Embed Size (px)
DESCRIPTION
Rebooting finance in public higher education. Jane Wellman AASCU Annual Meeting Charleston, SC November 22, 2010. Outside inside: the fractured dialogue about college costs and the road ahead. Source: John Immewahr, Villanova University, based on research for Public Agenda. - PowerPoint PPT Presentation
Citation preview

Rebooting finance in public higher education
Jane WellmanAASCU Annual Meeting
Charleston, SC November 22, 2010
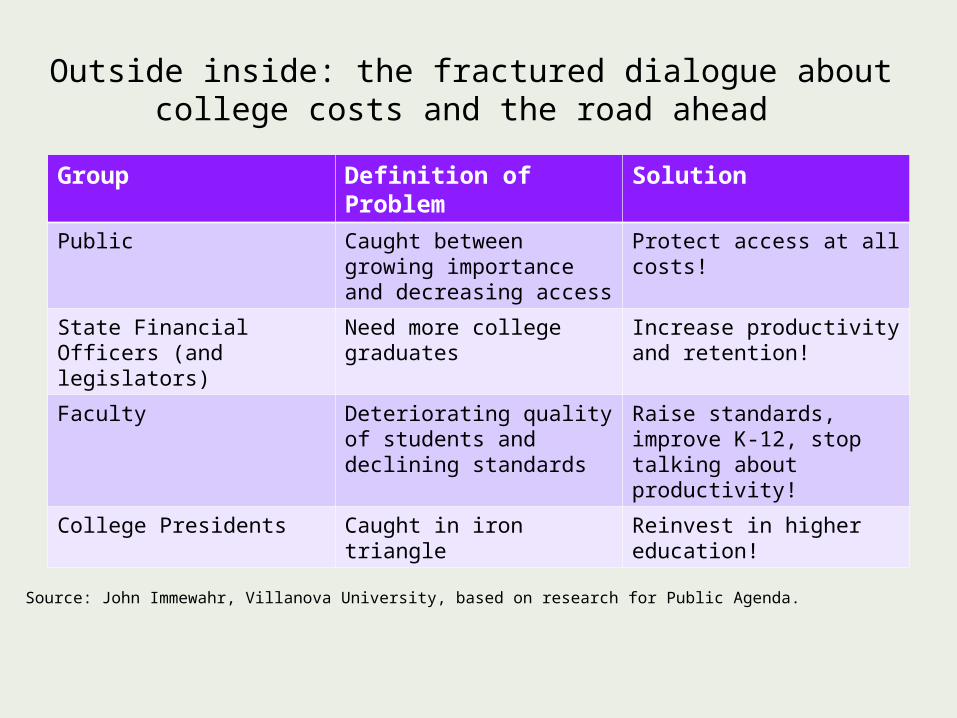
Group Definition of Problem SolutionPublic Caught between growing
importance and decreasing access
Protect access at all costs!
State Financial Officers (and legislators)
Need more college graduates
Increase productivity and retention!
Faculty Deteriorating quality of students and declining standards
Raise standards, improve K-12, stop talking about productivity!
College Presidents Caught in iron triangle Reinvest in higher education!
Outside inside: the fractured dialogue about college costs and the road ahead
Source: John Immewahr, Villanova University, based on research for Public Agenda.

The problem of multiple –and sometimes conflicting – truths
4
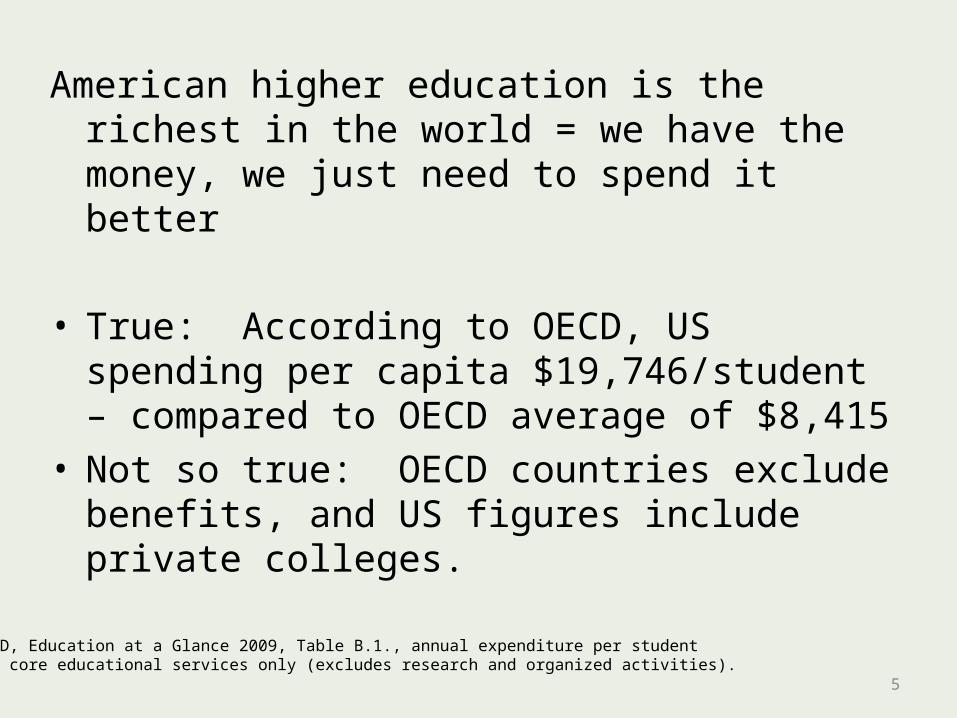
American higher education is the richest in the world = we have the money, we just need to spend it better
• True: According to OECD, US spending per capita $19,746/student – compared to OECD average of $8,415
• Not so true: OECD countries exclude benefits, and US figures include private colleges.
5
OECD, Education at a Glance 2009, Table B.1., annual expenditure per studentFor core educational services only (excludes research and organized activities).
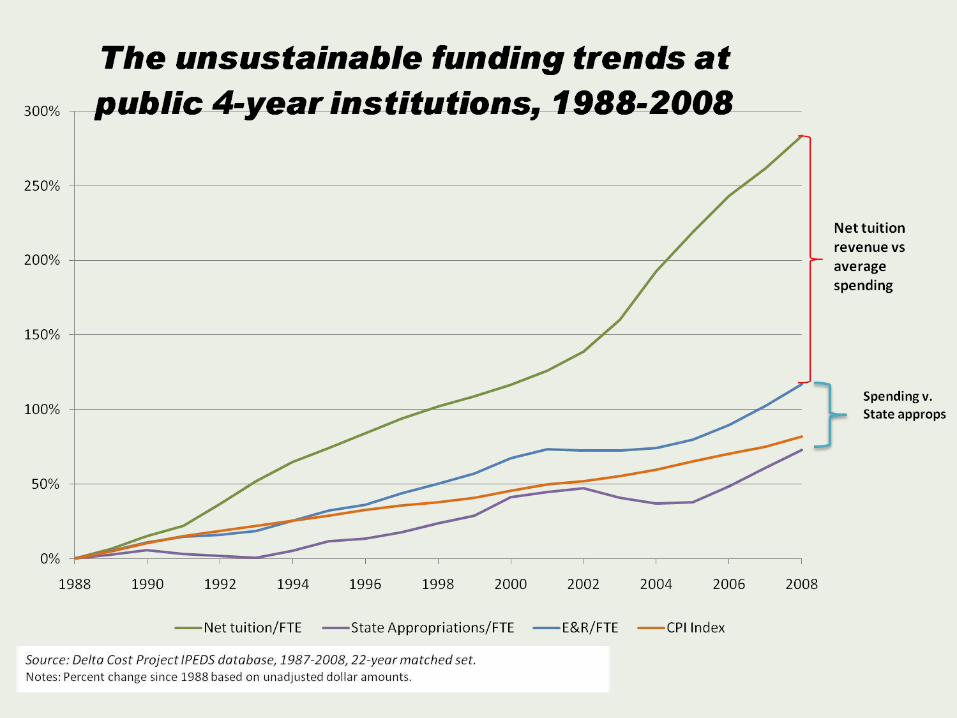
Source: Delta Cost Project IPEDS Database, 1987-2008; 10-year matched set.
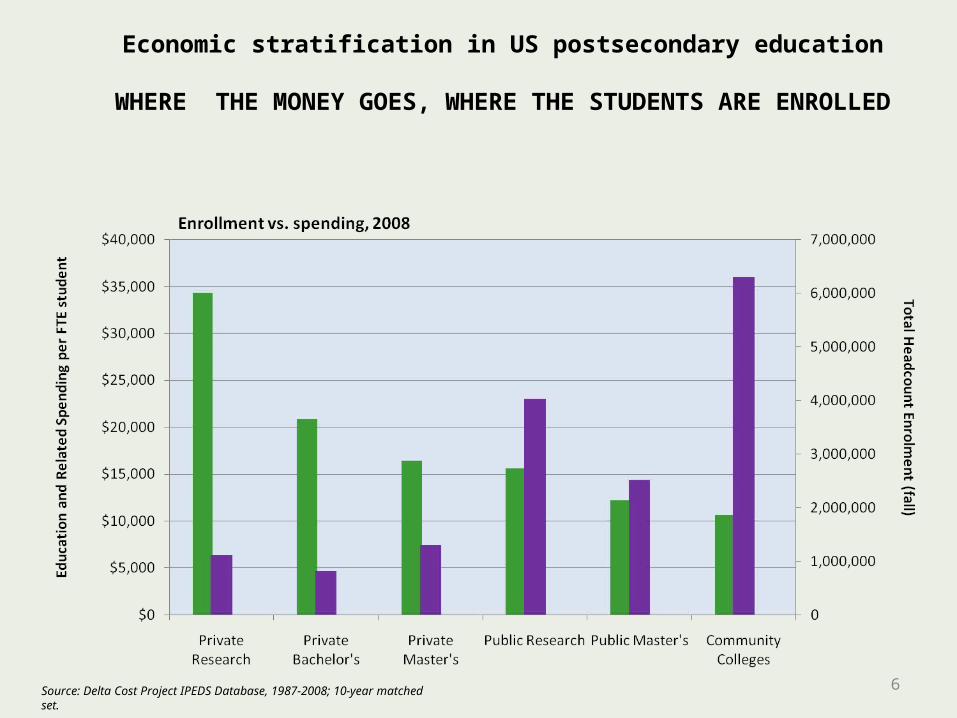
Economic stratification in US postsecondary education
WHERE THE MONEY GOES, WHERE THE STUDENTS ARE ENROLLED
6
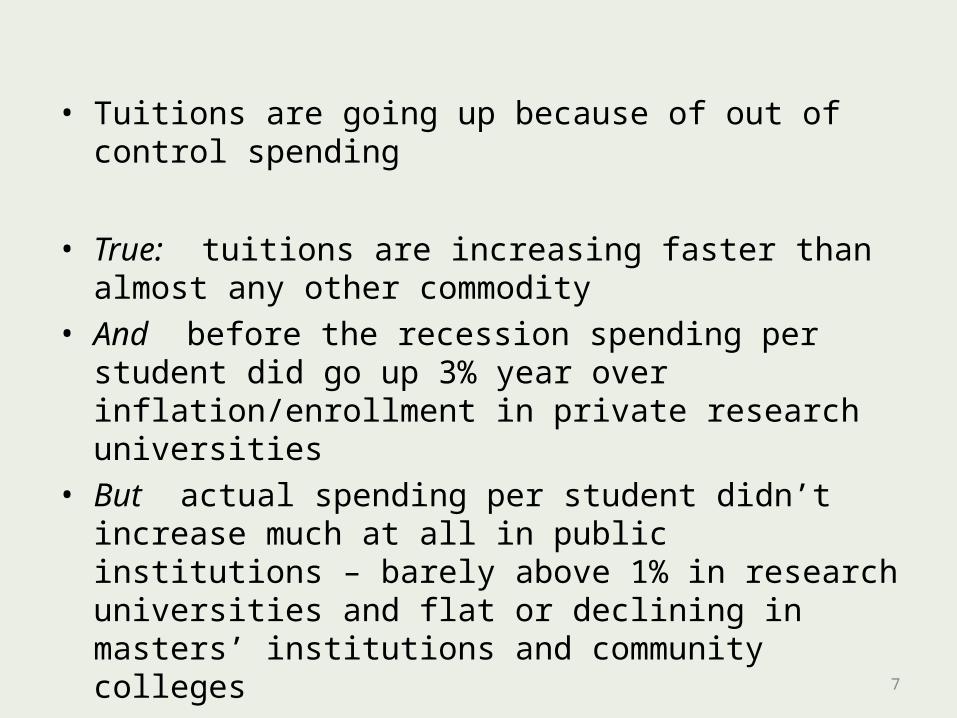
• Tuitions are going up because of out of control spending
• True: tuitions are increasing faster than almost any other commodity
• And before the recession spending per student did go up 3% year over inflation/enrollment in private research universities
• But actual spending per student didn’t increase much at all in public institutions – barely above 1% in research universities and flat or declining in masters’ institutions and community colleges
7

Sources: College Board, “Trends in College Pricing, 2008”; Bureau of Labor Statistics, 2009, www.bls.gov ; U.S. Census, Current Population Study-ASEC, 2008.
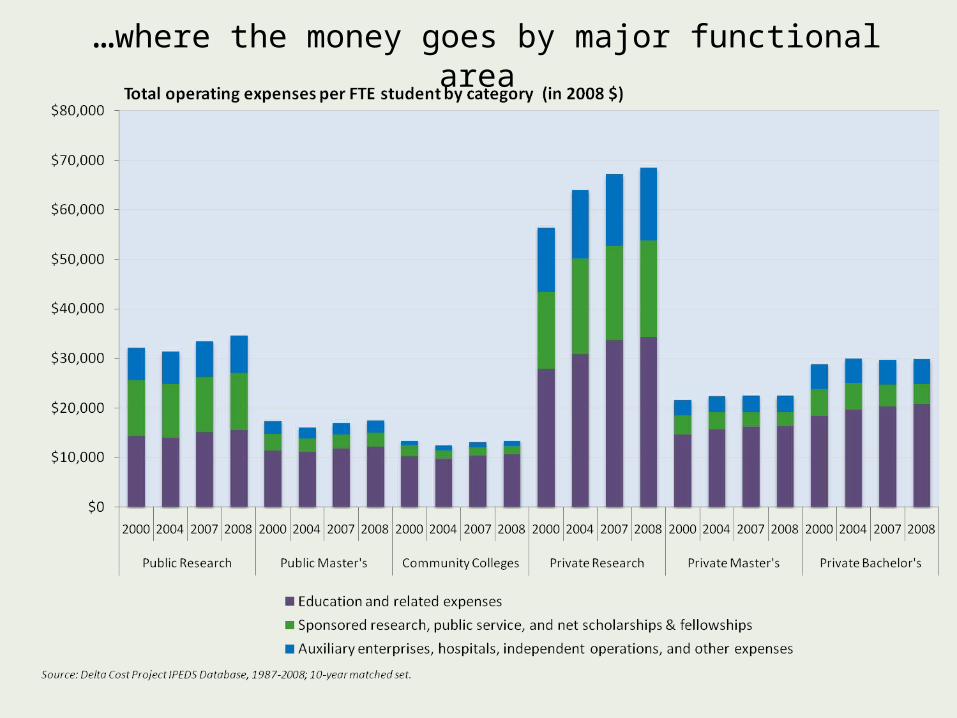
…where the money goes by major functional area
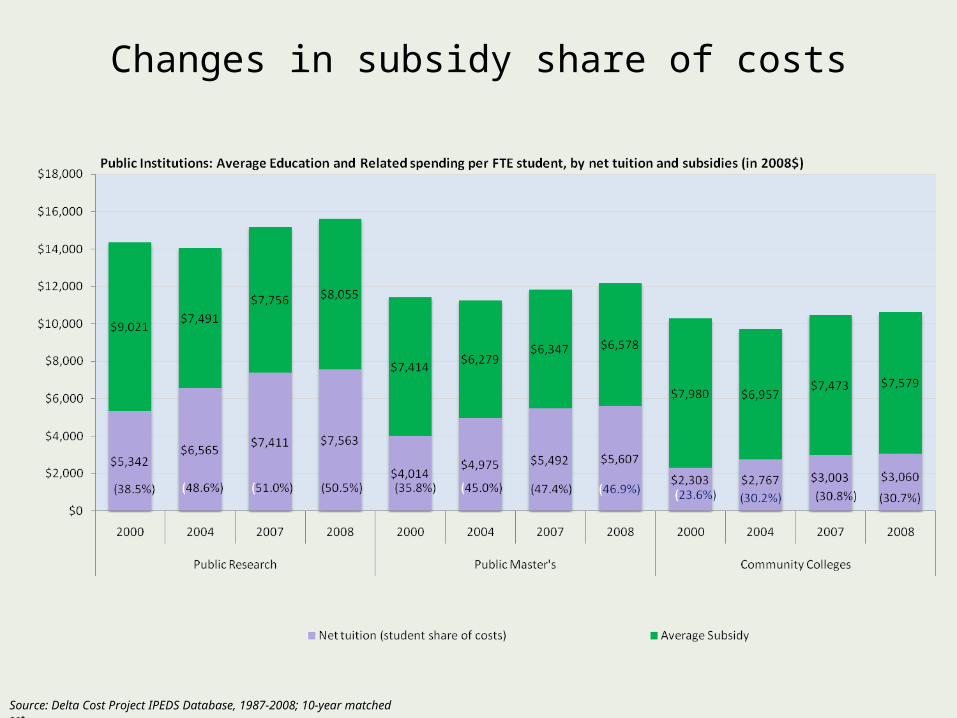
Changes in subsidy share of costs
Source: Delta Cost Project IPEDS Database, 1987-2008; 10-year matched set.
The primary driver of costs is faculty salaries – which can’t be reduced because of tenure
True: spending on faculty is the largest single spending area
False: faculty are not the majority of employees
• Spending on faculty is declining relative to other areas
• And most increases in compensation are going to benefits
11
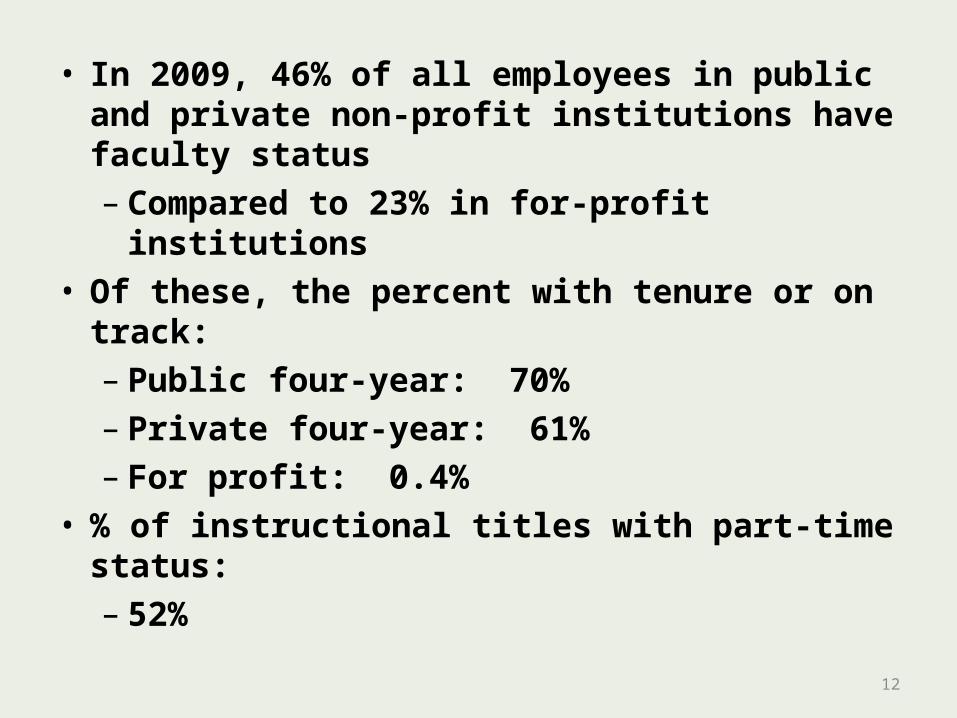
• In 2009, 46% of all employees in public and private non-profit institutions have faculty status– Compared to 23% in for-profit institutions
• Of these, the percent with tenure or on track:– Public four-year: 70%– Private four-year: 61%– For profit: 0.4%
• % of instructional titles with part-time status:– 52%
12
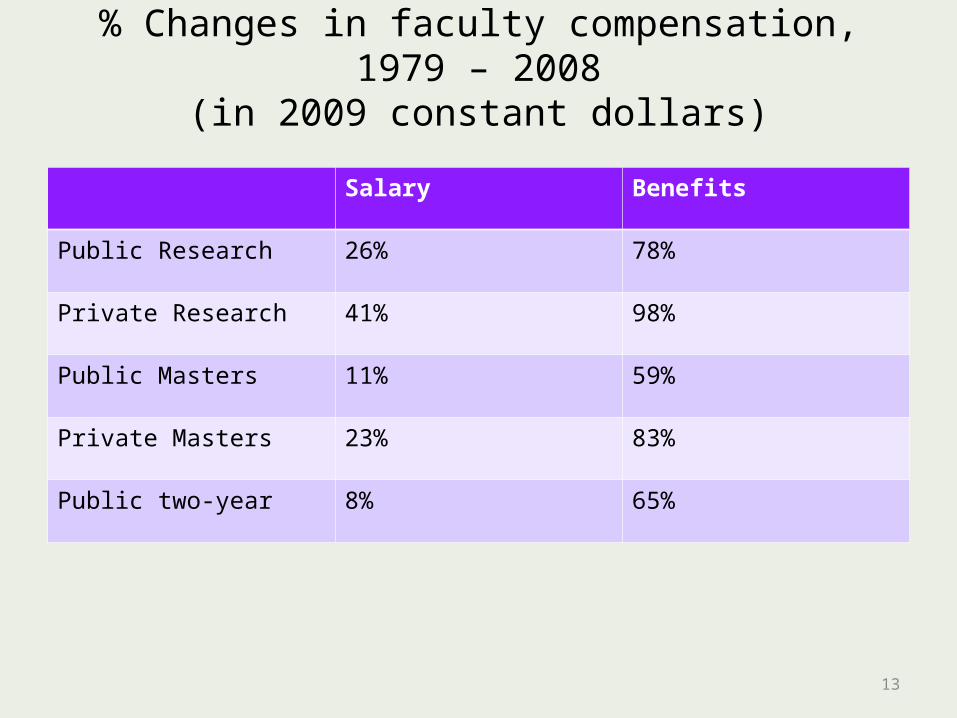
% Changes in faculty compensation, 1979 – 2008
(in 2009 constant dollars)
13
Salary Benefits
Public Research 26% 78%
Private Research 41% 98%
Public Masters 11% 59%
Private Masters 23% 83%
Public two-year 8% 65%
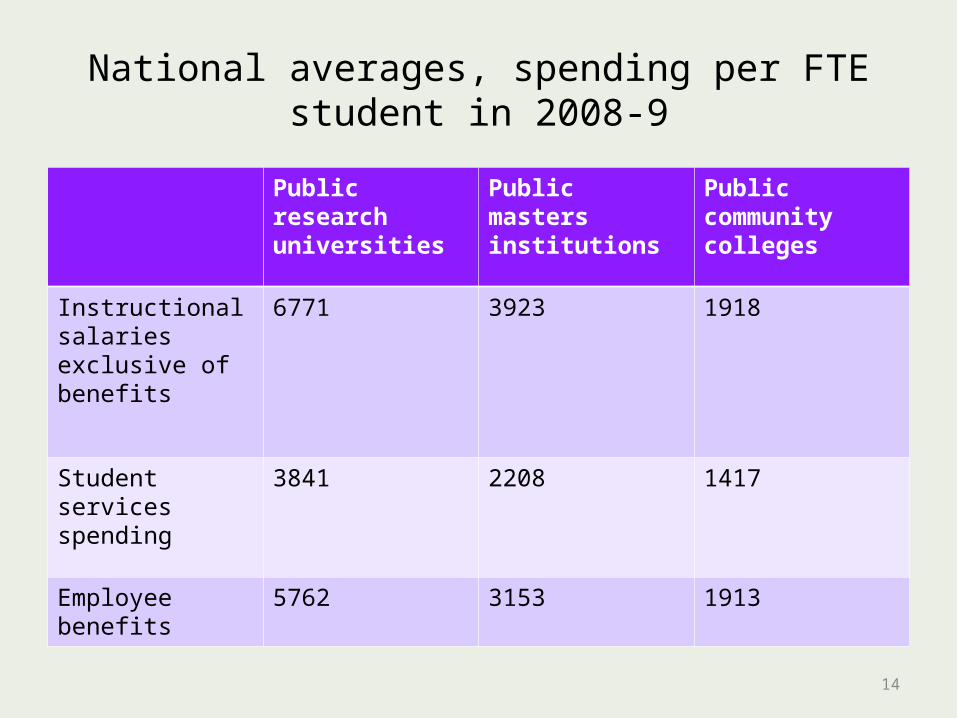
National averages, spending per FTE student in 2008-9
Public research universities
Public masters institutions
Public community colleges
Instructional salaries exclusive of benefits
6771 3923 1918
Student services spending
3841 2208 1417
Employee benefits 5762 3153 1913
14

States can save money by shifting students to community colleges
• True: cost per student in the community colleges on average is 14% less than in public masters’, and 34% less than public research costs
• BUT the state share of costs is higher – in many states subsidy costs are higher than in masters’ institutions
• AND cost per degree is actually higher in CCs
15

Spending and subsidies per Student – national averages
Public research Public masters Public CCs
E&R spending per student
$15,619 $12,185 $10,396
State and local subsidy per student
$8,055 $6,578 $7,404
16
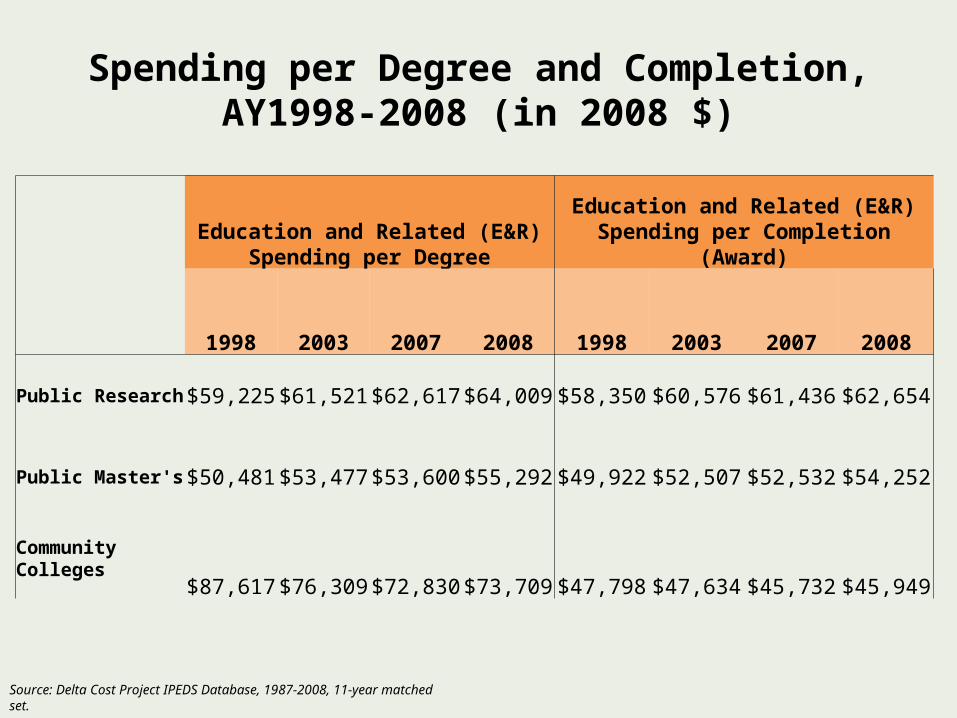
Spending per Degree and Completion, AY1998-2008 (in 2008 $)
Source: Delta Cost Project IPEDS Database, 1987-2008, 11-year matched set.
Education and Related (E&R)
Spending per DegreeEducation and Related (E&R)
Spending per Completion (Award)
1998 2003 2007 2008 1998 2003 2007 2008
Public Research $59,225 $61,521 $62,617 $64,009 $58,350 $60,576 $61,436 $62,654
Public Master's $50,481 $53,477 $53,600 $55,292 $49,922 $52,507 $52,532 $54,252
Community Colleges
$87,617 $76,309 $72,830 $73,709 $47,798 $47,634 $45,732 $45,949
Spending is going up because of under-prepared students… and the costs of remediation
18
•True: Underprepared students are less likely to succeed, and we DON’T have a good track record with success in remedial/developmentalEducation
•BUT: we don’t know what we spend on remediation – on a per student basis
•Remedial education is cheap – as is most ld/ug education – in public institutions, likely a net revenue-producer
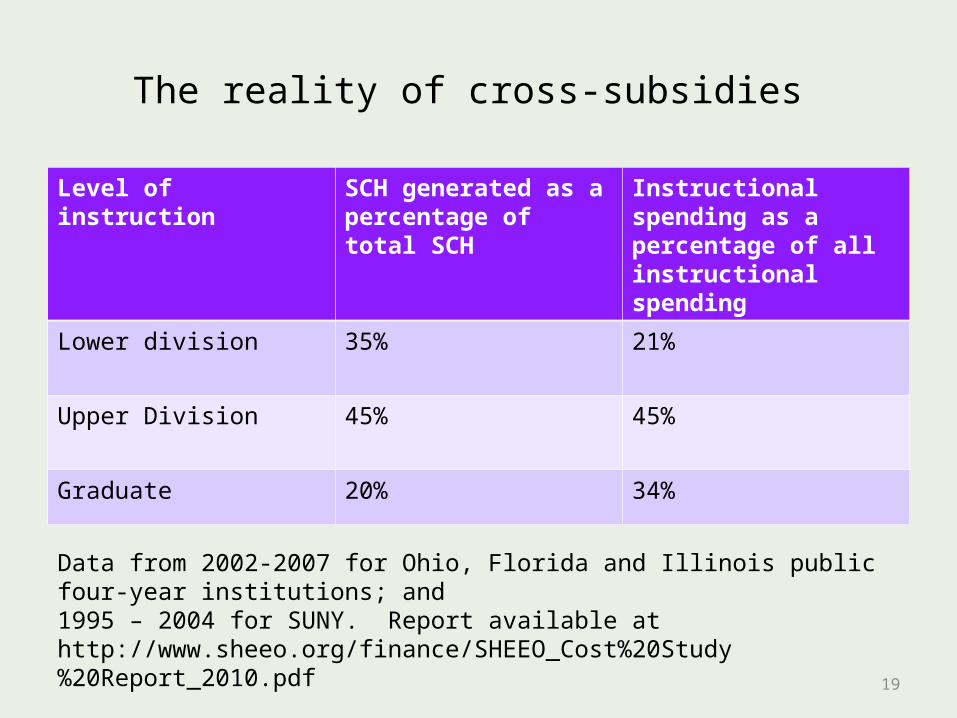
The reality of cross-subsidies
Level of instruction SCH generated as a percentage of total SCH
Instructional spending as a percentage of all instructional spending
Lower division 35% 21%
Upper Division 45% 45%
Graduate 20% 34%
19
Data from 2002-2007 for Ohio, Florida and Illinois public four-year institutions; and1995 – 2004 for SUNY. Report available at http://www.sheeo.org/finance/SHEEO_Cost%20Study%20Report_2010.pdf

For more information, go to:
Delta Cost Projecthttp://www.deltacostproject.org
http://tcson-line.org
20