Embed Size (px)
Citation preview

Reanalysis of Petricoin et al. Ovarian Cancer Data Set 3
Russ Wolfinger and Geoff Mann
SAS Institute Inc.
NISS Proteomics Workshop
March 6, 2003
Ovarian Cancer Mass Spec Data from http://clinicalproteomics.steem.com
91 Normals
162 Cancers

What We’d Love to See

What We Are Seeing
Green: Cancer, Red: Normal
Left: Green in Front, Right: Red in Front

New Paper from MD Anderson
Baggerly, K.A, Morris, J.S., and Coombes, K.R. (2003). Cautions about Reproducibility in Mass Spectrometry Patterns: Joint Analysis of Several Proteomic Data Sets
Email: [email protected]
• Reanalyses of all three ovarian cancer data sets
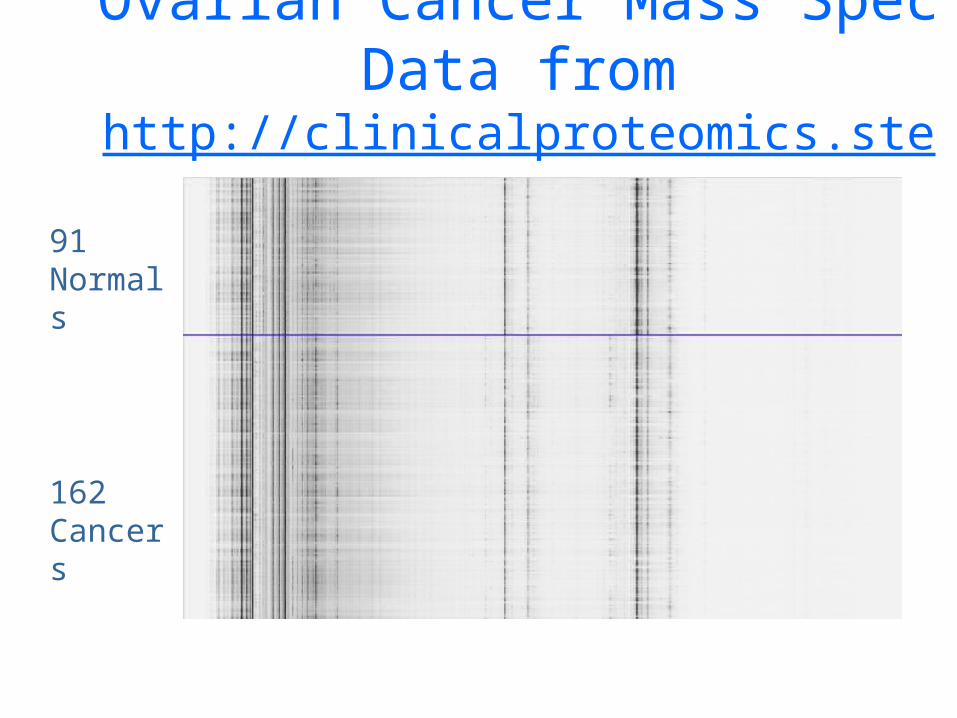
• For data set 3, they note that two pairs of m/z values provide perfect discrimination: 435.46 & 465.57, and 2.79 & 245.2. Easy to find with simple t-tests; genetic algorithm unnecessary.
First Pair: 435.46 and 465.57 Da
Green: Cancer, Red: NormalLeft: Green in Front, Right: Red in Front

Second Pair: 2.79 and 245.2 Da
Green: Cancer, Red: NormalLeft: Green in Front, Right: Red in Front
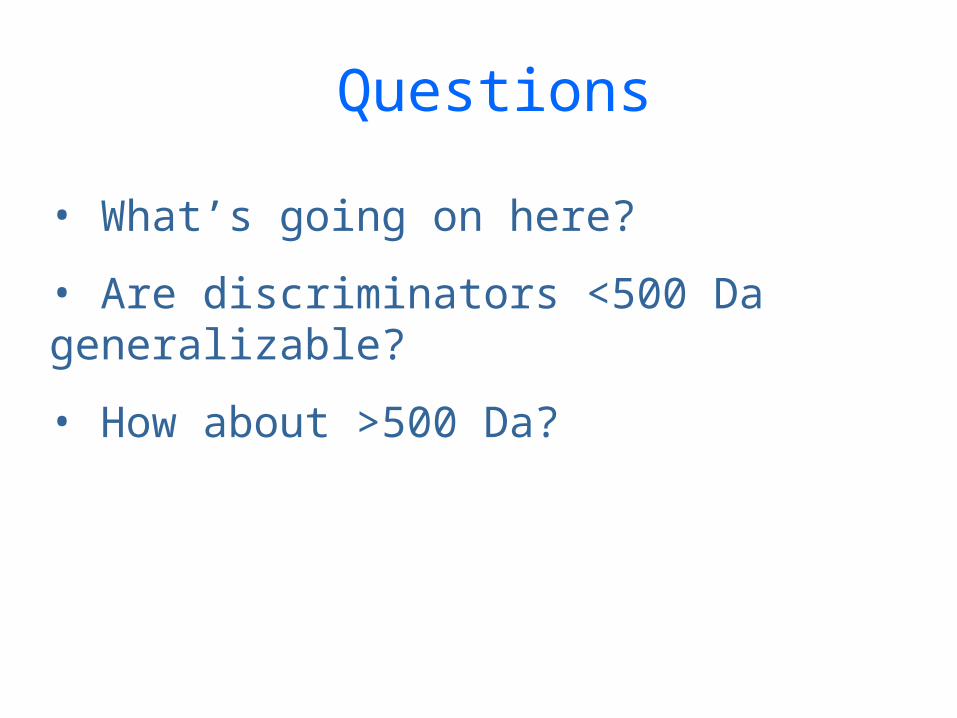
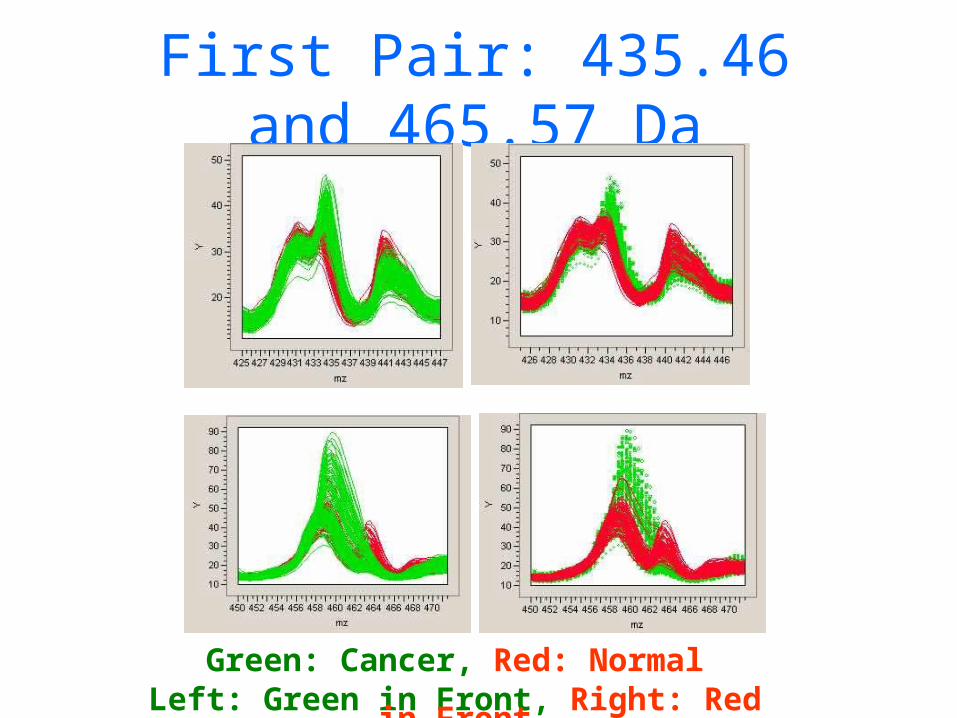
Questions
• What’s going on here?
• Are discriminators <500 Da generalizable?
• How about >500 Da?

Going Small: 435 Da
• At least 100 peptide fragments (including permutations) add up to 435, e.g. AFY, SMY, PPW, KNH, GGGAC, SSGGG
• 30 Hits from ChemFinder.com, including Sphingosyl-phosphocholine, a lipid molecule
• Similar kind of story for 465 Da

Going Large: Cross-Validated Stepwise Discriminant Analysis
1. Subtract baselines and determine 330 most prominent peak areas, all with m/z > 600.
2. Form 500 random partitions of the 253 spectra, with a 33% stratified holdout sample in each.
3. Perform stepwise discriminant analysis on each partition, using entry p = 0.05, exit p = 0.20, and max variables = 5.
4. Compute misclassification rate on each trial.
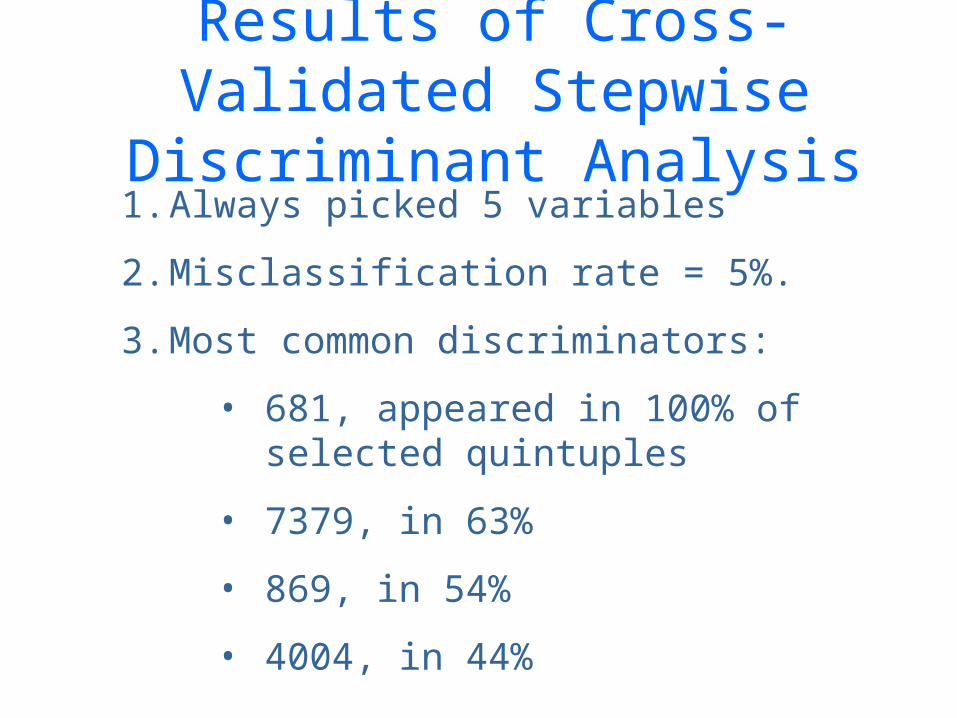
Results of Cross-Validated Stepwise Discriminant Analysis
1. Always picked 5 variables
2. Misclassification rate = 5%.
3. Most common discriminators:
• 681, appeared in 100% of selected quintuples
• 7379, in 63%
• 869, in 54%
• 4004, in 44%

Partial Least Squares on the Same 330 Peak Areas

Parting Shots
• Statistical discrimination is relatively easy for these data, but what are the real explanations for the clear differences in data set 3?
• Can statisticians overcome their biases and win the day?
• Is this kind of approach a red herring or a red snapper?