Embed Size (px)
Citation preview

Courtenay House, Monument Way East, Woking, Tel: +44(0)844 443 7925 Surrey GU21 5LY, United Kingdom Fax: +44(0)844 443 7928
Web Site: www.medcotas.com Registered in England No. 2751364 VAT No. 635749605
Real Time Electronic Acquisition & Monitoring
& Human Machine Interface
REAM HMI
For Pumping Services
© Copyright MEDCO 2010

2
Table of Contents
REAM HMI ...................................................................................................................1 Table of Contents...........................................................................................................2 System Overview...........................................................................................................3
System Description ....................................................................................................4 Default System Settings.............................................................................................5 Raw Data....................................................................................................................5 Computed Data ..........................................................................................................8 Resetting Fluid Totals ................................................................................................8 Display Schematics & Graph................................... Error! Bookmark not defined. Analogues Display Schematic ...................................................................................9 Counters Display Schematic ....................................................................................10 Real Time Graphs ....................................................................................................11 SYSTEM MENU Button .........................................................................................11 Reset To Defaults.....................................................................................................14 Set Ports ...................................................................................................................15 Set Date and Time....................................................................................................15 Change Units............................................................................................................16 Calibrate Analogue Channel ....................................................................................17 Calibrating Counters (Fluid Flow)...........................................................................19 Channel Mapping.....................................................................................................19 Curve Smoothing .....................................................................................................20 Comments ................................................................................................................11 Screen Test...............................................................................................................20 Screen Calibrate .......................................................................................................21 Data Logger .............................................................................................................22 Communication........................................................................................................24 Power .......................................................................................................................26
Sensors .........................................................................................................................27 Pressure Sensors.......................................................................................................27
Electrical Connection for Pressure Sensors .........................................................27 Proximity Switch .....................................................................................................28
Specifications:......................................................................................................28 Electrical Connection for Proximity Switch: .......................................................29 Cable for Proximity Switch to Data Collection Unit: ..........................................29 Connectors on Cable for Proximity Switch/Magnetic Pickup:............................30
Wiring Diagram – REAM HMI Connectors............................................................31

3
System Overview The REAM HMI is a user-friendly data acquisition system that reads data from electronic sensors and displays the data. The system records the data on solid state Compact Flash memory and allows remote monitoring of the data. The system is made of two main parts, REAM (Real-time Electronic Acquisition & Monitoring) is a microprocessor based data acquisition board, which collects data from electronic sensors, digitise the readings, and supply the appropriate excitation voltage to the sensors. The HMI (Human Machine Interface) communicates with the REAM board(s) to retrieve, display, and store the data. For pumping services, REAM has 4 analogue channels, and 2 counters or frequency channels. The number of channels is doubled in the case of a double REAM. The analogue channels accept output signals from sensors with 0-5 vdc, 0-10 vdc, or 4-20 mA. The counters accept pulse signals produced by proximity switches or magnetic pickups with amplifier. HMI can communicate with up to 4 REAM boards simultaneously in addition to many other controllers or data acquisition modules, such as alarm systems by MEDCO and MC-III Flow Analysers by Cameron, etc. The outputs are available on Web Pages, which means that they can be viewed remotely on a Local Area Network (LAN) or even a Wide Area Network (WAN), provided that proper Internet connections are available. This later feature means that the data can be viewed simultaneously from several terminals. There are many other features in the HMI and these can be tailored to client’s request.

4
System Description REAM HMI for Pumping Services comes in a compact flightcase measuring 330 x 290 x 140 mm. The flightcase cover is detachable and two rails are provided on the main body of the flight case for hanging the system on the wall while in use. The pictures below show the various components of REAM HMI.
The flightcase
Flighcase cover is detachable

5
Power switch
Powerconnector
Ethernetport
Analogue channels
Modbus connector
Counters/ frequency channels
Touch screen
The components of REAM HMI
Default System Settings The default values are:
• Date and Time: As per the UK date and time. • ADC channels (Analogue to Digital Convertors):
o Gain: Unity. o Offset: Zero.
• Pulse counters (frequency channels) and quadrature: K-factor = 1. • Rates of counters and quadrature: K-factor = 1.
These values do NOT represent the real values that should be used for applications. The user will need to perform proper calibrations in order to obtain actual values of the physical values being monitored (see calibrations section below).
Raw Data REAM HMI starts by displaying the RAW DATA web page. To access the other web pages in the REAM HMI use the buttons on the left hand side of the touch screen. The SYSTEM MENU button is used to reset or edit the system settings and calibrating channels. The RAW DATA web page shows MEDCO’s logo and a Welcome message. In addition, the system date and time, the REAM HMI software version, as well as the data stream from the REAM board(s). This page can always be accessed by pressing the first button.

6
Raw Data Page
The RAW DATA page can be used to check if communication is actually taking place between the HMI and the REAM board(s). All the data here are shown as raw values, i.e. without applying any calibration constants. The first line of data shows the first 4 analogue signals followed by the total of counter 1. The next line shows the total of counter 2, total of quadrature channel (not used in pumping), and rates of the counters, including the quadrature. The HMI communicates with the REAM boards through serial ports. On the HMI panel these are marked PGM PORT and COMMS PORT (RS232). If only one REAM board is installed, then the first serial port on the HMI (PGM PORT) is to be connected to the REAM board. Additionally, there are two buttons that will give access to the user to see the Ethernet Settings and to check the readings from MC-III (Modbus devices).
Display Ethernet Settings The current IP Address, Subnet Mask, and Default Gateway will be shown on a webpage when this button is clicked. The user may change the values by clicking the Ethernet Port Settings button. The IP Address needs to be compatible with the Local Area Network (LAN). For example, if using the crossed Ethernet cable supplied with the system, then this will connect directly to a computer. The user will need to manually enter an IP address on the computer, and ensure that both devices (computer and REAM HMI) have an IP address starting with “192.168” and a matching third block, such as “0” or “1”, finally the fourth block should have a different number for each device, for example computer IP Address could be “192.168.1.10” and REAM HMI could be “192.168.1.11”.

7
On the other hand, if using a router, then the IP address of the REAM HMI will need to be set such that the first 3 blocks match those of the router’s IP address and the last one will need to be carefully chosen such that it does not conflict with another device on the same LAN. It is probably easier, to connect the REAM HMI to the router first, then connect other devices or computers, as most of the computers will be able to obtain an IP address automatically without conflicting with other devices on the LAN. When using a router, the user must ensure that a STRAIGHT Ethernet cable is used (not supplied with the system).
Ethernet Settings
Ethernet Port Settings

8
Computed Data The second button is used to display the computed data page. This page will display the parameter names, current values, and units.
Computed Data Display
Note that the parameters have already been assigned to channels. Thus, it is important that the user adheres to this setup. The assignments are as follows: Channel Parameter Channel Parameter Analogue 1 Not assigned Counter 1 Fluid Total 1 Analogue 2 Not assigned Counter 2 Fluid Total 2 Analogue 3 Wellhead Pressure Counter 1 - Rate Flow Rate 1 Analogue 4 Pump Pressure Counter 2 - Rate Flow Rate 2 As can be seen from the above table, there are two non-assigned channels, analogue 1 & 2. If these are to be used, then the user needs to contact MEDCO, otherwise, the user can change the assigned channels using Channel Mapping.
Resetting Fluid Totals The third button will display a page dedicated to resetting fluid totals. The actual value will be shown on the left-hand-side column while the user can enter the new value on the right-hand-side column. If using MCIII flow analyser, then the RESET FLUID TOTAL can be used. This will reset the fluid total of the relevant MCIII to zero.

9
Resetting Fluid Totals
Sub-Menus for Pressure/Flow Schematics, Graph, Comments, Modbus status The fourth button is used to enter a sub-menu for accessing schematics, graph, comments, and checking Modbus devices such as MCIII or EPSS (Emergency Pump Stop System). Simply select the required page.
Analogues Display Schematic A schematic of the analogue signals can be displayed by selecting the Pressure Schematic button. The gauges will have scales corresponding to the Units System selected. (see SYSTEM MENU).

10
Analogue Channels Display Schematic
Counters Display Schematic A schematic of the totals and flow rates can be displayed by selecting the Flow Schematic button. The gauges will have scales corresponding to the Units System selected. (see SYSTEM MENU).
Counters Display Schematic

11
Real Time Graphs The Graph button will display a real time graph, the width of which is fixed to 4 minutes. All the curves will have scales determined by the minimum and maximum values set in the CHANGE UNITS page.
Real Time Graph
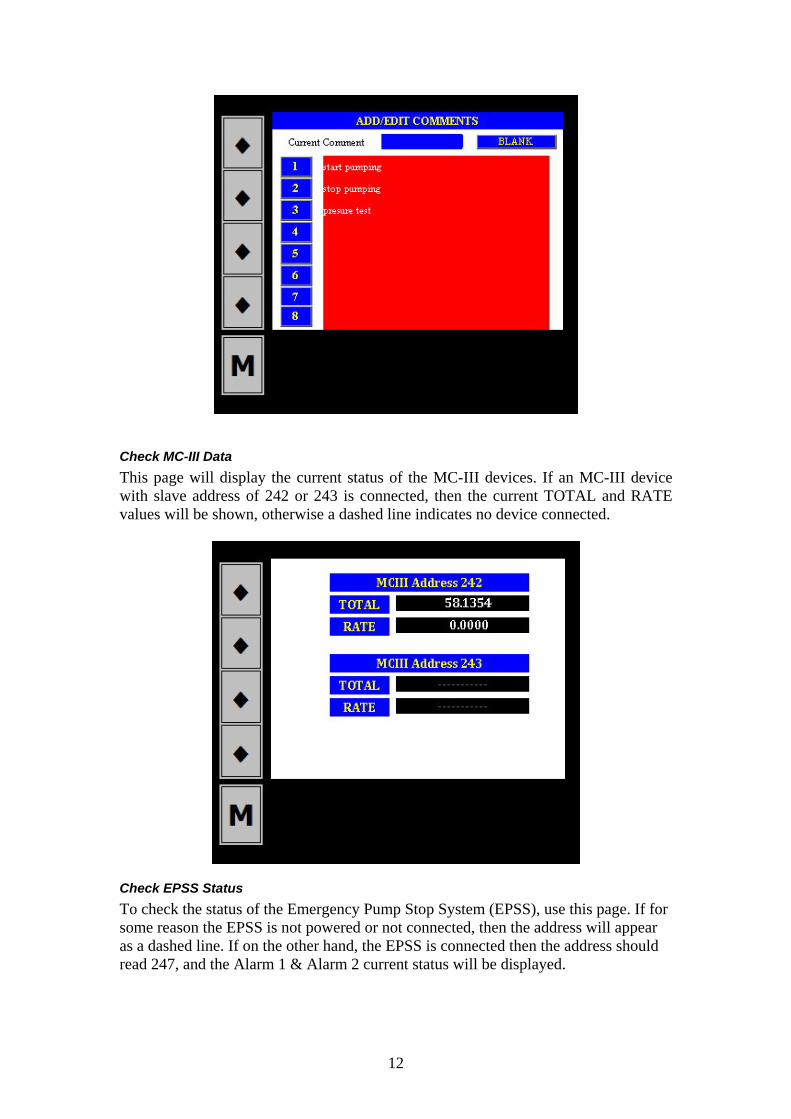
Comments The system allows the user to build a summary report while logging a job. This is done by inserting comments in the data log. The “comments” column in the data log will be blank except where comments were inserted. When using the DART software to retrieve the data logs, DART will recognise that these represent records of the summary report. A user-defined template of 8 comments is available for the user to edit and use on the job. If the comment is to be inserted in the data log, then the user needs to click on the comment number in the blue box, the comment will then appear in the “current comment” field, then click BLANK to clear the comment. If the comment itself needs to be edited then the user needs to click on the red area. Note that the 8 comments will be saved in system memory and will therefore be available for future jobs.
12
Check MC-III Data This page will display the current status of the MC-III devices. If an MC-III device with slave address of 242 or 243 is connected, then the current TOTAL and RATE values will be shown, otherwise a dashed line indicates no device connected.
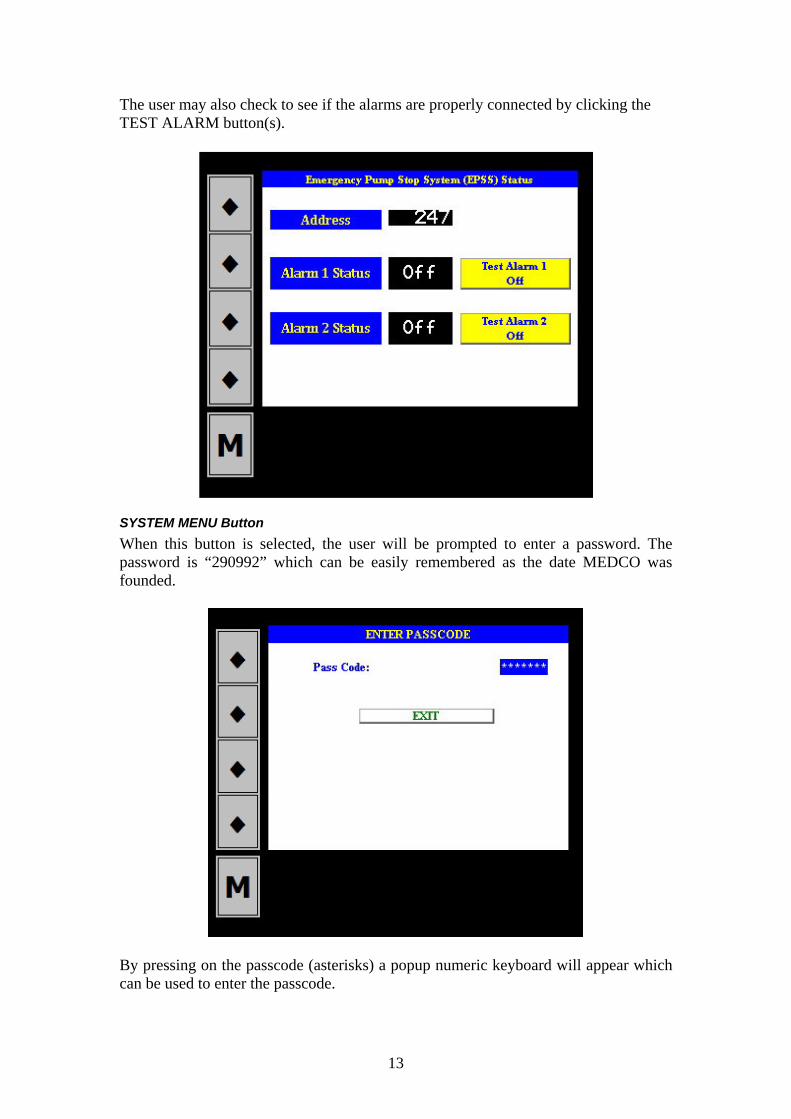
Check EPSS Status To check the status of the Emergency Pump Stop System (EPSS), use this page. If for some reason the EPSS is not powered or not connected, then the address will appear as a dashed line. If on the other hand, the EPSS is connected then the address should read 247, and the Alarm 1 & Alarm 2 current status will be displayed.
13
The user may also check to see if the alarms are properly connected by clicking the TEST ALARM button(s).
SYSTEM MENU Button When this button is selected, the user will be prompted to enter a password. The password is “290992” which can be easily remembered as the date MEDCO was founded.
By pressing on the passcode (asterisks) a popup numeric keyboard will appear which can be used to enter the passcode.

14
Data Entry
Once the correct passcode has been entered, another screen will appear with some more options.
Reset To Defaults This button will reset the system to manufacturer’s default values. This will include gain (value 1), offset (value 0), k-factor (value 1) of all channels, channel assignments, and curve smoothing. Only use this button if you are unable to recover from an unknown error. No other display will appear.

15
Set Ports This will give access to ports (channels) calibration data. The user can directly enter data here if already known. For example, if using a flow meter with a magnetic pickup amplifier and the k-factor for the flow meter is already known then this can be entered directly. Also, if calibrations were performed previously and gain and offset values were calculated, again these can be entered directly.
Set Date and Time Use this button to change date and time of the system. The system is shipped with UK date and time set.
When the date or time value is clicked while highlighted, a popup window will appear and this will allow changes to be made. Use the ENTER key on the popup menu to start the editing.

16
Changing the Date
Changing the Time
Change Units The units and the associated maximum values may be changed by the user using this facility. Click the required field to be changed and make the necessary changes.

17
Calibrate Analogue Channel Calibration is a procedure of establishing a correlation between the raw values produced by the REAM board and the physical values they represent. Most electronic sensors will have a linear response range, thus the calibration procedure is effectively a procedure to establish the straight-line relationship between the sensor electrical output (raw value) and the physical value being measured (actual value). For a straight-line, two points are required to be completely defined. The physical values (e.g. pressure) will be equivalent to the Y-axis while the raw values will be equivalent to the X-axis. The slope of the line is referred to as the GAIN and the intersection with the Y-axis is referred to as the OFFSET.
Raw value
Actual value (e.g. Pressure)
Gain
Offset
The user must supply channel number and two actual (reference) values. The system will provide the raw values then compute the gain and offset. If acceptable, then the user can SAVE these values. The following is a detailed procedure of calibrating the Pump 2 Pressure:

18
Calibrate Analogue Channel
1. Enter the channel number: As there are only 4 analogue channels, this should
be a number between 1 and 4. For example, the default channel assigned to pump 2 pressure is 4.
2. Decide what pressures will be used as reference points: When making this decision, ensure that the chosen values are as far apart as possible, to reduce errors, and are achievable without causing damage or danger to equipment or personnel. For example, for pump 2 pressure, a good two reference points could be 0 psi and say 4,000 psi.
3. In the column titled “Enter Actual Value”, enter the value (remember to use the appropriate units). For the First Value, enter 0 psi. Ensure that the pressure is physically 0 psi and monitor the raw value displayed in the CURRENT raw value. Ensure that the reading is steady (no large fluctuations) then when satisfied that the reading is steady, click READ FIRST VALUE. Note that while the pressure may be 0 psi, the raw value may not necessarily be 0. For example, if using a sensor with a 4-20 mA output, then raw value will probably be around 384.
4. In the column titled “Enter Actual Value”, enter the value (remember to use the appropriate units). For the Second Value, enter 4000 psi. Ensure that the pressure is physically 4000 psi and monitor the raw value displayed in the CURRENT raw value. Ensure that the reading is steady (no large fluctuations) then when satisfied that the reading is steady, click READ SECOND VALUE. If indeed the chosen pressure values were 0 and 4000 respectively, then expect the second raw value to be higher than the first. The raw value will, in this case, very much depend on the sensor range. For example, if using 4-20mA sensor that has a range of 0 to 10,000 psi, then second raw value should be around 998 when the pressure is 4000 psi.
5. Next, click the COMPUTE button, the HMI will display the computed Gain and Offset. If satisfied with these values, then click SAVE.

19
Calibrating Counters (Fluid Flow) For the counters, you only need to change the K-factor. If you already know the K-factor, for example from the manufacturer of the sensor, then you can enter the value directly. There is no need to enter a k-factor for the rate as the HMI automatically calculate this to get the rate per minute. For example, if using a 2” flow meter by Cameron, then the K-Factor is likely to be 2,300 pulses per barrel. If, on the other hand, you do not know the K-factor for your sensor, then you will need to calculate the K-factor using the following procedure:
1. Ensure that the counter channel has a K-factor of unity. 2. Ensure that the channel reading is zero. If necessary, reset the value to zero. 3. Physically, apply a known total. Example: If this is a flow total channel, then
pump a known quantity of the fluid. 4. Take note of the channel final reading. This is the number of pulses that your
sensor will produce for the physical quantity. The K-factor is thus calculated as (Number of Pulses, i.e. final reading) ÷ (Physical quantity). Example: If you pumped 2 barrels of water and your channel reading is 4600, then your K-factor is 4600 ÷ 2 = 2300 (pulses per barrel) or 54.7 pulses per gallon.
5. Now go to SET PORTS window and enter the K-factor for the corresponding channel.
Note: For MC-III flow analyser the K-Factor is determined using the same procedure above and is entered directly into the MC-III. HMI does not require a K-Factor for MC-III, it will read the computed value(s) directly from MC-III.
Channel Mapping

20
Channel mapping is used to assign physical channels to measured parameters. The picture above depicts typical channel assignments for pumping services. On some occasions, it may be necessary to change the connection. The user may then access this table and make the necessary changes to ensure that the measured parameters are correctly assigned. For example, if for some reason the user wishes to change the Pump 1 Pressure to channel 1 then this table will allow the change to happen. Also note, that the REAM HMI can read flow rates/totals either directly from sensors or from an MC-III Flow Analyser. If the flag in the column “Use MC-III” is ON, then the readings will be taken from the MC-III, otherwise a pulse generating sensor can be used, such a proximity switch or magnetic pickup with amplifier. For Flow 1, the MC-III must be assigned a slave address of 242, while for Flow 2 the slave address should be 243. Refer to the MC-III manual for instructions on how to assign slave address.
Curve Smoothing
If readings are fluctuating, then the user can make the curves look smoother by applying a smoothing/averaging factor. A value of 5, for example means that the readings will be averaged over 5 seconds.
Alarm Settings If Emergency Pump Stop System (EPSS) is used with the REAM HMI, then this page will enable the user to set the alarms. The user will need to specify a pressure value at which the alarm will become active. The EPSS alarm will activate a solenoid valve that will close the flow path to the pump throttle. The EPSS has two solenoid valves

21
and two alarms, i.e. one for each solenoid valve. If no alarm is required, then ensure that the “Use Alarm” is set to “0”.
Screen Test This function is for testing that the touch screen is properly calibrated, and that it is identifying the touch in the appropriate portion of the screen. Thus, touching the screen within this window will result in a square showing where the system has felt the touch. If this appears to be somehow shifted, then use the Calibrate Screen to get it right.
Screen Calibrate To ensure that the touch screen is responding properly to touches, use this function to calibrate the screen. Simply, go through the 9 boxes on the screen, touching them in turn staring from top left hand side and working across the rows then downwards until all 9 boxes are checked. This action will re-calibrate the screen.

22
Data Logger REAM HMI has a CompactFlash memory that is used for storing data. The CompactFlash card has a capacity of 1 Gbytes or above. There are five data logs that the user can choose from. Log length Log name Sampling rate Maximum number
of files One hour Onehour 1 second 200 One day Oneday 1 second 20 One day Oneday1 10 seconds 20 One day Oneday2 20 seconds 20 One day Oneday3 30 seconds 20 Additionally, a one day log at sampling rate of 1 second is automatically stored. This log is for cases that data may be required but no log was chosen by the user. This log cannot be switched off by the user and is referred to as Log1.

23
Data Logger
The logs will be found in a folder on the CompactFlash called “logs” and subsequent to this folder there will be sub-folders for each of the log names listed in the table above. The logs may also be accessible via the web pages by going to the main page then selecting VIEW LOGS and a list of the log folders will be shown. See the Communication section below to learn how to get to these pages.
All the log files will be named as follows; first two digits representing the year, next two digits representing the month, third two digits representing day of the month, and fourth two digits representing the hour the log was started. In the case of one day logs, the hour will always read “00”. Thus, in summary, using symbols “yy” for year, “mm” for month, “dd” for day, and “hh” for hour, the log files will have names “yymmddhh.csv”.

24
Note that the file extension is CSV, which is a mnemonic for Comma Separated Variables. CSV files are essentially text files and can be opened in Excel spreadsheet.
Communication The user can access the data in REAM HMI using the IP Address of the system. By default, the IP Address is “192.168.0.10”. The user can access the pages simply by typing the IP Address in the address bar of a web browser, for example in Internet Explorer. For communication with the DART software, use the default html page “auto/001/”. A local area network has to be present to enable browsing the pages. The system is supplied with one Ethernet crossed cable, meaning it connects directly to a computer (laptop). To connect through a router, the user can purchase a straight Ethernet cable commonly available in computer accessories shops.

25
The first page that will appear will have the following hyperlinks:
• View Data: Will display raw data with raw variable names. This is not meant for end users, it is meant for transmitting data to other devices capable of logging data through TCP/IP, example DART software on a laptop. This page address is “auto/001/”.
• View Logs: Will display all the data logs available. The files format is Comma Separated Variables (extension CSV) and this can be opened directly by Microsoft Excel. The log files follow a naming convention, which is made up of the year, month, day, and hour. Each OneHour file contains 1 hour worth of data as a maximum, and each OneDay file contains 1 day worth of data as a maximum. The CompactFlash memory can hold anything up to 200 files of the OneHour files (more than a week worth of data recorded from all channels at 1 per second) and 20 OneDay files, again recording data every one second.
• Remote View: Gives access to the pages described above. The current page being displayed on the HMI is the page that will be shown.

26
Power The system is operated by ONLY 24 vdc power supply; however the system comes with external table adapter for AC power supply. This adapter is AC/DC converter with following ratings:
Output Specification Output Voltage 24 Volts DC Min Current 0 Amps Max Current 3.33 Amps Power 80 Watts Input Specification Input Voltage 90~264VAC
Universal Input

27
Sensors Pressure Sensors The pressure sensors supplied are equipped with a WECO union fitting. The sensors have a range of 0-15,000 psi (0-103 MPa) and produce a current output of 4-20 mA.
Pressure sensor (Part No. 19001)
Electrical Connection for Pressure Sensors
A 100 ft (30m) cable is supplied with these sensors. The electrical wiring diagram is shown below.
Sensor side
Data collection unit side
D
C
B
A
3
2
1
E
F
IMPORTANT NOTICE: WIRE COLORS NOT NECESSARILY MATCHING – CHECK CABLE
CONTINUITY TO CONFIRM

28
Connector - data collection unit side Connector – sensor side
(Part No. 08152) (Part No. 19002)
Alternatively, if IS Barriers are installed, then the wiring will be as follows;
Sensor side
Data collection unit side
D
C
B
A
3
2
1
E
F IS Barrier
2
1 11
12
13
14
Proximity Switch
Proximity Switch Sensor
(Part No. 04007) Specifications: Operating voltage: 10 – 36 vdc Current rating: 250 mA Switching frequency: 800 Hz Temperature range: -25 to 80 oC Thread size: M12

29
Electrical Connection for Proximity Switch: The proximity switch comes with a short cable and a 4-way in-line sensor plug connector.
Connector for Proximity Switch
(Part No. 08153) The wiring inside the connector is as shown in the diagram below.
Common (blue wire)
Power (brown wire)
Signal (black wire)
Sensor
Connector
1
2
3
4
Wiring diagram for proximity switch
(Part No. 10017) Cable for Proximity Switch to Data Collection Unit: The wiring of the cable 100 ft (30m) to the data collection unit is as shown in the diagram below:

30
Common
Power
Used for Magnetic Pickup
Signal
Sensor side Data collection unit side
1
2
3
4
3
2
1
4
IMPORTANT NOTICE: WIRE COLORS NOT NECESSARILY MATCHING – CHECK CABLE
CONTINUITY TO CONFIRM (Part No. 10023)
Connectors on Cable for Proximity Switch/Magnetic Pickup:
Connector - sensor side
(Part No. 08155)

31
Connector - data collection unit side
(Part No. 08153)
Wiring Diagram – REAM HMI Connectors
4
3 2 White, signal (pulses)
Red, +12v supply
Black, 0v
2
3
1
Analogue channels
Black, 0 v comm
White, signal
Red, +24v supply
1
Counter channels
Blue, mag p/u low level
4
2 3
Red, +24v supply
Black, 0v
1
Power connector
Ethernet
1 2
3 RS485 connector
Signal -ve Signal +ve
Ground
IMPORTANT NOTICE: WIRE COLORS NOT NECESSARILY MATCHING – CHECK CABLE
CONTINUITY TO CONFIRM