Embed Size (px)
Citation preview

Lehrstuhl E15
Physik - Department
Realization and Characterizationof the Muon Veto Scintillator andthe Buffer Liquid of the Double
Chooz Experiment
Diplomarbeit
Judith Meyer1. Dezember 2010
Technische Universitat
Munchen


Abstract
Neutrino physics is one of the most exciting and important fields of modern parti-cle and astroparticle physics. The enhanced understanding of neutrinos and theirproperties today provides the opportunity to use them as a new and unique probeinto a huge variety of fields, for example, in astrophysics, geophysics, and cosmol-ogy. Many experimentally observed phenomena, such as the lack of solar electronneutrinos, are known to be caused by neutrino oscillations, which describe the peri-odical change in the probability to detect a particular flavor during the propagationof neutrinos in space. The underlying oscillation theory has six independent pa-rameters. While four of them, namely the mixing angles ϑ12 and ϑ23 as well as thetwo mass - squared differences ∆m2
21 and ∆m232 have been determined with high
accuracy by several experiments, the small mixing angle ϑ13 and the CP - violatingphase δ are still unknown. In order to further expand this theory, the focus ofmany current neutrino experiments, such as the Double Chooz experiment, is onquantifying ϑ13. The result will also have a significant impact on the determinationof the phase δ.The Double Chooz project is a reactor neutrino experiment located in the FrenchArdennes using the two cores of the Chooz reactor plant as efficient neutrinosources. For neutrino detection Double Chooz will use two large volume liquidscintillator based detectors in order to make a competitive measurement. Builtidentically, their purpose is to cancel or decrease significantly the systematic un-certainties. Both detectors feature a dedicated muon identification system, calledmuon veto or inner veto, which is an active detector based on a liquid scintillatorin order to reject background events induced by cosmic muons. Another fluid ofthe detector is the non - scintillating buffer liquid with the objective of shielding thetarget from natural radioactivity. The detection quality and therefore, the physi-cal capability of the Double Chooz experiment strongly depends upon the opticalcharacteristics of these liquids. This thesis focuses on testing both the muon vetoscintillator and the buffer liquid on their optical properties, which play a crucialrole in the decision regarding their composition and in their realization.Different products were available for the selection of the components of both bufferand muon veto liquid. Selection criteria included the results of the attenuationlength and light yield measurements. Having decided for the final compositions ofthe scintillator, it has been prepared on grand scale at Wacker Chemie in Munich.Finally, all liquids have been prepared on site in Chooz.The attenuation length is a parameter quantifying the optical transparency of aliquid scintillator. A high attenuation length implies high transparency, which isof essential concern for a scintillator given the fact that light from each event inthe liquid should be able to reach the photomultipliers located at the surfaces ofthe detector vessels. The attenuation length at 430 nm for the final muon veto

scintillator from Chooz was found to be more than 8m and for the final bufferliquid more than 12m. These results exceed the requirements for both the muonveto scintillator and the buffer liquid.The light yield, as it characterizes the efficiency in the conversion of energy de-posited in the scintillator into detectable photons, is another key parameter of aliquid scintillator. Light yield measurements using γ - radiation have been carriedout within the framework of this thesis. Based on them, the concentration of PPOas a wavelength shifter for the muon veto scintillator has been chosen to be 2 g/l.With an absolute light yield of 9 photons/keV for the ready scintillator the ex-pected light yield has been achieved.In order to analyze the light yield of the muon veto scintillator with respect to neu-trons, it was the aim to determine the proton - quenching factor, which is a variablerelevant for a precise understanding of the Double Chooz detector response. Bytime - of - flight measurements performed at the Maier - Leibnitz - Laboratorium inMunich the proton - quenching factor at an energy of 10.6MeV has been determinedto be 2.6. A Monte Carlo simulation based on C++ was used to investigate itsenergy dependence.Furthermore, the muon veto scintillator has been tested on its capability of distin-guishing between incident neutrons and gammas via pulse - shape discrimination.The neutron - γ discrimination was found to be possible on a 1 σ - level above anenergy threshold of 2180 keV. As regards Double Chooz, this will allow a greatercontrol of background.
4
Contents
1. Introduction to Neutrinos 1
2. Neutrino Oscillations 3
2.1. Derivation of the Oscillation Formula . . . . . . . . . . . . . . . . . 32.2. Oscillation Parameters and their Determination . . . . . . . . . . . 62.3. Measurement of ϑ13 . . . . . . . . . . . . . . . . . . . . . . . . . . 8
2.3.1. Accelerator based Superbeam Experiments . . . . . . . . . . 82.3.2. Reactor Neutrino Experiments . . . . . . . . . . . . . . . . . 9
3. The Double Chooz Experiment 11
3.1. Double Chooz Concept . . . . . . . . . . . . . . . . . . . . . . . . . 113.2. Detection Method . . . . . . . . . . . . . . . . . . . . . . . . . . . . 13
3.2.1. Signal . . . . . . . . . . . . . . . . . . . . . . . . . . . . . . 133.2.2. Background . . . . . . . . . . . . . . . . . . . . . . . . . . . 14
3.3. Detector Design . . . . . . . . . . . . . . . . . . . . . . . . . . . . . 15
4. Organic Liquid Scintillator: Working Principle & Preparation 17
4.1. Organic Liquid Scintillator . . . . . . . . . . . . . . . . . . . . . . . 174.1.1. Scintillation Mechanism . . . . . . . . . . . . . . . . . . . . 174.1.2. Energy Transfer . . . . . . . . . . . . . . . . . . . . . . . . . 194.1.3. Light Output . . . . . . . . . . . . . . . . . . . . . . . . . . 224.1.4. Solvent . . . . . . . . . . . . . . . . . . . . . . . . . . . . . . 244.1.5. Wavelength Shifters . . . . . . . . . . . . . . . . . . . . . . . 27
4.2. Buffer Liquid . . . . . . . . . . . . . . . . . . . . . . . . . . . . . . 304.3. Sample Preparation . . . . . . . . . . . . . . . . . . . . . . . . . . . 314.4. Preparation and Mixing of the Liquids for Chooz . . . . . . . . . . 31
5. Measurement of the Attenuation Length 33
5.1. The Attenuation Length . . . . . . . . . . . . . . . . . . . . . . . . 335.2. Scattering . . . . . . . . . . . . . . . . . . . . . . . . . . . . . . . . 35
5.2.1. Rayleigh Scattering . . . . . . . . . . . . . . . . . . . . . . . 355.2.2. Mie Scattering . . . . . . . . . . . . . . . . . . . . . . . . . 35
5.3. Determination of the Attenuation Length . . . . . . . . . . . . . . . 365.4. Error Estimation . . . . . . . . . . . . . . . . . . . . . . . . . . . . 385.5. Results . . . . . . . . . . . . . . . . . . . . . . . . . . . . . . . . . . 47
i

5.5.1. Muon Veto Scintillator and Components . . . . . . . . . . . 475.5.2. Buffer Liquid and Ondina . . . . . . . . . . . . . . . . . . . 545.5.3. Samples from Chooz . . . . . . . . . . . . . . . . . . . . . . 58
6. Measurement of the Light Yield due to γ - Irradiation 63
6.1. Light Yield . . . . . . . . . . . . . . . . . . . . . . . . . . . . . . . 636.2. Experimental Setup . . . . . . . . . . . . . . . . . . . . . . . . . . . 636.3. Read - out Electronics . . . . . . . . . . . . . . . . . . . . . . . . . . 656.4. Analysis . . . . . . . . . . . . . . . . . . . . . . . . . . . . . . . . . 696.5. Error Estimation . . . . . . . . . . . . . . . . . . . . . . . . . . . . 696.6. Results . . . . . . . . . . . . . . . . . . . . . . . . . . . . . . . . . . 71
7. Measurement of the Light Yield due to Neutron Irradiation 75
7.1. Proton - Quenching Factor . . . . . . . . . . . . . . . . . . . . . . . 757.2. Kinematics of Neutron Elastic Scattering . . . . . . . . . . . . . . . 757.3. Experimental Setup . . . . . . . . . . . . . . . . . . . . . . . . . . . 78
7.3.1. The MLL Accelerator . . . . . . . . . . . . . . . . . . . . . . 787.3.2. Neutron Production . . . . . . . . . . . . . . . . . . . . . . 797.3.3. Scintillator Setup . . . . . . . . . . . . . . . . . . . . . . . . 80
7.4. Setup of Data Acquisition . . . . . . . . . . . . . . . . . . . . . . . 817.5. Analysis . . . . . . . . . . . . . . . . . . . . . . . . . . . . . . . . . 82
7.5.1. Time - of - Flight Plot . . . . . . . . . . . . . . . . . . . . . . 827.5.2. Energy Calibration . . . . . . . . . . . . . . . . . . . . . . . 847.5.3. Neutron -γ Discrimination . . . . . . . . . . . . . . . . . . . 877.5.4. Proton - Quenching - Factor at 10.6MeV . . . . . . . . . . . . 927.5.5. Quenching-Factor Dependence on the Recoil Energy . . . . . 947.5.6. Error Estimation and Discussion of the Results . . . . . . . 100
8. Conclusion and Outlook 103
A. Attenuation Length Corrections 107
B. Attenuation Length of the Final Liquids from Chooz 109
List of Figures 112
List of Tables 113
Bibliography 115
ii

1. Introduction to Neutrinos
Astroparticle physics is a young multidisciplinary field of research, in which particlephysics, astronomy, astrophysics and cosmology converge. While particle physicsdeals with the study of the structure of matter and the fundamental laws that gov-ern their interaction and astronomy as well as astrophysics study the evolution andstructure of the Universe from the Hot Big Bang up to now, it is cosmology thatyields the theory to link those fields of physics. During the last years astroparticlephysics has taken remarkable strides towards understanding the evolution of ourUniverse. The field of neutrinos thereby plays an important role. In the StandardModel of particle physics neutrinos are the least massive fermions [1, 2]. Theybelong to the family of neutral leptons and exist in three types, also called flavors:electron neutrinos νe, muon neutrinos νµ and tau neutrinos ντ . Each type has acorresponding antiparticle, named antineutrino (νe, νµ, ντ ).Neutrinos are of great scientific interest. They are created as a result of certaintypes of radioactive decays, nuclear reactions such as those that take place in theSun, in nuclear reactors, or through the interaction of cosmic rays with the atmo-sphere. As they are known to be particles that are not significantly attenuated bytheir travel through the interstellar medium, they can make an exceptional probefor environments that are typically concealed from other observation techniques.Therefore, they do not only provide a new method to study astrophysical processeslike the energy production in the Sun or the mechanism of core - collapse super-nova explosions, but due to the discovery of so - called neutrino oscillations and,connected to that, neutrino masses, even give a strong motivation to extend theStandard Model of particle physics and to search for new physics beyond it.The neutrino was first postulated in 1930 by Wolfgang Pauli in order to preservethe conservation of energy, momentum and angular momentum in beta decays [3].The fact that an electron created and emitted by beta decay showed a continuousenergy spectrum and not a discrete one as expected for a two body decay, hadpresented former physics with a challenge. Pauli theorized that a third undetectedparticle was carrying away the observed difference between the energy, momentum,and angular momentum of the initial and final particles. He proposed that thisparticle had to be electrically neutral and only very weakly interacting, which alsowas an explanation for the missing experimentally measured data concerning thisparticle up to that time. To the detection of the neutrino, however, almost 20more years should elapse. It was not before the discovery of nuclear fission andthe construction of the first nuclear power plants that neutrino sources with a veryhigh efficiency were available, which enabled Cowan and Reines to succeed in the
1

1. Introduction to Neutrinos
detection of the neutrino in 1956 [4].The possibility of neutrinos changing their flavor was considered the first time atthe discovery of the solar neutrino number discrepancy [3]. The Sun generates itsenergy by nuclear fusion of hydrogen nuclei into helium. 98.4 % of the helium pro-duced in the Sun comes from a series of steps called the p - p (proton - proton) chainwith the following netto reaction: 4H + 2e− → 4He + 2νe + 26.73 MeV. The re-maining 1.6 % of the helium is generated in the so-called CNO cycle, in which smallamounts of carbon, nitrogen and oxygen isotopes are used as a catalyst to produceone alpha particle, two positrons and two electron neutrinos. Those neutrinos justlike the ones produced in the p− p chain, escape carrying away about 3 % of thereleased energy. Despite the huge circumfluent covering mass of the Sun, the neu-trinos reach the Earth as they do not significantly interact with matter. Dependingon their reaction of production in the p− p chain, which determines the neutrinoenergy, one can classify solar neutrinos. Headed by the astrophysicist RaymondDavis, the first experiment for the investigation of the solar neutrino flux startedoperating in 1968 [5]. The Homestake experiment or often referred to as the Davisexperiment used the inverse beta decay of chlorine as a proof of evidence and wasthe first experiment to successfully detect and count solar neutrinos. Surprisingly,the measured neutrino rate turned out to be only one third of the neutrino ratepredicted by the Standard Solar Model. This great discrepancy between the neu-trino rates became generally known as the Solar Neutrino Problem and could beconfirmed by further experiments such as GALLEX [6] and SuperKamiokande [7].The SNO experiment [8] succeeded in unraveling this mystery. In contrast to itspredecessors, SNO used a Cherenkov detector containing heavy water, which madeit possible to distinguish between electron neutrinos and neutrinos of different fla-vors. This way the missing electron neutrinos could be identified as muon - or tauneutrinos, which was the first experimental confirmation of neutrino oscillations.At the present day only the third mixing angle, namely ϑ13, is still missing for acomplete theoretical description of neutrino oscillations between the three neutrinoflavors. The Double Chooz project [9] is a neutrino experiment with the objectiveof the search for this final unknown parameter. Double Chooz (DC), like its pre-decessor Chooz [10], is a reactor neutrino experiment using the two cores of theChooz reactor plant as efficient neutrino sources. The Chooz experiment has al-ready been able to determine the best upper limit known today for the angle ϑ13
(sin2 (2ϑ13) < 0.16 at a 90 % C. L. [11]) and, therefore, also for the maximumconversion probability of the antielectron neutrino. Now, it is the aim of DoubleChooz to finally determine ϑ13 or at least to improve this limit.
2

2. Neutrino Oscillations
By definition neutrino oscillations are oscillating transitions of a neutrino of acertain flavor into a neutrino of another flavor during its propagation throughspace [3]. This means that the probability to measure a certain flavor of a neu-trino changes periodically with its preceding movement. The fact that neutrinooscillations exist implicates important consequences. Contrary to what had beenpreviously assumed, a precedent condition for neutrino oscillations is that not allneutrinos can be massless. Moreover, neutrino oscillations violate the lepton flavornumber conservation, merely the lepton number is preserved. Both scenarios arenot contained in the Standard Model of particle physics. As they do not violatethe Standard Model neither, the theory of neutrino oscillations could establish asan enhancement of the Standard Model.
2.1. Derivation of the Oscillation Formula
Solar and atmospheric neutrino experiments have indicated that the reason forneutrino oscillations is a discrepancy between the flavor and the mass eigenstatesof the neutrinos [3]. The three flavor eigenstates |νe〉, |νµ〉, |ντ〉 of the neutrinos arethe eigenstates of the weak interaction, in which neutrinos are generated. They arealso the ones one can detect. The mass eigenstates |ν1〉, |ν2〉, |ν3〉 in contrast, whichare not identical to the eigenstates of the weak interaction, are responsible for thepropagation of the neutrinos. Each group of eigenstates forms an independentorthonormal basis of the Hilbert space, so both basis systems can be transformedinto each other. The corresponding matrix is a 3 × 3 mixing matrix, also referredto as PMNS - matrix 1 [3, 12, 13]:
νe
νµ
ντ
=
Ue1 Ue2 Ue3
Uµ1 Uµ2 Uµ3
Uτ1 Uτ2 Uτ3
ν1
ν2
ν3
(2.1)
By means of the PMNS - matrix the oscillation probability of a neutrino of a certainflavor can be derived. First of all, a flavor eigenstate can be expressed in terms ofmass eigenstates as follows:
1The matrix is named after the physicists Bruno Pontecorvo, Ziro Maki, Masami Nakagawa andShoichi Sakata.
3
2. Neutrino Oscillations
|να〉 =3∑
i=1
Uαi|νi〉 (2.2)
Here, the flavor eigenstates are denoted by |να〉 with α = e, µ, τ , and the masseigenstates are denoted by |νi〉 with i = 1, 2, 3. Uαi describes the elements of themixing matrix. With respect to the evolution in time of the mass eigenstates, thatone obtains by solving the Dirac equation, the flavor eigenstates are [2]:
|να(t)〉 =
3∑
i=1
Uαie−iEit|νi (t = 0)〉 (2.3)
To get the transition probability Pνα→νβof a neutrino of the flavor α to the flavor
β, the transition amplitude |〈νβ|να(t)〉| has to be determined and its absolute valuehas to be squared:
Pνα→νβ(t) = |〈νβ|να(t)〉|2 =
∣∣∣∣∣
3∑
k=1
U⋆αke
−iEktUβk
∣∣∣∣∣
2
=3∑
k,j=1
U⋆αkUβkUαjU
⋆βje
−i(Ek−Ej)t (2.4)
where U⋆αk and U⋆
βj are the complex conjugated matrix elements. The transitionprobability from the flavor state |να〉 to the flavor state |νβ〉 hence varies periodicallywith time as a function of the energy difference Ek − Ej of the two states. Un-der the assumptions made in the Standard Model of neutrino oscillations, namelythat massive neutrinos have the same momentum ~p and that neutrinos detectableby oscillation experiments are ultrarelativistic, i.e. they almost travel with thespeed of light, the exponent of the transition probability can be simplified. Theapproximation
Ek =√
~p2 + m2k ≃ E +
m2k
2E(2.5)
yields
Ek − Ej =∆m2
kj
2E. (2.6)
4

2.1. Derivation of the Oscillation Formula
Here E ≡ |~p| is the energy of the approximately massless neutrino and ∆m2kj =
m2k − m2
j are the mass squared differences. Next c ≃ 1 results in t ≃ L. Lis the distance between neutrino source and detector that has been passed bythe ultrarelativistic neutrino. In contrast to the time t of the propagation, it isa measurable parameter. This leads to the standard formula of the oscillationprobability in vacuum. It gives the probability P, that a να is measured as a νβ
after a distance L of flight and clarifies the dependence of the oscillation probabilityon the neutrino masses [14]:
Pνα→νβ(L) =
3∑
k,j=1
U⋆αkUβkUαjU
⋆βje
−i∆m2
kj2E
L
= δαβ − 4∑
j>k
ℜ(U⋆
αkUβkUαjU⋆βj
)sin2
(∆m2
kj
4EL
)
+ 2∑
j>k
ℑ(U⋆
αkUβkUαjU⋆βj
)sin
(∆m2
kj
4EL
)
(2.7)
In obtaining (2.7) the unitarity of U has been used. δαβ is the Kronecker - symbol:
δαβ =
{
1 if α = β,
0 if α 6= β,
The phase differences ∝ ∆m2ij ·
L2E
in the complex exponential function result insine - and cosine - like oscillating terms of the probability. If not all ∆m2
kj disappear,which corresponds to the case of at least one massive neutrino, oscillations betweenthe different flavor eigenstates of the neutrinos exist. As a consequence of thismechanism, it follows immediately that neutrino oscillations are only sensitive onthe mass squared differences, but not on the absolute neutrino mass scale. Themass squared differences hence determine the frequency of the oscillations, whilethe oscillation amplitudes are given by the mixing angles ϑij (see 2.2). Thus themixing angles ϑij that are contained in the matrix elements of the mixing matrix,can, up to a certain extend, be seen as a quantity for the intensity of the mixing.Strictly speaking, the considerations above are only valid for vacuum oscillations.When neutrinos are propagating through matter, neutrino oscillations have to bemodified. This is known as the Mikheyev - Smirnov - Wolfenstein (MSW) effect [1,3]. The presence of electrons in matter changes the energy levels of the propagationeigenstates due to additional charged current forward scattering of the electronneutrinos. As a consequence neutrinos in matter do have a different effective massfrom neutrinos in vacuum, which in turn has an effect on the neutrino oscillationsthat are dependent on the mass square differences. This effect, however, is only
5
2. Neutrino Oscillations
noticeable for very high densities of matter, as for example in stars, and very longdistances of flight as it is the case for crossing the Earth. None of them plays anyrole for the Double Chooz experiment, which uses reactor neutrinos. The distancesthey travel are rather short (∼1 km) and no high densities of matter do appear [9],which is why matter effects can be neglected.
2.2. Oscillation Parameters and their Determination
The mixing matrix of equation (2.1) can be written as a product of four 3 × 3matrices [3]:
U =
Ue1 Ue2 Ue3
Uµ1 Uµ2 Uµ3
Uτ1 Uτ2 Uτ3
=
1 0 00 cos ϑ23 sin ϑ23
0 − sin ϑ23 cos ϑ23
·
cos ϑ13 0 sin ϑ13e−iδ
0 1 0− sin ϑ13e
−iδ 0 cos ϑ13
·
cos ϑ12 sin ϑ12 0− sin ϑ12 cos ϑ12 0
0 0 1
·
1 0 00 eiα 00 0 eiβ
(2.8)
ϑij stands for the mixing angles, which will later on often be referred to in the formof sin2 ϑij . δ is the CP violating phase, which does not vanish if neutrino oscilla-tions violate CP - symmetry 2. The violation of CP symmetry is being expected,however, up to now it has not been possible to experimentally show it [15]. αand β in the last matrix only differ from zero, if neutrinos are Majorana particles,which up to now has neither been shown nor been disproved. The question whetherneutrinos are Majorana particles or not, that is to say whether neutrinos are theirown antiparticles or not, does not have any effect on neutrino oscillations [3, 16].Inserting the matrix U (eq. (2.8)) in the standard formula of the oscillation probabil-ity (eq. (2.7)) reveals the oscillation probabilities for the three neutrino generations[3]. The neutrino oscillation probabilities depend on six independent parameters,two mass squared difference, the three mixing angles and the CP violating phaseδ. In fact, the probabilities to detect a certain flavor depend on the fraction of thedistance L passed between source and detector and the energy E of the neutrinos(see eq. (2.7)). Thus this ratio is the crucial experimental variable for a neutrino -oscillation experiment. Any experiment that allows the measurement and variationof L/E, in general, is sensitive on neutrino oscillations and makes it possible to
2In particle physics, CP symmetry states that the laws of physics are the same, if a particlewas interchanged with its antiparticle (charge conjugation or C symmetry), and all spatialcoordinates were swapped (parity or P symmetry).
6
2.2. Oscillation Parameters and their Determination
access and determine the several parameters of the oscillation formula almost inde-pendently from each other. For all oscillation experiments, the types of neutrinosat the source have to be known and types of neutrinos in the detector have tobe determined (e.g. by a CC - reaction on the nucleon). Basically, there are twopossible types of oscillation experiments.
• So - called appearance experiments measure the probability Pνα→νβthat a neu-
trino type, different from the one generated in the source, is being detected.Therefore, it is of great importance for such experiments to exactly knowabout possible νβ - impurities in the να - beam.
• In disappearance experiments the type of neutrino produced in the source isbeing detected later on. This means, the survival probability Pνα→να
thatan initial να reaches the detector respectively the probability Pνα→νx
= 1 −Pνα→να
that the initial να has disappeared, is being measured. For suchexperiments it is important to either know the initial neutrino flux at thesource or the neutrino flux at two different distances from the source in orderto compare the related spectra.
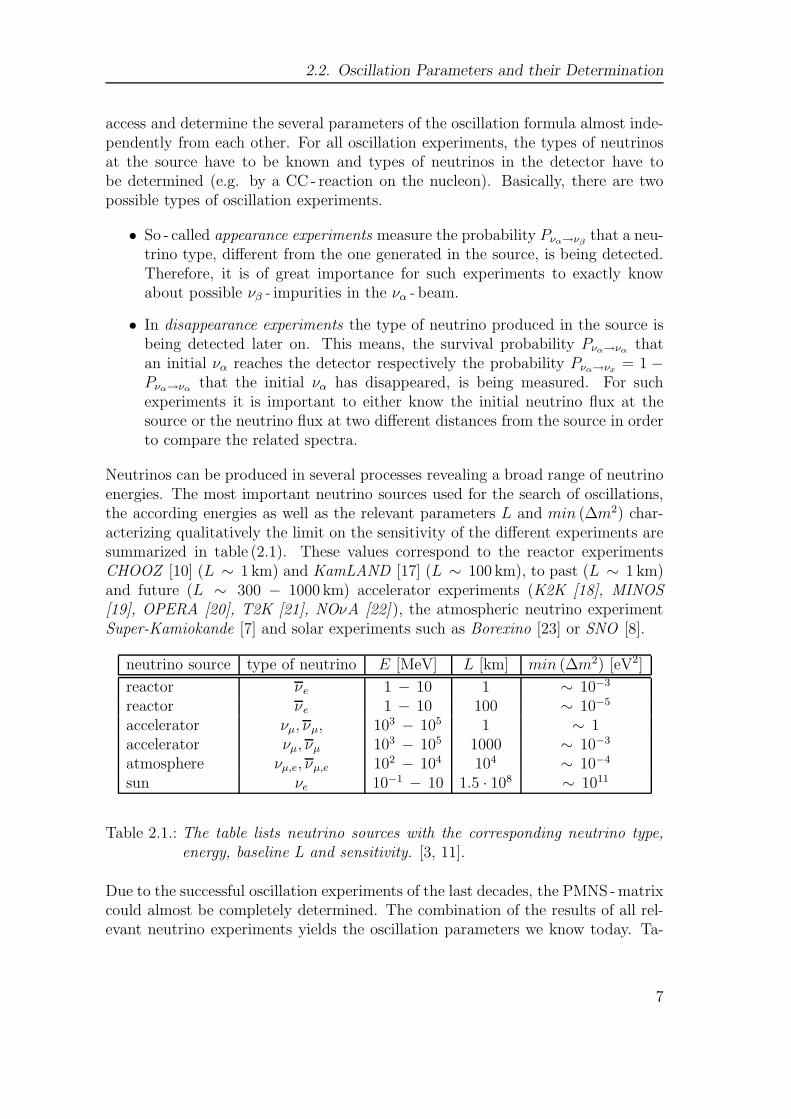
Neutrinos can be produced in several processes revealing a broad range of neutrinoenergies. The most important neutrino sources used for the search of oscillations,the according energies as well as the relevant parameters L and min (∆m2) char-acterizing qualitatively the limit on the sensitivity of the different experiments aresummarized in table (2.1). These values correspond to the reactor experimentsCHOOZ [10] (L ∼ 1 km) and KamLAND [17] (L ∼ 100 km), to past (L ∼ 1 km)and future (L ∼ 300 − 1000 km) accelerator experiments (K2K [18], MINOS[19], OPERA [20], T2K [21], NOνA [22]), the atmospheric neutrino experimentSuper-Kamiokande [7] and solar experiments such as Borexino [23] or SNO [8].
neutrino source type of neutrino E [MeV] L [km] min (∆m2) [eV2]
reactor νe 1 − 10 1 ∼ 10−3
reactor νe 1 − 10 100 ∼ 10−5
accelerator νµ, νµ, 103 − 105 1 ∼ 1accelerator νµ, νµ 103 − 105 1000 ∼ 10−3
atmosphere νµ,e, νµ,e 102 − 104 104 ∼ 10−4
sun νe 10−1 − 10 1.5 · 108 ∼ 1011
Table 2.1.: The table lists neutrino sources with the corresponding neutrino type,energy, baseline L and sensitivity. [3, 11].
Due to the successful oscillation experiments of the last decades, the PMNS - matrixcould almost be completely determined. The combination of the results of all rel-evant neutrino experiments yields the oscillation parameters we know today. Ta-
7
2. Neutrino Oscillations
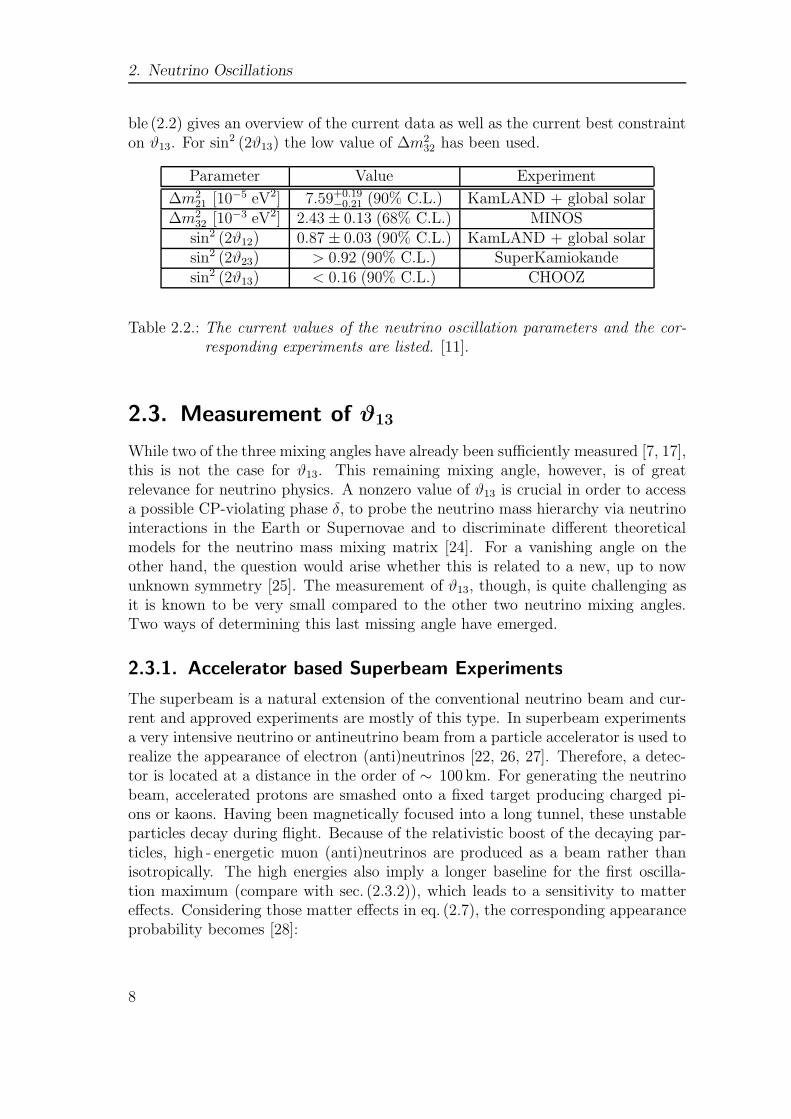
ble (2.2) gives an overview of the current data as well as the current best constrainton ϑ13. For sin2 (2ϑ13) the low value of ∆m2
32 has been used.
Parameter Value Experiment
∆m221 [10−5 eV2] 7.59+0.19
−0.21 (90% C.L.) KamLAND + global solar∆m2
32 [10−3 eV2] 2.43 ± 0.13 (68% C.L.) MINOSsin2 (2ϑ12) 0.87 ± 0.03 (90% C.L.) KamLAND + global solarsin2 (2ϑ23) > 0.92 (90% C.L.) SuperKamiokandesin2 (2ϑ13) < 0.16 (90% C.L.) CHOOZ
Table 2.2.: The current values of the neutrino oscillation parameters and the cor-responding experiments are listed. [11].
2.3. Measurement of ϑ13
While two of the three mixing angles have already been sufficiently measured [7, 17],this is not the case for ϑ13. This remaining mixing angle, however, is of greatrelevance for neutrino physics. A nonzero value of ϑ13 is crucial in order to accessa possible CP-violating phase δ, to probe the neutrino mass hierarchy via neutrinointeractions in the Earth or Supernovae and to discriminate different theoreticalmodels for the neutrino mass mixing matrix [24]. For a vanishing angle on theother hand, the question would arise whether this is related to a new, up to nowunknown symmetry [25]. The measurement of ϑ13, though, is quite challenging asit is known to be very small compared to the other two neutrino mixing angles.Two ways of determining this last missing angle have emerged.
2.3.1. Accelerator based Superbeam Experiments
The superbeam is a natural extension of the conventional neutrino beam and cur-rent and approved experiments are mostly of this type. In superbeam experimentsa very intensive neutrino or antineutrino beam from a particle accelerator is used torealize the appearance of electron (anti)neutrinos [22, 26, 27]. Therefore, a detec-tor is located at a distance in the order of ∼ 100 km. For generating the neutrinobeam, accelerated protons are smashed onto a fixed target producing charged pi-ons or kaons. Having been magnetically focused into a long tunnel, these unstableparticles decay during flight. Because of the relativistic boost of the decaying par-ticles, high - energetic muon (anti)neutrinos are produced as a beam rather thanisotropically. The high energies also imply a longer baseline for the first oscilla-tion maximum (compare with sec. (2.3.2)), which leads to a sensitivity to mattereffects. Considering those matter effects in eq. (2.7), the corresponding appearanceprobability becomes [28]:
8

2.3. Measurement of ϑ13
P (νµ → νe) ≈ sin2 (2ϑ13) · sin2 (2ϑ23) · sin
2 (β)
±α · sin (2ϑ13) · sin (δ) · sin (2ϑ12) · sin (2ϑ23) · β · sin2 (β)
−α · sin (2ϑ13) · cos (δ) · sin (2ϑ12) · sin (2ϑ23) · β · cos (β) · sin (β)
+α2 · cos2 (ϑ23) · sin2 (2ϑ12) · β
2
(2.9)
with the abbreviations α = ∆m221/∆m2
32 and β = ∆m232L/4E, where L is the
distance between generation and detection. Furthermore, cos(ϑ13) ≈ 1 and sin(α ·β) ≈ α · β have been used. The plus sign in the formula relates to antineutrinos,whereas the minus sign relates to neutrinos.The formula implies that superbeam experiments offer the opportunity to measure∆m2
23, the CP-violating phase δ, ϑ23, the mass hierarchy indicated by the sign of∆m2
23, but also ϑ13. On the other hand, eq. (2.9) also implicates that at a certainlevel of precision all oscillation formulas depend on all oscillation parameters leadingto a complicated parameter dependence with degeneracies and correlations. Thisis a great disadvantage of superbeam experiments [28].
2.3.2. Reactor Neutrino Experiments
In the core of a reactor, radioactive elements decay and emit electron antineutrinos,typically about 1022 per core and second. Due to their very intensive flux andlow energies (typically below 8MeV), these antineutrinos provide a possibility tomeasure ϑ13 [29]. The small energies as well as short baselines guarantee the absenceof matter oscillation effects. However, the low energies of antineutrinos from nuclearpower plants also have the disadvantage that only disappearance experiments arepossible. The reason for this is that the energy of reactor neutrinos is not sufficientfor the production of muon or tau leptons. With the help of eq. (2.7), the survivalprobability of an antielectron neutrino can be calculated to [30]:
P (νe → νe) = 1 − 2 sin2 (ϑ13) cos2 (ϑ13) sin2
(∆m2
31L
4E
)
− cos4 (ϑ13) sin2
(∆m2
21L
4E
)
+2 sin2 (ϑ13) cos2 (ϑ13) sin2 (ϑ12)
·
(
cos
((∆m2
31 − ∆m221) L
2E
)
− cos
(∆m2
31L
2E
))
.
(2.10)
The second term describes the contribution of the atmospheric and the third termof the solar driven oscillations. The last term is the result of an interference betweenboth. Assuming low energies and short baselines L (∼ 1 km), as it is the case forreactor experiments, eq. (2.10) in a first approximation simplifies to:
9

2. Neutrino Oscillations
P (νe → νe) = 1 − 2 sin2 (ϑ13) cos2 (ϑ13) sin2
(∆m2
31L
4E
)
(2.11)
Therefore, the survival probability approximately is free from parameter corre-lations and degeneracies, which allows a clean measurement of ϑ13. This is thegreat advantage of reactor neutrino experiments. At the same time, however, re-actor neutrino experiments have up to now been dominated by higher systematicuncertainties originating, for example, from the missing knowledge of the preciseantineutrino spectrum from the fission products of the reactor. Furthermore, thetotal neutrino flux had to be calculated from the thermal power of the reactor cores.
Since both superbeam and reactor neutrino experiments have advantages and dis-advantages, it has been pointed out that the combination of data from superbeamand reactor neutrinos provides a possibility to resolve ambiguities and thus gives amuch better sensitivity to oscillation parameters [82].Moreover, the reactor neutrino experiment Double Chooz pursues a new strategy[9] to reduce the systematic uncertainties former reactor experiments suffered from.The concept is to make a competitive measurement with two identical detectors in-stead of using only one. A detector close to the reactor will be used for monitoringthe total antineutrino flux, its spectral shape and time variations. A second de-tector will be located at a distance where the distortion of the antineutrino energyspectrum due to neutrino oscillations will allow to determine ϑ13 with an increasedsensitivity.
10

3. The Double Chooz Experiment
The Double Chooz (DC) project is a neutrino experiment with the objective of thesearch for the third mixing angle, namely ϑ13. Double Chooz, like its predeces-sor called Chooz [10], is a reactor neutrino disappearance experiment sited in thevillage Chooz, using the cores of the local reactor plant as efficient antineutrinosources. The Chooz experiment has already been able to determine the best upperlimit known today for the parameter ϑ13. Now, Double Chooz intends to finallydetermine ϑ13 or at least to improve its limit [9].
3.1. Double Chooz Concept
Figure 3.1.: Top view of the Chooz nuclear reactor plant sited at the river Meuse.The positions of the reactors as well as the close and the far detectorof the DC project are indicated [31].
11

3. The Double Chooz Experiment
The Double Chooz experiment is located at the village Chooz in the French Ar-dennes near the border to Belgium (see fig. (3.1)). Chooz has one of the worldwidemost powerful nuclear reactor plants (thermal power of 8.5 GW), which serves asan intense antineutrino source [9].For the detection of the neutrinos, Double Chooz uses two underground detectors:The so-called near detector is meant to measure precisely the total antineutrinoflux from the nuclear power plant, its spectral shape and time variations. There-fore, it is built under a small hill in a distance of only 400m to the two reactorcores [9]. At this position, oscillation effects can be neglected (see fig. (3.2) andeq. (2.10)).
Figure 3.2.: The survival probability of an electron antineutrino as a function ofbaseline L over neutrino energy E is plotted on a logarithmic scale[33]. For this plot the current data of [11] have been used. While theamplitude of the first oscillation minimum is given by sin2 (2ϑ13), theamplitude of the second minimum is given by sin2 (2ϑ12). Furthermore,the positions of the two DC detectors have been marked. While oscil-lation effects can be neglected at the location of the near detector, theeffects from neutrino oscillations due to ϑ13 are nearly maximal at theposition of the far detector.
The far detector is located in a distance of about 1.05 km to the two reactors [9],which is near the location of the expected local minimum of the survival proba-bility P (νe− → νe−) (see fig. (3.2)). For a not too small mixing angle ϑ13, the fardetector will reveal the effects from the disappearance of the electron antineutrinos.
12

3.2. Detection Method
Comparing the total flux and the shape of the neutrino spectrum in both detectors,the mixing angle can be calculated.
By the use of two detectors and related to that the reduction of systematic uncer-tainties, a sensitivity, almost twice as high as by the use of only one detector, canbe achieved. Currently, the installation of the first Double Chooz detector is closeto completion. Double Chooz intends to start operating with the far detector only.The desired sensitivity after 1.5 years of data taking is sin2(2ϑ13) ≤ 0.06. In thesecond phase both the near and the far detector will run simultaneously and theintended sensitivity after additional 3 years of data taking is sin2(2ϑ13) ≤ 0.06 (for∆m2
31 ≈ 2.5 · 10−3eV2 and a 90 % C.L.) [9]. Even if no effect was seen within theprecision of the measurement, the known upper limit of ϑ13 could still be improvedsignificantly. In both cases, the result will have great influence on the method ofthe determination of the CP violating phase δ, as the potential of future acceleratorneutrino experiments particularly depends on the exact value of ϑ13 [32].
3.2. Detection Method
3.2.1. Signal
The Double Chooz experiment uses two underground liquid scintillator1 based de-tectors. The electron antineutrinos undergo inverse beta decay in the scintillatorliquid at an energy threshold of 1.8MeV [9]:
νe + p → e+ + n (3.1)
The positron as well as the neutron produce a flash of scintillation light, whichcan be used for a delayed coincidence measurement. Loosing its kinetic energy,the positron leads to a prompt signal and finally annihilates with an electron ofthe surroundings producing two 511 keV photons. The neutron thermalizes and,as the DC liquid scintillator is loaded with 1 g/l gadolinium (Gd), can afterwardsbe captured by a gadolinium nucleus releasing gamma quants with a total energyof about 8 MeV.
Gd + n → Gd⋆ → Gd +∑
γ (8 MeV ) (3.2)
On average, the time interval between the prompt annihilation and the neutroncapture on gadolinium is 30 µs [34]. This delayed coincidence gives secure prooffor one of the very seldom neutrino capture events and provides the opportunityto greatly reduce the number of background events. Without oscillations, the
1For the working principle of organic scintillators and further information see chapter (4).
13

3. The Double Chooz Experiment
expected neutrino rates are ∼ 69 per day in the far and ∼ 480 per day in the neardetector.Measuring the total energy of the positron yields the energy of the incoming electronantineutrino:
Eνe≃ Ee+,vis − 511 keV + (mn − mp) (3.3)
where Ee+,vis is the total visible energy of the positron containing the kinetic energyas well as the energy of the gamma rays from the annihilation process. mn is themass of the neutron and mp the mass of the proton. The kinetic energy of the neu-tron has been neglected, which is a valid approximation for small neutrino energies.
3.2.2. Background
The reachable sensitivity in measuring ϑ13 is limited by systematical and statisti-cal uncertainties. While statistical uncertainties can be reduced by increasing thedetector mass and the measuring time, controlling the systematic uncertainties ismore challenging. Many uncertainties former reactor - neutrino experiments suf-fered from, such as the uncertainty in the reactor antineutrino flux in the Choozexperiment [10], can significantly be reduced by the use of two detectors. Thecontribution of so - called accidental and correlated background events, however,remains.Accidental background is caused by beta and gamma rays from natural radioac-tivity of the detector components that induce a prompt signal just as the positronfrom the inverse beta decay. Followed by an event creating an 8MeV signal, suchas slow neutrons produced by muons, this creates a delayed coincidence mimickingthe antineutrino signal. Accidental background, however, can be measured, whichallows to efficiently control its contribution to the systematical uncertainty [9].Correlated background can be induced by cosmic muons in different ways. Theyare, for example, capable of producing fast neutrons via spallation in the sur-rounding rock, which then can cross the veto and buffer and deposit several MeVby thermalization in the γ-catcher or target scintillator before being captured ongadolinium causing a delayed coincidence.Negatively charged muons can also be directly captured in the detector, followed byneutron emission. Finally, there is the possibility of muon spallation on 12C, whichcan produce 8He, 9Li and 11Li. Those isotopes decay on a timescale of 100ms for8He and 9Li and of a few ms for 11Li and by doing so produce neutron cascades.The systematics of the background due to fast neutrons cannot be measured effi-ciently. For its reduction, however, the determination of correlated events of fastneutrons in different active volumes of the detector, such as a threefold coincidence
14
3.3. Detector Design
of an energy deposition in the inner veto, the gamma catcher and the target, canbe used [9].
3.3. Detector Design
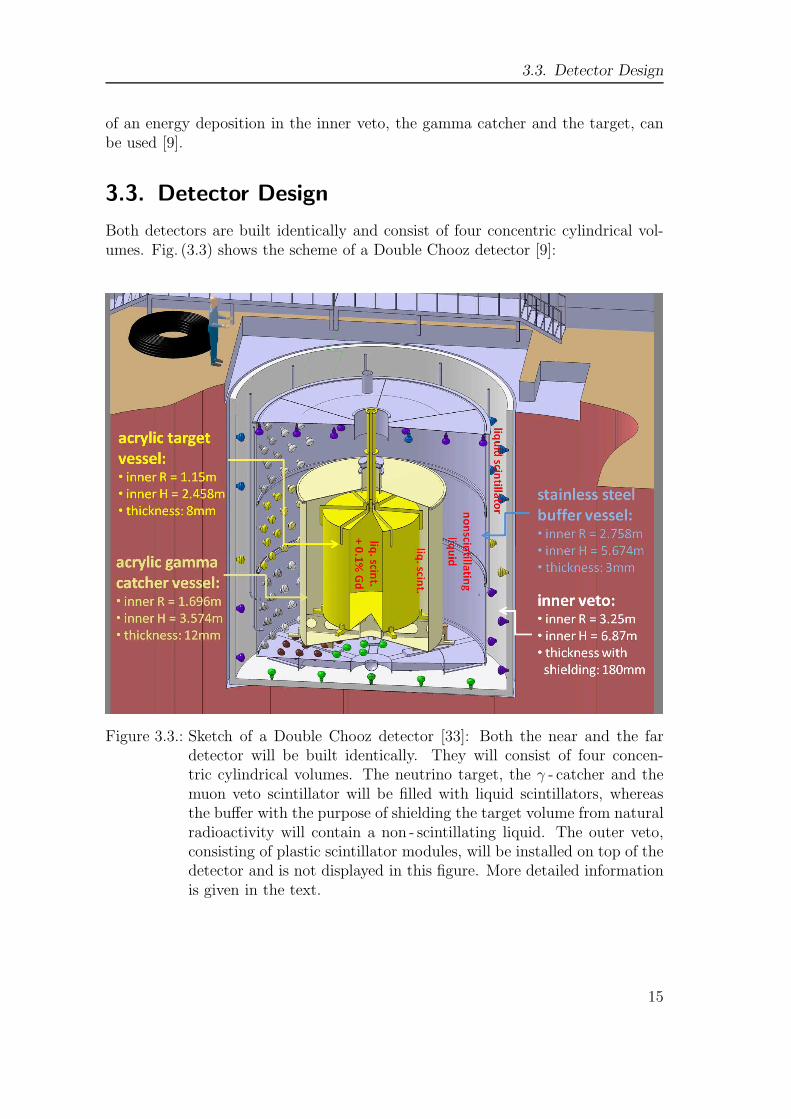
Both detectors are built identically and consist of four concentric cylindrical vol-umes. Fig. (3.3) shows the scheme of a Double Chooz detector [9]:
Figure 3.3.: Sketch of a Double Chooz detector [33]: Both the near and the fardetector will be built identically. They will consist of four concen-tric cylindrical volumes. The neutrino target, the γ - catcher and themuon veto scintillator will be filled with liquid scintillators, whereasthe buffer with the purpose of shielding the target volume from naturalradioactivity will contain a non - scintillating liquid. The outer veto,consisting of plastic scintillator modules, will be installed on top of thedetector and is not displayed in this figure. More detailed informationis given in the text.
15

3. The Double Chooz Experiment
• Starting from the inside, there is the neutrino target, 10.3 m3 of an organicliquid scintillator loaded with 1 g/l gadolinium contained in a tank made ofacrylic plastic material. The acrylic material was chosen to ensure chemicalcompatibility with the scintillating liquids, especially the gadolinium and tomeet the condition of transparency to photons with wavelengths above 400 nmemitted by the scintillator.
• The vessel surrounding the target is also cylindrical shaped and made ofacrylic plastic material. It it is filled with the so-called γ - catcher, moreprecisely, 22.6 m3 of a non - loaded scintillator. Its purpose is to efficientlymeasure the gamma rays released after the neutron capture on gadoliniumas well as those produced by positron annihilation. Ensuring that also thegamma rays created at the edge of the neutrino target deposit their wholeenergy, the γ - catcher guarantees a homogeneous detector response.
• The next vessel is made of stainless steel and carries the 390 inner detectorphotomultiplier tubes2. It contains 114.2 m3 of the so - called buffer liquid3.This non - scintillating liquid has the purpose of shielding the target volumefrom natural radioactivity, mainly gamma rays emitted by the glass of thePMTs.
• The inner veto tank is filled with 90 m3 of a liquid scintillator, which actsas muon veto (MU) to distinguish between true neutrino signals and thosethat are signals caused by background events. For this reason the MU liquidscintillator is used to identify incoming muons [33]. Compared to a waterCherenkov veto, the use of a scintillating liquid yields a factor of 30 morephotoelectrons per typical muon event and additionally grants the possibilityof identifying incoming fast neutrons by their charged secondaries. Further-more, the scintillation light in comparison to the Cherenkov light is diffuse,which is of advantage for the PMT arrangement at the inner surface of thevessel. Altogether, the inner veto houses 78 PMTs.
• On top, the detector will be covered with the outer veto. Consisting of 44plastic scintillator modules, this veto system does not only provide crucialredundancy for the inner veto in tagging background associated coincidences,but also allows a higher tracking resolution. It can even tag those muons,which merely pass near the detector and might produce fast neutrons.
2In the following photomultiplier tube will often be abbreviated by PMT.3For further information see chapter (4).
16

4. Organic Liquid Scintillator:
Working Principle & Preparation
4.1. Organic Liquid Scintillator
Scintillators are used for the detection of particles and radiation [35]. Incidentradiation or particles generate a light signal proportional to the energy they havedeposited in the scintillator material. In general, one can distinguish between or-ganic and anorganic scintillators. While anorganic scintillators are usually crystalsdoped with centers of activation, common organic scintillators are liquids as, forexample, the DC scintillator for the muon veto is supposed to be. Charged particlescrossing the scintillation medium deposit their energy mainly by electromagneticinteractions leading to the ionization of the state molecules. Besides from energyloss processes known as quenching, this leads to fluorescence light, usually, in theultraviolet (UV) or the visible range [36, 37].
4.1.1. Scintillation Mechanism
An organic scintillator usually contains hydrocarbons in a structure of benzene [38].Although the excitation of the strong sigma bonds is also possible, the main con-tribution to the scintillation light comes from the deexcitation of the π - electronsthat are distributed equally and delocalized between each of the six carbon atomsof the ring of benzene [39]. Generally, there are two processes resulting in lumines-cence light, which differ in their time scale τ of light emission after excitation, aswell as in wavelength. While in the case of fluorescence, absorption and excitationare immediately followed by the emission of light (τ ≈ 10−8 s), a longer period oftime can elapse between absorption and emission in the case of phosphorescence[40, 37].Processes leading from the absorption of exciting light or excitation by particlesto the emission of luminescence light can be explained by energy diagrams knownas Jablonski diagrams [41]. A Jablonski diagram shows the energies of the elec-tron transitions, which appear due to the excitation and emission of photons (seefig. (4.1)). Depending on the relative orientation of the spin of the excited elec-tron, that is whether it is parallel or antiparallel compared to the same electronin the ground state, the niveau scheme splits into a singlet and a triplet part [35].While the energy intervals of the electronic states (S0, S1, ...) are in a range of
17

4. Organic Liquid Scintillator: Working Principle & Preparation
Figure 4.1.: This Jablonski diagram gives the energy states of the π-electrons in anorganic liquid scintillator molecule [40, 37, 42]. The different elec-tron transitions that appear due to the excitation and emission ofphotons are illustrated. Depending on the relative orientation of thespin of the excited electron (parallel or antiparallel) compared to thesame electron in the ground state, the niveau scheme splits up into asinglet (S0, S1, ...) and a triplet part (T1, T2, ...). Shown are the elec-tronic states as well as the vibrational sub-levels (dashed lines). Oncea molecule has been excited (absorption), the processes of fluorescenceand phosphorescence can lead to the emission of luminescence light.Triplet states cannot be populated directly by absorption since electronictransitions in combination with a spin flip are forbidden by the rules ofselection. The indirect population, however, is possible for the processof intersystem crossing. Here, the excited electron flips its spin throughthe interaction with another molecule in the same state of excitation.
18

4.1. Organic Liquid Scintillator
2 eV to 4.5 eV, the energy differences of the vibrational states of the molecules(S00, S01, S02, ...) are about 0.1 eV. Although the simple picture of photon absorp-tion by a molecule subsequent by reemission of a photon to give luminescence seemsto be quite straightforward, there are nonradiative processes, which compete withphoton emission. Populated singlet states, for instance, that are higher in energythan the lowest excited state and any state with excess vibrational energy (such asS11 or S12) decay very fast (10−12 s) without emission of radiation dissipating energyin the form of heat via collisions with other molecules [42]. Nonradiative transi-tions between states of the same multiplicity (e.g. S1 → S0, S2 → S1, T2 → T1)are referred to as internal conversion or electronic relaxation, whereas the decay ofvibrational states (e.g. S00, S01, S02, ..) is known as vibrational relaxation.In a solution these nonradiative processes can occur during a negligibly short periodof time [42] through efficient transfer of excess vibrational energy from the solutemolecule to the solvent. In a simple organic scintillator molecule, the first effectafter an excitation process to a state higher than the lowest electronic one henceis the nonradiative relaxation into the S1 state. Luminescence light, however, isemitted by the radiative relaxation from the first excited levels into the groundstate. The radiative transition from S1 is referred to as fluorescence. Since theradiationless processes cause losses concerning the conversion of excitation energyto fluorescence light, the emission spectrum, actually, is shifted to longer wave-lengths, which is known as Stokes shift (see fig. (4.2)) [35, 42]. Neither in the caseof absorption nor in the case of fluorescence the spin of the affected electron doeschange. Electronic transitions in combination with a spin flip are highly forbiddenby the rules of selection. As a result triplet states cannot be populated directly byabsorption from S0 → T1. This, however, is possible indirectly, either by recombi-nation of ionized molecules, which in 75 % of the cases leads to triplet states [35], orby the so - called process of intersystem crossing. For the latter the excited electronhas to flip its spin. Therefore, it is only possible through interaction with anothermolecule in the same state of excitation and occurs with a very low probability.Once the triplet state has been populated, there is the possibility of the relaxationfrom T1 to the ground state S0. As a consequence phosphorescence does occur. Thenecessary change of spin for this process leads to a comparatively long timescalein the range of microseconds. Most of the times, however, populated triplet statescause delayed luminescence by the transition from S1 to S0. For that, the state S1
has to be repopulated, which is possible due to two processes: Firstly, the state T1
can acquire thermal energy via collisions until it is sufficient to return to the S1
state and secondly, two molecules in the same T1 state can interact giving rise toone S0 state and one excited singlet state S1 [35].
4.1.2. Energy Transfer
The emission spectrum of a luminescent significantly overlaps with its own absorp-tion spectrum [42, 43] as can be seen in fig. (4.2). This results in self - absorption of
19
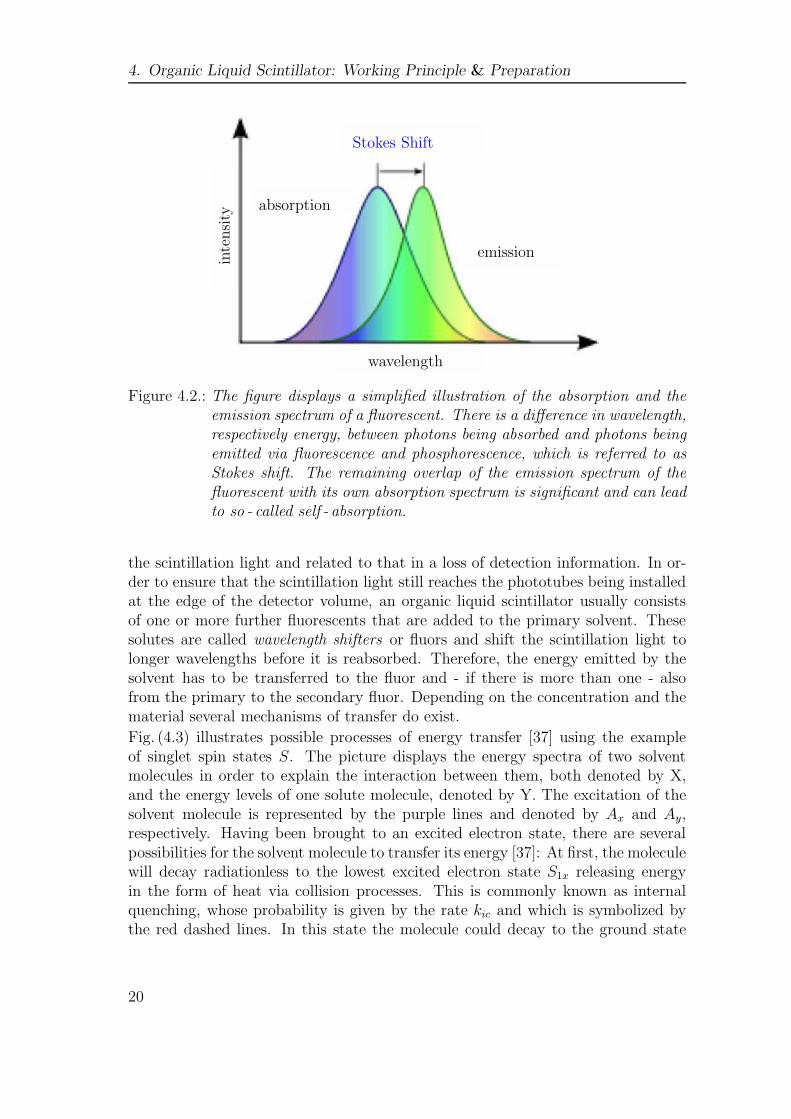
4. Organic Liquid Scintillator: Working Principle & Preparation
Stokes Shift
inte
nsi
ty
wavelength
absorption
emission
Figure 4.2.: The figure displays a simplified illustration of the absorption and theemission spectrum of a fluorescent. There is a difference in wavelength,respectively energy, between photons being absorbed and photons beingemitted via fluorescence and phosphorescence, which is referred to asStokes shift. The remaining overlap of the emission spectrum of thefluorescent with its own absorption spectrum is significant and can leadto so - called self - absorption.
the scintillation light and related to that in a loss of detection information. In or-der to ensure that the scintillation light still reaches the phototubes being installedat the edge of the detector volume, an organic liquid scintillator usually consistsof one or more further fluorescents that are added to the primary solvent. Thesesolutes are called wavelength shifters or fluors and shift the scintillation light tolonger wavelengths before it is reabsorbed. Therefore, the energy emitted by thesolvent has to be transferred to the fluor and - if there is more than one - alsofrom the primary to the secondary fluor. Depending on the concentration and thematerial several mechanisms of transfer do exist.
Fig. (4.3) illustrates possible processes of energy transfer [37] using the exampleof singlet spin states S. The picture displays the energy spectra of two solventmolecules in order to explain the interaction between them, both denoted by X,and the energy levels of one solute molecule, denoted by Y. The excitation of thesolvent molecule is represented by the purple lines and denoted by Ax and Ay,respectively. Having been brought to an excited electron state, there are severalpossibilities for the solvent molecule to transfer its energy [37]: At first, the moleculewill decay radiationless to the lowest excited electron state S1x releasing energyin the form of heat via collision processes. This is commonly known as internalquenching, whose probability is given by the rate kic and which is symbolized bythe red dashed lines. In this state the molecule could decay to the ground state
20

4.1. Organic Liquid Scintillator
Figure 4.3.: Energy transfer process illustrated in a two component system with onlysinglet spin states taken into account. The singlet spin states of the sol-vent X and the solute Y are shown [35, 37]. Having been excited byabsorption (purple lines that are denoted by Ax and Ay), the moleculescan decay either radiationless (red dashed lines) or by emitting fluores-cence light (blue lines). The rates of the internal conversions therebyare represented by kic for states higher than the lowest excited one andby kix or kiy for the first excited states. In the case of the fluorescenceprocesses, the rates are denoted by kfx and kfy. Photons, which es-cape from the system are denoted by the dashed blue lines (kfxe, kfye).The upper black dashed lines represent energy transfer by collision ordipole-dipole interactions (ktxx, ktxy) and the lower ones by radiativetransfer (axxkfx, axykfx, ayykfy). For details see text.
21
4. Organic Liquid Scintillator: Working Principle & Preparation
S0x, either again radiationless (red dashed line, with a rate denoted by kix) or byemitting fluorescence light (blue line, kfx). The latter leads to detectable photons(blue dashed line, denoted by kfxe), although, only to a certain amount as there isstill the possibility of reabsorption by another solvent molecule. Apart from thesetwo possible transitions, the energy could also be transferred to another moleculeor to the solute. In general, this is possible via collisions, also called energy hopping[44], via dipole-dipole interaction (Forster mechanism) [40, 45], indicated by theupper black dashed lines (with the rates ktxx and ktxy) in fig. (4.3), or via radiativeenergy transfer indicated by the lower black dashed lines (with the rates axxkfx,axykfx and ayykfy). In the case of liquid scintillators, the concentration of the soluteusually is in the order of a few grams per liter. This is very small compared to theconcentration of the solvent. As a result radiative processes can be neglected forthe energy transfer from the solvent to the solute [40].
The dipole - dipole transfer can be described by the following formula [45].
κ =1
τ1x
(R0
R
)6
(4.1)
Here κ is the dipole - dipole transfer rate between two interacting molecules andτ1x is the radiative lifetime of the donor state, i.e. S1x in fig. (4.3). R is thedistance between the interacting molecules and R0 is a constant describing theoverlap between the emission spectrum of the first and the absorption spectrumof the second molecule. Once the solute’s state S1y has been populated, there areagain the possibilities of radiationless transitions (red dashed line with kiy) andradiative transitions (blue line with kfy). Detectable photons are again denoted bythe blue dashed lines and the related rate by kfye. In the case of a secondary oreven third wavelength shifter, the energy then has to be transferred further fromone solute to the next. Here, radiative processes play the dominating role [46].Measurements of fluorescence and absorption spectra show that the concentrationsof the wavelength shifters usually are too small for an effective nonradiative energytransfer.
4.1.3. Light Output
When a charged particle crosses a scintillator, the main part of its kinetic energy,depending both on particle type and particle energy, is dissipated in the form ofheat. Only a small fraction of the particle’s energy is converted into fluorescencelight. Any process that reduces the fluorescence intensity of a scintillation detectoris commonly referred to as the effect of quenching (for the quenching factor seesec. (7.1)). Quenching, however, is not an effect of impurities and has to be distin-guished from other processes that irreversibly decrease the luminescence such asthe presence of oxygen [42]. The response of a scintillator to a charged particle can
22

4.1. Organic Liquid Scintillator
be parameterized by the fluorescence energy emitted per unit path length dL/dxapplying the semi - empirical Birks formula [35]:
dL
dx=
S dEdx
1 + kB dEdx
(4.2)
According to Birks theory, the specific light output dL/dx is related to the energydeposition per unit path length dE/dx. A charged particle is capable of producing afraction S · dE/dx of excited molecular structures along its track in the scintillatoraccording to the Bethe-Bloch law. These excitations hence are proportional tothe specific energy loss with S being the absolute scintillation efficiency. Theparameter kB is the Birks quenching factor, a proportionality constant, relating thedensity of ionization centers to dE/dx. Birks assumes that a fraction representedby kB ·dE/dx of the excited molecules along the particles’ wake contributes to thequenching effect, which reduces fluorescence intensity.Consequently, in the absence of quenching, the light yield is proportional to theenergy loss. This, for example, is the case for fast electrons directly induced byγ - radiation, when dE/dx can be assumed small for sufficiently large values of E.The light output per unit path length dx then turns into [42]:
dL
dx
e
= SdE
dx(4.3)
This leads to a constant light output per unit energy loss
dL
dE
e
= S (4.4)
and hence to an absolute light yield proportional to the initial particle energy.
L =
∫ E
0
dL
dE ′dE ′ = SE (4.5)
For the same deposition of energy, the scintillation light yield of heavier ions on theother hand, is generally less than the light yield of electrons and γ - ray interactions,respectively [47, 36]. The reason for this is that for an ion dE/dx becomes large.This approximately gives a specific light output of
dL
dx
ion
=S
kB(4.6)
23

4. Organic Liquid Scintillator: Working Principle & Preparation
where S and kB are depending on the scintillation medium. Integration results inan absolute light yield of
L =S
kB· R (4.7)
where R is the range of the considered ion. As a result, the absolute light yield for anion is proportional to the distance it passes in the scintillator medium. In general,the effect of quenching hence is larger for ions that travel a shorter distance in thescintillator. This distance on the other hand is the shorter, the heavier the ion andthus the higher the specific energy loss. Nevertheless, it has to be emphasized thatthis is an approximation and experimentally some further dependence of dL/dx onthe specific particle type in addition to dE/dx is observed [36]. 1
4.1.4. Solvent
Linear Alkylbenzene
The solvent is the basic material of a scintillator. For the MU of the Double Choozdetector the decision has been made for linear alkylbenzene (LAB). More precisely,LAB is not a single compound, but a mixture solvent of different alkylbenzenes.Fig. (4.4) illustrates its chemical structure and table (4.1) shows its main proper-ties.LAB as a scintillator for the Double Chooz experiment offers several advantagesincluding very high purity and transparancy. Moreover, LAB is classified neitheras hazardous material nor as ecologically harmful, which makes its handling moreplain. It additionally offers a relatively high flash point of 140 ◦C, which is a plusfactor referring to safety considerations. Besides, LAB as a common basic materialin the detergent industry, is available relatively inexpensive.LAB from different companies have been under consideration. The companies atchoice together with their products and the products’ densities are listed in ta-ble (4.2). In order to decide between them, the products have been tested on theiroptical properties (see sec. (5.5.1)) as well as on their density. For the density mea-surements a digital laboratory density meter of type DMA 38 from the companyAnton Paar was used. It is able to measure the density for temperatures rangingfrom 15◦ C to 40◦ C with an accuracy of 0.001 g/cm3. The measuring principleof the density meter is based on an electronic measurement of the oscillation fre-quency: The sample to be measured can be filled into a hollow, U - shaped glasstube of a certain oscillation capacity. This container then gets electronically excitedinto undamped oscillations. The eigenfrequency thereby is influenced by the mass
1The results of this subsection will be used in chapter (7).
24

4.1. Organic Liquid Scintillator
of the sample. The density meter measures the corresponding oscillation periodwith high resolution and, related to that, calculates the density.
Figure 4.4.: Chemical structure of LAB. The π - electrons of the ring of benzene areresponsible for the emission of scintillation light.
name linear alkylbenzeneshort name LABmolecular formula CH3 − (CH2)n − CH[C6H5] − (CH2)m − CH3
(n + m = 7 − 10) (n, m = 0 − 10)CAS-number 67774-74-7 (Helm [48]), 68890-99-3 (Petresa/Cepsa [49])flash point [◦C] 140absorption [nm] 260emission [nm] 283
Table 4.1.: Physical and chemical properties of LAB [50, 51].
25

4. Organic Liquid Scintillator: Working Principle & Preparation
company product name of LAB density at 15 ◦C
Petresa/Cepsa [49] LAB P-550 Q 0.859 g/cm3
Wibarco [52] Wibarcan 0.867 g/cm3
Helm Spain [48] LAB 0.860 g/cm3
Helm Belgium [48] LAB 0.860 g/cm3
Table 4.2.: The table gives the LAB products that have been tested for DC togetherwith their companies and the density measured for 15◦C.
n - Paraffin and Tetradecane
In the special case of the DC experiment a further component is used in addition tothe solvent. In order to achieve the desired density of 0.804 g/cm3 the primary sol-vent is being diluted with a non - scintillating, non - reactive and highly transparentfluid. It is very important for all detector liquids to have exactly the same density,as the separating walls of the single detector volumes are very thin. They wouldnot be able to withstand too strong buoyancy [53]. At choice were n - paraffins, amixture of alkanes with common molecular formula CnH2n+2, where n is between18 and 32, and tetradecane, higher alkanes with common formula C14H30. Fig. (4.5)illustrates the structure of n - paraffins.Tetradecane with a density of 0.767 g/cm3 as well as n-paraffins with a densityof 0.748 g/cm3 both provide a lower density than LAB, which has a density of0.859 g/cm3. This makes it possible to use both for adapting the required density.Both liquids are non - scintillating and non - reactive. They exhibit high trans-parency and are ecological harmless, which makes them appropriate candidates.The products again have been tested on their density (see table (4.4)) and theiroptical properties in order to make a decision. Finally, n - paraffin from CBR hasbeen selected (see sec. (5.5.1)).
[CH2]n-2
H3C CH3
Figure 4.5.: Chemical structure of n - paraffins with the common molecular formulaCnH2n+2.
26
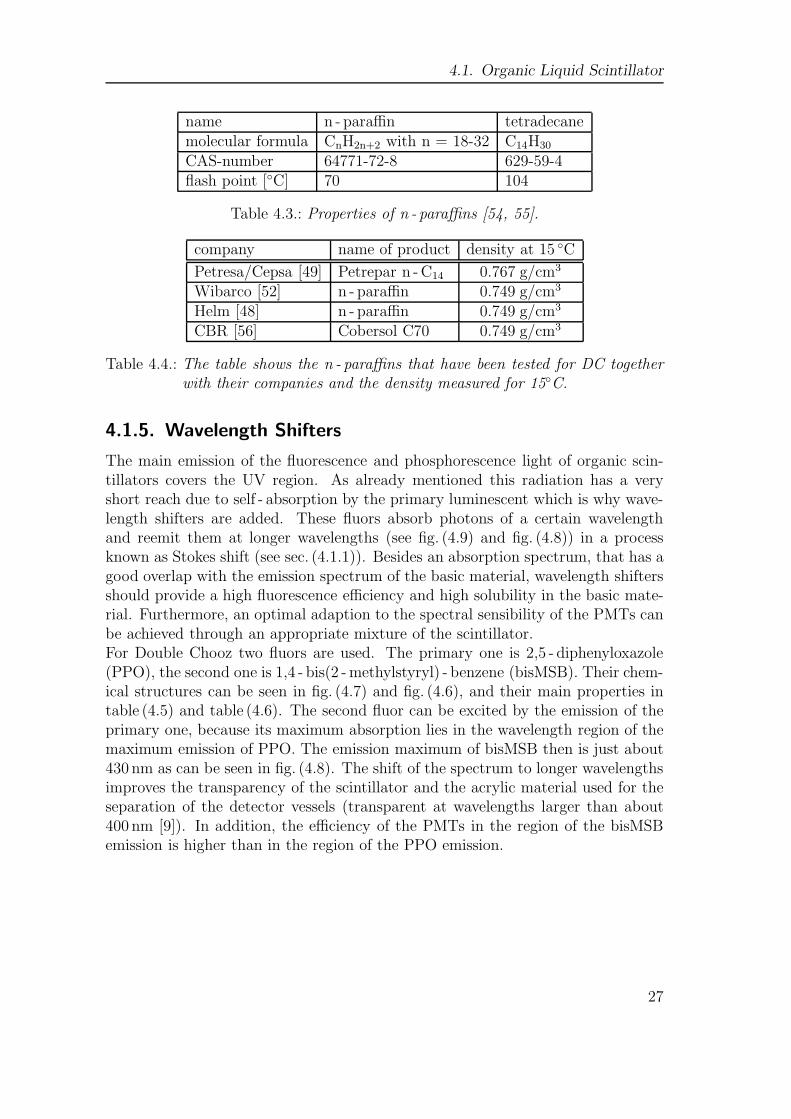
4.1. Organic Liquid Scintillator
name n - paraffin tetradecanemolecular formula CnH2n+2 with n = 18-32 C14H30
CAS-number 64771-72-8 629-59-4flash point [◦C] 70 104
Table 4.3.: Properties of n - paraffins [54, 55].
company name of product density at 15 ◦C
Petresa/Cepsa [49] Petrepar n - C14 0.767 g/cm3
Wibarco [52] n - paraffin 0.749 g/cm3
Helm [48] n - paraffin 0.749 g/cm3
CBR [56] Cobersol C70 0.749 g/cm3
Table 4.4.: The table shows the n - paraffins that have been tested for DC togetherwith their companies and the density measured for 15◦C.
4.1.5. Wavelength Shifters
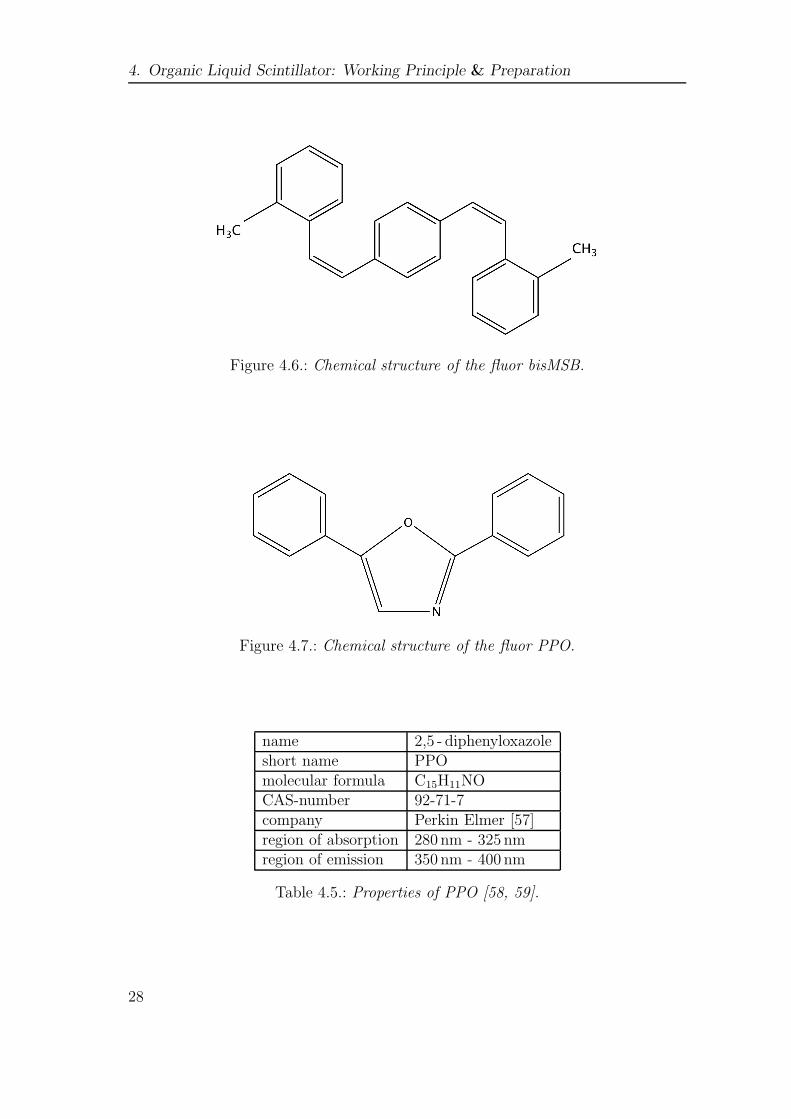
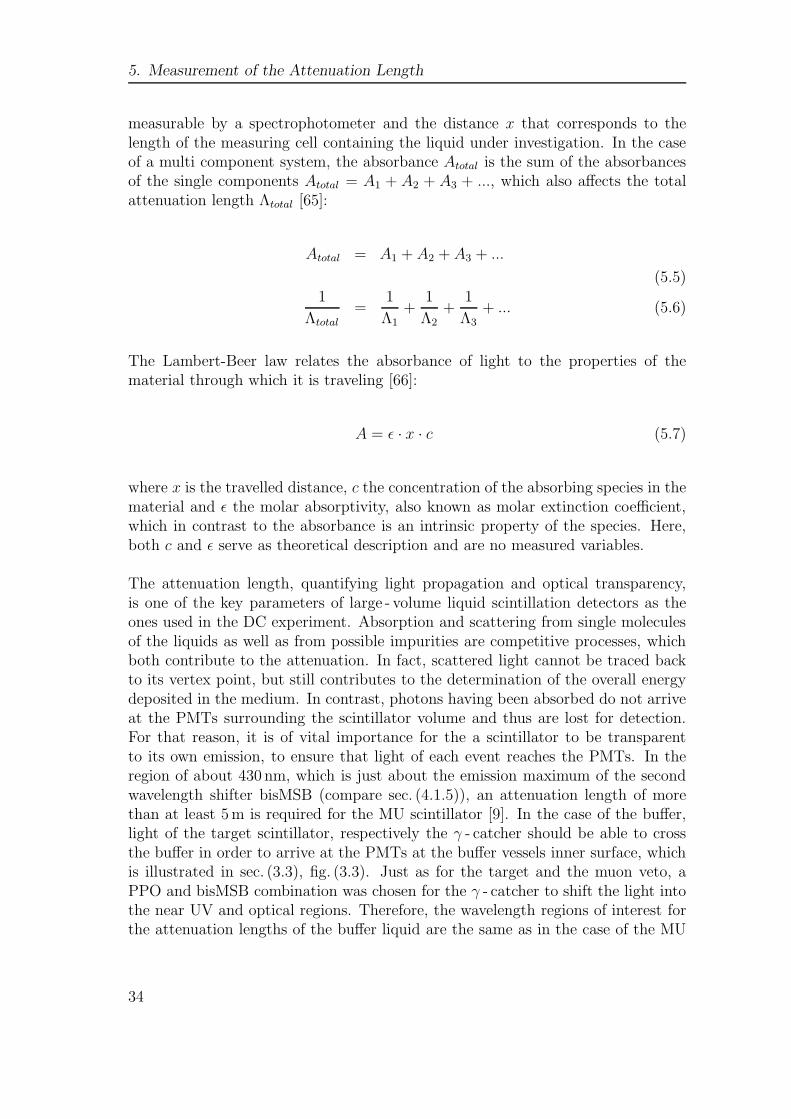
The main emission of the fluorescence and phosphorescence light of organic scin-tillators covers the UV region. As already mentioned this radiation has a veryshort reach due to self - absorption by the primary luminescent which is why wave-length shifters are added. These fluors absorb photons of a certain wavelengthand reemit them at longer wavelengths (see fig. (4.9) and fig. (4.8)) in a processknown as Stokes shift (see sec. (4.1.1)). Besides an absorption spectrum, that has agood overlap with the emission spectrum of the basic material, wavelength shiftersshould provide a high fluorescence efficiency and high solubility in the basic mate-rial. Furthermore, an optimal adaption to the spectral sensibility of the PMTs canbe achieved through an appropriate mixture of the scintillator.For Double Chooz two fluors are used. The primary one is 2,5 - diphenyloxazole(PPO), the second one is 1,4 - bis(2 - methylstyryl) - benzene (bisMSB). Their chem-ical structures can be seen in fig. (4.7) and fig. (4.6), and their main properties intable (4.5) and table (4.6). The second fluor can be excited by the emission of theprimary one, because its maximum absorption lies in the wavelength region of themaximum emission of PPO. The emission maximum of bisMSB then is just about430 nm as can be seen in fig. (4.8). The shift of the spectrum to longer wavelengthsimproves the transparency of the scintillator and the acrylic material used for theseparation of the detector vessels (transparent at wavelengths larger than about400 nm [9]). In addition, the efficiency of the PMTs in the region of the bisMSBemission is higher than in the region of the PPO emission.
27
4. Organic Liquid Scintillator: Working Principle & Preparation
Figure 4.6.: Chemical structure of the fluor bisMSB.
Figure 4.7.: Chemical structure of the fluor PPO.
name 2,5 - diphenyloxazoleshort name PPOmolecular formula C15H11NOCAS-number 92-71-7company Perkin Elmer [57]region of absorption 280 nm - 325 nmregion of emission 350 nm - 400 nm
Table 4.5.: Properties of PPO [58, 59].
28

4.1. Organic Liquid Scintillator
name 1,4-bis(2-methylstyryl)-benzeneshort name bisMSBmolecular formula C24H22
CAS-number 13280-61-0company Perkin Elmer [57]region of absorption 320 nm - 370 nmregion of emission 380 nm - 450 nm
Table 4.6.: Properties of bisMSB [60, 59].
wavelength [nm]
rela
tive
inte
nsi
ty
Figure 4.8.: The plot gives the absorption spectrum (left) and the emission spec-trum (right) of the wavelength shifter bisMSB [59]. The effect thatthe emission spectrum is shifted to larger wavelengths can clearly benoticed.
29

4. Organic Liquid Scintillator: Working Principle & Preparation
wavelength [nm]
rela
tive
inte
nsi
ty
rela
tive
inte
nsi
ty
wavelength [nm]
Figure 4.9.: The plots display the absorption spectrum of the wavelength shifterPPO dissolved in cyclohexane (left) and the emission spectrum of PPOdissolved in pseudocumene (right) [59]. Comparing both one can seethat the emission spectrum is shifted to a region of larger wavelengths.
4.2. Buffer Liquid
The buffer (see sec. (3.3)) is designed to shield the active volume from naturalradioactivity. On that account, the buffer volume of each of the two detectorshas to be filled with a non - scintillating liquid. Besides the required density of0.804 g/cm3 (see sec. (4.1.4)), this liquid has to fulfill another crucial condition,namely, high transparency in the wavelength region of the scintillator emission. Ithas been foreseen to use pure mineral oil for the buffer. Mineral oil is derived fromcrude oil and mainly composed of alkanes (typically 15 to 40 carbons) and cyclicparaffins. White mineral oil, often referred to as white oil, is crystal clear, odorlessand can be found in a variety of different viscosities. Two white mineral oils fromthe company Shell, Ondina 909 and Ondina 917, have been under investigation.Their characteristic values can be seen in table (4.7). In order to meet the densitycondition, n - paraffins, just as in the case of the MU scintillator, are added. Mineraloil, as well as different n - paraffins and tetradecane have been tested on their qualityconcerning their transparency (see sec. (5)). The buffer liquid composition has beenforeseen to be 54% by volume of mineral oil and 46% by volume of n - paraffins.The decision concerning the buffer liquid has been made in favor of the whitemineral oil Ondina 917 from Shell and n - paraffin from the company CBR (seesec. (5.5)).
30

4.3. Sample Preparation
mineral oil Ondina 909 Ondina 917
company Shell Shelldensity at 15 ◦C 0.825 g/cm3 0.854 g/cm3
flash point [◦C] 125 200dynamic viscosity at 20 ◦C [mPas] 5.1 36kinematic viscosity at 20 ◦C [mm2/s] 6.2 42kinematic viscosity at 40 ◦C [mm2/s] 3.8 18kinematic viscosity at 100 ◦C [mm2/s] - 3.7
Table 4.7.: Properties of the mineral oils Ondina 909 and 917 [61, 62].
4.3. Sample Preparation
For mixing as well as for storing scintillator samples, glassware containers wereused, to ensure chemical compatibility. Firstly, the liquid components of the scin-tillator were mixed, in detail LAB and n - paraffins or tetradecane. Afterwards, thesmall amounts of the bisMSB and the PPO powder have been weighed and added.In order to guarantee a complete solution of the powder in the liquid, the mixturewas put on a magnetic stirrer for some hours. It has been shown experimentally aswell as theoretically that the presence of oxygen in a liquid scintillator has seriousinfluence on the scintillator’s optical properties [63]. The so - called oxygen quench-ing effect 2 in LAB based liquid scintillators can lower the light yield, modify thefluorescence pulse shape and shorten the attenuation length. Therefore, it is ofgreat importance to avoid possible reactions of oxygen, which can be achieved byflushing the samples with nitrogen in order to completely displace the oxygen inthe liquid. This should be done after the mixing process of the sample, but alsoafter each tensioning of the scintillator’s container.
4.4. Preparation and Mixing of the Liquids for Chooz
The definite composition of the MU scintillator and the buffer liquid can be seenin table (4.8).As a result of the light yield measurements, the PPO concentration for the MUscintillator has been set to 2 g/l (see sec. (6.6)). With the help of Wacker Chemie,a chemical company in Munich, the so - called Master Solution containing the so-lutes of the DC MU scintillator was mixed. This Master Solution of totaling about
2Oxygen molecules have a triplet ground state and a singlet state as the next higher one, lyingabout 0.98 eV over the ground state. In aromatic molecules, the oxygen molecules can absorbthe energy of the aromatic molecules’ singlet states and make a spin allowed transition to thetriplet state, which decreases fluorescence [63].
31

4. Organic Liquid Scintillator: Working Principle & Preparation
muon veto scintillator company buffer liquid company
48.4 % vol. LAB Helm Spain51.6 % vol. n - paraffin CBR 46% vol. n - paraffin CBR2 g/l PPO Perkin Elmer 54% vol. Ondina 917 Shell20mg/l bisMSB Perkin Elmer
Table 4.8.: Final composition of the Double Chooz muon veto scintillator and thebuffer liquid.
5000 liters consists of LAB and the required wavelength shifters highly concen-trated, which means PPO in a concentration of 40 g/l and bisMSB in a concentra-tion of 0.4 g/l. It is not until on site in Chooz that this solution is being dilutedby adding n - paraffins and further LAB to reach the favored concentration of 2 g/lPPO and 20mg/l bisMSB. This method has the advantage that the huge amountsof LAB and n - paraffins can directly be delivered to Chooz by the manufactur-ing companies. Furthermore, this mixing plan makes it possible to exactly tunein the required density of 0.804 g/l for the scintillator with respect to the localtemperature in Chooz. Due to the missing facilities necessary for preparing suchhuge amounts of liquid, the preparation of the Master Solution was not possiblein Garching. The mixing itself took place as follows: The company Petresa deliv-ered 5 ibc containers of 900 liters LAB each and Perkin Elmer delivered the fluorsPPO and bisMSB. Firstly, a 1000 liters mixing vessel made of stainless steel wasevacuated. Afterwards, LAB of an ibc container was pumped in and bubbled withnitrogen. To facilitate the dissolving of the substances PPO and bisMSB the vesselwas heated up to about 50 ◦C while bubbling with nitrogen and stirring the liq-uid. As soon as the requested temperature had been reached, which took about onehour, the PPO and the bisMSB were weighed out. To be sure that both substanceswere completely solved, the LAB was stirred on two to three hours while bubblingwith nitrogen. Using a 3µm filter the final solution was then refilled in the ibccontainer.
The final mixing of the liquids as well as the adaption of density took place inChooz, where for that reason three tanks for the MU scintillator and three tanksfor the buffer liquid have been installed in the so - called storage area. The MasterSolution, further LAB as well as the n-paraffins and the mineral oil were transportedto Chooz. Once a truck with liquid had arrived, the liquid was filtered before beingpumped in the tanks. Each tank features a device in order to flush the liquids withnitrogen from the bottom up. This is not only necessary for displacing the oxygen,but also supports the mixing process. Additionally, the MU tanks as well as thebuffer tanks are connected among themselves so that the liquids could be mixedby circulating them.
32

5. Measurement of the Attenuation
Length
5.1. The Attenuation Length
The decrease of intensity of light crossing a scintillator sample can formally bedescribed by the following exponential function [64]:
I(x) = I(0) · e−x/Λ (5.1)
Here, I(0) is the intensity of the incident light, I(x) the intensity of the light rayhaving covered the distance x and Λ the attenuation length, which is to be deter-mined. The attenuation length is composed of both the scattering length Λscat andthe absorption length Λabs via
1
Λ=
1
Λabs
+1
Λscat
. (5.2)
In spectroscopy, the absorbance A1 as a function of the travelled distance x isdefined by [65]:
A(x) = log10
(I(0)
I(x)
)
(5.3)
Eq. (5.1) applied to formula (5.3) results in the attenuation length
Λ =x
A(x)· log10(e) (5.4)
The attenuation length Λ hence is completely determined by the absorbance A,
1Absorbance here does not only refer to absorption as in common parlance, but does containboth absorption and scattering.
33
5. Measurement of the Attenuation Length
measurable by a spectrophotometer and the distance x that corresponds to thelength of the measuring cell containing the liquid under investigation. In the caseof a multi component system, the absorbance Atotal is the sum of the absorbancesof the single components Atotal = A1 + A2 + A3 + ..., which also affects the totalattenuation length Λtotal [65]:
Atotal = A1 + A2 + A3 + ...
(5.5)1
Λtotal=
1
Λ1+
1
Λ2+
1
Λ3+ ... (5.6)
The Lambert-Beer law relates the absorbance of light to the properties of thematerial through which it is traveling [66]:
A = ǫ · x · c (5.7)
where x is the travelled distance, c the concentration of the absorbing species in thematerial and ǫ the molar absorptivity, also known as molar extinction coefficient,which in contrast to the absorbance is an intrinsic property of the species. Here,both c and ǫ serve as theoretical description and are no measured variables.
The attenuation length, quantifying light propagation and optical transparency,is one of the key parameters of large - volume liquid scintillation detectors as theones used in the DC experiment. Absorption and scattering from single moleculesof the liquids as well as from possible impurities are competitive processes, whichboth contribute to the attenuation. In fact, scattered light cannot be traced backto its vertex point, but still contributes to the determination of the overall energydeposited in the medium. In contrast, photons having been absorbed do not arriveat the PMTs surrounding the scintillator volume and thus are lost for detection.For that reason, it is of vital importance for the a scintillator to be transparentto its own emission, to ensure that light of each event reaches the PMTs. In theregion of about 430 nm, which is just about the emission maximum of the secondwavelength shifter bisMSB (compare sec. (4.1.5)), an attenuation length of morethan at least 5m is required for the MU scintillator [9]. In the case of the buffer,light of the target scintillator, respectively the γ - catcher should be able to crossthe buffer in order to arrive at the PMTs at the buffer vessels inner surface, whichis illustrated in sec. (3.3), fig. (3.3). Just as for the target and the muon veto, aPPO and bisMSB combination was chosen for the γ - catcher to shift the light intothe near UV and optical regions. Therefore, the wavelength regions of interest forthe attenuation lengths of the buffer liquid are the same as in the case of the MU
34
5.2. Scattering
scintillator. For the buffer liquid attenuation lengths of about 6m or more aredemanded.
5.2. Scattering
Scattering in scintillators mainly consists of two processes: Rayleigh and Mie scat-tering.
5.2.1. Rayleigh Scattering
Rayleigh scattering is the elastic scattering of light off particles much smaller thanthe wavelength λ of the light [67]. In contrast to Thomson scattering, which iselastic scattering of electromagnetic radiation off free charged particles, Rayleighscattering refers to photons that scatter off bound electrons, for example, in themolecules contained in a liquid scintillator. Rayleigh scattering hence is an intrinsiccharacteristic of organic scintillators and also plays a role in the ideal case of a 100%pure scintillator. In the classical approach the bound electrons thereby are seen asdipol oscillators driven by the electromagnetic waves. In the limit of frequencies ofthe incident light that are small compared to the resonance frequency ω0 of thoseoscillators (λ ≫ resonance wavelength λ0), the absolute scattering cross sectionshows the following 1/λ4-dependence [68]:
σtot (λ, λ0) =8π
3·
(e2
4πǫ0mec2
)2
·λ4
0
(λ2 − λ20)
2
λ≫λ0−→8π
3· r2
e ·
(λ0
λ
)4
(5.8)
where re = e2
4πǫ0mec2equals the classical electron radius of 2.8 fm. As a consequence,
light of shorter wavelengths is scattered much more than that of longer ones. At thispoint, a further advantage of the fluors added to the scintillator becomes evident:Shifting the light to longer wavelengths, they reduce the contribution of Rayleighscattering.
5.2.2. Mie Scattering
Another possibility for scattering is Mie scattering [67]. It refers to the scatteringof electromagnetic waves off microscopic spheric particles, that have a diameter inthe dimension of the wavelength of the radiation. Mie scattering therefore mayoccur due to impurities like small particles contained in the scintillator. This isthe reason why Mie scattering, in contrast to the intrinsic Rayleigh scattering, canbe reduced by filtering of the scintillation liquid. For small particle sizes the Mietheory reduces to the Rayleigh approximation.
35
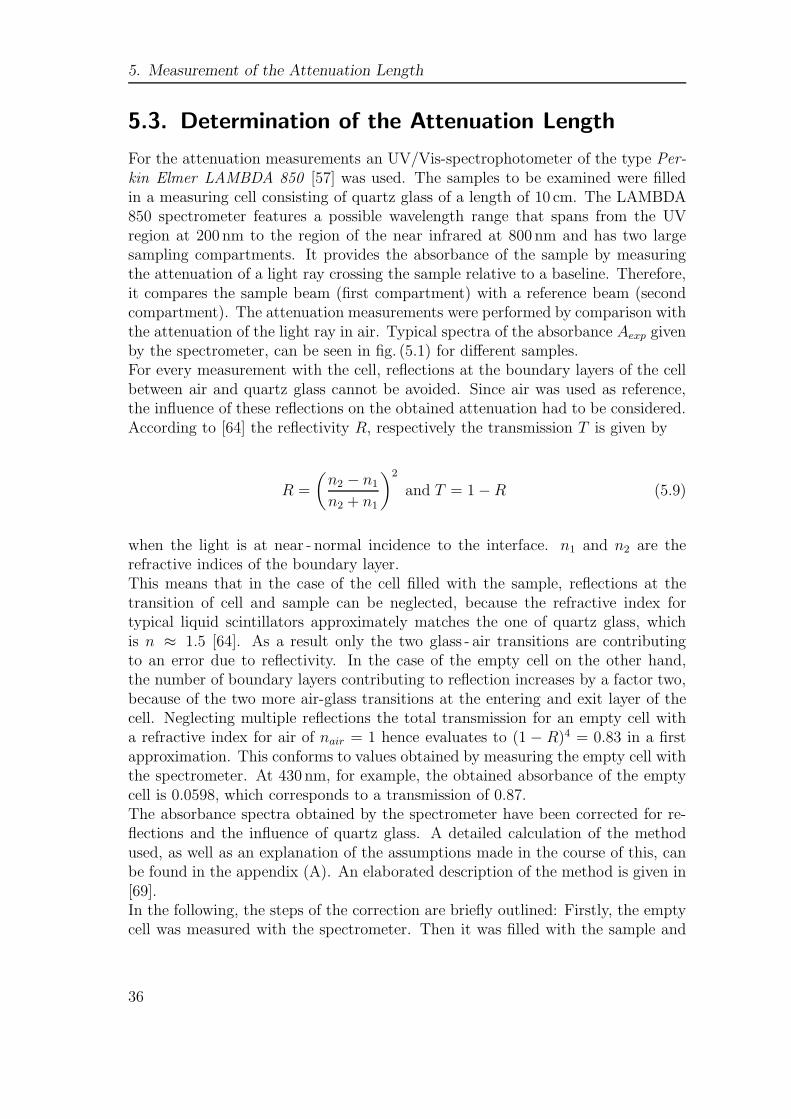
5. Measurement of the Attenuation Length
5.3. Determination of the Attenuation Length
For the attenuation measurements an UV/Vis-spectrophotometer of the type Per-kin Elmer LAMBDA 850 [57] was used. The samples to be examined were filledin a measuring cell consisting of quartz glass of a length of 10 cm. The LAMBDA850 spectrometer features a possible wavelength range that spans from the UVregion at 200 nm to the region of the near infrared at 800 nm and has two largesampling compartments. It provides the absorbance of the sample by measuringthe attenuation of a light ray crossing the sample relative to a baseline. Therefore,it compares the sample beam (first compartment) with a reference beam (secondcompartment). The attenuation measurements were performed by comparison withthe attenuation of the light ray in air. Typical spectra of the absorbance Aexp givenby the spectrometer, can be seen in fig. (5.1) for different samples.For every measurement with the cell, reflections at the boundary layers of the cellbetween air and quartz glass cannot be avoided. Since air was used as reference,the influence of these reflections on the obtained attenuation had to be considered.According to [64] the reflectivity R, respectively the transmission T is given by
R =
(n2 − n1
n2 + n1
)2
and T = 1 − R (5.9)
when the light is at near - normal incidence to the interface. n1 and n2 are therefractive indices of the boundary layer.This means that in the case of the cell filled with the sample, reflections at thetransition of cell and sample can be neglected, because the refractive index fortypical liquid scintillators approximately matches the one of quartz glass, whichis n ≈ 1.5 [64]. As a result only the two glass - air transitions are contributingto an error due to reflectivity. In the case of the empty cell on the other hand,the number of boundary layers contributing to reflection increases by a factor two,because of the two more air-glass transitions at the entering and exit layer of thecell. Neglecting multiple reflections the total transmission for an empty cell witha refractive index for air of nair = 1 hence evaluates to (1 − R)4 = 0.83 in a firstapproximation. This conforms to values obtained by measuring the empty cell withthe spectrometer. At 430 nm, for example, the obtained absorbance of the emptycell is 0.0598, which corresponds to a transmission of 0.87.The absorbance spectra obtained by the spectrometer have been corrected for re-flections and the influence of quartz glass. A detailed calculation of the methodused, as well as an explanation of the assumptions made in the course of this, canbe found in the appendix (A). An elaborated description of the method is given in[69].In the following, the steps of the correction are briefly outlined: Firstly, the emptycell was measured with the spectrometer. Then it was filled with the sample and
36

5.3. Determination of the Attenuation Length
measured again. For the correction for additional reflections caused by the twoadditional air - glass transitions for the empty cell, half of the absorbance valuesAcell obtained for the empty cell were subsequently subtracted from the absorbancevalues Aexp obtained for the sample, according to A′(λ) = Aexp(λ) − 1
2· Acell(λ).
For certain wavelengths, the attenuation of the considered sample is very small.Note, that the further proceeding of the method bases on the assumption that atthe wavelength with the smallest absorbance value, absorbance is negligible, impli-cating that the transmission converges to infinity. Having determined the smallestabsorbance value of the sample at a wavelength λmin, this wavelength is used asreference. The value of the measurement for every wavelength then is correctedwith this smallest value Amin(λmin) using A(λ) = A′(λ) −Amin(λmin). The result-ing value A(λ), finally, was used to calculate the attenuation length according to(5.4) [69].
Fig. (5.2) shows the corrected absorbance spectra for different samples. The ab-sorbance A(λ) that finally is used to calculate the attenuation length, is plottedversus the wavelength. In order to illustrate typical runs of the different types ofliquids measured 2, A(λ) of the following samples has been plotted:
• LAB from the company Helm Spain (dark blue)
• MU liquid with LAB from the company Helm Spain (light blue)
• n - paraffin from the company CBR (red)
• mineral oil, namely Ondina 917 from the company Shell (green)
• buffer liquid with Ondina 917 from the company Shell (pink)
Fig. (5.3) gives the same spectra, but zoomed in. Organic compounds, especiallythose with a high degree of conjugation3, absorb light in the UV or visible regionsof the electromagnetic spectrum [65]. Just as in the case of the ring of benzene (seesec. 4.1.1), conjugation allows a delocalization of the π - electrons that no longerbelong to single atoms. The electronic molecular states of the π - electrons splitup in different energetic niveaus (see fig. 4.1 in sec. 4.1.1) that can be excited byabsorption. A designated energy level corresponds to a certain vibrational androtational state of the molecule. The fact that vibrational and rotational levelsof the molecular orbitals are superimposed upon the electronic levels produces acombination of overlapping lines that appear as a continuous absorption band inthe UV/Vis spectrum. The wavelengths of absorption peaks are correlated withthe types of bonds in a given molecule. The presence of interfering substances,
2The results of the measurements of the single samples can be found in sec. (5.5).3In chemistry, conjugation is the overlap of one p-orbital with another, which leads to an inter-
vening sigma bond bridging the interjacent single bonds [39].
37
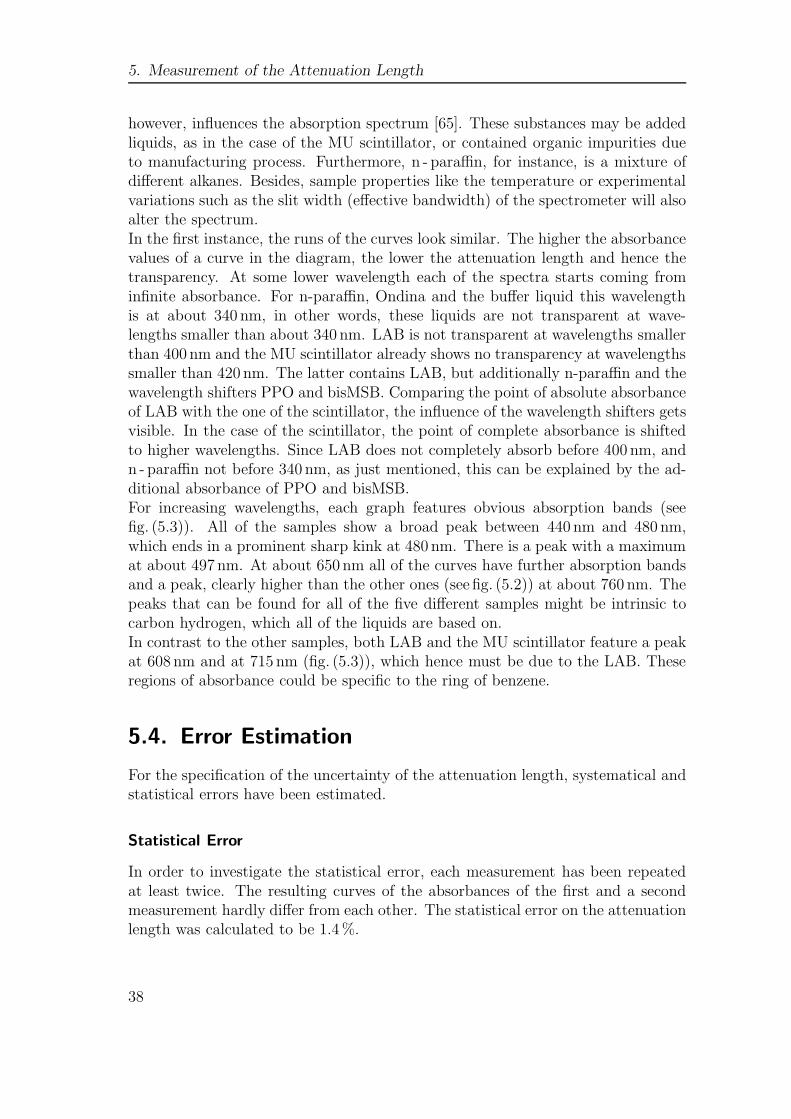
5. Measurement of the Attenuation Length
however, influences the absorption spectrum [65]. These substances may be addedliquids, as in the case of the MU scintillator, or contained organic impurities dueto manufacturing process. Furthermore, n - paraffin, for instance, is a mixture ofdifferent alkanes. Besides, sample properties like the temperature or experimentalvariations such as the slit width (effective bandwidth) of the spectrometer will alsoalter the spectrum.In the first instance, the runs of the curves look similar. The higher the absorbancevalues of a curve in the diagram, the lower the attenuation length and hence thetransparency. At some lower wavelength each of the spectra starts coming frominfinite absorbance. For n-paraffin, Ondina and the buffer liquid this wavelengthis at about 340 nm, in other words, these liquids are not transparent at wave-lengths smaller than about 340 nm. LAB is not transparent at wavelengths smallerthan 400 nm and the MU scintillator already shows no transparency at wavelengthssmaller than 420 nm. The latter contains LAB, but additionally n-paraffin and thewavelength shifters PPO and bisMSB. Comparing the point of absolute absorbanceof LAB with the one of the scintillator, the influence of the wavelength shifters getsvisible. In the case of the scintillator, the point of complete absorbance is shiftedto higher wavelengths. Since LAB does not completely absorb before 400 nm, andn - paraffin not before 340 nm, as just mentioned, this can be explained by the ad-ditional absorbance of PPO and bisMSB.For increasing wavelengths, each graph features obvious absorption bands (seefig. (5.3)). All of the samples show a broad peak between 440 nm and 480 nm,which ends in a prominent sharp kink at 480 nm. There is a peak with a maximumat about 497 nm. At about 650 nm all of the curves have further absorption bandsand a peak, clearly higher than the other ones (see fig. (5.2)) at about 760 nm. Thepeaks that can be found for all of the five different samples might be intrinsic tocarbon hydrogen, which all of the liquids are based on.In contrast to the other samples, both LAB and the MU scintillator feature a peakat 608 nm and at 715 nm (fig. (5.3)), which hence must be due to the LAB. Theseregions of absorbance could be specific to the ring of benzene.
5.4. Error Estimation
For the specification of the uncertainty of the attenuation length, systematical andstatistical errors have been estimated.
Statistical Error
In order to investigate the statistical error, each measurement has been repeatedat least twice. The resulting curves of the absorbances of the first and a secondmeasurement hardly differ from each other. The statistical error on the attenuationlength was calculated to be 1.4%.
38
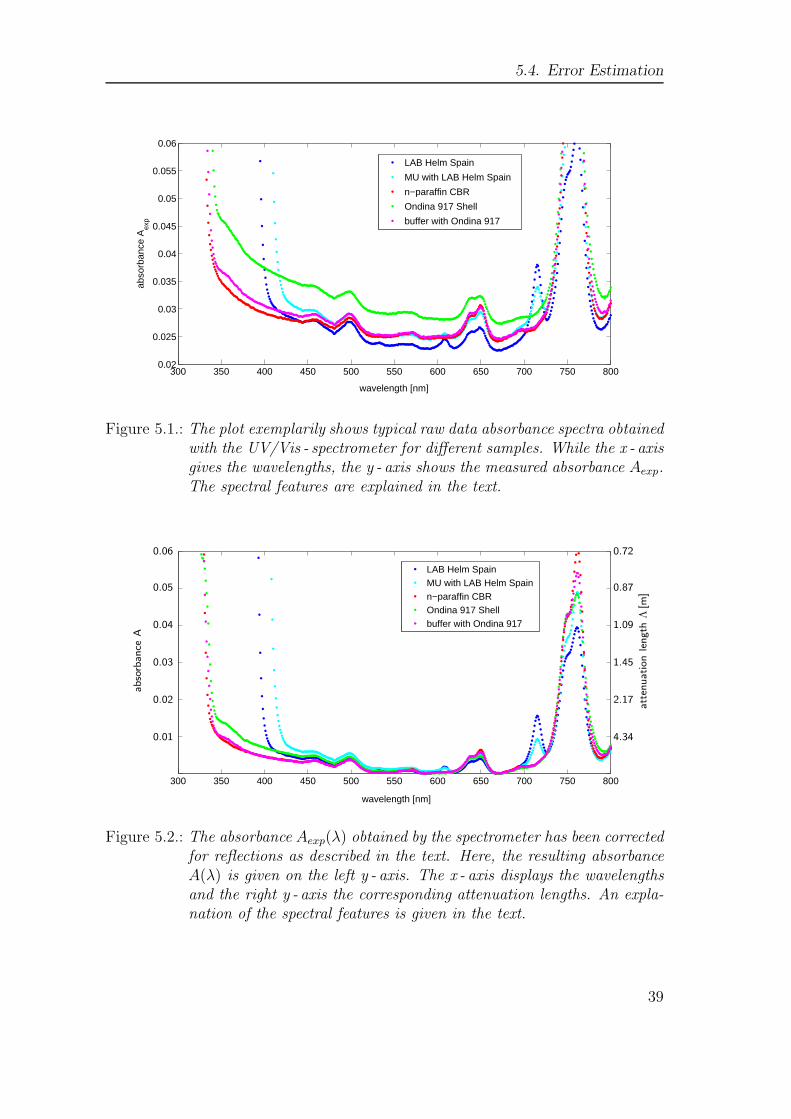
5.4. Error Estimation
300 350 400 450 500 550 600 650 700 750 8000.02
0.025
0.03
0.035
0.04
0.045
0.05
0.055
0.06
wavelength [nm]
abso
rban
ce A
exp
LAB Helm Spain
MU with LAB Helm Spain
n−paraffin CBR
Ondina 917 Shell
buffer with Ondina 917
Figure 5.1.: The plot exemplarily shows typical raw data absorbance spectra obtainedwith the UV/Vis - spectrometer for different samples. While the x - axisgives the wavelengths, the y - axis shows the measured absorbance Aexp.The spectral features are explained in the text.
300 350 400 450 500 550 600 650 700 750 800
wavelength [nm]
LAB Helm SpainMU with LAB Helm Spainn−paraffin CBROndina 917 Shellbuffer with Ondina 917
4.34
2.17
1.45
1.09
0.87
0.72
att
enuation
length
Λ[m
]
0.01
0.02
0.03
0.04
0.05
0.06
abso
rbance
A
Figure 5.2.: The absorbance Aexp(λ) obtained by the spectrometer has been correctedfor reflections as described in the text. Here, the resulting absorbanceA(λ) is given on the left y - axis. The x - axis displays the wavelengthsand the right y - axis the corresponding attenuation lengths. An expla-nation of the spectral features is given in the text.
39
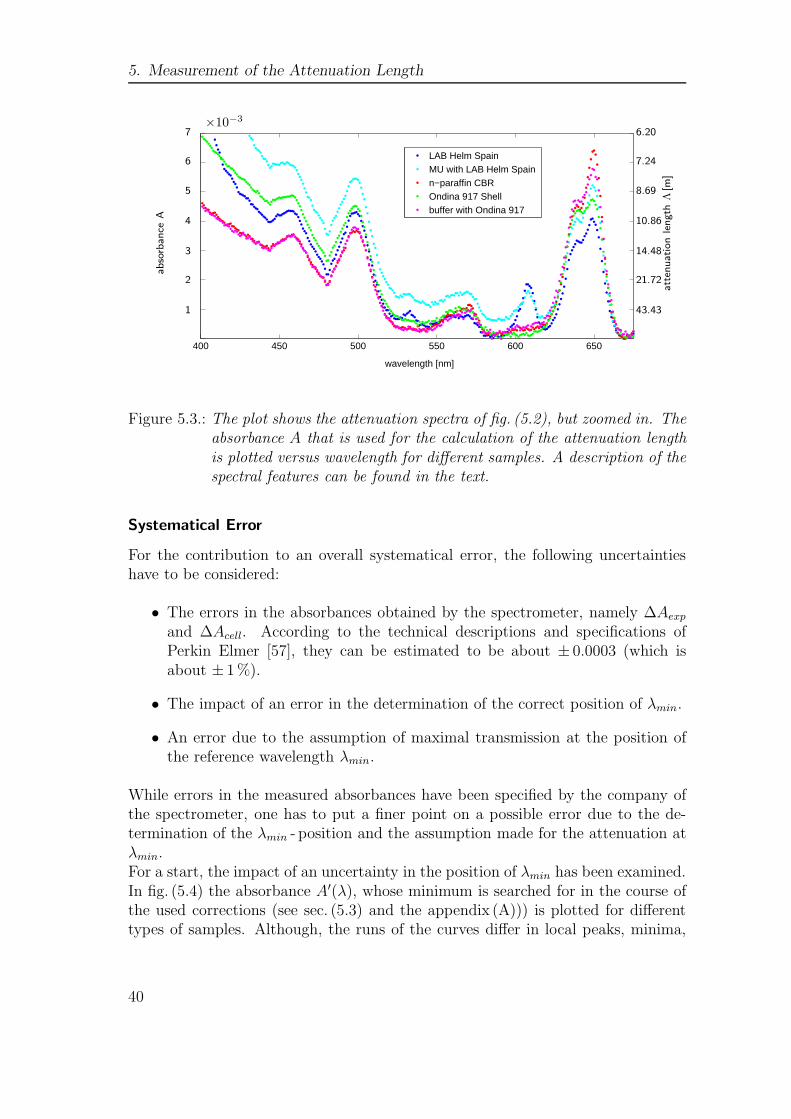
5. Measurement of the Attenuation Length
400 450 500 550 600 650
wavelength [nm]
LAB Helm SpainMU with LAB Helm Spainn−paraffin CBROndina 917 Shellbuffer with Ondina 917
43.43
21.72
14.48
10.86
8.69
7.24
6.20
att
enuation
length
Λ[m
]
1
2
3
4
5
6
7×10⁻³
abso
rbance
A
Figure 5.3.: The plot shows the attenuation spectra of fig. (5.2), but zoomed in. Theabsorbance A that is used for the calculation of the attenuation lengthis plotted versus wavelength for different samples. A description of thespectral features can be found in the text.
Systematical Error
For the contribution to an overall systematical error, the following uncertaintieshave to be considered:
• The errors in the absorbances obtained by the spectrometer, namely ∆Aexp
and ∆Acell. According to the technical descriptions and specifications ofPerkin Elmer [57], they can be estimated to be about ± 0.0003 (which isabout ± 1 %).
• The impact of an error in the determination of the correct position of λmin.
• An error due to the assumption of maximal transmission at the position ofthe reference wavelength λmin.
While errors in the measured absorbances have been specified by the company ofthe spectrometer, one has to put a finer point on a possible error due to the de-termination of the λmin - position and the assumption made for the attenuation atλmin.For a start, the impact of an uncertainty in the position of λmin has been examined.In fig. (5.4) the absorbance A′(λ), whose minimum is searched for in the course ofthe used corrections (see sec. (5.3) and the appendix (A))) is plotted for differenttypes of samples. Although, the runs of the curves differ in local peaks, minima,
40

5.4. Error Estimation
maxima and slopes, it can easily be seen that they all show their global minimumin a wavelength range from about 660 nm to 680 nm. For different samples of onetype, the curves are more or less the same, only shifted in the direction of they - axis depending on their transparency. This means the minima are quite well -marked, in so far as there should not be another global minimum in a region ofwavelengths completely different from the 660 nm to 680 nm range. Fig. (5.5), forinstance, shows the absorbance A′(λ) for different LAB samples. For LAB fromthe company Helm in Spain (red curve) the minimum can be found at a wave-length of 669 nm. The resulting attenuation length at 430 nm, determined withthe method of sec. (5.3), is 9.09m. Using this example, the error in the calculatedattenuation length depending on a deviation d from the correct minimum positionλmin has been worked out. Fig. (5.6) illustrates this error. The x - axis gives thedeviation from the minimum position and the y - axis the error in the attenuationlength. This error increases with growing deviation from λmin both in the directiontowards higher and lower wavelengths. A deviation from the correct λmin - positionof about - 5 nm or +7.5 nm, for example, would lead to an error of 6% (red dashedline). Variations like less than - 6 nm or more than +10 nm would yield errors ofmore than 10% (green dashed line). An error in the determination of the correctλmin - position could indeed occur for two reasons:Firstly, the spectrometer has a wavelength inaccuracy, which might shift the mini-mum in x - direction. According to Perkin Elmer this inaccuracy is ±0.08 nm. Theattenuation lengths within this range of λmin - wavelengths have been calculated.The resulting errors in the attenuation length, however, are very small with lessthan 1%.Secondly, statistical fluctuations could have the effect that a different minimumfrom Amin suddenly becomes the global minimum. Considering fig. (5.6), however,the region of deviations in which this effect might appear can be estimated to befrom about −4 nm to + 4nm. Outside this range the curve towards higher andlower wavelengths, respectively, steeply inclines so that statistical fluctuations dono longer pose a problem. The resulting error in the attenuation length hence isestimated to about 4 % (black dashed line in fig. (5.6)).
The main contribution to the systematic uncertainty, however, might originate fromthe assumptions made for the calculation of the attenuation length. As mentionedbefore, λmin is used as reference wavelength and the attenuation for the correspond-ing absorbance Amin is assumed to be zero (equals a 100 % transmittance or aninfinite attenuation length). Due to the fact that the entire calculation that followsis based on this assumption for the lowest absorbance Amin, the question arises,whether and to what extent a different assumption implicates a critical systematicerror. As already mentioned, LAB from Helm in Spain (red curve in fig. 5.5) hasan attenuation length of 9.09m at 430 nm. To simplify matters, this attenuationlength will be referred to as ΛLAB in the following. For its calculation the atten-
41

5. Measurement of the Attenuation Length
400 450 500 550 600 650 700−0.01
−0.008
−0.006
−0.004
−0.002
0
0.002
0.004
0.006
0.008
0.01
wavelength [nm]
abso
rban
ce A
’
LAB Helm Spain
MU with LAB Helm Spain
n−paraffin CBR
Ondina 917 Shell
buffer with Ondina 917
Figure 5.4.: The absorbance A′(λ) that, in the course of the used corrections (seesec. (5.3)), has been obtained by subtracting half of the absorbance val-ues for the empty cell, is plotted for different types of samples. De-pending on the type of liquid, the curves run differently, but for all ofthem an absolute minimum can be found in the wavelength range fromabout 660 nm to 680 nm.
42

5.4. Error Estimation
400 450 500 550 600 650 700−10
−8
−6
−4
−2
0
2
4
6
8x 10
−3
wavelength [nm]
abso
rban
ce A
’
LAB PetresaLAB WibarcoLAB Helm SpainLAB Helm Belgium
Figure 5.5.: The absorbance A′(λ), obtained by subtracting half of the absorbancevalues for the empty cell (see sec. (5.3)) is plotted for different LABsamples. The run of the different curves is more or less the same, onlyshifted in y - direction depending on their transparency. The absoluteminimum for the LAB from Helm Spain (red graph), can be found at awavelength of 669 nm. This is also the range, where the other sampleshave their absolute minimum.
−10 −8 −6 −4 −2 0 2 4 6 8 100
5
10
15
20
25
deviation from Λmin
− position [nm]
devi
atio
n fr
om c
alcu
late
d Λ
at 4
30 n
m [%
]
4 %6 %
10 %
Figure 5.6.: For the calculation of the attenuation length Λ, λmin is used as referenceas described in sec. (5.3). This plot illustrates the systematic error dueto an uncertainty in the determination of the position of λmin. Theerror in Λ is plotted versus the deviation from the correct λmin - position(blue line). Deviations resulting in an error of 4%, 6% and 10% aremarked.
43

5. Measurement of the Attenuation Length
uation length at λmin has been assumed to be infinite. In order to investigate theinfluence of different assumptions on ΛLAB, the attenuation length has also beencalculated for different assumed attenuation lengths (respectively transmittances)at λmin. The resulting deviation from ΛLAB has been plotted versus the assumedattenuation length Λ at λmin (fig. (5.7)) and versus the assumed transmittance(fig. (5.8)). The graph in fig. (5.7) starts at zero and does not begin to rise before1000m. At an assumed Λ of 100m the deviation from ΛLAB, for example, hasreached 8%. For an assumed Λ of 50m the deviation is already 15%. The errorrises very fast and the resulting attenuation lengths hence are strongly dependenton the assumption for Amin.Dodecane, however, has been measured in [59] using a different experimental setupthat is not based on such an assumption. With 3.65 ± 0.04 at 430 nm, Λ obtainedthere is in good agreement with the length of 3.87 nm measured with the spectrom-eter. This fact argues in favor of the method used. Its systematic error thus hasbeen estimated to 5%.
The total error for the attenuation length has been calculated by gaussian errorpropagation to be 9%.
44

5.4. Error Estimation
100
101
102
103
104
105
0
10
20
30
40
50
60
70
80
90
100
assumed Λ at λmin
[m]
devi
atio
n fr
om c
alcu
late
d Λ
at 4
30 n
m [%
]
Figure 5.7.: The systematic error due to the assumption made for the smallest oc-curring absorbance value Amin in the calculation of the attenuationlength Λ is illustrated. In the method used, Λ at 430 nm (ΛLAB) wasobtained by assuming Λ at the position of Amin to be infinite. Here,the x - axis displays different assumptions for Λ at the position of Amin.For each of these assumptions, Λ at 430 nm has been calculated. Theirdeviation from ΛLAB is plotted on the y - axis. The run of the graphdoes not start to increase before about 1000m on the x - axis, but thenrises very fast. The resulting Λ at 430 nm hence strongly depends onthe assumptions made for Λ at λmin. The error in the calculated Λ isclearly dominated by this systematic uncertainty.
45
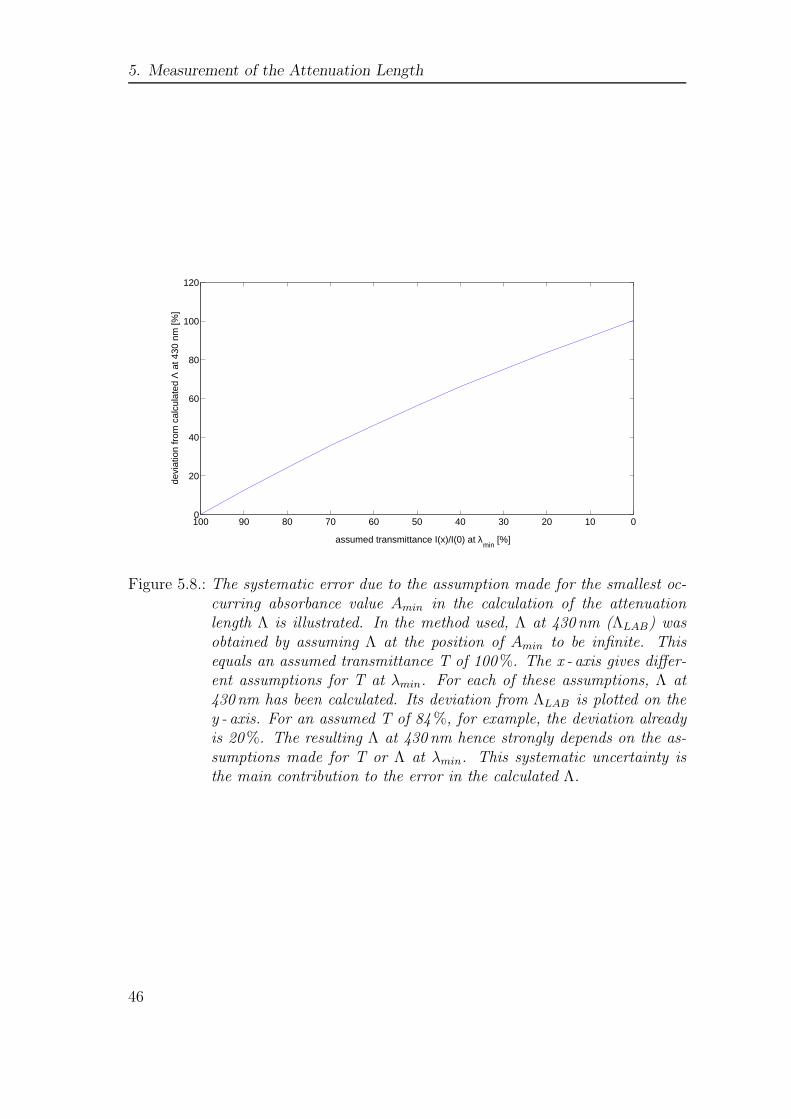
5. Measurement of the Attenuation Length
01020304050607080901000
20
40
60
80
100
120
assumed transmittance I(x)/I(0) at λmin
[%]
devi
atio
n fr
om c
alcu
late
d Λ
at 4
30 n
m [%
]
Figure 5.8.: The systematic error due to the assumption made for the smallest oc-curring absorbance value Amin in the calculation of the attenuationlength Λ is illustrated. In the method used, Λ at 430 nm (ΛLAB) wasobtained by assuming Λ at the position of Amin to be infinite. Thisequals an assumed transmittance T of 100 %. The x - axis gives differ-ent assumptions for T at λmin. For each of these assumptions, Λ at430 nm has been calculated. Its deviation from ΛLAB is plotted on they - axis. For an assumed T of 84 %, for example, the deviation alreadyis 20%. The resulting Λ at 430 nm hence strongly depends on the as-sumptions made for T or Λ at λmin. This systematic uncertainty isthe main contribution to the error in the calculated Λ.
46
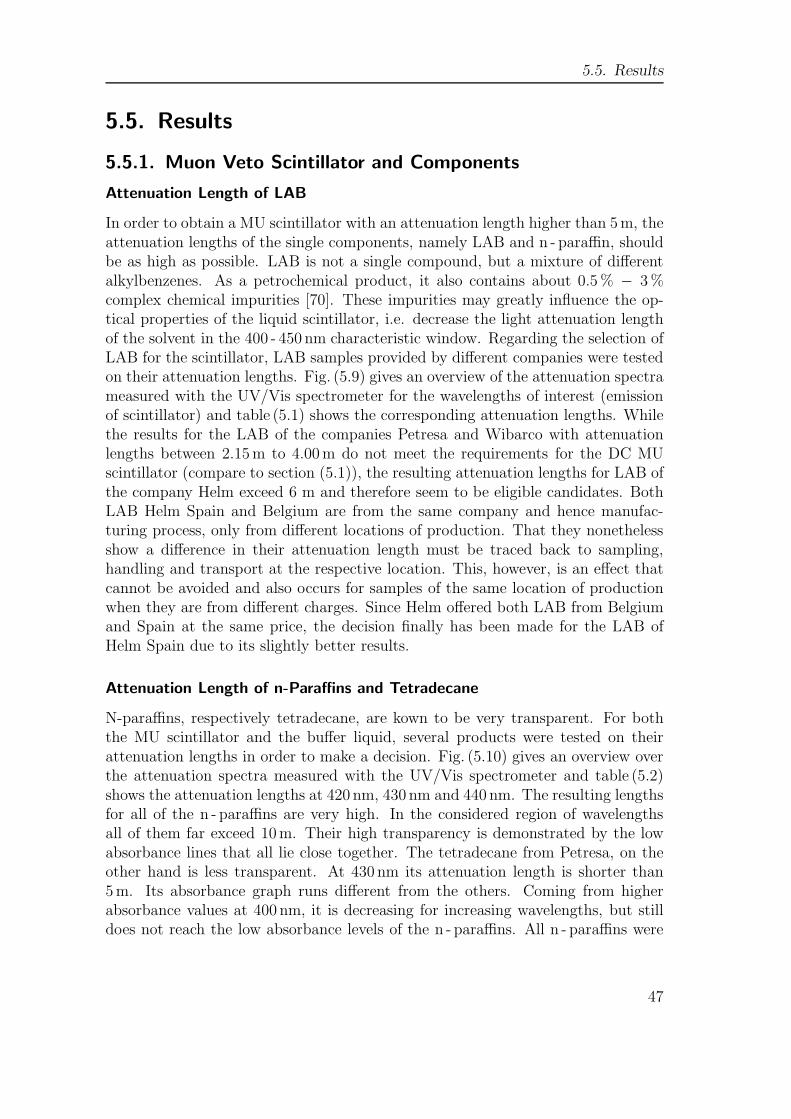
5.5. Results
5.5. Results
5.5.1. Muon Veto Scintillator and Components
Attenuation Length of LAB
In order to obtain a MU scintillator with an attenuation length higher than 5m, theattenuation lengths of the single components, namely LAB and n - paraffin, shouldbe as high as possible. LAB is not a single compound, but a mixture of differentalkylbenzenes. As a petrochemical product, it also contains about 0.5 % − 3 %complex chemical impurities [70]. These impurities may greatly influence the op-tical properties of the liquid scintillator, i.e. decrease the light attenuation lengthof the solvent in the 400 - 450 nm characteristic window. Regarding the selection ofLAB for the scintillator, LAB samples provided by different companies were testedon their attenuation lengths. Fig. (5.9) gives an overview of the attenuation spectrameasured with the UV/Vis spectrometer for the wavelengths of interest (emissionof scintillator) and table (5.1) shows the corresponding attenuation lengths. Whilethe results for the LAB of the companies Petresa and Wibarco with attenuationlengths between 2.15m to 4.00m do not meet the requirements for the DC MUscintillator (compare to section (5.1)), the resulting attenuation lengths for LAB ofthe company Helm exceed 6 m and therefore seem to be eligible candidates. BothLAB Helm Spain and Belgium are from the same company and hence manufac-turing process, only from different locations of production. That they nonethelessshow a difference in their attenuation length must be traced back to sampling,handling and transport at the respective location. This, however, is an effect thatcannot be avoided and also occurs for samples of the same location of productionwhen they are from different charges. Since Helm offered both LAB from Belgiumand Spain at the same price, the decision finally has been made for the LAB ofHelm Spain due to its slightly better results.
Attenuation Length of n-Paraffins and Tetradecane
N-paraffins, respectively tetradecane, are kown to be very transparent. For boththe MU scintillator and the buffer liquid, several products were tested on theirattenuation lengths in order to make a decision. Fig. (5.10) gives an overview overthe attenuation spectra measured with the UV/Vis spectrometer and table (5.2)shows the attenuation lengths at 420 nm, 430 nm and 440 nm. The resulting lengthsfor all of the n - paraffins are very high. In the considered region of wavelengthsall of them far exceed 10m. Their high transparency is demonstrated by the lowabsorbance lines that all lie close together. The tetradecane from Petresa, on theother hand is less transparent. At 430 nm its attenuation length is shorter than5m. Its absorbance graph runs different from the others. Coming from higherabsorbance values at 400 nm, it is decreasing for increasing wavelengths, but stilldoes not reach the low absorbance levels of the n - paraffins. All n - paraffins were
47

5. Measurement of the Attenuation Length
400 405 410 415 420 425 430 435 440 445 450
wavelength [nm]
LAB PetresaLAB WibarcoLAB Helm SpainLAB Helm Belgium
8.69
4.34
2.90
2.17
1.74
1.45
1.24
1.09
0.97
0.87
att
enuation
length
Λ[m
]
0.005
0.01
0.015
0.02
0.025
0.03
0.035
0.04
0.045
0.05
abso
rbance
A
Figure 5.9.: The absorbance A of different LAB samples is plotted versus the wave-length. The corresponding attenuation length is given by the right y -axis. The higher A, the higher the attenuation and the lower Λ. Thebest results, exceeding 8m, were obtained with the LAB from the com-pany Helm Spain. The curve of the LAB from Helm in Belgium runssimilar to the one from Helm Spain, but shifted to higher absorbances.This close resemblance is due to the fact that actually both LAB HelmSpain and Belgium is from the same company and hence manufactur-ing process only from different locations of production. The resultingattenuation lengths are lower than 8m, but with 6m to 7m still closeto the result of the LAB from Helm Spain. That they nonetheless showa difference in their Λ must be traced back to sampling, handling andtransport at the respective location. The spectra of the LAB from Pe-tresa and Wibarco yield attenuation lengths of about 3m, which is farfrom the lengths of the others. As described in the text, LAB containschemical impurities due to the manufacturing process, which results inthe differences of Λ for the different samples. The decision has beenmade for LAB Helm Spain which was the most transparent liquid.
48

5.5. Results
transparent enough to be used for Double Chooz. Due to a better offer and forlogistic reasons, the decision has finally been made for the company CBR.
400 405 410 415 420 425 430 435 440 445 450
wavelength [nm]
n−paraffin CBR (tank3−8)
n−paraffin CBR (tank1−9)
n−paraffin Wibarco
n−paraffin Helm
tetradecan Petresa
8.69
4.34
2.90
2.17
1.74
att
enuation
length
Λ[m
]
0.005
0.01
0.015
0.02
0.025
abso
rbance
A
Figure 5.10.: The absorbance A of different n - paraffins and tetradecane is plottedversus the wavelength. The corresponding Λ is given by the right y -axis. All n - paraffin samples show similar curves resulting in verygood attenuation lengths exceeding 10m. The graph for tetradecaneobviously runs different from the others. Starting from a higher ab-sorbance than the other samples, it is steeply falling off with increasingwavelength, but never reaches absorbances as low as the ones of then - paraffins.
49
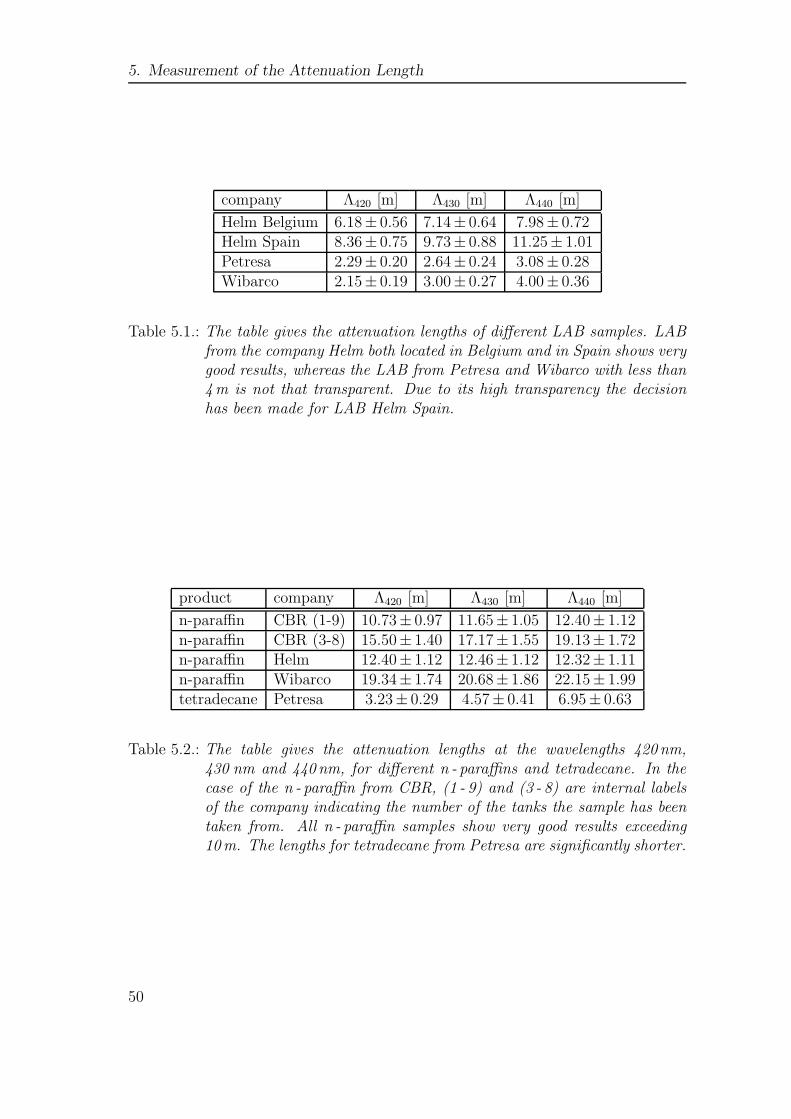
5. Measurement of the Attenuation Length
company Λ420 [m] Λ430 [m] Λ440 [m]
Helm Belgium 6.18± 0.56 7.14± 0.64 7.98± 0.72Helm Spain 8.36± 0.75 9.73± 0.88 11.25± 1.01Petresa 2.29± 0.20 2.64± 0.24 3.08± 0.28Wibarco 2.15± 0.19 3.00± 0.27 4.00± 0.36
Table 5.1.: The table gives the attenuation lengths of different LAB samples. LABfrom the company Helm both located in Belgium and in Spain shows verygood results, whereas the LAB from Petresa and Wibarco with less than4m is not that transparent. Due to its high transparency the decisionhas been made for LAB Helm Spain.
product company Λ420 [m] Λ430 [m] Λ440 [m]
n-paraffin CBR (1-9) 10.73± 0.97 11.65± 1.05 12.40± 1.12n-paraffin CBR (3-8) 15.50± 1.40 17.17± 1.55 19.13± 1.72n-paraffin Helm 12.40± 1.12 12.46± 1.12 12.32± 1.11n-paraffin Wibarco 19.34± 1.74 20.68± 1.86 22.15± 1.99tetradecane Petresa 3.23± 0.29 4.57± 0.41 6.95± 0.63
Table 5.2.: The table gives the attenuation lengths at the wavelengths 420 nm,430 nm and 440 nm, for different n - paraffins and tetradecane. In thecase of the n - paraffin from CBR, (1 - 9) and (3 - 8) are internal labelsof the company indicating the number of the tanks the sample has beentaken from. All n - paraffin samples show very good results exceeding10m. The lengths for tetradecane from Petresa are significantly shorter.
50

5.5. Results
Attenuation Length of the Muon Veto Scintillator
Initially, the idea was to use LAB and tetradecane from Petresa for the MU scin-tillator. The PPO concentration had not been fixed yet, whereas the bisMSBconcentration was set to be 20mg/l. Scintillator samples in a concentration of37.5 % vol. LAB, 62.5 % vol. tetradecane, 20mg/l bisMSB and PPO in differentconcentrations were prepared and measured. At this, the percentage of LAB andtetradecane is given by the required density (see sec. (4)). Table (5.3) gives anoverview of the attenuation length for the wavelength of 430 nm and the densitythat has been measured using the density meter described in sec. (4.1.4). Withincreasing PPO concentration the attenuation length tends to decrease. At a con-centration of 1.0 g/l the attenuation length is 4.08m. At a fourfold increase of thePPO concentration, the attenuation length falls by 20%. Although 430 nm doesnot lie in the region of maximal absorption of PPO, which is 280 nm to 325 nm(compare sec. (4.1.5)), PPO still absorbs at 430 nm. The increasing attenuationwith increasing concentration must be an effect due to self - absorption of the PPO.Due to the LAB measurements it turned out that LAB from other companies didshow higher attenuation lengths (see sec. 5.5.1). In order to decide on the prod-ucts used for the scintillator liquid, it is practically sufficient to measure the singlecomponents. If two components both show high transparency, this is also appliesto a mixture of them. In the course of the attenuation measurements, the deci-sion had been made for LAB from the company Helm Spain and n - paraffin fromCBR. As a cross check, however, some MU scintillator samples with LAB and n -paraffin from different companies with an PPO concentration of 2 g/l PPO and20mg/l bisMSB were mixed and tested on their attenuation. The measured ab-sorbance spectra and the calculated attenuation lengths can be seen in fig. (5.11)and table (5.4). The best results again have been obtained with the LAB from thecompany Helm. Both in the case of being mixed to n - paraffin CBR as well as ton - paraffin Helm, a required length of more than 5m at 430 nm was achieved. Withthe products from Petresa and Wibarco on the other hand, a length of more than5m could not be attained. In the case of the Petresa products, this is apparentsince the results of the single components did not reach the 5m limit. Concerningthe Wibarco scintillator, the poor result most probably is the influence of the LABsince the measurement of the Wibarco LAB yielded an attenuation length of only3m, whereas the n - paraffin was very transparent with more than 20m.
51

5. Measurement of the Attenuation Length
PPO concentration [g/l] Λ420 [m] density [g/cm3]
1.0 4.08± 0.37 0.80181.5 4.08± 0.37 0.80192.0 4.10± 0.37 0.80202.5 3.36± 0.30 0.80223.0 3.38± 0.30 0.80223.5 3.31± 0.30 0.80254.0 3.23± 0.29 0.8027
Table 5.3.: The table gives the attenuation lengths Λ for the MU scintillator withfixed components 37.5 % vol. LAB, 62.5 % vol. tetradecane, 20mg/lbisMSB and a varying PPO concentration. Also shown is the densitywhich has been measured with a density meter. For an increasing PPOconcentration, respectively density, Λ tends to decrease. This must bedue to self - absorption of PPO.
company of company ofΛ420 [m] Λ430 [m] Λ440 [m]
LAB n - paraffin/tetradecane
Helm (Belgium) CBR 4.39± 0.40 5.55± 0.50 6.38± 0.57Helm (Spain) Helm 5.30± 0.48 7.77± 0.70 9.04± 0.81Petresa Petresa 2.84± 0.26 4.33± 0.39 6.00± 0.54Wibarco Wibarco 2.94± 0.26 4.42± 0.40 5.49± 0.49
Table 5.4.: The table gives the attenuation lengths Λ at the wavelengths 420 nm,430 nm and 440 nm, calculated for MU scintillators with products fromdifferent companies. In case of CBR, Helm and Wibarco n - paraffinwas added to the LAB, while it was tetradecane in the case of Petresa.Both liquids with the LAB Helm Spain and the one with the LAB HelmBelgium have the required attenuation length of more than 5m. The at-tenuation lengths of the scintillator with LAB from Petresa and Wibarcoare shorter.
52

5.5. Results
410 415 420 425 430 435 440 445 450
wavelength [nm]
LAB Helm Belg. + n−paraffin CBR
LAB Helm Spain + n−paraffin Helm
LAB Helm Spain + n−paraffin CBR
LAB Petresa + tetradecane Petresa
LAB Wibarco + n−paraffin Wibarco
8.69
4.34
2.90
2.17
1.74
1.45
att
enuation
length
Λ[m
]
0.005
0.01
0.015
0.02
0.025
0.03
abso
rbance
A
Figure 5.11.: The absorbance A for MU scintillators with LAB as well as n - paraffinfrom different companies is plotted versus the wavelength. In the re-gion of 420 nm to 440 nm the lowest absorbances and the highest at-tenuation lengths, respectively, were reached with the mixture LABHelm Spain and n - paraffin CBR, LAB Helm Spain and n - paraffinHelm as well as LAB Helm Belgium and n - paraffin CBR. The trans-parency of the mixtures LAB and n - paraffin Wibarco as well as LABand tetradecane Petresa turned out to be lower. Due to measurementsof the single components the decision had been made for LAB HelmSpain and n - paraffin CBR. The mixed scintillator of both componentsshows the desired attenuation lengths of more than 5m which confirmsthe decision.
53

5. Measurement of the Attenuation Length
5.5.2. Buffer Liquid and Ondina
Attenuation Length of Ondina
Mineral oil from the company Shell, namely Ondina 909 and Ondina 917, hasbeen tested on its transparency. While fig. (5.12) shows the obtained absorbancespectra, table (5.5) gives the corresponding attenuation lengths. Ondina 909 06and Ondina 909 08 indicate that the sample was taken in 2006, respectively 2008,whereas february and april refer to the month of delivery in 2010. Ondina 909 aswell as Ondina 917 february show very good results. Ondina 917 april, however,with an attenuation length of only 3.32m at 430 nm, does not meet the requirementof an attenuation length of more than 6 m. Ondina 917 and Ondina 909 areboth white mineral oils that mostly differ in their viscosity (see sec. (4.2)). Theytherefore should feature attenuation lengths in the same order, which is true exceptfor the Ondina 917 april sample. Ondina 917 from february and april shouldeven be the same product, only received at another time. Due to the fact, thatboth samples have passed the same manufacturing process, the difference in theirattenuation lengths might be traced back to the sampling at Shell, transport or to acontamination after delivery. Since Ondina 909 was discontinued by Shell, Ondina917 was selected. Barring the april sample, the attenuation lengths of Ondina 917are sufficient.
Attenuation Length of the Buffer Liquid
Based on the measurements of the single components, the decision in the case ofthe buffer liquid has been made for Ondina 917 from Shell and n - paraffin fromthe company CBR. In the case of two components featuring high transparency, thehigh transparency also applies to the mixture of both provided that it is not con-taminated during the mixture process. Nevertheless, some different buffer samplesmixed with the mineral oil Ondina 917 from Shell and n - paraffin from Wibarcoand Helm as well as Ondina 909 from Shell and tetradecane from Petresa have beenmeasured. In fig. (5.13) you see the results for the absorbance spectra. Both curvesfor the buffer liquids with Ondina 917 run similarly. They result in attenuationlengths of more than 11m for the one with n - paraffin from Wibarco and in lengthsof more than 7m for the one with n - paraffin from Helm. Therefore, both liquidsare very transparent exceeding the required 6m attenuation length. The curveof the buffer liquid mixed with Ondina 909 and tetradecane from Petresa, on theother hand, runs different from the others. It is shifted to higher absorbance valuesand shows a steep decline for increasing wavelengths. The attenuation lengths at420 nm, 430 nm and 440 nm can be seen in fig. (5.6). Due to the attenuation lengthsexceeding 9m that have been measured for Ondina 909 (see subsec. (5.5.2)), the lowlengths that have been achieved with the Ondina 909 and tetradecance mixture,might be due to the lower lengths measured for tetradecane (see subsec. (5.5.1)).
54

5.5. Results
400 405 410 415 420 425 430 435 440 445 450
wavelength [nm]
Ondina 909 06Ondina 909 08Ondina 917 februaryOndina 917 april
10.86
7.24
2.90
2.17
1.74
1.45
1.24
0.87
att
enuation
length
Λ[m
]
0.004
0.006
0.015
0.02
0.025
0.03
0.035
0.05
abso
rbance
A
Figure 5.12.: The absorbance spectra of different mineral oils are plotted versuswavelength. Ondina 909 and Ondina 917 are two types of white min-eral oil from Shell that mostly differ in their viscosity. While 06 and08 indicate the year of sampling for Ondina 909, Ondina 917 wasproduced in 2010 and april, respectively february, denotes the monththey have been received. Ondina 909 shows better results than Ond-ina 917. Ondina 917 (february) is still very transparent, but Ondina917 (april) does not meet the required Λ of 6m. Both Ondina 917samples should actually be the same product, the difference in theirresults might be traced back to some contamination after the produc-tion process.
55

5. Measurement of the Attenuation Length
400 405 410 415 420 425 430 435 440 445 450
wavelength [nm]
Ondina 909 + tetradecane Petresa
Ondina 917 + n−paraffine Helm
Ondina 917 + n−paraffine Wibarco
8.69
4.34
2.90
2.17
1.74
1.45
1.24
1.09
0.97
0.87
att
enuation
length
Λ[m
]
0.005
0.01
0.015
0.02
0.025
0.03
0.035
0.04
0.045
0.05
abso
rbance
A
Figure 5.13.: The absorbance spectra of different buffer liquids are plotted versuswavelength. The lowest absorbance was achieved with the mineral oilOndina 917 from the company Shell and n - paraffin from Wibarcoresulting in a Λ of more than 11m for the wavelength range shownin this plot. The buffer liquid with Ondina 917 and n - paraffin fromHelm also meets the requirement of a Λ of more than 6m. This doesnot apply to the mixture of Ondina 909 and tetradecane from Petresa,whose absorbance runs clearly higher than the ones of the others.
56
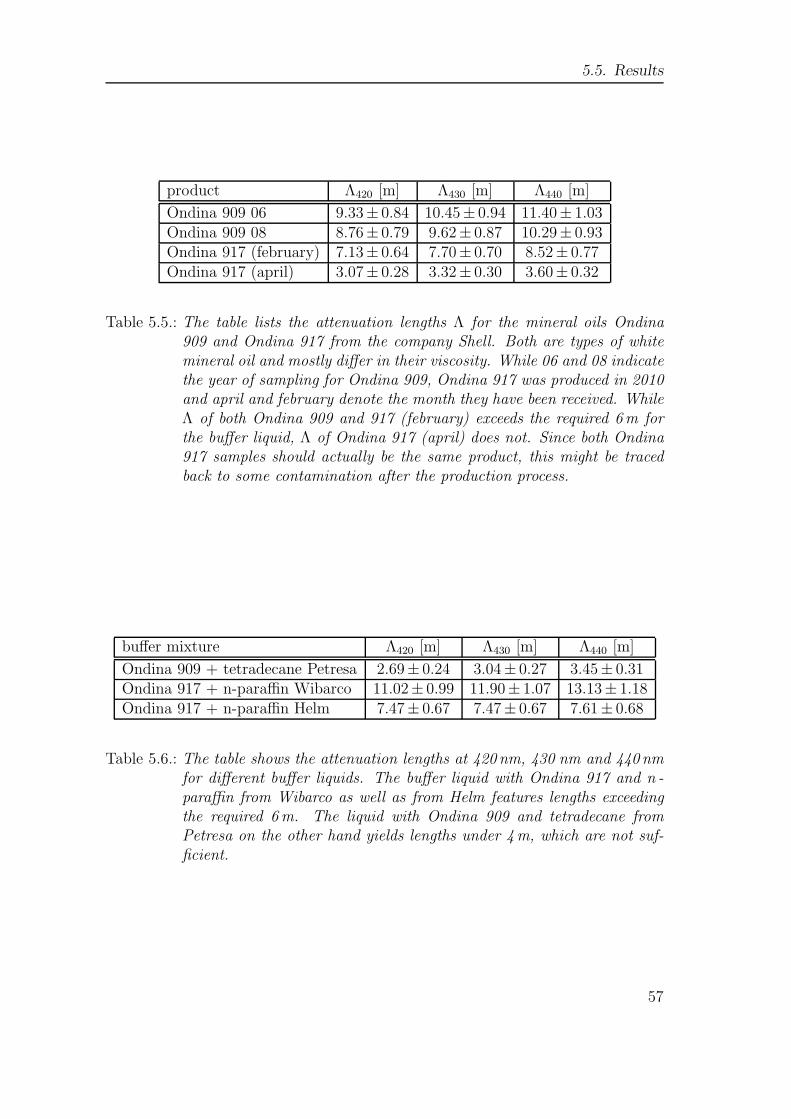
5.5. Results
product Λ420 [m] Λ430 [m] Λ440 [m]
Ondina 909 06 9.33± 0.84 10.45± 0.94 11.40± 1.03Ondina 909 08 8.76± 0.79 9.62± 0.87 10.29± 0.93Ondina 917 (february) 7.13± 0.64 7.70± 0.70 8.52± 0.77Ondina 917 (april) 3.07± 0.28 3.32± 0.30 3.60± 0.32
Table 5.5.: The table lists the attenuation lengths Λ for the mineral oils Ondina909 and Ondina 917 from the company Shell. Both are types of whitemineral oil and mostly differ in their viscosity. While 06 and 08 indicatethe year of sampling for Ondina 909, Ondina 917 was produced in 2010and april and february denote the month they have been received. WhileΛ of both Ondina 909 and 917 (february) exceeds the required 6m forthe buffer liquid, Λ of Ondina 917 (april) does not. Since both Ondina917 samples should actually be the same product, this might be tracedback to some contamination after the production process.
buffer mixture Λ420 [m] Λ430 [m] Λ440 [m]
Ondina 909 + tetradecane Petresa 2.69± 0.24 3.04± 0.27 3.45± 0.31Ondina 917 + n-paraffin Wibarco 11.02± 0.99 11.90± 1.07 13.13± 1.18Ondina 917 + n-paraffin Helm 7.47± 0.67 7.47± 0.67 7.61± 0.68
Table 5.6.: The table shows the attenuation lengths at 420 nm, 430 nm and 440 nmfor different buffer liquids. The buffer liquid with Ondina 917 and n -paraffin from Wibarco as well as from Helm features lengths exceedingthe required 6m. The liquid with Ondina 909 and tetradecane fromPetresa on the other hand yields lengths under 4m, which are not suf-ficient.
57

5. Measurement of the Attenuation Length
5.5.3. Samples from Chooz
LAB from Chooz
Having been produced in Spain the LAB was delivered to Chooz, filtered andpumped in the tanks of the storage area. LAB samples from the truck as wellas from the tanks after the filtering process have been taken. The correspondingattenuation lengths are summarized in table (5.7). The LAB from the truck showslengths of about 5m to 7m, which meets the requested 5m for the MU scintilla-tor, but is not as good as the LAB Helm Spain samples measured in Munich (seesubsec. 5.5.1). For the case of a possible contamination during transport (samplingand contact to tanks), LAB just as all the other liquids has been filtered. As canbe seen in table (5.7), filtering influenced the transparency leading to a clearly no-ticeable increase of the attenuation length. After filtering, the LAB shows resultssimilar to the ones of the LAB samples measured in advance.
LAB Chooz from... Λ420 [m] Λ430 [m] Λ440 [m]
...truck 5.08± 0.46 5.87± 0.53 6.80± 0.61
...tank after filtering 7.76± 0.70 9.22± 0.83 10.55± 0.95
Table 5.7.: The table displays the attenuation lengths at 420 nm, 430 nm and 440 nmof LAB from Chooz. The samples have been taken from the truck directlyafter delivery and the filtering process. Filtering clearly increased thetransparency and consequently the attenuation length. With 9.22m at430 nm the filtered LAB has the desired length.
Mineral Oil from Chooz
Having been transported to Chooz, Ondina samples from the truck as well as fromthe tanks after unloading and filtering were tested on their attenuation. The re-sulting attenuation lengths are very good as can be seen in fig. (5.8), exceedingthe values measured in advance (compare with subsec. (5.5.2)). Unfortunately, incontrast to the LAB samples, the lengths after filtering are slightly worse. Sincefiltering should not lower transparency, this is most probably due to a contamina-tion while taking the sample or to negligent handling at the filling process of thespectrometer’s cell. Nevertheless, the final mineral oil from Chooz is very trans-parent.
58
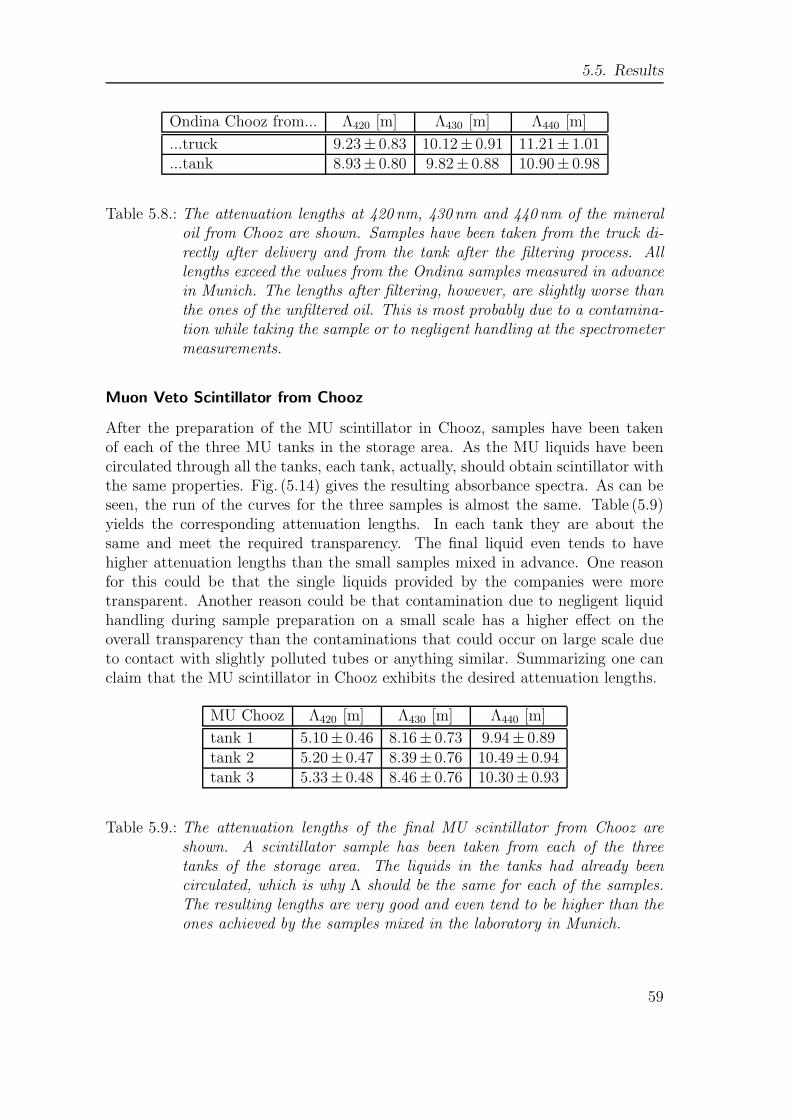
5.5. Results
Ondina Chooz from... Λ420 [m] Λ430 [m] Λ440 [m]
...truck 9.23± 0.83 10.12± 0.91 11.21± 1.01
...tank 8.93± 0.80 9.82± 0.88 10.90± 0.98
Table 5.8.: The attenuation lengths at 420 nm, 430 nm and 440 nm of the mineraloil from Chooz are shown. Samples have been taken from the truck di-rectly after delivery and from the tank after the filtering process. Alllengths exceed the values from the Ondina samples measured in advancein Munich. The lengths after filtering, however, are slightly worse thanthe ones of the unfiltered oil. This is most probably due to a contamina-tion while taking the sample or to negligent handling at the spectrometermeasurements.
Muon Veto Scintillator from Chooz
After the preparation of the MU scintillator in Chooz, samples have been takenof each of the three MU tanks in the storage area. As the MU liquids have beencirculated through all the tanks, each tank, actually, should obtain scintillator withthe same properties. Fig. (5.14) gives the resulting absorbance spectra. As can beseen, the run of the curves for the three samples is almost the same. Table (5.9)yields the corresponding attenuation lengths. In each tank they are about thesame and meet the required transparency. The final liquid even tends to havehigher attenuation lengths than the small samples mixed in advance. One reasonfor this could be that the single liquids provided by the companies were moretransparent. Another reason could be that contamination due to negligent liquidhandling during sample preparation on a small scale has a higher effect on theoverall transparency than the contaminations that could occur on large scale dueto contact with slightly polluted tubes or anything similar. Summarizing one canclaim that the MU scintillator in Chooz exhibits the desired attenuation lengths.
MU Chooz Λ420 [m] Λ430 [m] Λ440 [m]
tank 1 5.10± 0.46 8.16± 0.73 9.94± 0.89tank 2 5.20± 0.47 8.39± 0.76 10.49± 0.94tank 3 5.33± 0.48 8.46± 0.76 10.30± 0.93
Table 5.9.: The attenuation lengths of the final MU scintillator from Chooz areshown. A scintillator sample has been taken from each of the threetanks of the storage area. The liquids in the tanks had already beencirculated, which is why Λ should be the same for each of the samples.The resulting lengths are very good and even tend to be higher than theones achieved by the samples mixed in the laboratory in Munich.
59

5. Measurement of the Attenuation Length
410 415 420 425 430 435 440 445
wavelength [nm]
muon veto tank1
muon veto tank2
muon veto tank3
8.69
4.34
2.90
2.17
1.74
att
enuation
length
Λ[m
]
0.005
0.01
0.015
0.02
0.025
abso
rbance
A
Figure 5.14.: The absorbance spectra of the final MU scintillator from Chooz areplotted versus wavelength. The right y - axis gives the correspondingattenuation lengths. A scintillator sample has been taken from eachof the three tanks of the storage area. The liquids in the tanks hadalready been circulated, which is why Λ should be the same for each ofthe samples. All curves run very close to each other. For every tankthe transparency, respectively the resulting Λ is very good and eventends to be higher than the ones achieved by the samples mixed in thelaboratory in Munich.
Buffer Liquid from Chooz
After the preparation of the buffer liquids in Chooz, samples have been taken fromthe three buffer tanks. Since the liquids in the buffer tanks likewise the liquids inthe MU tanks had been circulated, each of the buffer tanks should contain the sameliquid. The results of the measurements can be seen in table (5.10). Especially, theattenuation length of the first tank differs from the others. This might be due tosome contamination while sampling or during the handling at the spectrometermeasurements. Nevertheless, the buffer liquids of all tanks far exceed the requiredattenuation lengths. Since contamination can always only decrease the attenuationlength, the better results, i.e. the ones of tank 2 and tank 3 can be regarded asindicative lengths.
60
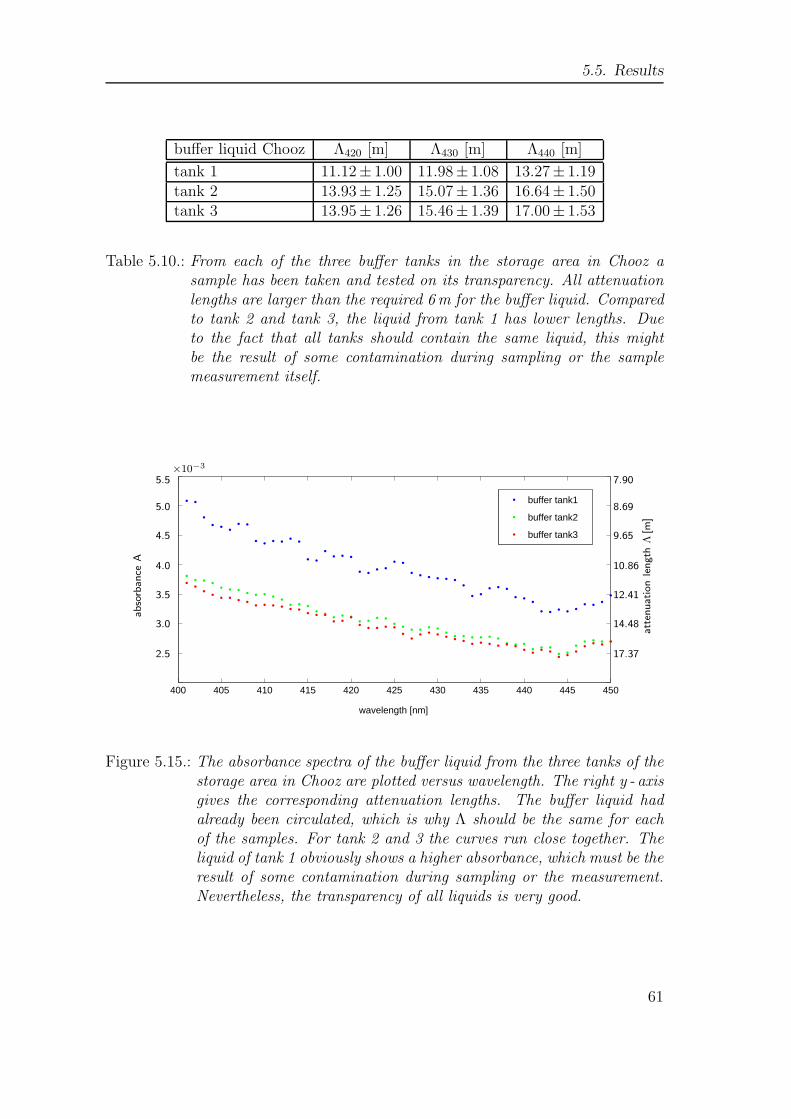
5.5. Results
buffer liquid Chooz Λ420 [m] Λ430 [m] Λ440 [m]
tank 1 11.12± 1.00 11.98± 1.08 13.27± 1.19tank 2 13.93± 1.25 15.07± 1.36 16.64± 1.50tank 3 13.95± 1.26 15.46± 1.39 17.00± 1.53
Table 5.10.: From each of the three buffer tanks in the storage area in Chooz asample has been taken and tested on its transparency. All attenuationlengths are larger than the required 6m for the buffer liquid. Comparedto tank 2 and tank 3, the liquid from tank 1 has lower lengths. Dueto the fact that all tanks should contain the same liquid, this mightbe the result of some contamination during sampling or the samplemeasurement itself.
400 405 410 415 420 425 430 435 440 445 450
wavelength [nm]
buffer tank1
buffer tank2
buffer tank3
17.37
14.48
12.41
10.86
9.65
8.69
7.90
att
enuation
length
Λ[m
]2.5
3.0
3.5
4.0
4.5
5.0
5.5×10⁻³
abso
rbance
A
Figure 5.15.: The absorbance spectra of the buffer liquid from the three tanks of thestorage area in Chooz are plotted versus wavelength. The right y - axisgives the corresponding attenuation lengths. The buffer liquid hadalready been circulated, which is why Λ should be the same for eachof the samples. For tank 2 and 3 the curves run close together. Theliquid of tank 1 obviously shows a higher absorbance, which must be theresult of some contamination during sampling or the measurement.Nevertheless, the transparency of all liquids is very good.
61

5. Measurement of the Attenuation Length
62

6. Measurement of the Light Yield
due to γ - Irradiation
6.1. Light Yield
Light yield, one of the key parameters of a liquid scintillation detector, character-izes the efficiency regarding to the conversion of deposited energy into detectablephotons. Light yield is commonly defined by the ratio of the number of photonsNph produced in the scintillator or in the phototubes of the detector to the energydeposited Edep.
LY =Nph
Edep(6.1)
In this chapter a measurement of the relative light yield is presented. The bestPPO concentration for the Double Chooz muon veto scintillator gaining the highestlight yield was determined. The muon veto scintillator then was prepared with thehelp of Wacker Chemie in Munich. The resulting liquids and samples of the finalscintillator from Chooz have likewise been checked on their light yield.
6.2. Experimental Setup
For feasibility reasons a relative measurement was performed. A measurement ofthe absolute light yield is almost impossible without a real 4π- detector geometry.Furthermore, very precise information about the efficiency of the used phototubeswould be essential [71]. As a consequence, the determination of the optimal PPOconcentration was carried out by comparing the results for different PPO concen-trations. Fig. (6.1) gives a schematic overview of the experimental setup. Theliquid scintillator stored in a container that will be described later on, indicated bythe dark blue cylinder, is excited by γ- rays from a 137Cs− source (orange sphere).The Cs - source has a distance of about 9 cm to the liquid scintillator cell and anactivity of 370 kBq. In the scintillator the γ - quants of the Cs - source performCompton scattering and hence confer part of their energy on electrons. The energyEdep of such a Compton electron under a fixed angle θ can be evaluated via thefollowing formula [36]:
63
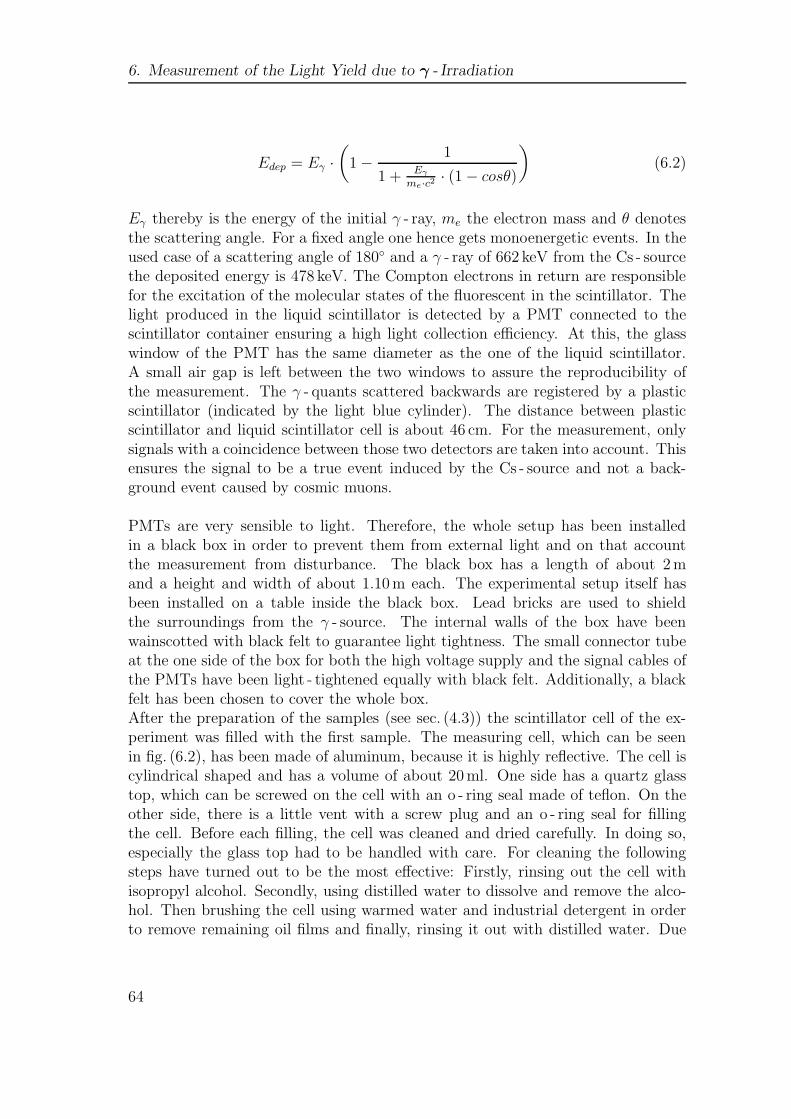
6. Measurement of the Light Yield due to γ - Irradiation
Edep = Eγ ·
(
1 −1
1 + Eγ
me·c2· (1 − cosθ)
)
(6.2)
Eγ thereby is the energy of the initial γ - ray, me the electron mass and θ denotesthe scattering angle. For a fixed angle one hence gets monoenergetic events. In theused case of a scattering angle of 180◦ and a γ - ray of 662 keV from the Cs - sourcethe deposited energy is 478 keV. The Compton electrons in return are responsiblefor the excitation of the molecular states of the fluorescent in the scintillator. Thelight produced in the liquid scintillator is detected by a PMT connected to thescintillator container ensuring a high light collection efficiency. At this, the glasswindow of the PMT has the same diameter as the one of the liquid scintillator.A small air gap is left between the two windows to assure the reproducibility ofthe measurement. The γ - quants scattered backwards are registered by a plasticscintillator (indicated by the light blue cylinder). The distance between plasticscintillator and liquid scintillator cell is about 46 cm. For the measurement, onlysignals with a coincidence between those two detectors are taken into account. Thisensures the signal to be a true event induced by the Cs - source and not a back-ground event caused by cosmic muons.
PMTs are very sensible to light. Therefore, the whole setup has been installedin a black box in order to prevent them from external light and on that accountthe measurement from disturbance. The black box has a length of about 2mand a height and width of about 1.10m each. The experimental setup itself hasbeen installed on a table inside the black box. Lead bricks are used to shieldthe surroundings from the γ - source. The internal walls of the box have beenwainscotted with black felt to guarantee light tightness. The small connector tubeat the one side of the box for both the high voltage supply and the signal cables ofthe PMTs have been light - tightened equally with black felt. Additionally, a blackfelt has been chosen to cover the whole box.After the preparation of the samples (see sec. (4.3)) the scintillator cell of the ex-periment was filled with the first sample. The measuring cell, which can be seenin fig. (6.2), has been made of aluminum, because it is highly reflective. The cell iscylindrical shaped and has a volume of about 20ml. One side has a quartz glasstop, which can be screwed on the cell with an o - ring seal made of teflon. On theother side, there is a little vent with a screw plug and an o - ring seal for fillingthe cell. Before each filling, the cell was cleaned and dried carefully. In doing so,especially the glass top had to be handled with care. For cleaning the followingsteps have turned out to be the most effective: Firstly, rinsing out the cell withisopropyl alcohol. Secondly, using distilled water to dissolve and remove the alco-hol. Then brushing the cell using warmed water and industrial detergent in orderto remove remaining oil films and finally, rinsing it out with distilled water. Due
64

6.3. Read - out Electronics
PMT
PMT
blackbox
137Csliquidscintillator
scintillato
rplastic
Figure 6.1.: The experimental setup of light yield measurement is illustrated. Fordetails see text.
to the contact with oxygen, corrosion phenomena of the aluminum get noticeablefor a long - term use. In this manner, the reflectivity of cell is diminished, whichaffects the results of the light yield measurements. For that reason, the aluminumshould either be polished regularly or even better, should get anodized. For thelatter one should ensure the anodized layer to show the same properties as theoriginal material.Having screwed the glass top on the cell, it was filled half with the prepared scin-tillator liquid before being flushed with nitrogen. Finally, the remaining volumewas filled with scintillator, too. Being careful that no oxygen remains in the cell,so that the measurement results are not distorted, the cell was closed. The samplethen was ready to be placed in the experimental setup. This should be done indarkness to protect the PMTs.
6.3. Read - out Electronics
For the read - out electronics a NIM - based system has been chosen. Fig. (6.3) showsa block diagram of the used electronics. The several electronic devices are sum-marized in table (6.1). The photomultiplier for the liquid scintillator is operatedat a voltage of - 810V, whereas the one for the plastic scintillator is operated at avoltage of - 800V. First of all, the signals of both PMTs are amplified. Afterwards,they are split by a Fan In/Fan Out in order to guide them to both the transientrecorder (explained later on) and to the discriminators for further evaluation. The
65

6. Measurement of the Light Yield due to γ - Irradiation
Figure 6.2.: The photo depicts the scintillator container that was used for the lightyield measurements. It has been made of aluminum due to its highreflectance.
signals are discriminated at a threshold of 200mV for the liquid and at a thresh-old of 60mV for the plastic scintillator. The logical signals of both discriminatorsare passed on to a And Gatter. The pulse of the PMT of the liquid scintillator isadditionally delayed by 16 ns. This is due to the fact that the detector responseof the plastic scintillator is significantly slower than the one of a liquid scintilla-tor and to adjust differences in cable lengths. When an event is registered in theliquid scintillator and shortly after within a time range of 20 ns also in the plasticscintillator, the And Gatter triggers both channels in order to record them with a10 bit transient recorder.A scaler is used to monitor the coincidence rate and the rates of both PMTs. Withthe settings described above the plastic scintillator showed a stable rate of about77Hz. The rate of the liquid scintillator and therefore the rate of the coincidences,depend on the scintillator under investigation. With a mean rate of about 425Hzfor the different liquid scintillators used, the rate of coincidence was about 0.029Hz.As the time window for a coincidence was 20 ns, random coincidences can be esti-mated less than 2% of all events recorded. For this reason, random coincidences arenegligible. Correlated background, on the other hand, can originate from gammasthat might undergo multiple scattering off the surroundings, for example, the leadsheets.
The PMTs used are models of the company ETL/ETEL of the type 9111B. Theyare equipped with blue - green sensitive bialcali photocathodes with plano - concave
66

6.3. Read - out Electronics
Scaler Scaler Scaler
Gate Generator Gate Generator
And Gatter
Discriminator Discriminator
Fan In/Fan Out Transient Recorder Fan In/Fan Out
Amplifier Amplifier
PMT PMT
Plastic Scintillator Liquid Scintillator
Delay
Trigger
Figure 6.3.: The block diagram shows the electronics used for the light yield mea-surement.
67

6. Measurement of the Light Yield due to γ - Irradiation
Element Model
Amplifier CAEN Mod. N979Fan In/Fan Out CAEN Mod. N625Attenuator Le Croy Mod. A101Discriminator CAEN Mod. N840Gate Generator MPI Dual Gate Pulse GeneratorAnd Gatter CAEN Quad Coincidence Logic Unit Mod. N455Scaler CAEN Quad Scaler + Preset Counter Timer Mod. N1145Transient Recorder Gage CS82G
Table 6.1.: The table lists the several electronic devices used for the light yield mea-surement.
window and a diameter of 25mm designed for fast timing. In order to reduce theinfluence of external electromagnetic fields, the PMTs are shielded by a protectiveµ - metal. The technical specifications of the above - named PMTs are listed in table(6.2). PMT1 refers to the liquid scintillator and PMT2 to the plastic scintillator.
PMT 1 PMT 2
Type Electron Tubes 9111B Electron Tubes 9111BSerial number 20918 20934Dark current 20 Hz 1000 HzPeak-to-Valley 1.3 no single photonWindow borosilicate borosilicate
Table 6.2.: Technical specifications of photomultipliers used for light yield measure-ment [72].
For the last measurements PMT1 had to be exchanged. The new photomultiplierwas of the same model 9111B of the company ETEL. Due to the fact that eachPMT, even if of the same type, features different characteristics attributable tothe manufacturing process, the settings for the high voltage as well as for thediscrimination thresholds had to be adapted. Therefore, of course, also the rateof the resulting events generated in the liquid scintillator and, consequently, thecoincidence rate did change. Using the scaler, the random coincidence rate couldagain be justified to be negligible. The changed discrimination threshold, however,did not affect the results of the measurements as they are relative ones comparingdifferent samples to a reference. The absolute light yield had been determined byremeasuring the reference sample of known absolute light yield in the new setup.
68
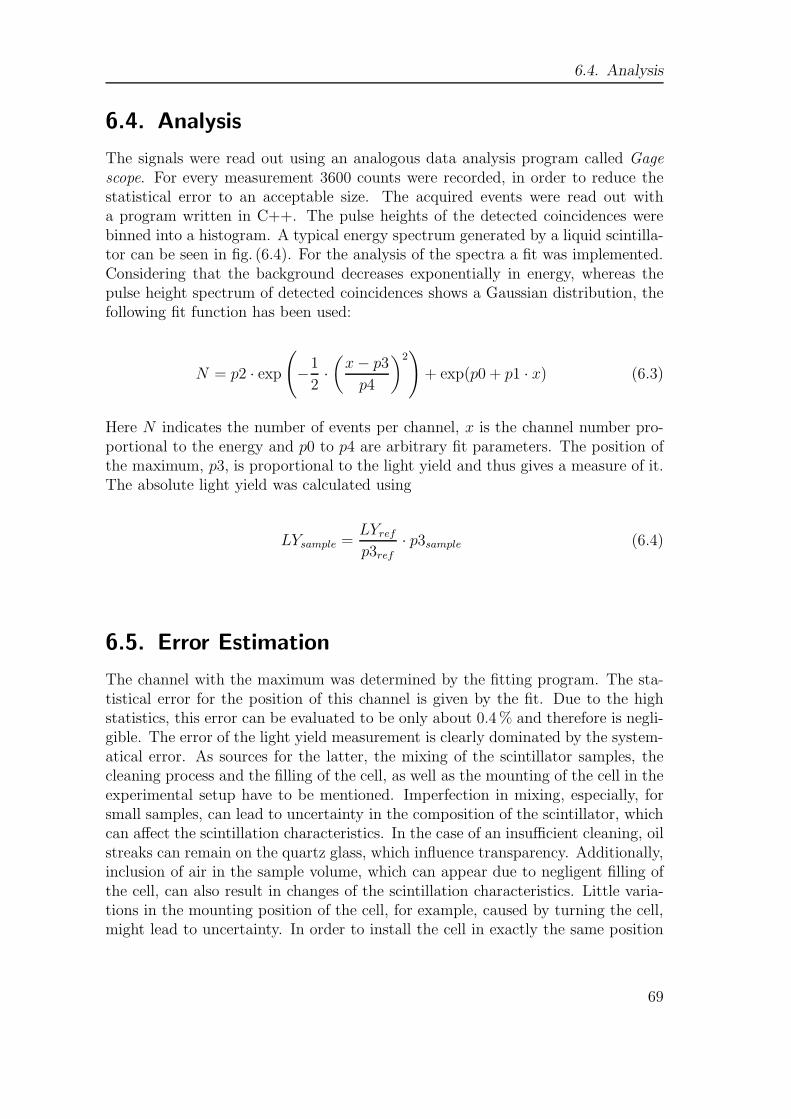
6.4. Analysis
6.4. Analysis
The signals were read out using an analogous data analysis program called Gagescope. For every measurement 3600 counts were recorded, in order to reduce thestatistical error to an acceptable size. The acquired events were read out witha program written in C++. The pulse heights of the detected coincidences werebinned into a histogram. A typical energy spectrum generated by a liquid scintilla-tor can be seen in fig. (6.4). For the analysis of the spectra a fit was implemented.Considering that the background decreases exponentially in energy, whereas thepulse height spectrum of detected coincidences shows a Gaussian distribution, thefollowing fit function has been used:
N = p2 · exp
(
−1
2·
(x − p3
p4
)2)
+ exp(p0 + p1 · x) (6.3)
Here N indicates the number of events per channel, x is the channel number pro-portional to the energy and p0 to p4 are arbitrary fit parameters. The position ofthe maximum, p3, is proportional to the light yield and thus gives a measure of it.The absolute light yield was calculated using
LYsample =LYref
p3ref
· p3sample (6.4)
6.5. Error Estimation
The channel with the maximum was determined by the fitting program. The sta-tistical error for the position of this channel is given by the fit. Due to the highstatistics, this error can be evaluated to be only about 0.4 % and therefore is negli-gible. The error of the light yield measurement is clearly dominated by the system-atical error. As sources for the latter, the mixing of the scintillator samples, thecleaning process and the filling of the cell, as well as the mounting of the cell in theexperimental setup have to be mentioned. Imperfection in mixing, especially, forsmall samples, can lead to uncertainty in the composition of the scintillator, whichcan affect the scintillation characteristics. In the case of an insufficient cleaning, oilstreaks can remain on the quartz glass, which influence transparency. Additionally,inclusion of air in the sample volume, which can appear due to negligent filling ofthe cell, can also result in changes of the scintillation characteristics. Little varia-tions in the mounting position of the cell, for example, caused by turning the cell,might lead to uncertainty. In order to install the cell in exactly the same position
69
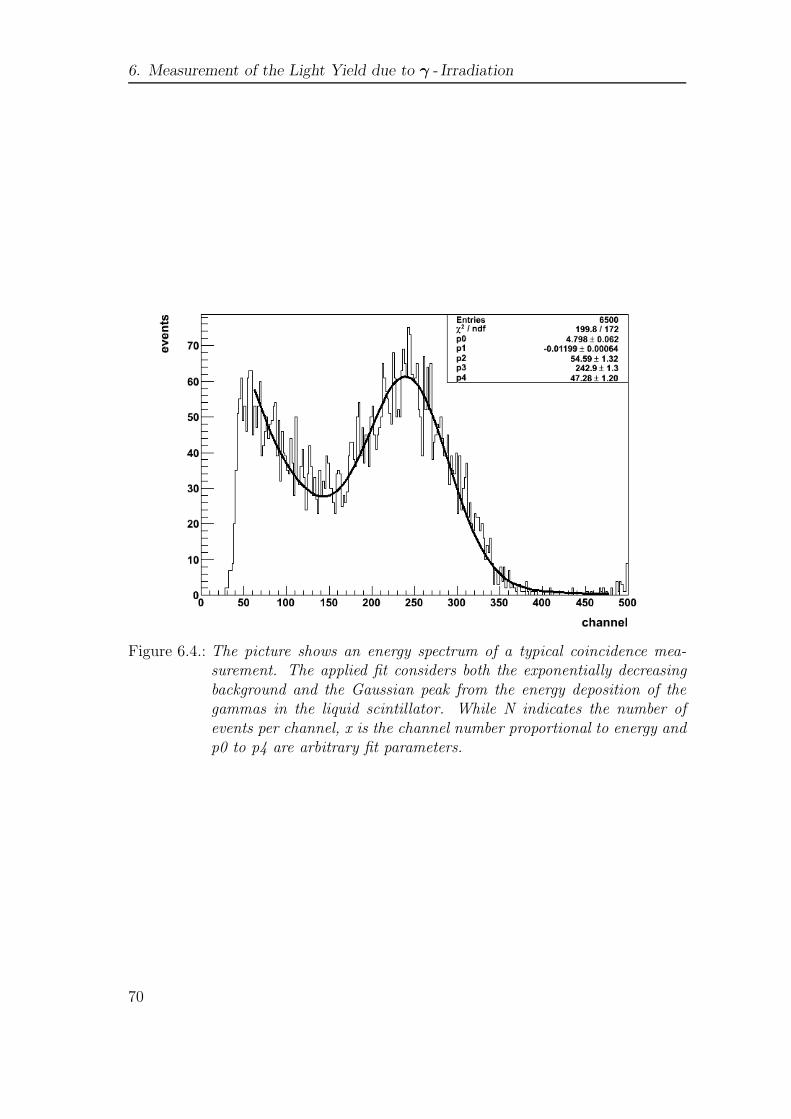
6. Measurement of the Light Yield due to γ - Irradiation
Figure 6.4.: The picture shows an energy spectrum of a typical coincidence mea-surement. The applied fit considers both the exponentially decreasingbackground and the Gaussian peak from the energy deposition of thegammas in the liquid scintillator. While N indicates the number ofevents per channel, x is the channel number proportional to energy andp0 to p4 are arbitrary fit parameters.
70
6.6. Results
for the next measurement and in this manner guarantee reproducibility, a markat the cell can be used. For an estimation of the systematical uncertainty andto investigate the reproducibility, measurements of one defined liquid scintillatorconcentration were repeated. Thereby, the whole sample preparation and fillingprocedure was carried out again. This way, the uncertainty has been assigned tobe about 4 %. Since the absolute light yield of the used reference sample is givenwith an accuracy of 10 % [73], the total systematical error has been estimated tobe 11 % by quadratic error propagation.
6.6. Results
For determining the optimal PPO concentration of the MU scintillator, sampleswere prepared in a composition of 37.5 % vol. LABP - 550Q, 62.5 % vol. tetrade-cane1, 20mg/l bisMSB and PPO, whose fraction was varied from 1 g/l to 4 g/l insteps of 0.5 g/l. The other components thereby were kept fixed at their particularconcentrations. The determination of the absolute light yield is very difficult as itis strongly dependent on the respective experimental setup. For this reason, thelight yield of a sample of known absolute light yield was measured in the sameexperimental setup. The comparison with this sample allows the determination ofthe absolute light yield for any other sample measured in this setup. As referencesample, the Borexino liquid scintillator 2 with an absolute light yield of 11 ± 1ph/keV [23, 73] was used.
The diagram in fig. (6.5) depicts the relative light yield depending on the PPOconcentration. The x - axis shows the PPO concentration in g/l. The y - axis givesthe absolute light yield in photons per energy in keV. As it can be seen, the graphbegins with a slope that later on for a PPO concentration of about 1.5 g/l saturates.Based on this diagram, the decision on the PPO concentration has been made infavor of 2 g/l PPO. For this concentration the light yield is no longer in the steepregion of the curve. A higher PPO concentration, on the other hand, would notsignificantly improve it. The considered concentration therefore is high enough toachieve the favored light yield and at the same time is the least necessary one. Ahigher PPO concentration, of course, would also imply higher costs. In addition,too high concentrations of the wavelength shifters offer the risk of self - absorption.
The results for the absolute light yield are summarized in table (6.3). ”tetradecane+ LAB + bisMSB” thereby indicates the fixed components in their particular con-centration, namely 62.5 % vol. tetradecane, 37.5 % vol. LAB and 20mg/l bisMSB.
1Due to the measurements of the attenuation length (see sec. (5.5)), LAB P - 550Q has lateron been replaced by LAB Helm Spain and tetradecane by n - paraffin CBR. Due to slightlydifferent densities, the percentages of the liquids changed to 48.4 % vol. LAB, 51.6 % vol.n - paraffin.
2Pseudocumene (PC) with 1.5 g/l PPO [23]
71

6. Measurement of the Light Yield due to γ - Irradiation
0 0.5 1 1.5 2 2.5 3 3.5 4 4.50
2
4
6
8
10
12
PPO concentration [g/l]
light
yie
ld [p
h/ke
V]
Figure 6.5.: The diagram gives the absolute light yield of the muon veto scintil-lator depending on the concentration of PPO. The light yield curvestarts with a slope that for higher PPO concentrations shows satura-tion. Based on this diagram it has been decided to use a PPO concen-tration of 2 g/l PPO. For this concentration the light yield is no longerin the steep region of the curve. A higher PPO concentration, on theother hand, would not significantly improve it. Too high concentrationsof the fluors offer the risk of self - absorption and imply higher costs.The considered concentration hence is not only high enough to achievethe favored light yield, but also the least necessary one.
scintillator sample absolute light yield [ph/keV]
LAB + tetradecane + bisMSB + 0 g/l PPO 1.7 ± 0.2LAB + tetradecane + bisMSB + 1.0 g/l PPO 7.4 ± 0.8LAB + tetradecane + bisMSB + 1.5 g/l PPO 8.5 ± 0.9LAB + tetradecane + bisMSB + 2.0 g/l PPO 9.2 ± 1.0LAB + tetradecane + bisMSB + 2.5 g/l PPO 9.6 ± 1.1LAB + tetradecane + bisMSB + 3.0 g/l PPO 9.8 ± 1.1LAB + tetradecane + bisMSB + 3.5 g/l PPO 10.0 ± 1.1LAB + tetradecane + bisMSB + 4.0 g/l PPO 10.2 ± 1.2
Table 6.3.: The table lists the absolute light yield that has been determined for themuon veto scintillator, namely 62.5 % vol. tetradecane, 37.5 % vol. LABand 20mg/l bisMSB with varying PPO concentration. The absolute lightyield increases with increasing PPO concentration. The decision hasbeen made for 2 g/l PPO resulting in a light yield of 9.2 photons/keV.
72
6.6. Results
Table (6.4) gives an overview of the absolute light yield of different scintillatorsamples as well as of n - paraffins and the mineral oil Ondina that also have beentested for scintillation. MU in this case stands for the final composition of the DCMU scintillator, which is to say 48.4 % vol. LAB, 51.6 % vol. n - paraffin, 2 g/lPPO and 20mg/l bisMSB. Helm Belgium and Helm Spain indicate the company ofthe LAB used for the MU scintillator, either from the company Helm in Belgiumor from the same company in Spain. MU from Master Solution means that theMaster Solution has been diluted to the final muon veto scintillator concentrationin the laboratory in Munich, whereas MU Chooz are samples of the ready muonveto scintillator from Chooz.Neither the n - paraffins nor the Ondina did show any scintillation. Together withother requirements, such as high transparency and radiopurity, this makes themsuitable candidates for the buffer liquid.The absolute light yield of the mixture of LAB and tetradecane both of the com-pany Petresa in the final MU composition with 2 g/l PPO but without any bisMSBturned out to be 7.4 ph/keV (see table (6.4)). This is less than the light yield of9.2 ph/keV of a sample with the same components, but with bisMSB added (see ta-ble (6.3)) and demonstrates the influence of bisMSB as a second wavelength shifter.Within the ranges of uncertainty the light yield of this MU scintillator made of Pe-tresa products (see table (6.3)) could also be achieved by the MU Helm Belgiumand MU Helm Spain (see table (6.4)). The MS with (9.6± 1.1) ph/keV, of course,shows a higher light yield, since it only contains the fluorescent LAB and the highlyconcentrated wavelength shifters.3 Having been diluted, the light yield of the MS(MU from MS) with (8.4± 0.9) ph/keV, is in the range of the MU scintillator sam-ples previously prepared in the laboratory.The absolute light yield of the ready MU scintillator from Chooz has been deter-mined to be (9.0± 1.0) ph/keV. The desired light yield of the MU scintillator thushas been achieved.
3The MS contains PPO in a concentration of 40 g/l and bisMSB in a concentration of 0.4 g/l.
73

6. Measurement of the Light Yield due to γ - Irradiation
scintillator sample absolute light yield [ph/keV]
n-paraffin CBR no scintillationn-paraffin Helm no scintillation
n-paraffin Wibarco no scintillationOndina no scintillation
LAB + tetradecane + 2.0 g/l PPO 7.4 ± 0.8MU with LAB Helm Belgium 7.8 ± 0.9MU with LAB Helm Spain 8.7 ± 1.0
Master Solution 9.6 ± 1.1MU from Master Solution 8.4 ± 0.9
MU Chooz 9.0 ± 1.0
Table 6.4.: The table gives the absolute light yield that has been determined fordifferent samples. Neither the n - paraffins nor the Ondina did show anyscintillation, which is a requirement concerning the buffer liquid. Themixture LAB + tetradecane + 2.0 g/l PPO does not contain bisMSB.Its light yield is less than the light yield of a muon veto scintillatorthat additionally contains the bisMSB as a second wavelength shifter.The MU scintillator samples with LAB Helm Belgium and Spain showlight yield in the same order of magnitude, which could also be achievedby the MU scintillator obtained from the Master Solution and the finalscintillator from Chooz.
74

7. Measurement of the Light Yield
due to Neutron Irradiation
Organic liquid scintillators mainly contain protons. The principal interaction ofneutrons incident on the scintillator is elastic neutron - proton scattering. Therecoiled protons are responsible for the ionization of the scintillator molecules andhence the light output. In order to analyze the light yield of the DC muon vetoscintillator with respect to neutrons, it was the aim to determine the proton -quenching factor (see also sec. (4.1.3)).
7.1. Proton - Quenching Factor
By definition, the quenching factor (QF) is the ratio of the recoil energy ER whichis the totally deposited energy in the scintillator and the fluorescence energy L 1.
QF =ER
L(7.1)
As described in sec. (4.1.2) and sec. (4.1.3) quenching, the reduction of the fluo-rescence intensity of a scintillator, is related to the ionization density, which isconsidered in the formula of Birks. The QF is a function of the energy and themass of the primary recoiling nucleus as well as of the scintillator’s chemical com-position and its temperature [47].
7.2. Kinematics of Neutron Elastic Scattering
For organic liquid scintillators, which mainly contain protons, the effect of quench-ing does occur for neutrons that undergo elastic neutron - proton scattering. Thescattered proton in the scintillator leads to ionization and as a consequence lumi-nescence light will be emitted by the scintillator. In the following, elastic neutron -proton scattering, which is the principal interaction for neutrons with an energy of
1The light yield L of nuclear recoils is usually expressed in terms of a so - called electron -equivalent energy Eee, i.e. the energy of a recoiled electron that results in the same lightoutput as the nuclear recoil in the detector (compare with (6.1)).
75
7. Measurement of the Light Yield due to Neutron Irradiation
less than 1 GeV [36], will be discussed. At energies of several MeV, the problemmay be treated nonrelativistically.Fig. (7.1) illustrates a single collision in the laboratory frame between a nucleus ofmass M and a neutron with velocity vn. The nucleus is assumed to be at rest [36].The angle between the direction of the incoming neutron and the recoiled nucleusis denoted by θlab. Considering conservation of energy and momentum yields
En = EA + En,s
⇒~p 2
n
2m=
~p 2A
2mA+
~p 2n,s
2m(7.2)
and
~pn,s = ~pn − ~pA (7.3)
with En the energy of the incoming neutron with momentum ~pn and En,s theenergy of the scattered neutron with momentum ~pn,s. EA denotes the energy of therecoiled nucleus and ~pA the corresponding momentum. The mass of the neutronis indicated by m and the mass number of the nucleus by A. Furthermore, thefollowing approximation for the mass M(A) of a nucleus with mass number A hasbeen used
M(A) = m · A. (7.4)
Equation (7.3) squared results in
~p 2n,s = ~p 2
n − 2 |~pn| |~pA| cos(θlab) + ~p 2A (7.5)
which applied to equation (7.2) gives the recoil energy of the nucleus:
EA =4A
(A + 1)2· En · cos2(θlab). (7.6)
In the particular case of elastic neutron - proton scattering (A=1), it simplifies to
Ep = En · cos2(θlab), (7.7)
76
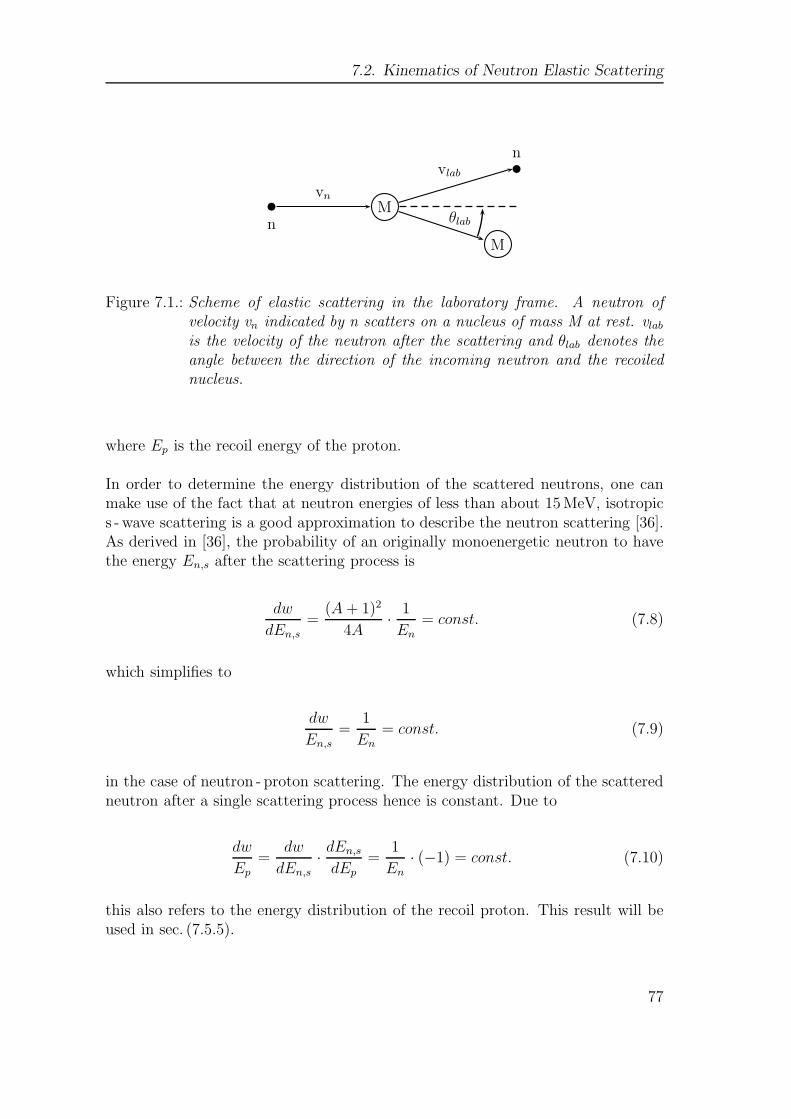
7.2. Kinematics of Neutron Elastic Scattering
M
M
n
n
vn
vlab
θlab
Figure 7.1.: Scheme of elastic scattering in the laboratory frame. A neutron ofvelocity vn indicated by n scatters on a nucleus of mass M at rest. vlab
is the velocity of the neutron after the scattering and θlab denotes theangle between the direction of the incoming neutron and the recoilednucleus.
where Ep is the recoil energy of the proton.
In order to determine the energy distribution of the scattered neutrons, one canmake use of the fact that at neutron energies of less than about 15MeV, isotropics - wave scattering is a good approximation to describe the neutron scattering [36].As derived in [36], the probability of an originally monoenergetic neutron to havethe energy En,s after the scattering process is
dw
dEn,s
=(A + 1)2
4A·
1
En
= const. (7.8)
which simplifies to
dw
En,s=
1
En= const. (7.9)
in the case of neutron - proton scattering. The energy distribution of the scatteredneutron after a single scattering process hence is constant. Due to
dw
Ep=
dw
dEn,s·dEn,s
dEp=
1
En· (−1) = const. (7.10)
this also refers to the energy distribution of the recoil proton. This result will beused in sec. (7.5.5).
77

7. Measurement of the Light Yield due to Neutron Irradiation
7.3. Experimental Setup
7.3.1. The MLL Accelerator
For the determination of the proton - quenching factor of the Double Chooz muonveto scintillator, the accelerator of the Maier Leibnitz Laboratorium (MLL) inGarching served as a neutron source.
Figure 7.2.: Top view of the MLL accelerator facility in Garching [74]. The severaldevices denoted in the picture are explained in the text.
The tandem accelerator is an advancement of a Van - de - Graaff accelerator. It canreach high ion energies by using the acceleration voltage (up to 15MeV) twice.Accelerated by a potential difference, negatively charged ions are being stripped oftheir electrons by a stripping foil inside the tube of the tandem accelerator. Thechange of polarity allows to accelerate them again by the same potential difference[74].Fig. (7.2) shows a top view of the accelerator facility. For the first step of accelera-tion the tandem accelerator requires negatively charged ions, which are produced bythe negative ion injector. For the production of neutrons 11B (Ekin ∼ 61.5 MeV)has been chosen. The boron ions are pre - accelerated by the extraction voltage(∼ 10 kV), before they are injected into the tandem accelerator tube. The ions
78

7.3. Experimental Setup
produced usually consist of different charge numbers and thus of miscellaneous en-ergies. To produce a monoenergetic beam, a 90◦ analyzing magnet is used to selectthe desired energy and isotope. The adapted beam can then be focused into thebeamline in order to be guided to the experimental setup.The time - of - flight measurements used for the investigation of the quenching factorneed a sharply pulsed beam (width 2 - 4 ns) which is achieved by the so - called low-energy buncher and the low - energy chopper. The low-energy buncher periodicallycompresses the continuous beam into units (pulse width∼ 20 ns). The low - energychopper cuts off the parts between the beam bunches in order to further sharpenthem. A logical pulse from the pulsing devices is used as a start signal for thetime - of - flight measurements [74].
7.3.2. Neutron Production
At the end of the beamline neutrons are produced inside a so - called hydrogencell (see fig. (7.3)). The cell’s inner diameter is about 1 cm and its length is 3 cm.Charged with 2 bar of hydrogen, neutrons in the MeV regime are generated viathe nucleus reaction p(11B,n)11C. A 5µm thick molybdenum foil separates the cellfrom the vacuum in the beamline. This foil can stand the pressure difference of3 bar and allows the high energetic 11B - beam to pass with an average energy lossof about 5 MeV. A 11B - beam of an energy of 55.4MeV is found to be the optimalvalue, leading to a resonant production of 11MeV neutrons in forward direction[74].
beamline
hydrogencell
cryostatblack box
Figure 7.3.: The picture illustrates the side view of the experimental setup for themeasurement of the QF at the MLL. The DC scintillator has beeninstalled in a black box located in the beamline of the accelerator behindthe cryostat of the CRESST scattering experiment. Also shown is thehydrogen cell for the production of the neutrons.
79
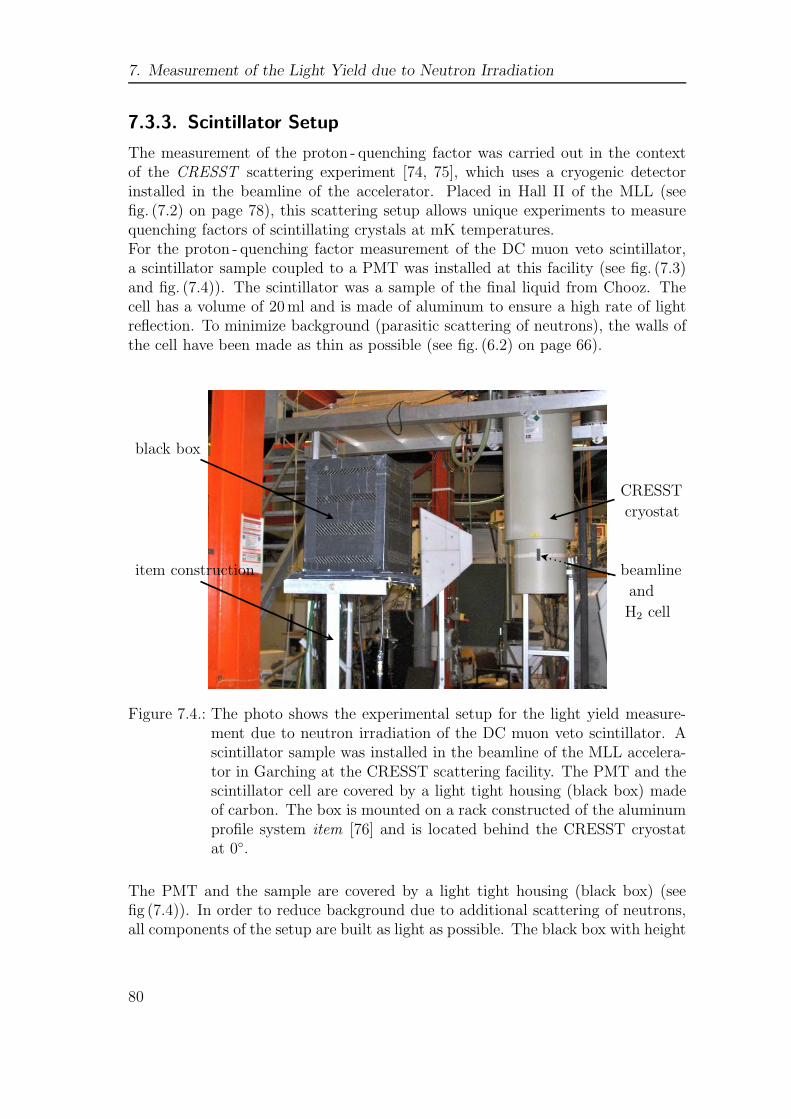
7. Measurement of the Light Yield due to Neutron Irradiation
7.3.3. Scintillator Setup
The measurement of the proton - quenching factor was carried out in the contextof the CRESST scattering experiment [74, 75], which uses a cryogenic detectorinstalled in the beamline of the accelerator. Placed in Hall II of the MLL (seefig. (7.2) on page 78), this scattering setup allows unique experiments to measurequenching factors of scintillating crystals at mK temperatures.For the proton - quenching factor measurement of the DC muon veto scintillator,a scintillator sample coupled to a PMT was installed at this facility (see fig. (7.3)and fig. (7.4)). The scintillator was a sample of the final liquid from Chooz. Thecell has a volume of 20ml and is made of aluminum to ensure a high rate of lightreflection. To minimize background (parasitic scattering of neutrons), the walls ofthe cell have been made as thin as possible (see fig. (6.2) on page 66).
CRESST
cryostat
item construction
black box
beamline
and
H2 cell
Figure 7.4.: The photo shows the experimental setup for the light yield measure-ment due to neutron irradiation of the DC muon veto scintillator. Ascintillator sample was installed in the beamline of the MLL accelera-tor in Garching at the CRESST scattering facility. The PMT and thescintillator cell are covered by a light tight housing (black box) madeof carbon. The box is mounted on a rack constructed of the aluminumprofile system item [76] and is located behind the CRESST cryostatat 0◦.
The PMT and the sample are covered by a light tight housing (black box) (seefig (7.4)). In order to reduce background due to additional scattering of neutrons,all components of the setup are built as light as possible. The black box with height
80

7.4. Setup of Data Acquisition
of 28 cm and a square basis with an edge length of 20 cm is made of carbon fiber.Cracks between the single carbon fiber sheets are additionally masked with scotchtape. The PMT is hold by an aluminum clamp and the whole box is mountedon a rack constructed of the variable aluminum profile system item [76]. The boxis located at 0◦, at a distance of 3.65m to the hydrogen cell. Shorter distanceshave not been possible due to experimental constraints of the CRESST scatteringexperiment.
7.4. Setup of Data Acquisition
The pulse parameters of the PMT signals are recorded by an analog - to - digitalconverter (ADC) and all timing information is registered by a time - to - digitalconverter (TDC). The signals of the PMT are amplified and fed in the ADC anda constant - fraction discriminator (CFD). The CFD triggers on a certain fractionof the pulse height which makes the trigger time independent. The output of theCFD is directly connected to the TDC which continuously records the event timesof the PMT and the starting information provided by the pulsing devices.The ADC, CFD and TDC modules are part of a VME - based system that waschosen and developed in [75]. The VME bus connects the VME controller to astandard PC by an optical - fiber cable. The events of the detector during themeasurement campaigns are recorded and the analysis is performed offline. Coin-cidences between the bunches of the accelerator and events in the photomultiplierare determined.
ADC
CFD
TDC
Amplifier PMT
VM
Ebus
VMEcontroller
buncher
StandardPC
Figure 7.5.: Wiring scheme of the VME - based modules and the photomultiplier.
81

7. Measurement of the Light Yield due to Neutron Irradiation
Element Model
PMT ETL/ETEL type 9111BAmplifier CAEN Mod. N979Constant Fraction Discriminator CEAN v812Time to Digital Converter CAEN v1190Analog to Digital Converter Struck Sis3320VME controller CAEN v2718
Table 7.1.: The several electronic devices used for the proton - quenching measure-ment are listed.
7.5. Analysis
7.5.1. Time - of - Flight Plot
In fig. (7.6) a typical time - of - flight (ToF) plot is shown. The y - axis of this scatterplot gives the scintillation energy measured with the PMT in arbitrary units. Thex - axis gives the time of flight ∆t in ns with the zero value provided by the pulsingdevices as described in sec. (7.3.1). The first distribution found at a ∆t of about300 thereby is the so - called γ-distribution. Together with the neutrons, a largeamount of gammas is produced in the hydrogen cell, which also reach the liquidscintillator. Depositing their energy, they lead to luminescence light that can bedetected with the photomultiplier. As the gammas have travelled the distance xof 3.65m from the cell to the PMT with velocity of light c, the γ - distributioncorresponds to a time of t = x
c. This information is used to calibrate the x - axis.
The second distribution in fig. (7.6) at a ∆t of about 369, originates from the fastestneutrons that reach the detector. They are due to the resonant neutron productionof about 11MeV in the hydrogen cell (see (7.3.2)). At later flight times neutronswith lower energies arrive in the detector causing the decreasing shaded area behindthe prominent neutron peak. The calibration of the x - axis (fig. (7.10)) yields a ToFof t = 81ns for the fastest neutrons. According to that, the maximum energy ofthe neutrons in the beam can be derived using
En =1
2· m v2
n =1
2· m(x
t
)2
(7.11)
where m is the neutron mass, vn its velocity, x the travelled distance and t thetime - of - flight. This results in a maximum neutron energy of 10.6MeV.
82

7.5. Analysis
Figure 7.6.: The figure shows a typical ToF scatter plot of the DC muon veto scintil-lator under irradiation of neutrons measured during a beamtime at theMLL. While the x - axis gives the time difference ∆t between the start-ing signal for the ToF -measurements given by the pulsing devices andthe PMT signal in ns, the y - axis gives the pulse heights measured withthe PMT. The left distribution is due to the gammas that are producedtogether with the neutrons in the hydrogen cell. The right distributionoriginates from the neutrons.
source process of γ production branching T1/2 [y] Eγ [keV] ECE [keV]137Cs β− 85 % 30 662 47822Na β−/EC 100 % 2.6 1275 1062
Table 7.2.: For the calibration of the ToF measurement a 137Cs - source and a 22Na -source have been used. The sources together with the respective processof gamma production, branching, their gamma energy Eγ and the energyof the Compton edge ECE are shown [77].
83

7. Measurement of the Light Yield due to Neutron Irradiation
7.5.2. Energy Calibration
The constituents of organic scintillators feature low Z - values which is why no photopeaks are visible to realize energy calibration. Therefore, the energy calibration ofthe experiment was carried out by the use of different γ - sources (see table (7.2)).The emitted γ - rays undergo Compton scattering in the liquid scintillator andtransfer part of their energy to the so - called Compton electron whose energy isgiven by
E(θ, Eγ) = Eγ −Eγ
1 + Eγ
mec2(1 − cos θ)
(7.12)
where Eγ is the energy of the incident gamma ray, me the electron mass and θ thescattering angle [36].The maximum energy deposition Emax is achieved by backward scattering at anangle of θ = 180◦. By plotting the counts in the PMT versus the energy mea-sured with the scintillator, this becomes visible as an edge in the spectrum thatgenerally is referred to as Compton edge and can serve as a calibration point. Forthe calibration of the energy axis the following procedure has been applied: Thespectrum with counts plotted versus the pulse height in arbitrary units, which hasbeen measured in the scintillator, has been fitted with a Gaussian fit function inthe high energy region (see fig. (7.7) and fig. (7.8)). For the energy of the Comptonedge ECE , the point xCE , which is the pulse height channel at which the spectrumhas decreased to half of its maximum towards higher pulse heights, has been chosen[42]. The calibration can be obtained by a linear fit to the calibration points (xCE,i,ECE,i) where i refers to the different γ - sources. The fluorescence energy L henceis given by
L =ECE,i
xCE,i· x = c · x (7.13)
where x is the pulse height channel.The resulting plot leading to the calibration factor c can be seen in fig. (7.9). It isin good agreement with the assumption of a linear detector response. Fig. (7.10)shows the energy measured in the liquid scintillator plotted versus the time - of -flight after calibration of the axes.
84

7.5. Analysis
0 50 100 150 200 250 300 3500
500
1000
1500
2000
2500
3000
3500
4000
4500
5000
pulse height [arb. units]
coun
ts
Cs−137 source
gaussian fit
Figure 7.7.: Pulse height spectrum of the DC muon veto scintillator under irradi-ation of a 137Cs - source. The Compton edge has been fitted using aGaussian fit function.
0 100 200 300 400 500 6000
500
1000
1500
2000
2500
3000
3500
4000
pulse height [arb. units]
coun
ts
Na−22 source
gaussian fit
Figure 7.8.: Pulse height spectrum of the DC muon veto scintillator under irradi-ation of a 22Na - source. The Compton edge has been fitted using aGaussian fit function.
85
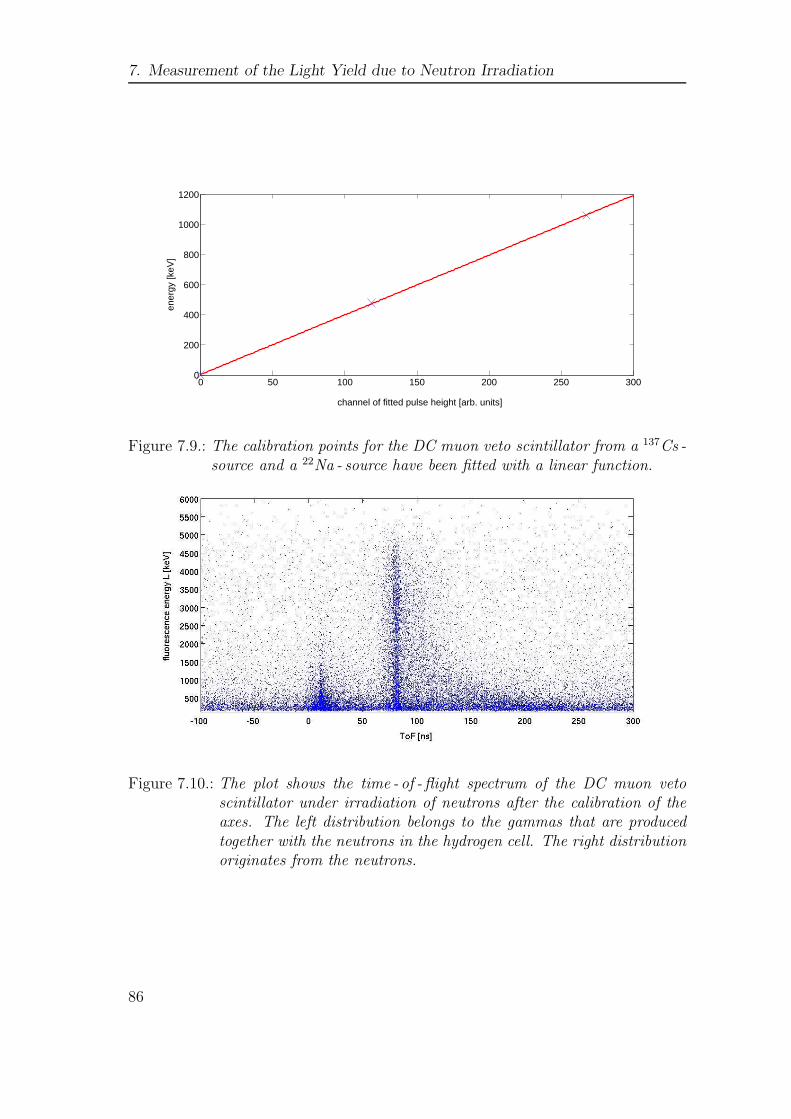
7. Measurement of the Light Yield due to Neutron Irradiation
0 50 100 150 200 250 3000
200
400
600
800
1000
1200
channel of fitted pulse height [arb. units]
ener
gy [k
eV]
Figure 7.9.: The calibration points for the DC muon veto scintillator from a 137Cs -source and a 22Na - source have been fitted with a linear function.
Figure 7.10.: The plot shows the time - of - flight spectrum of the DC muon vetoscintillator under irradiation of neutrons after the calibration of theaxes. The left distribution belongs to the gammas that are producedtogether with the neutrons in the hydrogen cell. The right distributionoriginates from the neutrons.
86

7.5. Analysis
7.5.3. Neutron - γ Discrimination
As described in sec. (4.1.1), the light emission of organic scintillators is dominatedby a single fast component, but also features a substantial slow component. Bothcontributions depend on the energy deposition per unit path length dE/dx. Forheavier and slower particles, for example, this deposition in the scintillator materialis large compared to the one of fast electrons. This results in a higher ionizationfor heavier particles and consequently a higher fraction of delayed fluorescence.Scintillators, where this impact on decay time and hence pulse shape is strong,are capable of pulse - shape discrimination, i.e. capable of distinguishing betweendifferent types of incident particles by the shape of the emitted light pulse [36]. Forsuch a scintillator, fig. (7.11) qualitatively shows the pulses of alpha particles, fastneutrons (proton recoils) and gamma rays for comparison.
Figure 7.11.: The time dependence of scintillation pulses in a typical liquid scintil-lator due to the excitation by alpha particles, fast neutrons and gammarays is illustrated qualitatively. Scintillators, where the overall decaytime of the emitted light pulse varies with the type of incident particlecan be used for pulse - shape discrimination [42].
87

7. Measurement of the Light Yield due to Neutron Irradiation
The muon veto scintillator has been checked on its neutron -γ discrimination capa-bility. For the discrimination, a scintillation pulse can be integrated over differenttime intervals. In order to distinguish between neutrons and gammas it is suffi-cient to apply two integration gates, a short one (∼ 50 ns) and long one (∼ 500 ns)[74, 75]. With the help of the acquisition software (see (7.4)) that has a graphi-cal interface to display pulses of the detector during the measurement, integrationgates for the pulse - shape discrimination can be applied. They can be optimizedchecking the neutron - γ discrimination in a live discrimination plot. Fig. (7.12)shows the discrimination parameters for a set of pulses containing neutrons andgammas in a scatter plot. The ratio of the integrated pulse signals of the shortand the long integration gate is plotted versus the long gate. A ToF - cut has beenapplied to the 10.6MeV neutron - distribution as well as to the γ - distribution. Theneutrons are indicated by the red color, whereas blue dots represent the gammas.Fig. (7.13) shows the ratio of the integrated pulse signals of the short and the longintegration gate binned in a histogram, where again only the events from the γ - cut(indicated by blue color) and the 10.6MeV neutron - cut (indicated by red color)are shown.
Figure 7.12.: The ratio of the integrated pulse signals of the short and the long inte-gration gate is plotted versus the long gate, which is a measure for thedeposited energy. The upper population (blue dots) represents gammaevents, whereas the lower band (red dots) originates from neutron -induced protons.
88

7.5. Analysis
0.85 0.9 0.95 10
500
1000
1500
2000
2500
ratio [arb. units]
coun
ts
gammas11 MeV neutrons
Figure 7.13.: The ratio of the integrated pulse signals of the short and the longintegration gate has been binned into a histogram. Here, only eventsfrom the γ - distribution (indicated by blue color) and the 10.6MeVneutrons (indicated by red color) have been taken into account.
500 1000 1500 2000 2500 3000 3500 4000 4500 5000 5500
0.8
0.85
0.9
0.95
1
1.05
1.1
pulse height in electron equivalent energy [keV]
ratio
[arb
. uni
ts]
Figure 7.14.: The ratio of the integrated pulse signals of the short and the long in-tegration gate is plotted versus the pulse height in electron - equivalentenergy measured in the detector.
89

7. Measurement of the Light Yield due to Neutron Irradiation
In order to examine whether electron and proton recoil events can be distinguished,the following steps have been taken.
• The ratio of the short versus the long integration gate has been plotted versusthe pulse height in electron - equivalent energy measured in the detector (seefig. (7.14)).
• All events from 1MeV to 5MeV were binned with a 250 keV binning.
• To each gamma - and neutron - distribution of each energy bin, a gaussian fitwas applied. Fig. (7.15) exemplarily shows the fitted gaussian distributionsfor one of those bins. The discrimination capability is quantified by the extentof the overlap of both distributions.
A 1σ - discrimination is possible, if those distributions do not overlap on a 1 σ -level. In fig. (7.16) the mean values of the gaussian fits are plotted versus theenergy. The blue line denotes the gammas and the red line the 10.6MeV neutrons.The dashed lines have been obtained by adding and subtracting, for each energycut, the corresponding 1 σ to and from the mean values of the gamma and neutrondistributions, respectively. The dashed lines therefore indicate an error band of1σ - width around the averages demonstrating to what energy neutron and gammaevents can be distinguished on a 1 σ - level. Above an energy of about 2180 keV theerror bands do not overlap, which means that on a 1 σ - level, neutron - γ discrim-ination is possible above an energy threshold of 2180 keV in electron equivalentenergy.
90

7.5. Analysis
0.85 0.86 0.87 0.88 0.89 0.9 0.91 0.92 0.93 0.94 0.950
2
4
6
8
10
12
ratio [arb. units]
coun
ts
gammas
gaussian fit
neutrons
gaussian fit
Figure 7.15.: Cuts on the energy measured in the detector have been applied. Binnedin a histogram of the ratio, these events show two distributions dueto the electron and proton recoils as can be seen exemplarily in thisfigure. Each distribution has been fitted with a gaussian fit function.Neutrons are indicated by green dots and the red fit and the gammasby purple dots and the blue fit, respectively.
1000 1500 2000 2500 3000 3500 4000 4500 50000.86
0.87
0.88
0.89
0.9
0.91
0.92
0.93
0.94
0.95
0.96
L [keV]
shor
t gat
e/lo
ng g
ate
[arb
. uni
ts]
Figure 7.16.: The mean values of the ratio of event rates in the short and longintegration gate of the neutron - (red color) and γ - distribution (bluecolor) are plotted versus the fluorescence energy L in the detector.Also shown are the 1 σ - lines above and below the mean values illus-trating the discrimination capability on a 1 σ - level.
91

7. Measurement of the Light Yield due to Neutron Irradiation
7.5.4. Proton - Quenching - Factor at 10.6MeV
According to eq. (7.1) on page 75, two informations are of importance for the eval-uation of the proton - quenching factor: the light yield of the scintillator L andthe recoil energy ER. While L corresponds to the scintillation energy that candirectly be measured with a PMT, ER refers to the energy Ep that has been trans-ferred to the recoil proton. Depending on the scattering angle this energy varies(see sec. (7.2)). Knowing the incident neutron energy via ToF measurement, thehighest visible scintillation light output Lmax induced by neutrons must belong toelastically backscattered neutrons (angle of 180◦), transferring all their energy (En)on the proton. Using eq. (7.1) the quenching factor thus becomes:
QF =ER
L=
En
Lmax=
12m(x
t)2
Lmax(7.14)
Thus the quenching factor at an energy of about 10.6MeV can be determined us-ing the prominent 10.6MeV neutron peak. Therefore, the first step is to assignthe maximal scintillation energy Lmax, for which the following procedure has beenused: A cut of 10 ns has been applied to the neutron peak from 76.2 ns to 86.2 ns infig. (7.10). Having done so, 4658 events remained. Subsequently, the events fulfill-ing the ToF condition have been binned in a histogram of the scintillation energyand the statistical background known from measurements without neutron beamhas been subtracted. Having subtracted the background, 4188 events remained. Inorder to determine the maximum energy, a Gaussian fit has been applied to thehigh energy region as can be seen in fig. (7.17). As maximum energy, the value,where the spectrum has decreased to half of its maximum, has been chosen [42].Fig. (7.18) shows the point that has been determined that way together with thescatterplot.
The proton - quenching factor for an energy of 10.6MeV has been evaluated to be2.6 ± 16 % (for the error estimation see sec. (7.5.6)).
92

7.5. Analysis
0 1000 2000 3000 4000 5000 6000 7000 80000
10
20
30
40
50
60
70
80
fluorescence energy L [keV]
coun
ts
cut on 10.6 MeVgaussian fit
Figure 7.17.: The events of the cut on the prominent neutron peak (∼ 10.6MeV)have been binned in a histogram and a gaussian fit has been appliedin order to determine the maximum energy.
Figure 7.18.: The time - of - flight scatter plot is shown together with the maximumscintillation energy (indicated by the red cross) that has been deter-mined for the 10.6MeV neutrons.
93
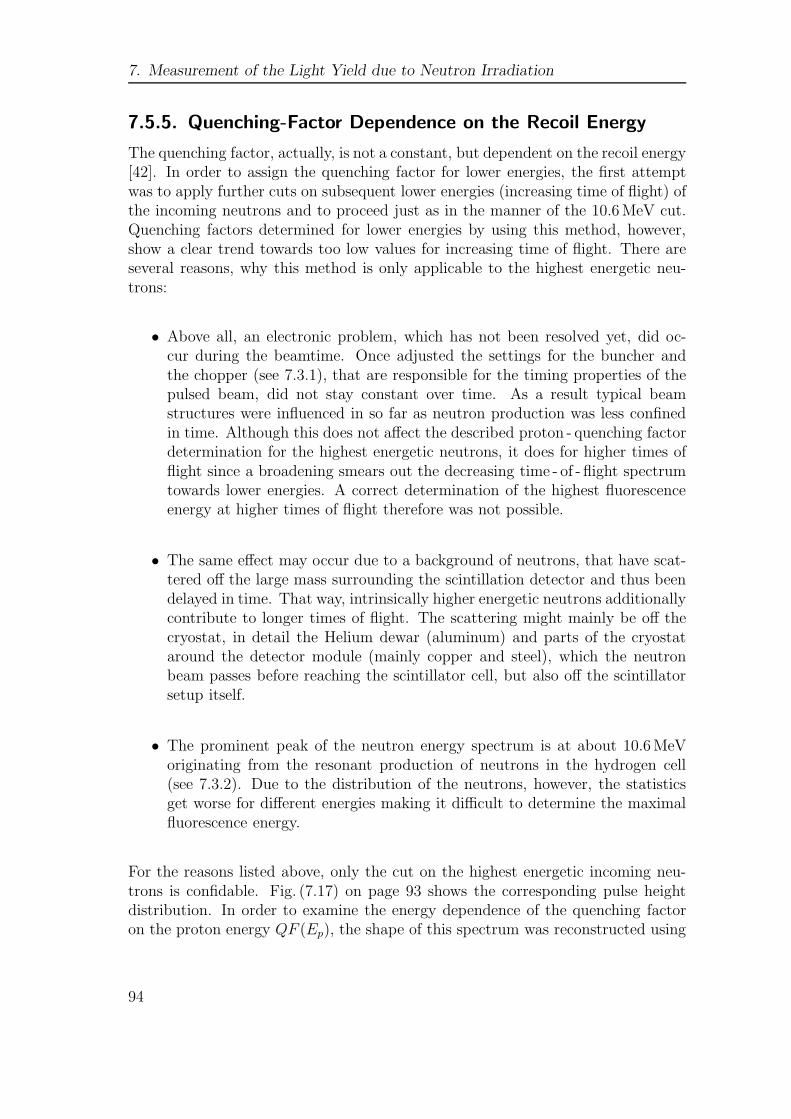
7. Measurement of the Light Yield due to Neutron Irradiation
7.5.5. Quenching-Factor Dependence on the Recoil Energy
The quenching factor, actually, is not a constant, but dependent on the recoil energy[42]. In order to assign the quenching factor for lower energies, the first attemptwas to apply further cuts on subsequent lower energies (increasing time of flight) ofthe incoming neutrons and to proceed just as in the manner of the 10.6MeV cut.Quenching factors determined for lower energies by using this method, however,show a clear trend towards too low values for increasing time of flight. There areseveral reasons, why this method is only applicable to the highest energetic neu-trons:
• Above all, an electronic problem, which has not been resolved yet, did oc-cur during the beamtime. Once adjusted the settings for the buncher andthe chopper (see 7.3.1), that are responsible for the timing properties of thepulsed beam, did not stay constant over time. As a result typical beamstructures were influenced in so far as neutron production was less confinedin time. Although this does not affect the described proton - quenching factordetermination for the highest energetic neutrons, it does for higher times offlight since a broadening smears out the decreasing time - of - flight spectrumtowards lower energies. A correct determination of the highest fluorescenceenergy at higher times of flight therefore was not possible.
• The same effect may occur due to a background of neutrons, that have scat-tered off the large mass surrounding the scintillation detector and thus beendelayed in time. That way, intrinsically higher energetic neutrons additionallycontribute to longer times of flight. The scattering might mainly be off thecryostat, in detail the Helium dewar (aluminum) and parts of the cryostataround the detector module (mainly copper and steel), which the neutronbeam passes before reaching the scintillator cell, but also off the scintillatorsetup itself.
• The prominent peak of the neutron energy spectrum is at about 10.6MeVoriginating from the resonant production of neutrons in the hydrogen cell(see 7.3.2). Due to the distribution of the neutrons, however, the statisticsget worse for different energies making it difficult to determine the maximalfluorescence energy.
For the reasons listed above, only the cut on the highest energetic incoming neu-trons is confidable. Fig. (7.17) on page 93 shows the corresponding pulse heightdistribution. In order to examine the energy dependence of the quenching factoron the proton energy QF (Ep), the shape of this spectrum was reconstructed using
94

7.5. Analysis
a Monte Carlo method.Neglecting additional contributions from competing reactions at high energies andmultiple scattering effects (for the discussion see sec. (7.5.6)), the shape of the pulseheight spectrum can be described by a function
f(L) = const. ·
∫ (
g(Ep, L) ⊗ QF (Ep) ·dw
dEp
)
dEp. (7.15)
The distribution hence can be obtained by integrating over the quenching fac-tor QF (Ep) (see sec. (4.1.3) and (7.1)), the cross section of the elastic neutron -proton scattering that is proportional to the energy distribution of the recoil protondw/dEp and the gaussian energy resolution g(Ep, L) of the detector in the limitsof possible proton energies. With dw/dEp being constant (see sec. (7.2)), f(L)becomes
f(L) = const ·
∫
(g(Ep, L) ⊗ QF (Ep)) dEp (7.16)
Using eq. (7.16) the spectrum has been simulated. The recoil proton energy therebyhas been randomly chosen between zero and the maximum energy of the incom-ing neutron (10.6MeV). The energy resolution of the detector has been assumedproportional to
√Ep according to
σ(Ep) = σ0 ·√
Ep (7.17)
with σ0 being a proportional constant. From the gaussian fit in fig. (7.17) thatdescribes the maximal energy transfer of the 10.6MeV neutrons on the proton, theproportional constant σ0 has been determined to be 0.22.
For a first approach this has been done for an energy independent QF. As a value2.6 was assumed, as it is the value obtained for the 10.6MeV protons. The resultingplot can be seen in fig. (7.19).Supposing an ideal detector resolution, a linear light output of the scintillator anda constant energy distribution of the recoil protons, the expected pulse height dis-tribution should be rectangular with a steep cutoff. Just as in the case of themeasured spectrum, the simulated distribution varies from the distinct rectangularstructure at the highest recoil energies, where it is washed out due to the detectorresolution. The curve of the measured data, however, features an additional risefor lower scintillation energies. This slope should not be due to background sincethe background has been considered and subtracted by applying the 10.6MeV cut
95

7. Measurement of the Light Yield due to Neutron Irradiation
L [MeV]0 1 2 3 4 5 6 7
0
2000
4000
6000
8000
10000
12000
14000
16000
Figure 7.19.: The pulse height distribution for the 10.6MeV neutrons has beensimulated. The quenching factor has been assumed to be constant.Compared to the experimentally measured data the graph misses therise for lower energies. As discussed in the text this can mainly betraced back to the influence of the energy dependence of the quenchingfactor.
96
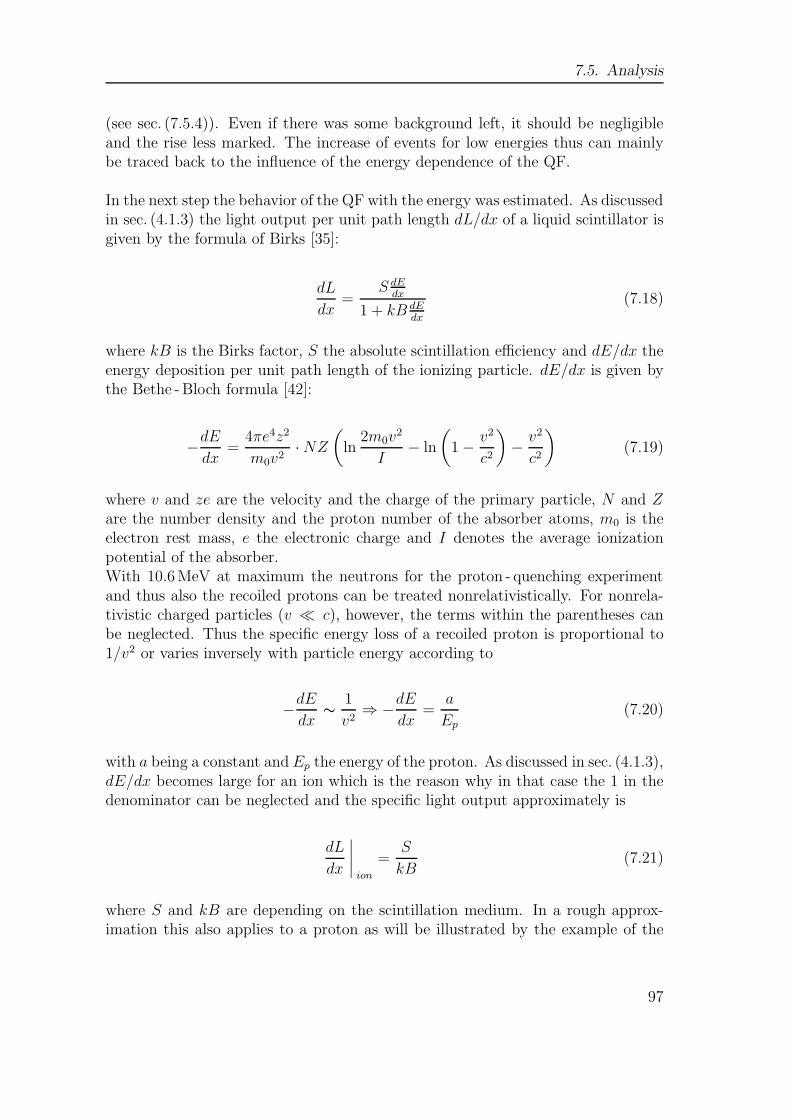
7.5. Analysis
(see sec. (7.5.4)). Even if there was some background left, it should be negligibleand the rise less marked. The increase of events for low energies thus can mainlybe traced back to the influence of the energy dependence of the QF.
In the next step the behavior of the QF with the energy was estimated. As discussedin sec. (4.1.3) the light output per unit path length dL/dx of a liquid scintillator isgiven by the formula of Birks [35]:
dL
dx=
S dEdx
1 + kB dEdx
(7.18)
where kB is the Birks factor, S the absolute scintillation efficiency and dE/dx theenergy deposition per unit path length of the ionizing particle. dE/dx is given bythe Bethe - Bloch formula [42]:
−dE
dx=
4πe4z2
m0v2· NZ
(
ln2m0v
2
I− ln
(
1 −v2
c2
)
−v2
c2
)
(7.19)
where v and ze are the velocity and the charge of the primary particle, N and Zare the number density and the proton number of the absorber atoms, m0 is theelectron rest mass, e the electronic charge and I denotes the average ionizationpotential of the absorber.With 10.6MeV at maximum the neutrons for the proton - quenching experimentand thus also the recoiled protons can be treated nonrelativistically. For nonrela-tivistic charged particles (v ≪ c), however, the terms within the parentheses canbe neglected. Thus the specific energy loss of a recoiled proton is proportional to1/v2 or varies inversely with particle energy according to
−dE
dx∼
1
v2⇒ −
dE
dx=
a
Ep
(7.20)
with a being a constant and Ep the energy of the proton. As discussed in sec. (4.1.3),dE/dx becomes large for an ion which is the reason why in that case the 1 in thedenominator can be neglected and the specific light output approximately is
dL
dx
ion
=S
kB(7.21)
where S and kB are depending on the scintillation medium. In a rough approx-imation this also applies to a proton as will be illustrated by the example of the
97

7. Measurement of the Light Yield due to Neutron Irradiation
Ep [MeV] 9 8 7 6 5
QF (Ep) 2.7 ± 0.1 3.0 ± 0.1 3.4 ± 0.1 4.0 ± 0.2 4.8 ± 0.2
Table 7.3.: Based on the energy dependence that was derived from a Monte Carlosimulation, the quenching factor was calculated for different energieswithin the range of the measured data.
borexino scintillator [23] whose kB factor is known:The energy deposition per unit path length of a 1GeV proton in hydrogen is4.5MeVcm2/g [78]. With the density of the borexino scintillator of ρ = 0.8 g/cm3
this becomes ∼ 4MeV/cm energy deposition per unit path length. Using eq. (7.20)the energy deposition for protons of about 10MeV hence can be derived to 400MeV/cm. The kB factor for the borexino scintillator is 0.02 cm/MeV [79] leadingto kB · (dE/dx)10 MeV ≈ 8 > 1. As a result dL/dx approximately tends to a con-stant.
Using eq. (7.21) integration hence results in the absolute light yield due to a recoiledproton:
L =
∫ xm
0
dL
dxdx =
∫ 0
Ep
dL
dx
dx
dEdE
(7.20)= −
∫ 0
Ep
S
kB
E
adE = k · E2
p (7.22)
Here, xm is the range of the proton, Ep its energy and k a constant.Using its definition (see eq.(7.1)) the quenching factor becomes
QF =Ep
L=
k
Ep. (7.23)
with k being a constant. The best result has been obtained with k = (24 ± 1) MeV.The simulated distribution can be seen in fig. (7.20). Using eq. (7.23) and k =24 MeV the quenching factor has been calculated for different energies within theenergy range of the measured data. The results together with the errors due to theuncertainty in k are listed in table (7.3).
98

7.5. Analysis
L [MeV]0 1 2 3 4 5 6 7
-210
-110
1
10
210
Figure 7.20.: The pulse height distribution for the 10.6MeV neutrons has been sim-ulated (indicated by red color). Also shown is the measured spectrum(indicated by blue color). For the simulation the quenching factor hasbeen assumed to be QF = k
Epwith Ep being the proton energy and the
constant k being 24MeV. Compared to the plot obtained by a constantQF (see fig. (7.19)) of 2.6, the curve increases for lower energies andgives a quite good fit to the experimental data.
99

7. Measurement of the Light Yield due to Neutron Irradiation
7.5.6. Error Estimation and Discussion of the Results
Error Estimation of the Proton - Quenching Factor
For the estimation of uncertainty for the proton quenching factor at 10.6MeV, thefollowing errors have been taken into account:
• A systematical error in the resolution for the time of flight measurement thatcan be estimated to be about ∆t = 4ns.
• A systematical error in the distance x due to the distance from hydrogen cellto the scintillator cell that had been measured and the size of the scintillatorcell. This uncertainty can be assumed to be about 1 cm.
• A statistical error of about 15 % in the maximal scintillation energy Lmax dueto the fit on the energy spectrum used for its determination.
Linear error propagation of the total systematical and the total statistical errorresulted in a total error of about 16%. The proton - quenching at an energy of10.6MeV hence is 2.6± 0.4.
Discussion of the Simulated Energy Dependence
The simulated distribution (fig. (7.20)) obtained with the energy dependent QF ap-proximately describes the run of the experimental data. In comparison to the plotobtained by a constant QF (see fig. (7.19)), its curve increases for lower energies.Nevertheless, the simulated spectrum still deviates from the measured data. Forone reason, this can be explained by the approximations made at the derivation ofthe energy dependence of the QF, more precisely, in the Birks and Bethe - Blochformula. Furthermore, the following effects result in a further distortion of thepulse height spectrum, but have not been considered in the simulation:
• Edge effect : If the range of the recoil protons is not small compared withthe detector dimensions, effects due to escaping protons from the scintillatormedium can occur [42]. Those effects might be applicable to the setup of themeasurement since the volume of the scintillator, with only about 20ml, issufficiently small and, additionally, the neutron energy with about 11MeVquite high. Escaping protons are not able to deposit their whole energy,which means they still create events, but shifted to lower energies. That way,these events distort the pulse height spectrum by causing a further increasingslope in the region of lower pulse heights.
• Competing reactions at high energies: For neutron energies higher than 8or 9MeV two competing reactions contribute to the overall response of or-ganic scintillators [42]: 12C(n, α)9Be at an energy threshold of 6.17MeV and
100

7.5. Analysis
12C(n, n’)3α at an energy threshold of 7.98MeV. Both reactions become sig-nificant above 9MeV and in this range lead to an increase in the pulse heightdistribution.
In general, the shape of the pulse height distribution could additionally be influ-enced by neutrons that undergo multiple scattering off hydrogen or scattering offcarbon followed by scattering off hydrogen [42].2 For the scintillator setup used,however, the contribution of multiple scattering can be neglected since the detectorvolume with only 20ml is too small.At an energy of 10.6MeV the quenching factor was determined from the pulseheight distribution. With 2.6 ± 0.4 this quenching factor agrees with the quench-ing factor of 2.3 ± 0.4 obtained by the simulation at the respective energy. Thisresult is also in the range of the proton - quenching factor that has been assumedfor the KamLAND scintillator [80].
2The neutron elastic scattering from carbon itself does not contribute much to the detectoroutput, as according to Birks (see (4.1.3)) the scintillation efficiency for particles with a highenergy deposition per unit path length is low.
101

7. Measurement of the Light Yield due to Neutron Irradiation
102

8. Conclusion and Outlook
The discussion of possible neutrino oscillations started with the discovery of the so-lar neutrino discrepancy problem in 1968 [5]. Since that time neutrino oscillationshave been confirmed by several experiments. The underlying oscillation theory hassix independent parameters, namely three mixing angles ϑ12, ϑ23 and ϑ13 as well astwo mass - squared differences ∆m2
21 and ∆m232 and a CP - violating phase δ. With
∆m221 = (7.59+0.19
−0.21) · 10−5 eV2, ∆m232 = (2.43 ± 0.13) · 10−3 eV2 in the case of the
mass differences and with sin2 (2ϑ12) = 0.87 ± 0.03 and sin2 (2ϑ23) > 0.92 in thecase of the mixing angles, all parameters of the neutrino mixing matrix except forthe small mixing angle ϑ13 and the phase δ have been determined to high accuracy[11]. For ϑ13 only an upper limit of ϑ13 < 0.16 [11] could be set. There are furtherunknown fundamental properties of the neutrinos such as the absolute mass scale,the hierarchy of the mass eigenvalues of the neutrinos, and whether neutrinos areMajorana particles or not that currently are under investigation or have to be ad-dressed by future experiments.The reactor neutrino experiment Double Chooz in the French Ardennes providesa promising possibility to finally assign the missing angle ϑ13 [9] or at least toimprove its limit. In both cases, the result will have a significant impact on thedetermination of the CP violation phase δ since the potential of future accelera-tor neutrino experiments regarding its finding particularly depends on the exactvalue of ϑ13 [32]. Using the Chooz nuclear reactor plant as a powerful neutrinosource Double Chooz pursues a new concept of making a competitive measurementwith two identical detectors. While the so - called near detector is meant for fluxmonitoring, the far detector will be sensitive on effects from neutrino oscillationsdue to ϑ13. The detectors are based on liquid scintillators. In order to control thebackground induced by cosmic muons, both detectors feature an inner veto whichis a dedicated muon identification system based on liquid scintillator. Additionally,the buffer containing a non - scintillating liquid has been installed to shield the tar-get from natural radioactivity. Optical properties, such as the light yield and theattenuation length of all liquids of the detectors, have a significant influence on thephysical success of the Double Chooz experiment.In the course of this thesis, measurements of the light yield of the DC muon vetoscintillator as well as of the attenuation length of both the muon veto scintillatorand the buffer liquid have been carried out in order to decide on the compositionof the liquids.Concerning the MU scintillator, an attenuation length of more than 5m at 430 nm,which is the characteristic wavelength of light emission, is required to guarantee
103

8. Conclusion and Outlook
that light of every event located in the liquid reaches the PMTs at the detectorvolumes surface. In the case of the buffer liquid, the same applies to the events inthe target leading to a desired attenuation length of more than 6m. In order tomake a decision concerning the products used for both muon veto scintillator andbuffer liquid, samples of different candidates have been tested on their attenuationlength using an UV/Vis-spectrometer. As primary luminescent for the muon vetoscintillator different LAB have been under consideration. The best results with anattenuation length of more than 9m at 430 nm, which is the wavelength of interest,were obtained by the LAB from the company Helm in Spain. In order to adapt thescintillator to the required density of 0.804 g/cm3, a second component is added.For this purpose, different n - paraffins and tetradecane were tested. While the at-tenuation length of tetradecane with less than 5m was found to be too short, alln - paraffins tested showed high attenuation lengths in the range of 12m and hencewould have been eligible candidates. Due to the best offer, the decision was madefor the company CBR.Regarding the buffer liquid it has been foreseen to use a mixture of a mineral oiland in order to achieve the required density also n - paraffin. While in the case ofn - paraffin, the decision had already been made in favor of the company CBR, themineral oils Ondina 909 and Ondina 917 from the company Shell have been underinvestigation in the case of the mineral oil. With more than about 10m, Ondina909 did show higher attenuation lengths than Ondina 917 with about 7m. SinceOndina 909 was discontinued by Shell, the decision has been made for Ondina 917,whose transparency also was sufficient.The optimal concentration of the wavelength shifter PPO for the muon veto scin-tillator has been determined. Therefore, light yield measurements for scintillatorliquids with varying PPO - concentration under the irradiation of a 137Cs - sourcewere carried out using an experimental setup for a coincidence measurement. Thebest PPO concentration was found to be 2 g/l. With a light yield of (8.7 ± 1) pho-tons/keV, the muon veto scintillator with its final products met the requirementsconcerning Double Chooz.The finalized compositions of both the muon veto scintillator and the buffer liquidare listed in table (8.1). A Master Solution of the muon veto scintillator containingLAB and the highly concentrated wavelength shifters PPO and bisMSB has beenprepared at Wacker Chemie in Munich. In Chooz the Master Solution has beendiluted to the muon veto scintillator concentration. Both the scintillator and thebuffer liquid have finally been mixed on site and adapted to the correct density.Samples of the liquids stored in Chooz, ready to be filled in the detector, haveagain been tested on their light yield as well as on their attenuation lengths. Thelight yield of the scintillator was determined to be (9 ± 1) photons/keV, which evenexceeds the expected (8.7 ± 1) photons/keV.The attenuation length at the characteristic wavelength of light emission of 430 nmfor the muon veto scintillator was found to be more than 8m and for the buffer
104

muon veto scintillator company buffer liquid company
48.4 % vol. LAB Helm Spain51.6 % vol. n - paraffin CBR 46% vol. n - paraffin CBR2 g/l PPO Perkin Elmer 54% vol. Ondina 917 Shell20mg/l bisMSB Perkin Elmer
Table 8.1.: Final composition of the Double Chooz muon veto scintillator and thebuffer liquid.
liquid more than 12m. Both liquids, hence, are very transparent and exceed therequirements regarding the attenuation.In addition, the muon veto scintillator from Chooz has been tested on its light yielddue to neutron irradiation. The principal reaction of neutrons incident on the scin-tillator is elastic neutron - proton scattering. The recoiled protons are responsiblefor the ionization of the scintillator molecules and hence, the light output. Due toradiationless deexcitation processes grouped together under the term of quenching,not the whole energy that has been deposited in a liquid scintillator medium byincident particles is converted into detectable light. Taking this into account, thequenching factor describes the scintillation efficiency and, therefore, is a relevantparameter for a precise understanding of the Double Chooz detector response. Forthe determination of the proton - quenching factor for the muon veto scintillator theMLL accelerator was used as a neutron source. By time - of - flight measurementsperformed during a beamtime of about one week the proton - quenching factor at10.6MeV was assigned to be (2.6 ± 0.4). For a further investigation of its energydependence a Monte Carlo simulation was used. The quenching factors that havebeen determined for energies within the range of the experimental data can be seenin table (8.2).The shape of the emitted light pulses of a scintillator varies for particles of dif-ferent ionizing power due to the excitation of different fluorescence mechanisms.For certain scintillators, where this effect is strong, this can be used to distinguishbetween different types of incident particles. In the course of the beamtime at theMLL accelerator, the DC muon veto scintillator has additionally been tested on itscapability of distinguishing between incident neutrons and gammas via pulse - shapediscrimination. The neutron - gamma discrimination was found to be possible on a1 σ− level above an energy threshold of 2180 keV. As regards Double Chooz, thefact that neutron and gamma events can subsequently be identified on a certainlevel will allow a better control of the background.
Further improvements concerning the measurements of the light yield due to γ -irradiation could be reached by implementing an experimental setup for the abso-lute light yield. The measurements performed in this thesis used a relative method.
105

8. Conclusion and Outlook
Ep [MeV] 9 8 7 6 5
QF (Ep) 2.7 ± 0.1 3.0 ± 0.1 3.4 ± 0.1 4.0 ± 0.2 4.8 ± 0.2
Table 8.2.: Based on the energy dependence that was derived from a Monte Carlosimulation, the quenching factor was calculated for different energieswithin the range of the measured data.
Results that are independent from a reference sample could be achieved by realiz-ing a complex 4 π - detector geometry.For the attenuation length measurements with the UV/Vis - spectrophotometer thesamples under investigation had to be filled in a sample cell of 0.1m length. Mea-surements with higher precision, however, could be obtained by new experimentalsetups using path lengths that are in the range of the expected attenuation lengths(∼ 6m).The experimental setup for the time - of - flight measurements at the MLL pre-sented in this thesis is a general possibility to perform further quenching factormeasurements under irradiation of neutrons and to proceed with investigating theneutron - gamma discrimination capability of liquid scintillators. A repetition ofthe measurements would indeed be desirable in order to increase statistics andhence, the reliability of the results. Furthermore, measurements using neutrons ofdifferent energies, would be interesting and lead to a more detailed understandingof the energy dependence of the proton - quenching factor.The possibility of pulse - shape discrimination is a crucial issue for next - generationneutrino experiments. For LENA with the subject to a possible observation ofrare neutrino events from the diffuse supernova neutrino background (DSNB), forexample, controlling the background is highly important [81]. The fact that theDouble Chooz muon veto scintillator was found to be generally capable of neutron -gamma discrimination together with its high transparency and light yield speaksin favor for LAB as a scintillator candidate for future neutrino experiments.Regarding Double Chooz, both the muon veto scintillator and the buffer liquid willallow a successful performance. The results for the quenching factor and the dis-crimination capability are essential for the Double Chooz analysis and hence willcontribute to its success in the search for ϑ13.
106

A. Attenuation Length Corrections
For the measurement of an empty cell, reflections of four boundary layers are con-tributing to the attenuation as described in sec. (5.3). Presuming wavelength inde-pendent reflections at the layers between air and glass, the absorbance measuredwith an empty cell can be written as
Acell = log10
(I(0) · (1 − R)4
I(x)
)
= log10
(I(0)
I(x)
)
+ log10
((1 − R)4
)
= Aglass+air + 4 · log10 (1 − R) (A.1)
where Aglass+air is the absorbance of both the quartz glass of the cell and the air. Ris the reflectivity of the boundary between quartz glass and air, I(0) the intensityof the incident light ray and I(x) the reflectivity of the light ray having crossed thecell.The absorbance of the cell filled with the sample, which only has two layers con-tributing (see sec. (5.3)), on the other hand, is
Afull = log10
(I(0) · (1 − R)2
I(x)
)
= log10
(I(0)
I(x)
)
+ log10
((1 − R)2
)
= Aglass+liquid + 2 · log10 (1 − R) (A.2)
Here Aglass+liquid refers to the absorbance of both the glass and liquid. In orderto obtain Aliquid, half of the absorbance for the empty cell is subtracted from theabsorbance of the full cell, according to
Aliquid = Afull −1
2Acell. (A.3)
Inserting eq. (A.2) and eq. (A.1) and applying the fact that the absorbance of a
107
A. Attenuation Length Corrections
multi component system is the sum of the absorbances of the single components(see sec. (5.1)), Afull −
12Acell actually evaluates to
Afull −1
2Acell = Aglass + Aliquid + 2 · log10 (1 − R)
−1
2(Aglass + Aair + 4 · log10 (1 − R))
= Aliquid +1
2Aglass −
1
2Aair (A.4)
Neglecting the absorbance of air and considering the wavelength dependence, thisbecomes the absorbance A′(λ) of sec. (5.3):
A′(λ) = Afull(λ) −1
2Acell(λ) = Aliquid(λ) +
1
2Aglass(λ). (A.5)
Now A′(λ) still has to be corrected for the remaining absorbance of glass. Therefore,the smallest occurring absorbance Amin at the wavelength λmin, which is
Amin = A(λmin) = Aliquid(λmin)︸ ︷︷ ︸
≈ 0
+1
2Aglass(λmin) (A.6)
is used. Assuming that the transmission at the wavelength position λmin is maxi-mal, Aliquid(λmin) is zero. Furthermore, the wavelength dependence of the quartzglass has to be neglected, which, however, is a good approximation [64].This leads to the corrected absorbance A(λ) of the sample that is taken for thecalculation of the attenuation length in sec. (5.3):
A(λ) = A′(λ) − Amin
= Aliquid(λ) +1
2Aglass(λ) −
1
2Aglass(λmin)
= Aliquid(λ). (A.7)
108

B. Attenuation Length of the Final
Liquids from Chooz
!""#$%&"'($)*#$+",)(-)-'$&*)*'.%'/0
!"#$% !"#$% !"#$% !"#&' !"#&' !"#&'
()*+ ,-).#/ ,-).#0 ,-).#1 ,-).#/ ,-).#0 #,-).#1
345 65733 66766 65786 69754 6:75; 6:762
338 65734 657<: 6578; 6974; 6:75< 6:762
33: 65748 6676: 657<2 6978: 6:743 6:788
333 6572; 6679< 667;9 63768 627:3 627<9
33; 65736 6578< 65783 6978: 6:7<3 6275:
335 <7<3 6573< 65795 697;2 6:7:3 62755
398 <7:3 65763 6575: 69755 6:795 6:739
39: <795 <729 <725 6;72; 6:756 6:7;9
393 <75: <736 <735 6;7<6 6472< 6:758
39; 87:4 87<: <755 6;794 647:; 64725
395 876: 879< 873: 667<8 64752 64795
3;8 2729 8756 876; 667<; 637<2 6476:
3;: 2769 273< 274< 66744 637<3 647;5
3;3 :7:; :72< :7<: 66738 637;3 637:5
3;; 478: :75; :76< 66734 63794 63726
3;5 4765 47;5 4799 6676; 697<9 697<4
368 3796 3735 3746 657<2 697<4 63752
36: 9746 974; 97:9 657<4 697:: 69748
363 ;723 ;724 ;789 65736 69763 697;6
36; ;759 ;759 ;758 657;5 6;7<9 6;7<2
365 6736 6735 6733 65762 6;742 6;785
358 578< 578< 57<6 <72; 6;74; 6;786
35: 574; 574; 5749 <729 6;768 6;793
353 57;8 57;8 57;< <73< 66782 6;764
35; 5764 5764 5764 87<8 667:: 66728
355 5758 5758 575< 8782 667;; 66746
2-3454)6,7
Table B.1.: The table lists the attenuation lengths (AL) of the final muon veto scin-tillator (MU) and the buffer liquid (BF) that have been calculated forthe wavelength range from 400 nm to 450 nm. A sample of each of thethree buffer and the three muon veto tanks of the storage area in Choozhas been measured with the UV/Vis - spectrometer.
109

B. Attenuation Length of the Final Liquids from Chooz
110

List of Figures
3.1. Top view on the Chooz reactor site . . . . . . . . . . . . . . . . . . 113.2. Survival probability of an electron antineutrino . . . . . . . . . . . 123.3. Sketch of the Double Chooz detector . . . . . . . . . . . . . . . . . 15
4.1. Jablonski diagram for the illustration of the scintillation mechanism 184.2. Simplified illustration of the Stokes shift . . . . . . . . . . . . . . . 204.3. Energy transfer processes illustrated in a two component system . . 214.4. Chemical structure of LAB . . . . . . . . . . . . . . . . . . . . . . . 254.5. Chemical structure of n - paraffins . . . . . . . . . . . . . . . . . . . 264.6. Chemical structure of bisMSB . . . . . . . . . . . . . . . . . . . . . 284.7. Chemical structure of PPO . . . . . . . . . . . . . . . . . . . . . . . 284.8. Absorption and emission spectrum of bisMSB . . . . . . . . . . . . 294.9. Absorption and emission spectrum of PPO . . . . . . . . . . . . . . 30
5.1. Typical absorbance spectra measured with the UV/Vis spectrometer 395.2. Typical absorbance spectra having applied corrections 1 . . . . . . . 395.3. Typical absorbance spectra having applied corrections 2 . . . . . . . 405.4. Illustration of the minimum in the absorbance spectrum 1 . . . . . 425.5. Illustration of the minimum in the absorbance spectrum 2 . . . . . 435.6. Illustration of the systematic error in the attenuation length 1 . . . 435.7. Illustration of the systematic error in the attenuation length 2 . . . 455.8. Illustration of the systematic error in the attenuation length 3 . . . 465.9. Attenuation spectra of different LAB . . . . . . . . . . . . . . . . . 485.10. Attenuation spectra of different n - paraffins . . . . . . . . . . . . . 495.11. Attenuation spectra of MU scintillator with different LAB . . . . . 535.12. Attenuation spectra of different mineral oil . . . . . . . . . . . . . . 555.13. Attenuation spectra of different buffer liquids. . . . . . . . . . . . . 565.14. Attenuation spectra of the final MU scintillator in Chooz . . . . . . 605.15. Attenuation spectra of the final buffer liquid in Chooz . . . . . . . . 61
6.1. Experimental setup of the light yield measurement . . . . . . . . . 656.2. Scintillator cell used for the light yield measurements . . . . . . . . 666.3. Block diagram of electronics used for the light yield measurement . 676.4. Energy spectrum of a typical light yield measurement . . . . . . . . 706.5. Light yield of the MU scintillator depending on PPO concentration 72
111

List of Figures
7.1. Elastic scattering . . . . . . . . . . . . . . . . . . . . . . . . . . . . 777.2. Top view of the MLL accelerator facility in Garching. . . . . . . . . 787.3. Sketch of the experimental setup for the QF measurement . . . . . 797.4. The experimental setup for the measurement of the proton - QF . . 807.5. Wiring scheme of the VME - based modules and the PMT . . . . . . 817.6. Typical ToF-spectrum . . . . . . . . . . . . . . . . . . . . . . . . . 837.7. Pulse height spectrum of the scintillator irradiated with 137Cs . . . 857.8. Pulse height spectrum of the scintillator irradiated with 22Na . . . . 857.9. The calibration points of the liquid scintillator . . . . . . . . . . . . 867.10. ToF - spectrum after the calibration of the axis . . . . . . . . . . . . 867.11. Pulse shapes of different particles . . . . . . . . . . . . . . . . . . . 877.12. Neutron - γ discrimination plot 1 . . . . . . . . . . . . . . . . . . . . 887.13. Neutron - γ discrimination histogram . . . . . . . . . . . . . . . . . 897.14. Neutron - γ discrimination plot 2 . . . . . . . . . . . . . . . . . . . . 897.15. Distributions of the ratio of event rates in short and long integration
gate due to electron and proton recoils . . . . . . . . . . . . . . . . 917.16. Illustration of neutron - γ discrimination capability on a 1 σ - level . 917.17. Histogram of the cut on the prominent neutron peak . . . . . . . . 937.18. The maximum scintillation energy of the 10.6MeV neutrons in the
ToF - plot . . . . . . . . . . . . . . . . . . . . . . . . . . . . . . . . 937.19. Simulated pulse height distribution with constant QF . . . . . . . . 967.20. Simulated pulse height distribution with an energy dependent QF . 99
112

List of Tables
2.1. Neutrino sources with the neutrino type, energy, baseline and sensi-tivity . . . . . . . . . . . . . . . . . . . . . . . . . . . . . . . . . . . 7
2.2. Current values of the neutrino oscillation parameters . . . . . . . . 8
4.1. Properties of LAB . . . . . . . . . . . . . . . . . . . . . . . . . . . 254.2. LAB from different companies . . . . . . . . . . . . . . . . . . . . . 264.3. Properties of n - paraffins . . . . . . . . . . . . . . . . . . . . . . . . 274.4. N - paraffins from different companies . . . . . . . . . . . . . . . . . 274.5. Properties of PPO . . . . . . . . . . . . . . . . . . . . . . . . . . . 284.6. Properties of bisMSB . . . . . . . . . . . . . . . . . . . . . . . . . . 294.7. Properties of the mineral oils Ondina 909 and 917 . . . . . . . . . . 314.8. Final composition of the DC MU scintillator and the buffer liquid . 32
5.1. Attenuation lengths of different LAB . . . . . . . . . . . . . . . . . 505.2. Attenuation lengths of different n - paraffins . . . . . . . . . . . . . 505.3. Attenuation lengths of MU scintillator with different PPO concen-
trations . . . . . . . . . . . . . . . . . . . . . . . . . . . . . . . . . 525.4. Attenuation lengths of MU scintillator with different LAB . . . . . 525.5. Attenuation lengths of different mineral oil . . . . . . . . . . . . . . 575.6. Attenuation lengths of different buffer liquids . . . . . . . . . . . . . 575.7. Attenuation lengths of the LAB samples from Chooz . . . . . . . . 585.8. Attenuation lengths of the mineral oil from Chooz . . . . . . . . . . 595.9. Attenuation lengths of the final MU scintillator from Chooz . . . . 595.10. Attenuation lengths of the final buffer liquid in Chooz . . . . . . . . 61
6.1. Electronic devices used in the light yield measurements . . . . . . . 686.2. Technical specifications of the PMTs of the light yield measurement 686.3. Light yield of the MU scintillator with varying PPO concentration . 726.4. Light yield of different samples . . . . . . . . . . . . . . . . . . . . 74
7.1. Electronic devices used for the proton - quenching measurement . . . 827.2. Sources used for the calibration in the QF measurement . . . . . . . 837.3. QF at different energies . . . . . . . . . . . . . . . . . . . . . . . . . 98
B.1. Attenuation lengths of the final liquids from Chooz . . . . . . . . . 109
113

List of Tables
114

Bibliography
[1] L. Bergstrom and A. Goobar. Cosmology and particle astrophysics. Springer-Verlag, New York, Berlin, Heidelberg, 2nd edition, 2008.
[2] F. Halzen and A. D. Martin. Quarks and leptons. John Wiley and sons, 1984.
[3] N. Schmitz. Neutrinophysik. Teubner-Verlag, Stuttgart, 1997.
[4] C. L. Cowan et al.. Detection of the Free Neutrino: a Confirmation. Science,(124, 103), 1956.
[5] R. Davis et al.. Search for neutrinos from the sun. Phys. Rev. Lett., (20, 1205),1968.
[6] P. Anselmann et al.. Solar neutrinos observed by GALLEX at Gran Sasso.Phys. Lett., (B 285, 376), 1992.
[7] M. Ishitsuka for the Super-Kamiokande collaboration. Super-Kamiokande re-sults: atmospheric and solar neutrinos. E-print arXiv:physics/0404071v2.
[8] Q. R. Ahmad et al.. Direct evidence for neutrino flavour transformation fromneutral-current interactions in the Sudbury Neutrino Observatory, 2001. E-print arXiv:nucl-ex/0204008 and arXiv:nucl-ex/0204009.
[9] Double Chooz Collaboration. A Search for the Neutrino Mixing Angle θ13,2006. E-print arXiv:hep-ex/0606025v4.
[10] M. Apollonio et al.. Limits on neutrino oscillations from the Chooz experiment.Phys. Lett. B., (466, 415), 1999. E-print arXiv:hep-ex/9907037.
[11] K. Nakamura et al.. The Review of Particle Physics. J. Phys., (G 37, 075021),2010. http://pdg.lbl.gov.
[12] C. Giunti. Theory of neutrino oscillations, 2004. E-print arXiv:hep-ph/0409230.
[13] S.M. Bilenky and B. Pontecorvo. Lepton mixing and neutrino oscillations.Phys. Rept., (41, 225), 1978.
[14] B. Kayser. Neutrino physics, 2005. E-print arXiv:hep-ph/0506165v1.
115

Bibliography
[15] S.M. Bilenky, C. Giunti, and W. Grimus. Long-baseline neutrino oscillationexperiments and CP violation in the lepton sector. 1997. E-print arXiv:hep-ph/9712537v1.
[16] M. Fukugita and T. Yanagida. Physics of Neutrinos and Applications to As-trophysics. Springer Verlag, 2003.
[17] F. Suekane et al.. An overview of the KamLAND 1-kiloton liquid scintillator.E-print arXiv:hep-ex/0406076.
[18] M.H. Ahn et al.. Measurement of neutrino oscillation by the K2K experiment.Phys. Rev., (D74, 072003), 2006. E-print arXiv:hep-ph/0606032v3.
[19] MINOS collaboration. Preliminary results from MINOS on νµ disappearancebased on an exposure of 2.5·1020 120GeV protons on the NuMI target. E-printarXiv:hep-ph/07081495v2.
[20] M. Guler et al.., 2000. CERN/SPSC 2000-028.
[21] Y. Oyama. Results from K2K and status of T2K. E-print arXiv:hep-ex/05012041v2.
[22] O. Mena Requejo et al.. Super-NOνA: A long-baseline neutrino experimentwith two off-axis detectors. Phys. Rev., (D 72), 2005. E-print arXiv:hep-ph/0504015.
[23] G. Alimonti et al.. The Borexino detector at the Laboratori Nazionali delGran Sasso. Nucl. Instr. and Meth. in Phys. Res. A, (600, 568-593), 2009.
[24] G. L. Fogli, E. Lisi, A. Marrone, A. Palazzo, and A. M. Rotunno. Neutrinooscillations, global analysis and ϑ13, 2009. E-print arXiv:hep-ph/0905.3549v2.
[25] A. Merle and W. Rodejohann. The Elements of the Neutrino Mass Matrix:Allowed Ranges and Implications of Texture Zeros. 2006. E-print arXiv:hep-ph/0603111.
[26] M. Mezzetto. Physics potential of the spl super beam. J. Phys., (G 29, 1781-1784), 2003. E-print arXiv:hep-ex/0302005.
[27] K. Hagiwara et al.. Solving the neutrino parameter degeneracy by measuringthe T2K off-axis beam in Korea. Phys. Lett., (B 637, 266-273), 2006. E-printarXiv:hep-ph/0504061.
[28] P. Huber et al.. Reactor neutrino experiments compared to superbeams. Nucl.Phys., (B 665, 487), 2003. E-print arXiv:hep-ph/0303232v2.
[29] L. Oberauer. Search for ϑ13 with reactor experiments. Prog. Part. Nucl. Phys.,(57,127), 2006.
116

Bibliography
[30] S.M. Bilenky, D. Nicolo, and S.T. Petcov. Constraints on |Ue3|2 from a three-
neutrino oscillation analysis of the CHOOZ data. Phys. Lett., (B 538, 77),2002. E-print arXiv:hep-ph/0112216.
[31] http://irfu.cea.fr/images/aslmg/2656 1.jpg, 2010.
[32] S. Berridge et al.. Proposal for U.S. participation in DOUBLE CHOOZ: Anew ϑ13 experiment at the Chooz reactor. E-print: arXiv:hep-ex/0410081.
[33] V. Zimmer. Development of a muon track reconstruction with the inner vetoof Double Chooz. Diploma thesis, Technische Universitat Munchen, 2010.
[34] M. Apollonio et al.. Search for neutrino oscillations on a long baseline at theCHOOZ nuclear power station. Eur. Phys. J., (C 27, 331), 2003. arXiv:hep-ex/0301017.
[35] J. B. Birks. Scintillation Counters. Pergamon Press, London, 1953.
[36] W. R. Leo. Techniques for Nuclear and Particle Physics Experiments. SpringerVerlag, Berlin, 1987.
[37] T. Marrodan Undagoitia. Measurement of light emission in organic liquidscintillators and studies towards the search for proton decay in the future large-scale detector LENA. PhD thesis, Technische Universitat Munchen, 2008.
[38] T. Forster. Fluoreszenz organischer Verbindungen. Vandenboeck undRuprecht in Gottingen, 1950.
[39] C. E. Mortimer and U. Muller. Das Basiswissen der Chemie. Georg Thieme-Verlag, 8th edition, 2003.
[40] J. R. Lakowicz. Principles of fluorescence spectroscopy. Springer Verlag, 2ndedition.
[41] A. Jablonski. Z. Phys., (94, 38), 1935.
[42] G. F. Knoll. Radiation Detection and Measurement. Wiley, 1989.
[43] C. Grupen. Teilchendetektoren. BI Wissenschaftsverlag, 1993.
[44] H. Morrison and G. Pandey. Singlet excited-state ”energy hopping” in alkyl-benzenes. Chem. Phys. Lett., (1, 96).
[45] T. Forster. Discuss. Farady Soc., (27, 7), 1959.
[46] C. Buck, F. X. Hartmann, D. Motta, and S. Schoenert. Energy transfer andlight yield properties of a new highly loaded indium(III) β-diketonate organicscintillator system. Chem. Phys. Lett., (435, 252-256), 2007.
117
Bibliography
[47] Th. Jagemann, F.v. Feilitzsch, and J. Jochum. Measurement of the scintil-lation light quenching at room temperature of sodium recoils in NaI(Tl) andhydrogen recoils in NE 213 by the scattering of neutrons. Nucl. Inst. andMeth. in Phys. Res., (A 564, 549-558), 2006.
[48] http://www.helmag.com/de, 2010.
[49] http://www.cepsa.com/, 2010.
[50] EG Sicherheitsdatenblatt - Linear-Alkylbenzol, 2009.
[51] Material safety data sheet - Linear Alkylbenzene Petrelab 550-Q (P 550-Q),2007.
[52] http://www.hansachemie.eu/de, 2010.
[53] A. Rockl. Test and Installation of Level Measurement Systems for the DoubleChooz Experiment. Diploma thesis, Technische Universitat Munchen, 2010.
[54] Produktdatenblatt - Cobersol C 70, 2008.
[55] Sheet of Typicalproperties - Petrepar n-C14, 2008.
[56] http://www.cbr-online.de, 2010.
[57] 2010. http://www.perkinelmer.com/.
[58] Material safety data sheet - PPO, 2004. http://www.perkinelmer.com/.
[59] M. Wurm. Untersuchungen zu den optischen Eigenschaften eines auf PXEbasierenden Flussigszintillators und zum Nachweis von ”Supernova Relic Neu-trinos” mit dem zukunftigen Neutrinodetektor LENA. Diploma thesis, Tech-nische Universitat Munchen, 2005.
[60] Material safety data sheet - bisMSB, 2004. http://www.perkinelmer.com/.
[61] Material safety data sheet - Shell Ondina oil 909, 2010.http://www.epc.shell.com/.
[62] Material safety data sheet - Shell Ondina oil 917, 2010.http://www.epc.shell.com/.
[63] H.-L. Xiao and J.-S. Deng. Oxygen quenching in LAB based liquid scintillatorand nitrogen bubbling model. Chinese Physics, (C, 34, 5), 2009. E-printarXiv:nucl-ex/0904.1329v4.
[64] W. Demtroder. Experimentalphysik 2, Elektrizitat und Optik. Springer Verlag,5th edition.
118

Bibliography
[65] M. Hesse, H. Meier, and B. Zeeh. Spektroskopische Methoden in der organis-chen Chemie. Georg Thieme-Verlag, 7th edition, 2005.
[66] J. M. Hollas. Moderne Methoden in der Spektroskopie. Vieweg-Verlag, 1995.
[67] E. W. Otten. Repetitorium Experimentalphysik fur Vordiplom und Zwis-chenprufung. Springer Verlag, Berlin, 2002.
[68] M. Wurm et. al.. Optical Scattering Lengths in Large Liquid-Scintillator Neu-trino Detectors. Rev. of Scient. Instr., (81, 5, 053301), 2010.
[69] C. Aberle. Optimierung der Fluoreszenzcharakteristik von Flussigszintilla-toren des Double Chooz Reaktorneutrinoexperiments. Diploma thesis, Max-Planck-Institut fur Kernphysik Heidelberg, 2008.
[70] P. Huang et al.. Study of attenuation length of linear alkyl benzene as LSsolvent, 2010. E-print: http://iopscience.iop.org/1748-0221/5/08/P08007.
[71] P. Pfahler. Bestimmung der absoluten Lichtausbeute des Flussigszintilla-tors fur die ausseren Detektorkomponenten des Neutrinoexperiments DoubleChooz. Diploma thesis, Technische Universitat Munchen, 2007.
[72] Electron Tubes Ltd. 25 mm (1”) photomultiplier 9111B series data sheet,2009. http://www.electrontubes.com/pdf/9111B.pdf.
[73] G. Alimonti et al.. Light propagation in a large volume liquid scintillator.Nucl. Instr. and Meth. in Phys. Res. A, (440, 360), 2000.
[74] R. Strauss. Quenching Factor Measurements of CaWO4 at mK Tempera-tures by Neutron Scattering for the Dark Matter Experiments CRESST andEURECA. Diploma thesis, Technische Universitat Munchen, 2009.
[75] C. Ciemniak. PhD thesis, Technische Universitat Munchen. in preparation.
[76] http://www.item24.com, 2010.
[77] Firestone (Editor). Table of Isotopes. John Wiley & Sons, 8th edition, 1996.
[78] M. J. Berger, J.S Coursey, M. A. Zucker, and J. Chang. Computer programsfor calculating stopping-power and range tables for electrons, protons, andhelium ions. Online available: http://physics.nist.gov/Star [2010, October].National Institute of Standards and Technology, Gaithersburg, MD.
[79] B. Di Cesare. Calculation of the Birks quenching factor for Borexino’s scintil-lator. talk, 2008.
[80] J. F. Beacom, W. M. Farr, and P. Vogl. Detection of Supernova Neutrinos byNeutrino - Proton Elastic Scattering, 2002. E-print arXiv:hep-ph/0205220v1.
119

Bibliography
[81] Mollenberg, R. Monte Carlo Study of the Fast Neutron Background in LENA.Diploma thesis, Technische Universitat Munchen.
[82] P. Huber, M. Lindner, M. Rolinec, T. Schwetz, and W. Winter. Combinedpotential of future long-baseline and reactor experiments. 2004. E-printarXiv:hep-ph/0412133.
[83] E. Condon. Phys. Rev., (28, 1182), 1926.
[84] J. Franck and E. G. Dymond. Trans. Faraday Soc., (21, 536), 1926.
[85] T. Jagemann. Measurement of the Scintillation Light Quenching for NuclearRecoils induced by Neutron Scattering in Detectors for Dark Matter Particles.PhD thesis, Technische Universitat Munchen, 2004.
[86] H. V. Klapdor-Kleingrothaus and K. Zuber. Teilchenastrophysik. Teubner-Verlag, Stuttgart, 1997.
[87] M. Hofmann. Low-background gamma spectroscopy for the neutrino oscilla-tion experiment DOUBLE CHOOZ. Diploma thesis, Technische UniversitatMunchen, 2007.
[88] L. Kirkup and B. Frenkel. An Introduction to Uncertainty in Measurement.Camebridge University Press, 2006.
120

Danksagung
Zu Beginn mochte ich Prof. Franz von Feilitzsch dafur danken, dass er mich furdie Astroteilchenphysik begeistert hat und mich so freundlich an seinem Lehrstuhlaufnahm.
Prof. Lothar Oberauer danke ich sehr fur die Moglichkeit zu dieser interessan-ten Diplomarbeit. Ich mochte mich dafur bedanken, dass er sich stets fur denFortschritt der Arbeit interessiert hat und mir mit Rat und Tat zur Seite stand.Seine freundliche Art hat maßgeblich dazu beigetragen, dass mir das vergangeneJahr in sehr guter Erinnerung bleiben wird.
Auch danke ich Prof. Tobias Lachenmaier und Dr.Walter Potzel fur Ihr Interessean meiner Arbeit und dafur, dass sie stets ein offenes Ohr fur meine Fragen hatten.
Ich mochte mich bei Dr.Honghanh Trinhthi bedanken, die mich im Umgang mitSzintillatoren vertraut gemacht und mir sehr viel beigebracht hat. Die Zusamme-narbeit am Spektrometer, das Mischen bei Wacker Chemie und die Zeit in Choozhaben mir sehr gefallen. Vielen Dank fur die Hilfe und die schone Zeit.
Sonja Kraus und Maria Bremberger danke ich fur ihre stets freundliche Unter-stutzung und ihre herzliche Art.
Großer Dank auch an meine Burokollegen fur das erstklassige Arbeitsklima:Martin Hofmann danke ich insbesondere fur die ausgiebigen Diskussionen undVerbesserungsvorschlage zu dieser Arbeit.Bei Achim Gutlein mochte ich mich fur seine engagierte Hilfe bedanken und dafur,dass er mir mit seinen C++ Kenntnissen zur Seite stand.Ich danke Nils Haag fur seine liebe Unterstutzung sowie die sorgfaltige Durchsichtder Arbeit.Auch Randolph Mollenberg mochte ich sehr fur seine Hilfsbereitschaft danken.
Großer Dank geht außerdem an Christian Ciemniak und Raimund Strauss, die mirdie Messungen am MLL ermoglicht haben. Die Strahlzeiten mit Euch haben mirsehr viel Spass gemacht. Vielen Dank fur Eure große Hilfe bei den Messungen undder Auswertung sowie dafur, dass Ihr Euch immer Zeit fur mich genommen undmir so viel beigebracht habt.Hinsichtlich der Neutronen Messungen war auch Stephan Wawoczny als Werkstu-
121

Bibliography
dent eine große Hilfe, weshalb auch ihm mein Dank gilt.
Ich mochte mich bei Timo Lewke fur seine Unterstutzung vor allem hinsichtlichder Lichtausbeutemessungen bedanken.
Ich danke Dr.Michael Wurm fur viele wichtige Diskussionen rund um die Ab-schwachlangenmessungen.
Großer Dank gilt auch Herrn Hagn, der dank seiner großen Einsatzbereitschaft undseiner immensen Kenntnisse im Bereich der Elektronik eine entscheidende Hilfe war.
Mike Willers danke ich besonders dafur, dass er rund um die Uhr jegliche Art vonComputerhilfe gab.
Bei Patrick Pfahler, Nils Haag und Anton Rockl mochte ich mich außerdem fureine sehr schone Zeit in Chooz bedanken.
Vincenz Zimmer und Andreas Zoller danke ich fur die Hilfe bei kleineren undgroßeren Problemen in der Aufschreibphase und die Motivation.
Ich danke dem Werkstattteam Harald Hess, Erich Seitz und Thomas Richter furihren bedeutenden Beitrag an den experimentellen Aufbauten.
Allen Mitgliedern des Lehrstuhls E15, auch den namentlich hier nicht aufgefuhrten,gilt mein besonderer Dank fur die wertvollen sowie lehrreichen Gesprache und ihregroße Hilfsbereitschaft. Sehr gefallen hat mir die angenehme Arbeitsatmosphare,die auch zu vielen schonen Freizeitaktivitaten gefuhrt hat.
Zu guter Letzt mochte ich meiner Familie danken, insbesondere meinen Eltern,die mir dieses Studium ermoglicht und mich auf ganzer Linie unterstutzt haben.Ebenso danke ich meinem Freund Thorsten Orendt dafur, dass er mich auf meinemWeg begleitet und bestarkt hat.
122