Embed Size (px)
Citation preview
Realism in Messiaen’s Oiseaux Exotiques: A Correlation
Analysis
Professor Marcus Pendergrass, Jahangir Iqbal
April 1, 2013
1 Introduction
One of the most famous composers of the 20th century, Olivier Messiaen, drew some of his
greatest inspirations from birds. Messiaen, a devout Catholic throughout his life, saw birds
as perhaps the greatest musicians with abilities that seemed divinely endowed. He studied
birds from all around the world and captured some of their magic in the form of musical
transcriptions in his work which he claimed to be “parfaitement authentiques”[2]. In fact,
while most musicologists agree that some of Messiaen’s compositions do bear striking
artistic similarities to real birdsongs, there has been little in the way of substantiating
Messiaen’s claim with rigorous analysis to quantify such claims. The research presented in
this paper aims to do just that. In essence, it focuses on testing several sections of Olivier
Messiaen’s Oiseaux Exotiques by comparing specific musical transcriptions in it to actual
birdsong recordings that were used to compose those pieces. This project aims to extend
upon the research done on the same subject by a musicology professor and a Messiaen
scholar at Cornell University, Dr. Robert Fallon. It does this by employing a much more
mathematical approach to quantitatively measure and evaluate the correlations that may
arise between the birdsong and the music.
This research project had two distinct phases of progression. The first phase was a ten
week long summer project that dealt with much of the preliminary research on Messiaen,
his music, and his fascination with birdsong. During the summer, a lot of the algorithms
that are used to analyze, graphically represent, and quantify the similarities between the
1

birdsongs and snippets of Messiaen’s music were programmed using Matlab. At the end
of the ten weeks, a lot of progress had been made in quantifying the similarities between
the snippets of music and the corresponding birdsongs; these pairings are termed “Fallon
Pairings” since they were originally notated in the The Record of Realism in Messiaen’s
Bird Style, the article published by Fallon which served as the inspiration and basis for
this project. However, mainly due to constraints of time, rigorous tests for statistical
significance were not completed for all of the seven Fallon pairings. Near the end of the
summer phase of this research, there were also many ideas on how this research could be
taken further; particularly how the analysis could be made more thorough, faster, and in
a sense more automated. The second phase of this research project took the form of an
independent study with Dr. Pendergrass and it focused on making the analysis section
better and faster. It also addressed the unanswered questions of statistical significance left
over from the summer phase of the research.
2 Methodology
The following sections give a general overview of the progression of this research and the
specific kinds of analyses performed. Since the some of the approaches were different
during the summer phase versus the independent phase of this research project, it makes
sense to also address these differences in this section. This will help to give the reader an
understanding of how the research methodology progressed.
2.1 Fallon Pairings
One of the first goals was to locate specific sections of Messiaen’s music which could be
correlated with birdsong. Since these sections represented musical transcriptions of the
birdsongs as composed by Messiaen, they had to have been inspired from actual bird-
song. The thesis of this project was to determine how good Messiaen was at capturing
the musical phenomenon of birdsong in his music. The article by Fallon mentioned in the
introduction was instrumental in helping to locate specific sections of Messiaen’s music in
Oiseaux Exotiques that clearly corresponded to birdsongs. To access the original birdsongs
used by Messiaen, the Lab of Ornithology at Cornell University was contacted. This lab
2
graciously provided the whole birdsong album, American Bird Songs (1942), that was used
by Messiaen during his composing. The fact that the same recordings that Messiaen used
were used in this research project as well is very important as birdsongs evolve and change
from generation to generation. While the album was useful to hear because it contained
the complete birdsongs, we only needed small sections of the birdsongs. Fortunately the
actual snippets of birdsongs from this album that were used by Fallon, were found on-
line at “www.oliviermessiaen.org”. Thus, this project’s goal of finding suitable pairings of
music and birdsong to compare was solved entirely by Dr. Fallon’s research. Naturally
these pairings are referred throughout this paper as Fallon pairings. The next goal was
to transform the Fallon pairings into a sort of raw data that could be analyzed mathe-
matically. This was done, in a great part, using Matlab. In Matlab the birdsongs were
read in using the waveread function. For the corresponding musical snippets two different
approaches were taken as to how they were read into Matlab. During the summer phase
the musical snippets were “built” from the composer’s conductor sheet in Netbeans using
the Java package BarebonesMusic written by Professor Pendergrass. The music was built
to remove orchestral noise in the recording which might affect the possible correlations
between the music and the birdsongs. However this method was very time consuming.
During the independent study actual musical snippets from the orchestral recording were
read into Matlab. This method was much faster, although it contained background noise
which probably detracted from the correlation values. Dr. Fallon’s work was the starting
point of this research as it provided the pairings of the music and birdsong which serve as
the focus of this research. Despite mirroring Dr. Fallon’s work in some ways, this research
was also different in a key way: mathematical and strictly objective means are adopted to
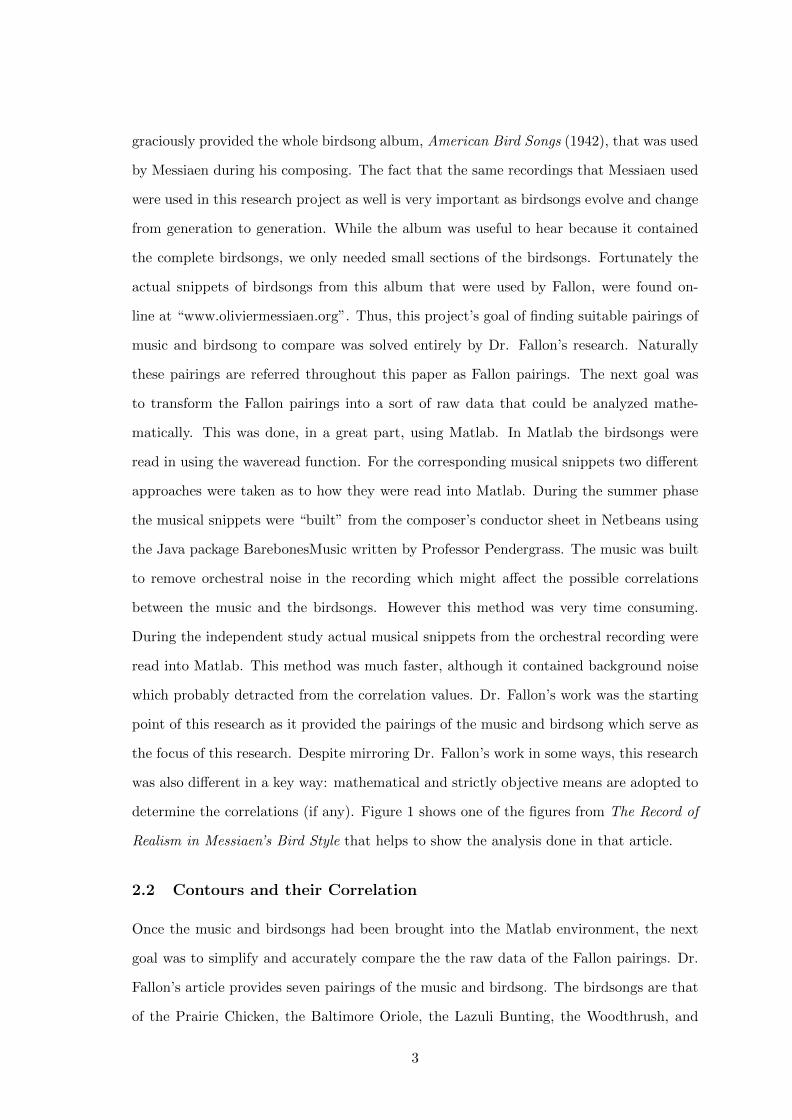
determine the correlations (if any). Figure 1 shows one of the figures from The Record of
Realism in Messiaen’s Bird Style that helps to show the analysis done in that article.
2.2 Contours and their Correlation
Once the music and birdsongs had been brought into the Matlab environment, the next
goal was to simplify and accurately compare the the raw data of the Fallon pairings. Dr.
Fallon’s article provides seven pairings of the music and birdsong. The birdsongs are that
of the Prairie Chicken, the Baltimore Oriole, the Lazuli Bunting, the Woodthrush, and
3
Figure 1: This figure highlights the similarities found between Messiaen’s music on theWood Thrush and the actual birdsong. Dr. Fallon points out frequencies similaritiesbetween the spectrogram and the music score [2]. In contrast, this research paper focuseson mathematically computing and comparing the contours of the music and the birdsongs.
the Cardinal (which had three distinct parts to its birdsong and thus three pairings). For
each birdsong and its corresponding music section, a time-frequency-energy spectrogram
is analyzed. The spectrogram is useful in extracting a “contour” for the birdsong. Dur-
ing the summer research, the contour for the corresponding piece of Messiaen music to
the birdsong was built based on the conductor’s score sheet for Oiseaux Exotiques. How-
ever this process of “building” a contour from music sheet was very time consuming and
one of the limiting factors during the summer phase. Therefore, during the independent
study phase of the research, a faster and more automatic method of obtaining the mu-
sic contour was written. This method was in effect just ”extracting” the music contour
from a orchestral recording of Oiseaux Exotiques. This way of ”extracting” the contour
from a recording perfectly mirrors how the contour for the birdsong is found. Figure 2
helps to illustrate this progression. These contours are important as they help to simplify
the time-frequency-energy spectrograms of the signals into one-dimensional vectors which
could effectively be tested for possible correlations. The three different methods by which
4

Figure 2: The process of deriving contours from the birdsong and from Messiaen’s music.The contours simplified the large frequency data, allowing it to be correlated with eachother. One of the key ways in which the independent study went forward from the summerresearch was employing a similar extraction method on the recording of Oiseaux Exotiquesas used for the birdsong. This allowed the music contours to be generated much morequickly, however there was also more background noise in the music contour.
the contours of a pairing are compared are centered correlation, uncentered correlation
and CSIM correlation. Uncentered correlation is a fairly common way of finding the angle
between two vectors or determining how close they are to each other. This correlation rests
on a very important theorem in mathematics, the Cauchy-Schwarz inequality, which will
be proven in the course of this paper. Centered correlation centers the contours to a mean
of zero before finding a correlation between them. The final method of correlating the two
vectors, CSIM correlation, is a method that is used in Music Theory when comparing the
contours of the two different pieces of music [1]. Thus, for each of the seven pairings of
birdsong with music signals, there are three different values of correlation that are derived.
2.3 Control Pairings
The results that are achieved through the correlation methods would be meaningless if
there is not something to compare or measure them up against. The method by which this
research takes into account the statistical significance of the results is by having certain
pairings which are determined to be the control. Due to restraints of time during the
summer part of the research and also because of the time-consuming process of “building”
5

the contours from a score sheet, it was not possible to compute the statistical significance
for all of the seven pairings. It was computed only for the Baltimore Oriole. The control
was set to be twenty random sections of music from Oiseaux Exotiques which were paired
with the Baltimore Oriole birdsong. Any section which contained transcriptions from the
Baltimore Oriole birdsong was carefully avoided. For each of these twenty pairings, the
three measures of correlation were calculated. In the end there were 21 pairings, (including
the one experimental result), for the Baltimore Oriole. The three values of correlation for
the experimental results were compared against those of the randomly chosen pairings
to determine statistical significance, (for the Baltimore Oriole). One of the main tasks
undertaken during the independent study phase of the this research was to compute the
statistical significance for each of the seven Fallon birdsong-music pairings. This was done
by choosing 100 random snippets of music from the orchestral recording and comparing
their values of uncentered correlation, centered correlation, and CSIM correlation to the
correlation values computed for the Fallon pairings. The algorithm of choosing random
pairings from the orchestral recording was carefully evaluated to make sure that it did
not choose snippets that overlapped with any of the music transcribed for specifically the
seven birds that are being focused on through the course of this study.
2.4 Methods and Tools
The great portion of this research revolved around coding up algorithms, classes and
functions in Matlab and Netbeans, and of course debugging. There was not a lot of
programming done in Java as a lot of previous code from the BareBonesMusic package
written by Professor Pendergrass was used. However there were two new classes that
were written in BareBonesMusic, ControlMeasures and MusicDemos, which dealt with
accessing and returning music contours. The bulk of coding was done in Matlab and the
Java packages were imported into Matlab via .jar files. Near the later half of this project, a
lot of the long spaghetti code was simplified into many different functions that preformed
specific tasks. For example the three similarity measures had their own specific functions;
there were functions written to extract the contours from the spectrograms of the birdsong
and build the contours from the music signal; another important function written was a
shifting function which stretched and shifted one contour with respect to the other to find
6

the best correlation between the two. Matlab was also very used to represent the results
in meaningful plots.
3 Mathematical Background
3.1 Time Frequency Analysis
A major mathematical topic that helped to lay the foundation for this project was Fourier
analysis. It might be useful to review the concept of what Fourier analysis is and how
it is used. Fourier analysis, named in recognition of the famous French mathematician
Joseph Fourier who helped to develop this vastly important field of mathematics, deals
with taking functions that are represented in the time domain and deriving a frequency-
domain representation for the signals/functions. This process works in the reverse also;
that is Fourier analysis can be used to extract the time-domain representation of a signal
from the frequency-domain representation. Taking a function of time and representing
it as a function of frequency is very useful, especially in the field of signal processing.
Through Fourier analysis one can take virtually any kind of complex waveform and break
it down into sums of simpler trigonometric functions. The mathematical transform that
performs Fourier analysis is called the Fourier transform and Matlab implements a very
efficient algorithm, FFT, which is able to compute the discrete Fourier transform of a
vector quickly. Below are the formulas used to compute the Fourier transform of a signal
and the Inverse Fourier transform, which can convert a function back to a time domain
representation from a frequency domain representation.
S(f) =
∫ ∞−∞
s(t)e−2πiftdt (1)
s(t) =
∫ ∞−∞
S(F )e2πiftdf (2)
The frequency-domain representation of a signal is often a complex valued function. While
the complex valued function is useful in many cases, often it is helpful to just determine
the energy of the various frequencies represented in the frequency-domain. The method
by which this is achieved is by taking the energy spectral density (ESD) of the function.
7

The ESD is a function of frequency that returns the energy present in a waveform due to
specific frequencies. So, if the waveform is a simple sinusoid with a constant frequency, all
of the energy of the waveform would be concentrated at that frequency. The formula for
finding the ESD of a function is as follows.
ESD(f) = |S(f)|2 = |∫ ∞−∞
s(t)e−2πiftdt|2 (3)
Where S(f) is a the frequency domain representation and s(t) is the time domain repre-
sentation.
Figure 3 shows the ESD of a basic sinusoid function. The formula for the energy
Figure 3: This figure shows a sine wave and its power spectrum. The Fourier transformof a function is often represented in this manner.
spectral density is derived through Parseval’s theorem. This theorem hints toward the
Fourier transform being unitary, which means that the square of the integral of a function
is equal to the square of the integral of the transform of that function. Thus, the amount
of energy in s(t) is equal to the energy in S(f).
Theorem 1 (Parseval’s Relation). Let s(t) be the time domain representation of a func-
8
tion, and S(f) be its frequency domain representation,
∫ ∞−∞
s2(t)dt =
∫ ∞−∞|S|2(f)df (4)
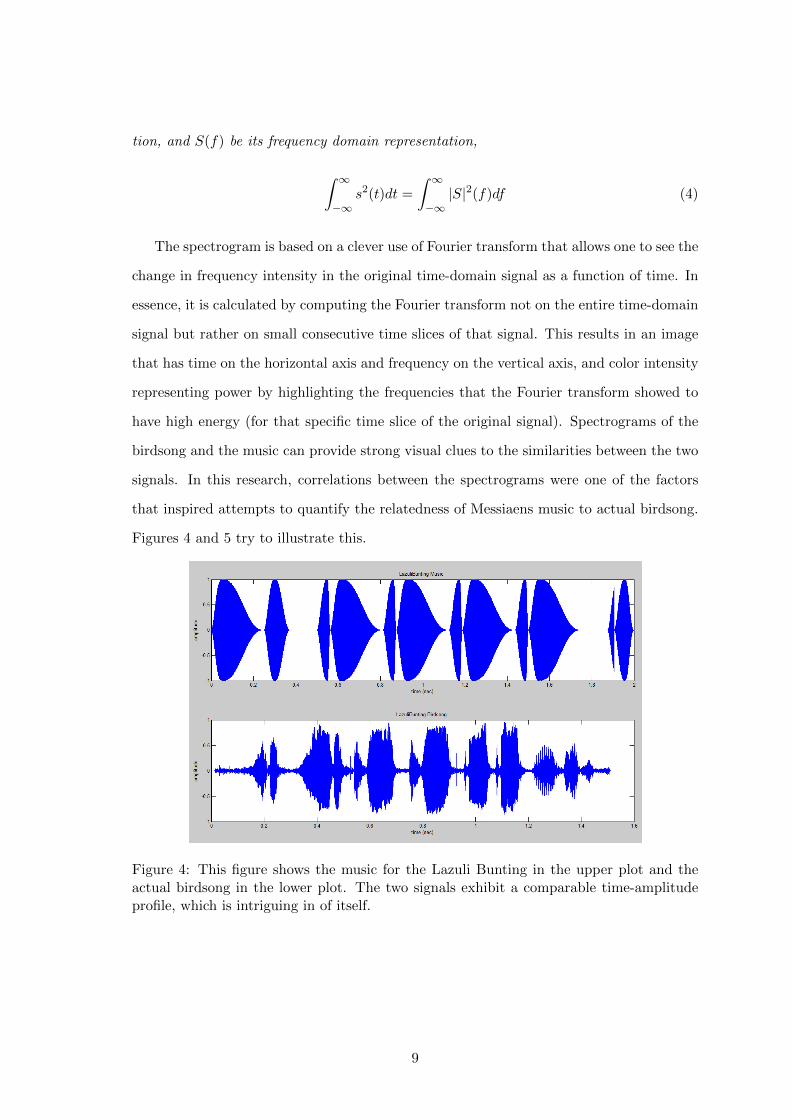
The spectrogram is based on a clever use of Fourier transform that allows one to see the
change in frequency intensity in the original time-domain signal as a function of time. In
essence, it is calculated by computing the Fourier transform not on the entire time-domain
signal but rather on small consecutive time slices of that signal. This results in an image
that has time on the horizontal axis and frequency on the vertical axis, and color intensity
representing power by highlighting the frequencies that the Fourier transform showed to
have high energy (for that specific time slice of the original signal). Spectrograms of the
birdsong and the music can provide strong visual clues to the similarities between the two
signals. In this research, correlations between the spectrograms were one of the factors
that inspired attempts to quantify the relatedness of Messiaens music to actual birdsong.
Figures 4 and 5 try to illustrate this.
Figure 4: This figure shows the music for the Lazuli Bunting in the upper plot and theactual birdsong in the lower plot. The two signals exhibit a comparable time-amplitudeprofile, which is intriguing in of itself.
9
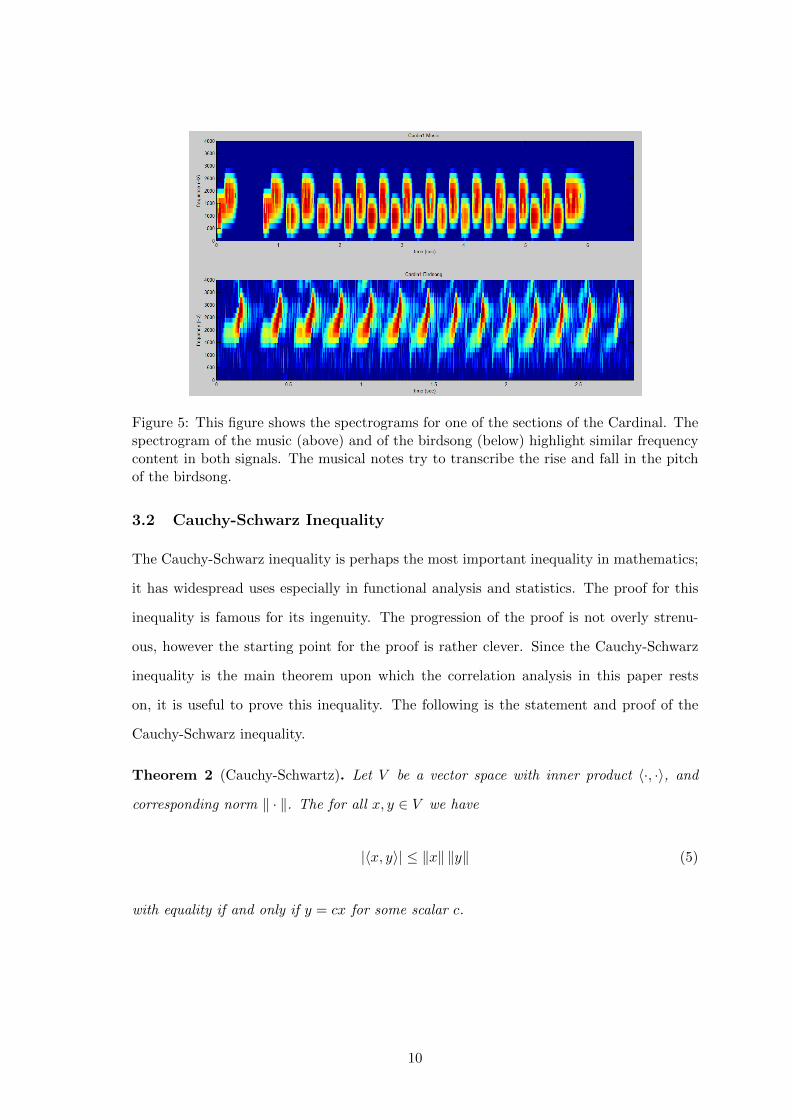
Figure 5: This figure shows the spectrograms for one of the sections of the Cardinal. Thespectrogram of the music (above) and of the birdsong (below) highlight similar frequencycontent in both signals. The musical notes try to transcribe the rise and fall in the pitchof the birdsong.
3.2 Cauchy-Schwarz Inequality
The Cauchy-Schwarz inequality is perhaps the most important inequality in mathematics;
it has widespread uses especially in functional analysis and statistics. The proof for this
inequality is famous for its ingenuity. The progression of the proof is not overly strenu-
ous, however the starting point for the proof is rather clever. Since the Cauchy-Schwarz
inequality is the main theorem upon which the correlation analysis in this paper rests
on, it is useful to prove this inequality. The following is the statement and proof of the
Cauchy-Schwarz inequality.
Theorem 2 (Cauchy-Schwartz). Let V be a vector space with inner product 〈·, ·〉, and
corresponding norm ‖ · ‖. The for all x, y ∈ V we have
|〈x, y〉| ≤ ‖x‖ ‖y‖ (5)
with equality if and only if y = cx for some scalar c.
10

Proof. In the trivial case in which x or y are zero:
|〈x, y〉| = ‖x‖ ‖y‖ = 0
Thus, the inequality holds in the trivial case.
Let x and y be non-zero vectors. Choose an arbitrary vector p(t) that is a function of
a scalar variable, t.
p(t) = tx+ y
Then, because the norm of any vector is greater than zero,
‖p(t)‖ = ‖tx+ y‖ ≥ 0
So
0 ≤ ‖p(t)‖2 = ‖tx+ y‖2
= 〈tx+ y, tx+ y〉
= t2〈x, x〉+ 2t〈x, y〉+ 〈y, y〉
= t2 ‖x‖2 + 2t〈x, y〉+ ‖y‖2 (6)
To make the substitutions simple, let
a = ‖x‖2
b = 2〈x, y〉
c = ‖y‖2
Then we have,
0 ≤ t2 ‖x‖2 + 2t〈x, y〉+ ‖y‖2
= at2 + bt+ c ≥ 0
Since the above quadratic in variable t is always greater than or equal to zero, the dis-
criminant is negative so we have
b2 − 4ac ≤ 0,
from which it follows that
4〈x, y〉2 ≤ 4 ‖x‖2 ‖y‖2 ,
11

and thus
|〈x, y〉| ≤ ‖x‖ ‖y‖ .
Now, we need only show that equality holds if and only if x = cy where c is a some
scaler.
Let x = cy, then the above analysis results in
|〈cy, y〉| ≤ ‖cy‖ ‖y‖
which simplifies to
|c||〈y, y〉| ≤ |c| ‖y‖2
|c| ‖y‖2 = |c| ‖y‖2
Thus, if x = cy then there is equality
Now assume an arbitrary case with equality,
|〈x, y〉| = ‖x‖ ‖y‖
Then, from the proof:
4〈x, y〉2 = 4 ‖x‖2 ‖y‖2
and with a, b, and c as previously defined
we have,
b2 − 4ac = 0
Then, by equation 6, only one real root since the discriminant is zero. Thus, the following
is zero with t0 being the real root.
〈t0x+ y, t0x+ y〉 = 0
From which, it follows
‖t0x+ y‖ = 0.
12
If the norm of a vector is zero, then the vector is zero.
t0x+ y = 0
This can be simplified with the value of t0 found from the quadratic mentioned above.
x =‖x‖2
〈x, y〉x
And thus,
x = cy
The vector x has to be colinear to y anytime there is equality in the Cauchy-Schwarz
Theorem. This is another of saying equality if and only if x = cy for some scaler c, can
there be equality. Thus the Cauchy-Schwarz inequality theorm has been proven including
its condition of equality.
3.3 Similarity Measures
The uncentered correlation between two vectors is based on the Cauchy-Schwarz inequality.
Through simple rules of trigonometry, this correlation can also be rewritten in another
form which shows the angle between the vectors. The uncentered correlation is derived
as follows from the Cauchy-Schwarz inequality 5: If x and y are vectors in a valid vector
space V ,
|〈x, y〉| ≤ ‖x‖ ‖y‖
|〈x, y〉|‖x‖ ‖y‖
≤ 1
−1 ≤ 〈x, y〉‖x‖ ‖y‖
≤ 1
The above formula shows that the uncentered correlation, 〈x,y〉‖x‖‖y‖ , will always be between
-1 and 1. The lower boundary represents the scenario in which the two vectors being
compared are anti-parrallel, and the upper boundary accounts for when the vectors are
co-linear. The definition for uncentered correlation described above can be represented
13

differently-as the angle between the two vectors.
cos θ =〈x, y〉‖x‖ ‖y‖
θ = arccos (〈x, y〉‖x‖ ‖y‖
)
It can be useful the view uncentered correlation between two vectors as the angle between
them, as that gives one an idea to how far apart they are from each other. In other words
a high uncentered correlation between two vectors suggests that they are very similar
geometrically. Uncentered correlation was the first mean by which contours of birdsong
and music were compared in this research project.
Centered correlation sometimes referred to as Pearson’s correlation coefficient is more of
a statistical measure of similarity. It is also based on using the Cauchy-Schwarz inequality
and therefore always between -1 and 1. However the main way in which it differs from
uncentered correlation is that it centers both vectors to a mean of zero before correlating
them. The Centered correlation between f and g is:
ρc =covariance(f, g)
σf ∗ σg=〈f − µf , g − µg〉‖f − µf‖ ‖g − µg‖
(7)
The Cauchy-Schwarz theorem also holds here so we can put a bound on ρc.
ρc ≤ 1,
with equality if and only if g(t)− µg = c(f(t)− µf ) for some scalar c.
Thus, another way to think about centered correlation is that ρc measures essentially
how well g can be approximated as a linear function of f ; at ρc = ±1 there is an exact
linear relationship between f and g and when ρc = 0, f and g have no linear relationship.
CSIM correlation is a measure of correlation between two musical contours, (which in this
context are the same as vectors). It is not related to uncentered correlation or centered
correlation, but rather it is based on how rises and falls in two contours compare to each
other. Laparde and Marvin in their paper ”Relating Musical Contours: Extensions of a
14

Theory for Contour” explain how retention and recognition of music often depends on an
invariant melodic contour, even if the ”size of the interval between successive pitches may
be altered”[1]. Although Laparde and Marvin cite several similarity measures in their
paper, the one we found to be most useful for our research was CSIM. The algorithm by
which CSIM works is as follows:
Let x and y be two vectors/contours. CSIM(x, y) returns a number between 0 and 1
that signifies the similarity between x and y; 1 being the contours being exactly the same.
Each contour is converted to COM-matrix, which is a matrix of dimensions the length
of the contour.Each unit of a COM-matrix for a contour c is the corresponding row-th
value of the c subtracted from the column-th value; thus a COM-matrix is just a matrix
filled positive and negative numbers with the diagonal being all zero. Just the signs of
the numbers in a COM-matrices are used in calculating the CSIM correlations between
two contours. The CSIM correlation counts the number of corresponding signs in the
COM-matrices of the contours and then divides that number by the maximum number of
similarities which is the size of the matrix.
4 Results
4.1 Fallon Pairings
The results of this research project were very substantial. At times they validated the
hypotheses we started out with and at times not so much. The results made us analyze our
methods of research very carefully to make sure we were doing exactly what we thought we
were doing. During the summer phase of this project the three correlation values between
the musical snippets and the birdsong in the seven Fallon pairings were encouraging and
helped to corroborate Dr. Fallon’s work. The results helped to make it clear that Messiaen
had undeniable talent as a musician who could take inspiration from birds. The following
figure helps to illustrate the results from the summer phase of this research in a meaningful
way.
As the bar graph shows, some pairings had higher correlations than others. In all the
cases, the uncentered correlations showed the highest similarities between the birdsong
and the music. The CSIM correlation generally yielded higher results than the centered
15
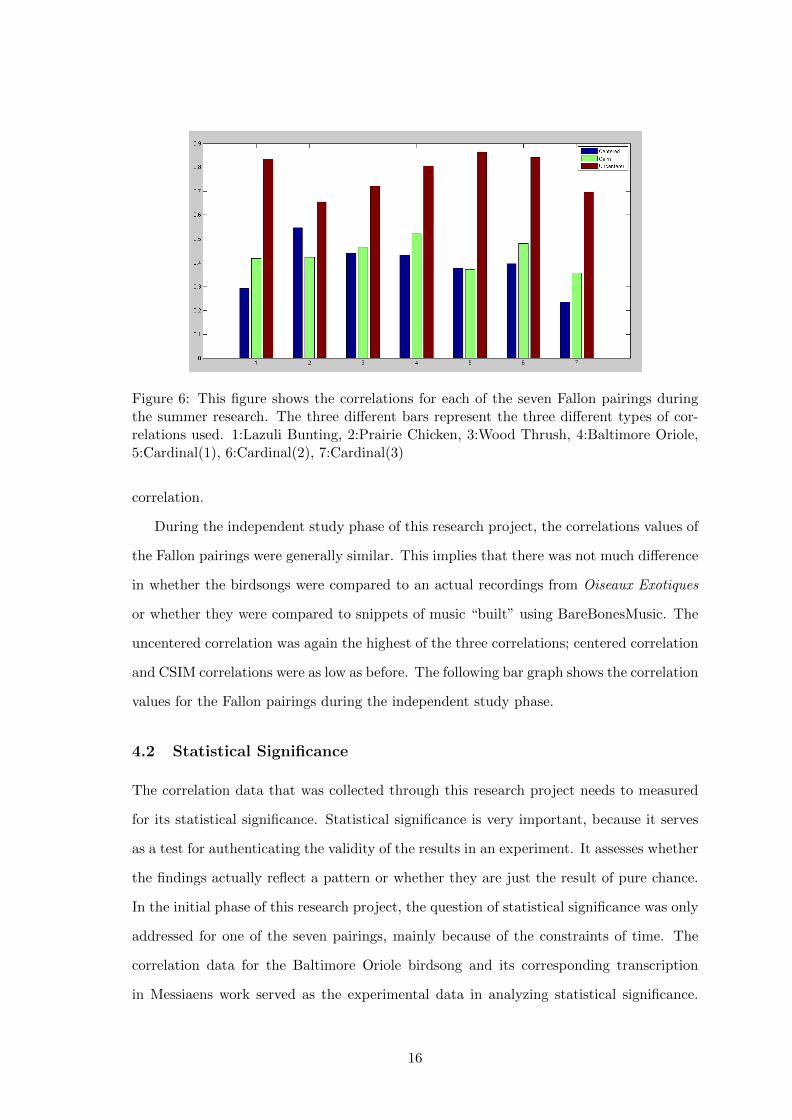
Figure 6: This figure shows the correlations for each of the seven Fallon pairings duringthe summer research. The three different bars represent the three different types of cor-relations used. 1:Lazuli Bunting, 2:Prairie Chicken, 3:Wood Thrush, 4:Baltimore Oriole,5:Cardinal(1), 6:Cardinal(2), 7:Cardinal(3)
correlation.
During the independent study phase of this research project, the correlations values of
the Fallon pairings were generally similar. This implies that there was not much difference
in whether the birdsongs were compared to an actual recordings from Oiseaux Exotiques
or whether they were compared to snippets of music “built” using BareBonesMusic. The
uncentered correlation was again the highest of the three correlations; centered correlation
and CSIM correlations were as low as before. The following bar graph shows the correlation
values for the Fallon pairings during the independent study phase.
4.2 Statistical Significance
The correlation data that was collected through this research project needs to measured
for its statistical significance. Statistical significance is very important, because it serves
as a test for authenticating the validity of the results in an experiment. It assesses whether
the findings actually reflect a pattern or whether they are just the result of pure chance.
In the initial phase of this research project, the question of statistical significance was only
addressed for one of the seven pairings, mainly because of the constraints of time. The
correlation data for the Baltimore Oriole birdsong and its corresponding transcription
in Messiaens work served as the experimental data in analyzing statistical significance.
16

Figure 7: This figure shows the correlations for five pairings. The three different bars rep-resent the three different types of correlations used. 1:Cardinal(1), 2:Cardinal(2), 3:Cardi-nal(3), 4: Wood Thrush, 4:Baltimore Oriole. It should be noted that during the summerphase, the musical snippets were built from the conductor’s score rather than just ex-tracted from the orchestral recording. This fact could have been one of the reasons whyduring the independent study phase the correlations were usually a little lower, becauseof background noise.
Twenty randomly chosen sections of music, (each of which didnt coincide with the Balti-
more Oriole section) from Oiseaux Exotiques were correlated against the birdsong for the
Baltimore Oriole. These twenty correlations served as the control, and they were “built”
from a score sheet rather than “extracted” from a recording the music. In this manner,
the experimental Baltimore Oriole pairing was measured against 20 control pairings to
highlight its statistical significance. Figure 7 helps to show this. The results of the sta-
tistical significance calculated for the Baltimore Oriole were very intriguing because they
turned out to be not as high as expected but nevertheless they were on the threshold of
a statistical significance. Such results suggested the need for further testing to ascertain
the remaining results of the summer project.
In the independent study phase, the issue of statistical significance was addressed more
thoroughly. Since the process of finding the control pairings was, in effect, automated, it
was possible to extract one hundred control pairings for each of seven (five as of right now)
Fallon pairings of music to birdsong. These controls shed more light on actually how well
the Fallon pairing compared to randomly chosen pairings. The following figure illustrates
the statistical significance of the Baltimore Oriole Fallon pairing vs the control pairings.
17

Figure 8: This figure illustrates the statistical significance for the Baltimore Oriole pairing.It shows 21 correlation values for each of the three correlation tests focused on in thispaper: Uncentered correlation, Centered correlation, CSIM correlation. The correlationvalue denoted by an asterisk represents the actual correlation for the Baltimore Oriolepairing.
5 Discussion/Conclusion
The statistical significance for the Baltimore Oriole pairing was not as high we would have
liked, but it was also not completely trivial. Looking back, its seems like there are several
factors that could have made the statistical significance for this research project better.
For one, more than just 20 random correlation values representing the control would have
given more accurate and possible better results. A bootstrapping analysis is a method
by which we could have used different controls to see if similar statistical significance
is achieved. Since the music piece for the Baltimore Oriole was the smallest of all the
other music pieces for the birds, it might have been easier to find other sections of music
randomly that seemed to relate to the Baltimore Oriole section. If a longer piece like the
Prairie Chicken had been chosen, it would have been harder to find sections of music that
resembled it. As has been mentioned above, one the reasons only the Baltimore Oriole was
chosen for statistical significance was because of constraints of time near the end of this
project. Another factor at play here was the mere fact that we chose our control pairings
from a Messiaen piece Oiseaux Exotiques that focused entirely on birdsongs, which means
that the randomly chosen control measures could have made the statistical significance
measurements much more stringent than necessary. We conjecture that had the control
18

Figure 9: This figure illustrates the statistical significance for the Baltimore Oriole pair-ing. It shows that a hundred control pairings were chosen in calculating the statisticalsignificance.
been set to another Messiaen piece that didn’t deal with birdsongs as extensively, such as
Quartet for the End of Time, the statistical significance would have been higher.
The main goal of this research project has been to find objective and quantitative
values of comparison between the natural birdsongs, that Olivier Messiaen so admired and
was openly known for using in the compositions of his music, and his music. It is already
well-known and accepted that clear similarities exist between the music and the birdsong
and hearing the music or viewing its frequency content in comparison to the birdsongs
certainly makes this clear also. However, approaching the same goal from a mathematical
standpoint makes finding comparisons a much more rigorous exercise. The correlation
values that were derived for the seven pairing of birdsong and music overall seemed high
enough to suggest that Messiaen was definitely inspired by the birdsongs he so admired.
An important distinction that should be noted is that Messiaen was an artist; he was not
looking to copy birdsongs into his music exactly, but rather he artistically portrayed them
in his work.
6 Acknowledgements
In no way would this research project would have been possible without the constant
guidance, help, and oversight of Professor Pendergrass. In addition, Dr. Fallon’s research
19

and previous work proved to be of immeasurable help towards our research goals. Lastly,
Ms. Tammy Bishop at the Lab of Ornithology was very helpful when we were trying to
find recordings of birdsong needed for the research.
References
[1] Paul Laprade, Elizabeth Marvin, Relating Musical Contours: Extension of a Theory
for Contour. Journal of Music Theory, Vol. 31, No.2, pp. 225-267, Autumn 1987.
[2] Robert Fallon, The Record of Realism in Messiaen’s Bird Style. “OLIVIER MESSI-
AEN: Music, Art and Literature”, Christopher Dingle and Nigel Simeone, Ashgate,
2007.
20