Embed Size (px)
Citation preview

REAL-TIME VELOCITY PROFILE GENERATION OF POWDER CONVEYING 27
Jurnal Teknologi, 35(D) Dis. 2001: 27–38© Universiti Teknologi Malaysia
REAL-TIME VELOCITY PROFILE GENERATION OF POWDERCONVEYING USING ELECTRODYNAMIC TRANSDUCER
MOHD FUA’AD RAHMAT1 & MOHD HEZRI FAZALUL RAHIMAN2
Abstract. This methodology explores the probability in determining the real-time velocityprofiles of a vertical and horizontal flow. Generally, the measurement is based on the electrostaticcharges produced by dry solid powder during their movement in the flow rig and accumulated atthe sensors’ electrode. Two arrays of dedicated electrodynamic sensors are used as static-to-electri-cal signal converter and they are located at the pipe wall. The sensors generated electrical signalcorresponding to the amount of flow it detects and this is based on the fact that the amount of flowcontributes to the level of the static charges accumulated at the sensors. The collected data isretrieved and manipulated by an application program, which is developed using Microsoft VisualBasic 6.0. The application features the ability to obtain velocity in real-time mode, which is previ-ously unrealisable.
Keywords: Tomography, electrodynamic, real-time, velocity profile, interfacing
Abstrak. Kaedah pengukuran tomografi ini bertujuan mengkaji pengukuran profil halajupengaliran dalam paip secara talian terus ataupun masa sebenar bagi pengaliran yang menegakdan melintang. Secara umumnya, pengukuran yang dibuat adalah berdasarkan cas elektrostatikyang dijana oleh hasil pergerakan serbuk pepejal kering di dalam paip. Pengumpulan cas-cas iniakan dikesan oleh dua rangkaian penderia elektrodinamik. Konsep asas yang digunakan olehpenderia-penderia ini adalah penukaran keamatan cas yang dihasilkan kepada magnitud voltanyang setara. Penderia-penderia ini akan ditempatkan di luar ukur lilit permukaan paip dan jarakantara dua rangkaian penderia ini telah ditetapkan. Isyarat-isyarat voltan yang dihasilkan olehpenderia akan disampel, dimanipulasi dan dipaparkan pada skrin komputer dengan programaplikasi yang dibangunkan melalui pengaturcaraan menggunakan Microsoft Visual Basic 6.0.Keupayaan utama aplikasi ini adalah kebolehannya mengintegrasikan sistem pengukuran ini dalammasa sebenar yang sebelum ini tidak dapat dilakukan.
Kata kunci: Tomografi, elektrodinamik, masa sebenar, profil halaju, antara muka
1.0 INTRODUCTION
The idea of signal processing with the cross correlation technique is not a newphenomena. Since 1930s, the theory has been developed, but is not used by theindustries until 1960s, in which a hardware called a correlator has been invented [2].The cross correlation technique to find the real-time velocity of a pipe flow has been
1 & 2 Department of Control and Instrumentation Engineering, Faculty of Electrical Engineering,Universiti Teknologi Malaysia, 81310 Skudai, Johor Bahru, Malaysia. Email: [email protected];[email protected].
Untitled-56 02/16/2007, 18:0427
MOHD FUA’AD RAHMAT & MOHD HEZRI FAZALUL RAHIMAN28
implemented in this paper. The flow is detected by two arrays of electrodynamicsensors which are axially spaced between them, in which the length of the space isknown, and will be interfaced with the computer via an interface board, KeithleyMetrabyte DAS-1800HC. This paper focuses on the software development to inter-act with the interface board and to acquire the data from the sensors, so that thecross correlation technique can manipulate data. The velocity of the vertical andhorizontal pipe flow can be calculated with the knowledge of the length of spacebetween the sensors with the time shift obtained from the peak of the cross correla-tion coefficient.
The electrodynamic sensor has a high spatial filtering bandwidth [6], which makesit a very useful for velocity determination [9]. It has limitations, which arise becauseof the tribo-electrification phenomena [5] so that the level of charge on a particle canvary depending upon material, size, shape, humidity et cetera [9]. All the systemsother than the electrical charge method have significant disadvantages whether it bedue to cost, physical size, sensor complexity or combinations of these factors. Theelectrodynamic sensor is considered the best solution even though it is ‘near sensordominant’ [4]. This means that the particles nearer to the electrode are giving ahigher weighting factor on the final average velocity reading (as with capacitancesensor). But this method complies with the requirement of a robust, small and lowcost sensor to measure flow velocity.
2.0 THE MEASUREMENT SYSTEM
The measurement system consists of two axially spaced arrays of electrodynamicsensors mounted on a 100 mm diameter steel pipe as shown in Figure 1. The sepa-ration between upstream and downstream sensors is set to 50 mm so that the sensor
Figure 1 Arrangement of the 32 Electrodynamic Sensors on a Metal Pipe
���������������������������������������������������������������������������������������������������������������������������������������������������������������������������������������������������������������������������
������������������������������������������������������������������������������������������������������������������������������������������������������������������������������������������������������������������������������
50 mm
Upstream
Downstream
100 mm
Flow
2
1
3 4 5 6 7 8 9
10 11 12 13 14 15 16
17
18 19 22 20 21 23 24
25 26 27 28 29 30 31 32
Untitled-56 02/16/2007, 18:0428

REAL-TIME VELOCITY PROFILE GENERATION OF POWDER CONVEYING 29
output can be correlated adequately. A small separation produces a high correlationcoefficient and accuracy, but requires high-speed data capturing and processing,vice-versa [1]. Figure 1 shows the arrangement of sensors on the pipe wall.
The sensor consists of an electrode with 3 mm in diameter, connected to thetransducer electronics. For the transducer block diagram, please refer to Figure 3[8]. Charged particles falling in the pipe induce charge in the electrode. The in-duced charge is converted into a voltage, which is then amplified approximately fivehundred times. The interface board will acquire the amplified voltages from all thethirty-two sensors at 1 kHz sampling rate.
The gravity flow rig diagram for vertical flow is shown in Figure 14 [8]. Solidmaterial is fed from the hopper into the down pipe via the variable speed screwfeeder at controlled rates. The solid particles are accelerated under gravity. Themovement of the particles will generate static charges and affect the measurementsection. Particles are collected by a material tank and sent back to the hopper by avacuum. In this paper, a horizontal flow rig is used and the experimental work is stillin progress. The horizontal flow rig is shown in Figure 2.
Figure 2 The Horizontal Flow Rig for Powder Conveying
Material Tank
From AirCompressor
VerticalMeasurementSection
HorizontalMeasurementSection
Legend:
Material Flow
Pressured Air Flow
Screw Feeder
Hopper
VacuumLoader
Variable Valve
Untitled-56 02/16/2007, 18:0429

MOHD FUA’AD RAHMAT & MOHD HEZRI FAZALUL RAHIMAN30
2.1 Image Reconstruction System Through Pixel ConcentrationTime Series Cross-correlation
This measurement determines the velocity profile within the measurement cross-section. Three hundred twelve sets of data (limited by the data acquisition system),each consisting of thirty-two measurements obtained by sampling all the sensors insequence, are collected. Each data set is captured within 1ms and processed using alinear back projection algorithm to generate an upstream and a down stream con-centration profile [8]. The electrodynamic sensors detect charge, so the resultingconcentration must relate to the total amount of charge being detected. However,for the tests carried out, it is assumed that for specific material all particles carry asimilar charge as the particles are of similar size and shape [9]. In the case of thegravity drop system the concentration output is calibrated against solids mass-flowrate because the particles have approximately the same velocity.
The concentration profile is represented by the concentration of individual pixelsmapped onto the pipe cross-section as shown in Figure 3 and the positions of theindividual pixels are identified by the respective row and column. For example, theupstream pixel in second row and third column counting from the top left handcorner is written U3,2. Therefore U3,2|1 represents the first set of data collected forpixel U3,2. Similarly, the corresponding downstream pixel is D3,2|1.
The concentration profiles are calculated for all 312 upstream and downstreamdata sets. Consider a pixel, U3,2. The calculations resulted in 312 concentration,(U3,2|1, U3,2|2, ..., U3,2|312) occurring in a time series data spaced at 1 ms interval.
1,1 2,1 3,1 4,1 5,1 6,1 7,1 8,1 9,1 10,1 11,1
1,2 2,2 3,2 4,2 5,2 6,2 7,2 8,2 9,2 10,2 11,2
1,3 2,3 3,3 4,3 5,3 6,3 7,3 8,3 9,3 10,3 11,3
1,4 2,4 3,4 4,4 5,4 6,4 7,4 8,4 9,4 10,4 11,4
1,5 2,5 3,5 4,5 5,5 6,5 7,5 8,5 9,5 10,5 11,5
1,6 2,6 3,6 4,6 5,6 6,6 7,6 8,6 9,6 10,6 11,6
1,7 2,7 3,7 4,7 5,7 6,7 7,7 8,7 9,7 10,7 11,7
1,8 2,8 3,8 4,8 5,8 6,8 7,8 8,8 9,8 10,8 11,8
1,9 2,9 3,9 4,9 5,9 6,9 7,9 8,9 9,9 10,9 11,9
1,10 2,10 3,10 4,10 5,10 6,10 7,10 8,10 9,10 10,10 11,10
1,11 2,11 3,11 4,11 5,11 6,11 7,11 8,11 9,11 10,11 11,11
Figure 3 Pixel Position Identification Figure 4 The Corresponding Pixel forUpstream (U1,1) and Downstream (D1,1)
Flow Direction
UpstreamProfile
DownstreamProfile
Untitled-56 02/16/2007, 18:0430

REAL-TIME VELOCITY PROFILE GENERATION OF POWDER CONVEYING 31
These values of concentration are plotted against time to produce an upstream pixelconcentration time function. These time functions are generated for all upstreamand downstream pixels.
An upstream and a downstream time series may be cross-correlated to estimatethe transit time between the two measurement arrays relating to the flowing solidparticles [7].
If the corresponding upstream and downstream pixel concentrations are cross-correlated, the flow velocity can be obtained. Figure 4 shows the correspondingupstream and downstream shown by the shaded pixels.
2.2 Flow Patterns Due to the Effect of Non-uniformDistribution of Flow
The formation of non-uniform flow patterns increases as the density differencebetween the conveyed components becomes greater. The phenomena certainly existsfor liquid-solid flows, but it is even more noticeable for gas-solid flows, where inhorizontal conveying there can be a sliding bed flow of the solid, with the gasmoving at a much higher velocity above the solid [2].
Therefore, if the velocity profile measurement is to be applied to the horizontalflow system, the measuring task becomes much more complicated as the differencesin signals measured by the sensors may affect the accuracy of flow measurement.This is due to the phenomena that usually occurs in the horizontal flow systemwhere the flow is not uniformly distributed. This phenomena is usually referred totwo-phase flow. The behaviour of the two-phase flow is unpredictable and depen-dent on many factors. The main complicating factor is that gravitational forces acton the solid phase, causing it to be displaced towards the bottom of the pipe. Flowregimes in horizontal flow are illustrated in Figure 5 [3].
Figure 5 Gas-solid Flow in a Horizontal Pipeline
Intermittent flow with large particleslugs
Dispersed non-homogeneous flow
Small dunes on the top of thesettling layer
Dispersed homogeneous flow
Untitled-56 02/16/2007, 18:0431

MOHD FUA’AD RAHMAT & MOHD HEZRI FAZALUL RAHIMAN32
2.3 Application Program
The application program is developed using Microsoft Visual Basic 6.0. Theprogram can be integrated with the measurement section through DAS-1802HChigh-speed data acquisition system board. Since this program is purposely built tosupport the interface board and the measurement hardware in real-time, it providesa wide range of functions and customisable settings for users in order to meet theirrequirement.
By default, the sampling frequency for this application program is set to 1 kHz perchannel using burst triggering under DMA mode. The burst triggering is clocked to333 kHz or 3 µs, which means that the sampling task for 32 sensors can be com-pleted within 96 µs. Basically, this application will sample 312 sets of data (within312 ms) and loads them onto hardware buffer in FIFO order before they can betransferred into local memory. The data will be manipulated with the Linear BackProjection Algorithm before they can be cross-correlated. This application imple-ments point-to-point method together with evolutionary concept to reduce the calcu-lation time [2]. The Graphical User Interface for application program mainframe isshown in Figure 6.
3.0 IMPLEMENTATION AND RESULT
Several experiments have been carried out to test and verify the feasibility of thedeveloped application program. They are the vertical full-flow measurement, thevertical half-flow measurement and the horizontal half-flow measurement. In thevertical half-flow measurement, 50% of the pipe flow was blocked.
Theoretically, the velocity of the dropped powder towards ground varies with the
displacement. This theory is represented by a velocity formulae v, 2=v gs where
Figure 6 Application Program Mainframe
Untitled-56 02/16/2007, 18:0432

REAL-TIME VELOCITY PROFILE GENERATION OF POWDER CONVEYING 33
g is gravitational acceleration and s is displacement. The displacement of the droppedpowder is fixed as 1.4 meter and the gravitational acceleration is set as 9.8 ms–2.Thus, the calculated velocity of the dropped powder is 5.24 ms–1.
3.1 Analogue Input Signal
The analogue input signals sampled from the sensors are in bipolar mode and themagnitude of the signals will vary according to the flow pattern. The Figure 7 repre-sents the analogue input signal collected from channels 8 and 24.
From Figure 7, the signal similarity between channels 8 and 24 is significant. Inthe measurement hardware, the sensor for channel 8 is located immediately abovethe sensor for channel 24 (refer to Figure 1) and thus, the signal pattern betweenboth sensors has to be identical and shifted. The delay between both signals is 12ms. Therefore, the velocity of the flow can be inferred as 4.167 ms–1. This sensor-to-sensor velocity is called the peripheral velocity.
3.2 Velocity Profile for Vertical Full-Flow Measurement
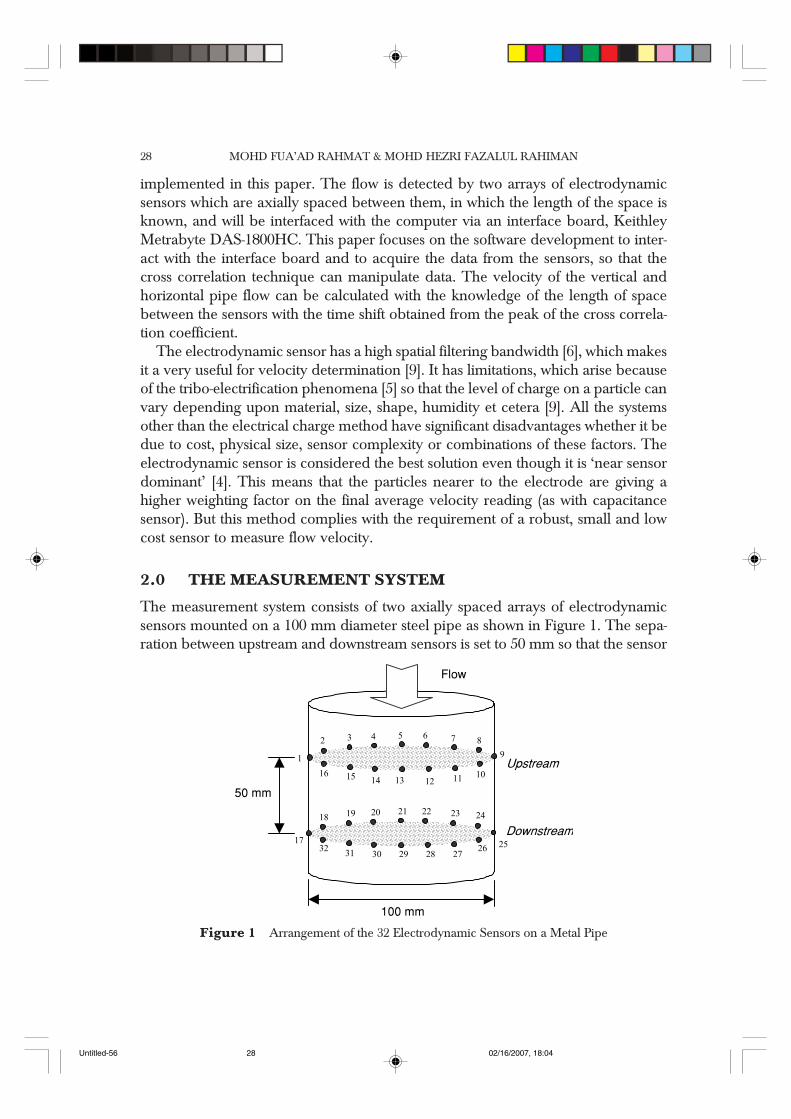
The velocity profiles for vertical full-flow measurement have been measured inreal-time at the sampling frequency of 1 kHz under DMA mode. The example ofmeasurement result obtained by the application program is shown in Figure 8.
From Figure 8, the application form has shown the full flow result where theexpected velocity range is set between 3.8 ms–1 and 5 ms–1. This velocity range is setaccording to the expected time delay of 10 ms to 13 ms. Since the corner pixels arenull or outside of the pipe area, the number of active pixels is 109. If the pixelvelocity is within the expected range, the pixel background colour will be changed
Figure 7 Analogue Input Signal of Channel 8 and 24
Vol
t (V
)
CH 8 & CH 24
-15 -10
10 15
-5 0 5
1 13 25 37 49 61 73 85 97 109
121
133
145
157
169
181
193
205
217
229
241
253
265
277
289
301
Ch 8 Ch 24
Untitled-56 02/16/2007, 18:0433
MOHD FUA’AD RAHMAT & MOHD HEZRI FAZALUL RAHIMAN34
to light red in order to facilitate users to recognize the flow distribution. The map-ping is labelled with the parameters U and L, which represent the upper streamsensor and the lower stream sensor respectively. For example, ‘U1,L17’ representsthe location of upper stream sensor 1 and lower stream sensor 17. Please referFigure 1 for detail on the location.
Several experiments have been carried out for verification purposes and it isfound that the result of the full flow is convincing. The results of other full-flowmeasurements are shown in Figure 9 and Figure 10.
Figure 9 Real-time Velocity Result of Full-Flow Measurement
Figure 8 Real-time Velocity Result of Full-Flow Measurement by Application Program
0
12
3
4
5
6
Velo
city
(m
/s)
Full flow (04)
5-64-53-42-31-20-1
U9,L25
U1,L17
U13
,L29
U5,
L21
Untitled-56 02/16/2007, 18:0434

REAL-TIME VELOCITY PROFILE GENERATION OF POWDER CONVEYING 35
3.3 Velocity profile for vertical half-flow measurement
The example of measurement result obtained by the application program is shownin Figure 11 where the upper half of the flow region is blocked.
0
12
3
4
5
6
Velo
city
(m
/s)
Full flow (08)
5-64-53-42-31-20-1
U9,L25
U1,L17
U13
,L29
U5,
L21
Figure 10 Real-time Velocity Result of Full-Flow Measurement
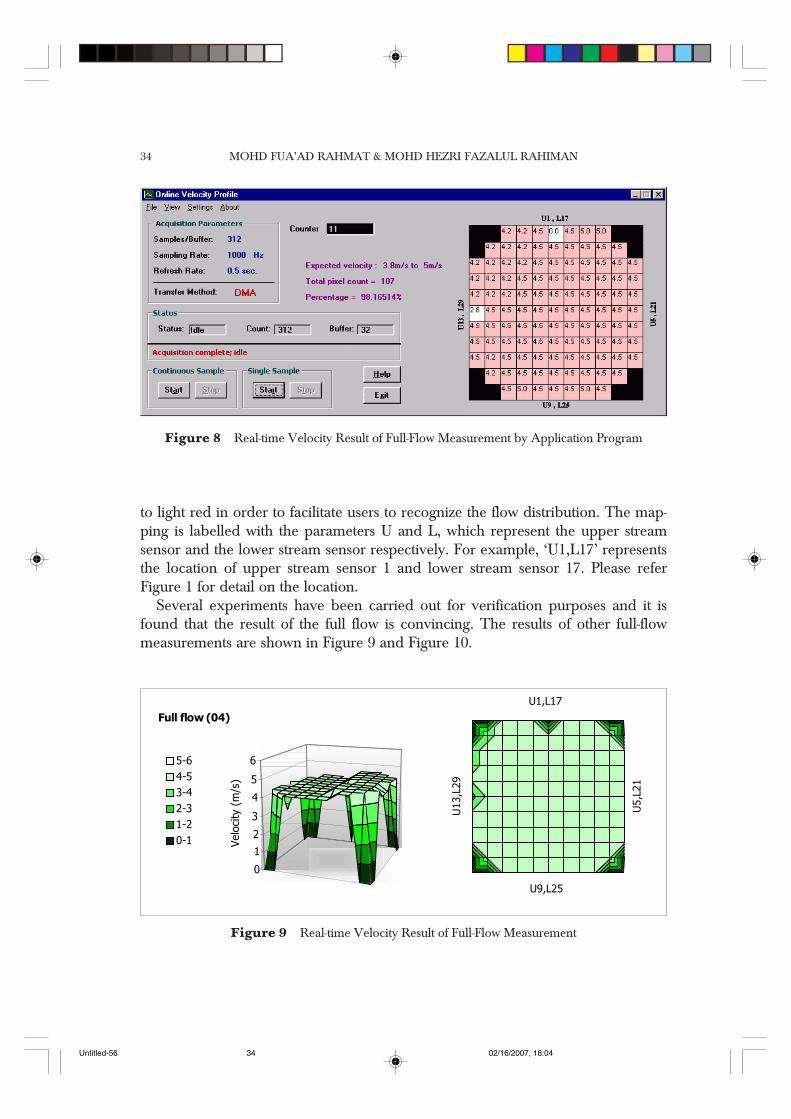
From Figure 11, it can be observed that the flow velocity between the two flowregions, the blocked region and the unblocked region are different.
Figure 11 Real-time Velocity Result of Half-flow Measurement by Application Program
Untitled-56 02/16/2007, 18:0435
MOHD FUA’AD RAHMAT & MOHD HEZRI FAZALUL RAHIMAN36
3.4 Velocity Profile for Horizontal Flow Measurement
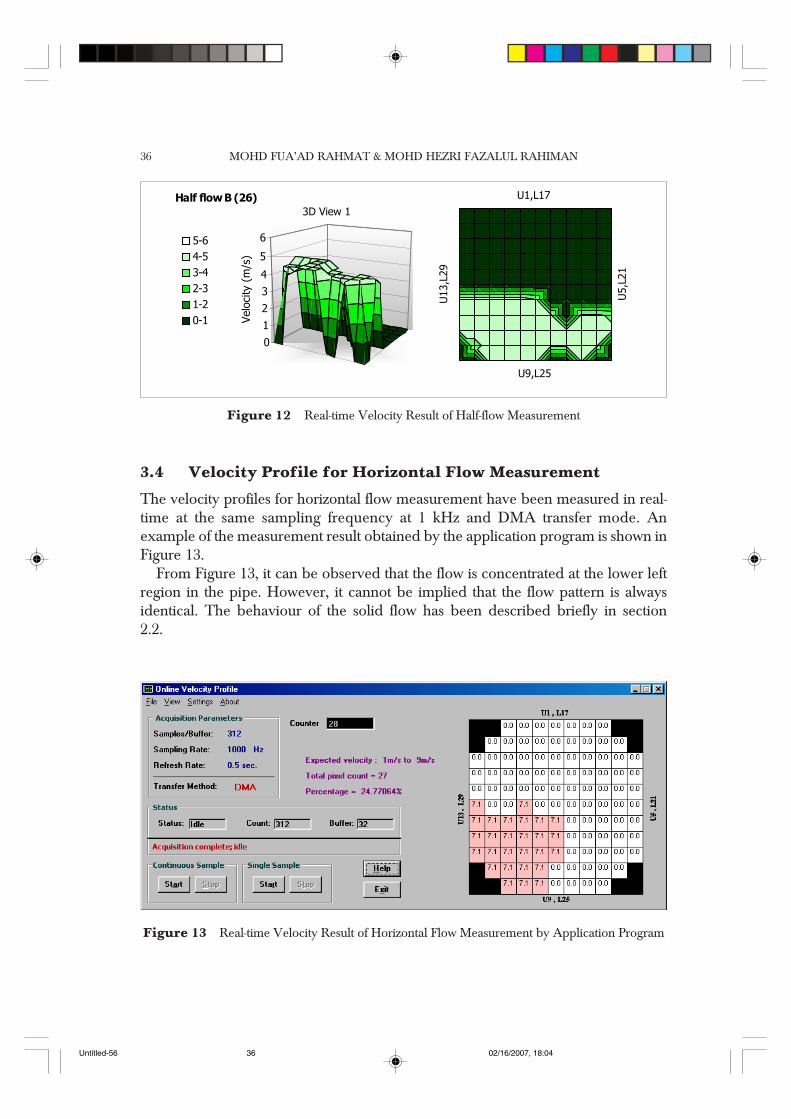
The velocity profiles for horizontal flow measurement have been measured in real-time at the same sampling frequency at 1 kHz and DMA transfer mode. Anexample of the measurement result obtained by the application program is shown inFigure 13.
From Figure 13, it can be observed that the flow is concentrated at the lower leftregion in the pipe. However, it cannot be implied that the flow pattern is alwaysidentical. The behaviour of the solid flow has been described briefly in section2.2.
Figure 12 Real-time Velocity Result of Half-flow Measurement
01234
5
6Ve
loci
ty (
m/s
)
Half flow B (26)
5-64-53-42-31-20-1
3D View 1
U9,L25
U1,L17
U13
,L29
U5,
L21
Figure 13 Real-time Velocity Result of Horizontal Flow Measurement by Application Program
Untitled-56 02/16/2007, 18:0436

REAL-TIME VELOCITY PROFILE GENERATION OF POWDER CONVEYING 37
The result in Figure 13 is displayed in 3D tomogram as shown in Figure 14.
Another result of the horizontal flow measurement is shown in Figure 15.
Other results have been obtained from this type of measurement. The overallresults have shown that the patterns of the flow in these experiments are randomand unpredictable. However, it can be concluded that the majority of the flows havethe highest concentration and speed at the lower part of the pipe. These phenomenaoccurred due to the structure of the conveyor (please refer to Figure 2) where theinlet of a pressured air is fixed at the lower part of the pipe.
Figure 14 Real-time Velocity Result of Horizontal Flow Measurement
0123456789
10
Velo
city
(m
/s)
Horizontal flow (09)9-108-97-86-75-64-53-42-31-20-1
U9,L25
U1,L17
U13
,L29
U5,
L21
3D View 1
Figure 15 Real-time Velocity Result of Horizontal Flow Measurement
0123456789
10
Velo
city
(m
/s)
Horizontal flow (11)9-108-97-86-75-64-53-42-31-20-1
U9,L25
U13
,L29
U5,
L21
Untitled-56 02/16/2007, 18:0437

MOHD FUA’AD RAHMAT & MOHD HEZRI FAZALUL RAHIMAN38
4.0 CONCLUSION
The real-time velocity profile measurement system for powder conveying wassuccessfully developed. The application program seems to work as expected andthe results have been verified. The average velocity value of vertical full flow is4.2 ms–1 at a displacement of 1.4 meter under gravitational force. Further experi-mental work will be carried out to investigate the result of horizontal flow measure-ment.
REFERENCES[1] Abulgazim Giuma Elarabi. 1991. Cross-correlation flow measurement based on short delays. MSc Disser-
tation. Bradford University.[2] Beck M. S. and A. Plaskowski. 1987.Cross correlation flowmeters - their design and application. Bristol,
UK: Adam Hilger, IOP Publishing Ltd.[3] Dyakowski T. 1995. Tomography in a process system. Oxford: Butterworth-Heinemann Ltd. 13–37.[4] Gregory I. A. 1987. Shot velocity measurement using electrodynamic transducers. PhD Thesis. UMIST.[5] Kelly E. G. and D. J. Spottiswood. 1989. The theory of electrostatic separations: A review (Part II: Particle
charging). Minerals Engineering. UK: Pergamon Press. 2(2).[6] Mohd Fua'ad Rahmat. 1996. Instrumentation of particle conveying using electrical charge tomography.
PhD Thesis. Sheffield Hallam University.[7] Mohd Fua'ad Rahmat, Chang W. L. and S.G. Tan. 2000. Testing of real-time cross-correlation flowmeter.
Jurnal Teknologi. 32(D): 89-107.[8] Mohd Fua'ad Rahmat and Mohd Hezri Fazalul Rahiman. 2000. Calibration of real-time tomographic
imaging for electrical charge tomography system. Jurnal Teknologi. 33(D): 1–18.[9] Shackleton M.E. 1982. Electrodynamic transducers for gas/solids flow. Mphil Thesis. University of Bradford.
Untitled-56 02/16/2007, 18:0438