Embed Size (px)
Citation preview
MQP – BIO – DSA – 3046 MQP – BIO – DSA – 8280
Real-time PCR Study of α4β2 nAChR Gene Expression During Chronic
Nicotine Treatment of H69 Cells
A Major Qualifying Project Report
Submitted to the Faculty
of the
WORCESTER POLYTECHNIC INSTITUTE
in partial fulfillment of the requirements for the
Degree of Bachelor of Science
in
Biology and Biotechnology
by
_________________________________________ ___________________________________________ Jaime L. Grouf Stacia L. Richards
April 28, 2005
APPROVED:
_____________________________ ______________________________ Paul D. Gardner, PhD David S. Adams, PhD Department of Psychiatry Dept. of Biology and Biotechnology Brudnick Neuropsychiatric Research Institute Worcester Polytechnic Institute UMass Medical School WPI Project Advisor Major Advisor
2
ABSTRACT
The α4β2 subunits comprise a heteromeric nicotinic acetylcholine receptor
(nAChR) subtype. Previous studies of nicotine treatment have shown increased receptor
expression, but these studies only investigated gene expression utilizing reverse
transcriptase PCR. In this study, we treated the H69 human lung carcinoma cell line with
nicotine and observed the effects on gene expression using real-time PCR with the
hypothesis that nicotine treatment alters gene expression of α4β2 subunits. The
advantages of real-time PCR are that it provides the ability to observe amplification at
each cycle as well as the ability to perform quantitative analysis on the data. In analyzing
a 4 day 100 µM nicotine treatment of the H69 cell line, a significant increase in gene
expression of the α4 subunit was observed after 24 hours. Any change prior to or after 24
hours was not significant. These data are indicative of changes in gene expression
observed for short periods of nicotine treatment in contrast to long-term treatment.

3
TABLE OF CONTENTS Signature Page …………………………………………………………………. 1 Abstract ………………………………………………………………………… 2 Table of Contents ………………………………………………………………. 3 Acknowledgements …………………………………………………………….. 4 Background …………………………………………………………………….. 5 Project Purpose …………………………………………………………………. 21 Methods …………………………………………………………………………. 22 Results …………………………………………………………………………… 26 Discussion ……………………………………………………………………….. 46 Bibliography ……………………………………………………………………... 50

4
ACKNOWLEDGEMENTS
The authors would like to extend their sincerest thanks to Dr. Paul D. Gardner for
acceptance into his research laboratory, and without whom our educational experience
would not have been a success. Gratitude is also extended to Yuly Fabiola Fuentes Medel
for her camaraderie, assistance, and collaboration on this project, and Sarah Binke for her
technical support. Lastly, we would like to thank David S. Adams for his project
initiation, guidance, and assistance in the technical writing of our report.
5
BACKGROUND
Nicotine
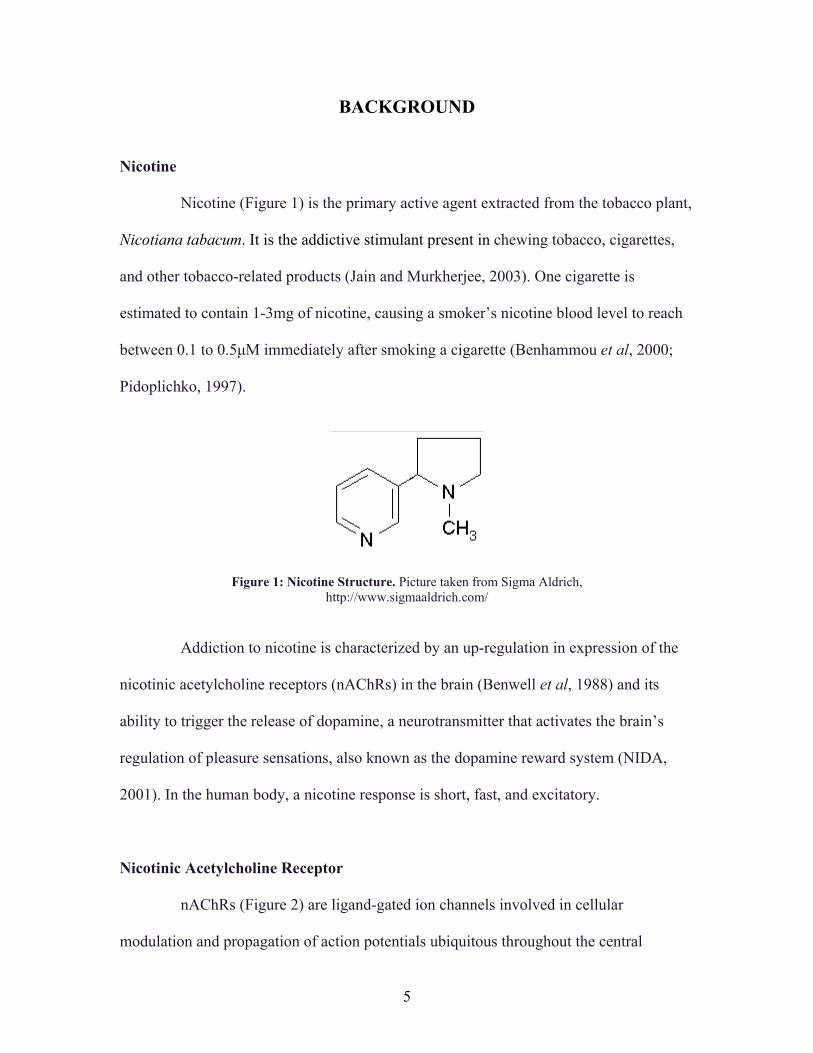
Nicotine (Figure 1) is the primary active agent extracted from the tobacco plant,
Nicotiana tabacum. It is the addictive stimulant present in chewing tobacco, cigarettes,
and other tobacco-related products (Jain and Murkherjee, 2003). One cigarette is
estimated to contain 1-3mg of nicotine, causing a smoker’s nicotine blood level to reach
between 0.1 to 0.5µM immediately after smoking a cigarette (Benhammou et al, 2000;
Pidoplichko, 1997).
Figure 1: Nicotine Structure. Picture taken from Sigma Aldrich, http://www.sigmaaldrich.com/
Addiction to nicotine is characterized by an up-regulation in expression of the
nicotinic acetylcholine receptors (nAChRs) in the brain (Benwell et al, 1988) and its
ability to trigger the release of dopamine, a neurotransmitter that activates the brain’s
regulation of pleasure sensations, also known as the dopamine reward system (NIDA,
2001). In the human body, a nicotine response is short, fast, and excitatory.
Nicotinic Acetylcholine Receptor
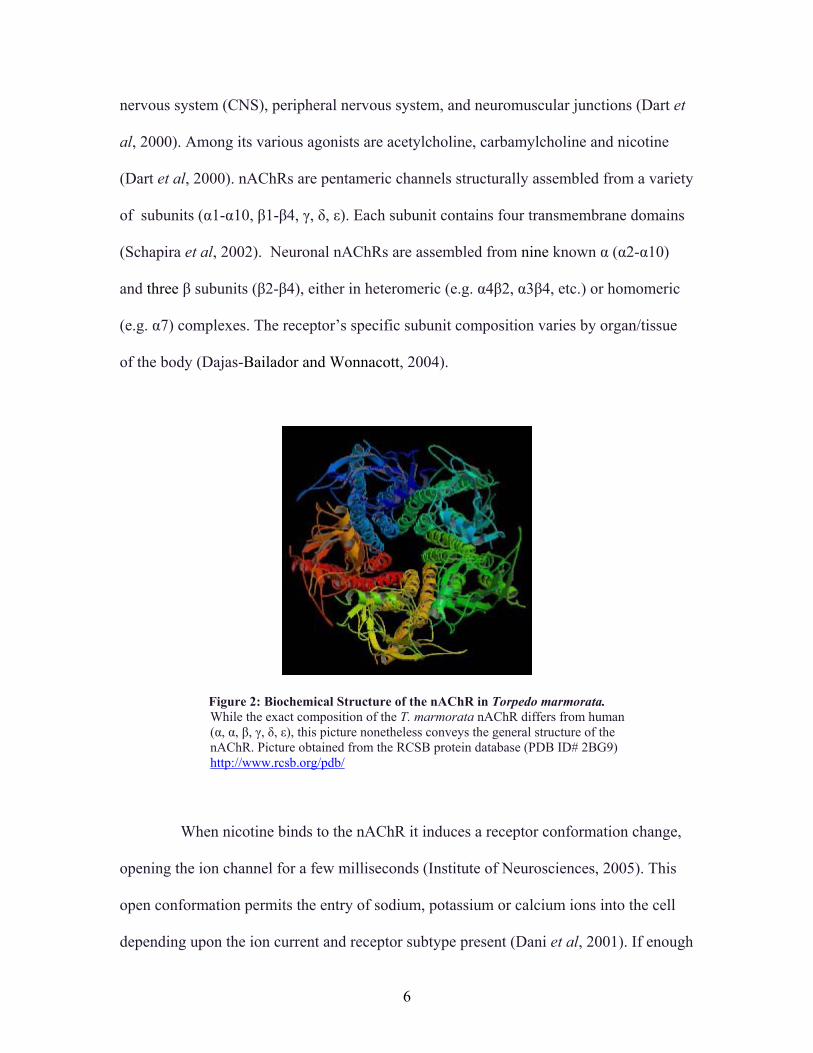
nAChRs (Figure 2) are ligand-gated ion channels involved in cellular
modulation and propagation of action potentials ubiquitous throughout the central
6
nervous system (CNS), peripheral nervous system, and neuromuscular junctions (Dart et
al, 2000). Among its various agonists are acetylcholine, carbamylcholine and nicotine
(Dart et al, 2000). nAChRs are pentameric channels structurally assembled from a variety
of subunits (α1-α10, β1-β4, γ, δ, ε). Each subunit contains four transmembrane domains
(Schapira et al, 2002). Neuronal nAChRs are assembled from nine known α (α2-α10)
and three β subunits (β2-β4), either in heteromeric (e.g. α4β2, α3β4, etc.) or homomeric
(e.g. α7) complexes. The receptor’s specific subunit composition varies by organ/tissue
of the body (Dajas-Bailador and Wonnacott, 2004).
Figure 2: Biochemical Structure of the nAChR in Torpedo marmorata. While the exact composition of the T. marmorata nAChR differs from human (α, α, β, γ, δ, ε), this picture nonetheless conveys the general structure of the nAChR. Picture obtained from the RCSB protein database (PDB ID# 2BG9) http://www.rcsb.org/pdb/
When nicotine binds to the nAChR it induces a receptor conformation change,
opening the ion channel for a few milliseconds (Institute of Neurosciences, 2005). This
open conformation permits the entry of sodium, potassium or calcium ions into the cell
depending upon the ion current and receptor subtype present (Dani et al, 2001). If enough
7
ions enter to surpass a threshold, the cell membrane becomes depolarized, which excites
the cell, and propagates an action potential. When the receptor returns to a closed
conformation, it is temporarily desensitized to the stimulation of neurotransmitters.
Continuous nicotine exposure prolongs this state of desensitization (Institute of
Neurosciences, 2005).
nAChR Subunits
As previously mentioned, neuronal nAChRs are pentameric ligand-gated ion
channels composed of α and β subunits. The exact combination of subunits depends on
the cellular context. In some cases, a specific neuron can express multiple subtypes.
Three receptor subtypes are particularly interesting. The α4β2 subtype is the most
common receptor found throughout the CNS and is characterized by a high affinity for
nicotine. The α7 homomeric receptor is an appealing receptor for research because of its
known specific ligand, α-bungarotoxin, which provides an easy tool to study this
receptor. Furthermore, the α7 receptor interestingly possesses higher calcium
permeability than the NMDA subtype of the glutamate receptors (Séguéla et al, 1993).
Lastly, while more research is necessary to understand the fundamentals of these specific
receptors, far more is known regarding the α4β2 and α7 receptors than any other neuronal
subtype.
Neuronal nAChR α4β2 Subtype
The α4β2 subtype (Figure 3) is the most abundant heteromeric nAChR in the
central nervous system. Among the numerous types of nAChR, the α4β2 subtype has the
8
highest affinity for nicotine, constituting greater than ninety percent of nicotine binding
in rat brain (Marks et al, 1992). The α4 subunit is vital as it specifically interacts with the
receptor ligands, nicotine or acetylcholine. The β2 subunit contributes structural stability
to the receptor subtype as well as reinforcement of nicotine’s effects on the nAChR
(Marks et al, 1992).
Figure 3: nAChR Type α4β2. Shown here is acetylcholine (yellow), the endogenous ligand of the nAChRs, bound to the ligand binding site of the α4 (left) and β2 (right) subunit monomers of the receptor pore. Note that this is only a model of the subunit interaction and the nAChRs are actually pentameric in nature. Picture taken from Schapira et al, 2002.
Chronic exposure to nicotine in a dose-dependent manner has consistently
demonstrated an up-regulation or increase in nicotinic receptor concentration. In 1992,
Marks et al established the paradigm that while chronic nicotine treatment does increase
the number of nicotine binding sites on the plasma membranes of cells, this effect is not a
direct result of up-regulation of the α4 and β2 nAChR subunit genes, but post-
transcriptional (Marks et al, 1992). However, a few other plausible possibilities exist to
9
explain the observed increase in nicotine binding sites per cell, nicotine may increase the
efficiency of receptor incorporation into cellular membranes, it may stabilize the RNA
transcript such that it exists in the cytoplasm longer allowing more translation, or nicotine
may attenuate the receptor degradation rate (Marks et al, 1992). The Marks et al (1992)
study was validated by Benhammou et al (2000) who described a positive correlation
between the number of cigarettes smoked each day and the number of nicotine binding
sites in human lung tissue.
The potential role of the β2 subunit in transmission of nicotine-related
responses and behavior was investigated by Picciotto et al in 1998. The authors used a β2
knockout mouse model and found that the neurons in these mice lacked the ability to
elicit a response to nicotine simulation as compared to wild type mice, indicating that the
β2 subunit is responsible for neurotransmission responses to nicotine. Picciotto et al also
found that in nicotine self-administration experiments, the knockout mice showed a
significant decrease in the number times they would drink from a bottle of water
containing nicotine as compared to the wild type, reinforcing the role of this receptor in
mediating the effects of nicotine.
Neuronal nAChR α7 Subtype
The α7 subtype is another receptor of the nAChR family that is frequently
studied as it is one of the only known nAChR subtypes able to form a homopentameric
receptor. While this subunit has a lower affinity for nicotine than the α4β2 subtype, it
does possess a high affinity for α-bungarotoxin, and is the predominant protein to bind
this toxin in the brain (Peng et al, 1997). Specifically, the high affinity for α-
10
bungarotoxin gives researchers an advantageous tool in studying the α7 receptor. This
receptor appears to be involved in numerous physiological processes such as the
suppression of apoptosis, learning, memory, schizophrenia, Alzheimer’s, inflammation
and vasodilation (Severance et al, 2004).
In 2004, Trombino et al established that nAChR are both expressed and
stimulated by nicotine in human mesothelioma cell lines, and that nicotine enhances cell
proliferation by binding the α7 receptor. They demonstrated both the ubiquitous presence
of α7 subunits throughout these cells as well as calcium ion influx upon stimulation by
nicotine binding. It has been previously established that nicotine binding to the α7
nAChR permits the influx of calcium ions, known to activate MAPK signaling cascades
which participate in repression of apoptosis. Therefore, Trombino et al were able to
determine that the calcium ions released by nicotine treatment activated MAPK, which
increases the rate of DNA phosphorylation inside the cells, thereby increasing DNA
synthesis and inducing elevated rates of cell proliferation.
Peng et al (1997) demonstrated that the α7 nAChR receptor subtype is up-
regulated by chronic treatment with nicotine, and that this up-regulation and activation
only occurs at higher doses of nicotine than is required to upregulate the α4β2 receptor
subtype, reaching its maximal up-regulation by 24 hours. Consistent with observations
for the α4β2 receptors, no increases of the α7 subunit mRNA were observed, consistent
with post-transcriptional regulation.
11
Nicotine Addiction in Smokers
In smokers, repeated nicotine stimulation increases both the length of time the
neuronal membrane is desensitized and the quantity of dopamine released within the
brain (Jain and Mukherjee, 2003). Self-administrated reinforcement by nicotine is
thought to be regulated in part via the mesolimbic dopamine reward system. Within this
system, neuronal projections populated with numerous α4 and β2 subunit-comprised
nAChRs extend from the ventral tegmental area (VTA) and terminate within the nucleus
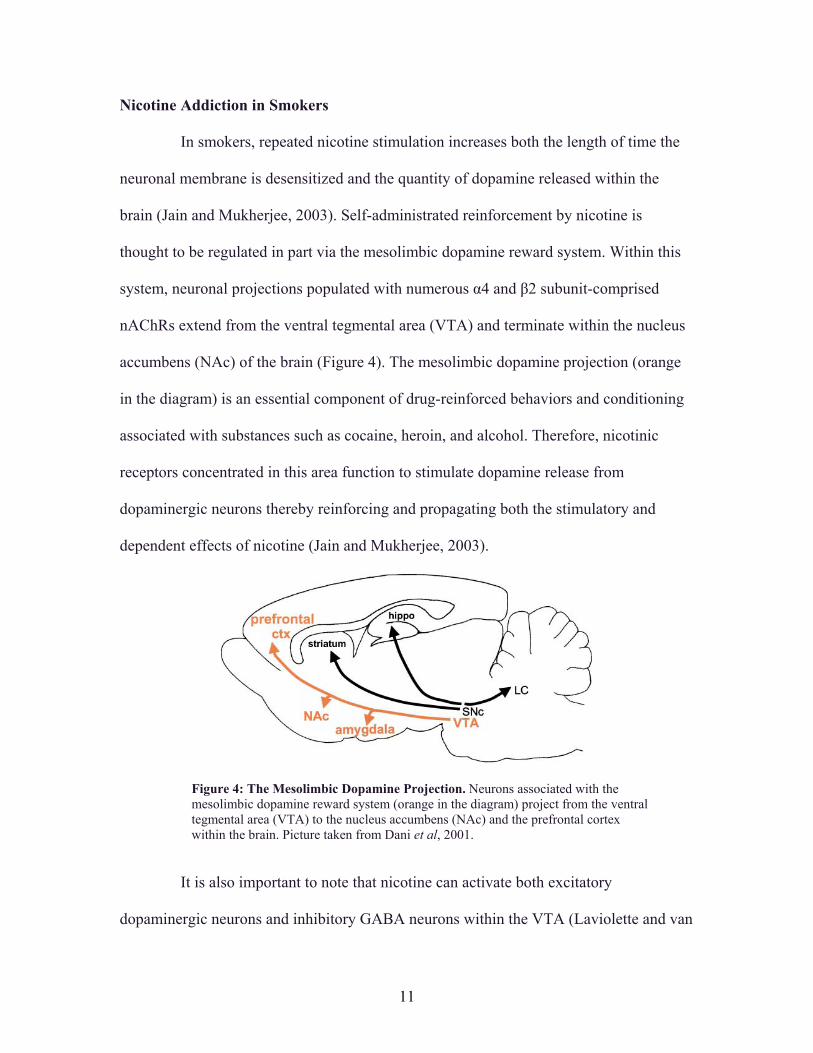
accumbens (NAc) of the brain (Figure 4). The mesolimbic dopamine projection (orange
in the diagram) is an essential component of drug-reinforced behaviors and conditioning
associated with substances such as cocaine, heroin, and alcohol. Therefore, nicotinic
receptors concentrated in this area function to stimulate dopamine release from
dopaminergic neurons thereby reinforcing and propagating both the stimulatory and
dependent effects of nicotine (Jain and Mukherjee, 2003).
Figure 4: The Mesolimbic Dopamine Projection. Neurons associated with the mesolimbic dopamine reward system (orange in the diagram) project from the ventral tegmental area (VTA) to the nucleus accumbens (NAc) and the prefrontal cortex within the brain. Picture taken from Dani et al, 2001.
It is also important to note that nicotine can activate both excitatory
dopaminergic neurons and inhibitory GABA neurons within the VTA (Laviolette and van
12
der Kooy, 2004). These two neuron types play coordinated roles within the VTA. In the
early stages of nicotine administration, the inhibitory GABA neurons are predominantly
affected and quickly desensitized. This assists in prolonged excitation of dopaminergic
neurons as the inhibitory influence of the GABA neurons are temporarily diminished
(Laviolette and van der Kooy, 2004).
Contributing to the addictive properties of nicotine is the fact that after
depolarization of the neuronal membrane, the endogenous agonist of the AChR,
acetylcholine, is easily disposed of by the cell through enzymatic hydrolysis via
acetylcholinesterase. Nicotine, on the other hand, can exist for prolonged periods of time
at the synapse because it cannot be hydrolyzed by acetylcholinesterase, thus intensifying
its desensitizing effects (Dani et al, 2001).
During the time between cigarettes, nicotine levels in the blood are high enough
to maintain receptor desensitization and pleasure responses (Institute of Neurosciences,
2005). As the nicotine concentration decreases over time, some receptors regain their
sensitivity, increasing the levels of acetylcholine neurotransmission which causes
agitation and discomfort in the smoker, also known as withdrawal. Ultimately, prolonged
receptor desensitization leads to nicotine tolerance and addiction. (Institute of
Neurosciences, 2005).
nAChR, Nicotine, and Lung Cancer
Cancer is the second leading cause of death in the United States, second only to
heart disease, claiming 557,271 lives in 2002 (American Cancer Society, 2005). Lung
cancer is the second leading cause of cancer diagnoses in men and women in the United
13
States. Unfortunately it is also the primary cause of cancer-related deaths, accounting for
approximately 30% of all cancer deaths each year, and expected to kill an estimated 163,
510 persons in the year 2005 (American Cancer Society, 2005).
Lung cancers are separated into two main categories: small cell lung carcinomas
(SCLC), which are very aggressive lung tumors accounting for 20-25% of all lung
cancers, and non-small cell lung carcinomas (NSCLC) (Song et al, 2003). Non-small cell
lung carcinomas are further subdivided into adenocarcinoma, which is the most prevalent
lung cancer in nonsmokers, adenosquamous carcinoma, large cell carcinoma, which
comprises 10-15% of lung cancers, and squamous cell carcinoma, the most abundant lung
cancer comprising 25-40% of all lung cancers (Song et al, 2003).
Small Cell Lung Cancer
Throughout the decades, lung cancer has been linked to the effects of smoking
and the carcinogens contained within cigarettes (Song et al, 2003). However, researchers
have shown that nicotine also may play a role in lung cancer proliferation. In 1993,
Cattaneo et al provided preliminary data demonstrating the release of serotonin by
nicotine-activated AChRs in SCLCs. This was very significant research because
serotonin release is tightly coordinated with SCLC growth and proliferation, indicating
that nicotine may be a contributing mitogen in tumor growth of the SCLCs.
To further support this study, Mai et al in 2003 documented their study
displaying nicotine’s effect on suppressing apoptosis in SCLC cells, in which they
described how nicotine induces phosphorylation of the Bcl2 cellular proto-oncogene
14
protein, thereby enhancing the Bcl2 gene function of anti-apoptosis and cell survival
within the tumor.
RT-PCR vs. Real-time PCR
This MQP used real-time PCR to monitor levels of nAChR subunit mRNAs in
cells treated with nicotine, so we include a brief background on this technique here.
With the biotechnology field becoming ever-increasingly complex and analytical,
powerful methods for quantifying biological molecules are in high demand. For decades
the method of reverse-transcriptase polymerase chain reaction (RT-PCR) has been used
to efficiently amplify small quantities of nucleic acids. RT-PCR permits the reverse
transcription of RNA into DNA, followed by successive amplification of the template
cDNA from a reaction mixture that includes gene-specific primers, dNTP’s, and
template. However, limitations of this technique include the inability to analyze the target
amplified gene of interest (amplicon) at each amplification cycle and the inability to
accurately quantify end yields (Lechniak, 2002). When performing RT-PCR, researchers
are only able to compare final amplicon yields to a standard on a gel; thus, RT-PCR is
only a qualitative technique. In addition to this, variability in reactions and protocols
throughout the RT and PCR experiments also make it difficult to accept the
quantification results obtained on a gel (Lechniak, 2002). Currently, when using RT-
PCR, no technique exists to determine the initial starting concentration of your target
nucleic acid. An important problem with traditional RT-PCR is that the same quantity of
end product may eventually be formed, even when the starting template concentrations
are different.
15
Real-time PCR is a relatively novel technique that, unlike RT-PCR, can be
used to quantify nucleic acid concentrations (Lechniak, 2002). Real-time PCR is an
extremely sensitive and powerful technique as it not only can quantify initial sample
concentrations, but it allows the researcher to analyze the amplification process at each
PCR cycle thus eliminating the need for gel electrophoretic analysis after the reaction,
and allowing quantitations to be performed during the exponential phase of the reaction.
Theoretically, quantitative real-time PCR can detect products from as few as a single
copy of a given sequence (Provanzano et al, 2001). This is an extremely sensitive
technique compared to alternative gene expression methods.
Real-Time PCR Reporter Dyes
Real-time PCR requires the use of a fluorescent reporter dye to bind to the
target and permit detection. These dyes are attached to a probe which also contains a
quencher dye so that they only fluoresce upon target binding. Therefore, at each PCR
cycle, the amount of product is directly proportional to the light emitted by the dye.
Specifically, real-time PCR does not measure the actual nucleic acid amplification, but
rather the emitted fluorescence during the reaction. However, in order for the
quantification to be valid, the data must be analyzed within the exponential phase of the
amplification curve where the reaction occurs at a constant rate.
A few fluorescence reporters exist that can be used to quantify the
amplification. Two of the most common dyes are SybrGreen and TaqMan (Lechniak,
2002). Both dyes bind to the minor groove of DNA. SybrGreen is less expensive than
16
TaqMan but it is less specific as it can also bind to primer dimers and nonspecific
products (Lechniak, 2002).
Real-Time PCR Amplification Plot
The exact cycle number at which a significant amount of product will be
detected depends upon the initial quantity of the desired target gene. Therefore, higher
concentrations of starting material will result in an earlier detection of reporter dye
fluorescence and vice versa. Each cycle in real-time PCR increases logarithmically. For
example, the amplicon will increase with each cycle 21, 22, 23, 24, and so on, where the
exponent is the cycle number (Dorak, 2005).
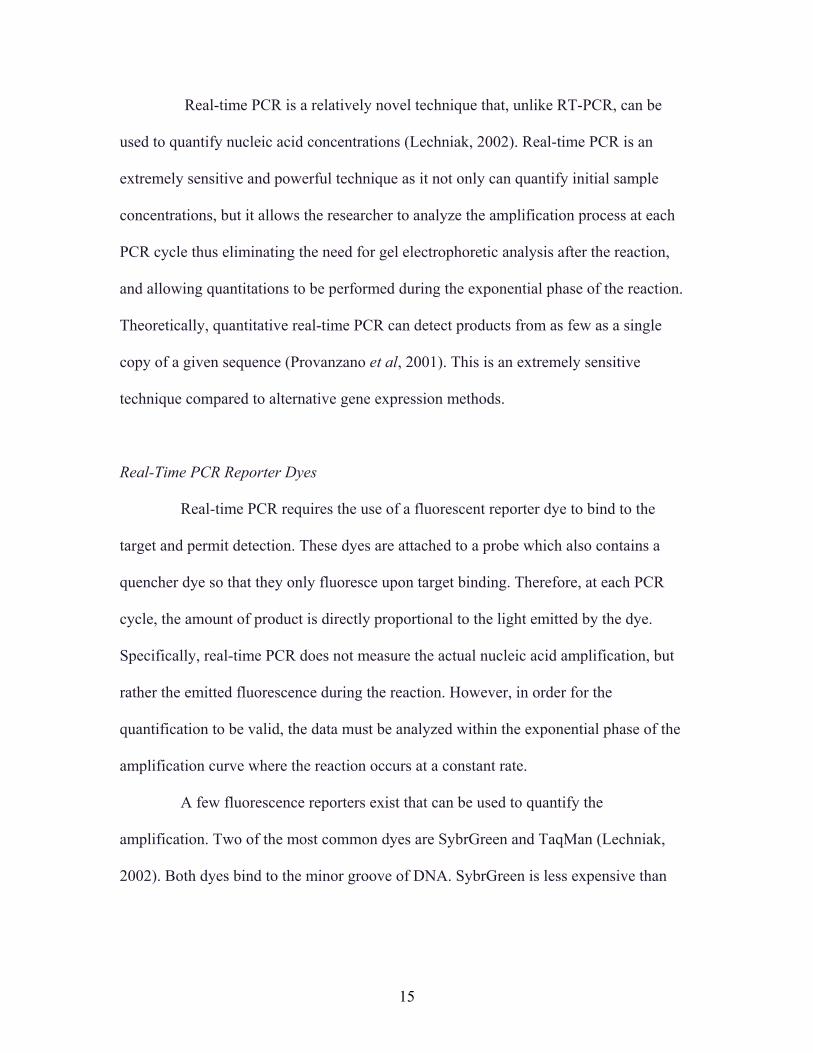
An amplification plot in real-time PCR (Figure 5) displays the exponential
increase of the desired target product. The baseline level is set prior to the log-linear
phase and serves as a cut off for background noise. The threshold (green line in the
figure), which the operator can manually set, is the point at which a significant increase
of fluorescence is detected, typically placed within the exponential phase of the graph.
Because it is here that theoretically, all the samples are amplified at the same rate, the
researcher can then calculate the amount of starting template in each sample (Figure 5).
17
Figure 5: Example of a Real-time PCR Amplification Plot for GAPDH. This plot shows how the threshold (green line) is set where each product is being amplified at approximately the same rate. The 5 reactions shown here differ in dilution. Each dilution has a difference of 2 cycle numbers. Figure taken from Grouf and Richards, 2005.
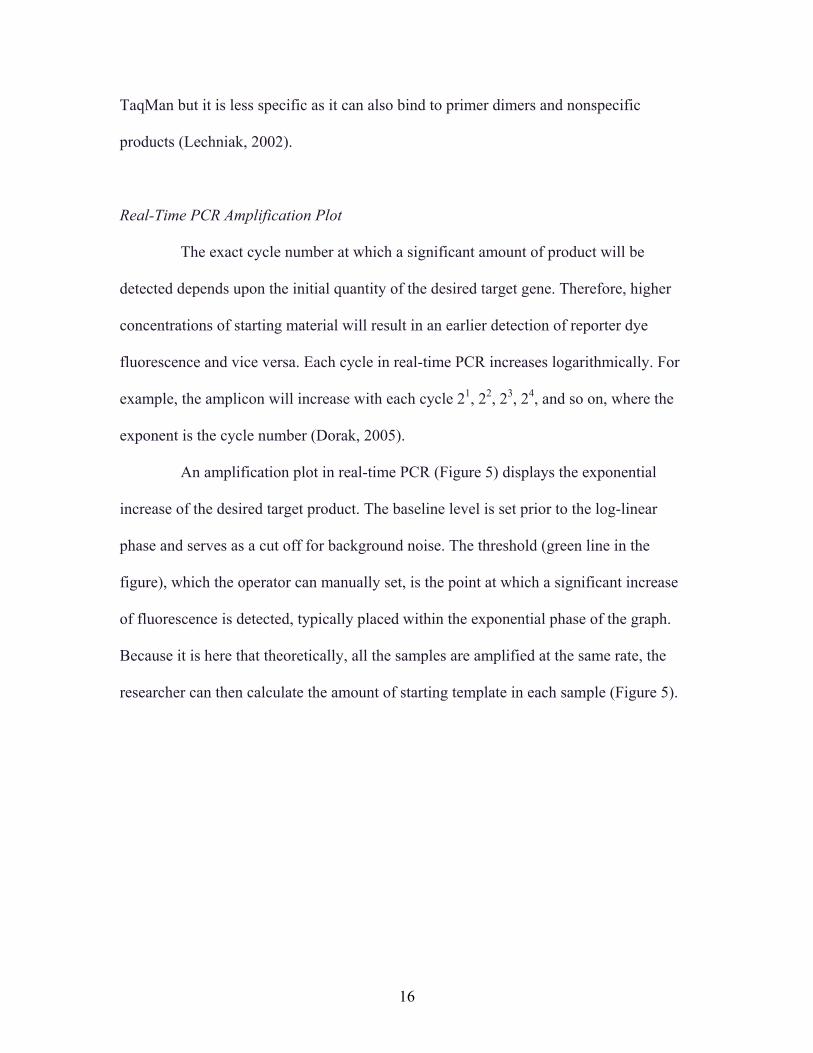
Real-Time PCR Dissociation Curve The dissociation curve (Figure 6) is another useful graph that real-time PCR can
produce to assist in data analysis. The dissociation curve is also known as a melting
curve. This curve provides a method for determining the specificity of the primers. If the
plot contains only one peak (as is the case for Figure 6), then it can be inferred that only
one target is amplified and the primers are specific to that target. However, if more than
one peak appears, the primers may be non-specific. Depending upon the reaction
conditions, there may be contamination, primer dimer competition, or non-specific
amplification. The dissociation curve also allows one to ensure that the desired amplicon
is being detected. This can be determined by comparing the melting temperature at which
18
the peak is found on the dissociation plot to the assumed melting temperature for the
amplicon predicted by the researcher’s primer design software (Figure 6).
Figure 6: Example of a Real-time PCR Dissociation Curve of the Human nAChR α4 Gene. The α4 AChR primers are specific to the target α4 mRNA. Also 840C is the correct melting temperature for the desired amplicon. Figure taken from Grouf and Richards, 2005.
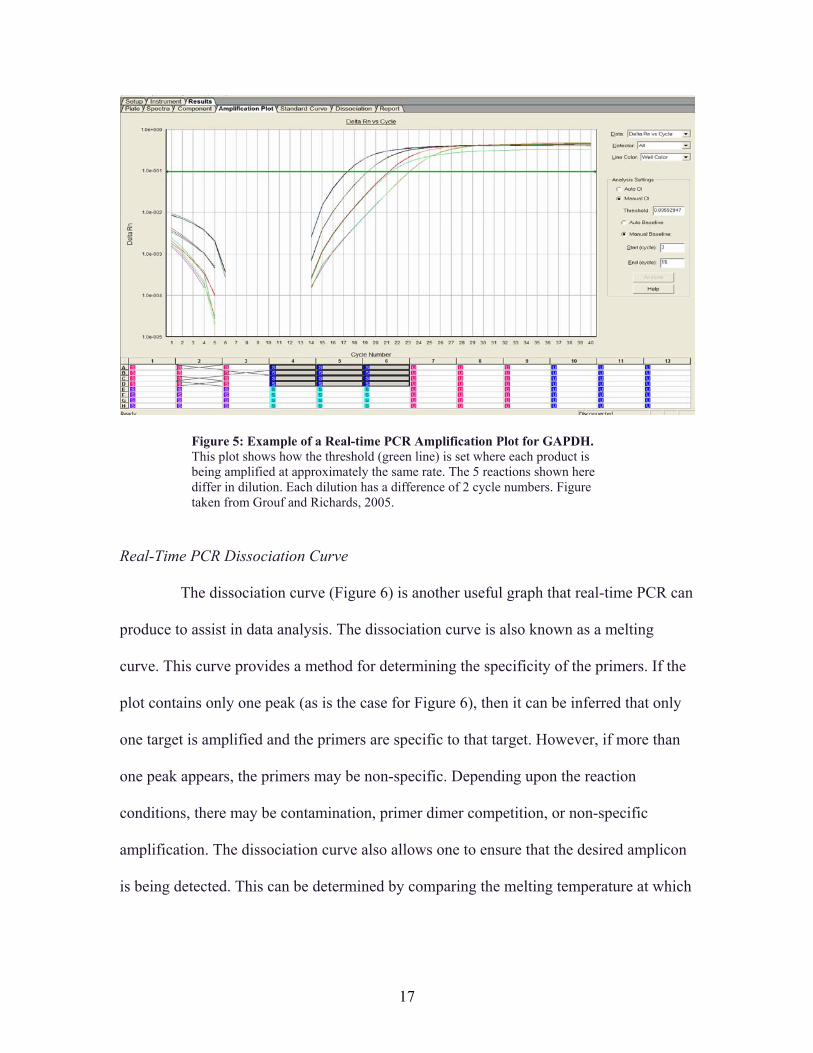
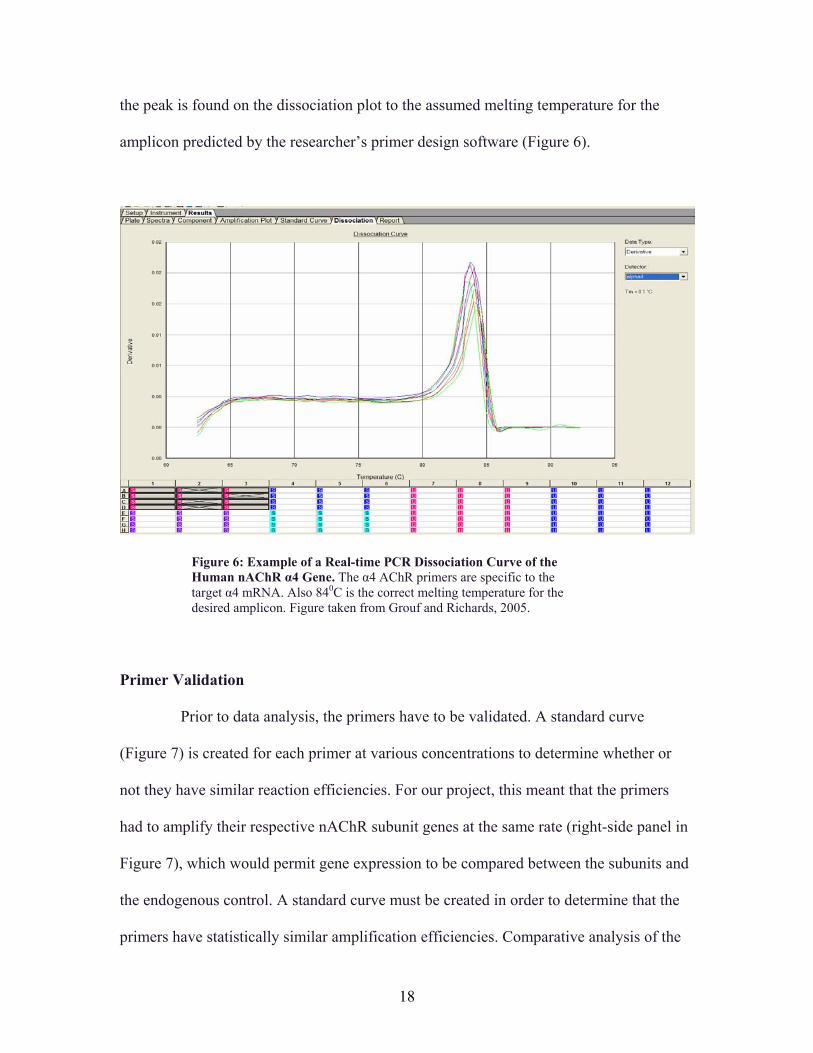
Primer Validation Prior to data analysis, the primers have to be validated. A standard curve
(Figure 7) is created for each primer at various concentrations to determine whether or
not they have similar reaction efficiencies. For our project, this meant that the primers
had to amplify their respective nAChR subunit genes at the same rate (right-side panel in
Figure 7), which would permit gene expression to be compared between the subunits and
the endogenous control. A standard curve must be created in order to determine that the
primers have statistically similar amplification efficiencies. Comparative analysis of the
19
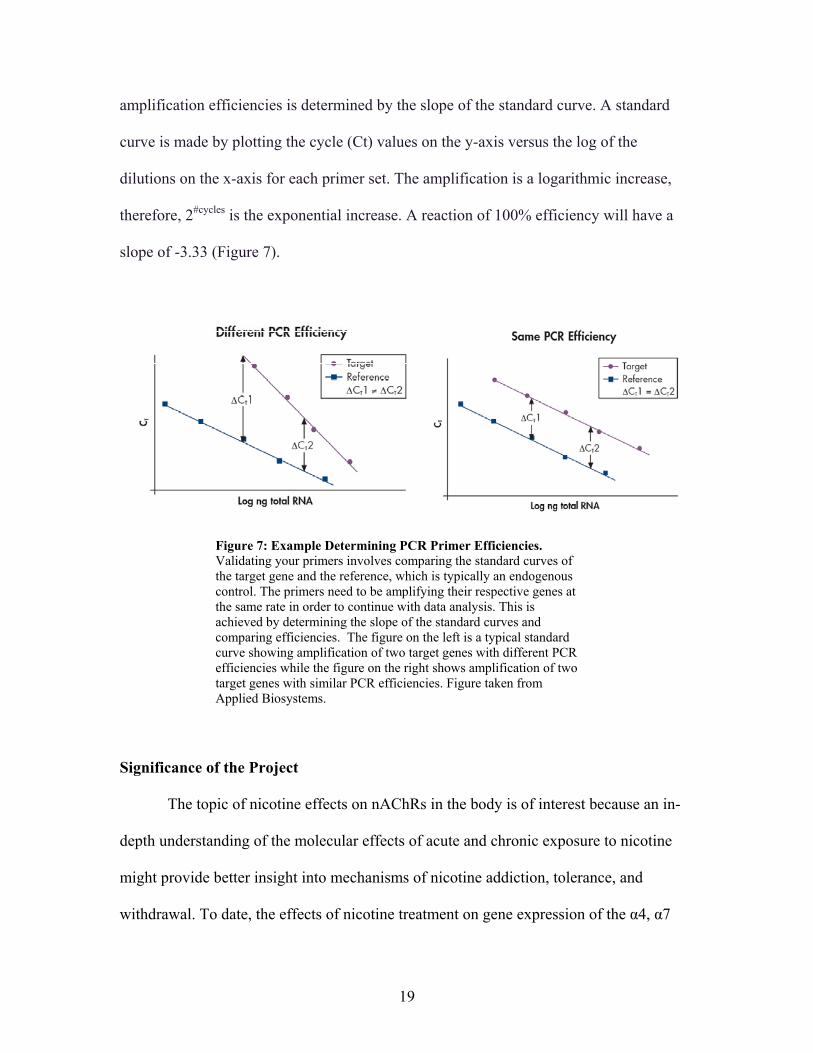
amplification efficiencies is determined by the slope of the standard curve. A standard
curve is made by plotting the cycle (Ct) values on the y-axis versus the log of the
dilutions on the x-axis for each primer set. The amplification is a logarithmic increase,
therefore, 2#cycles is the exponential increase. A reaction of 100% efficiency will have a
slope of -3.33 (Figure 7).
Figure 7: Example Determining PCR Primer Efficiencies. Validating your primers involves comparing the standard curves of the target gene and the reference, which is typically an endogenous control. The primers need to be amplifying their respective genes at the same rate in order to continue with data analysis. This is achieved by determining the slope of the standard curves and comparing efficiencies. The figure on the left is a typical standard curve showing amplification of two target genes with different PCR efficiencies while the figure on the right shows amplification of two target genes with similar PCR efficiencies. Figure taken from Applied Biosystems.
Significance of the Project
The topic of nicotine effects on nAChRs in the body is of interest because an in-
depth understanding of the molecular effects of acute and chronic exposure to nicotine
might provide better insight into mechanisms of nicotine addiction, tolerance, and
withdrawal. To date, the effects of nicotine treatment on gene expression of the α4, α7

20
and β2 subunits using real-time PCR has not been done. Therefore, in order to provide a
more quantitative analysis and in-depth understanding of these molecular interactions, the
goal of this project was to use real-time PCR to quantify nAChR gene expression in lung
cancer cell lines and to determine if the expression changes in response to nicotine.
21
PROJECT PURPOSE
The purpose of this study was to quantify changes in the levels of α4 and β2
nAChR subunit mRNAs using real-time PCR in H69 and H460 human lung carcinoma
cells treated with nicotine for short and long periods of time to test the hypothesis that
short-term nicotine treatment increases gene expression of the α4 and β2 subunits, while
long-term treatment desensitizes the receptor and decreases subunit expression. nAChR
gene expression was analyzed using real-time PCR since that method is far more
quantitative than traditional RT-PCR, and little work to date has applied this technique to
nicotine-treated cancer cells. The cells were treated using a range of nicotine
concentrations to determine the optimal dose required to observe an effect on gene
expression.
22
METHODS
Cell Culture
The H69 human small cell lung carcinoma cell line (non-adherent) and H460
human large cell lung carcinoma cell line (adherent) were originally obtained from the
American Type Culture Collection (ATCC). Vials were thawed and cultured in RPMI
1640 medium (Gibco) + 10% FBS (HyClone) in the absence of antibiotics. The H69
medium was doubled every other day until maximum flask volume was reached at which
point the cells were centrifuged at 1500 rpm for 5 minutes and passaged into new flasks.
The H460 cells were cultured to 60% confluency, then trypsinized and passaged using
Trypsin-EDTA (Gibco), and centrifuged at 1000 rpm for 5 minutes. Cells were
maintained at 37oC in 8% humidified CO2.
Nicotine Treatment (Dose Response)
H69 and H460 cells were treated with either 1 µM, 10 µM, or 100 µM nicotine
(Sigma Aldrich) continuously over a period of seven days. This dose response was
performed using duplicate samples in both treatment and control groups. The H69 cells
were plated at an initial cell number of 3 x 10⁶ cells, and the H460 cells were plated at an
initial cell number of 500,000 cells. The H69 cells were passaged every other day and
resuspended in the appropriate medium. Medium was replaced on the H460 cells every
other day. Cells were harvested at day seven and stored at -80˚C.
23
Nicotine Treatment (Timed Response)
H69 and H460 cells were treated with 100 µM nicotine for a variety of times over
a period of four days. The H69 cells were plated at an initial cell number of 3 x 10⁶ cells,
and the H460 cells were plated at an initial cell number of 500,000 cells. As stated
before, new medium was supplemented every other day. The cells were harvested at time
zero, one hour, 24 hours, and four days.
RNA Isolation
Total cellular RNA was isolated for each sample using a Qiagen RNeasy Midi
Kit©, and the protocol provided by the manufacturer with no exceptions. The assumed
starting cell number was a range between a minimum of 5 x 10⁶ cells and a maximum of
1 x 10⁸ cells. Typical yields were approximately 200 µg total, at a concentration of 2
µg/µl.
RNA Quantification
Absorbance of total RNA was measured at 260 nm for each sample to calculate
the necessary volume to reverse transcribe 2.5 µg of total RNA. RNA was diluted to a
concentration of 1/100 prior to quantification. Each absorbance was measured in
triplicate. To quantify RNA, the calculation used was as follows:
(Average absorbance x 40 x dilution factor) / 1000 = x µg/µL.
(2.5 µg RNA) / (x µg/µL) = x µL used for Reverse Transcription.
24
Primer Design
mRNA sequences for nAChR subunits α4, α7, β2, and also GAPDH were
obtained from GenBank (gi:29570783, gi:21536283, gi:4502832, gi:7669491,
respectively). Primers were designed using PrimerExpress© software. All primer pairs
flanked an intronic sequence to ensure the absence of genomic contamination
(determined by electrophoretic analysis). Primers were purchased from Operon
Biotechnologies (Huntsville, AL). Lyophilized primers were resuspended in Buffer TE,
pH 7.0 to a concentration of 200 µM, and stored at -20oC.
Reverse Transcription
Using the protocol provided by Ambion, 2.5 µg of total cellular RNA were
reverse transcribed into cDNA for each sample. The calculated total RNA was combined
with 2 µL of random decamers and water to make a total of 12 µL. The mixture was
incubated at 75oC for 3 minutes in a thermocycler to denature the RNA, then quick-
chilled on ice to prevent snap-back. The mixture was then mixed with 0.5 µL RNAse
inhibitor, 2 µL 10X RT-buffer, 4 µL dNTP. For all +RT tubes, 1 µL of MMLV reverse
transcriptase was used. Tubes without reverse transcriptase were supplemented with 1 µL
of water. The cycle parameters were as follows: tubes were incubated at 43˚C for one
hour to reverse transcribe the RNA templates, and then the temperature was increased to
92oC for a duration of 10 minutes to denature the reverse transcriptase. The samples
remained at 4˚C until they were removed from the thermocycler.

25
Quantitative Real-Time Polymerase Chain Reaction
To obtain a standard curve to validate primer efficiencies, cDNA samples were
serially diluted as follows: 1/1, 1/4, 1/16, and 1/64 in nuclease-free water. Two AChR
subunit genes were amplified: α4, β2, plus GAPDH as the endogenous control. A master
mix for each gene was made containing 12.5 µL of SybrGreen (BioRad), 2 µL of the 10
µM sense and antisense primer buffer solution, and 5.5 µL of nuclease-free water
(Ambion) (for each well). The total volume of each master mix was dependent upon the
number of wells per gene used for the PCR reaction. The primer solution added to the
master mix for each gene was diluted to a concentration of 10 µM from the initial 200
µM stock solution by adding 5 µL of the forward primer, 5 µL of the reverse primer, and
90 µL of nuclease-free water. Each well of a 96-well plate contained 5 µL of the
respective cDNA template to which 20 µL of respective master mix were added. PCR
reactions were performed in an Applied Biosystems 7500 real-time PCR machine for 40
cycles. The parameters for the 40 cycles were as follows: 95oC for 2 minutes, then 50oC
for 10 minutes, and 60oC for 1 minute. Upon completion of the standard curve
experiment, an optimal dilution (usually 1:16) was chosen where a sufficient quantity of
gene expression was observed.
This protocol was repeated for both dose response and time course experiments.
However, for the 100 µM nicotine timed response experiment, a 1/5 dilution of cDNA
template was used instead of 1/16 due to low RNA quantities.
26
RESULTS
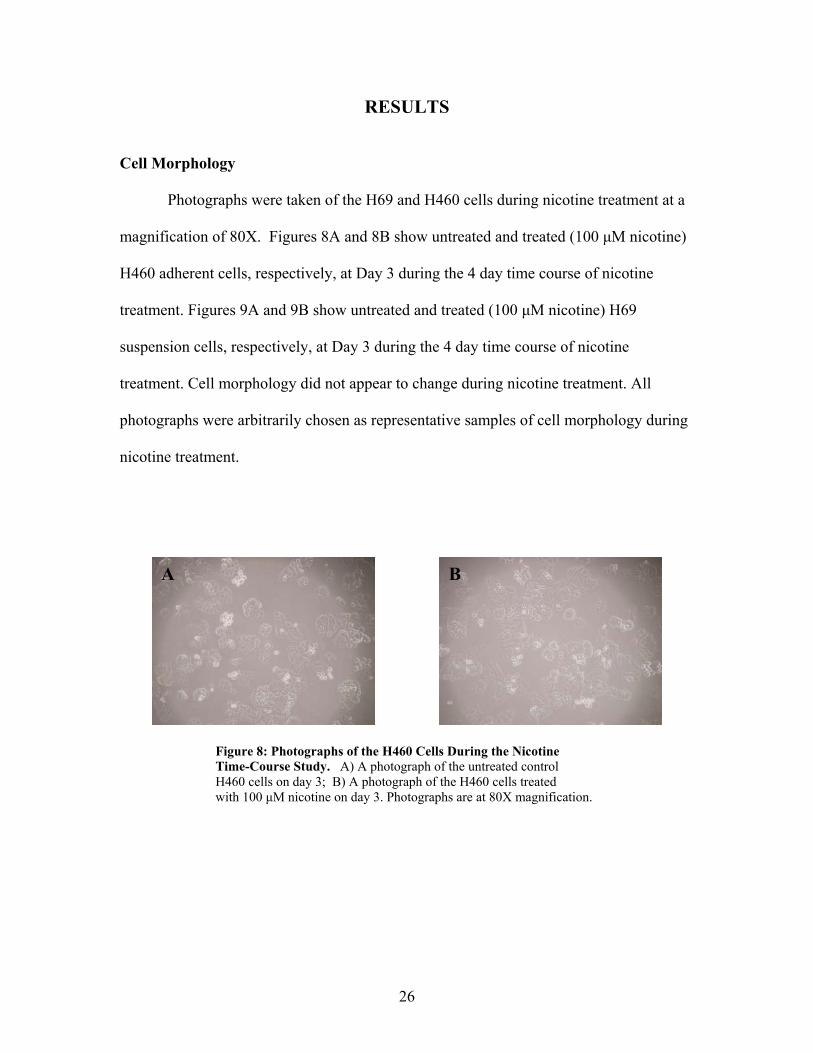
Cell Morphology
Photographs were taken of the H69 and H460 cells during nicotine treatment at a
magnification of 80X. Figures 8A and 8B show untreated and treated (100 µM nicotine)
H460 adherent cells, respectively, at Day 3 during the 4 day time course of nicotine
treatment. Figures 9A and 9B show untreated and treated (100 µM nicotine) H69
suspension cells, respectively, at Day 3 during the 4 day time course of nicotine
treatment. Cell morphology did not appear to change during nicotine treatment. All
photographs were arbitrarily chosen as representative samples of cell morphology during
nicotine treatment.
Figure 8: Photographs of the H460 Cells During the Nicotine Time-Course Study. A) A photograph of the untreated control H460 cells on day 3; B) A photograph of the H460 cells treated with 100 µM nicotine on day 3. Photographs are at 80X magnification.
A B
27
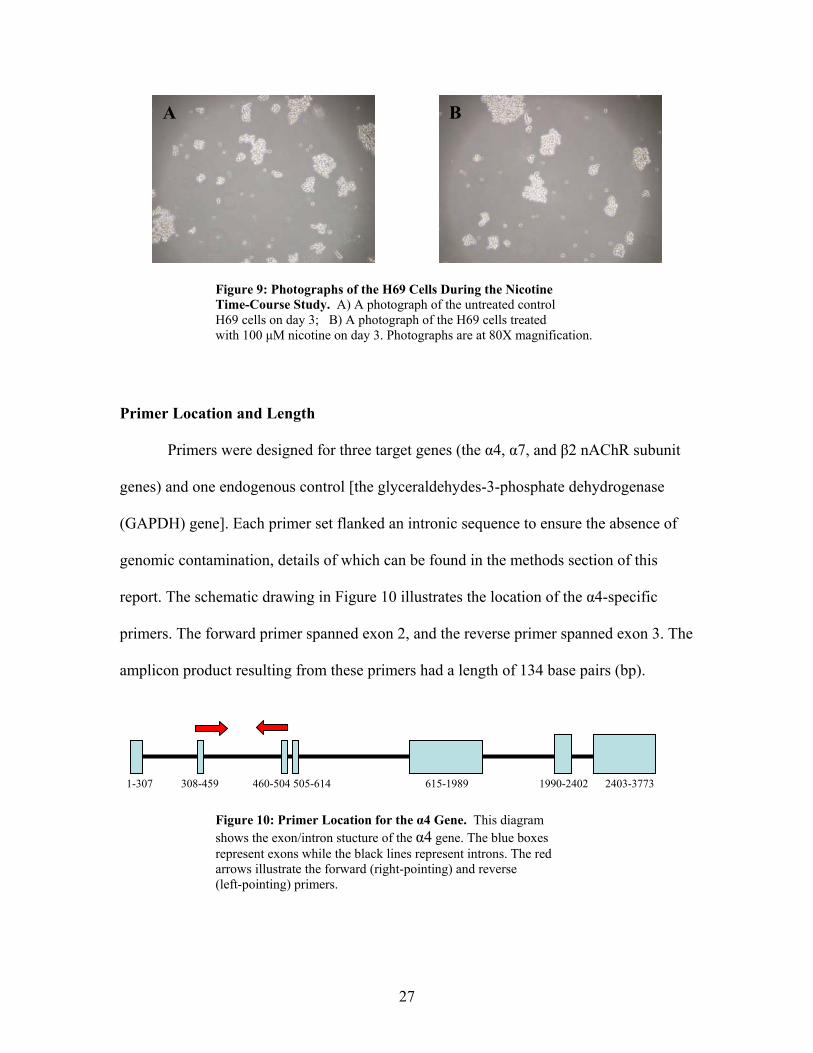
Figure 9: Photographs of the H69 Cells During the Nicotine Time-Course Study. A) A photograph of the untreated control H69 cells on day 3; B) A photograph of the H69 cells treated with 100 µM nicotine on day 3. Photographs are at 80X magnification.
Primer Location and Length
Primers were designed for three target genes (the α4, α7, and β2 nAChR subunit
genes) and one endogenous control [the glyceraldehydes-3-phosphate dehydrogenase
(GAPDH) gene]. Each primer set flanked an intronic sequence to ensure the absence of
genomic contamination, details of which can be found in the methods section of this
report. The schematic drawing in Figure 10 illustrates the location of the α4-specific
primers. The forward primer spanned exon 2, and the reverse primer spanned exon 3. The
amplicon product resulting from these primers had a length of 134 base pairs (bp).
Figure 10: Primer Location for the α4 Gene. This diagram shows the exon/intron stucture of the α4 gene. The blue boxes represent exons while the black lines represent introns. The red arrows illustrate the forward (right-pointing) and reverse (left-pointing) primers.
1-307 308-459 460-504 505-614 615-1989 1990-2402 2403-3773
A B

28
The schematic drawing in Figure 11 shows the location of the β2-specific primers.
The forward primer spanned exon 2 and the reverse primer spanned exon 3. The
amplicon product resulting from these primers had a length of 63 bp.
Figure 11: Primer Location for the β2 Gene. A schematic drawing showing the exon/intron structure of the β2 gene. The blue boxes represent exons while the black lines represent introns. The red arrows illustrate the forward (right-pointing) and reverse (left-pointing) primers.
The schematic drawing in Figure 12 illustrates the location of the α7-specific
primers. The forward primer spanned exon 5 and the reverse primer spanned exon 6. The
amplicon resulting from these primers had a length of 77 bp.
Figure 12: Primer Location for the α7 Gene. A schematic drawing showing the the exon/intron structure of the α7 gene. The blue boxes represent exons while the black lines represent introns. The red arrows illustrate the forward (right-pointing) and reverse (left-pointing) primers.
Primer Specificity
Primer specificity was determined in both the H69 and H460 cell lines prior to
nicotine treatment (Figures 13 and 14). This was necessary to validate the primers and to
determine their efficiencies. The cDNA template of each cell line was serially diluted
(1:1, 1:4, 1:16, 1:64) in order to create a standard curve, which is essential as a first step
1-328 329-474 475-519 520-629 630-1602 1603-2448
1-127 128-267 268-312 313-422 423-502 503-670 671-865 866-952 953-1062 1063-2155
29
towards determining primer efficiencies. These serial dilutions were also created to
determine the optimal dilution for all subsequent experiments.
The specificity of each set of primers in the H460 cells is shown in Figure 13. To
revisit what is seen in the real-time PCR data, an amplification plot helps to determine
what products are amplified by the primers. A dissociation curve assists in establishing
primer specificity. If a primer set is specific, only one peak should be observed at the
correct melting temperature in the dissociation curve. Additionally, amplification should
only be seen in the samples that contained reverse transcriptase in the RT-PCR
experiment, and not within those samples that did not contain reverse transcriptase (-RT).
30
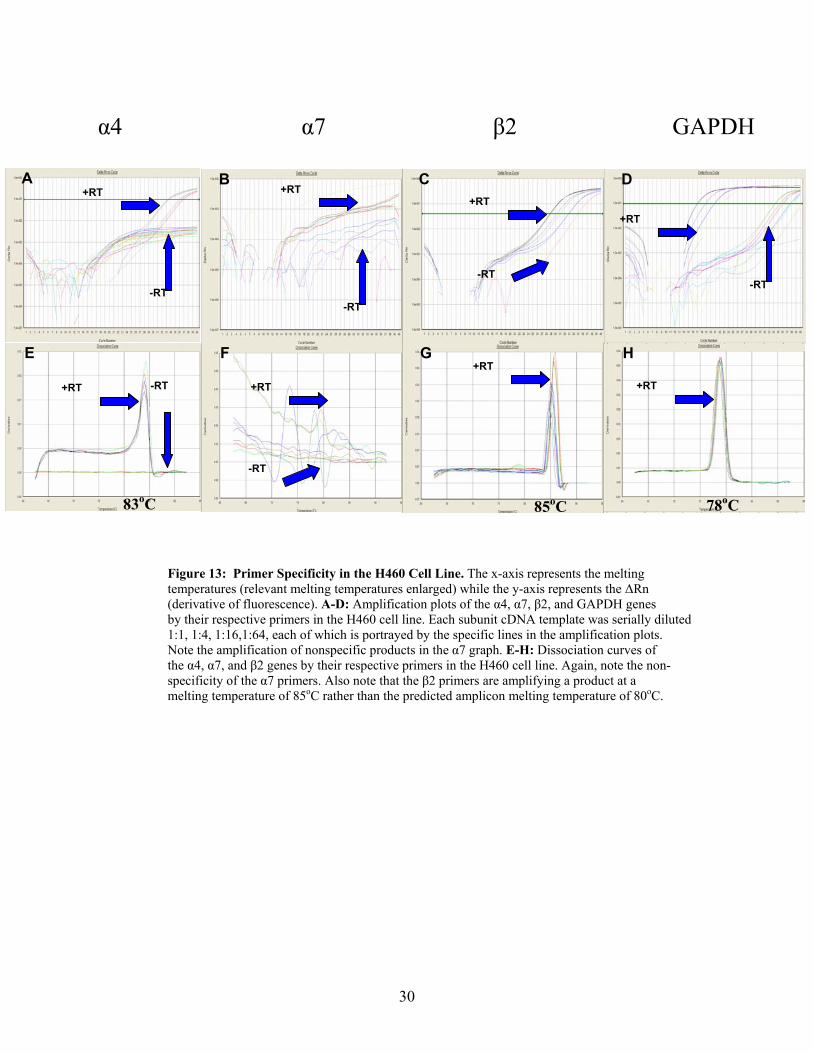
Figure 13: Primer Specificity in the H460 Cell Line. The x-axis represents the melting temperatures (relevant melting temperatures enlarged) while the y-axis represents the ∆Rn (derivative of fluorescence). A-D: Amplification plots of the α4, α7, β2, and GAPDH genes by their respective primers in the H460 cell line. Each subunit cDNA template was serially diluted 1:1, 1:4, 1:16,1:64, each of which is portrayed by the specific lines in the amplification plots. Note the amplification of nonspecific products in the α7 graph. E-H: Dissociation curves of the α4, α7, and β2 genes by their respective primers in the H460 cell line. Again, note the non- specificity of the α7 primers. Also note that the β2 primers are amplifying a product at a melting temperature of 85oC rather than the predicted amplicon melting temperature of 80oC.
A B C D
F E H G
α4 α7 β2 GAPDH
+RT
-RT
+RT +RT
+RT
+RT +RT
+RT+RT -RT
-RT-RT
-RT
-RT
85oC 78oC83oC
31
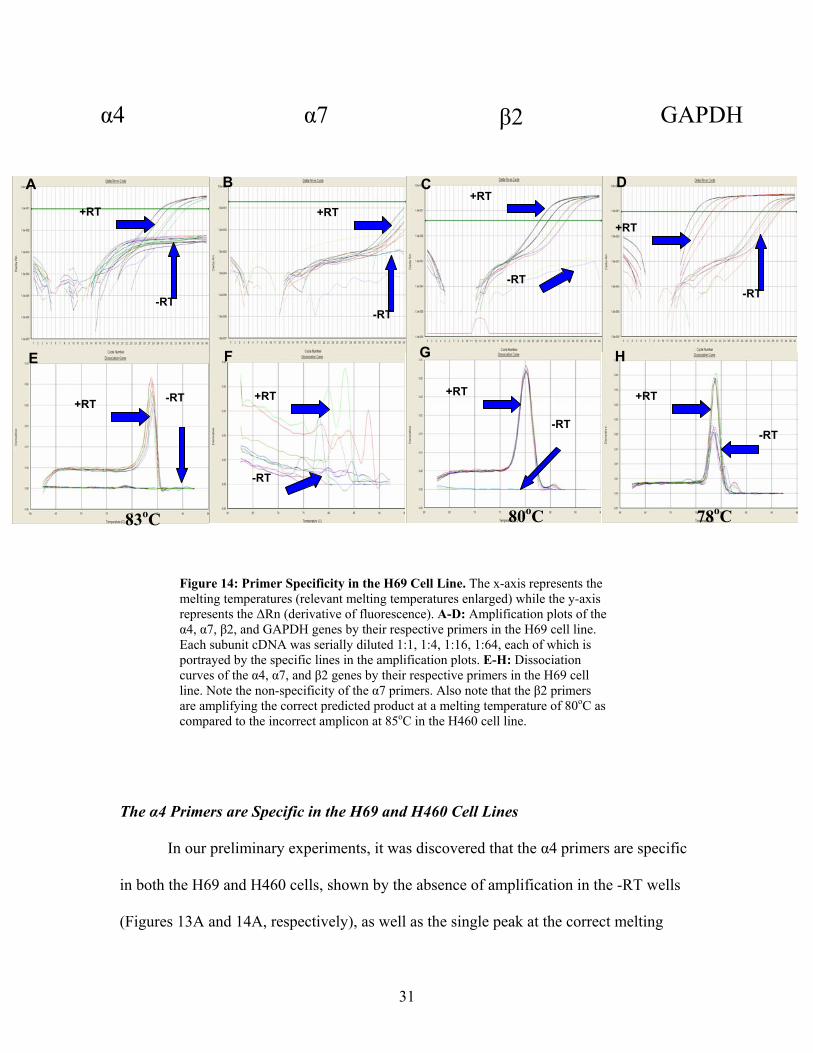
Figure 14: Primer Specificity in the H69 Cell Line. The x-axis represents the melting temperatures (relevant melting temperatures enlarged) while the y-axis represents the ∆Rn (derivative of fluorescence). A-D: Amplification plots of the α4, α7, β2, and GAPDH genes by their respective primers in the H69 cell line. Each subunit cDNA was serially diluted 1:1, 1:4, 1:16, 1:64, each of which is portrayed by the specific lines in the amplification plots. E-H: Dissociation curves of the α4, α7, and β2 genes by their respective primers in the H69 cell line. Note the non-specificity of the α7 primers. Also note that the β2 primers are amplifying the correct predicted product at a melting temperature of 80oC as compared to the incorrect amplicon at 85oC in the H460 cell line.
The α4 Primers are Specific in the H69 and H460 Cell Lines
In our preliminary experiments, it was discovered that the α4 primers are specific
in both the H69 and H460 cells, shown by the absence of amplification in the -RT wells
(Figures 13A and 14A, respectively), as well as the single peak at the correct melting
α4
A B D C
G H F E
β2 α7 GAPDH
+RT
-RT
+RT+RT
+RT
+RT +RT +RT+RT -RT
-RT-RT
-RT
-RT
-RT
-RT
83oC 80oC 78oC

32
temperature (84oC) in the dissociation curves (Figures 13E and 14E, respectively). One
important point to mention is the observation of lower expression of this subunit within
both the H69 and H460 cell lines as compared to either the β2 or GAPDH amplification
shown in Figure 13. This can be stated because of the high cycle number at which the α4
target amplicon is first detectable (cycle number 30). It was determined that the 1:16
dilution was sufficient for the detection and analysis of this nAChR subunit gene.
The α7 Primers are Not Specific in the H69 and H460 Cell Lines
Issues were encountered with the α7 primers in both cell lines as can be seen in
the non-specificity of the target gene shown in the H460 cells (Figures 13B and F) and in
the H69 cells (Figures 14B and F). Not only was there an absence of a single peak in the
dissociation curves, but the amplification in either cell line did not reach a threshold
value where all of the dilutions were amplified at the same rate. These primers were
redesigned in an attempt to obtain primers specific for the gene of interest, however no
improvement in the results were observed with the second set of primers. Therefore, this
nAChR subunit was neither further pursued nor was the optimal dilution of cDNA
determined as it was unlikely, due to time constraints, that a third set of primers could be
designed.
The β2 Primers are Not Specific in the H69 and H460 Cell Lines
In addition to the α7 primers, the β2 primers also lacked specificity, although to a
lesser extent in both the H460 and H69 cell lines (Figures 13C, G, and 14C, G,
respectively). Specifically, the correct amplicon in the H69 cells was amplified (melting
33
temperature of 80oC determined by PrimerExpress© software), however an incorrect
target was amplified in the H460 cells (melting temperature of 85˚C). Although the
primers amplified the correct target in the H69 cells, there is a slight peak at 85oC to the
right of the main target peak in the dissociation curve (Figure 14G), indicative of
amplification of a non-specific product.
As described above, the β2 primers had a small amount of non-specific
amplification in the H69 cells. However, this non-specific amplification was much higher
in the H460 cells and the β2 primers actually favored this non-specific target over the β2
gene. Figure 13G shows how the non-specific amplification at 85oC is higher than the
target amplicon at 80oC. To further analyze this non-specificity and compare the size of
the non-specific product to the predicted size of the target amplicon, gel electrophoresis
was performed on a 1.7% agarose-TBE gel. Figure 15 shows the separation of the β2
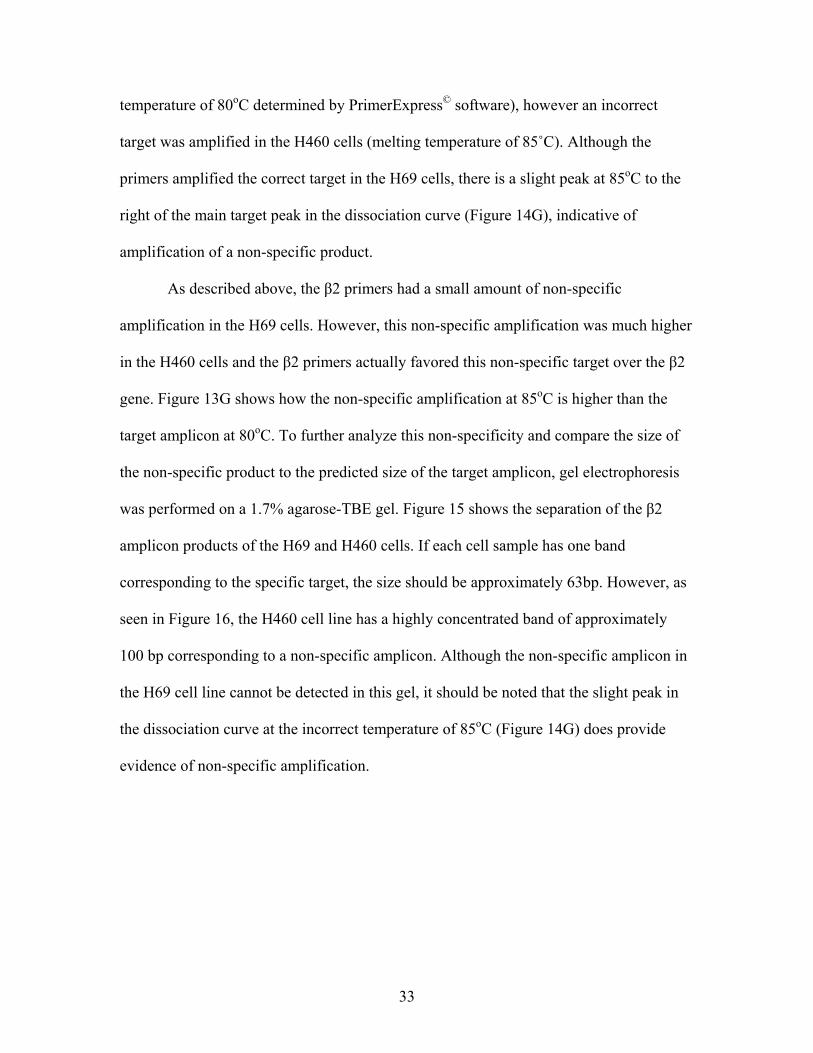
amplicon products of the H69 and H460 cells. If each cell sample has one band
corresponding to the specific target, the size should be approximately 63bp. However, as
seen in Figure 16, the H460 cell line has a highly concentrated band of approximately
100 bp corresponding to a non-specific amplicon. Although the non-specific amplicon in
the H69 cell line cannot be detected in this gel, it should be noted that the slight peak in
the dissociation curve at the incorrect temperature of 85oC (Figure 14G) does provide
evidence of non-specific amplification.
34
Figure 15: Separation of β2 Amplicon Products in Both H69 and H460 Cell Lines on 1.7% agarose/TBE. Lane 1: 1kb marker; lane 2: H69 sample; lane 4: H460 sample; lanes 6 & 8: positive control; lanes 3, 5, 7, & 9: empty. Note that the amplicon within the H69 cell line corresponds to the approximate size of the positive control, but the amplicon in the H460 cell line is entirely different.
In addition to the speculation of non-specific amplification by the β2 primers, the
possible presence of contamination was also considered. However, contamination was
discarded as a possibility since the same reagents were used for each primer set, and no
contamination was evident in any previous or future real-time PCR experiment of the
nAChR α4 subunit. It was then hypothesized that perhaps the β2 primer stock was
contaminated, as this is the only difference between each nAChR subunit’s set of samples
in a real-time PCR experiment. However, after reordering new primers, the
‘contamination’ was still present. Therefore, it was reaffirmed that the amplification
within the β2 –RT samples was due to non-specific amplification. Thus, after all of these
aforementioned analyses, the β2 primers were not used in subsequent experiments as
their efficiency would be decreased due to competition between the correct and incorrect
targets within this cell line, thereby negating their use for relative gene expression
1 2 3 4 5 6 7 8 9
35
quantification. In conclusion, the β2 subunit was not further studied due to time
constraints.
The GAPDH Primers are Specific in the H69 and H460 Cell Lines
The GAPDH primers were specific in both the H460 and H69 cell lines (Figure
13D, H, and 14D, H, respectively). However, while the GAPDH samples did exhibit non-
specific amplification in –RT samples, these primers were believed to be specific for the
following reasons. To begin, there is only one peak present in the dissociation curves of
both H460 and H69 cell lines in the +RT samples, which is very important (Figures 13H
and 14H, respectively). Additionally, despite the fact that the non-specific amplification
did occur with the GAPDH primers in the –RT samples, it was not detectable until cycle
number 35. This is in comparison to the amplification of the correct target gene,
detectable at cycle number 17. It is important to note that a typical RT-PCR reaction is
not extended past the 30th cycle. In a real-time PCR experiment however, the machine is
automatically set to carry out 40 cycles. As an example, since the α4 subunit gene is
present in such a low concentration within both cell lines, it was not detectable until
about cycle number 30 (Figures 13A and 14A). Therefore, the PCR experiment would
have to be run past cycle number 30 in order to observe the α4 gene expression.
However, because the specific target of the GAPDH primers is in such high concentration
within both cell lines, it was detectable at cycle 17 and theoretically, the PCR reaction
would not need to run past cycle 30. Therefore, the non-specific amplification observed
after cycle 30 was considered negligible and concluded to be insignificant as it was not
observed until the later phase of the PCR experiment.
36
Another reason that this non-specific amplification was concluded to be negligible
in the GAPDH samples was due to the sensitivity of real-time PCR. Because of this
sensitivity, any non-specific target could theoretically be amplified even at low dilutions.
Since RNA was not reverse transcribed in the -RT samples, the GAPDH primers
theoretically had nothing available in the real-time PCR experiment to amplify.
Therefore, it is highly probable that they amplified anything within the sample wells
present in an extremely low concentration. This could be considered to be contamination;
however, because the primers are so specific for their target gene, and thus primer
efficiency would not be decreased, GAPDH was used as the endogenous control for
subsequent experiments. In summary, the GAPDH primers were used for additional
experiments as they satisfied the requirement of specificity in these preliminary
experiments. Additionally, the 1:16 dilution was also determined to be a sufficient
dilution to use in subsequent experiments.
The α4 Subunit is Valid for Relative Gene Expression Quantification Using the ∆∆Ct
Method
Establishing primer specificity is the first step in determining whether gene
expression can be quantified using the ∆∆Ct method, which is a relative method of
quantification (Livak and Schmittgen, 2001). Once the primers are established to be
specific to the targets of interest, the next step is determining primer efficiencies between
the target gene(s) and the endogenous control. This is an essential aspect of relative
quantification since this approach describes a change in target gene expression relative to
a reference group (Livak and Schmittgen, 2001). Therefore, determining the efficiencies

37
of the α4 and GAPDH primers was an essential analysis prior to quantification in order to
validate the use of the ∆∆Ct method.
Amplification efficiency is measured as the ability of primers specific for distinct
genes (in our case, α4 and GAPDH) to amplify their target genes at the same rate (Livak
and Schmittgen, 2001). This measurement is established by first producing a standard
curve for each set of primers, using serial dilutions, and then determining how the cycle
number changes with each dilution. To begin this process, the average cycle number for
each cDNA dilution, performed in triplicate, must be calculated for each target gene.
Once these averages are established, the average cycle number for the endogenous
control is subtracted from each target gene to determine the change in cycle number
compared to the control, or ∆Ct. The log of the cDNA dilutions are then plotted on a
graph versus the ∆Ct values at each dilution. If the absolute value of the slope is close to
zero, then the efficiencies of the target and endogenous control primers are considered to
be similar and the ∆∆Ct method is validated for use (Livak and Schmittgen, 2001).
The α4 and GAPDH efficiencies were analyzed using the aforementioned
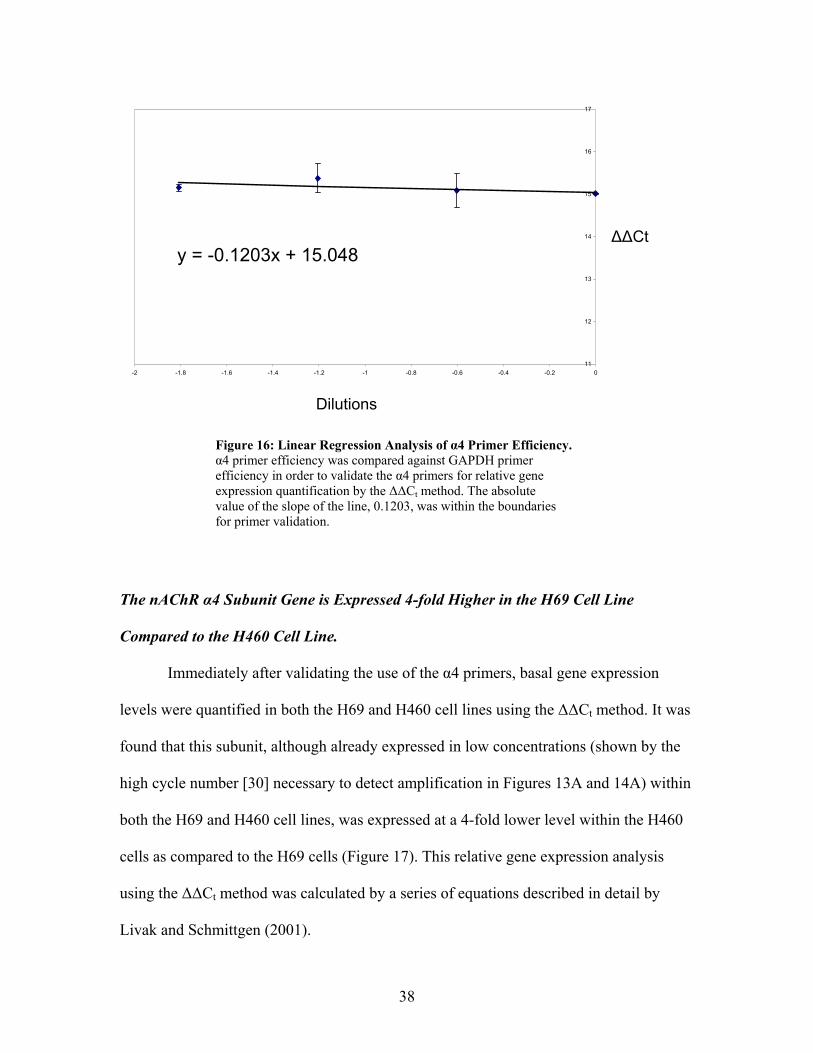
methods. Linear regression analysis of α4 primer efficiency is shown in Figure 16.
Because the absolute value of the slope of the line, 0.123, the α4 primers were able to be
used for quantitative gene expression analysis.
38
Figure 16: Linear Regression Analysis of α4 Primer Efficiency. α4 primer efficiency was compared against GAPDH primer efficiency in order to validate the α4 primers for relative gene expression quantification by the ∆∆Ct method. The absolute value of the slope of the line, 0.1203, was within the boundaries for primer validation.
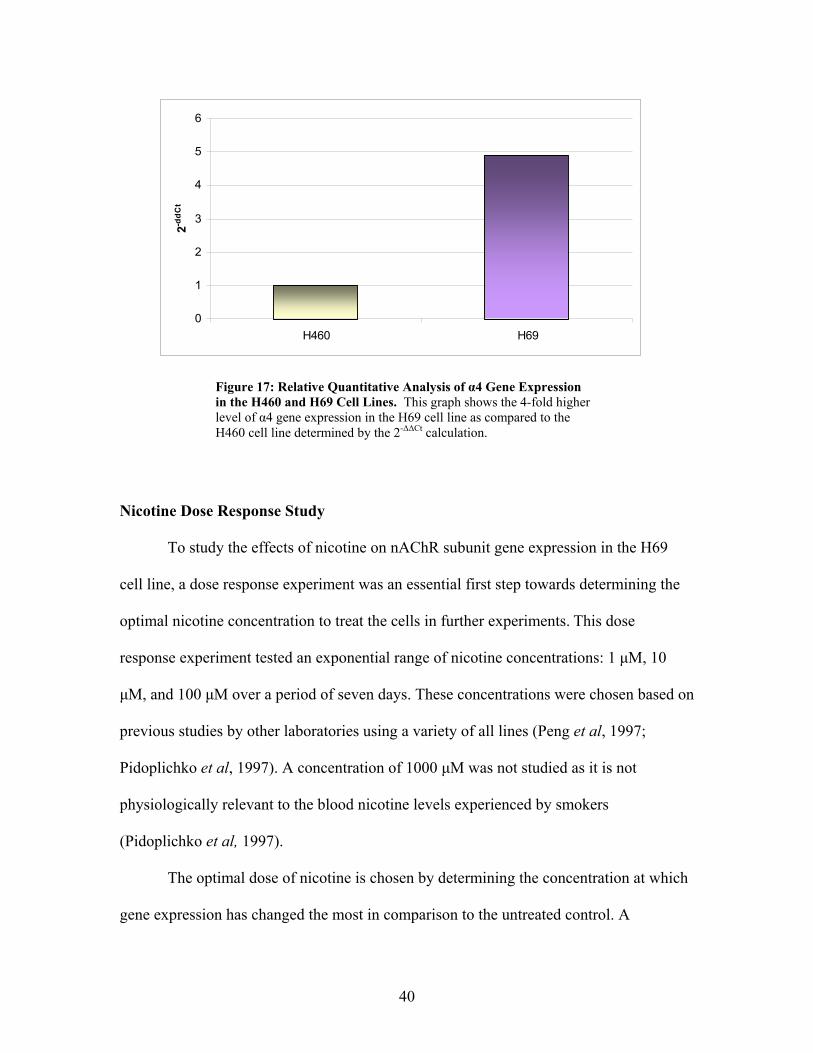
The nAChR α4 Subunit Gene is Expressed 4-fold Higher in the H69 Cell Line
Compared to the H460 Cell Line.
Immediately after validating the use of the α4 primers, basal gene expression
levels were quantified in both the H69 and H460 cell lines using the ∆∆Ct method. It was
found that this subunit, although already expressed in low concentrations (shown by the
high cycle number [30] necessary to detect amplification in Figures 13A and 14A) within
both the H69 and H460 cell lines, was expressed at a 4-fold lower level within the H460
cells as compared to the H69 cells (Figure 17). This relative gene expression analysis
using the ∆∆Ct method was calculated by a series of equations described in detail by
Livak and Schmittgen (2001).
11
12
13
14
15
16
17
-2 -1.8 -1.6 -1.4 -1.2 -1 -0.8 -0.6 -0.4 -0.2 0
Dilutions
∆∆Ct y = -0.1203x + 15.048
39
To provide some detail, the average cycle number (Ct) of each target gene is
calculated and normalized against the endogenous control in order to account for any
variance in the initial starting RNA concentrations (∆Ct) (Livak and Schmittgen, 2001).
Standard devations are calculated from triplicate samples of each gene. The ∆Ct is then
calculated as described above in the previous section. Because the expression of the α4
subunit gene was compared between cell lines in this study, one cell line had to be chosen
as a reference point with which to compare any differences in expression of the α4
subunit gene. Therefore, to begin this calculation, the H460 cell line was arbitrarily
chosen as the calibrator. Next, the ∆∆Ct calculation is performed. To do so, the ∆Ct of the
α4 subunit in the H460 cell line was subtracted from itself to obtain a value of zero
(again, this was done in order to use the H460 cell line as a calibrator). Then the ∆Ct for
α4 subunit gene expression in the H460 cell line was subtracted from the α4 subunit gene
expression in the H69 cell line. This was done to obtain the ∆∆Ct value for the H69 cells.
Finally, the ∆∆Ct values for both the H69 and H460 cell lines were used to calculate the
normalized relative gene expression in the equation 2-∆∆Ct. These values were then plotted
on a bar chart to visually represent the difference in gene expression between the two cell
lines, shown in Figure 17.
As stated previously, the H69 cell line was characterized by a 4-fold higher level
in α4 subunit gene expression as compared to the H460 cell line. The H69 cell line was
chosen for study as it appeared to be a stronger candidate than the H460 cells after
evaluation of primer non-specificity and low α4 subunit gene expression.
40
Figure 17: Relative Quantitative Analysis of α4 Gene Expression in the H460 and H69 Cell Lines. This graph shows the 4-fold higher level of α4 gene expression in the H69 cell line as compared to the H460 cell line determined by the 2-∆∆Ct calculation.
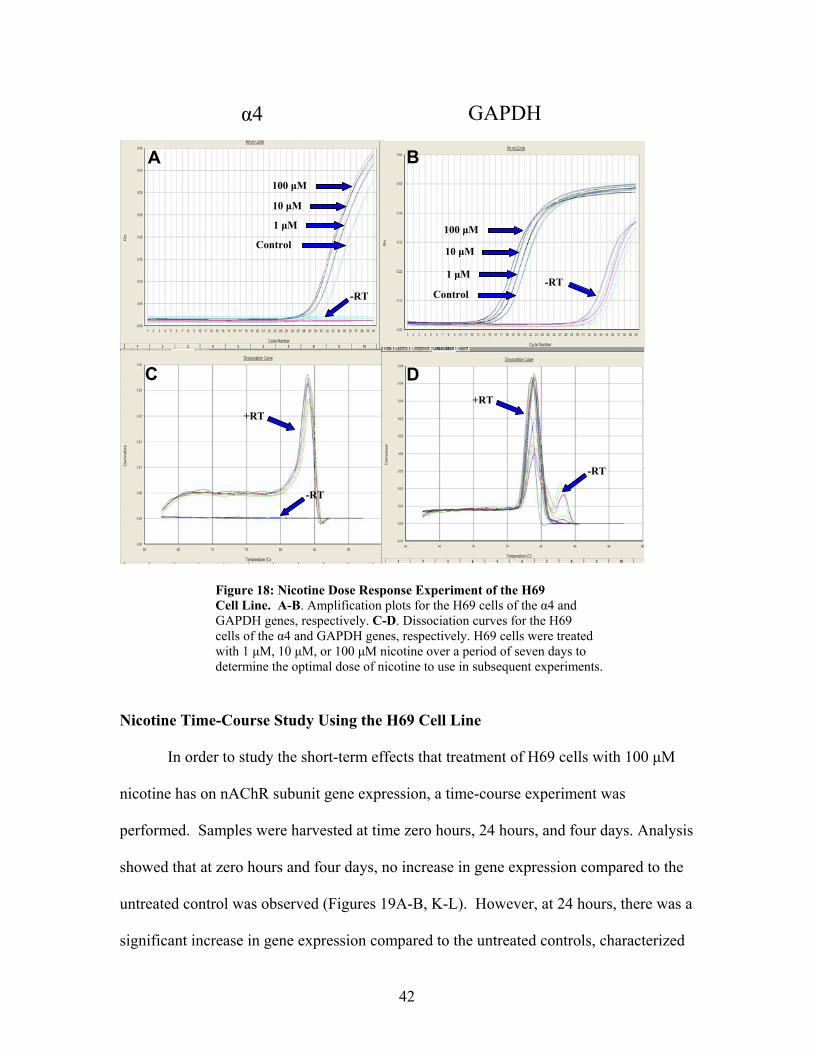
Nicotine Dose Response Study
To study the effects of nicotine on nAChR subunit gene expression in the H69
cell line, a dose response experiment was an essential first step towards determining the
optimal nicotine concentration to treat the cells in further experiments. This dose
response experiment tested an exponential range of nicotine concentrations: 1 µM, 10
µM, and 100 µM over a period of seven days. These concentrations were chosen based on
previous studies by other laboratories using a variety of all lines (Peng et al, 1997;
Pidoplichko et al, 1997). A concentration of 1000 µM was not studied as it is not
physiologically relevant to the blood nicotine levels experienced by smokers
(Pidoplichko et al, 1997).
The optimal dose of nicotine is chosen by determining the concentration at which
gene expression has changed the most in comparison to the untreated control. A
0
1
2
3
4
5
6
H460 H69
2-ddC
t
41
significant change in expression is visually established by a difference of two or more
cycles between the untreated control and the target of interest. Since α4 subunit gene
expression differed by two cycle numbers in response to 100 µM nicotine, it was
determined that this concentration affected gene expression the most (Figure 18A). A
visual analysis was the only tool available after this study was performed because
mathematical analysis tools were not available at the time. However, towards the end of
this project, when these tools were available, reanalysis of these data unexpectedly
showed that 10 µM nicotine had actually increased gene expression the most as compared
to an untreated control. Therefore, while 100 µM nicotine was the concentration used for
all subsequent nicotine treatment experiments in our project, it is important to consider
using 10 µM nicotine treatment in future studies.
42
Figure 18: Nicotine Dose Response Experiment of the H69 Cell Line. A-B. Amplification plots for the H69 cells of the α4 and GAPDH genes, respectively. C-D. Dissociation curves for the H69 cells of the α4 and GAPDH genes, respectively. H69 cells were treated with 1 µM, 10 µM, or 100 µM nicotine over a period of seven days to determine the optimal dose of nicotine to use in subsequent experiments.
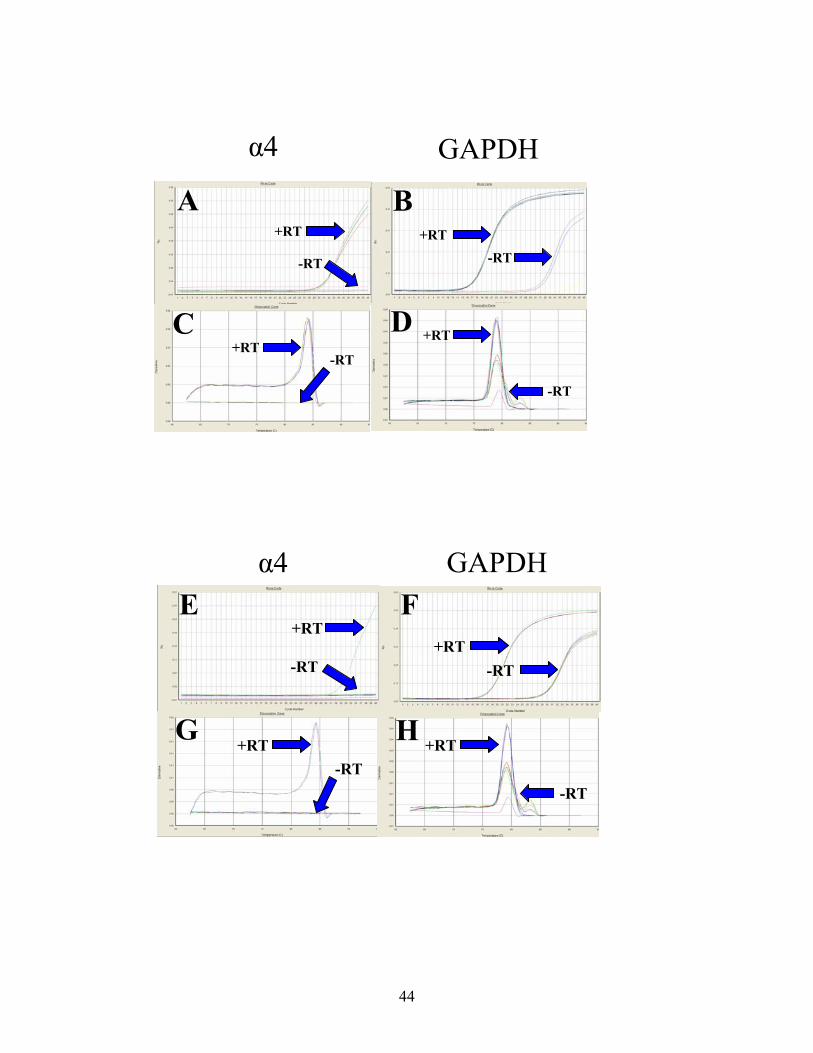
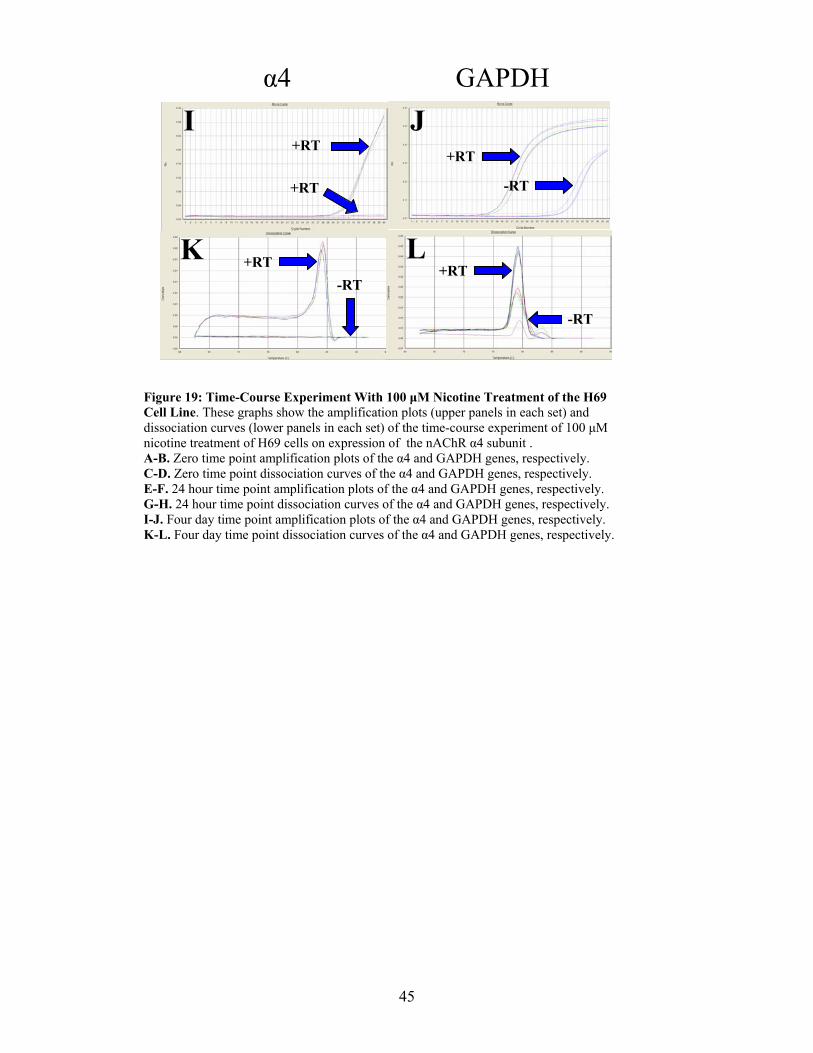
Nicotine Time-Course Study Using the H69 Cell Line
In order to study the short-term effects that treatment of H69 cells with 100 µM
nicotine has on nAChR subunit gene expression, a time-course experiment was
performed. Samples were harvested at time zero hours, 24 hours, and four days. Analysis
showed that at zero hours and four days, no increase in gene expression compared to the
untreated control was observed (Figures 19A-B, K-L). However, at 24 hours, there was a
significant increase in gene expression compared to the untreated controls, characterized
α4 GAPDH
B
C D
A
-RT
10 µM
100 µM
1 µM
Control 100 µM
10 µM
1 µM
Control -RT
-RT
-RT
+RT +RT
43
by a difference of more than two cycle numbers (Figures 19G-I). However, in addition to
this, GAPDH gene expression also changed significantly with nicotine treatment at 24
hours. Therefore, no relative quantitative analyses can be performed on the expression of
the α4 subunit gene during this time-course study. Since the validity of using an
endogenous control during real-time PCR experiments is attributed to a housekeeping
gene’s hypothetical stable expression, changes in control gene expression are not
acceptable if quantification is to be performed. If control gene expression does change
during treatment, a different control must be tested. Therefore, because GAPDH gene
expression increased with nicotine treatment during the time-course experiment,
quantitative data analysis could not be performed. However, despite this fact, it was
possible to make some qualitative assumptions addressed in the Discussion section of this
report. Due to time constraints, it was not possible to choose an alternative endogenous
control, design primers, and repeat all of the previously undertaken experiments.
44
α4
A B
C D
GAPDH
+RT
-RT
+RT -RT
+RT -RT
+RT
-RT
H
E
G
F+RT
-RT +RT
-RT
-RT -RT
+RT +RT
α4 GAPDH
45
Figure 19: Time-Course Experiment With 100 µM Nicotine Treatment of the H69 Cell Line. These graphs show the amplification plots (upper panels in each set) and dissociation curves (lower panels in each set) of the time-course experiment of 100 µM nicotine treatment of H69 cells on expression of the nAChR α4 subunit . A-B. Zero time point amplification plots of the α4 and GAPDH genes, respectively. C-D. Zero time point dissociation curves of the α4 and GAPDH genes, respectively. E-F. 24 hour time point amplification plots of the α4 and GAPDH genes, respectively. G-H. 24 hour time point dissociation curves of the α4 and GAPDH genes, respectively. I-J. Four day time point amplification plots of the α4 and GAPDH genes, respectively. K-L. Four day time point dissociation curves of the α4 and GAPDH genes, respectively.
I J
K L
+RT
+RT
+RT
-RT
+RT -RT
+RT
-RT
α4 GAPDH

46
DISCUSSION
The purpose of this study was to analyze the effects of nicotine treatment on the
expression of nicotinic acetylcholine receptor (AChRs) genes in the H69 and H460
human lung carcinoma cell lines. The cells were treated using a range of nicotine
concentrations to determine the optimal dose required to observe an effect on gene
expression.
To begin this project, efficient primers were necessary to amplify the target genes
within these cell lines. We designed primer sets for the α4, α7, and β2 nAChR subunit
genes, and the housekeeping gene GAPDH. While the α4 primers were efficient in
amplifying the correct target in both cell lines, the α7 primers were non-specific for their
target gene in both the H69 and H460 cell lines as can be seen in Figures 13 and 14.
Since non-specific amplification decreases the efficiency of the primers to amplify the
target gene at a hypothetical 100%, the α7 subunit had to be discredited for quantitative
analysis and further experiments.
The β2 primers were specific for the target gene in the H69 cell line; however,
they were not specific in the H460 cell line. This was determined by the proposed
amplicon melting temperature provided by PrimerExpress©. The correct melting
temperature for the β2 amplicon was 80oC, which was observed in the H69 cell line.
However, in the H460 cell line, the amplicon melting temperature was observed at 85oC.
Despite the first assumptions that the β2 primers were specific for their target in the H69
cell line, further analysis proved that these primers were also amplifying non-specific
products in H69 cells. Therefore, the β2 primers were also discredited for quantitative
47
analysis and further experiments since non-specific amplification decreases primer
efficiency.
Amplification of the α4 subunit gene by its respective primers was specific,
however, expression was low in both cell lines. Since the α4 primers were specific in
both cell lines, their efficiency (compared to that of the endogenous control GAPDH) was
analyzed and showed that they were valid for quantifying gene expression using the ∆∆Ct
method. Quantification analysis using this method established that the α4 subunit gene is
expressed at a 5-fold lower level in the H460 cell line as compared to the H69 cell line
(Figure 17). Therefore, all of the aforementioned results led us to conclude that with the
limited time available, the H69 cell line was a much stronger candidate for nicotine
treatment studies.
A dose-response experiment was then performed on the H69 cell line over a
period of seven days in order to determine the optimal nicotine concentration to treat cells
in subsequent experiments. After data analysis, it was observed that 100 µM nicotine
increased the nAChR subunit gene expression the most compared to the untreated
controls. Therefore, this concentration was used for all subsequent experiments.
However, upon reanalysis of these data at a later time point, it was unexpectedly
discovered that the 10 µM nicotine concentration had actually produced the greatest
change in α4 subunit gene expression, an important point for future experiments.
A time-course experiment was then performed using 100 µM nicotine in order to
study the short-term effects of nicotine treatment on α4 nAChR subunit gene expression
in the H69 cell line. The purpose of this experiment was to further analyze exactly when
the increase in subunit gene expression occurs in order to further provide information on
48
the gene expression of nAChRs, and the mechanism behind nicotine addiction. After data
analysis, the most prominent change in α4 gene expression was an increase at 24 hours.
This time-point is of great interest since α4 subunit gene expression in the untreated
control was undetectable compared to the treated samples. Furthermore, amplification of
the α4 subunit in the GAPDH and treated samples at the 0 and 4 day time points were
detectable, but no change in gene expression was detected in any of these samples
(Figures 19A-L).
Although the expression of the GAPDH gene was not previously determined to
change with nicotine treatment during the dose-response experiment, it unfortunately
increased compared to the untreated controls during the time-course study, specifically at
24 hours (Fig 13D-H). Moreover, throughout each real-time PCR, the GAPDH samples
that were not reverse transcribed (-RT) were observed to have amplification. This led us
to the conclusion that these samples were either contaminated, or the primers were non-
specific. To elaborate, it is possible that contamination was not an issue as the same
reagents were used for each cDNA sample, and amplification was never observed in any
of the –RT α4 samples. Therefore, non-specific amplification by the GAPDH primers
may have been the issue at hand. However, this cannot be proven since the ‘no template
controls’ (NTC), where no cDNA template was present, of the GAPDH samples also had
amplification. The oddity in this observation is that the α4 NTC samples never had
amplification. Therefore, if it was contamination, it should have been present in these
samples throughout each experiment. In conclusion, it is difficult to confidently state
what phenomenon was occurring. It may also be possible that nicotine treatment of these
cells indeed upregulates GAPDH expression, and that GAPDH can no longer be
49
considered a true “housekeeping” gene. GAPDH has been shown to have functions other
than housekeeping glucose metabolism (Tisdale, 2002).
In summary, due to the unexpected results throughout each experiment, the
following are suggested recommendations. First and foremost, a new endogenous control
must be chosen, validated, and observed for changes in gene expression during nicotine
treatment. Since a new endogenous control is necessary, all previous experiments must
be repeated. In addition, new β2 and α7 primers must be designed such that they are
specific for their target gene in both cell lines.
Due to the unexpected result after data analysis that 10 µM nicotine stimulated the
greatest change in α4 subunit gene expression, this phenomenon should be further
evaluated. Furthermore, the time-course experiment should also be repeated in order to
verify the increase in gene expression observed in the α4 subunit at 24 hours. If these data
are reproducible, additional nicotine treatment studies should be performed where
samples are taken on an hourly basis to determine precisely the length of time required to
see this change in gene expression.
The purpose of this project was to quantify gene expression levels of nAChRs
subunits after short-term and long-term nicotine treatment. This study is relevant in
providing additional information regarding the molecular mechanisms behind nicotine
addiction and cancer. It is essential to use techniques such as real-time PCR to provide
quantitative analysis for future research.
50
REFERENCES American Cancer Society (2005) Facts and Figures. Statistics for 2005. Found on April 3, 2005 at: http://www.cancer.org/docroot/home/index.asp Benhammou K et al (2000) [3H] Nicotine binding in the peripheral blood cells of smokers is correlated with the number of cigarettes smoked per day. Neuropharmacology 39: 2818-2829. Benwell ME, Anderson JM, and Balfour DJ (1988) Evidence that Tobacco Smoking Increases the Density of (-)-[3H]nicotine Binding Sites in Human Brain. Journal of Neurochemistry, 50(4): 1243-1247. Cattaneo MG et al (1993) Nicotine Stimulates a Serotonergic Autocrine Loop in Human Small-Cell Lung Carcinoma. Cancer Research, 53: 5566-5568. Dajas-Bailador F and Wonnacott S (2004) Nicotinic Acetylcholine Receptors and the regulation of Neuronal Signaling. TRENDS in Pharmacological Sciences, 25(6): 317-324. Dani JA, Ji D and Zhou FM (2001) Synaptic Plasticity and Nicotine Addiction. Neuron, 31: 349-352. Dart MJ et al (2000) Structural Aspects of High Affinity Ligands For The alpha 4 beta 2 Neuronal Nicotinic Receptor. Pharmaceutica acta Helvetiae, 74:115-123. Dorak MT (2005) Real-time PCR. Clinical Medical Sciences. Found on March 30, 2005 at: http://dorakmt.tripod.com/genetics/realtime.html Institute of Neurosciences (2005) How Drugs Affect Neurotransmitters. Found on March 30, 2005 at: http://www.thebrain.mcgill.ca/flash/i/i_03/i_03_m/i_03_m_par/i_03_m_par_nicotine.html Jain R and Murkherjee K (2003) Biological Basis of Nicotine Addiction. Indian Journal of Pharmacology, 35: 281-289. Laviolette SR and van der Kooy D (2004) The Neurobiology of Nicotine Addiction: Bridging the Gap from Molecules to Behaviour. Nature Reviews Neuroscience, 5: 55-65. Lechniak D (2002) Quantitative Aspect of Gene Expression Analysis in Mammalian Oocytes and Embryos. Reproductive Biology, 2(3): 229-241. Livak KJ and Schmittgen TD (2001) Analysis of Relative Gene Expression Data Using Real-Time Quantitative PCR and the 2-∆∆Ct Method. Methods, 25: 402-408.
51
Mai H et al (2003) A Functional Role for Nicotine in Bcl2 Phosphorylation and Suppression of Apoptosis. The Journal of Biological Chemistry, 278(3): 1886-1891. Marks M et al (1992) Nicotine Binding and Nicotinic Receptor Subunit RNA After Chronic Nicotine Treatment. The Journal of Neuroscience, 12(7): 2765-2784. National Institute on Drug Abuse (NIDA) Research Report Series (2001) Nicotine Addiction. National Institute of Health, 1-8. Found on March 25, 2005 at: http://www.nida.nih.gov/researchreports/nicotine/nicotine2.html#what Peng X et al (1997) Chronic Nicotine Treatment Up-Regulates α3 and α7 Acetylcholine Receptor Subtypes Expressed by the Human Neuroblastoma Cell Line SH-SY5Y. Molecular Pharmacology, 51: 776-784. Picciotto MR et al (1998) Acetylcholine Receptors Containing the β2 Subunit are Involved in the Reinforcing Properties of Nicotine. Nature, 391: 173-177. Pidoplichko VI (1997) Nicotine Activates and Desensitizes Midbrain Dopamine Neurons. Nature, 390: 401-404. Provenzano M et al (2001) The Usefulness of Quantitative Real Time PCR in Immunogenetics. Scientific Communications, 89-91. Schapira M, Abagyan R and Totrov M (2002) Structural Model of Nicotinic Acetylcholine Receptor Isotypes Bound to Acetylcholine and Nicotine. BMC Structural Biology, 2(1): 1-8. Séguéla P et al (1993) Molecular Cloning, Functional Properties, and Distribution of Rat Brain α7: A Nicotinic Cation Channel Highly Permeable to Calcium. Journal of Neuroscience, 13(2): 596-604. Severance EG et al (2004) The α7 Nicotinic Acetylcholine Receptor Subunit Exists in Two Isoforms that Contribute to Functional Ligand-Gated Ion Channels. Molecular Pharmacology, 66: 420-429. Song P et al (2003) Synthesis of Acetylcholine by Lung Cancer. Life Sciences, 72: 2159-2168. Tisdale EJ (2002) Glyceraldehyde-3-phosphate Dehydrogenase is Phosphorylated by Protein Kinase Cι/λ and Plays a Role in Microtubule Dynamics in the Early Secretory Pathway. Journal of Biological Chemistry, 277: 3334-3341. Trombino S et al (2004) α7-Nicotine Acetylcholine Receptors Affect Growth Regulation of Human Mesothelioma Cells: Role of Mitogen-Activated Protein Kinase Pathway. Cancer Research, 64: 135-145.


![18F]Flubatine as a novel α4β2 nicotinic acetylcholine](https://img.dokumen.tips/doc/110x75/629737326d4e5a451c0d4cae/18fflubatine-as-a-novel-42-nicotinic-acetylcholine-.jpg)