Embed Size (px)
Citation preview

Real-Time Implementation of Locality Sensitive Hashing UsingNI WSN and LabVIEW for Outlier Detection in Wireless Sensor
Networks
Subhashree V.K.∗and Tharini C.Department of Electronics and Communication Engineering, B.S.Abdur Rahman University
Vandalur, Chennai, Tamilnadu, Indiasubhashree ece phd 2013, [email protected]
Abstract
Outlier detection is one of the major challenges in wireless sensor networks. To the best of ourknowledge, not many have evaluated the performance of outlier detection algorithms in real time.This paper proposes a real time hardware implementation of outlier detection using locality sensitivehashing algorithm for temperature data and evaluated both in indoor and outdoor environments. NIWSN 3202 programmable nodes and NI 9792 programmable gateway is used for hardware imple-mentation of the algorithm and LabVIEWTM software is used for programming the nodes. The LSHtechnique detects outliers based on the threshold value. Hence the outlier detection accuracy andprecision are analyzed for various threshold values and the optimal threshold value is selected.
Keywords: outlier, threshold, LSH, NI gateway and nodes, LabVIEWTM, WSN
1 Introduction
Wireless Sensor Networks (WSN) is used in various applications such as military, environment moni-toring, habitat monitoring, smart cities, etc. In real time monitoring of data, there are chances of somefaults to occur [1]. The faults may both external and internal. The faults may be external due to intrusion,denial of service or any other security issues, or sometimes it may be internal faults caused due to faultynodes, communication failure, damage of the node, unwanted sensing of events, etc.The data having significant variations from the normal data that are previously collected by the samenode or the data collected by the neighboring nodes is referred as outlier data. The main sources ofoutliers are noise and errors, unwanted event detection, malicious attacks, etc. There are two types ofoutliers namely Local outliers and Global outliers. The local outliers are identified at individual sensornodes and global outliers are identified by the data aggregator or the sink node. Detecting the local out-liers save communication overhead and enhances scalability. Detecting the global outliers optimizes theresponse time and energy consumption. The outlier detection and elimination is done to improve the dataaggregation accuracy in the network.In WSN, the outlier detection is done in various domains such as fault detection, event detection andintrusion detection. The conventional outlier detection techniques might not be suitable for handlingsensor data in WSN due to the following reasons such as resource constraints, high communication cost,distributed streaming data, dynamic network topology, frequent communication failures, mobility andheterogeneity of nodes, large scale deployments, identify outlier sources, etc. To overcome these issues,many outlier detection techniques are specifically developed for WSN and are classified based on statis-tical, nearest neighbor, clustering, classification, spectral decomposition, etc., [2], [3].
Journal of Wireless Mobile Networks, Ubiquitous Computing, and Dependable Applications, 7:3 (September 2016), pp. 22-39∗Corresponding author: Department of Electronics and Communication Engineering, B.S.Abdur Rahman University, Van-
dalur, Chennai, Tamilnadu, India, Tel: +91-900-322-7746
22

LSH using NI WSN for Outlier Detection Subhashree V.K. and Tharini C.
The most commonly used algorithms for outlier detection are Kernel density estimation, Rough set the-ory, Locality Sensitive Hashing, Bayesian belief network, Support Vector Machine, etc.[2], [4]. In datamining and machine learning communities, nearest neighbor based approaches are the most commonlyused for analyzing the data instance with respect to its nearest neighbor. The distance (similarity) metricsare used to compute the distance between two data instances. A data instance is declared as an outlierif it is located far from its neighbors. In the context of sensor networks, the data is an outlier if it hassignificant variation from the normal data collected by the neighboring nodes. Locality sensitive hashingtechnique is one of the nearest neighbor based approach, which leads to a compact representation ofobjects so that the similarity of the objects can be estimated from these compact sketches [1].In this paper, Locality Sensitive Hashing algorithm is used for outlier detection. A real time hardwareimplementation of the algorithm is done using the National Instruments (NI) Wireless Sensor Network(WSN) programmable nodes and gateway. The experiments are carried out both in indoor and outdoorenvironments and the temperature data is monitored and the outlier data is detected. The paper is orga-nized as: Section 2 summarizes the related work, Section 3 presents the theoretical concepts of LocalitySensitive Hashing technique with illustrative examples, Section 4 describes the experimental setup andperformance evaluation and Section 5 concludes the paper.
2 Related Work
The related work in Locality Sensitive Hashing technique is discussed in this section. In [5], the authorshave described the theory and implementation of a randomized algorithm known as locality sensitivehashing (LSH). The LSH algorithm uses dot products with random vectors to quickly find the nearestneighbors. LSH algorithm provides a probabilistic guarantee by reducing the computational error andsignificantly improves the computational performance. The application of LSH algorithm includes find-ing duplicate page on the web, image and music retrieval, etc. LSH is useful in identifying the nearestneighbors quickly even for large databases. In [6], the locality sensitive hashing scheme is analyzed forvarious similarity metrics such as Euclidean distance, Jaccard distance, Edit distance, Cosine distance,Hamming distance, etc. The LSH technique is mainly used for applications such as entity resolution,finger print matching, matching of newspaper articles, etc. The LSH based methods are most effectivewhen the degree of similarity is relatively low.In [1], outlier detection based fault tolerant data aggregation for wireless sensor networks is proposed.The aim of the algorithm is to eliminate outlier data sent by the malfunctioning and / or compromisedsensor nodes. A random hyperplane projection (RHP) based Locality sensitive hashing (LSH) techniqueis used to detect the outlier and redundant data. The proposed scheme is able to reduce the numberof false data transmission and increase the data aggregation accuracy. In [7], several families of spacehashing functions in a real setup are compared. The Artificial Neural Network (ANN) based locality sen-sitive scheme is described for both structured and unstructured quantizers. The comparison of randomprojections, lattice quantizers, k-means and hierarchical k-means quantizers reveals that unstructuredquantizers improves accuracy of LSH, as it closely fits the data in the feature space. K-LSH, multi-probeLSH and query-adaptive K-LSH querying mechanisms are compared in the context of dataset size, mem-ory usage and recall. The query-adaptive K-LSH method was found to be the best as it was suitable forvery large data sets, with no memory constraints.In [8], the authors have discussed on how to derive optimal parameters for LSH. Some of the optimiza-tion parameters include quantization interval, number of dot products, bin width, CPU time, etc. Theperformance evaluation is done using the numerical and experimental simulation on wide range of realdata bases. In [9], an approximate algorithm for distance based outlier detection using LSH technique
23

LSH using NI WSN for Outlier Detection Subhashree V.K. and Tharini C.
is proposed. In case of very large datasets collected from various input sources, the data is distributedacross the network. LSH technique is used to prune all the objects which cannot be outliers and processonly the remaining objects to find the actual outliers. The computational complexity is reduced for dis-tributed setting when compared to centralized setting. Experiments are performed on data sets collectedfrom UCI machine learning repository. The performance is evaluated by varying the bin threshold andby choosing the optimal bin threshold; the false positives values of the data are reduced. The number ofprocessed objects after pruning is less than 1% for large datasets.
Most of the prominent outlier detection techniques focuses on the optimization of parameters, andconsiders only univariate data. As summarized in table 1, most techniques use real datasets collectedfrom various repositories for their analysis, but there is only a lesser focus on real time hardware imple-mentation of the algorithms. In [13], temperature, humidity sensors are attached to the aurdino boardand using zigbee, the sensed data is transmitted to the base station. Once the data is gathered, a database is created and using MYSQL and MATLAB, the outlier detection based on filters are done usingsimulations. In this paper, the LSH algorithm is implemented using real time hardware for eliminationof outlier data. For every ‘m’ set of sensed data, the node sends the LSH code to the gateway. The gate-way collects the LSH codes from its neighboring nodes, calculates the cosine and the hamming distancebetween the LSH codes. If the distance is found to be negative, the gateway eliminates the data from thenode to be outlier. The optimal threshold value is identified based on the accuracy and precision valuefor various threshold values.
3 Locality Sensitive Hashing
In data mining, the Locality Sensitive Hashing (LSH) technique is used to find the similar entries inlarge databases by finding out the approximate matches efficiently [5]. Locality Sensitive Hashing isone example of the family of min-hash functions [7]. LSH algorithm uses a distance metric to measurethe similarity between sensor node data sets. A distance metric for a set of data points (space) is afunction f(u,v) that takes two points u and v from the space as arguments and produces a real number asa distance between them [6]. In this paper, the cosine distance and the hamming distance is used to findthe similarity between the data points and detect the outlier data [6].Assume that two data points u and v are in a d-dimensional space. Let R be the radius of a d-dimensionalspace. If the distance between u and v is less than R, then u is a R-near neighbor of v. LSH technique isused to similarity between the data points u and v. A family f(u,v) is said to be locality sensitive if,
d(u,v)≤ R, the probability that f(u)=f(v)is P1 (1)
d(u,v)≥ R, the probability that f(u)=f(v)is P2 (2)
where d(u,v) is the distance between the data points u and v, P1 is the probability that the data set u andv are similar, P2 is the probability that there is no similarity between u and v as denoted in equation (1)and (2). If the distance between u and v is less than R, then u is an R-near neighbour of v. The LSHalgorithm outputs whether there is an R-near neighbour for a data point or not [7].
Random Hyperplane Projection (RHP)
In order to use the LSH for finding the similarities and outliers in sensor node data sets using the co-sine and hamming distance, a technique that works with vectors have to be used. Random Hyperplane
24

LSH using NI WSN for Outlier Detection Subhashree V.K. and Tharini C.
Table 1: Comparison of outlier detection techniquesTechnique Outlier
detectionalgorithm
Distancemeasures
Real/syntheticdatasets
HardwareImplemen-tation
Description
LoicPauleve etal. [7]
Localitysensitivehashing
– Synthetic No Unstructured quantizers perform better thanthe structured. Query-adaptive K-LSH is ef-ficient for large data sets.
SuatOzdemir etal. [1]
Randomprojectionbased LSH
Cosine,hamming
Synthetic No FTDA scheme eliminates the outlier data us-ing LSH scheme. Number of false data trans-mission is reduced and data aggregation accu-racy is increased. Outlier detection accuracyis improved for optimal threshold value.
MalcomSlaney etal. [8]
Localitysensitivehashing
Euclidean Real andSynthetic
No Optimal parameters for LSH are derived.
Asmaa etal.[10]
Outlierbasedclustering
Euclidean Real andSynthetic
No Outlier detection is done to distinguish the er-ror is due to fault in sensor or due to event.
Hugo Mar-tins et al.[11]
Supportvectormachine
– Synthetic No Least square-support vector novelty basedoutlier detection is done in transient time us-ing SVM.
MahsaSalehi etal. [12]
Machinelearning
k-distanceand reachdistance
Synthetic No Modified iLOF is used to maximize the utilityof outlier detection when deployed on mem-ory constrained sensor nodes.
ManishGupta etal. [13]
Moving av-erage filterand hodrick-prescott filter
– Real timedata
Yes Computational time and complexity of mov-ing average filter is very less and this leadsto reduction in error and noise in real sensordata.
EurichSchubert etal. [14]
Space fill-ing curve(Randomprojectionbased LSH)
Preservedistance
Synthetic No Outlier detection based on space filling curvefor highly scalable data based on ensemblesfor approximate near neighbor search.
OussamaGhorbel etal. [15]
Kernelprincipalcomponentanalysis(KPCA)
Mahalanobisdistance
Real No KPCA-MD is highly effective in detectingtrue outliers by mapping of data points in fea-ture space to find the outliers from normal pat-tern of data distribution.
OsmanSalem etal. [16]
Kerneldensityestimation
Mahalanobisdistance
Real andsynthetic
No MD and KDE is used to detect abnormalmeasurements and to distinguish faulty mea-surement from a clinical emergency throughuse of spatial and temporal correlation be-tween monitored attributes.
Proposedapproach
Localitysensitivehashing
Cosine andHammingdistance
Real timedata
Yes Outlier detection based on LSH is done usingthe real time data collected from the sensornodes. Optimal threshold is identified forvarious threshold characteristics.
25

LSH using NI WSN for Outlier Detection Subhashree V.K. and Tharini C.
Projection (RHP), a form of LSH, is a technique that generates a family of hash functions by projectingthe collected data vectors in a d-dimensional space to a Hamming cube, whose coordinate points are inthe form of 0/1 bits. RHP computes the similarity between short descriptions of data that are streamedfrom remote sites in a continuous manner, instead of using the Lp norms. In all the other forms of LSH,to compute the distance between the data points and locate the nearest neighbor, the actual data vectorsare required. But there is no known formula for deriving the distances of the objects based on their LSHhash values. This limitation is overcome in RHP, as it uses cosine similarity that can be estimated usingthe RHP bitmaps based on their hamming distances [17].A common seed is used to produce a spherically symmetric random vector ‘r’ of unit length from ad-dimensional space [1]. RHP generates a family of hash function by taking dot product with the datavector ‘u’ and random vector ‘r’.A hash function hr is defined in equation (3) as:
hr(u) =
1, i f r ∗u≥ 00, i f r ∗u < 0
(3)
Using n random vectors r1, . . , rn, input data items u and v are mapped into RHP bitmaps lsh(u) andlsh(v) of length ‘n’ respectively. The probability of existence of similarity between u and v can be foundusing the cosine distance between the data vectors u and v as shown in equation (4):
Pr[hr(u) = hr(v)] = 1− θ(u,v)π
(4)
θ(u,v) = π ∗ (1−Pr) (5)
(1−Pr) =θ(u,v)
π(6)
where θ(u,v) is the angle between the data sets u and v, Pr is the probability for existence of simi-larity between the two data sets u and v as shown in equations (5) and (6). Since the angle between thedata sets cannot be measured directly, hamming distance between the RHP bitmaps is calculated.
Hamming Distance and Cosine Distance
Hamming distance (Dh) is the distance between two strings of equal length and is the number of posi-tions at which the corresponding symbols are different. Dh(lshu,lshv) in the equation (7) is the Hammingdistance of the produced bitmaps [17].
Dh(lshu, lshv) = n∗ (1−Pr) (7)
θ(u,v)π
=Dh(lshu, lshv)
n(8)
The equation (8) states that the angle θ(u,v) is proportional to the ratio of number of bits that differ inthe RHP encodings of vectors u and v to the length of their bitmaps.The similarity threshold Ω(Dh) based on hamming distance [1] can be written as shown in equation (9)as
Ω(Dh) = n∗ θ(u,v)π
(9)
26

LSH using NI WSN for Outlier Detection Subhashree V.K. and Tharini C.
The similarity threshold is set up based on the length of the bitmaps. In order to find the similaritybetween the data sets, the cosine distance is measured. If the angle between the data sets is more, thevalue of the similarity threshold also increases. The cosine value for larger angles is negative. Since thedistance cannot be a negative value, the angle between the data sets is kept small. From [1], wider thesimilarity angle θ , lesser the outlier detection accuracy. Hence the value of the similarity threshold ischosen to be a small value, in order to increase the accuracy of detection.
Example
For understanding the LSH algorithm, temperature data sets u and v are considered and is explainedin the figure 1. The data sets u and v are mapped to the RHP bitmaps lsh(u) and lsh(v) respectively bytaking the dot product with the random vector ‘r’ in a d-dimensional space of radius ‘R’. The bits inwhich their corresponding bitmaps differ contribute to the estimation of their angle θ(u,v) [17]. Whenthe number of bits in which the two bitmaps differ is higher, the hamming distance and the estimatedangle θ(u,v) is larger.
Figure 1: Illustrative Example of RHP bitmaps-Locality Sensitive Hashing Codes
From the above example as shown in the figure 1, Dh(lshu, lshv)=2, since the codes differ in 2 positions.The angle between u and v is shown in equation (10):
θ(u,v) =26∗ (π) = π
3(10)
cos(π
3) = 0.5 (11)
The cosine of the angle θ(u,v) is the cosine distance between the data sets u and v as in equation (11).In the above example, the similarity threshold value is set as 3, i.e the value of the hamming distanceDh(lshu, lshv) should be lower than or equal to 3. If the hamming distance lies in the range of thesimilarity threshold and the cosine distance is in between (0, 1), then the data sets u and v are said tonear-neighbor to each other. Hence there is a probability for the existence of similarity between u and v.
27

LSH using NI WSN for Outlier Detection Subhashree V.K. and Tharini C.
If the hamming distance is greater than 3 and the cosine distance is negative, then there is no similarityexisting between the data sets.
Algorithm
The figure 2 shows the algorithm used by the node to generate the LSH code. Each node receives acommon seed to generate the random vector ‘r’. After ‘m’ readings are collected, the node forms a datavector ‘u’ and takes a dot product with the random vector. The RHP bitmap called as the LSH code istransmitted to the Cluster Head (CH).
Figure 2: LSH code generated by the node
After receiving the LSH codes from each of its member nodes, the CH computes the hamming distanceand cosine between the received LSH codes as shown in figure 3. If the value lies inside the similaritythreshold, the data from the node is accepted, else is rejected as outlier data.
Figure 3: Cluster Head (CH) performs Outlier detection using LSH technique
28
LSH using NI WSN for Outlier Detection Subhashree V.K. and Tharini C.
4 Experimental Setup and Results
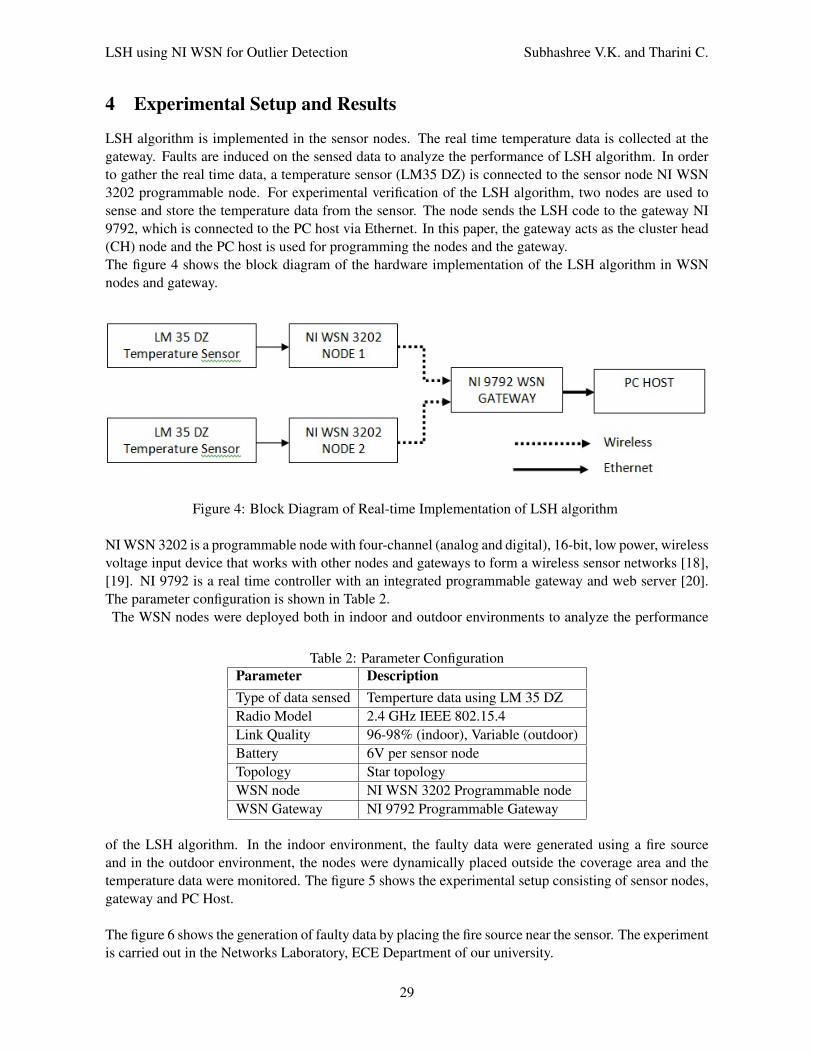
LSH algorithm is implemented in the sensor nodes. The real time temperature data is collected at thegateway. Faults are induced on the sensed data to analyze the performance of LSH algorithm. In orderto gather the real time data, a temperature sensor (LM35 DZ) is connected to the sensor node NI WSN3202 programmable node. For experimental verification of the LSH algorithm, two nodes are used tosense and store the temperature data from the sensor. The node sends the LSH code to the gateway NI9792, which is connected to the PC host via Ethernet. In this paper, the gateway acts as the cluster head(CH) node and the PC host is used for programming the nodes and the gateway.The figure 4 shows the block diagram of the hardware implementation of the LSH algorithm in WSNnodes and gateway.
Figure 4: Block Diagram of Real-time Implementation of LSH algorithm
NI WSN 3202 is a programmable node with four-channel (analog and digital), 16-bit, low power, wirelessvoltage input device that works with other nodes and gateways to form a wireless sensor networks [18],[19]. NI 9792 is a real time controller with an integrated programmable gateway and web server [20].The parameter configuration is shown in Table 2.The WSN nodes were deployed both in indoor and outdoor environments to analyze the performance
Table 2: Parameter ConfigurationParameter DescriptionType of data sensed Temperture data using LM 35 DZRadio Model 2.4 GHz IEEE 802.15.4Link Quality 96-98% (indoor), Variable (outdoor)Battery 6V per sensor nodeTopology Star topologyWSN node NI WSN 3202 Programmable nodeWSN Gateway NI 9792 Programmable Gateway
of the LSH algorithm. In the indoor environment, the faulty data were generated using a fire sourceand in the outdoor environment, the nodes were dynamically placed outside the coverage area and thetemperature data were monitored. The figure 5 shows the experimental setup consisting of sensor nodes,gateway and PC Host.
The figure 6 shows the generation of faulty data by placing the fire source near the sensor. The experimentis carried out in the Networks Laboratory, ECE Department of our university.
29

LSH using NI WSN for Outlier Detection Subhashree V.K. and Tharini C.
Figure 5: Experimental Setup
Figure 6: Indoor Experimental Setup
The temperature from the sensor nodes are continuously monitored and are shown in figure 7. The risein the temperature is due to the placement of the fire source near the node in that instant.
30

LSH using NI WSN for Outlier Detection Subhashree V.K. and Tharini C.
Figure 7: Continuous monitoring of temperature from sensor nodes
In order to eliminate a data as an outlier, the Cluster head has to set up a threshold value and compareit with the received data. The threshold value plays a major role in improving the outlier detectionaccuracy of the LSH algorithm. To find the optimal threshold value, the parameters such as outlierdetection accuracy and precision are analyzed [1].Outlier detection accuracy is a metric that is computed as the fraction of instances for which the correctresult is obtained. Precision (positive predictive value) is the fraction of retrieved instances that arerelevant. In order to compute the accuracy and precision, the sensitivity and selectivity (true positive,true negative, false positive and false negative) values has to be estimated from the obtained data set. Thetable 3 shows the correct classification of normal data and outlier data for obtaining the accuracy andprecision [1].The accuracy and precision is computed as shown in the equation (12) and (13):
Table 3: Correctness Classification for Precision and AccuracyType of Data Correctness Classification
Correct IncorrectNormal data Correctly identified TP Incorrectly Identified FPOutlier Data Correctly rejected TN Incorrectly rejected FN
Accuracy =T P+T N
T P+T N +FP+FN(12)
Precision =T P
T P+FP(13)
The threshold value is varied as 30, 35, 40 and 45 and for a data set having 2340 values, the TP, TN, FPand FN are calculated. The accuracy and the precision is plotted against the threshold value and is shownin the figure 8.
31

LSH using NI WSN for Outlier Detection Subhashree V.K. and Tharini C.
Figure 8: Outlier Detection Accuracy and Precision for various threshold values
From the figure 8, it is observed that, when the threshold value is 30, the accuracy and precision is foundto be lesser. For threshold value equal to 35, the accuracy and precision is found as 76% and 69% respec-tively. As the threshold value increases further, the true positive value remains the same, but the falsepositive value increases and as a result the outlier detection accuracy and precision tends to decrease.From the experimentation, the optimal threshold value equal to 35 is required to obtain a better outlierdetection accuracy and precision [1].The Cluster Head (CH) acquires the optimal threshold value from the accuracy and precision measure-ment. Once the threshold value is set by the CH, it distributes a common seed to its member nodesfor generating the random number. The figure 9 shows the LabVIEW TM program coded in the Blockdiagram window and deployed inside each NI WSN 3202 programmable node. The nodes senses thetemperature values from the sensors connected and stores ‘m’ values in its memory. All the nodes usethe received seed to generate random numbers to perform Random Hyperplane Projection with its owncollected data. For experimentation purpose, the value of m was kept as five. The nodes sensed fiveconsecutive readings from the sensor and stored it in an array. Then, dot product is taken between thesensed values and the random numbers. The resultant output is Boolean, where 1 represents the positiveoutput of the dot product and 0 for the rest of the data and this is the corresponding LSH code of thenode. Each LSH code is of length ‘n’ bits, in this experiment, the length of the LSH code is five bits.The LSH code is transmitted using the Analog I/O ports to the gateway.
32

LSH using NI WSN for Outlier Detection Subhashree V.K. and Tharini C.
Figure 9: Block Diagram window of NI WSN programmable node
The figure 10 shows the LabVIEW TM program coded in the Block diagram window of the gateway node.The CH node (gateway) receives the LSH codes from nodes 1 and 2. The CH calculates the Hammingdistance between the received LSH codes to find out the cosine distance, which is the angle between thetwo data sets. If the cosine distance is positive, then the data lies inside the threshold value set by theCH, and the data from that node is accepted by the CH. If the cosine distance is negative, then the datadoes not lie inside the threshold value and the data from that node is rejected and eliminated as outlier.
The figure 11 shows the front panel window of the LabVIEWTM coded for the gateway displaying thesensed temperature values and their corresponding LSH codes. The readings marked inside the circledenotes the temperature value that is sensed due to the occurrence of fire.
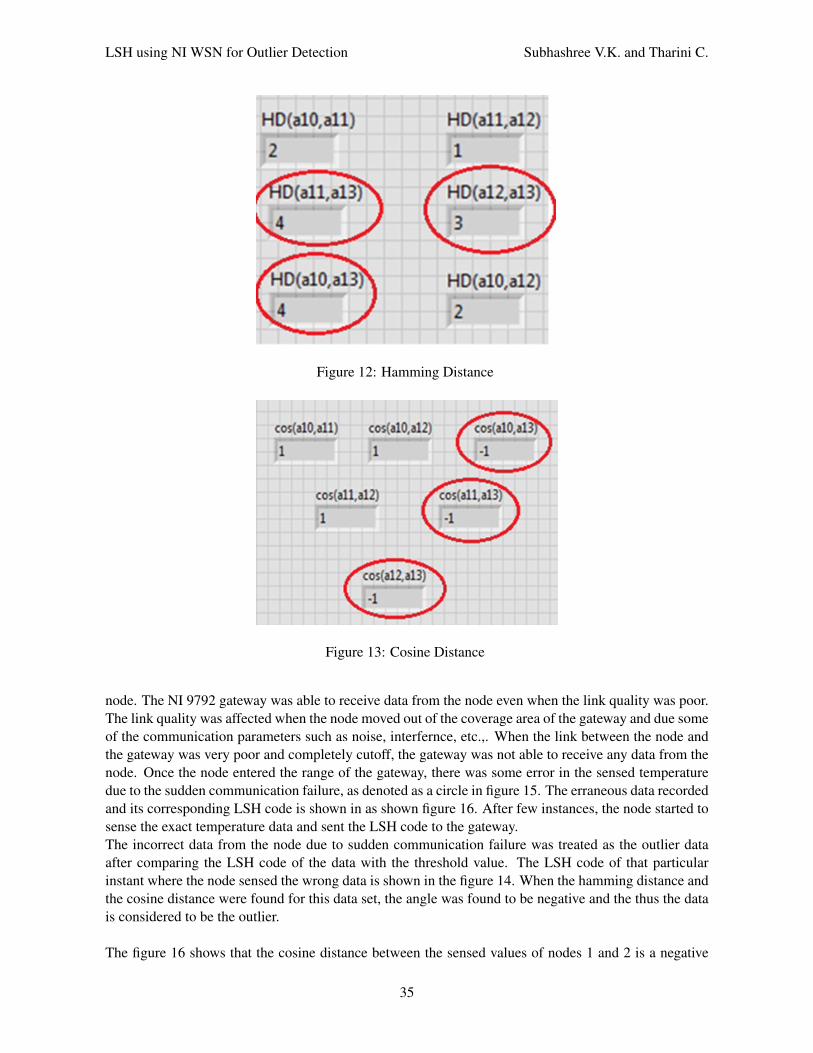
The cluster head (CH) finds the hamming distance between the received LSH codes by using the codeshown in the figure 10. The figure 12 shows the Hamming distance between the sensors that are con-nected to both the nodes.
The figure 13 shows the cosine distance that is calculated using the hamming distance and the formulafrom the equation (8). The values inside the circle in figure 12 and 13 denotes the Hamming and cosinedistance of the erraneous data. The CH compares the value with the similarity threshold and the datafrom this sensor node is eliminated as outlier.
In order to analyze the performance of the LSH algorithm in outdoor environment, the nodes were placedoutside the laboratory in an open environment and the temperature value and the link quality was moni-tored. Link quality is denoted by a numerical value representing the percentage of signal strength avail-able between the node and the gateway. The figure 14 shows the aerial view of the outdoor environmenttaken using Google Earth.
33

LSH using NI WSN for Outlier Detection Subhashree V.K. and Tharini C.
Figure 10: Block Diagram window of NI 9792 programmable gateway
Figure 11: Front panel window displaying the sensed temperature values and their LSH codes
The nodes were moved arbitarily and the link quality was monitored. The figure 15 shows the continousmonitoring of the node’s link quality and its corresponding temperature value.
The nodes were placed at various distances from the gateway and the temperature data was stored in the
34
LSH using NI WSN for Outlier Detection Subhashree V.K. and Tharini C.
Figure 12: Hamming Distance
Figure 13: Cosine Distance
node. The NI 9792 gateway was able to receive data from the node even when the link quality was poor.The link quality was affected when the node moved out of the coverage area of the gateway and due someof the communication parameters such as noise, interfernce, etc.,. When the link between the node andthe gateway was very poor and completely cutoff, the gateway was not able to receive any data from thenode. Once the node entered the range of the gateway, there was some error in the sensed temperaturedue to the sudden communication failure, as denoted as a circle in figure 15. The erraneous data recordedand its corresponding LSH code is shown in as shown figure 16. After few instances, the node started tosense the exact temperature data and sent the LSH code to the gateway.The incorrect data from the node due to sudden communication failure was treated as the outlier dataafter comparing the LSH code of the data with the threshold value. The LSH code of that particularinstant where the node sensed the wrong data is shown in the figure 14. When the hamming distance andthe cosine distance were found for this data set, the angle was found to be negative and the thus the datais considered to be the outlier.
The figure 16 shows that the cosine distance between the sensed values of nodes 1 and 2 is a negative
35

LSH using NI WSN for Outlier Detection Subhashree V.K. and Tharini C.
Figure 14: Aerial view of the outdoor environment using Google Earth
value; the data sensed by the node 1 does not lie in the range of the threshold. Hence this data is detectedas outlier and thus eliminated by the gateway (CH). The node calculates the LSH code for every ‘m’readings and the gateway compares with the threshold by finding the cosine distance and detects the out-liers. The real-time implementation of outlier detection using the LSH algorithm was done using the NI9792 programmable gateway and NI WSN 3202 programmable nodes in both indoor and outdoor envi-ronment and the results were analyzed. The gateway node was able to detect the outliers instantaneouslyby collecting the LSH code from each sensor node by calculating the hamming and cosine distance.
5 Conclusion and Future Work
The real time implementation of the outlier detection was done using the Locality Sensitive Hashing tech-nique. The NI WSN 3202 programmable nodes and NI 9792 programmable gateway was used performthe hardware implementation of the algorithm. The LabVIEWTM software was used for programmingthe nodes and gateway. The experiments were carried out both in indoor and outdoor environments.The outlier detection accuracy and precision were evaluated for various threshold values. For an opti-mal value of threshold, the accuracy and precision were found to be 77% and 66% respectively. As the
36

LSH using NI WSN for Outlier Detection Subhashree V.K. and Tharini C.
Figure 15: XY graph plot for Link Quality vs Temperature values for nodes 1 and 2
Figure 16: LSH code of the temperature data and hamming and cosine distance between them
threshold was increased, the accuracy and precision started to decrease. Hence in order to enhance theaccuracy and precision, the threshold value plays a major role in LSH algorithm. The nodes sensed thetemperature data and transmitted the LSH code to the gateway. The outliers were detected by computingthe cosine distance of the received data and comparing with the threshold value set up by the cluster headnode. The performance of the LSH algorithm was evaluated by varying the link quality in the outdoorenvironment and by generating erroneous data in the indoor environments. In future, outlier detectionwould be implemented in hardware for various distance metrics and combinations outlier detection algo-rithms for enhancing the outlier detection accuracy.
37

LSH using NI WSN for Outlier Detection Subhashree V.K. and Tharini C.
References
[1] S. Ozdemir and Y. Xiao, “FTDA: outlier detection-based fault-tolerant data aggregation for wireless sensornetworks,” Security and Communication Networks, vol. 6, no. 6, pp. 702—-710, 2013.
[2] Y. Zhang, N. Meratnia, and P. Havinga, “Outlier detection techniques for wireless sensor networks: A survey,”IEEE Communications Surveys and Tutorials, vol. 12, no. 2, pp. 159–170, 2010.
[3] N. Shahid, I. H. Naqri, and S. B. Qaisar, “Characteristics and classification of outlier detection techniques forwsn in harsh environments: A survey,” Artificial Intelligence Review, vol. 43, no. 2, pp. 193–228, February2015.
[4] D. M. annd Stewart Sanchez, S. Madria, and F. Ercal, “A survey of methods for finding the outliers in wirelesssensor networks,” Journal of Network System Management, vol. 23, no. 1, pp. 163–182, January 2015.
[5] M. Slaney and M. Casey, “Locality-sensitive hashing for finding nearest neighbors,” IEEE Signal ProcessingMagazine, vol. 25, no. 2, pp. 128—-131, March 2008.
[6] J. Leskovec, A. Rajaraman, and J. Ullman, Finding Similar Items. Cambridge University Press, 2011, pp.73–130.
[7] L. Pauleve, H. Jegou, and L. Amsaleg, “Locality sensitive hashing: a comparison of hash function types andquerying mechanisms,” Pattern Recognotion Letters, vol. 31, no. 11, pp. 1328—-1358, August 2010.
[8] M. Slaney, Y. Lifshits, and J. He, “Optimal parameters forlocality sensitive hashing,” Proceedings of theIEEE, vol. 100, no. 9, pp. 2604–2623, September 2012.
[9] M. R. Pillutla, N. Raval, P. Bansal, K. Srinathan, and C. V. Jawahar, “LSH based outlier detection and itsapplication in distributed setting,” in Proc. of the 2011 ACM International Conference on Information andKnowledge Management (CIKM’11), Glasgow, Scotland, UK. ACM, October 2011, pp. 2289–2292.
[10] A. Fawzy, H. M. Mokhtar, and Q. Hegazy, “Outliers detection and classification in wireless sensor networks,”Egyptian Informatics Journal, vol. 14, no. 2, pp. 157–164, July 2013.
[11] H. Martins, L. Palma, A. Cardoso, and P. Gil, “A support vector machine based technique for online detectionof outliers in transient time series,” in Proc. of the IEEE 10th Asian Control Conference (ASCC’15), KotaKinabalu,. IEEE, May-June 2015. [Online]. Available: http://dx.doi.org/10.1109/ASCC.2015.7244794
[12] M. Salehi, C. Leckie, J. C. Bezdek, and T. Vaithianathan, “Local outlier detection for data streamsin sensor networks: Revisiting the utility problem,” in Proc. of the IEEE International conference onIntelligent Sensors, Sensor networks and Information Processing (ISSNIP’15), Singapore. IEEE, April2015. [Online]. Available: http://dx.doi.org/10.1109/ISSNIP.2015.7106978
[13] M. Gupta, K. K. R, H. D. Chinh, and S. K. Panda, “Outlier detection and data filtering for wireless sensorand actuator networks in building environment,” in Proc. of the IEEE International Conference on BuildingEnergy Efficiency and Sustainable Technologies (ICBEST’15), Singapore. IEEE, August-September 2015,pp. 95–100.
[14] E. Schubert, A. Zimek, and H. P. Kriegal, “Fast and scalable outlier detection with approximate nearestneighbors ensembles,” in Proc. of the 20th International Conference on Database Systems for AdvancedApplications (DASFAA’15), Part II, Hanoi, Vietnam, ser. Lecture Notes in Computer Science, vol. 9050.Springer International Publishing, April 2015, pp. 19–36.
[15] O. Ghorbel, W. Ayedi, H. Snoussi, and M. Abid, “Fast and efficient outlier detection method in wirelesssensor networks,” IEEE Sensors Journal, vol. 15, no. 6, pp. 3403–3411, 2015.
[16] O. Salem, Y. Ziu, and A. Mehaoua, “Anomaly detection in medical wireless sensor networks,” Journal ofComputing Science and Engineering, vol. 7, no. 4, pp. 272–284, 2013.
[17] K. Georgoulas and Y. Kotidis, “Distributed similarity estimation using derived dimensions,” The VLDB Jour-nal, vol. 21, no. 1, pp. 25—-50, 2012.
[18] National Instruments, “Wireless sensor network analog input nodes - ni wsn-3202, ni wsn-3212, ni wsn-3226,” National Instruments Data Sheet ds-293, 2014, http://www.ni.com/datasheet/pdf/en/ds-293 [Online;Accessed on September 10, 2016].
38

LSH using NI WSN for Outlier Detection Subhashree V.K. and Tharini C.
[19] R. B. Pant, H. P. Halvorsen, F. Skulbru, and S. Mylyaganam, “Intermediate measurement node for extensionof wsn coverage,” Journal of Cyber Security and Mobility, vol. 2, no. 1, pp. 29–61, 2012.
[20] National Instruments, “Ni 9792 programmable wsn gateway,” National Instruments Data Sheet ds-284, 2014,http://www.ni.com/datasheet/pdf/en/ds-284 [Online; Accessed on September 10, 2016].
——————————————————————————
Author Biography
Subhashree V.K. received the B.E. degree in Electronics and Communication En-gineering from Anna University,Chennai , India, in 2007, and the M.E. degree inCommunication Systems from the Anna University, Chennai , India, in 2009. She iscurrently pursuing her research in the field of wireless sensor networks in the ECEdepartment, B S Abdur Rahman University, Chennai. She has presented few papersin national and international conferences. She is a member of IEEE.
Tharini C. is currently working as a Professor in ECE department, B S Abdur Rah-man University Chennai. She has pursued her research in Information and Communi-cation at Anna University, Chennai and completed during the year 2011. She has 15years of experience in research and teaching. She has presented many papers in Inter-national Conference and some of her papers were awarded as best paper.She has pub-lished papers in International journals and her papers are cited by many researchersin this field. She is a life member of Computer Society of India. She has reviewed
papers for the journals like Journal of Computers and e-scripts, a novel crowd- based submission systemintroduced by European Alliance for Innovation. Currently she is guiding research scholars in the areaof Wireless Communication and Sensor Networks. She has also organized many national workshops andconferences in the field of wireless sensor networks. She has been a resource person for many workshopsand conferences organized by several engineering colleges.
39


![Introduction to Locality-Sensitive Hashingtylerneylon.com/a/lsh1/lsh_post1.pdf · Introduction to Locality-Sensitive Hashing Tyler Neylon 521.2018 [Formats:html|pdf|kindlepdf] Locality-sensitivehashing](https://img.dokumen.tips/doc/110x75/5f5ae4c0bff9836d6a4356a4/introduction-to-locality-sensitive-introduction-to-locality-sensitive-hashing-tyler.jpg)


![MapReduce Based Personalized Locality Sensitive … Based Personalized Locality Sensitive Hashing for ... end-to-endset-similarity join algorithm [12], fast computation of ... minhashing](https://img.dokumen.tips/doc/110x75/5ade01257f8b9a8b6d8da327/mapreduce-based-personalized-locality-sensitive-based-personalized-locality.jpg)