Embed Size (px)
Citation preview

Real-time, high-resolution x-ray diffraction measurements on shockedcrystals at a synchrotron facilityY. M. Gupta, Stefan J. Turneaure, K. Perkins, K. Zimmerman, N. Arganbright et al. Citation: Rev. Sci. Instrum. 83, 123905 (2012); doi: 10.1063/1.4772577 View online: http://dx.doi.org/10.1063/1.4772577 View Table of Contents: http://rsi.aip.org/resource/1/RSINAK/v83/i12 Published by the American Institute of Physics. Related ArticlesInterferometric hard x-ray phase contrast imaging at 204 nm grating period Rev. Sci. Instrum. 84, 013706 (2013) Single-order operation of lamellar multilayer gratings in the soft x-ray spectral range AIP Advances 3, 012103 (2013) Spatial resolution of synchrotron x-ray microtomography in high energy range: Effect of x-ray energy and sample-to-detector distance Appl. Phys. Lett. 101, 261901 (2012) Formation of native defects in the γ-ray detector material Cs2Hg6S7 Appl. Phys. Lett. 101, 202103 (2012) Integration of a broad beam ion source with a high-temperature x-ray diffraction vacuum chamber Rev. Sci. Instrum. 83, 113901 (2012) Additional information on Rev. Sci. Instrum.Journal Homepage: http://rsi.aip.org Journal Information: http://rsi.aip.org/about/about_the_journal Top downloads: http://rsi.aip.org/features/most_downloaded Information for Authors: http://rsi.aip.org/authors
Downloaded 04 Feb 2013 to 164.54.164.42. Redistribution subject to AIP license or copyright; see http://rsi.aip.org/about/rights_and_permissions
REVIEW OF SCIENTIFIC INSTRUMENTS 83, 123905 (2012)
Real-time, high-resolution x-ray diffraction measurements on shockedcrystals at a synchrotron facility
Y. M. Gupta,1 Stefan J. Turneaure,1 K. Perkins,1 K. Zimmerman,1 N. Arganbright,1
G. Shen,2 and P. Chow2
1Institute for Shock Physics and the Department of Physics, Washington State University, Pullman,Washington 99164-2816, USA2HPCAT, Geophysical Laboratory, Carnegie Institution of Washington, Argonne, Illinois 60437, USA
(Received 22 October 2012; accepted 3 December 2012; published online 21 December 2012)
The Advanced Photon Source (APS) at Argonne National Laboratory was used to obtain real-time,high-resolution x-ray diffraction measurements to determine the microscopic response of shock-compressed single crystals. Disk shaped samples were subjected to plane shock wave compressionby impacting them with half-inch diameter, flat-faced projectiles. The projectiles were acceleratedto velocities ranging between 300 and 1200 m/s using a compact powder gun designed specificallyfor use at a synchrotron facility. The experiments were designed to keep the sample probed volumeunder uniaxial strain and constant stress for a duration longer than the 153.4 ns spacing between x-raybunches. X-rays from a single pulse (<100 ps duration) out of the periodic x-ray pulses emitted bythe synchrotron were used for the diffraction measurements. A synchronization and x-ray detectiontechnique was developed to ensure that the measured signal was obtained unambiguously from thedesired x-ray pulse incident on the sample while the sample was in a constant uniaxial strain state.The synchronization and x-ray detection techniques described can be used for a variety of x-ray mea-surements on shock compressed solids and liquids at the APS. Detailed procedures for applying theBragg-Brentano parafocusing approach to single crystals at the APS are presented. Analytic devel-opments to determine the effects of crystal substructure and non-ideal geometry on the diffractionpattern position and shape are presented. Representative real-time x-ray diffraction data, indicatingshock-induced microstructural changes, are presented for a shock-compressed Al(111) sample. Theexperimental developments presented here provided, in part, the impetus for the Dynamic Compres-sion Sector (DCS) currently under development at the APS. Both the synchronization/x-ray detectionmethods and the analysis equations for high-resolution single crystal x-ray diffraction can be used atthe DCS. © 2012 American Institute of Physics. [http://dx.doi.org/10.1063/1.4772577]
I. INTRODUCTION
A detailed understanding of shock wave induced changesin condensed systems requires real-time measurements atlength scales ranging from the continuum level down to theatomic level.1 At the crystal lattice scale, x-ray diffraction(XRD) measurements have been useful for gaining insightinto shock-compressed solids.2–20 Because of the short du-ration of shock wave experiments, typically sub-μs, intensex-ray sources are required for real-time examination of shock-compressed solids. Most shock compression experiments in-corporating x-ray diffraction have been conducted using flashx-ray sources2–13 or laser-based x-ray sources.14–18 Thesex-ray sources provide relatively non-directional, characteris-tic x-rays, limiting both the types of experiments that canbe performed and the resolution achievable in those exper-iments. In contrast, modern synchrotron x-ray sources areflexible, provide a highly collimated beam, tunable x-ray en-ergy, bandwidths ranging from sub-eV to broadband, sub-nanosecond pulse durations, and a variety of temporal x-raybunch spacings. Recently, synchrotron x-rays at the AdvancedPhoton Source (APS) have been used to examine solids shockcompressed with both a powder gun19, 20 and a light gasgun.21, 22 High-resolution diffraction measurements have beenmade on single crystals19, 20 using monochromatic x-rays.
Imaging21, 22 and Laue diffraction22 measurements have beenobtained using a white beam. Synchrotron Laue diffractionmeasurements have also been reported for laser shocked sin-gle crystals.23
To routinely and optimally use synchrotron x-rays fordiffraction, scattering, and x-ray imaging measurements indynamic compression experiments, a dedicated experimentalfacility, termed the Dynamic Compression Sector (DCS), iscurrently under development at the Advanced Photon Source(Argonne National Laboratory, IL). The present article de-scribes experimental developments successfully implementedat the APS19, 20 that demonstrated the feasibility of using mod-ern synchrotrons for impact experiments. In particular, wedescribe experimental methods and analysis procedures forhow the Bragg-Brentano parafocusing geometry was used ata synchrotron to examine the microstructural details of shock-compressed single crystals19 and the strength of shocked andreleased crystals.20
An overview of the compact plate impact facility devel-oped for use at a synchrotron and methods to interface thesame to the synchrotron are presented in Sec. II. A key fea-ture of our experimental design was the ability to unambigu-ously isolate the diffracted x-rays from a single x-ray pulseincident on the sample while it was in the desired constant
0034-6748/2012/83(12)/123905/10/$30.00 © 2012 American Institute of Physics83, 123905-1
Downloaded 04 Feb 2013 to 164.54.164.42. Redistribution subject to AIP license or copyright; see http://rsi.aip.org/about/rights_and_permissions

123905-2 Gupta et al. Rev. Sci. Instrum. 83, 123905 (2012)
12
3
4
5
FIG. 1. Photograph of the experimental setup in hutch 16ID-D at HPCAT atthe Advanced Photon Source showing the following items: (1) incident beampath, (2) horizontal focusing x-ray mirror, (3) powder gun, (4) diffractedbeam path, and (5) x-ray detector.
uniaxial strain state. The x-ray detection, synchronization,and gating methods used to isolate the desired x-ray pulse arepresented in Sec. III. Implementation of the Bragg-Brentanoparafocusing geometry for shock-compressed single crystals4
at a synchrotron source is described in Sec. IV. Particular at-tention is given to the relation between crystal microstructureand the diffraction pattern shape. Representative diffractionresults are presented for both ambient and shock-compressedsamples in Sec. V. Concluding remarks are summarized inSec. VI.
II. EXPERIMENTAL SETUP
A. Hutch layout
The experimental setup, located in hutch 16ID-D at HP-CAT at the APS, is shown in Figure 1. The properties of thex-ray beam incident on the sample may be tuned for a par-ticular experiment by varying the undulator insertion devicesettings and/or the beamline optics. The specific x-ray op-tics and geometry used in the present work are described inSec. IV. The x-ray beam enters and exits the target chamber(see Fig. 2) through Lexan windows located on opposite sides
1 2
34
5
7 8
10
6
9
FIG. 2. Drawing of compact powder gun showing the following compo-nents: (1) breech, (2) half-inch bore and 3 ft long barrel, (3) target chamber,(4) target holder, (5) catch tank, (6) catch tube, (7) computer controlled driverfor angle adjustment, (8) pivot point for gun rotation, (9) gun base plate, and(10) main gun support. The side flange of the target chamber is not shown onthe incident beam side.
(a)
(b)
target holder
Lexan window
target
incident beam
beam on back of sample
target holder
target plate
target ring
FIG. 3. Photographs of a target mounted inside the target chamber. (a) Sideview of the target holder from the x-ray source side of the gun. The red linesabove and below the barrel to the left of the target holder are due to lightscatter from the laser diode beams used for projectile velocity measurement.(b) Target viewed from the back of the target holder. The line indicated in thefigure shows where the x-ray beam was incident on the rear surface of a LiFsample as measured using burn paper.
of the target chamber (see Fig. 3(a)). A rectangular detectortable with a breadboard top is located parallel and adjacent tothe main gun support as shown in Fig. 1; the x-ray area de-tector was mounted on a rail whose position and angle wereadjusted, for each experiment, to the desired settings relativeto the edges of the detector table. Because the only mechani-cal coupling between the compact powder gun assembly andthe detector and x-ray optics is through the floor, the detectorand x-ray optics were not perturbed by the projectile launch.
B. Compact powder gun
The powder gun operating principles are similar to thoseof the gun described in Ref. 4. However, the present powdergun is smaller and was designed specifically for use at a syn-chrotron. The overall footprint of the gun is 66 in. × 40 in.,allowing it to fit into the small confines of a typical syn-chrotron hutch. The gun barrel has a half-inch bore and is 3 ftlong. Disk shaped samples were mounted about half an inchpast the end of the gun barrel in the 15 in. long × 4.5 in. widetarget chamber. Because the target chamber was narrow, anx-ray area detector placed alongside the chamber can cover alarge solid angle relative to the center of the sample rear sur-face. This is particularly important for powder diffraction orLaue diffraction techniques. The projectile velocity was mea-sured using a method similar to that described in Ref. 4.
Downloaded 04 Feb 2013 to 164.54.164.42. Redistribution subject to AIP license or copyright; see http://rsi.aip.org/about/rights_and_permissions

123905-3 Gupta et al. Rev. Sci. Instrum. 83, 123905 (2012)
Because the synchrotron beam direction is nearly fixed,the gun was designed to be mobile and flexible in its position-ing relative to the beam. The following procedures were usedto ensure a rapid setup of the gun/sample with respect to thesynchrotron x-ray beam. The gun assembly was first moved(approximately) to the desired position and orientation withrespect to the incident beam. The target holder height was de-signed to be nominally at the height of the monochromaticincident beam (∼1.4 m). The target height was fine-tuned byadjusting four threaded feet at the ends of the A-frame gunsupports until the incident beam was vertically centered onthe sample. A manual dovetail translation stage (not shownin Fig. 2), located between the A-frame supports and the maingun support, was used to translate the target along the gun axisuntil the back of the target (located above the gun pivot point)was horizontally centered on the incident beam. For each ex-periment, both the translation and beam/sample angle werefine-tuned. The target holder was translated along the gun axisusing a dovetail track inside the target chamber to position theback of the sample directly above the gun rotation pivot point.Finally, the incident beam/sample angle was set by rotatingthe gun and the gun base plate about the pivot point using acomputer controlled Parker-Hannifin driver. The total rangeof angle adjustment was ±5◦ and the angular resolution was0.01◦. Figure 3(b) shows the incident x-ray beam striking thesample after the target alignment procedure was completed.
Projectile velocities from 300 to 1200 m/s could be ob-tained using either 2 or 3 in. long half-inch diameter Alprojectiles and commercially available primers, cartridges,and gun powder. Using lighter projectiles, higher velocitiesare feasible. The launch was initiated by a solenoid striker(Physics Applications Inc.), which impacted a primer at theback of the cartridge. The delay time from the solenoid strikertrigger signal to the projectile/target impact was 34 ms withabout 1 ms jitter. The measured projectile velocities were typ-ically within 2% of the desired velocities. The average tilt be-tween the projectile and target at impact was 0.88 mrad witha standard deviation of 0.42 mrad. It was inferred from someof the x-ray diffraction results that the target might translatea distance tlaunch (<30 μm) toward the gun barrel betweenlaunch initiation and impact. As described in Sec. IV, thistranslation can be corrected for when increased accuracy ofthe diffraction pattern shifts is needed.
C. Targets
Typical pictures of a target mounted in the target cham-ber are shown in Fig. 3, and a schematic side view of animpactor and target is shown in Fig. 4. The impact face ofthe target consisted of a 10 mm diameter, 2 mm thick z-cutquartz disk, and four concentrically placed piezoelectric PZTpins (Dynasen Inc.). The pins provide a trigger signal for thex-ray detection mechanism, and their relative impact times areused to determine the impact tilt.4 To accommodate a 10 mmdiameter target, it was necessary that the half-inch diameterimpactor not strike the full diameter of the piezoelectric pins.The PZT pins provided adequate signal levels despite not be-ing fully impacted. The purpose of the z-cut quartz buffers
Impactor
Al target ring
PZT pins
Quartz/sample/VC
FIG. 4. Side schematic view of impactor and target.
was to delay the shock wave from reaching the back of thesample sufficiently for the x-ray detector to be gated on as de-scribed in Sec. III. The samples were bonded to the back ofthe quartz. In some of the experiments a vitreous carbon (VC)window was also bonded to the back of the sample.
III. X-RAY DETECTION: SYNCHRONIZATIONWITH THE IMPACT EVENT
The common APS operation results in 24 equally spacedbunches in the storage ring producing periodic x-ray pulses(153.4 ns separation). Each pulse is less than 100 ps in du-ration. The timing and gating methods described below weredesigned for this mode of operation.
Time zero is defined as the moment the projectile im-pacts the target; it is uncorrelated to the phase of the x-raypulses (see Fig. 5). The experiments were designed to have ashock wave time window from tsw start to tsw end during whichthe region of the sample exposed to the x-ray beam was sub-jected to macroscopic uniaxial strain; the stress state in thesample was nominally constant. In Fig. 5, the shock wavetime window duration is shown as 153.4 ns. In practice, thethicknesses and diameters of the target pieces were chosen toprovide somewhat longer shock wave time window durations.Thus, at least one x-ray pulse will arrive at the sample duringthe shock wave time window, although the exact arrival timeof that x-ray pulse relative to the shock wave time window isunknown prior to the impact event. Many other x-ray pulsesare also incident on the sample and detector both prior to andafter the shock wave time window. It was desired to detect thediffracted x-rays from a single pulse, arriving at the sampleduring the shock wave time window, and to avoid detectingthe signals from other x-ray pulses. To accomplish this, twocriteria must be met: (1) the detector must be able to gate onand off faster than the 153.4 ns x-ray period and (2) the detec-tor must be gated on and off for the desired x-ray bunch.
Our detection system consisted of the following compo-nents: a P47 phosphor (Y2SiO5:Ce) coated onto a fiber face-plate by Beam Imaging Solutions Inc., a microchannel plate(MCP) image intensifier (Photek), and a Princeton Instru-ments charge-coupled device with 20 μm pixel size. The de-tector was gated by biasing the MCP photocathode voltage onor off with a fast power supply (GBS Micro Power Supply).Gate rise and fall times of about 25 ns were achieved.
The P47 phosphor was essential to fast gating and waschosen because of its short decay time.24 The use of P47 isuncommon in x-ray detection, though it has been previously
Downloaded 04 Feb 2013 to 164.54.164.42. Redistribution subject to AIP license or copyright; see http://rsi.aip.org/about/rights_and_permissions

123905-4 Gupta et al. Rev. Sci. Instrum. 83, 123905 (2012)
(a)
(b)
FIG. 5. Simplified timeline of events during a shock-wave experiment. Time zero is defined as the impact time. The shock wave time window beginning attsw start and ending at tsw end is the time during which the rear sample surface, exposed to x-rays, is in a uniaxial strain constant stress state. In (a) the desiredx-ray pulse arrives near the beginning of the time window, and in (b) the desired x-ray pulse arrives near the end of the time window. The x-ray detector is gatedon between the times tdet on and tdet off.
used in a fast x-ray camera.25 Several tests were performedto determine the suitability of P47 for synchrotron shock-compression experiments. The dependence of light emittedfrom P47 was measured as a function of the P47 areal densityfor densities of 11, 15, and 20 mg/cm2 with both 8 keV and17.5 keV x-rays. The 20 mg/cm2 phosphor had the greatestsensitivity at both x-ray energies; furthermore, the spatial res-olutions were independent of the P47 areal density. Figure 6shows the calculated fraction of incident x-rays absorbed bya 20 mg/cm2 coating of P47 phosphor. The calculation wascarried out using x-ray absorption values from Ref. 26. A20 mg/cm2 coating of P47 has a reasonable fraction of ab-sorbed x-rays over a range of energies making it potentiallyuseful for a variety of x-ray applications.
The temporal response of the detector was determined bymeasuring the light emitted from the P47 phosphor as a func-tion of the detector gate on time relative to the x-ray pulsetime (see Fig. 7). An exponential decay time of 48 ns wasdetermined from a fit to the data. This is a reasonably shortdecay time compared with the 153.4 ns x-ray period. The sig-nal level from the desired x-ray pulse will be more than 20times larger than the signal level from the preceding x-ray
FIG. 6. Calculated fraction of incident x-rays absorbed for a 20 mg/cm2
coating of P47 phosphor as a function of x-ray energy.
pulse (provided that the sample’s diffraction properties do notchange significantly as a result of shock compression betweenthe arrivals of the two pulses).
The effects of both long-time P47 phosphor afterglowand imperfect MCP gating on the detected signal were exam-ined. Each could potentially lead to an accumulation of signalfrom the thousands of pulses arriving at the detector before theimpact event. The P47 phosphor afterglow signal was foundto be less than 1% of the signal from a single pulse. The on/offgain ratio of the MCP was measured to be greater than 109.Even though the signals from the phosphor afterglow and theMCP bleed-through were determined to be relatively smallcompared to the signal from the desired single pulse, a mil-lisecond shutter (Vincent Associates) was used to limit thex-ray exposure to about 15 ms. The shutter was opened about25 ms after launch initiation and it was closed within several
FIG. 7. Measured intensity from a single x-ray pulse as a function of therelative time at which the detector was gated on. For these measurements,the x-ray pulse was separated temporally from the next nearest pulse by over1.59 μs. The gate pulse to the detector was 100 ns in duration. The modelassumes a pure exponential decay of the P47 phosphor with a 48 ns timeconstant.
Downloaded 04 Feb 2013 to 164.54.164.42. Redistribution subject to AIP license or copyright; see http://rsi.aip.org/about/rights_and_permissions
123905-5 Gupta et al. Rev. Sci. Instrum. 83, 123905 (2012)
PZT impact pins
Cable delay box
Synchrotron bunch clock
AND gate
Digital delay generator
MCP gate unit
FIG. 8. Flowchart of signals and equipment used to gate the x-ray areadetector.
milliseconds of impact. In summary, the x-ray gating and de-tection method described above proved adequate for singlepulse detection in the 24 bunch operation mode at the APS.
The method used to ensure that the single detected x-raypulse arrived at the sample during the shock wave time win-dow is summarized next. A flowchart of the equipment usedto gate the detector to on is shown in Fig. 8. The signals fromthe four piezoelectric pins were combined with diode boxesand delayed by an adjustable cable delay box before enteringan AND gate. The signal from the first pin to be impacted en-abled the AND gate. Nuclear instrumentation module (NIM)pulses from the Advanced Photon Source’s bunch clock en-tered the AND gate every 153.4 ns. Following the enablingof the AND gate, the next NIM pulse to enter the AND gatecaused the AND gate to generate a transistor-transistor logic(TTL) pulse. This TTL pulse triggered an SRS DG535 digitaldelay generator which then provided a pulse that was used togate the MCP on and off. The delay and the pulse length set-tings of the SRS DG535 were chosen such that the detectorwas gated on just before the arrival of an x-ray pulse at thedetector and gated off just before the arrival of the next x-raypulse. To ensure that the detector is gated on for the desiredpulse, the following relation must be satisfied:
tsw start − tAND enable = N × 153.4ns + δt. (1)
In relation (1), N is a positive integer and δt is the timedifference between the x-ray pulses arriving at the sampleand the bunch clock NIM signals arriving at the AND gate.The value of δt can be adjusted by delaying the bunch clockNIM signal and, in practice, it was adjusted such that δt = 0.For each experiment, the delay of the cable delay box inFig. 8 was adjusted such that relation (1) was satisfied for N= 2. A minimum value of 2 was required for N because ofthe magnitude of the insertion delays between the NIM signalentering the AND gate and the detector gating on. Figure 5shows that the detector is gated to on for the desired pulse inthe two bounding cases where the desired pulse arrives at thebeginning (Fig. 5(a)) or at the end (Fig. 5(b)) of a 153.4 nsduration shock wave time window. If relation (1) is notsatisfied, the detector may gate on for any one of three x-raypulses: the pulse prior to the desired one, the desired pulse,or the pulse arriving after the desired pulse. We performed 25shock wave experiments using this synchronization approach;
Impactor
x
z
y
Detector
2θ
xd
zd
Effectivex-ray
sourceTarget
θ
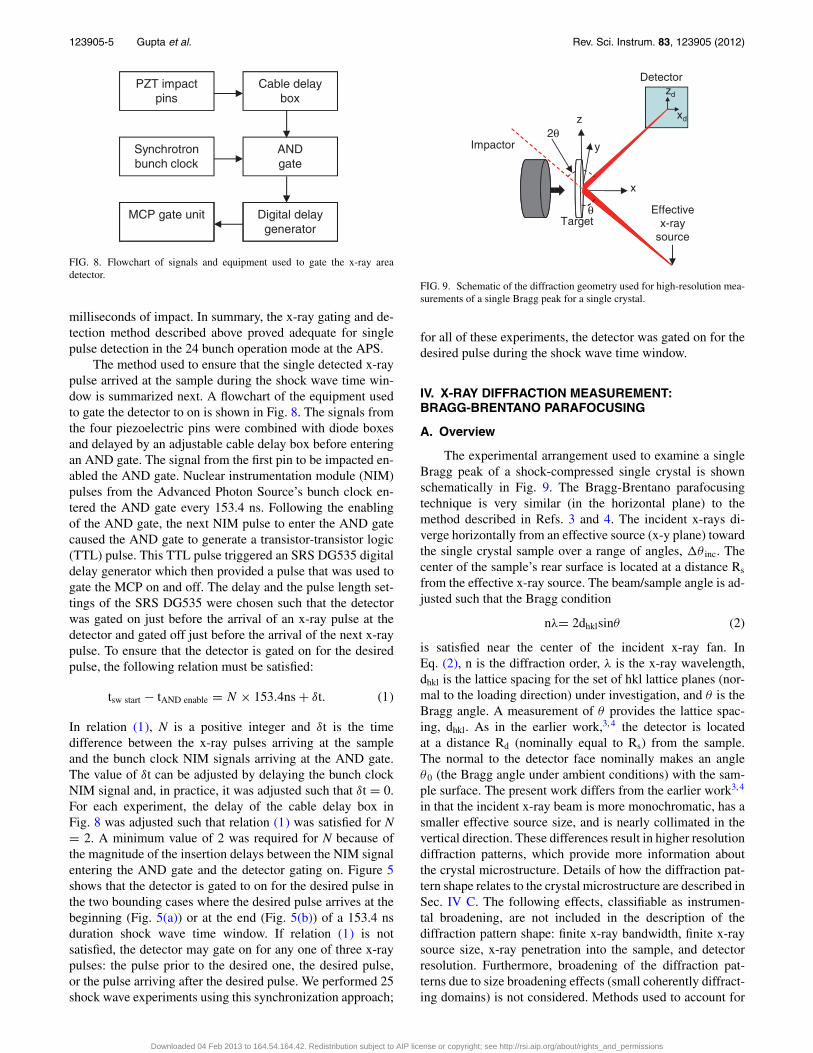
FIG. 9. Schematic of the diffraction geometry used for high-resolution mea-surements of a single Bragg peak for a single crystal.
for all of these experiments, the detector was gated on for thedesired pulse during the shock wave time window.
IV. X-RAY DIFFRACTION MEASUREMENT:BRAGG-BRENTANO PARAFOCUSING
A. Overview
The experimental arrangement used to examine a singleBragg peak of a shock-compressed single crystal is shownschematically in Fig. 9. The Bragg-Brentano parafocusingtechnique is very similar (in the horizontal plane) to themethod described in Refs. 3 and 4. The incident x-rays di-verge horizontally from an effective source (x-y plane) towardthe single crystal sample over a range of angles, �θ inc. Thecenter of the sample’s rear surface is located at a distance Rs
from the effective x-ray source. The beam/sample angle is ad-justed such that the Bragg condition
nλ= 2dhklsinθ (2)
is satisfied near the center of the incident x-ray fan. InEq. (2), n is the diffraction order, λ is the x-ray wavelength,dhkl is the lattice spacing for the set of hkl lattice planes (nor-mal to the loading direction) under investigation, and θ is theBragg angle. A measurement of θ provides the lattice spac-ing, dhkl. As in the earlier work,3, 4 the detector is locatedat a distance Rd (nominally equal to Rs) from the sample.The normal to the detector face nominally makes an angleθ0 (the Bragg angle under ambient conditions) with the sam-ple surface. The present work differs from the earlier work3, 4
in that the incident x-ray beam is more monochromatic, has asmaller effective source size, and is nearly collimated in thevertical direction. These differences result in higher resolutiondiffraction patterns, which provide more information aboutthe crystal microstructure. Details of how the diffraction pat-tern shape relates to the crystal microstructure are described inSec. IV C. The following effects, classifiable as instrumen-tal broadening, are not included in the description of thediffraction pattern shape: finite x-ray bandwidth, finite x-raysource size, x-ray penetration into the sample, and detectorresolution. Furthermore, broadening of the diffraction pat-terns due to size broadening effects (small coherently diffract-ing domains) is not considered. Methods used to account for
Downloaded 04 Feb 2013 to 164.54.164.42. Redistribution subject to AIP license or copyright; see http://rsi.aip.org/about/rights_and_permissions

123905-6 Gupta et al. Rev. Sci. Instrum. 83, 123905 (2012)
instrumental broadening and the size effect on diffraction pat-tern shape are described in Ref. 11. Before describing theXRD geometry in detail, we explain how the effective x-raysource was generated.
B. Effective x-ray source
The effective x-ray source was obtained as follows. Theundulator A insertion device (3.3 cm period), located in thesynchrotron storage ring, was tuned to produce a fundamen-tal x-ray energy of about 8.8 keV. A double diamond crys-tal monochromator was used to reduce the bandwidth of the8.8 keV x-rays to approximately 1 eV. The x-ray beamfollowing the monochromator was nearly collimated andKirkpatrick-Baez (KB) mirrors were used to focus the beamboth vertically and horizontally. A 1 m long Rh coated mir-ror located about 8 m upstream of the sample and 57 mdownstream from the center of the undulator source was usedfor vertical focusing. The location of the vertical focus wasroughly 2 m upstream of the sample. The full width verti-cal divergence of the beam emanating from the vertical focalpoint was less than 0.01◦ and the beam height on the samplewas approximately 250 μm. A 0.2 m long Rh coated mirrorlocated about 0.6 m upstream from the sample and about 64 mdownstream from the center of the undulator source was usedfor horizontal focusing. The location of the ∼30 μm widehorizontal focus defining the effective x-ray source positionwas Rs = 0.4 m upstream of the sample. The horizontal di-vergence angle of the incident beam from the effective x-raysource, �θ inc, may be varied from near zero to several tenthsof a degree by adjusting the horizontally focusing KB mir-ror. The width of the x-ray beam projected onto the sampledepends on the Bragg angle θ0 of the peak under examina-tion, the beam divergence �θ inc and the value of Rs. For �θ inc
= 0.2◦, Rs = 0.4 m, and a Bragg angle of 17.55◦ (correspond-ing to the Al 111 peak discussed later in the article), the x-raybeam diverging from the effective x-ray source covers a 4.6mm wide region across the sample similar to what is shown inFig. 3(b). Figure 10(a) shows a profile of the diverging beam(�θ inc = 0.2◦) measured with a single x-ray pulse that con-tained about 2 × 10⁵ x-ray photons. A vertically binned crosssection of the image is shown in Fig. 10(b). Except near theedges of the cross section, the angular distribution of intensityis reasonably smooth.
C. XRD geometry and experimental procedure
Because the synchrotron diffraction measurements havehigh resolution, it is worthwhile to consider the diffractiongeometry in detail; deviations from an ideal geometry canaffect the position and shape of the diffraction pattern. Anideal sample is defined as a non-mosaic single crystal withthe hkl reciprocal lattice vector of interest normal to the sam-ple face, i.e., along the x-axis. However, in practice, the hkllattice planes may be somewhat misoriented with respect tothe sample surface. In this case, the lattice will have compo-nents of rotation about the y- and z-axes with amplitudes ofδθmis,y and δθmis,z, respectively. A real sample may also be
(a)
(b)
FIG. 10. (a) Image of horizontally diverging beam taken with a single pulseusing the gated x-ray area detector. The detector was nominally perpendicularto the x-ray beam and the distance from the horizontal focus to the detectorwas 1.1 m. (b) Cross section of the diverging beam averaged vertically withthe background subtracted.
somewhat mosaic and have a distribution of micro-lattice ro-tations about the y- and z-axes with position dependent ampli-tudes of δθmos,y and δθmos,z, respectively. The net componentsof lattice rotation with respect to an ideally oriented sampleare
δθm,y=δθmis,y+δθmos,y (3)
and
δθm,z=δθmis,z+δθmos,z. (4)
For the actual experiments, the axis of macroscopic misorien-tation was determined and the sample was oriented in the gunsuch that δθmis,z was nominally zero.
The following procedures were used to orient a samplewith respect to the beam prior to a shock experiment. A PINdiode was used to measure the diffracted intensity as a func-tion of the incident beam/sample angle; the beam/sample an-gle was then set to the central angle of the measured peak.As shown in Fig. 11(a), this corresponds to an angle of θ0
− δθmis, z between the center of the incident beam fan andthe sample rear surface, where θ0 is the ambient Bragg angleof the hkl peak being examined. Next, a reference diffractionpattern was obtained from the ambient crystal. The horizontaland vertical positions of this peak on the detector were de-fined as xd = 0 and zd = 0, respectively. The gun and samplewere then rotated by an angle θ1e−θ0, which is the expecteddifference in the Bragg angle between the shocked and ambi-ent states (see Fig. 11(b)). Both the incident x-ray beam andthe detector remained stationary. If the pivot point for the gunrotation is not directly under the center of the sample, then thesample, in addition to being rotated, will be translated some-what along the x- and y-axes. A small translation of the sam-ple along the y-axis is unimportant because it will not changethe relative position of the sample/beam intersection and thedetector. However, a translation along the x-axis, tpivot, must
Downloaded 04 Feb 2013 to 164.54.164.42. Redistribution subject to AIP license or copyright; see http://rsi.aip.org/about/rights_and_permissions
123905-7 Gupta et al. Rev. Sci. Instrum. 83, 123905 (2012)
(a)
(b)
(c)
FIG. 11. Horizontal plane (x-y) geometry of incident x-ray beam, samplerear surface, and the hkl lattice plane under investigation. (a) The geometryused when obtaining a reference diffraction pattern from the ambient crystal.(b) The geometry just prior to shot initiation after rotating the sample andgun such that the center of the incident x-ray beam fan will satisfy the Braggcondition for the expected lattice compression in the shocked state. (c) Thegeometry during the x-ray diffraction measurement of the shocked crystal.
be considered in determining the horizontal position of thepeak on the detector.
As shown in Fig. 11(c), the projectile launch and the im-pact event result in additional geometry changes prior to theXRD measurement. The projectile tilt with respect to the tar-get impact surface will rotate the crystal lattice about the y-and z-axes with components of amplitude δθ tilt,y and δθ tilt,z,respectively.3, 4 The net rotation of the crystal about the z-axis
relative to the ambient state is then
θ ′1e − θ0 = θ1e − θ0 + δθtilt,z. (5)
The actual Bragg angle in the shocked state (θ1) may besomewhat different from θ ′
1e because of projectile tilt (δθ tilt,z)and/or a difference between the actual (θ1) and expected (θ1e)Bragg angles. The horizontal divergence of the incident beam(�θ inc = 0.2◦) was chosen to accommodate the expectedmagnitude of these effects and still satisfy the Bragg condi-tion somewhere in the incident fan of x-rays, even for a non-mosaic sample. The sample has an additional translation tshock
along the x-axis relative to the ambient sample position. Thistranslation is the result of the particle velocity imparted to thesample by shock compression.3, 4 The net translation of thesample along the x-axis between the ambient and shock mea-surements is
t = tshock + tlaunch + tpivot, (6)
where tlaunch was defined in Sec. II B.The effect of the various lattice rotations and translations
on the diffraction pattern is described next. Of particular inter-est is how the shock-induced changes to the diffraction patternrelate to shock-induced changes in the crystal microstructure,i.e., distributions in θ1, δθmos,y, and δθmos,z. It is convenient toseparate the discussion into horizontal changes to the diffrac-tion pattern along xd (primarily lattice compression) and ver-tical changes to the diffraction pattern along zd (primarily lat-tice rotation).
1. Horizontal diffraction pattern changes
For the analysis of the horizontal changes, it is assumedthat the incident beam is collimated vertically and that thereciprocal lattice vector under investigation does not have az-component, i.e., δθ tilt,y and δθm,y are both zero. With theseassumptions the diffraction pattern will be at a height z = zd
= 0. The net horizontal shift of the diffraction peak on thedetector between the ambient and shocked states is given by
xd = Rd tan[2(θ1 − θ0)] + xd,tran+xd,rot, (7)
where
xd,tran = 2tcosθ1sinθ1
sin(θ1 − δθm,z)
cos(θ ′1e − θ0 + δθm,z)
cos(θ ′1e + θ1 − 2θ0 + δθm,z)
×{1 + tan(θ ′1e − θ0 + δθm,z)} (8)
and
xd,rot ={
Rd − Rscos[2(θ1 − θ0)]sin(θ1 + δθm,z)
sin(θ1 − δθm,z)
}
× sin(θ ′1e − θ1 + δθm,z)
cos[2(θ1 − θ0)]cos(θ1 + θ ′1e − 2θ0 + δθm,z)
. (9)
The first term in Eq. (7) is the relation between the Braggangle shift and the diffraction peak shift on the detector foran ideally oriented, non-mosaic crystal. The term xd,tran is theshift on the detector due to the translation of the target, t,and is treated as a correction.3, 4 The term xd,rot is the shifton the detector that depends on the various lattice rotations
Downloaded 04 Feb 2013 to 164.54.164.42. Redistribution subject to AIP license or copyright; see http://rsi.aip.org/about/rights_and_permissions

123905-8 Gupta et al. Rev. Sci. Instrum. 83, 123905 (2012)
about the z-axis. For typical experiments, the translation cor-rection xd,tran may be approximated as 2tcosθ1 and the shiftdue to rotations xd,rot may be neglected (provided Rs = Rd).However, if any of the various lattice rotation terms are notsmall, the full expressions (8) and (9) should be used in Eq.(7) when determining θ1. Next, the effects of micro-lattice-strains and micro-lattice-rotations on the diffraction patternare discussed.
If the crystal has a distribution of micro-lattice-strainsalong the loading direction (corresponding to a distributionin θ1 values), then the Bragg condition will be satisfied in dis-crete locations over a finite horizontal width of the crystal.Each of the various locations on the crystal where the Braggcondition is satisfied has a particular value for the Bragg an-gle θ1 that depends on the local longitudinal lattice strain.Different values of θ1 result in diffracted x-rays at differentpositions xd on the detector according to Eq. (7). Thus, pro-vided that the lattice rotation term is small, a measure of theshock-induced horizontal broadening of the diffraction peakis related directly to the shock-induced distribution of micro-lattice-strains in the crystal.
If the crystal is mosaic and has a finite distribution ofδθmos,z values, the Bragg condition will be satisfied in discreteregions of the crystal over a finite horizontal width; that widthwill grow with increasing δθmos,z. However, the incident fanof x-rays covers a finite angular width and if the width of thedistribution in δθmos,z becomes larger than �θ inc, there will becrystallites with δθmos,z values on the tails of the mosaic dis-tribution that do not contribute to the diffraction. Thus, whendetermining the width of the diffraction peak due to a distribu-tion of δθmos,z values, the largest and smallest values of δθmos,z
that should be used in Eq. (9) are �θ inc/2 and −�θ inc/2. Intypical experiments, the effect of a distribution of δθmos,z val-ues on the width of the diffraction peak is minimal so long asRd = Rs. In other words, with the Bragg-Brentano parafocus-ing geometry the horizontal width of the peak is insensitiveto micro-lattice-rotations. In some instances, it may be desir-able to break the parafocusing geometry by focusing the inci-dent beam directly on the sample (Rs = 0) in order to probea small region of the crystal. In this case, a distribution ofmicro-lattice rotations δθmos,z causes a broadening of the peakthat is roughly proportional to the width of the δθmos,z distri-bution (provided that the width of the distribution is less than�θ inc). However, it is generally more convenient to examinemicro-lattice-rotations by measuring the vertical height of thediffraction pattern as discussed next.
2. Vertical diffraction pattern changes
The position of the diffraction pattern relative to the am-bient diffraction pattern is approximately given by
zd= 2Rd sin θ1(δθtilt,y + δθmos,y) (10)
for diffraction from a single mosaic block. A uniform lat-tice tilt (δθ tilt,y) due to the projectile tilt about the y-axis willshift the whole diffraction pattern vertically. The vertical po-sition of the diffracted beam on the detector from each mo-saic block will depend on the particular value of δθmos,y for agiven block. Hence, the intensity of the diffracted beam as a
function of zd is a direct measure of the distribution of micro-lattice rotations, δθmos,y. The vertical position and height ofthe diffraction pattern on the detector is insensitive to micro-latttice strains.
V. REPRESENTATIVE DIFFRACTION RESULTS
A. Instrumental resolution
Figure 12 compares a diffraction pattern measured at theAPS (Fig. 12(a)) with one measured using the flash x-ray
(a)
(b)
(c)
FIG. 12. (a) Diffraction image of a LiF 200 peak measured at the AdvancedPhoton Source. (b) Diffraction image of a LiF 200 peak measured using aflash x-ray source. (c) Comparison of horizontal cross sections of the LiF200 peak in reciprocal space. The intensity scales of the diffraction imageshave arbitrary units.
Downloaded 04 Feb 2013 to 164.54.164.42. Redistribution subject to AIP license or copyright; see http://rsi.aip.org/about/rights_and_permissions

123905-9 Gupta et al. Rev. Sci. Instrum. 83, 123905 (2012)
system described in Ref. 4 (Fig. 12(b)). The conditions forthe synchrotron measurement were as described in Sec. IV.For the flash x-ray measurements Cu Kα (8 keV) x-rays wereused, Rs = Rd = 186 mm, and a vertical slit collimator wasplaced in front of the x-ray source. To compare the two mea-surements, horizontal cross sections are plotted vs. the re-ciprocal lattice coordinate in Fig. 12(c). The peak measuredat the synchrotron is substantially narrower than the peakmeasured with the flash x-ray system. The small instrumen-tal broadening at the synchrotron makes it easier to measureshock-induced broadening of the diffraction peak which canbe related to micro-lattice strains as described in Sec. IV C.The resolution of the micro-lattice strain measurement at theAPS is about 0.03% strain.
The height of the diffraction peak measured at the syn-chrotron for the ambient LiF crystal is primarily due to theheight of the vertical beam at the detector and can, in princi-ple, be made smaller by moving the vertical focus closer to thedetector. In contrast, the height of the diffraction image usingthe flash x-ray system4 is constrained only by the height ofthe sample unless horizontal x-ray slits are used. Even withhorizontal slits, the diverging beam and large source heightcharacteristic of a flash x-ray system make it more difficult toexamine micro-lattice rotations than with a synchrotron x-raysource. The resolution of the micro-lattice-rotation measure-ment at the APS is about 0.02◦.
B. Representative shock results
Typical diffraction patterns measured in a shock experi-ment at the APS are shown in Figure 13. The XRD geometrywas as described in Sec. IV. The data in Fig. 13(a) are froma single pulse measurement of the 111 peak of Al(111) un-der ambient conditions with a Bragg angle of θ0 = 17.55◦.The height of the diffraction peak is larger than that in the LiFsample in Fig. 12(a) which indicates that the Al(111) crystalhas a distribution of micro-lattice rotations even in the am-bient state. From the height of the peak, a full width at halfmaximum (FWHM) mosaic spread of about 0.1◦ was deter-mined for the ambient Al(111) crystal. Although mosaicityincreases the peak height above the height expected due toinstrumental broadening alone, it does not cause significanthorizontal broadening of the peak because of the parafocusinggeometry.
The experimental arrangement for the shock experimentwas as shown in Fig. 4. The Al6061 impactor had a ve-locity of 349 m/s. The target piece thicknesses were 2.018mm, 0.819 mm, and 0.544 mm for the quartz, Al(111), andVC, respectively. The stress (1.7 GPa) and density compres-sion (ρ/ρ0−1 = 0.021) at the rear surface of the Al(111)were calculated using a one-dimensional wave propagationcode.27
The diffraction pattern measured in the shocked stateis shown in Fig. 13(b). It is shifted horizontally relative tothe ambient peak. It is also somewhat taller and significantlybroader than the ambient peak. The shift of the diffraction pat-tern corresponds to θ1−θ0 = 0.13◦ and the compression of thelattice planes along the loading direction is 0.73%. This lattice
(a)
(b)
FIG. 13. Diffraction images of the 111 peak of an Al(111) sample. (a) Ambi-ent diffraction pattern prior to shock loading. (b) Diffraction pattern measuredin the shocked state showing a shift in the Bragg angle of 0.13◦. The diffrac-tion pattern from the shocked sample is taller and significantly broader thanthe diffraction pattern from the ambient sample. The intensity scales havearbitrary units.
compression is close to the lattice compression (0.69%) ex-pected for a cubic unit cell with a density compression equalto the simulated value. Thus, as was found for LiF,3, 4 NaCl,7
and Cu14 crystals shocked along [100], the unit cell appearsto be compressed nearly isotropically following shock com-pression.
The diffraction peak width in the shocked state is morethan three times larger than the peak width in the ambientstate. This increase in width corresponds to a 0.16% FWHMdistribution of micro-lattice strains in the shocked state. Theincrease in the height of the diffraction pattern from theshocked crystal indicates that the mosaic spread increasedfrom 0.1◦ to 0.24◦ as a result of shock compression.
Future shock compression experiments at the DCS, uti-lizing the Bragg-Brentano parafocusing geometry to examinemicrostructure of shocked single crystals, will have signifi-cantly better signal/noise than the data presented here due tonearly 100 times higher incident photon flux than used in thepresent work.
Downloaded 04 Feb 2013 to 164.54.164.42. Redistribution subject to AIP license or copyright; see http://rsi.aip.org/about/rights_and_permissions

123905-10 Gupta et al. Rev. Sci. Instrum. 83, 123905 (2012)
VI. CONCLUDING REMARKS
The experimental developments and the analysis proce-dures used at the APS to obtain high resolution x-ray diffrac-tion measurements on shocked single crystals19, 20 were de-scribed. Two aspects of the work presented here are of par-ticular significance for the DCS currently being developedat the APS: (1) synchronization/x-ray detection methods and(2) analysis equations for determining shocked crystal mi-crostructure.
A significant experimental challenge in utilizing syn-chrotron x-rays for plate impact (shock-compression) experi-ments at the APS is the need to isolate x-ray signals generatedfrom individual x-ray pulses arriving periodically at a shockedsample and at an area detector. A successful synchronizationand x-ray detection approach utilizing an intensified charge-coupled device (ICCD) with a fast phosphor (Y2SiO5:Ce)was demonstrated. This synchronization method allowed usto obtain with certainty the diffraction signal from an x-raypulse arriving at the sample during the desired uniaxial-strain,constant-stress time window. Recent impact work at the APShas demonstrated the ability to capture more than one frameby using a fast scintillator crystal and either multiplexing thesignal to multiple ICCDs or using a framing CMOS camera.22
By combining the approaches presented here and in Ref. 22,it will be possible to obtain multiple frames during a prede-termined time window with certainty. However, further workis needed to optimize detectors and to develop faster x-rayshutters to limit the high heat loads imposed on the sampleand detector elements when white beam and/or focused x-raybeams are used. An ideal shutter would have an insertion de-lay of a few microseconds or less and open times of a fewmicroseconds or less. A possible approach would be to use asingle shot explosive x-ray shutter triggered by an explodingbridge wire.
The synchrotron based Bragg-Brentano parafocusing ap-proach for examining shocked crystals will be one of severaltypes of x-ray measurement capabilities available at the DCS.Thus, the equations presented here for analyzing the shift andbroadening of diffraction patterns for shocked single crystalswill be useful for DCS users. Significant improvements overthe present work are expected because the monochromaticflux incident on the sample at the DCS will be about 100 timeslarger than in the present work. An additional 100 times in-crease in flux will be possible by removing the double crystalmonochromator and using the full pink beam. In that case, thediffracted beam in the horizontal direction will be broad dueto the ∼5% bandwidth of the pink beam, but the vertical widthof the diffraction pattern from the shocked crystal will still bedominated by lattice rotations. Hence, very precise measuresof lattice rotation distribution in shocked single crystals willbe possible in the future at the DCS.
ACKNOWLEDGMENTS
Cory Bakeman is thanked for assistance with the plateimpact experiments. Beamtime was supported by the HPCATmember institutions (CIW, CDAC, LLNL, and UNLV). Peter
Liermann is thanked for assistance in obtaining safety ap-provals. Assistance with the experimental setup was providedby Eric Rod and Peter Liermann (both at HPCAT). PeterLiermann, Yang Ding (HPSynC), and Wenge Yang of HP-CAT are thanked for beamline assistance during the exper-iments. This work was supported primarily by the (U.S.)Department of Energy/National Nuclear Security Admin-istration (DOE/NNSA) [Grant Nos. DE-FG03-97SF21388,DE-FG52-97SF21388, and DE-NA0000970]. Portions of thiswork were performed at HPCAT (Sector 16), Advanced Pho-ton Source (APS), Argonne National Laboratory. HPCAT op-erations are supported by CIW, CDAC, UNLV, and LLNLthrough funding from DOE-NNSA and DOE-Basic EnergySciences (BES), with partial instrumentation funding by Na-tional Science Foundation (NSF). APS is supported by DOE-BES, under Contract No. DE-AC02-06CH11357.
1Y. M. Gupta, Mater. Res. Soc. Symp. Proc. 538, 139 (1999).2Q. Johnson, A. C. Mitchell, and L. Evans, Appl. Phys. Lett. 21, 29 (1972).3P. A. Rigg and Y. M. Gupta, Appl. Phys. Lett. 73, 1655 (1998).4Y. M. Gupta, K. A. Zimmerman, P. A. Rigg, E. B. Zaretsky, D. M. Savage,and P. M. Bellamy, Rev. Sci. Instrum. 70, 4008 (1999).
5T. d’Almeida and Y. M. Gupta, Phys. Rev. Lett. 85, 330 (2000).6P. A. Rigg and Y. M. Gupta, Phys. Rev. B 63, 094112 (2001).7E. Zaretsky, J. Appl. Phys. 93, 2496 (2003).8B. J. Jensen and Y. M. Gupta, J. Appl. Phys. 100, 053512 (2006).9S. J. Turneaure and Y. M. Gupta, Appl. Phys. Lett. 90, 051905 (2007).
10S. J. Turneaure, Y. M. Gupta, and P. Rigg, J. Appl. Phys. 105, 013544(2009).
11S. J. Turneaure and Y. M. Gupta, J. Appl. Crystallogr. 44, 574 (2011).12S. J. Turneaure and Y. M. Gupta, J. Appl. Phys. 109, 123510 (2011).13S. J. Turneaure and Y. M. Gupta, J. Appl. Phys. 111, 026101 (2012).14A. Loveridge-Smith, A. Allen, J. Belak, T. Boehly, A. Hauer, B. Holian, D.
Kalantar, G. Kyrala, R. W. Lee, P. Lomdahl, M. A. Meyers, D. Paisley, S.Pollaine, B. Remington, D. C. Swift, S. Weber, and J. S. Wark, Phys. Rev.Lett. 86, 2349 (2001).
15D. H. Kalantar, J. F. Belak, G. W. Collins, J. D. Colvin, H. M. Davies, J. H.Eggert, T. C. Germann, J. Hawreliak, B. L. Holian, K. Kadau, P. S. Lom-dahl, H. E. Lorenzana, M. A. Meyers, K. Rosolankova, M. S. Schneider, J.Sheppard, J. S. Stolken, and J. S Wark, Phys. Rev. Lett. 95, 075502 (2005).
16J. Hawreliak, J. D. Colvin, J. H. Eggert, D. H. Kalantar, H. E. Lorenzana,J. S. Stolken, H. M. Davies, T. C. Germann, B. L. Holian, K. Kadau, P. S.Lomdahl, A. Higginbotham, K. Rosolankova, J. Sheppard, and J. S. Wark,Phys. Rev. B 74, 184107 (2006).
17J. A. Hawreliak, D. H. Kalantar, J. S. Stolken, B. A. Remington, H. E.Lorenzana, and J. S. Wark, Phys. Rev. B 78, 220101 (2008).
18M. Suggit, G. Kimminau, J. Hawreliak, B. Remington, N. Park, and J.Wark, Rev. Sci. Instrum. 81, 083902 (2010).
19S. J. Turneaure, Y. M. Gupta, K. Zimmerman, K. Perkins, C. S. Yoo, andG. Shen, J. Appl. Phys. 105, 053520 (2009).
20S. J. Turneaure and Y. M. Gupta, J. Appl. Phys. 106, 033513 (2009).21B. J. Jensen, S. N. Luo, D. E. Hooks, K. Fezzaa, K. J. Ramos, J. D. Yeager,
K. Kwiatkowski, T. Shimada, and D. M. Dattelbaum, AIP Adv. 2, 012170(2012).
22S. N. Luo, B. J. Jensen, D. E. Hooks, K. Fezzaa, K. J. Ramos, J. D.Yeager, K. Kwiatkowski, and T. Shimada, Rev. Sci. Instrum. 83, 073903(2012).
23K. Ichiyanagi, S. Adachi, S. Nozawa, Y. Hironaka, K. G. Nakamura, T.Sato, A. Tomita, and S. Koshihara, Appl. Phys. Lett. 91, 231918 (2007).
24Phosphor Handbook, edited by S. Shionoya and W. M. Yen (CRC, NewYork, 1999), p. 187.
25B. C. Stratton, R. Feder, S. von Goeler, G. F. Renda, V. J. Mastrocola, andJ. L. Lowrance, Rev. Sci. Instrum. 75, 3959 (2004).
26International Tables for X-ray Crystallography, edited by C. H.MacGillavry, G. D. Rieck, and K. Lonsdale (Kynoch, Birmingham, 1962),Vol. III, Chap. 3, Sec. 2.
27Y. M. Gupta, COPS Wave Propagation Code (Stanford Research Institute,Menlo Park, CA, 1978).
Downloaded 04 Feb 2013 to 164.54.164.42. Redistribution subject to AIP license or copyright; see http://rsi.aip.org/about/rights_and_permissions


![The Rupture of Thin Liquid Films Placed on Solid …ancient.hydro.nsc.ru/sk/CICP/v17n5kupershtokh.pdfincluding structuredsurfaces (seereview [4]). The systemsconsistingof thin liquid](https://img.dokumen.tips/doc/110x75/5e25533ecfed0825735b2bf6/the-rupture-of-thin-liquid-films-placed-on-solid-including-structuredsurfaces-seereview.jpg)


