Embed Size (px)
Citation preview

0
REAL ESTATE MARKET ASSESSMENT KAMLOOPS, BC
Prepared for: Venture Kamloops September 2016 Prepared by: Site Economics Ltd. 701 West Georgia Street – Suite 1500 Vancouver, BC V7Y 1C6 File (16-40)

1
EXECUTIVE SUMMARY
Venture Kamloops is the organization responsible for providing economic development services
to the City of Kamloops, and commissioned this real estate report to provide an objective market
overview for Downtown Kamloops as well as Kamloops North Shore.
POPULATION GROWTH
We estimate the current population of Kamloops to be about 90,000 people, growing by about
5% since 2011. As high housing prices in the Lower Mainland drive population surges across
the province, we expect the City population to grow another 20% by 2036 to just under 109,000.
Overall, we expect Kamloops to grow by about 1,000 residents per year for the next ten years
before slowing slightly. Interestingly, the populations of both the North Shore and Downtown
study areas actually declined slightly between 2006 and 2011.
WORKFORCE AND EMPLOYMENT
We expect that Kamloops' working age population will shrink from nearly 70% to under 60% of
its total population by 2031; at the same time, its over-65 population will jump from under 15%
to over 25% of the total population. Such trends can have economic repercussions as a smaller
workforce is tasked with providing the tax-base to support an increasing number of seniors,
who, in turn, will require higher levels of services from public infrastructure.
Between 2011 and 2041 we expect the Kamloops workforce to grow by 32%. The industries we
expect to grow include mining and extraction, construction, and healthcare & social assistance.
Industries we expect to comparatively shrink include agriculture, manufacturing, education and
FIRE (finance, insurance & real estate).
RESIDENTIAL REAL ESTATE MARKET
We expect that Kamloops will require about 505 additional households per year between 2016
and 2021, with that average declining somewhat over time as the rate of growth slows.
Residential sales activity in Kamloops has been on the rise for the past few years with June
sales peaking above the 10-year average in both 2015 and 2016. This June, Kamloops and
District home sales posted best month in nine years, as the number of homes sold recorded a
fifth consecutive double-digit increase. Home sales totalled 351 units in June 2016, up 13.2%
from the previous year. This was the second best June on record after 2007.
June inventories from 2007 though 2016 and the months worth of inventory has dropped to
post-recession lows. There were 5.1 months of inventory at the end of June 2016, down from
6.8 months a year earlier and below the long-run average for this time of year.

2
Inventories of under 7 months are considered to be seller's markets, and it would seem that the
Kamloops and District residential market has recently crossed into that territory.
Predictably, the state of the market influences prices. The average price of homes sold in June
2016 was $339,029, rising 6.6 per cent from a year earlier. The less volatile year-to-date
average sale price was $338,030, up 4.2 per cent from the first half of 2015. The dollar value of
all home sales in June 2016 was $119 million, up 20.7 per cent on a year-over-year basis
RETAIL REAL ESTATE MARKET
Colliers reports that Kamloops has just over 5 million square feet of retail space, with vacant
space increasing by about 1.7% between the end of 2015 and the middle of 2016. This
translates into a rising vacancy rate of about 7.8%. This increasing vacancy rate is likely a
contributing factor to the stable rents across the board for Kamloops retail.
Based on our projections, it would appear that Kamloops retail is overbuilt by several hundred
thousand square feet, as the current inventory exceeds our estimation of the square footage
supported. We estimate that Kamloops can currently support about 4.65 million square feet of
retail, including about 740,000 square feet of restaurant space.
OFFICE REAL ESTATE MARKET
Colliers reports that Kamloops has just over 2.1 million square feet of office space, with vacant
space decreasing to about 4.92% between the end of 2015 and the middle of 2016. This
decreasing vacancy rate is likely a contributing factor to the slightly increasing rents for
Kamloops office space. According to our estimates, Kamloops presently has about as much
office space as it can support. We expect that Kamloops will need about 130,000 additional
square feet by 2021, and about 180,000 additional square feet by 2026.
FINANCIAL ANALYSIS
Our analysis suggests that lower-density low rise condominium apartment developments are
viable in both the Downtown and North Shore study areas, with the North Shore being able to
support the higher-density variant as well.
Overall, the Kamloops market is stronger than it has been in several years and indicators point
toward continued growth especially as other markets in British Columbia continue to rise.
Population growth and the lack of high quality development sites indicate that prices will rise in
both these markets and that every form of multifamily development from low-rise to mid-rise is
viable, depending only on absorption.

3

4
CONTENTS
1.0 SITE AND LOCATION ................................................................................................... 5
1.1 LOCATION ................................................................................................................. 5 1.2 THE STUDY AREAS .................................................................................................. 6 1.3 ACCESS ....................................................................................................................10 1.4 PUBLIC TRANSIT .....................................................................................................11
2.0 POPULATION & WORKFORCE ...................................................................................12
2.1 PROVINCIAL POPULATION .....................................................................................12 2.2 KAMLOOPS AND REGIONAL DISTRICT POPULATION ..........................................13 2.3 KAMLOOPS AND STUDY AREA DEMOGRAPHICS ................................................17 2.4 BUILDING PERMITS .................................................................................................25
3.0 RESIDENTIAL REAL ESTATE MARKET .....................................................................26
3.1 EXISTING HOUSING STOCK ...................................................................................26 3.2 HOUSING DEMAND PROJECTIONS .......................................................................29 3.3 HOUSING TRENDS AND HIGHLIGHTS ...................................................................30 3.4 HOUSING SALES AND PRICES ...............................................................................34 3.5 CURRENT RESIDENTIAL SALES LISTINGS ...........................................................38 3.6 RESIDENTIAL RENTAL MARKET TRENDS .............................................................41 3.7 CURRENT DEVELOPMENTS IN PROGRESS .........................................................42 3.8 POTENTIAL TARGET MARKETS .............................................................................44
4.0 COMMERCIAL MARKET OVERVIEW ..............................................................................45
4.1 RETAIL COMPETITION ..................................................................................................45 4.2 RETAIL AND RESTAURANT MARKET METRICS ..........................................................49 4.3 OFFICE MARKET METRICS ...........................................................................................52 4.4 COMMERCIAL SPACE LISTINGS ..................................................................................53
5.0 FINANCIAL ANALYSIS ......................................................................................................54
5.1 METHOD OF REVENUE PRO FORMAS ........................................................................54 5.2 PRO FORMA ASSUMPTIONS ........................................................................................57 5.3 FINANCIAL ANALYSIS ...................................................................................................58 5.4 SUMMARY ......................................................................................................................61
APPENDIX - RETAIL CATEGORIES AND TRENDS ...............................................................62
APPENDIX - ASSUMPTIONS AND LIMITING CONDITIONS ..................................................67
APPENDIX - RESUME .............................................................................................................71

5
1.0 SITE AND LOCATION
Venture Kamloops is the organization responsible for providing economic development services
to the City of Kamloops, and commissioned this real estate report to provide an objective market
overview for Downtown Kamloops as well as Kamloops North Shore.
1.1 LOCATION
Kamloops is the primary population centre in the Thompson-Nicola Regional District and is
situated at the intersection of the Trans-Canada Highway (Highway 1) and the Yellowhead
Highway (Highway 5), placing at a crossroads between Vancouver, Calgary and Edmonton.
Kamloops is also a rail transportation hub. The Canadian Pacific and Canadian National main
line routes connect Vancouver to the west with Kamloops. The two railroads diverge to the north
and east where they connect with the rest of Canada.
Figure 1: Kamloops and the Thompson-Nicola Regional District
Sources: Google Maps; Site Economics

6
1.2 THE STUDY AREAS
This report focuses on the North Shore and Downtown study areas as shown in context on the
map below. These areas represent the earliest parts of Kamloops developed, with urban activity
dating back to the 1800s.
Figure 2: Kamloops and the Downtown and North Shore Study Areas
Sources: Google Maps; Site Economics
The two study areas are generally flat and ideal for real estate development, and they have
already accommodated fairly extensive development over Kamloops' history. Given their
central locations within the city, all typical municipal infrastructure and services, including
potable water, storm water, sewer and sanitary sewer, hydro, natural gas, telephone, and cable,
as well as ambulance, police, and fire protection are available. It is not expected that
development would trigger any off-site costs as these are mature urban areas with fully
developed infrastructure.

7
The two study area are shown more closely on the map below.
Figure 3: Kamloops Study Areas
Sources: Google Maps; Site Economics
TRAFFIC VOLUMES
According to assorted traffic counts conducted by the City over the past ten years, traffic counts
have been generally increasing steadily on most major roads in direct response to growth.
A typical benchmark for commercial developments is that on the order of 15,000 drive-by
vehicles per day are required to warrant a successful commercial district. Fortune Drive in the
North Shore exceeds this, while Tranquille Road comes close. These traffic volumes are
sufficient to support a major commercial strip along Fortune Drive, or Tranquille Road.

8
Commercial development should be focused on the main street only as it is much less viable on
the interstitial streets between the two. In the Downtown area, few streets exceed daily counts
above 15,000, and arguably the streets that do are likely traffic heading to the Overlanders
Bridge, which connects the northern portion of the city to the southern portion.
Typically, in local neighbourhoods of this scale, most trade area residents will live within a five-
minute drive. The conditions of successful commercial streets typically require four lanes for
traffic, with two lanes for parking. The downtown area does have traffic and sufficient street
parking which creates a street-side buffer for pedestrians on the sidewalk and enhances
customer convenience.
Figure 4: Traffic Volumes in Kamloops Study Areas
Source: City of Kamloops; Sitewise; Bing Maps

9
Downtown traffic volumes are not comparable to other commercial areas where the typical 24-
hour average on successful commercial streets ranges over 20,000 vehicles. In some
instances, too much traffic can be detrimental as it creates congestion and commuters choose
not to stop unless they are forced to. Local retail thrives when there is a large nearby population
base. Significantly growing the local population through the development of multi-family
residential would greatly reduce the dependence of local retail on drive-by traffic.
DOWNTOWN PARKING
A cursory review of parking facilities reveals that parking is not a major issue, rather there is
categorically a surplus of on-street and off street parking. Since many businesses provide some
off-street parking, some long-term effort should be made to add more structured on-site parking
and improve directional signage to parking lots which are just off the main roads. This is very
expensive and adds to the cost of urban versus suburban housing.
The map below shows the parking available Downtown. The scale is too small to discern any
details beyond general geographies and colors, but that is to help illustrate the magnitude of the
parking available downtown. Areas in beige are surface parking lots, while streets in bright
green are paid street parking. Lastly, streets lined in pink offer free street parking for 1-2 hours.
Figure 5: Downtown Parking Availability
Source: City of Kamloops
These large lots present redevelopment opportunities provided there is an adequate market.

10
1.3 ACCESS
The Downtown area has excellent local access and visibility, and is fairly convenient to regional
traffic. The Trans-Canada Highway has an interchange near the branching of Battle Street and
Columbia Street, at the eastern edge of the Downtown study area. The North Shore study area
has high-capacity arterials serving it, connecting it to both Downtown as well as to the major
highways flowing out of the city.
The map below shows the major routes within the city. Green routes are major inter-provincial
highways; gold routes are truck routes with red routes being those designated for the
transportation of dangerous goods.
Figure 6: Kamloops Major Road Network
Sources: BC Ministry of Transportation and Infrastructure

11
1.4 PUBLIC TRANSIT
The current bus service connecting Downtown and North Shore with surrounding residential
communities and other commercial hubs is adequate. There is regular and increasingly well-
used service between downtown and all areas, even those located well to the south and west of
the study areas. The map below shows the extent of the public transportation system; both the
Downtown and North Shore areas are well-served by the bus system.
Figure 7: Public Transportation in Kamloops
Sources: BC Transit; Site Economics

12
2.0 POPULATION & WORKFORCE
This section of the study describes the context for the economic opportunities and population
growth levels. This is important in any economic and financial study of a future real estate
development, as it supports the demand side of the real estate equation.
2.1 PROVINCIAL POPULATION
British Columbia has a population of approximately 4.4 million and it has grown by an average
of 1% per year. The population is ageing due to a long-term decline in birth rates. The baby
boom generation helped delay the onset of the full effect of this ageing but, as they reach
retirement age, the ageing of the population will accelerate, regardless of the level of
international immigration.
Figure 8: Components of Population Growth in British Columbia - 1971-2036
Source: BC Stats

13
The provincial population is expected to continue to grow at a similar rate as in the past. Most of
the growth will occur in the Lower Mainland / Southwest; this is because immigrants tend to be
the main source of growth and they tend to prefer large urban centres where the majority of
infrastructure and employment opportunities are found.
Figure 9: Forecasts Population Growth Rates in British Columbia by Region
Source: BC Stats
2.2 KAMLOOPS AND REGIONAL DISTRICT POPULATION
The City of Kamloops comprises a relatively large geographic area. The municipality is part of
the Thompson-Nicola Regional District (TNRD) and is by far its largest municipality. In 2011,
Kamloops comprised about two-thirds of TNRD’s total population. The map below shows the
TNRD and Kamloops in its context. Other smaller municipalities in the TNRD may be seen in
their proximity to Kamloops.

14
Figure 10: Map of the Thompson-Nicola Regional District
Sources: Google Maps; Site Economics
The Thompson-Nicola Regional District is growing quickly, having increased by about 5.1%
between 2006 and 2011, or an annual growth rate of just over 1%. The population of the
Regional District is broken down in the table below:
Table 1: Population of Thompson-Nicola Regional District - 2011
Municipality Government Type Population (2011)
Thompson-Nicola Regional District 128,473
Kamloops City 85,678
Merritt City 7,113
Chase Village 2,495
Clearwater District Municipality 2,331
Logan Lake District Municipality 2,037
Barriere District Municipality 1,773
Ashcroft Village 1,628
Cache Creek Village 1,040
Clinton Village 636
Sun Peaks Mountain Resort Municipality 371
Lytton Village 228
Source: Statistics Canada

15
Using population projections from BC Stats for the Regional District, we derived projections for
the City of Kamloops over the next 25 years as summarized in the table below. As the most
recent reliable population counts are from the 2011 census the present-day population needed
to be estimated. According to our calculations, we estimate the current population of Kamloops
to be about 90,000 people, or about a 5% increase from 2011. As high housing prices in the
Lower Mainland drive population surges elsewhere in the province, we expect the City
population to grow another 20% by 2036 to just under 109,000. Overall, we expect Kamloops to
grow by about 1,000 residents per year for the next ten years before slowing slightly.
Interestingly, as the populations of both the North Shore and Downtown study areas remain
largely unchanged between the 2006 and 2011 Censuses (the populations actually declined
slightly, our models do not expect any growth occurring there without interventions.
When future population growth is expected to remain strong, demand for both housing are retail
is usually expected to be strong as well. Population growth is transformed into demand for new
housing through household formation, which in turn demand more goods and services.
Table 2: Population Projections for the City of Kamloops - 2011-2036 POPULATION HISTORY AND PROJECTIONS BY AGE COHORT - CITY OF KAMLOOPS - 2006-2036
2006 2011 2016e 2021p 2026p 2031p 2036p
TOTAL 80,375 85,678 90,004 95,297 100,383 104,929 108,895
0 to 4 years 3,835 4,305 3,897 4,334 4,493 4,430 4,359
5 to 9 years 4,305 4,325 4,358 4,275 4,846 5,008 4,966
10 to 14 years 5,205 4,717 4,362 4,725 4,729 5,317 5,518
15 to 19 years 5,870 5,650 4,780 4,629 5,013 5,037 5,643
20 to 24 years 6,070 6,413 5,899 4,960 4,805 5,168 5,240
25 to 29 years 4,580 5,773 5,873 6,357 5,342 5,245 5,609
30 to 34 years 4,435 4,910 5,485 6,585 6,973 6,010 5,953
35 to 39 years 5,280 4,963 5,142 6,171 7,280 7,673 6,698
40 to 44 years 6,330 5,759 5,248 5,641 6,722 7,872 8,256
45 to 49 years 6,795 6,644 5,875 5,555 6,002 7,101 8,293
50 to 54 years 6,345 7,074 6,707 6,032 5,729 6,187 7,297
55 to 59 years 5,750 6,243 7,460 6,771 6,116 5,817 6,271
60 to 64 years 4,180 5,560 6,839 7,425 6,764 6,132 5,839
65 to 69 years 3,375 4,008 6,085 6,671 7,280 6,649 6,031
70 to 74 years 2,820 3,141 4,480 5,764 6,345 6,931 6,344
75 to 79 years 2,315 2,586 3,262 4,035 5,220 5,764 6,297
80 to 84 years 1,665 1,882 2,204 2,673 3,349 4,335 4,813
85 years and over 1,225 1,725 2,049 2,695 3,375 4,253 5,467
HISTORIC ESTIMATED / PROJECTED
Sources: Statistics Canada; BC Stats; Site Economics
The age cohorts above can be grouped into three major categories of residents of working age
as well as those older and those younger. When plotted on a graph as shown below, an
important trend becomes evident.

16
The fact that the Baby Boom generation is getting older and into retirement is well-known and
often discussed because of is implications for the workforce. Kamloops, like most North
American cities, is not immune to this trend.
According to our estimates Kamloops' working age population will shrink from nearly 70% to
under 60% of its total population by 2031; at the same time, its over-65 population will jump
from under 15% to over 25% of the total population. Interestingly, the portion of the population
under the age of 15 is expected to slowly decrease over this period. These trends are
summarized on the chart below.
Figure 11: Population Projections in Kamloops - 2006-2041
0.0%
10.0%
20.0%
30.0%
40.0%
50.0%
60.0%
70.0%
80.0%
2006 2011 2016 2021 2026 2031 2036 2041
PE
RC
EN
TA
GE
OF
PO
PU
LA
TIO
N
Under 15 15 to 64 65 and Older
Sources: Statistics Canada; BC Stats; Site Economics
Such trends can have economic repercussions as a smaller workforce is tasked with providing
the tax-base to support an increasing number of seniors, who, in turn, will require higher levels
of services from public infrastructure.

17
2.3 KAMLOOPS AND STUDY AREA DEMOGRAPHICS
The map below shows the specific areas of Kamloops that will be the focus of this report: the
City Centre and the North Shore. This section will compare key demographic information of the
populations of these study areas against the city as a whole as well as the province of British
Columbia overall.
Figure 12: City Centre and North Shore Study Areas in Kamloops
Sources: Bing Maps; Site Economics
EMPLOYMENT
The unemployment rate in British Columbia was 5.9 per cent at the end of July 2016,
unchanged from the previous month; this was, however, the lowest level since March of 2015.
The number of full-time jobs was down from the end of the previous month.
There were 1,400 fewer full-time jobs in July 2016 compared to a month earlier. A gain of 8,000
part-time positions led to an increase of 6,600 total jobs in July.
Full-time job gains occurred mainly in transportation & warehousing, the financial sector,
professional, scientific and technology services, business & building services and public
administration. These gains offset losses occurring mainly in utilities, construction,
manufacturing, trade services, education, healthcare, information & culture services,
accommodation & food services.

18
The census data shows how Kamloops compares to the province in terms of labour force
participation, and is summarized below.
Table 3: Labour Force Participation - 2011 Census LABOUR FORCE PARTICIPATION - 2011 CENSUS - KAMLOOPS AND COMPARISON AREAS
Total Population 15 years or Over 8,877 2,853 70,402 3,648,290
In the labour force 5,339 60.1% 1,509 52.9% 46,749 66.4% 2,355,193 64.6%
Employed 4,683 52.8% 1,375 48.2% 42,797 60.8% 2,172,199 59.5%
Unemployed 656 7.4% 134 4.7% 3,952 5.6% 182,994 5.0%
Not in the labour force 3,538 39.9% 1,343 47.1% 23,653 33.6% 1,293,097 35.4%
Participation rate 60.1% 52.9% 66.4% 64.6%
British ColumbiaNorth Shore Downtown Kamloops
Sources: Statistics Canada; Sitewise
In 2011, the data showed that Kamloops had a higher proportion of its working age population
engaged in the labour force than did the province overall, yet had a slightly higher
unemployment rate.
The Downtown study area had a significantly lower labour participation rate than the city or the
province overall. The North Shore also exhibited a lower participation rate as well as a higher
unemployment rate when compared to the two larger jurisdictions.
The next two tables on the following pages compare the two study area populations with the city
and the province in terms of employment. Unfortunately the most recent data comes from the
2011 Census; while the numbers themselves may be not as accurate in 2016, the figures from
2011 do provide useful comparisons. Some noteworthy observations include:
North Shore residents are 96% less likely to work in information and cultural services, 54%
less likely to work in educational services, and 53% less likely to work in professional,
scientific and technical services than their province-wide counterparts. On the other hand,
they are 264% more likely to work in mining and extraction industries than those province
wide, and 29% more likely to than the city-wide population.
North Shore residents are also more likely to work in construction, real estate and
accommodation and food services than their citywide or provincial counterparts.
Downtown residents are 192% more likely to work in arts, entertainment and recreation than
their provincial counterparts, and 141% more likely than those citywide. Similarly, downtown
residents are much more likely to work in accommodation and food services than their
citywide or provincial counterparts

19
Downtown residents are 25% more likely to work in public administration than the provincial
average. They are also more likely to work in retail trade and real estate then those across
the province or city.
Downtown residents are over 44% less likely to work in construction than the provincial or
citywide averages, and over 48% less likely to work in transportation and warehousing.
The figures are summarized in the table below:
Table 4: Employment by Industry - Kamloops and Comparison Areas - 2011 EMPLOYMENT BY INDUSTRY - 2011 CENSUS - KAMLOOPS AND COMPARISON AREAS
Labour Force 15 years and over by Industries 5,339 1,509 46,749 2,355,193
Industry - Not applicable 141 2.6% 37 2.5% 928 2.0% 48,963 2.1%
All industries 5,198 97.4% 1,472 97.5% 45,821 98.0% 2,306,230 97.9%
11 Agriculture, forestry, fishing and hunting 23 0.4% 6 0.4% 731 1.6% 61,250 2.6%
21 Mining, quarrying, and oil and gas extraction 212 4.0% 20 1.3% 1,457 3.1% 25,479 1.1%
22 Utilities 22 0.4% 9 0.6% 209 0.4% 13,242 0.6%
23 Construction 506 9.5% 60 4.0% 3,348 7.2% 181,567 7.7%
31-33 Manufacturing 282 5.3% 41 2.7% 2,306 4.9% 148,867 6.3%
41 Wholesale trade 140 2.6% 21 1.4% 1,660 3.6% 90,601 3.8%
44-45 Retail trade 716 13.4% 233 15.4% 6,221 13.3% 266,338 11.3%
48-49 Transportation and warehousing 322 6.0% 40 2.6% 2,684 5.7% 118,716 5.0%
51 Information and cultural industries 6 0.1% 25 1.6% 718 1.5% 62,271 2.6%
52 Finance and insurance 145 2.7% 38 2.5% 1,250 2.7% 91,831 3.9%
53 Real estate and rental and leasing 193 3.6% 54 3.6% 961 2.1% 54,874 2.3%
54 Professional, scientific and technical services 191 3.6% 86 5.7% 2,605 5.6% 179,412 7.6%
55 Management of companies and enterprises 8 0.1% 2 0.2% 67 0.1% 2,464 0.1%
56 Admin & support, waste mgmt & remed. svcs 372 7.0% 18 1.2% 1,610 3.4% 98,932 4.2%
61 Educational services 176 3.3% 101 6.7% 3,529 7.5% 167,930 7.1%
62 Health care and social assistance 737 13.8% 175 11.6% 6,104 13.1% 249,099 10.6%
71 Arts, entertainment and recreation 109 2.0% 106 7.0% 1,377 2.9% 56,955 2.4%
72 Accommodation and food services 574 10.8% 210 13.9% 4,035 8.6% 179,681 7.6%
81 Other services (except public administration) 272 5.1% 114 7.6% 1,926 4.1% 112,790 4.8%
91 Public administration 193 3.6% 115 7.6% 3,023 6.5% 143,931 6.1%
North Shore Downtown Kamloops British Columbia
Sources: Statistics Canada; Sitewise

20
The table below summarizes employment by occupation type, comparing the results from the
two study areas with those from the city of Kamloops and the province of BC.
Some noteworthy observations include:
North Shore residents are 65% more likely to work in natural resource production than
their provincial counterparts and 39% more likely than those citywide. On the other hand,
downtown residents are more than 50% less likely to work in these occupations.
North Shore residents are over 40% less likely to work in management occupations and
over 30% less likely to work in education, law, social and government occupations.
North Shore residents are 72% more likely to work in manufacturing and utilities than
their citywide counterparts, while downtown residents are 16% less likely to work in
those occupations.
Downtown residents are 86% more likely to work in occupations involving arts, culture
and recreation than the citywide average.
The figures are summarized in the table below:
Table 5: Employment by Occupation - Kamloops and Comparison Areas - 2011 EMPLOYMENT BY OCCUPATION - 2011 CENSUS - KAMLOOPS AND COMPARISON AREAS
Labour Force 15 years and over by Occupation 5,339 1,509 46,749 2,355,193
Occupation - Not applicable 135 2.5% 37 2.5% 925 2.0% 48,985 2.1%
All industries 5,204 97.5% 1,472 97.5% 45,824 98.0% 2,306,208 97.9%
0 Management occupations 351 6.6% 141 9.4% 4,558 9.7% 263,781 11.2%
1 Business, finance & admin occupations 609 11.4% 241 16.0% 6,567 14.0% 369,097 15.7%
2 Natural and applied sciences & related 91 1.7% 65 4.3% 2,489 5.3% 154,125 6.5%
3 Health occupations 379 7.1% 127 8.4% 3,568 7.6% 147,690 6.3%
4 Occupations in education, law and social,
community and government services399 7.5% 196 13.0% 5,626 12.0% 266,007 11.3%
5 Occupations in art, culture, recreation & sport 140 2.6% 62 4.1% 1,025 2.2% 78,631 3.3%
6 Sales and service occupations 1,714 32.1% 474 31.4% 11,556 24.7% 554,503 23.5%
7 Trades, transport and equipment operators and
related occupations1,063 19.9% 117 7.7% 7,804 16.7% 337,246 14.3%
8 Natural resources, agriculture and related
production occupations230 4.3% 19 1.2% 1,458 3.1% 60,348 2.6%
9 Occupations in manufacturing and utilities 229 4.3% 31 2.1% 1,173 2.5% 74,780 3.2%
North Shore Downtown Kamloops British Columbia
Sources: Statistics Canada; Sitewise
A key driver for future land use is the nature of the employment. Some industries will grow to be
a larger share of the employment pool over time while others will recede. Using industry growth
projections from BC Stats, we developed employment projections by industry for Kamloops
through 2041.

21
These projections are summarized below:
Table 6: Employment Projections by Industry - City of Kamloops - 2011-2041 EMPLOYMENT PROJECTIONS BY INDUSTRY - CITY OF KAMLOOPS - 2011-2041
INDUSTRY BY 2-DIGIT NAICS CODE 2011 2016 2021 2026 2031 2036 2041
11 Agriculture, forestry, fishing and hunting 731 731 731 738 756 791 833
21 Mining, quarrying, and oil and gas extraction 1,457 1,781 2,177 2,287 2,344 2,451 2,583
22 Utilities 209 219 229 233 240 250 265
23 Construction 3,348 3,660 4,001 4,112 4,214 4,408 4,647
31-33 Manufacturing 2,306 2,400 2,498 2,542 2,604 2,724 2,872
41 Wholesale trade 1,660 1,753 1,851 1,889 1,935 2,024 2,135
44-45 Retail trade 6,221 6,570 6,940 7,082 7,256 7,590 8,002
48-49 Transportation and warehousing 2,684 2,821 2,964 3,022 3,096 3,239 3,414
51 Information and cultural industries 718 752 787 802 821 858 905
52 Finance and insurance 1,250 1,300 1,353 1,377 1,411 1,476 1,556
53 Real estate and rental and leasing 961 1,001 1,041 1,059 1,086 1,136 1,198
54 Professional, scientific and technical services 2,605 2,792 2,993 3,063 3,139 3,283 3,462
55 Management of companies and enterprises 67 67 67 67 68 73 78
56 Admin & support, waste mgmt & remed svcs 1,610 1,727 1,852 1,896 1,942 2,031 2,143
61 Educational services 3,529 3,654 3,784 3,846 3,942 4,123 4,347
62 Health care and social assistance 6,104 6,772 7,513 7,743 7,934 8,298 8,747
71 Arts, entertainment and recreation 1,377 1,441 1,506 1,534 1,572 1,645 1,733
72 Accommodation and food services 4,035 4,304 4,591 4,694 4,810 5,030 5,302
81 Other services (except public administration) 1,926 2,014 2,106 2,145 2,198 2,299 2,424
91 Public administration 3,023 3,209 3,406 3,479 3,565 3,728 3,931
TOTAL 45,821 48,968 52,390 53,610 54,933 57,457 60,577
Employment in Primary Industries (1) 2,205 2,529 2,925 3,042 3,117 3,260 3,436
Population-based Employment (2) 21,011 22,437 23,976 24,527 25,132 26,286 27,714
Tourism-based Employment (3) 9,777 10,340 10,937 11,164 11,439 11,965 12,613
Industrial-based Employment (4) 12,829 13,662 14,553 14,878 15,245 15,946 16,815
1. Primary industries: include farms, forestry, fishing, hunting and mining oil and gas extraction
2. Population-based employment includes jobs in FIRE, business service, institutional and 50% of retail trade.
3. Tourism-based employment includes jobs in accommodation, food and beverage and other service and 50% of retail trade
4. Industrial-based employment includes jobs in manufaturing, wholesale trade, construction, transportation and storage and utilities
Sources: Statistics Canada; Site Economics
Between 2011 and 2041 we expect the Kamloops workforce to grow by 32%. The industries we
expect to gain share of the workforce relative to today are mining and extraction, construction,
and healthcare & social assistance. Industries where we expect decreasing share include
agriculture, manufacturing, education and FIRE (finance, insurance & real estate).

22
EDUCATION AND INCOME
The table below compares the two study area populations with the city and the province in
terms of education attainment. Unfortunately the most recent data comes from the 2011
Census; while the numbers themselves may be not as accurate in 2016, the figures from 2011
do provide useful comparisons.
Table 7: Educational Attainment - Kamloops and Comparison Areas - 2011 EDUCATIONAL ATTAINMENT - 2011 CENSUS - KAMLOOPS AND COMPARISON AREAS
Total Population 15 years and over 8,877 2,853 70,402 3,648,290
No certificate, diploma or degree 2,014 22.7% 597 20.9% 12,001 17.0% 607,885 16.7%
High school certificate or equivalent 3,041 34.3% 788 27.6% 21,260 30.2% 1,009,735 27.7%
Postsecondary certificate, diploma or degree 3,822 43.1% 1,468 51.5% 37,141 52.8% 2,030,670 55.7%
Apprenticeship or trades certificate or
diploma1,409 15.9% 376 13.2% 9,500 13.5% 387,628 10.6%
College, CEGEP or other non-university
certificate or diploma1,266 14.3% 443 15.5% 11,814 16.8% 628,356 17.2%
University certificate or diploma below
bachelor level473 5.3% 184 6.4% 4,432 6.3% 208,367 5.7%
University certificate, diploma or degree at
bachelor level or above675 7.6% 465 16.3% 11,395 16.2% 806,319 22.1%
Bachelor's degree 500 5.6% 334 11.7% 7,633 10.8% 511,445 14.0%
University certificate, diploma or degree
above bachelor level175 2.0% 131 4.6% 3,762 5.3% 294,874 8.1%
British ColumbiaNorth Shore Downtown Kamloops
Sources: Statistics Canada; Sitewise
Some interesting observations include:
Downtown residents are 23% more likely than their citywide counterparts to have less
than a high school education; North Short residents are 34% more likely.
While North Shore residents are 53% less likely than the citywide average to hold a
bachelor-level degree or higher, Downtown residents are slightly more likely to hold this
level of educational attainment.
North Shore and Downtown residents, respectively, are 50% and 25% more likely than
the provincial average to hold a trades certificate or diploma.
There is often a strong correlation between educational attainment and income, and so it comes
as little surprise that residents of both study areas have significantly lower average and median
incomes than their provincial or citywide counterparts. The table below compares household
incomes found in the two study areas with those found across Kamloops and BC. Again, the
most recent reliable numbers come from the 2011 census, so while the numbers themselves
may be somewhat dated, they do reveal interesting relationships.

23
Table 8: Household Income - Kamloops and Comparison Areas - 2011 HOUSEHOLD INCOME - 2011 CENSUS - KAMLOOPS AND COMPARISON AREAS
Households by Income 4,871 %base 1,960 %base 35,022 %base 1,764,637 %base
Under $10,000 534 11.0% 269 13.7% 1,496 4.3% 91,434 5.2%
$ 10,000 - $19,999 823 16.9% 364 18.6% 2,966 8.5% 154,987 8.8%
$ 20,000 - $29,999 735 15.1% 311 15.9% 3,061 8.7% 161,804 9.2%
$ 30,000 - $39,999 609 12.5% 253 12.9% 3,152 9.0% 168,414 9.5%
$ 40,000 - $49,999 485 10.0% 190 9.7% 3,070 8.8% 161,782 9.2%
$ 50,000 - $59,999 379 7.8% 132 6.7% 2,795 8.0% 149,403 8.5%
$ 60,000 - $69,999 318 6.5% 102 5.2% 2,721 7.8% 136,676 7.7%
$ 70,000 - $79,999 262 5.4% 87 4.4% 2,642 7.5% 122,644 7.0%
$ 80,000 - $89,999 177 3.6% 63 3.2% 2,287 6.5% 106,954 6.1%
$ 90,000 - $99,999 126 2.6% 45 2.3% 2,010 5.7% 91,310 5.2%
$ 100,000 - $ 124,999 236 4.8% 85 4.3% 3,695 10.6% 158,059 9.0%
$ 125,000 - $ 149,999 114 2.3% 44 2.3% 2,314 6.6% 103,272 5.9%
$ 150,000 - $ 174,999 32 0.7% 10 0.5% 1,206 3.4% 59,958 3.4%
$ 175,000 - $ 199,999 24 0.5% 1 0.1% 638 1.8% 34,424 2.0%
$ 200,000 - $ 249,999 15 0.3% 0 0.0% 561 1.6% 30,318 1.7%
$ 250,000 and over 4 0.1% 2 0.1% 408 1.2% 33,198 1.9%
Average income 45,586$ 41,579$ 76,285$ 78,227$
Median Income 35,650$ 31,389$ 63,569$ 59,632$
British ColumbiaNorth Shore Downtown Kamloops
Sources: Statistics Canada; Sitewise
Some interesting observations include:
Kamloops has average and median incomes are roughly aligned with those across BC,
but with a slightly higher median income. Moreover, Kamloops has a slightly higher
share of households earning over $100,000 per year than the province as a whole
(25.2% vs. 23.9%). On the other hand, fewer than 9% of study area households have
incomes above that threshold.
The median household income among Downtown residents is less than half that of the
city overall, with over three times the rate of households earning under $10,000 per year.
Downtown households are also twice as likely to earn between $10,000 and $20,000
than their citywide counterparts.
These differences may prove to be important as household incomes play a significant role in
retail demand.
HOUSEHOLDS
The table below compares the two study area populations with the city and the province in
terms of household size and maintainer age. Unfortunately the most recent data comes from the
2011 Census; while the numbers themselves may be not as accurate in 2016, the figures from
2011 do provide useful comparisons.

24
Table 9: Household Metrics - Kamloops and Comparison Areas - 2011 HOUSEHOLD METRICS - 2011 CENSUS - KAMLOOPS AND COMPARISON AREAS
Total Households by Size of Household 4,871 1,960 35,022 1,764,637
1 person 1,792 36.8% 1,146 58.5% 9,315 26.6% 498,924 28.3%
2 persons 1,660 34.1% 577 29.4% 13,027 37.2% 613,269 34.8%
3 persons 706 14.5% 142 7.2% 5,537 15.8% 264,134 15.0%
4 persons 446 9.2% 60 3.1% 4,868 13.9% 237,725 13.5%
5 persons 170 3.5% 25 1.3% 1,607 4.6% 91,600 5.2%
6 or more persons 97 2.0% 10 0.5% 668 1.9% 58,985 3.3%
Persons in Households 10,478 3,052 83,731 4,324,505
Persons per household 2.15 1.56 2.39 2.45
Total Households by Age of Maintainer 4,871 1,960 35,022 1,764,637
Under 25 years 311 6.4% 227 11.6% 1,754 5.0% 57,816 3.3%
25 to 34 years 763 15.7% 232 11.8% 4,910 14.0% 235,950 13.4%
35 to 44 years 671 13.8% 187 9.6% 5,823 16.6% 308,825 17.5%
45 to 54 years 1,005 20.6% 277 14.1% 7,545 21.5% 396,785 22.5%
55 to 64 years 777 16.0% 266 13.6% 6,778 19.4% 354,395 20.1%
65 to 74 years 623 12.8% 256 13.1% 4,557 13.0% 220,365 12.5%
75 years or over 721 14.8% 513 26.2% 3,655 10.4% 190,501 10.8%
Median Age 51.9 57.1 51.7 52.0
British ColumbiaNorth Shore Downtown Kamloops
Source: Statistics Canada
Some noteworthy observations include:
The North Shore and Downtown areas have proportionately many more single-person
households than the city or the province. This in turn drives down the average household
size to 1.56 Downtown and 2.15 on the North Shore as compared to 2.39 citywide. In
fact, Downtown has one-third the share of households of three or more persons than
does the city or province.
Downtown has a much higher rate of household maintainers under the age of 25 than
does the North Shore, the city or the province, yet has the highest median maintainer
age. This indicates a "dumbbell-shaped" age distribution where Downtown has a
disproportionately large representation of maintainers under 25 and maintainers older
than 65.

25
2.4 BUILDING PERMITS
Building permit data from BC Stats for the period between 2006 and 2015 is illustrated in the
following figures. The data show a substantial reduction in residential and commercial building
permit levels for Kamloops in 2009, most likely as a result of the global economic slowdown.
After a brief spike in residential permits in 2010, activity fell in the following years before slowly
building back to near pre-recession levels. These results are summarized in the table and figure
below
Table 10: Building Permit Values - City of Kamloops - 2006-2015 BUILDING PERMIT AMOUNTS - CITY OF KAMLOOPS - 2006-2015
Building Permit Type 2006 2007 2008 2009 2010 2011 2012 2013 2014 2015
Residential (in $000s) 129,027 131,621 133,846 95,308 136,339 98,424 83,795 92,849 111,077 123,581
Industrial (in $000s) 4,980 1,623 7,430 6,583 5,628 14,209 4,068 3,497 8,543 11,010
Commercial (in $000s) 39,473 28,496 55,885 26,023 33,799 29,422 81,991 34,490 20,189 38,630
Institutional (in $000s) 27,256 16,586 3,029 28,878 6,926 11,971 29,155 15,537 47,285 1,516
Residential Building Permits 697 612 575 423 674 396 346 502 419 466
Single Dwelling Units 383 350 239 157 273 146 176 152 217 223
Row Home Units 136 121 90 12 89 57 36 32 41 38
Apartment Units 44 72 210 228 284 151 97 270 117 142
Source: BC Stats
Figure 13: Building Permit Values - City of Kamloops - 2006-2015
0
20,000
40,000
60,000
80,000
100,000
120,000
140,000
160,000
2006 2007 2008 2009 2010 2011 2012 2013 2014 2015
Pe
rmit
Va
lue
(in
$0
00
s)
Residential (in $000s) Industrial (in $000s)
Commercial (in $000s) Institutional (in $000s)
Source: BC Stats
26
3.0 RESIDENTIAL REAL ESTATE MARKET
An assessment of the market is a crucial step to determine the most appropriate development
strategy and mix of unit types and sizes. The market findings bear directly on the development
options for the site, the value of each component, and a reasonable expectation of absorption.
To that end, this market study examines building starts, home sales, and prices for all forms of
residential development in Kamloops.
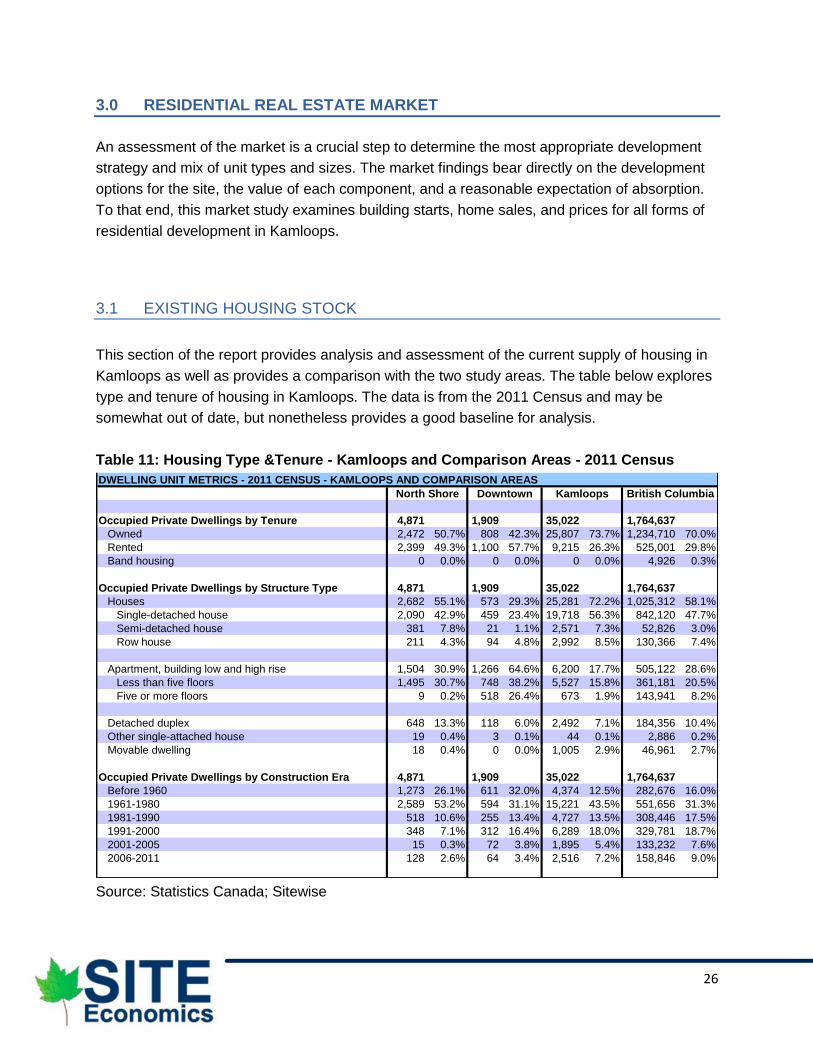
3.1 EXISTING HOUSING STOCK
This section of the report provides analysis and assessment of the current supply of housing in
Kamloops as well as provides a comparison with the two study areas. The table below explores
type and tenure of housing in Kamloops. The data is from the 2011 Census and may be
somewhat out of date, but nonetheless provides a good baseline for analysis.
Table 11: Housing Type &Tenure - Kamloops and Comparison Areas - 2011 Census
DWELLING UNIT METRICS - 2011 CENSUS - KAMLOOPS AND COMPARISON AREAS
Occupied Private Dwellings by Tenure 4,871 1,909 35,022 1,764,637
Owned 2,472 50.7% 808 42.3% 25,807 73.7% 1,234,710 70.0%
Rented 2,399 49.3% 1,100 57.7% 9,215 26.3% 525,001 29.8%
Band housing 0 0.0% 0 0.0% 0 0.0% 4,926 0.3%
Occupied Private Dwellings by Structure Type 4,871 1,909 35,022 1,764,637
Houses 2,682 55.1% 573 29.3% 25,281 72.2% 1,025,312 58.1%
Single-detached house 2,090 42.9% 459 23.4% 19,718 56.3% 842,120 47.7%
Semi-detached house 381 7.8% 21 1.1% 2,571 7.3% 52,826 3.0%
Row house 211 4.3% 94 4.8% 2,992 8.5% 130,366 7.4%
Apartment, building low and high rise 1,504 30.9% 1,266 64.6% 6,200 17.7% 505,122 28.6%
Less than five floors 1,495 30.7% 748 38.2% 5,527 15.8% 361,181 20.5%
Five or more floors 9 0.2% 518 26.4% 673 1.9% 143,941 8.2%
Detached duplex 648 13.3% 118 6.0% 2,492 7.1% 184,356 10.4%
Other single-attached house 19 0.4% 3 0.1% 44 0.1% 2,886 0.2%
Movable dwelling 18 0.4% 0 0.0% 1,005 2.9% 46,961 2.7%
Occupied Private Dwellings by Construction Era 4,871 1,909 35,022 1,764,637
Before 1960 1,273 26.1% 611 32.0% 4,374 12.5% 282,676 16.0%
1961-1980 2,589 53.2% 594 31.1% 15,221 43.5% 551,656 31.3%
1981-1990 518 10.6% 255 13.4% 4,727 13.5% 308,446 17.5%
1991-2000 348 7.1% 312 16.4% 6,289 18.0% 329,781 18.7%
2001-2005 15 0.3% 72 3.8% 1,895 5.4% 133,232 7.6%
2006-2011 128 2.6% 64 3.4% 2,516 7.2% 158,846 9.0%
North Shore Downtown Kamloops British Columbia
Source: Statistics Canada; Sitewise

27
Some noteworthy observations include:
The rate of homeownership in Kamloops is slightly higher than that across BC.
Downtown and North Shore residents are much more likely to rent their home than those
citywide or across the province; Nearly half of North Shore households rent as do over
57% of Downtown households.
Downtown Kamloops has a significant share (over 26%) of its housing supply in the form
of apartments in buildings of five floors or higher. The city and province report this share
at 19.% and 8.2% respectively. Interestingly, the nearby North Shore area has a
negligible number of units of this type, though its lower density zoning is the likely
reason.
The housing stock in the two study areas is significantly older than that citywide or
across the province. Over 63% of units Downtown were built before 1980, and 32% were
built before 1960, while nearly 80% of units on the North Shore were built before 1980.
Compare these with the 56% found across Kamloops and the 46% observed province-
wide. This suggests that both Downtown and North Shore may be ripe for
redevelopment.
Zoning maps for the two study areas are found below and on the following page. Residential
uses are indicated in the legend and one may notice that almost the entirety of each study area
allows for residential development in one form or another. At a glance, higher density forms can
be recognized with colors closer to red. The land use map for Downtown as shown below
reveals that much of the study area is designated for higher density forms than typical single-
detached residences, while the North Shore is less densely designated.
Figure 14: Land Use Map - Kamloops Downtown
Sources: City of Kamloops; Site Economics

28
Figure 15: Land Use Map - Kamloops North Shore
Sources: City of Kamloops; Site Economics

29
3.2 HOUSING DEMAND PROJECTIONS
Using the population forecast from the previous chapter, we can apply the commonplace trend
of a mildly declining household size to project the total number of households in Kamloops. The
results are summarized in the table below.
Table 12: Population and Household Projection - City of Kamloops - 2006-2036
POPULATION AND HOUSEHOLD PROJECTION - CITY OF KAMLOOPS - 2006-2036
2006 2011 2016e 2021p 2026p 2031p 2036p
POPULATION 80,375 85,678 90,004 95,297 100,383 104,929 108,895
HOUSEHOLD SIZE 2.52 2.40 2.31 2.30 2.29 2.28 2.26
HOUSEHOLDS 31,958 35,709 38,959 41,486 43,845 46,069 48,185
AVERAGE ANNUAL INCREASE 750 650 505 472 445 423
HISTORIC ESTIMATED / PROJECTED
Sources: Statistics Canada; BC Stats; Site Economics
The projection shows that Kamloops can expect to require about 505 additional homes per year
between 2016 and 2021, with that average declining somewhat over time as the rate of growth
slows. Note that these projections only cover population growth and do not account for housing
units being lost to age, fire or other disasters. If Kamloops moved to align its housing mix with
that of the province, it would build fewer houses and more apartments over the next twenty
years. Those units built could be built in the quantities shown in the table below.
Table 13: Possible Demand Scenario for New Housing Units - Kamloops - 2016-2036
NEW HOUSING UNITS POSSIBLE DEMAND SCENARIO - CITY OF KAMLOOPS - 2016-2036
2016-2021 2022-2026 2027-2031 2032-2036
New Units Total (5-Year Periods) 2527 2359 2224 2116
New Houses (5-Year Periods) 751 518 319 146
Single-detached house 457 262 94 44
Semi-detached house 184 172 162 58
Row house 109 84 62 44
New Apartments (5-Year Periods) 1284 1340 1396 1451
Less than five floors 813 829 847 867
Five or more floors 453 492 527 561
New Detached Duplexes 470 488 506 524
New other single-attached house 11 12 13 13
New Movable Dwellings 56 49 43 39
Source: Site Economics

30
3.3 HOUSING TRENDS AND HIGHLIGHTS
This section of the report provides analysis and assessment of the Kamloops residential market.
The data is presented in terms of housing starts, housing construction, housing completions,
and housing prices. The data used in this section is derived from various sources including
Canadian Mortgage and Housing Corporation (CHMC) and the Multiple Listing Service (MLS).
HOUSING STARTS
The table below shows the starts for the different types of housing across Kamloops. What can
be readily observed is that starts have not yet reached the pre-recession levels observed in
2006-2007, though they have been steadily increasing.
Table 14: Housing Starts by Unit Type and Market - Kamloops - 2006-2015
UNIT STARTS BY TYPE AND MARKET - KAMLOOPS - 2006-2015
All Markets 2006 2007 2008 2009 2010 2011 2012 2013 2014 2015
Single 481 455 307 195 360 242 283 219 281 296
Semi-Detached 132 80 92 39 47 48 48 42 52 58
Row 67 123 90 27 41 33 21 31 34 32
Apartment 0 105 89 159 193 187 129 187 151 137
All 680 763 578 420 641 510 481 479 518 523
Homeowner 2006 2007 2008 2009 2010 2011 2012 2013 2014 2015
Single 385 389 274 182 348 233 272 210 267 253
Semi-Detached 0 0 6 24 43 44 48 42 38 14
Row 0 0 0 0 0 0 0 4 0 0
Apartment 0 0 0 0 0 0 0 0 0 0
All 385 389 280 206 391 277 320 256 305 267
Rental 2006 2007 2008 2009 2010 2011 2012 2013 2014 2015
Single 61 51 23 4 6 1 11 9 4 3
Semi-Detached 0 0 0 3 0 0 0 0 0 0
Row 0 0 0 0 12 0 0 0 15 0
Apartment 0 48 0 19 0 6 41 10 95 32
All 61 99 23 26 18 7 52 19 114 35
Condo 2006 2007 2008 2009 2010 2011 2012 2013 2014 2015
Single 35 15 10 9 6 8 0 0 10 40
Semi-Detached 132 80 86 12 4 4 0 0 14 44
Row 67 123 90 27 29 33 21 27 19 32
Apartment 0 57 89 140 193 181 88 177 56 105
All 234 275 275 188 232 226 109 204 99 221
Source: CMHC

31
It is interesting to place this rate of development in context with other urban centres of
comparable size, as shown in the table below. Here we can see that in the category of centres
between 50,000 and 100,000 people, Kamloops finds itself in the middle of the pack with a
greater number of starts than Vernon or Prince George, but fewer than Chilliwack or centres on
Vancouver Island. This placement is to be expected as centres closer to Greater Vancouver are
more likely to receive its displaced residents.
Table 15: Housing Starts through 2016 Q2 - Centres over 10,000 residents
Source: CMHC
It is worth noting that Kamloops, along with the other centres not on Vancouver Island are
witnessing positive year-to-date growth, while Island centres have seen declines.

32
HOUSING COMPLETIONS
Housing completions are registered when a unit receives an occupancy permit. This differs from
housing starts which measures when construction starts and does not determine if the project is
eventually completed. The following chart outlines housing completions by submarket and
dwelling type. A total of 231 completions were recorded in the first half of 2016, which is down
nearly 33% from the 344 completions recorded during the same period of 2015. This is well
below the 24% provincial increase recorded for the period.
The table below shows the completions for the different types of housing across Kamloops.
What can be readily observed is that completions have generally not yet reached the pre-
recession levels observed in 2006-2007, though they have been steadily increasing and are
approaching those levels.
Table 16: Housing Completions by Type and Market - Kamloops - 2006-2015
UNIT COMPLETIONS BY TYPE AND MARKET - KAMLOOPS - 2006-2015
All Markets 2006 2007 2008 2009 2010 2011 2012 2013 2014 2015
Single 405 442 403 234 287 322 262 237 251 277
Semi-Detached 130 126 48 79 50 28 67 40 42 54
Row 41 83 111 69 47 31 26 24 28 12
Apartment 43 0 90 45 176 156 283 86 279 55
All 619 651 652 427 560 537 638 387 600 398
Homeowner 2006 2007 2008 2009 2010 2011 2012 2013 2014 2015
Single 307 369 362 216 273 304 249 225 243 248
Semi-Detached 2 0 2 2 36 22 58 34 38 26
Row 0 0 0 0 0 0 0 0 4 0
Apartment 0 0 0 0 0 0 0 0 0 0
All 309 369 364 218 309 326 307 259 285 274
Rental 2006 2007 2008 2009 2010 2011 2012 2013 2014 2015
Single 56 55 33 7 3 13 11 12 8 3
Semi-Detached 2 0 0 3 2 0 1 0 0 0
Row 0 0 0 0 0 12 0 0 0 0
Apartment 0 0 48 0 19 1 10 44 148 12
All 58 55 81 10 24 26 22 56 156 15
Condo 2006 2007 2008 2009 2010 2011 2012 2013 2014 2015
Single 42 18 8 11 11 5 2 0 0 26
Semi-Detached 126 126 46 74 12 6 8 6 4 28
Row 41 83 111 69 47 19 26 24 24 12
Apartment 43 0 42 45 157 155 273 42 131 43
All 252 227 207 199 227 185 309 72 159 109
Source: CMHC
It is worth observing that rental units have historically played a relatively small portion of the
total units delivered, with the notable exception of 2014.

33
As it was with housing starts, it is interesting to place this rate of completion in context with other
urban centres of comparable size, as shown in the table below w can see that in the category of
centres between 50,000 and 100,000 people, Kamloops again finds itself in the middle of the
pack with a greater number of completions than Courtenay, Vernon or Prince George.
Table 17: Housing Completions through 2016 Q2 - Centres over 10,000 residents
Source: CMHC

34
3.4 HOUSING SALES AND PRICES
Residential sales activity in Kamloops has been on the rise for the past few years with June
sales peaking above the 10-year average in both 2015 and 2016 as shown on the chart below.
Kamloops and District home sales posted best month in nine years, as the number of homes
sold through the Kamloops and District Real Estate Association recorded a fifth consecutive
double-digit increase in June 2016. According to the Association’s statistics home sales totaled
351 units in June 2016, up 13.2% from the previous year. This was the second best June on
record after 2007.
Figure 16: Comparisons of June Sales Volumes - Kamloops - 2007-2016
Source: Canadian Real Estate Association
This increased sales activity predictably has had an effect on the available inventory. The chart
below shows June inventories from 2007 though 2016 and the months worth of inventory has
dropped to post-recession lows. There were 5.1 months of inventory at the end of June 2016,
down from 6.8 months a year earlier and below the long-run average for this time of year. This
metric is the number of months it would take to sell current inventories at the current rate of
sales activity.

35
Figure 17: Comparisons of Months of Inventory - Kamloops Residential - 2007-2016
Sources: Canadian Real Estate Association; Site Economics
It should be noted that months of inventory can be sued as a proxy for whether the market
favors buyers or sellers. The range of 7 to 11 months of inventory is considered to be a
"balanced market" while more than 11 months of inventory is indicative of a buyer's market.
Likewise, less than 7 months of inventory is considered to be a seller's market, and it would
seem that the Kamloops and District residential market has recently crossed into that territory.
Indeed it would appear that the Kamloops residential market had been a buyer's market for
some time.
Predictably, the state of the market influences prices. The average price of homes sold in June
2016 was $339,029, rising 6.6 per cent from a year earlier. The less volatile year-to-date
average sale price was $338,030, up 4.2 per cent from the first half of 2015. The dollar value of
all home sales in June 2016 was $119 million, up 20.7 per cent on a year-over-year basis. This
was the second highest level of any month on record and the highest of any June. Sales of all
property types numbered 378 units in June, an increase of 12.5 per cent from June 2015. The
total value of all properties sold was $130.6 million, up 22.5 per cent from June 2015.

36
The chart below shows the average sales prices for homes (of all types) sold in the Kamloops
area since mid-2007. Prices appear to be approaching pre-recession levels these past two
years.
Figure 18: Average Residential Sales Prices - Kamloops and District - 2007-2016
Source: Canadian Real Estate Association
Average sales prices by type of unit are shown below for 2006 and 2011 to illustrate the
differences in price between the types. It is important to know that this time period encompasses
the recession of 2009 including the price fluctuations of that time.
Table 18: Average Sales Prices by Unit Type - Kamloops - 2006 & 2011 AVERAGE PRICES BY UNIT TYPE - KAMLOOPS - 2006 & 2011
Single-Det. Semi-Det. Row Duplex Low-Rise Apt. High-Rise Apt. Total
2006 250,497$ 200,702$ 180,146$ 250,085$ 155,537$ 122,156$ 239,776$
2011 375,136$ 310,642$ 269,298$ 359,669$ 249,393$ 209,938$ 348,733$
% Chg 49.8% 54.8% 49.5% 43.8% 60.3% 71.9% 45.4%
Sources: CMHC; Site Economics

37
The figure below charts the average and median prices for absorbed new (single detached)
units each month between January 2006 and July 2016, while the figure at bottom tracks the
number of such units sold each month. Trend lines have been added to better reveal patterns.
Figure 19: Average & Median Prices of Absorbed Units - Kamloops - 2006-2016
Figure 20: Number of Absorbed Units per Month - Kamloops - 2006-2016
Sources: CMHC; Site Economics

38
3.5 CURRENT RESIDENTIAL SALES LISTINGS
As of early August, 2016 the Kamloops and District MLS had a total of 1,652 residential listings,
984 of which were in the City of Kamloops proper. Single-detached units have the highest
average price points be far, ranging from $364,000 to over $595,000. In the City of Kamloops,
apartments are presently asking the highest average price per square foot at just over $259 per
square foot.
Table 19: Summary of Residential Listings - Kamloops and District - August 2016 RESIDENTIAL MLS LISTINGS - KAMLOOPS AND VICINITY - AUGUST 2016
AREA TYPE LISTINGS AVG PRICE AVG SQFT AVG $/SQFT
Kamloops Apartment Unit 180 204,991$ 791 259.09$
Full Duplex 5 421,740$ 2,963 142.32$
Half Duplex 34 331,738$ 1,843 180.04$
Single Family 609 595,546$ 2,697 220.81$
Townhouse 156 346,338$ 1,584 218.69$
Kamloops Total 984 474,596$ 2,144 221.38$
North East Fourplex 2 264,900$ 2,270 116.70$
Half Duplex 1 189,900$ 1,146 165.71$
Single Family 166 373,878$ 2,065 181.08$
Townhouse 2 171,500$ 953 179.96$
North East Total 171 369,160$ 2,049 180.19$
North West Single Family 24 369,279$ 1,979 186.63$
North West Total 24 369,279$ 1,979 186.63$
South East Half Duplex 4 539,725$ 2,133 253.09$
Single Family 93 595,640$ 2,497 238.52$
Townhouse 4 440,725$ 1,669 264.07$
South East Total 101 587,290$ 2,450 239.71$
South West Apartment Unit 36 75,025$ 825 93.53$
Fourplex 1 235,000$ 3,654 64.31$
Full Duplex 9 179,078$ 1,402 127.72$
Half Duplex 2 159,900$ 1,436 111.39$
Single Family 290 364,364$ 2,128 171.21$
Townhouse 24 180,813$ 1,458 124.00$
Triplex 1 169,000$ 2,000 84.50$
South West Total 363 316,919$ 1,940 163.84$
Grand Total 1652 434,614$ 2,109 206.22$
Sources: Kamloops and District Real Estate Association; Site Economics
Note:
North West includes: Clinton
North East includes: Barriere, Clearwater, Little Fort, and Wells Gray
South West includes: Ashcroft, Cache Creek, Lillooet, Logan Lake, Loon Lake, Lytton,
Merritt, and Stump Lake
South East includes: Adams Lake, Chase, North Shuswap, and South Shuswap

39
Examining the single family listings more closely in Kamloops reveals a very broad range of
price points, from an average of $226,000 in the Red Lake area up to the average of nearly $1.4
million in Sun Peaks. The table below is sorted by decreasing average price per square foot and
again a significant range of values can be observed. Per square foot values in the North Shore
(noted as North Kamloops) are among the lowest in Kamloops, while those in the Downtown
area (noted as South Kamloops) are slightly above the citywide average.
Table 20: Single Family Residential Listings - City of Kamloops - August 2016
RESIDENTIAL MLS LISTINGS - CITY OF KAMLOOPS - AUGUST 2016
TYPE NEIGHBOURHOOD LISTINGS AVG PRICE AVG SQFT AVG $/SQFT
Single Family Sun Peaks 22 1,371,064$ 3,105 441.55$
Pritchard 11 607,327$ 2,007 302.54$
Paul Lake 1 778,500$ 2,600 299.42$
Knutsford-Lac Le Jeune 12 890,450$ 3,234 275.38$
South Thompson Valley 24 891,000$ 3,471 256.70$
Valleyview 20 807,015$ 3,217 250.88$
Monte Lake/Westwold 6 567,300$ 2,363 240.13$
Heffley 27 606,837$ 2,563 236.73$
Cherry Creek/Savona 26 601,435$ 2,552 235.71$
Barnhartvale 35 572,306$ 2,459 232.70$
South Kamloops 29 556,611$ 2,421 229.95$
McLure/Vinsula 5 380,080$ 1,662 228.63$
Tobiano 1 750,000$ 3,366 222.82$
Dallas 10 572,710$ 2,621 218.48$
Juniper Heights 32 684,578$ 3,223 212.42$
Campbell Creek/Deloro 17 567,318$ 2,704 209.81$
Westsyde 50 552,236$ 2,715 203.37$
Rayleigh 11 539,155$ 2,656 202.99$
Sahali 35 595,420$ 2,963 200.97$
Pineview Valley 22 425,327$ 2,161 196.82$
Pinantan 9 416,022$ 2,148 193.70$
Aberdeen 56 533,250$ 2,779 191.90$
Sun Rivers 29 664,090$ 3,574 185.83$
Batchelor Heights 26 561,192$ 3,056 183.63$
Dufferin/Southgate 3 445,800$ 2,495 178.70$
North Kamloops 39 309,685$ 1,761 175.85$
Brocklehurst 44 422,502$ 2,409 175.42$
Westmount 4 362,400$ 2,099 172.63$
Red Lake 3 226,300$ 1,775 127.52$
Single Family Total 609 595,546$ 2,697 220.81$
Sources: Kamloops and District Real Estate Association; Site Economics
When other housing types are examined, as shown on the table on the following page, we see other
patterns. Among apartment listings, the two study areas command some of the highest values per
square foot, with values considerably above the citywide average. Ironically, Sun Peaks which had the
highest single family values have the lowest apartment values, at least among listings active in
August 2016. What is also interesting is that apartments had an average value per square foot
than single family homes.

40
Table 21: Non-Single Family Residential Listings - City of Kamloops - August 2016
RESIDENTIAL MLS LISTINGS - CITY OF KAMLOOPS - AUGUST 2016
TYPE NEIGHBOURHOOD LISTINGS AVG PRICE AVG SQFT AVG $/SQFT
Apartment Unit Sun Rivers 11 244,336$ 689 354.86$
South Kamloops 51 231,320$ 728 317.63$
North Kamloops 6 313,733$ 1,068 293.67$
Aberdeen 7 251,928$ 871 289.10$
Tobiano 1 299,400$ 1,060 282.45$
Dallas 9 189,311$ 689 274.63$
Dufferin/Southgate 5 318,900$ 1,198 266.19$
Sahali 29 241,021$ 945 255.00$
Valleyview 2 299,300$ 1,186 252.36$
Pineview Valley 1 259,900$ 1,099 236.49$
Brocklehurst 11 149,400$ 776 192.62$
Sun Peaks 47 120,812$ 692 174.58$
Apartment Unit Total 180 204,991$ 791 259.09$
Full Duplex Westsyde 1 474,900$ 1,890 251.27$
Brocklehurst 1 450,000$ 2,000 225.00$
North Kamloops 2 354,450$ 2,038 173.96$
Heffley 1 474,900$ 6,852 69.31$
Full Duplex Total 5 421,740$ 2,963 142.32$
Half Duplex Tobiano 2 437,400$ 1,508 290.15$
Knutsford-Lac Le Jeune 2 231,500$ 821 281.97$
Sun Peaks 1 284,900$ 1,215 234.49$
Aberdeen 5 424,140$ 2,016 210.35$
Brocklehurst 9 313,133$ 1,806 173.39$
Sahali 2 261,400$ 1,515 172.54$
Westsyde 7 344,771$ 2,136 161.41$
Heffley 3 372,666$ 2,587 144.07$
North Kamloops 3 221,100$ 1,565 141.25$
Half Duplex Total 34 331,738$ 1,843 180.04$
Townhouse Sun Peaks 7 543,400$ 1,718 316.22$
Dufferin/Southgate 8 532,725$ 2,078 256.43$
Tobiano 4 377,200$ 1,513 249.35$
Westsyde 16 278,662$ 1,234 225.83$
Sahali 41 316,451$ 1,432 220.92$
Aberdeen 35 344,880$ 1,617 213.32$
Juniper Heights 9 343,789$ 1,624 211.69$
Sun Rivers 7 520,357$ 2,476 210.18$
Pineview Valley 6 326,417$ 1,702 191.84$
South Kamloops 6 365,617$ 1,917 190.72$
Batchelor Heights 2 322,400$ 1,752 184.02$
Westmount 1 172,500$ 1,010 170.79$
Valleyview 4 283,650$ 1,663 170.54$
Brocklehurst 10 210,980$ 1,247 169.14$
Townhouse Total 156 346,338$ 1,584 218.69$
Sources: Kamloops and District Real Estate Association; Site Economics

41
3.6 RESIDENTIAL RENTAL MARKET TRENDS
The Canadian Mortgage and Housing Corporation tracks residential rents and vacancy rates in
many Canadian municipalities. The residential rental metrics for Kamloops are summarized in
the tables below.
Table 22: Median Residential Rents - Kamloops - 2006-2015 RENTAL UNIT MEDIAN RENTS BY UNIT SIZE - KAMLOOPS - 2006-2015
Bachelor 1 Bedroom 2 Bedroom 3 Bedroom + Overall
2006 495 550 695 850 625
2007 500 625 745 900 695
2008 575 650 800 950 750
2009 595 700 820 1050 750
2010 600 700 820 1100 750
2011 595 700 825 1150 760
2012 600 700 850 1100 783
2013 690 725 855 1150 800
2014 675 750 875 1150 800
2015 675 758 900 1170 850
Source: CMHC
As can be seen, rents have been rising since 2010 after several years of recession-driven
stagnation. The overall increase of 6.25% observed between 2014 and 2015 was the largest
seen since the pre-recession era. The table below shows rental vacancy rates which are at their
lowest since 2009, but still not below pre-recession rates.
Table 23: Residential Rental Vacancy Rates (%) - Kamloops - 2006-2015 RENTAL UNIT VACANCY RATES BY UNIT SIZE - KAMLOOPS - 2006-2015
Bachelor 1 Bedroom 2 Bedroom 3 Bedroom + Overall
2006 0.6 1.2 0.6 0.3 0.8
2007 0.6 0.6 0.4 0.6 0.5
2008 0 0.3 0.6 0.3 0.4
2009 2.1 1.6 1.4 1.3 1.5
2010 11.2 2.4 1.8 3.2 2.6
2011 1.5 3.7 2.4 4.1 3.1
2012 1.8 3.1 4.7 5.5 3.9
2013 12.9 3.3 2.1 1.1 3.2
2014 10.1 3.6 3.7 2.3 3.9
2015 2.1 2.5 2.4 2.9 2.5
Source: CMHC

42
3.7 CURRENT DEVELOPMENTS IN PROGRESS
Several developments are in various stages of progress in the two Kamloops study areas. In the
Downtown area, rezoning applications or development permits have been submitted for:
A 12-storey 73-unit development at Victoria Street and 1st Avenue;
A 59-unit development on St. Paul Street between 4th and 5th Avenues;
An 18-unit multifamily development on Battle Street at 8th Avenue.
The map below shows these development areas in the Downtown study area and others in
surrounding areas.
Figure 21: Anticipated Development Activity in the Downtown Study Area
Source: City of Kamloops

43
In the North Shore area, rezoning applications or development permits have been submitted for:
a 400-unit high-density development near Northills Mall; and,
a mixed-use commercial and residential development.
The map below shows these development areas in the North Shore study area and others in
surrounding areas.
Figure 22: Anticipated Development Activity in the North Shore Study Area
Source: City of Kamloops

44
3.8 POTENTIAL TARGET MARKETS
Given the growth of Kamloops and the relatively recent shift in the residential market, there is
the potential for multi-family development projects in the study areas. The many positive factors
which will likely lead to continued economic and population growth of the area in both the short-
term and long-term future include:
Proximity to both urban and natural amenities. Kamloops offers residents many
attractive natural and recreational amenities and facilities.
Limited supply of land in other parts of BC is driving ever increasing housing prices and
densities in Kamloops.
Greater acceptance of multi-family housing forms.
Significant population within the Lower Mainland nearing retirement age; many of them
own valuable single detached houses and wish to downsize to smaller units, such as
multi-family housing forms.
Strong international immigration into BC. While Kamloops does not receive the majority
of immigrants arriving in British Columbia. People continue to move further east, as the
high cost of living deters many residents from settling in Metro Vancouver. As Metro
Vancouver grows it has a spin off impact, indirectly increasing growth in the Thompson-
Nicola Region
The target market for this new community will include:
New Inter-Provincial Resident Families: This market segment is made up of young and
new families to the area who need affordable housing and want proximity to an urban
lifestyle.
New Local Resident Families: This buyer group is made up of new families who are
starting a household and are moving from the inner urban areas to the suburbs. The site
is ideal for young families as it offers a location with excellent amenities and value.
Recent Downsizing Retirees: These households may already live in the area in single
detached houses and want to downsize to smaller easier to manage homes such as
apartments.
New International Immigrants: This market segment is already well established in the
new housing market areas. International demand can be less price sensitive than the
local market. These buyers can also be investors renting their units.
Young Singles and Couples: This buyer group would be interested in this location
because of proximity to employment such as downtown.

45
4.0 COMMERCIAL MARKET OVERVIEW
This section outlines the retail market opportunity and potential for retail development in
Kamloops and especially within the study areas. It outlines such issues as industry standards,
retail trends, market supply, market demand, trade area, and competition. Demand for retail
goods is essentially a function of the trade area population and average consumer spending on
retail goods, modified if necessary, by resident age and income characteristics.
Kamloops has most forms of convenience and destination retail development. The ideal type of
retail development at the subject site would be retail serving the local population and to a lesser
extent drive by traffic. Due to very significant competition and limited demand, additional
commercial within the study areas would be very limited in scale and scope. The only viable
industry standard form of retail development would be retail at grade level, either small scale or
slightly larger scale.
4.1 RETAIL COMPETITION
This section of the report outlines the retail competition. The figure below illustrates some of the
more important facilities in and around the Kamloops Downtown study areas followed by a
description of each project.
Figure 23: Major Retail Areas nearby Kamloops Downtown
Sources: Google Maps; Various Brokerages

46
Lansdowne Village - The only major standalone shopping centre in the Downtown study area is
Lansdowne Village, a 191,000 square foot neighbourhood shopping centre anchored by London
Drug, Dollarama, and Save-On-foods.
Victoria Street - While not a shopping centre per se, the span of Victoria Street between 1st and
7th Avenues presents itself as a true "Main Street" with an assortment of locally-run restaurants,
pubs, and boutiques. While not possessing an anchor tenant in the typical sense of the word,
Victoria Street draws patrons with the diversity of its offering and the authenticity of its
experience.
Figure 24: Typical Retailers along Victoria Street in Downtown Kamloops
Source: Google Maps
As the map on the previous page suggests, all of the other retail centres described here lie
outside of the downtown study area. Because of the way Kamloops is organized spatially
coupled with its road infrastructure, the entirely of the city can rightly be considered the trade
area for Downtown, and thus the following centres, though not physically in the Downtown area
can nonetheless service the residents of Kamloops.
Sahali Centre Mall - To the southwest of the Downtown study area is a cluster of smaller
shopping centres, the largest of which is Sahali Centre Mall which measures about 172,000
square feet. It is anchored by a Safeway supermarket and a Dollar Tree discount store.
Columbia Place - Immediately south of Sahali Centre Mall is Columbia Place, a 139,000 square
foot shopping centre anchored by a Save-On-Foods supermarket, a BC Signature Liquor Store,
and a Shoppers Drug Mart.

47
Summit Shopping Centre - To the west of Columbia Place is a 129,000 square foot centre
anchored by a Winners/HomeSense and a JYSK.
Columbia Square - Adjacent to Columbia Place is Columbia Square, a 102,000 square foot
shopping centre anchored by an Urban Barn and a Toys 'R' Us.
Aberdeen Mall - Just slightly to the southeast of the centres mentioned above, and just off the
map shown previously, is Aberdeen Mall, a 464,000 square foot regional mall, anchored by
major national retailers including Sears, Best Buy, Hudson's Bay Company and SportChek.
The figure below illustrates some of the more important facilities in and around the Kamloops
North Shore study areas followed by a description of each project.
Figure 25: Major Retail Areas nearby Kamloops North Shore
Sources: Google Maps; Various Brokerages

48
Northills Shopping Centre - The largest shopping centre within the North Shore study area is the
255,000 square foot Northills Shopping Centre which is anchored by a
Shoppers Drug Mart, a Mark's Work Wearhouse and an Independent Grocers. Interestingly, this
centre spans between Tranquille Road and Fortune Drive.
Fortune Shopping Centre - Just to the north of Northills Shopping Centre is the 100,000 square
foot Fortune Shopping Centre, which is anchored by a Safeway supermarket.
Tranquille Road - While lacking some of the charm of Victoria Street, Tranquille Road has a
number of locally-based establishments that deliver an authenticity not found in locations of
national chains. While Victoria Street is more pedestrian friendly, Tranquille Road is more
oriented around the automobile-friendly strip centre format, with small pockets of "Main Street"
style retail. The occasional vacant lots and stretches low-density development make this
corridor a viable option for infill or densification.
Figure 26: Example of Tranquille Road Streetscape
Source: Google Maps
Brock Shopping Centre - Following Tranquille Road to the west one finds the Brock Shopping
Centre, a small centre of about 75,000 square feet anchored by a Save-on-Foods location and
is home to an assortment of shops including a Tim Horton's location.

49
4.2 RETAIL AND RESTAURANT MARKET METRICS
This subsection explores whether the Kamloops market has an appropriate level of retail space,
including restaurant space. This is done by comparing the amount of space presently in
inventory with the amount of space supported by the size of the population and their
expenditure potential. Colliers International is a well-respected international commercial
brokerage and the information in the table below comes from their recent report on the
Kamloops market.
Table 24: Retail Real Estate Metrics - Kamloops - 2016 Q2 RETAIL REAL ESTATE METRICS - KAMLOOPS - 2015Q4 - 2016Q2
RETAIL MARKET METRICS 2015 Q4 2016 Q2 TREND
Retail Inventory (sqft) 5,106,600 5,085,000* Decreasing
Vacant Space (sqft) 389,800 396,800 Increasing
Vacancy Rate 7.63% 7.80% Increasing
Under Construction (sqft) 11,000 2,000 Decreasing
Average Asking Net Rent
Downtown $9-$15 $9-$15 Stable
North Shore $8-$14 $8-$14 Stable
Power Centres $15-$40 $15-$40 Stable
*inventory has decreased due to the reclassification of several buildings.
Source: Colliers International
Colliers reports that Kamloops has just over 5 million square feet of retail space, with vacant
space increasing by about 1.7% between the end of 2015 and the middle of 2016. This
translates into a rising vacancy rate of about 7.8%. This increasing vacancy rate is likely a
contributing factor to the stable rents across the board for Kamloops retail.
But understanding the supply of retail is only the first part; one must also consider retail
demand. Demand is a function of the size of the trade area population, their income level and,
to an extent, their demographics. As stated earlier, the relatively short travel times experienced
in Kamloops effectively makes the city itself the trade area for retail. Moreover, as Kamloops is
the major centre of the surrounding region, it serves as a retail destination for a larger
population than just the city itself.
Those factors weigh in to model the total expenditures for the various categories of retail, which
are then converted into square feet. This square footage is the amount supported by the trade
area population. The supported square footage is then projected forward to grow proportionately
with how the population is expected to grow.

50
These projections are summarized in the table below.
Table 25: Retail Space Supported - City of Kamloops - 2011-2041 CITY OF KAMLOOPS - 2011-2041 - RETAIL SPACE SUPPORTED (SQUARE FEET) - BASED ON $300/SQFT PRODUCTIVITY
Expenditure Category $/sqft 2011 2016 2021 2026 2031 2036 2041
Supermarkets and other grocery 886,320 930,960 985,800 1,038,360 1,085,400 1,126,440 1,164,120
Convenience stores 56,040 58,800 62,280 65,640 68,640 71,160 73,560
Specialty food stores 72,360 76,080 80,520 84,840 88,680 92,040 95,160
Beer, wine and liquor stores 284,280 298,680 316,200 333,120 348,240 361,320 373,440
Health and personal care stores 356,880 374,880 396,960 418,080 437,040 453,600 468,720
Convenience Retail Total 1,655,880 1,739,400 1,841,760 1,940,040 2,028,000 2,104,560 2,175,000
Clothing stores 245,400 257,760 273,000 287,520 300,480 311,880 322,320
Shoe stores 32,280 33,960 36,000 37,920 39,600 41,040 42,480
Jewellery, luggage, leather goods 43,440 45,600 48,240 50,880 53,160 55,200 57,000
Sporting goods, hobby, book, music 133,680 140,400 148,680 156,600 163,680 169,920 175,560
General merchandise stores 613,440 644,400 682,320 718,680 751,200 779,640 805,680
Miscellaneous store retailers 147,720 155,160 164,280 173,040 180,960 187,800 194,040
General Retail Total 1,215,960 1,277,280 1,352,520 1,424,640 1,489,080 1,545,480 1,597,080
Electronics and appliance stores 178,800 187,800 198,840 209,400 218,880 227,160 234,840
Furniture stores 106,920 112,320 118,920 125,280 131,040 135,960 140,520
Home furnishings stores 74,760 78,480 83,160 87,600 91,560 95,040 98,160
Bldg material, garden equip., supplies 290,880 305,520 323,520 340,800 356,160 369,720 382,080
Building Services Total 651,360 684,120 724,440 763,080 797,640 827,880 855,600
Eating & Drinking Places 703,440 738,960 782,400 824,160 861,480 894,120 924,000
Service Commercial* 81,600 85,680 90,720 95,520 99,840 103,680 107,160
Movie Theatres 11,280 11,880 12,600 13,320 13,920 14,400 14,880
Automotive parts, accessories, tires 106,440 111,840 118,440 124,680 130,440 135,360 139,800
Miscellaneous Total 902,760 948,360 1,004,160 1,057,680 1,105,680 1,147,560 1,185,840
Total, All Stores (non-automotive) 4,425,960 4,649,160 4,922,880 5,185,440 5,420,400 5,625,480 5,813,520 * Service Commercial generally includes clothing services such as laundry, dry-cleaning, tailoring and alteration
services, hair and esthetics salons, and other personal care services.
Sources: Statistics Canada - Retail Trade Journal 63-005; Statistics Canada. Table 080-0023 -
Annual retail store survey; Site Economics Ltd
Based on our projections, it would appear that Kamloops retail is overbuilt by several hundred
thousand square feet, as the current inventory exceeds our estimation of the square footage
supported. We estimate that Kamloops can currently support about 4.65 million square feet of
retail, including about 740,000 square feet of restaurant space.

51
The following table shows common retail tenants in a typical commercial area. While there is
little opportunity for anchor tenants, there may be some opportunity for street front "Main Street"
style retail in the two study areas.
Table 26: Typical Kinds of Retail Tenants FOOD AND DRUG RETAIL APPAREL AND ACCESSORIES
SUPERMARKET MEN'S APPAREL
GROCER/PRODUCE MEN'S APPAREL HIGH END
GROCER SPECIALTY/ETHNIC MEN'S APPAREL ETHNIC
CONVENIENCE STORE LADY'S APPAREL
FISH MARKET LADY'S APPAREL HIGH END
MEAT MARKET LADY'S APPAREL ETHNIC
BAKERY UNISEX
PHARMACY UNISEX ETHNIC
DRUGSTORE CHILDRENS" APPAREL
FOOD SERVICE CHILDREN'S APPAREL ETHNIC
LICENSED RESTAURANT FABRIC
FAST FOOD BRIDAL
RESTAURANT / CAFÉ MATERNITY
RESTAURANT ETHNIC THRIFT/SECOND-HAND MERCHANDISE
SPECIALTY COFFEE/TEA UNIFORMS
OTHER FOOD RETAIL OTHER APPAREL
SERVICE JEWELLERY
BARBER + BEAUTY SALON SHOES
TRAVEL AGENCY HOUSEHOLD / FURNISHINGS
VIDEO RENTAL HOUSEWARES
SHOE REPAIR SMALL APPLIANCES
DRY CLEANER/LAUNDRAMAT LARGE APPLIANCES
PRINTING / COPY HARDWARE STORES
ENTERTAINMENT GARDEN SUPPLIES
FITNESS CENTRE ELECTRONICS / HOME ENTERTAINMENT
VETERINARIAN/PET GROOMING FURNITURE / HOME FURNISHINGS
OTHER DURABLE GOODS/PAINT & WALLPAPER
OFFICE/FINANCIAL SPECIALTY RETAIL
STREETFRONT MEDICAL/DENTAL SPORTING GOODS
INSURANCE/REALTOR/INVEST. BROKER BICYCLE SHOPS
FINANCIAL/BANK/CREDIT UNION BOOKSTORES
ACCOUNTING/LEGAL/NOTARY TOYS/HOBBIES
BUSINESS SERVICES OFFICE SUPPLIES
OPTOMETRIST HEALTH & BEAUTY ITEMS
OTHER CARDS & STATIONARY
GENERAL MERCHANDISE BEDDING & LINEN
JUNIOR DEPARTMENT STORE ART GALLERY/FRAMING
GENERAL STORE CAMERAS / FILM / PHOTO
GENERAL STORE ETHNIC ANTIQUES
VARIETY/DOLLAR STORE GIFTS
OTHER OPTICAL
AUTOMOTIVE PETS & PET SUPPLIES
GAS STATION LIQUOR STORE / BEER AND WINE
TIRES/PARTS/ACCESSORIES FLORIST
SERVICE RECORD & TAPE STORES
AUTO / MOTORCYCLE SALES MUSICAL INSTRUMENTS
CELLULAR TELEPHONES
Source: Site Economics

52
4.3 OFFICE MARKET METRICS
This subsection explores whether the Kamloops market has an appropriate level of office space.
This is done by comparing the amount of space presently in inventory with the amount of space
supported by the level of employment in industries and occupations that utilize office space.
Colliers International is a well-respected international commercial brokerage and the information
in the table below comes from their recent report on the Kamloops market.
Table 27: Office Real Estate Metrics - Kamloops - 2016Q2 OFFICE REAL ESTATE METRICS - KAMLOOPS - 2015Q4 - 2016Q2
OFFICE MARKET METRICS 2015 Q4 2016 Q2 TREND
Office Inventory (sqft) 2,112,600 2,119,000 Increasing
Vacant Space (sqft) 105,600 104,000 Decreasing
Vacancy Rate 5.00% 4.92% Decreasing
Under Construction (sqft) 17,500 0 Decreasing
Average Asking Net Rent
Downtown $9-$20 $10-$20 Increasing
North Shore $8-$14 $8-$14 Stable
Southgate/Aberdeen $15-$18 $15-$18 Stable
Source: Colliers International
From our employment projection shown in Section 2 we can estimate the number of Kamloops
workers employed in an office environment both now and in the future. Using an average of 180
square feet per office worker, we arrive at the estimates for office space supported as
summarized in the table below.
Table 28: Office Space Supported - City of Kamloops - 2011-2041 CITY OF KAMLOOPS - 2011-2041 - OFFICE SPACE SUPPORTED BY EMPLOYMENT
2011 2016 2021 2026 2031 2036 2041
Office-based Employment (Workers) 11,149 11,287 11,427 11,568 11,713 11,860 12,007
Office Space Supported (000s of SQFT) 2,007 2,135 2,272 2,322 2,379 2,489 2,625
Source: Site Economics
According to our estimates, Kamloops presently has about as much office space as it can
support. We expect that Kamloops will need about 130,000 additional square feet by 2021, and
about 180,000 additional square feet by 2026.

53
4.4 COMMERCIAL SPACE LISTINGS
The Colliers reports referenced previously show rents as being generally between $8 and $40
per square foot and the current listings are consistent with that report. The table below lists the
commercial lease listings that were available to give the reader a sense of the rents observed in
different parts of Kamloops. One may notice that lower rents are generally found in South
Kamloops (i.e. Downtown) and North Kamloops (i.e. North Shore) while Sahali and
Dufferin/Southgate tend to enjoy higher rents.
Table 29: Commercial Lease Listings - Kamloops and Vicinity - August 2016 COMMERCIAL PROPERTY LEASE LISTINGS - KAMLOOPS AREA - AUGUST 2016
ADDRESS RENT/SF DISTRICT SUB DISTRICT MLS # TYPE
103-1211 SUMMIT DRIVE $25.00 Kamloops Sahali 132824 Building Only
416-500 NOTRE DAME DR $22.00 Kamloops Sahali 134109 Building Only
158 VICTORIA STREET $19.00 Kamloops South Kamloops 134564 Building Only
209-1211 SUMMIT DRIVE $18.00 Kamloops Sahali 127389 Building Only
106-775 MCGILL ROAD $18.00 Kamloops Sahali 133479 Building Only
106-1315 SUMMIT DRIVE $18.00 Kamloops Sahali 135917 Building Only
103-1315 SUMMIT DRIVE $17.50 Kamloops Sahali 135916 Building Only
2-716 SYDNEY AVE $16.75 Kamloops North Kamloops 131056 Building Only
201-805 NOTRE DAME DR $15.00 Kamloops Dufferin/Southgate 127385 Building Only
3B-1315 SUMMIT DRIVE $15.00 Kamloops Sahali 135915 Building Only
100-1383 MCGILL ROAD $14.00 Kamloops Dufferin/Southgate 133167 Building Only
703 TRANQUILLE ROAD $14.00 Kamloops North Kamloops 135146 Building Only
5-177 TRANQUILLE ROAD $13.00 Kamloops North Kamloops 134303 Building Only
30-789 FORTUNE DRIVE $13.00 Kamloops North Kamloops 136149 Building Only
300-293 1ST AVE $12.50 Kamloops South Kamloops 134937 Building Only
503-1315 SUMMIT DRIVE $12.00 Kamloops Sahali 135918 Building Only
1176 BATTLE STREET $12.00 Kamloops South Kamloops 132664 Building Only
328 SEYMOUR STREET $12.00 Kamloops South Kamloops 134479 Building Only
201-150 VICTORIA STREET $12.00 Kamloops South Kamloops 135145 Building Only
162 ORIOLE ROAD $12.00 Kamloops Valleyview 125811 Building and Land
168 ORIOLE ROAD $12.00 Kamloops Valleyview 134670 Building and Land
4-111 ORIOLE ROAD $12.00 Kamloops Valleyview 136412 Building Only
6-177 TRANQUILLE ROAD $11.00 Kamloops North Kamloops 134301 Building Only
7-177 TRANQUILLE ROAD $11.00 Kamloops North Kamloops 134304 Building Only
1301-1315 SUMMIT DRIVE $11.00 Kamloops Sahali 135919 Building Only
300-153 SEYMOUR STREET $11.00 Kamloops South Kamloops 126578 Building Only
200-180 SEYMOUR STREET $11.00 Kamloops South Kamloops 130830 Building Only
100-293 1ST AVE $10.50 Kamloops South Kamloops 134936 Building Only
224 VICTORIA STREET $10.00 Kamloops South Kamloops 135523 Building and Land
200-205-535 TRANQUILLE RD $8.00 Kamloops North Kamloops 133150 Building Only
BLDG 2-365 MURTLE CRES $24.00 North East Clearwater 135431 Building Only
3320 RIVER RANCH ROAD $11.00 South West Merritt 135500 Building Only
220 OPAL DRIVE $4.95 South West Logan Lake 131505 Building Only
Sources: Kamloops and District Real Estate Association; Site Economics

54
5.0 FINANCIAL ANALYSIS
Some of the main features and assumptions of the financial analysis must be described prior to
assessing and recommending mixes of land uses and densities. The first step of the analysis is
to define the concept plan and then estimate costs and revenues associated with that plan. The
plan and analysis is not based on an aggressive and unlikely planning program, but rather a
practical and achievable program that reflects all aspects of the market, as well as the
constraints and opportunities of the site.
5.1 METHOD OF REVENUE PRO FORMAS
The pro formas comprise the various elements which make up the financial analysis for the
proposed concept plans. Every attempt has been made to ensure consistency for the land uses,
in terms of the costs and revenues, such that the findings can be consistently reviewed, even if
some assumptions and yields / floor areas are changed after further refinement. This means the
ranking of the development scenarios should remain constant regardless of major changes and
refinements. The comparisons show the relative differences as opposed to absolute amounts.
Financial evaluation includes a discussion of the financial benefits, costs and sensitivities. A
number of reasonable cost and revenue assumptions were made for the preparation of this
financial pro forma analysis. Also, no discounting for time is recommended as price appreciation
will at least match the time value of money.
Concept Plans
The first step of the analysis was to explore different scenarios which outline the development
concept in terms of functional site layout and estimated unit yield and floor areas as described
earlier in this report. Numerous considerations in this step influence the financial analysis,
including: floor space ratios (FSR), parking requirements, tenant demands, building setbacks,
sloped terrain, right of way’s (ROW’s), etc.
The unit yield used in this analysis is a vital factor in revenue and cost projections. This form of
analysis is designed to remain relatively constant between land uses. Any measurement, which
may be amended, applies to all options and therefore it should not alter the findings or rankings.
The financial analysis is based on an assumed development plan, which would be achievable
both technically and financially. It should be noted that structured parking is extremely costly
and difficult to justify unless the project is very dense or very valuable.
Revenue Pro Formas – Sales Drive Rents
The second step is to create a revenue pro forma to estimate the overall income which the
development will generate based upon the assumed units / land sales and gross leasable area /

55
unit yield. The revenue pro forma is as accurate as various site plan assumptions are, as shown
in the three development scenarios.
The estimated total net rental revenue generated is used to determine the total land value. The
added net revenue created by a development plan minus the construction costs provides the
financial results for the development strategy and indicates the residual land values. The annual
revenue is capitalized to indicate current value.
The primary determinant of retail rent is sales. There are typical industry standard rent to sales
ratios which range from just 5% for a supermarket to the industry standard of 10% for most
retailers to 15% and higher for food service businesses.
Rental rates in this market are moderate compared to most urban areas. This is a largely due to
the limited walk by traffic and the large size of downtown which is spread over so many blocks.
If pedestrian traffic (caused by anchor tenants and local employees and residents) were greater,
then sales and rents would be higher. Rental rates have not changed significantly since 2014.
A summary business pro forma has been provided for illustrative purposes below. In this
example, if a coffee shop has 250 transactions per day, then they can typically afford a total rent
of $24 per square foot. If sales were twice as high the Coffee Shop could afford rents over $50
per square foot. Rent is a function of sales and can rise or fall very quickly. It is expected that
commercial rents will rise in the study areas but only over the longer term, once customer traffic
has increased.
Table 30: Estimation of Supportable Rents - Hypothetical Coffee Shop Scenario
Source: Site Economics

56
Construction Cost Estimates
The third step is to prepare a project cost estimate. This step is difficult to determine because
there are numerous different cost items, many of which can vary widely on numerous factors,
even after construction has started. The construction costs used in the analysis are based upon
all available salient information and according to development industry standards. Further cost
estimates should be completed as the project advances and the concept plan is refined.
Detailed and final costs are not possible until development is pending as this study explores
only hypothetical development scenarios.
Sale Value and Uncertainty
In order to establish the development costs and revenues a summary financial analysis has
been prepared. Further, the project provides for a contingency allowance. This budget is of a
preliminary nature and it must be refined with more detailed information as the project and
development planning progresses. Using basic industry standards and a set of reasonable
assumptions, the model outlines the potential development and establishes the range of land
values.
Servicing Costs
A newly serviced area could expect the costs of servicing to be paid at the time of development
and spread across the absorption period. The typical development method for estimating on and
off site costs is to assign average costs per residential unit or per square foot of space
developed. This will eventually be supplemented by more detailed estimates. As stated earlier,
though, both study areas in Kamloops are already fully serviced.
Construction Costs and Revenues
Hard costs are the costs associated with the direct actual construction of buildings. The hard
cost estimates are based upon industry standards for the region and preliminary engineering
cost estimates. Soft costs are costs associated with preparing the site for development, such as
architectural and planning fees. Soft costs vary considerably and are approximately 25% of hard
costs (these include a contingency factor for possible cost overruns).
Market Absorption
The residential absorption rate in Kamloops has been stable. There has been improved market
acceptance of multi-family housing. The supply of strata condominiums and townhouses is
being readily absorbed and developers are building more multifamily than in the past.
The pro forma used in this analysis assumes selling prices 5% below comparable product to
reflect the price difference between more attractive new suburban lands on ideal locations and
challenging urban core land with some undesirable adjacent land uses. A lower price makes
them competitive and ensures a reasonable absorption rate.

57
5.2 PRO FORMA ASSUMPTIONS
The development program parameters are modeled on realistic assumptions and provide an
insight into the number and nature of the variables that will affect land values. The residual
model by necessity makes a series of general assumptions. These estimates must be further
refined as a real project advances and additional information is available.
Assumptions factored into the financial model include:
The site areas are all net developable land parcels. The floor space ratio used to
determine the building areas are industry standard. Floor Space Ratios (FSR) for the
North Shore are assumed to be between 2.0 and 2.5 while those Downtown are
assumed to be between 3.0 and 4.0;
The residential is assumed to be low-rise, wood frame apartments (up to 4 storeys)
which are ideally suited for this market. All new development will have structured
parking;
Downtown lots are assumed to measure 150 feet by 120 feet for analysis purposes while
North Shore lots are larger and assumed to measure;
Unit sizes downtown average about 960 square feet for apartment condominiums and
about 725 square feet for rental apartments;
Unit sizes on the North Shore average about 1100 square feet for apartment
condominiums and about 900 square feet for rental apartments;
Building costs for apartment condominiums are estimated at $165-170 per square foot
while building costs for four storey apartments are estimated at $200 per square foot,
including structured parking. Purpose-built rental apartments are assumed to be built at
lower cost;
Soft costs are all calculated as a standard ratio of hard costs;
Developers profit plus return on equity is typically 10-20% of construction costs;
The average sale price for apartment condominiums is expected to be $310 per square
foot in 2018 on the North Shore and $330-350 per square foot Downtown.
The three hypothetical developments for comparison are:
lower-density low-rise condominium apartments;
higher-density low-rise condominium apartments; and
lower-density low-rise rental apartments.

58
5.3 FINANCIAL ANALYSIS
The tables below summarize our financial analyses for hypothetical development scenarios both
Downtown and in the North Shore study area. The left-most columns show the scenario for
lower-density low-rise condominium apartments, the middle columns show higher-density low-
rise condominium apartments, and the right-most columns show lower-density low-rise rental
apartments.
Downtown Development Scenarios
The table below shows the three development scenarios for Downtown. We assume that the
city would allow FSRs of 3.0 for lower-density and 4.0 for higher-density. Among the three
scenarios, the lower-density model appears to be the most viable, commanding up to $28 per
buildable square foot, which is generally within the range of current listings.
Table 31: Residual Land Analysis for Hypothetical Developments - Downtown Kamloops
DOWNTOWN KAMLOOPS STRATA APARTMENT STRATA APARTMENT
DEVELOPMENT SPECIFICATIONS ACTUAL ACTUAL
SITE AREA ACRES AND SQ. FT. GROSS 18,000 18,000
ALLOWABLE FLOOR SPACE RATIO 3.00 4.00
ALLOWABLE GROSS BUILDING AREA SQ. FT. BASED ON FSR 54,000 72,000
NET SQ. FT. @ EFFICIENCY 87% 46,980 87% 62,640
TOTAL NET BUILDING AREA SQ. FT. 46,980 62,640
AVERAGE UNIT SIZE AND NO. OF UNITS 940 50 895 70
DEVELOPMENT COSTS
DEMOLITION AND SITE PREPARATION $2 $36,000 $2 $36,000
OFF SITE $2 $36,000 $2 $36,000
HARD CONSTRUCTION COSTS @ SQ. FT. $170 $9,180,000 $200 $14,400,000
TOTAL HARD COSTS $9,252,000 $14,472,000
ARCH / PERMITS @ TOTAL HARD COSTS 7.0% $647,640 7.0% $1,013,040
FINANCING FEE @ TOTAL HARD COSTS 3.0% $277,560 3.0% $434,160
PROPERTY TAXES @ GROSS SQ. FT. $5.00 $270,000 $5.00 $360,000
FINANCING INTERIM BUILDING @ CONSTRUCTION PERIOD 7.5% $346,950 7.5% $542,700
CONTINGENCY / MISC / PROVISIONAL % HARD COSTS 5.0% $462,600 5.0% $723,600
TOTAL SOFT COSTS $2,004,750 $3,073,500
TOTAL DEVELOPMENT COSTS $ 208 $11,256,750 $ 244 $17,545,500
DEVELOPMENT REVENUES & LAND VALUES
AVG. SALE PRICE PER SQ.FT. AND TOTAL PER UNIT $325 $305,370 $355 $317,674
GROSS REVENUES $15,268,500 $22,237,200
SELLING COSTS 1.5% $229,028 1.5% $333,558
NET REVENUE $15,039,473 $21,903,642
DEVELOPER PROFIT/FINANCING COSTS & ADMIN 20.0% $2,251,350 20.0% $3,509,100
NET SITE LAND VALUE $1,531,373 $849,042
NET LAND VALUE @ BUILDABLE SQ. FT. $28 $12
Source: Site Economics (using data inputs from multiple sources)

59
This scenario assumes a wood-frame building costing $170 per square foot to build and selling
at $330 per square foot, not unlike the building shown below.
Figure 27: New Low-Rise Apartment Building - Downtown Kamloops
Source: Google Maps
The higher-density scenario assumes concrete construction at $200 per square foot, and selling
at a slightly higher price point of $355 per square foot. With its higher cost structure, this
development scenario drives the viable land price per buildable foot down to only $12, which is
almost certainly below what any seller would accept. Thus, we can conclude that the market for
concrete high-rise is not as strong as the market for wood-frame low-rise.

60
North Shore Development Scenarios
The table below shows the three development scenarios for the North Shore study area. We
assume that the city would allow FSRs of 2.00-2.5 for lower-density. There may even be the
potential for a 3.0 higher-density project, however the results would be similar as it is still a low-
rise wood frame condominium. Among the two scenarios, both are viable, revealing a land value
of approximately $22 per buildable square foot, which conservatively aligns well with current
listings.
Table 32: Residual Land Analysis for Hypothetical Developments - North Shore
NORTHSHORE KAMLOOPS
STRATA APARTMENT
STRATA APARTMENT
DEVELOPMENT SPECIFICATIONS
ACTUAL
ACTUAL
SITE AREA ACRES AND SQ. FT. GROSS 30,000 30,000
ALLOWABLE FLOOR SPACE RATIO 2.00 2.50
ALLOWABLE GROSS BUILDING AREA SQ. FT. BASED ON FSR 60,000 75,000
NET SQ. FT. @ EFFICIENCY 87% 52,200 87% 65,250
TOTAL NET BUILDING AREA SQ. FT. 52,200 65,250
AVERAGE UNIT SIZE AND NO. OF UNITS 1,088 48 1,088 60
DEVELOPMENT COSTS
DEMOLITION AND SITE PREPARATION $2 $60,000 $2 $60,000
OFF SITE $2 $60,000 $2 $60,000
HARD CONSTRUCTION COSTS @ SQ. FT. $165 $9,900,000 $165 $12,375,000
TOTAL HARD COSTS $10,020,000 $12,495,000
ARCH / PERMITS @ TOTAL HARD COSTS 7.0% $701,400 7.0% $874,650
FINANCING FEE @ TOTAL HARD COSTS 3.0% $300,600 3.0% $374,850
PROPERTY TAXES @ GROSS SQ. FT. $5.00 $300,000 $5.00 $375,000
FINANCING INTERIM BUILDING @ CONSTRUCTION PERIOD 7.5% $375,750 7.5% $468,563
CONTINGENCY / MISC / PROVISIONAL % HARD COSTS 5.0% $501,000 5.0% $624,750
TOTAL SOFT COSTS $2,178,750 $2,717,813
TOTAL DEVELOPMENT COSTS $ 218 $12,198,750 $ 218 $15,212,813
DEVELOPMENT REVENUES & LAND VALUES
AVG. SALE PRICE PER SQ.FT. AND TOTAL PER UNIT $310 $337,125 $310 $337,125
GROSS REVENUES $16,182,000 $20,227,500
SELLING COSTS 1.5% $242,730 1.5% $303,413
NET REVENUE $15,939,270 $19,924,088
DEVELOPER PROFIT/FINANCING COSTS & ADMIN 20.0% $2,439,750 20.0% $3,042,563
NET SITE LAND VALUE $1,300,770 $1,668,713
NET LAND VALUE @ BUILDABLE SQ. FT. $22 $22
Source: Site Economics (using data inputs from multiple sources)
The two condominium scenarios are both assumed to be wood-frame construction with an
average construction cost of $165 per square foot and selling price of $310 per square foot.
Both scenarios produced viable land prices of about $22 per buildable foot, which seem to be in
line with current listings.

61
5.4 SUMMARY
Our analysis suggests that lower-density low rise condominium apartment developments are
viable in both the Downtown and North Shore study areas, with the North Shore being able to
support the higher-density variant as well. Overall, the Kamloops market is stronger than it has
been in several years and indicators point toward continued growth especially as other markets
in British Columbia continue to rise.
Moreover, the Downtown and North Shore study areas are geographically well-positioned within
Kamloops as they occupy lower elevations and are less prone to inclement conditions found
more frequently at higher elevations. Overall, we see a bright future in the near term for
Kamloops and we feel that developers would be well-advised to start assembling properties in
the two study areas for development of multifamily projects of various densities. Ongoing growth
and the shortage of well-located land indicate that multifamily prices will be rising.

62
APPENDIX - RETAIL CATEGORIES AND TRENDS
Classification of Shopping Centres
It is important to have an understanding of the basic nature of retail areas and shopping centres.
Recent retail development trends have focused on open air shopping centres, street-front retail,
high-density mixed use centres, and freestanding large scale stores. In general, 50% of each
centre’s floor space is occupied by the anchor tenant and 50% by small shops and store. The
ratio is lower for busy locations such as downtown and higher at remote locations which need
the anchors to act as a destination and bring customers to the site.
An anchor tenant is a large scale typically chain store which has an AAA covenant (a solid
financial firm where there is little or no risk of default) and generates extra customer traffic for
nearby stores (i.e. a supermarket chain).
The standard retail classifications are as follows.
Strip Centre: A strip centre is an attached row of stores or service outlets managed as a
coherent retail entity, with on-site parking conveniently located in front of the stores. These vary
in size and range from 8,000 sq.ft. to 30,000 sq.ft.
Neighbourhood Centre: This centre is designed to provide convenience shopping for the day-
to-day needs of consumers in the immediate neighbourhood and is typically anchored by a
supermarket. Neighbourhood centres have an average size of 90,000 sq.ft. across North
America and never exceed 150,000 sq.ft. in size including all office space.
Community Centre: A community centre typically offers a wider range of apparel and other soft
goods than does the neighbourhood centre. It is anchored by a supermarket and small
proportional department store. The problem with this type of project is that it is not focused. It is
not convenient yet and it is not large enough to be a destination. Most of these centres have
been redeveloped into smaller retail facilities with only a supermarket and the surplus land
turned into housing.
Lifestyle Centre: A centre that generally imitates a traditional street front retail district with
sidewalks, streets and pedestrian areas. This is typical in new suburbs where consumers want
alternatives to standard power centres and large unattractive parking lots. These centres try to
offer a more appealing shopping destination with interesting stores, public spaces and
thoughtful architecture and design features. They mix food, personal services and convenience
shopping with apparel and accessories. There are few of these in Canada to date, such as Park
Royal Village, a component of the Park Royal Shopping Centre in West Vancouver.
Regional Centre: This centre type provides general merchandise (a large percentage of which
is made up of apparel retailers) and services in full depth and variety. The anchor tenants are

63
typically full-line department stores, promotional department stores, supermarkets and various
big box tenants.
Super-regional Centre: Similar to a regional centre, but because of its larger size, a super-
regional centre has more anchors, a deeper selection of merchandise, and draws from a larger
population base.
Fashion/Specialty Centre: A centre composed mainly of upscale apparel shops, boutiques and
craft shops carrying selected fashion or unique merchandise of high quality and price. These
centres do need to be anchored, although sometimes restaurants or entertainment can provide
the draw of anchors. The physical design of the centre is very sophisticated, emphasizing a rich
decor and high quality landscaping.
Power Centre: A centre dominated by several large anchors, including discount department
stores, off-price stores, warehouse clubs, or "category killers”.
Theme/Festival Centre: These centres typically employ a unifying theme that is carried out by
the individual shops in their architectural design and, to an extent, in their selection of
merchandise. The biggest appeal of these centres is for tourists, as restaurants and
entertainment facilities can anchor them. These centres, tend to be adapted from older,
sometimes historic, buildings, and can be part of mixed-use projects. The locations tend to have
some sort of natural feature such as water, or a tourist attraction. Granville Island in Vancouver
is an excellent example, as is Ghirardelli Square in San Francisco.
Outlet Centre: Usually located in rural or, occasionally, in tourist locations, outlet centres
consist mostly of manufacturers outlet stores selling their own brands at a discount price. These
are not a major factor in Canada, with the only such mall being the newly developed CrossIron
Mills north of Calgary.
In terms of street-front retail districts they tend to be in the following general categories:
Historic Heritage District and Retail Area. These tend to be tourist-oriented such as
Gastown in Vancouver.
Neighbourhood Commercial Street. These retail centres are typical of urban areas
across North America, and are where local residents obtain most of their food, services
and other convenience needs.
Fashion District. These areas have overcome the initial negative competitive impact of
enclosed malls and many are now thriving. The strength of these street-front retail areas
inspires Lifestyle mall developers who are trying to emulate the best elements of
streetscapes in a single master planned project.
Entertainment District or precinct with cinemas, restaurants/cafes, and nightclubs.
Business-Serving Retail such as on many downtown streets. These areas are
dominated by restaurants and personal or business services.

64
Neighbourhood shopping centres provide merchandise for daily living needs. They include
convenience goods such as food, drugs, financial service (banks) and personal services (beauty
salons). A supermarket is the principal tenant in this type of shopping centre and is often
complemented by a drugstore. This is often the most important type of retail in the area.
According to the International Council of Shopping Centres and Dollars & Cents of Shopping
Centres, the average Canadian neighbourhood centre is 61,452 sq ft with the largest one being
86,775 sq ft and including some office space. It is neither advised, nor possible for a
neighbourhood centre to exceed 100,000 sq ft in size unless the supermarket is extraordinarily
large as it is in this example.
A typical neighbourhood centre is approximately 60,000 sq ft in size and generates sales of just
over $500 per sq ft of gross leasable area.
Food stores such as supermarkets comprise almost half (46.5%) of neighbourhood shopping
centre floor space. Other categories are food service (9.0%), personal service (8.4%),
drugstores (6.5%), other miscellaneous retail (5.9%), and general merchandise stores (4.7%).
The ancillary small shops and stores required under this scenario would typically add up to
40,000 square feet of GLA.
As with any retail market study, it is important to address a number of important retail
development trends influencing the study area.
Regional enclosed malls have lost retail market share over the past 15 years. They tend to
be costly to operate and inconvenient to shop at for the majority of customers. This is due to
such factors as their lack of convenience for many residents within the mall’s large regional
trade area. Regional enclosed malls are declining form of retail development and very few
have been built in North America since 1990. Despite this, they have maintained dominance
over some segments of the industry, particularly apparel. Without a large apparel selection,
this type of retail development is not effective. Without full line department store anchors,
this type of development is inconvenient without the end benefit of shopping there. Regional
malls can rely on infrequent but substantial shopping trips by rural residents.
Malls can be ineffective premises for retailers due to their inconvenient locations and/or
inconvenient space within mall area plans. Internal-only locations with weak exposure to
major arterials do not offer sufficient visibility for retailers seeking the maximum exposure to
potential consumers.
Stand-alone anchors or anchors with just a few ancillary stores are becoming ever more
common due to their simplicity, convenience, and low operating costs.

65
Commercial streets are increasingly attractive locations for retailers as they offer maximum
customer convenience and independence from mall landlords. They also allow retailers to
become an integral part of customers’ ever more differentiated lifestyles. Mass marketing is
growing less effective than in the past and customers seek more unique and socially diverse
experiences.
Street-front retailing is making a major comeback, in part, because it is convenient and it
offers a number of unique and interesting owner-operator tenants. The large chains are all
trying to get locations on good, high traffic streets in order to get closer to their customers,
both physically and in terms of their lifestyle. This trend is only expected to grow as it gains
its strength from the ever more pressing need for convenience with respect to the local
population base.
There is strong demand from supermarkets for in-fill sites in inner-urban areas. The
supermarkets tend to thrive with the associated denser population base and higher traffic
volumes that such locations provide. This would spin off benefits to the immediate area and
make related businesses viable. The major drawback is that there are few large vacant sites
in the downtown areas.
Virtually every major high profile retail development site is being proposed as a mixed use
development. Whenever the site is near rapid transit or at a highway interchange,
developers are proposing street front retail, anchor tenants, structured parking, and
extensive residential around the periphery of the retail facility. A pure retail development is
no longer deemed viable or the highest and best use for high quality locations.
Big-box specialty retail anchors which sell product lines such as: books, crafts, toys, office
supplies, computers, electronics, sporting goods, shoes, pet supplies, home furnishings and
furniture, and home improvement merchandise, have grown to dominate shopping centre
development. The big-box stores are now seeking out street-front retail locations in urban
markets and are modifying their floor plans for these locations. These big-box tenants tend
to locate on their own stand alone sites when possible.
Modern malls have high anchor-to-CRU (commercial retail unit) ratios. This trend is evident
in virtually every recent development.
Street-front commercial districts, with their more numerous, finer grain retail, are being
differentiated from malls, and offer a favourable and complementary shopping alternative.
Dozens of retail impact studies have been conducted when large new stores enter older
communities and in general there has not been any measurable impact.
Neighbourhood centres anchored by supermarkets and drugstores play a very strong role
within the local community. They generate high and consistent rental revenue and have low
associated leasing risk. These are a very popular form of retail development.

66
Most new retail projects are inner urban, mixed use and high density. Many new urban
projects have a substantial multi-family component. In general, retail is ever more
specialized and should be focused on specific customer needs. There is less speculative
building than in the past.
The wholesale to retail industry, typified by stores such as Costco, is still doing very well.
The large discount chains are doing better than full price chains in the recession. Wal-Mart
has done relatively well and taken major steps to “improve” and “green” their practices and
image.
Internet shopping is still growing steadily and is serving an ever bigger function in the
market.

67
APPENDIX - ASSUMPTIONS AND LIMITING CONDITIONS
This market, economic, land use or development report / study has been prepared at the
request of the client for the purpose of providing an estimate of economic feasibility or impact,
development strategy or range of possible market values. It is not reasonable for any person
other than the person or those to whom this report is addressed to rely upon this without first
obtaining permission from the client and the author of this report. This report has been prepared
on the assumption that no other person will rely on it for any other purpose and all liability to all
such persons is denied.
This report has been prepared at the request of the client, and for the exclusive (and
confidential) use of the recipient as named herein and for the specific purpose and function as
stated herein. The client has provided much of the site information and has represented that
such material, such as ownership, rents, size, etc. is reliable. All copyright is reserved to the
author and this report is considered confidential by the author and the client. Possession of this
report, or a copy thereof, does not carry with it the right to reproduction or publication in any
manner, in whole or in part, nor may it be disclosed, quoted from or referred to in any manner, in
whole or in part, without the prior written consent and approval of the author as to the purpose,
form and content of any such disclosure, quotation or reference.
Without limiting the generality of the foregoing, neither all nor any part of the contents of this
report shall be disseminated or otherwise conveyed to the public in any manner whatsoever or
through any media whatsoever or disclosed, quoted from or referred to in any report, financial
statement, prospectus, or offering memorandum of the client, or in any documents filed with any
governmental agency without the prior written consent and approval of the author as to the
purpose, form and content of such dissemination, disclosure, quotation or reference.
If an estimate of economic, market or financial value of the real property / subject site which is
assessed in this report is provided then it pertains to the approximate and general range of
possible values of the freehold or fee simple, or leasehold or leased fee estate in the real
property, based on vacant possession or subject to terms and conditions of the existing tenancy
as described in this report. The property rights exclude mineral rights, if any.
An estimate of economic, market or financial value, if any, contained in this report is founded
upon a thorough and diligent examination and analysis of information gathered and obtained
from numerous sources. Certain information has been accepted at face value, especially if there
was no reason to doubt its accuracy. Other empirical data required interpretive analysis
pursuant to the objective of this report. Certain inquiries were outside the scope of this mandate.
In addition, any economic or financial estimates in this report are approximations only and may
vary from final and actual market values. For these reasons, the analyses, opinions, and
conclusions contained in this report are subject to the following contingent and limiting
conditions.

68
The property has been assessed on the basis that title to the real property is good and
marketable.
The author of this report cannot accept responsibility for legal matters, questions of survey,
opinions of title, hidden or unapparent conditions of the property, toxic wastes or contaminated
materials, soil or sub-soil conditions, environmental, engineering or other technical matters
which might render this property more or less valuable than as stated herein. If it came to our
attention as the result of our investigation and analysis that certain problems may exist, a
cautionary note has been entered in the body of the report.
The legal description of the property and the area of the site was obtained from sources which
are deemed to be reliable. Further, the plans and sketches contained in this report are included
solely to aid the recipient in visualizing the location of the property, the configuration, and
boundaries of the site and the relative position of the improvements on the said lands.
The property, if any, has been described on the basis that the real property is free and clear of
all value influencing encumbrances, encroachments, restrictions or covenants except as any be
noted in this report and that there are no pledges, charges, lien or social assessments
outstanding against the property other than as stated and described herein.
The property if any, has been described on the basis that there are no outstanding liabilities
except as expressly noted herein, pursuant to any agreement with a municipal or other
government authority, pursuant to any contract or agreement pertaining to the ownership and
operation of the real estate or pursuant to any lease or agreement to lease, which may affect
the stated value or saleability of the subject property or any portion thereof.
The interpretation of any leases and other contractual agreements, pertaining to the operation
and ownership of the property, as expressed herein, is solely the opinion of the author, and
should not be construed as a legal interpretation. Further, any summaries of these contractual
agreements, which may appear in the Addenda, are presented for the sole purpose of giving the
reader an overview of the salient facts thereof.
The property, if any, has been described on the basis that the real property complies in all
material respects with any restrictive covenants affecting the site and has been built and is
occupied and being operated, in all material respects, in full compliance with all requirements of
law, including all zoning, land use classification, building, planning, fire and health by-laws,
rules, regulations, orders and codes of all federal, provincial, regional and municipal
governmental authorities having jurisdiction with respect thereto. (It is recognized there may be
work orders or other notices of violation of law outstanding with respect to the real estate and
that there may be certain requirements of law preventing occupancy of the real estate as
described in this report. However, such possible circumstances have not been accounted for in
the reporting process.)

69
Investigations have been undertaken in respect of matters that regulate the use of land.
However, no inquiries have been placed with the fire department, the building inspector, the
health department, or any other government regulatory agency, unless such investigations are
expressly represented to have been made in this report. The subject property must comply with
such regulations and, if it does not comply, its non-compliance may affect the market value of
this property. To be certain of such compliance, further investigations may be necessary.
The property, if any, has been assessed and possibly valued in a general analysis on the basis
that all rents referred to in this report are being paid in full and when due and payable under the
terms and conditions of the attendant leases, agreements to lease or other contractual
agreements. Further, it is assumed that all rents referred to in this report represent the rental
arrangements stipulated in the leases, agreements to lease or other contractual agreements
pertaining to the tenants' occupancy, to the extent that such rents have not been prepaid,
abated, or inflated to reflect extraordinary circumstances, and are fully enforceable
notwithstanding that such documentation may not be fully executed by the parties thereto as at
the date of this reporting, unless such conditions have been identified and noted in this report.
The data and statistical information contained herein were gathered from reliable sources and
are believed to be correct. However, these data are not guaranteed for accuracy, even though
every attempt has been made to verify the authenticity of this information as much as possible.
Any estimated economic or market or financial value does not necessarily represent the value of
the underlying shares, if the asset is so held, as the value of the shares could be affected by
other considerations. Further, the estimated market value if any does not include consideration
of any extraordinary market value of the property, unless the effects of such special conditions,
and the extent of any special value that may arise therefrom, have been described and
measured in this report.
Should title to the real estate presently be held (or changed to a holding) by a partnership, in a
joint venture, through a co-tenancy arrangement or by any other form of divisional ownership,
the value of any fractional interest associated therewith may be more or less than the
percentage of ownership appearing in the contractual agreement pertaining to the structure of
such divisional ownership.
In the event of syndication, the aggregate value of the limited partnership interests may be
greater than the value of the freehold or fee simple interest or leasehold interest in the real
property, by reason of the possible contributory value of non-realty interests or benefits such as
provision for tax shelter, potential for capital appreciation, special investment privileges,
particular occupancy and income guarantees, special financing or extraordinary agreements for
management services.
Should the author of this report be required to give testimony or appear in court or at any
administrative proceeding relating to this report, prior arrangements shall be made therefore,
including provisions for additional compensation to permit adequate time for preparation and for
any appearances which may be required. However, neither this nor any other of these

70
contingent, and limiting conditions is an attempt to limit the use that might be made of this report
should it properly become evidence in a judicial proceeding. In such a case, it is acknowledged
that it is the judicial body which will decide the use of this report which best serves the
administration of justice.
Because market conditions, including economic, social and political factors, change rapidly and,
on occasion, without notice or warning, the estimate of market value expressed herein, as of the
effective date of this report, cannot necessarily be relied upon as any other date without the
subsequent advice of the author of this report. All macro-economic data has been obtained from
reliable sources however major changes in the economy are possible which could move entire
markets and a reported value, if any, would move up or down with that market. The report
typically assumes stable background economic conditions.
If any economic, market or financial value or measure has been expressed herein it is in
Canadian dollars.

71
APPENDIX - RESUME
SITE ECONOMICS LTD.
Richard Wozny, Principal
Experience
Site Economics Ltd. provides real estate development consulting services to developers,
land owners, investors and the public sector. We have completed over 1,100 major
projects with a total value well over $105 billion. We have very extensive experience in all forms of large
scale commercial, industrial, residential and institutional land development projects.
Richard Wozny, the principal, has conducted hundreds of development and financial studies of shopping
centres and commercial districts. He has worked on the development of thousands of acres of industrial
buildings, including complex logistics parks, thousands of acres of residential sub divisions and hundreds
of high density residential buildings and office towers. Richard has also conducted hundreds of store
location and feasibility studies for retailers and financial institutions. Richard combines a creative project
vision with pragmatic development analysis.
Past Employment and Education
Richard’s past work experience includes: Vice President and Manager of Advisory Services, Cushman &
Wakefield, Manager of Retail Development for Western Canada, Marathon Realty Company Ltd., and
Senior Consultant for Shopping Centre Developments, Thomas Consultants Inc. Richard completed a
Master’s Degree in Regional Science at the University of Pennsylvania, Philadelphia, PA, a Master’s
Degree in Religion at Temple University, Philadelphia, PA, and a Bachelor’s Degree in Philosophy at the
University of British Columbia, Vancouver, BC.
Strategic Real Estate Services
Market Analysis Proforma / Discounted Cash Flows
Financial Analysis and Site Valuation Property Acquisition and Disposition Strategies
Highest and Best Use Studies Strategic Review of Redevelopment Options
Development Feasibility Studies Shopping Centre / Downtown Revitalization
Development Strategies & Optimization Market Impact Studies for Major Developments
Supply and Demand Assessments Market Input for Land Use Planning
Absorption and Price Assessments for
Major Developments
Site Selection and Location Assessment for
Retailers and Landowners
Site Economics Ltd.
Suite 1500 – 701 West Georgia Street
Vancouver, BC V7Y 1C6 Canada / 604.250 2992
email: [email protected] / website: www.siteeconomics.com