Embed Size (px)
DESCRIPTION
Â
Citation preview
w e s t e r n w a s h i n g t o n | t h i r d q u a r t e r 2 014 , V o l u m e X X V i i
p r e p a r e d e x c l u s i v e l y f o r w i n d e r m e r e r e a l e s t a t e

Windermere real estate is proud to partner with Gardner economics on this analysis of the Western Washington
real estate market. this report is designed to offer insight into the realities of the housing market. Numbers alone
do not always give an accurate picture of local economic conditions; therefore our goal is to provide an explanation
of what the statistics mean and how they impact the Western Washington housing economy. We hope that
this information may assist you with making an informed real estate decision. For further information about the
real estate market in your area, please contact your Windermere agent.
w e s t e r n w a s h i n g t o n | t h i r d q u a r t e r 2 014 , V o l u m e X X V i i
p r e p a r e d e x c l u s i v e l y f o r w i n d e r m e r e r e a l e s t a t e

-2 -1.5 -1 -.5 0 0.5 1.0 1.5 2.0 2.5 3 3.5 4
r e g i o n a l e c o n o m i c s PerCent Change in annUaL eMPLoyMent
uS 2.0%Washington State 2.5%
San Juan (Friday harbor mSa)
Pierce (tacoma mSa) 3.8%
Skagit (mt. Vernon-anacortes mSa) 3.7%
King (Seattle/Bellevue mSa) 3.5%
thurston (olympia mSa) 2.7%
Cowlitz (longview mSa) 2.4%
Kittitas (ellensburg mSa) 1.9%
Snohomish (everett mSa) 0.8%
lewis (Centralia mSa) 0.4%
Clallam (Port angeles mSa) 0.1%
Whatcom (Bellingham mSa) -0.1%
Kitsap (Bremerton/Silverdale mSa) -0.1%
island (oak harbor mSa) -0.1%
Jefferson (Port townsend mSa) -0.7%
mason (Shelton mSa) -1.4%
Grays harbor (aberdeen mSa) -1.7%
t h i r d q u a r t e r 2 014 , V o l u m e X X V i i Pag e 2t h e g a r d n e r r e p o r t | w i n d e r m e r e r e a l e s ta t e
non agriCULtUre eMPLoyMent: sePteMber 2013–sePteMber 2014
County growthgrowth
rate County growthgrowth
rate
Clallam (Port angeles mSa) 20 0.1% lewis (Centralia mSa) 90 0.4%
Cowlitz (longview mSa) 900 2.4% mason (Shelton mSa) -190 -1.4%
Grays harbor (aberdeen mSa) -380 -1.7% Pierce (tacoma mSa) 10,800 3.8%
island (oak harbor) -20 -0.1% San Juan (Friday harbor mSa) 370 6.5%
Jefferson (Port townsend mSa) -60 -0.7% Skagit (anacortes mSa) 1,700 3.7%
King (Seattle/Bellevue mSa) 44,300 3.5% Snohomish (everett mSa) 2,200 0.8%
Kitsap (Bremerton/Silverdale mSa) -100 -0.1% thurston (olympia mSa) 2,700 2.7%
Kittitas (ellensburg mSa) 290 1.9% Whatcom (Bellingham mSa) -100 -0.1%
Washington State 84,700 2.8% united States (in 000’s) 2,566 1.9%
Not Seasonally Adjusted
at first glance, the third quarter employment growth rate in Western Washington appears to be very healthy, with a substantial 62,520 jobs added since a year ago. For comparison purposes, the state as a whole grew by 2.5 percent and employment country-wide rose by two percent.
despite what appears to have been strong annual growth, the rate of employment growth is actually slowing down with third quarter adding just 3,100 jobs. this isn’t too surprising given that all of the jobs that were lost during the Great recession have now been returned, so it’s actually normal to see the rate of growth start to slow as we exceed our prior peak employment.
the tri-county area of King, Snohomish, and Pierce Counties continues to dominate in terms of total jobs, as well as total growth rates, having added 57,300 jobs over the past year, and 6,800 jobs in third quarter.
From an absolute number standpoint, King County (+44,300) maintains its top position in terms of employment growth over the past 12 months, followed by Pierce (+10,800) and thurston Counties (+2,700). When looking at percentage growth rates, the small San Juan County area saw employment rise by 6.5%. this was followed by Pierce County (+3.8%), Skagit County (+3.5%), and King County (+3.5%).
in Western Washington, annual job losses continue to be seen in just a handful of small counties. Grays harbor County lost 380 jobs over the past year with pronounced declines in transportation and construction industries. employment also dropped in mason County (-190 jobs), and Whatcom and Kitsap Counties fell by 100 jobs a piece. Very minor losses were also seen in Jefferson and island Counties.
When we look at unemployment rates in the region, all counties showed improvement in total unemployment relative to a year ago and no county currently has an unemployment rate above 8.8 percent. We have not seen that for several years.
When compared to September of 2013, the greatest decline in unemployment rates were seen in Cowlitz, mason, and Grays harbor Counties, whose rates all dropped by 1.8 percent.
one might wonder how counties (Grays harbor and mason) that lost jobs over the past year could also show a drop in their unemployment rates. this is a fair question that needs to be addressed.
unemployment rates are calculated by dividing the number of people unemployed by the total workforce. in the counties mentioned above, the labor force actually shrank over the past year and the number of people claiming unemployment benefits also declined. as such, the rates dropped.
6.5%

r e g i o n a l e c o n o m i c s
UneMPLoyMent rate year-over-year
uS 7.0%5.7%
Washington State 6.4%5.4%
Grays harbor (aberdeen mSa) 10.6%8.8%
lewis (Centralia mSa) 9.8%8.3%
mason (Shelton mSa) 9.0%7.2%
Cowlitz (longview mSa) 8.8%7.0%
Clallam (Port angeles mSa) 8.1%7.0%
Jefferson (Port townsend mSa) 8.0%6.6%
Pierce (tacoma mSa) 7.3%6.0%
Skagit (mt. Vernon-anacortes mSa) 7.2%5.9%
island (oak harbor) 7.0%6.1%
thurston (olympia mSa) 6.5%5.4%
Kitsap (Bremerton/Silverdale mSa) 6.2%5.3%
Kittitas (ellensburg mSa) 6.1%5.5%
Whatcom (Bellingham mSa) 6.1%5.3%
Snohomish (everett mSa) 5.8%5.1%
King (Seattle mSa) 5.2%4.8%
San Juan (Friday harbor mSa) 4.7%3.7%
t h i r d q u a r t e r 2 014 , V o l u m e X X V i i Pag e 3t h e g a r d n e r r e p o r t | w i n d e r m e r e r e a l e s ta t e
UneMPLoyMent rate CoMParison
County (Metropolitan area) employment
Unemployment rate
Clallam (Port angeles mSa) 22,480 7.0%
Cowlitz (longview mSa) 38,500 7.0%
Grays harbor (aberdeen mSa) 21,850 8.8%
island (oak harbor) 15,230 6.1%
Jefferson (Port townsend mSa) 8,030 6.6%
King (Seattle mSa) 1,294,900 4.8%
Kitsap (Bremerton/Silverdale mSa) 83,700 5.3%
Kittitas (ellensburg mSa) 15,540 5.5%
lewis (Centralia mSa) 23,670 8.3%
mason (Shelton mSa) 13,230 7.2%
Pierce (tacoma mSa) 294,300 6.0%
San Juan (Friday harbor mSa) 6,100 3.7%
Skagit (mt. Vernon-anacortes mSa) 48,200 5.9%
Snohomish (everett mSa) 272,000 5.1%
thurston (olympia mSa) 104,200 5.4%
Whatcom (Bellingham mSa) 84,100 5.3%
0% 1% 2% 3% 4% 5% 6% 7% 8% 9% 10% 11%
■ Sept 2013 ■ Sept 2014in total, Western Washington continues to outperform the nation as a whole. Certainly, there are pockets that have not seen rapid improvement, but the trend remains positive. i cannot yet up the “B+” grade that i have given the employment situation for over a year, but the faster that we head toward an average of five percent unemployment—generally considered to be full employment—the sooner i will be able to improve the grade.

r e g i o n a l r e a l e s tat e PerCent Change in year-to-date CLosed saLes
San Juan (Friday harbor mSa) 69.7%
mason (Shelton mSa) 30.0%
Grays harbor (aberdeen mSa) 20.5%
thurston (olympia mSa) 13.2%
lewis (Centralia mSa) 11.1%
Jefferson (Port townsend mSa) 7.8%
island (oak harbor) 7.5%
Kitsap (Bremerton/Silverdale mSa) 7.3%
Kittitas (ellensburg mSa) 5.9%
Pierce (tacoma mSa) 2.9%
Cowlitz (longview mSa) 2.6%
Skagit (mt. Vernon-anacortes mSa) 2.1%
Snohomish (everett mSa) 2.0%
Whatcom (Bellingham mSa) 1.3%
Clallam (Port angeles mSa) -1.9%
King (Seattle/Bellevue mSa) -2.2%
t h i r d q u a r t e r 2 014 , V o l u m e X X V i i Pag e 4t h e g a r d n e r r e p o r t | w i n d e r m e r e r e a l e s ta t e
the number of homes for sale dropped slightly between September 2013 and September 2014, which was a little disappointing. total listings in the counties covered by this report were measured at 21,019, compared to 21,589 a year ago (-2.6%). as a point of reference, in September 2009 there were 32,598 homes listed for sale!
Five counties saw the number of homes for sale increase when compared to a year ago, starting with Snohomish County (+7.8%). this was followed by Cowlitz (+6%), Pierce (+5.45%), and Kittitas (+5.3%) Counties. eleven counties reported a year-over-year drop in homes for sale, starting with mason County (-18%). this was followed by Skagit (-14.8%), island (-14.4%), Clallam (-13.8%), and lewis (-11.1%) Counties.
When comparing first and second quarters of this year, every county reported more homes for sale. the greatest increase was seen in Kittitas County where inventory levels grew by 50 percent. this was followed by Whatcom (+44%), King (+41%), and thurston (+40%) Counties. the smallest increase was seen in lewis County at a still respectable 14 percent increase over the first quarter of this year.
When we look at home sales, 49,391 homes were sold in the first three quarters of 2014—a modest increase of 1.9 percent compared to the same period in 2013. during the third quarter of this year, there were a total of 19,237 home sales, an increase of 5.4 percent over second quarter. during this time, sales rose the most in island County (+28.3%). this was followed by mason (+26.4%), Grays harbor (+22%), Kittitas (+17.8%), and Whatcom (+17.7%) Counties. Sales fell in just one county, San Juan, which is not surprising given the volatility that this particular market frequently sees due to the limited number of homes for sale at any one time. CLosed saLes aCtivity of existing singLe-faMiLy hoMe & Condo
Countyytd
sept 14ytd
sept 13 Countyytd
sept 14ytd
sept 13
Clallam (Port angeles mSa) 420 428 lewis (Centralia mSa) 630 567
Cowlitz (longview mSa) 758 739 mason (Shelton mSa) 741 570
Grays harbor (aberdeen mSa) 671 557 Pierce (tacoma mSa) 7,752 7,535
island (oak harbor) 1,015 944 San Juan (Friday harbor mSa) 235 154
Jefferson (Port townsend mSa) 389 361 Skagit (anacortes mSa) 1,123 1,100
King (Seattle/Bellevue mSa) 20,889 21,362 Snohomish (everett mSa) 7,516 7,366
Kitsap (Bremerton/Silverdale mSa) 2,563 2,389 thurston (olympia mSa) 2,269 2,004
Kittitas (ellensburg mSa) 431 407 Whatcom (Bellingham mSa) 1,989 1,964
-5% 0% 5% 10% 15% 20% 25% 30% 35% 40% 45% 50%
52.6%
hoMe PriCe growth rate
Clallam (Port angeles mSa) 18.2%
Kittitas (ellensburg mSa) 18.1%
lewis (Centralia mSa) 15.9%
island (oak harbor) 7.5%
Snohomish (everett mSa) 7.0%
King (Seattle/Bellevue mSa) 6.4%
thurston (olympia mSa) 5.7%
Pierce (tacoma mSa) 3.7%
Whatcom (Bellingham mSa) 3.7%
Cowlitz (longview mSa) 2.9%
Skagit (mt. Vernon-anacortes mSa) 2.6%
Jefferson (Port townsend mSa) 1.7%
Grays harbor (aberdeen mSa) 1.5%
Kitsap (Bremerton/Silverdale mSa) -1.3%
mason (Shelton mSa) -2.9%
San Juan (Friday harbor mSa) -16.5%
t h i r d q u a r t e r 2 014 , V o l u m e X X V i i Pag e 5t h e g a r d n e r r e p o r t | w i n d e r m e r e r e a l e s ta t e
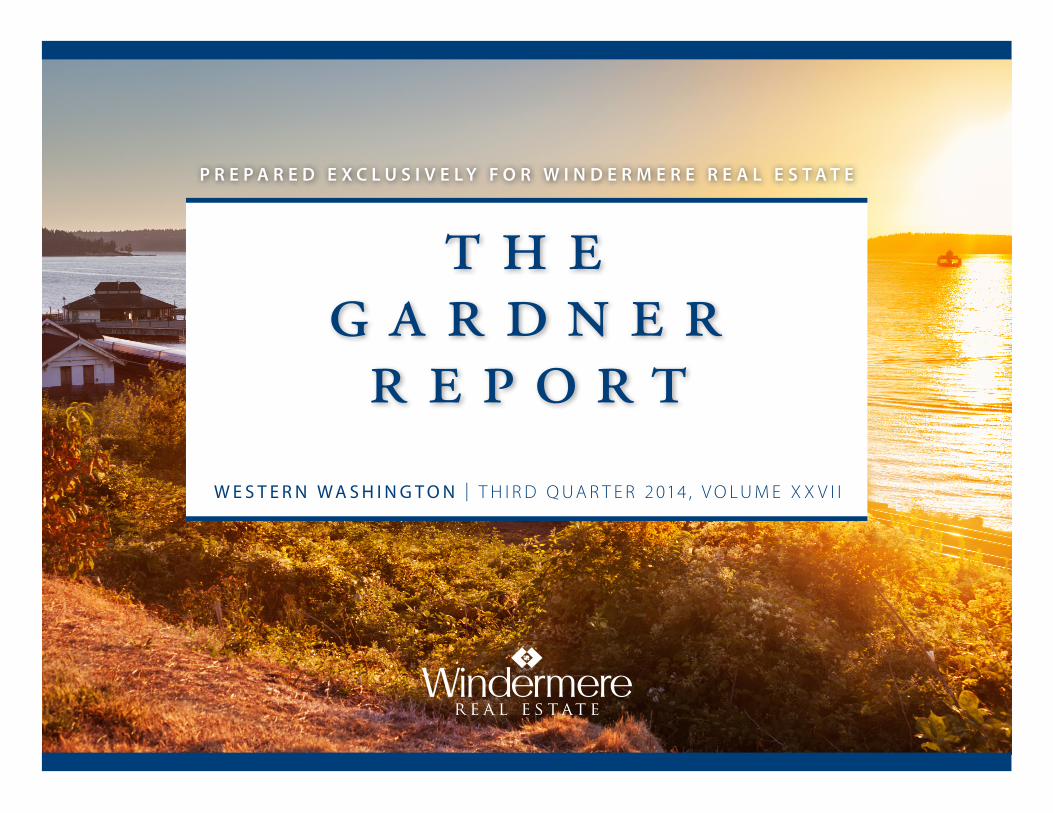
the average price of homes sold in Western Washington in the third quarter was $361,767—an increase of 0.7 percent when compared to second quarter. Prices are 4.1 percent higher than those seen a year ago when the average price was $347,411. Year to date, prices are up by 4.4 percent over the first nine months of 2013.
as is seen in the chart to the right, all but three counties saw average home prices rise when compared to the third quarter of 2013. Price growth continues to taper, but remains generally positive. the strongest annual gains were in Clallam County where prices rose by 18.2 percent. there were also significant gains seen in Kittitas County (+18.1%) and lewis County (+15.9%). on the opposite end of the spectrum, we did see prices decline in the always-volatile San Juan County where they were down by 16.5 percent compared to third quarter of last year. Small losses were also seen in mason and Kitsap Counties.
all is looking good in terms of home prices, but we are still not seeing the growth in listings that are needed. as such, i am maintaining the “B+” grade that i gave the market last quarter.
saLes PriCe singLe-faMiLy & Condo: sePteMber 2013–sePteMber 2014
Countygrowth
rate
netgrowth($000’s) County
growthrate
netgrowth($000’s)
Clallam (Port angeles mSa) 18.2% 36.3 lewis (Centralia mSa) 15.9% 23.3
Cowlitz (longview mSa) 2.9% 5.0 mason (Shelton mSa) -2.9% -5.7
Grays harbor (aberdeen mSa) 1.5% 2.0 Pierce (tacoma mSa) 3.7% 8.7
island (oak harbor) 7.5% 22.0 San Juan (Friday harbor mSa) -16.5% -94.7
Jefferson (Port townsend mSa) 1.7% 4.7 Skagit (anacortes mSa) 2.6% 6.3
King (Seattle/Bellevue mSa) 6.4% 29.3 Snohomish (everett mSa) 7.0% 21.0
Kitsap (Bremerton/Silverdale mSa) -1.3% -4.0 thurston (olympia mSa) 5.7% 13.3
Kittitas (ellensburg mSa) 18.1% 42.3 Whatcom (Bellingham mSa) 3.7% 10.3
Average $’s
-20% -15% -10% -5% -0% 5% 10% 15% 20%
r e g i o n a l r e a l e s tat e

r e g i o n a l r e a l e s tat e
Median hoMe PriCe growth rate
King
Kittitas
Snohomish
island
Cowlitz
Kitsap
Jefferson
Whatcom
Clallam
Pierce
lewis
Skagit
thurston
San Juan
mason
Grays harbor
t h i r d q u a r t e r 2 014 , V o l u m e X X V i i Pag e 6t h e g a r d n e r r e p o r t | w i n d e r m e r e r e a l e s ta t e
singLe-faMiLy hoMe PriCe trends
Countyaverage
Price
home Price escalation
Quarter 1 year* 2 year* 5 year*
Clallam $235,667 10.8% 18.2% 10.1% 1.6%
Cowlitz $175,667 3.3% 2.9% 17.6% 3.5%
Grays harbor $132,667 2.6% 1.5% 1.8% -6.6%
island $317,000 1.6% 7.5% 6.4% 7.6%
Jefferson $284,333 -3.1% 1.7% 16.8% 2.3%
King $489,000 1.3% 6.4% 19.4% 18.5%
Kitsap $296,667 5.8% -1.3% 1.3% 2.7%
Kittitas $276,000 16.9% 18.1% 12.3% 16.9%
lewis $170,333 8.3% 15.9% 16.4% -1.4%
mason $189,333 8.4% -2.9% 0.2% -5.8%
Pierce $244,667 3.4% 3.7% 11.4% -0.7%
San Juan $478,000 3.2% -16.5% -19.5% -4.9%
Skagit $252,667 -0.9% 2.6% 3.8% -1.7%
Snohomish $322,333 2.9% 7.0% 22.3% 8.7%
thurston $246,667 6.3% 5.7% 14.0% -4.9%
Whatcom $293,333 0.6% 3.7% 8.6% 2.1%
* Year over year from most recent month surveyed
-20% -15% -10% -5% 0% 5% 10% 15% 20%
■ one-year ■ two-year ■ Five-year
22.25%

t h i r d q u a r t e r 2 014 , V o l u m e X X V i i Pag e 7t h e g a r d n e r r e p o r t | w i n d e r m e r e r e a l e s ta t e
mr. Gardner is a land use economist and principal with Gardner economics and is considered by many to be one of the foremost real estate analysts in the Pacific Northwest.
in addition to managing his consulting practice, mr. Gardner chairs the Board of trustees at the Washington Center for real estate research at the university of Washington; sits on the urban land institutes technical assistance Panel; is an advisory Board member for the runstad Center for real estate Studies at the university of Washington; and is the editor of the Washington State university’s Central Puget Sound real estate research report.
he is also the retained economist for the master Builders association of King & Snohomish Counties. he has twenty-five years of professional experience in the u.K. and u.S.
he has appeared on CNN, NBC and NPr news services to discuss real estate issues, and is regularly cited in the Wall Street Journal and all local media.
c o n c l u s i o n s a b o u t m at t h e w g a r d n e r
our region’s economy continues to expand but the rate of growth is tapering. this is not surprising, and as long as we can continue to say that our region is growing at a faster rate than the country as a whole, we are in pretty good shape.
interest rates so far in 2014 have not trended as i had anticipated. regular readers of the Gardner report will note that i had been expecting rates to rise—albeit modestly—in the second half of the year, but that has clearly not been the case.
at the start of the year, the average 30-year fixed rate in the u.S. was 4.53 percent. after dropping quite dramatically for a month or so, it started to rise again in February and continued up through the end of march. Since that time, the rate has trended down, and at the end of September was measured at 4.2 percent.
as of the publication date of this report, average mortgage interest rates dropped below four percent to 3.92 percent in the third week of october (excluding fees and points). We are now back at levels not seen since early 2013 and rates are certainly far lower than i or anyone else could have anticipated.
So the question now is, will they rise and, if so, when? i certainly believe that rates cannot stay at these levels forever. Global instability and “frothy” equity markets have led to a flood of money moving into the fixed income markets. as we know, mortgage rates follow the yield on the 10-year treasury, and as long as buyers are prepared to accept low interest rates for their money, mortgage rates will remain low. however, as long as the economy continues to improve, rates will start to trend higher. it’s just a matter of time.
windermere.com
© 2014 Windermere Services Company & Gardner Economics. All rights reserved.