Embed Size (px)
Citation preview

3Real-Ear Measures
LAWRENCE J. REVIT
Brief History of Real-Ear Measures
In 1942, Romanow wrote in his seminalpaper “Methods for Measuring the Perfor-mance of Hearing Aids”:
A hearing aid can be considered as asound transmission system which is in-terposed in the path between the sourceof sound and the listener’s ear. As such,its performance can be judged by com-paring the sound that reaches the ear firstthrough the air path and then throughthe hearing aid.
Romanow’s concept was that if the listenercould observe sounds without and with hear-ing aids, then the fitter could get an idea of theefficacy of the chosen instruments. “Soundthat reaches the ear” is the key phrase. Today,clinicians use probe-tube microphone mea-surements of sounds in the ear canal to obtainquantitative, objective observations of the un-amplified versus the amplified sound that“reaches the ear.” Such comparisons are calledreal-ear insertion gain (REIG) measurements.
It is ironic that the paper that first intro-duced this important paradigm for real-ear
measures (REMs) also introduced the 2-cccoupler used in test boxes for standardizedelectroacoustic measures of hearing aid per-formance. It is the hearing aid industry’s long-standing reliance on the 2-cc coupler, alongwith the lack of availability of clinical real-earmeasurement equipment, that helped steerthe focus of hearing aid fitting away fromREMs until the mid-1980s, more than 40 yearsafter Romanow’s paper was published.
The first probe-tube microphone measure-ments of sound in and near the ear canalwere reported by Filler et al (1945). In awidely read paper discussing those mea-surements, Wiener and Ross (1946) con-cluded, “The human ear is . . . an effective‘amplifier,’” referring to the acoustical prop-erties of the outer ear known as “reso-nances” and “diffraction effects.” The earcanal resonance and the diffraction effects ofthe pinna and the head enhance the soundpressure level (SPL) of certain frequencies atthe eardrum, as compared to the sound-pressure level in the free field (Fig. 3–1). Inaddition to reporting mean data for soundarriving from three directions (azimuths),Wiener and Ross reported considerable vari-ability among the adult male ears they stud-ied, especially at high frequencies [standarddeviation (S.D.) = 5 dB, N = 12].
The combined results of 12 studies of theouter ear “amplifier” appear in a seminalpaper by Shaw (1974). In that paper, Shaw
66
Warning/Disclaimer: The techniques described in thischapter are part of routine clinical practice, and, althoughthey are not dangerous if applied properly, hazards doexist. The reader is advised that the author of this chaptermakes no warranties as to the safety or effectiveness ofthe techniques described in this chapter. Also, the authorof this chapter is not responsible in any way for injuriessustained as a result of anyone using these techniques.
12843.C03.PGS 3/8/02 11:02 AM Page 66

CHAPTER 3 � REAL-EAR MEASURES 67
fully described how the transformation ofSPL from the free field to the eardrum of un-occluded ears varied as a function of the az-imuth of the sound source (Fig. 3–2). Be-cause the primary tube resonance of the earcanal, at about 2700 Hz, does not changewith the azimuth of the sound source, theazimuth-dependent effects seen at higherfrequencies can be attributed largely to dif-fraction and resonance effects of the pinna.In later work, Shaw (1975) showed that thepinna causes the sound entering the earcanal to vary as a function of the elevation ofthe sound source (Fig. 3–3), as well as of theazimuth of the sound source. In brief sum-mary, the SPL at the eardrum of an unoc-cluded ear is amplified by the diffractionand resonant effects of the outer ear, whichvary (1) as a function of frequency, (2) acrossindividual ears, and (3) with the azimuthand elevation of the sound source.
An entirely different system determinesthe SPL at the eardrum of an occluded ear.When sound enters an occluded ear canalthrough an insert earphone or a hearing aid,the SPL at the eardrum is determined notby the ear canal resonance, but by the acous-
tic impedance “seen” by the sound source,“looking into” the ear. Without going into alengthy discussion of acoustic impedance,this impedance is the same one cliniciansmeasure with an occluding probe as part ofan aural acoustic immittance test battery.
Of particular importance to clinicians in-volved in hearing aid fitting is that the im-pedance of a 2-cc coupler differs from that ofthe occluded ear. Addressing the fact thathearing aids occlude the ear, and that stan-dardized hearing aid performance is mea-sured in a 2-cc coupler [American NationalStandards Institute (ANSI), 1996b], Sachsand Burkhard (1972) used real-ear, probe-tube microphone measurements to showhow the SPL output of a hearing aid or an in-sert earphone in a 2-cc coupler differed fromthat at the eardrum in a nonclinical sample ofreal ears (Fig. 3–4). Standard deviations inthis measure of the occluded, real-ear-to-coupler difference (RECD) were similar tostandard deviations reported by Wiener andRoss (1946) for their measurements of unoc-cluded ears (approximately 5 dB), again,with higher variability at high frequencies (N= 11). Much later, Fikret-Pasa and Revit
Figure 3–1. Average real-ear unaided gain (REUG), for the free field, for three azimuthsof the sound source in the horizontal plane: 0 degrees (solid line), 45 degrees (long dashes),and 90 degrees (short dashes). (Reprinted with permission from Wiener FM, Ross DA. Thepressure distribution in the auditory canal in a progressive sound field. J Acoust Soc Am1946;18(2):401–408, Acoustical Society of America.)
12843.C03.PGS 3/8/02 11:02 AM Page 67

68 STRATEGIES FOR SELECTING AND VERIFYING HEARING AID FITTINGS
(1992) measured the RECDs of a clinical pop-ulation of hearing aid candidates. At highfrequencies, standard deviations for RECDsof hearing aid candidates were only slightlyhigher than those reported for normal earsby Sachs and Burkhard (Fig. 3–5). At low fre-quencies, however, standard deviations gen-erally exceeded those of normal ears. Fikret-Pasa and Revit concluded that the higherstandard deviations of the RECDs for their
clinical subjects were related to the fact thatabout half the clinical subjects exhibitedsome middle-ear abnormality, whether bycase history or by immittance measurements.Figure 3–6 illustrates examples of RECDs forears having abnormal (Fig. 3–6a) and normal(Fig. 3–6b) middle ears from that study. The“take-home message” was that individualRECDs should be measured and accountedfor, whenever 2-cc coupler data are relied on
Figure 3–2. Average real-ear unaided gain (REUG) (12 studies) for various azimuths ofthe sound source. (Reprinted with permission from Shaw EAG. Transformation of soundpressure level from the free field to the eardrum in the horizontal plane. J Acoust Soc Am1974;56(6):1848–1861, Acoustical Society of America.)
12843.C03.PGS 3/8/02 11:02 AM Page 68
CHAPTER 3 � REAL-EAR MEASURES 69
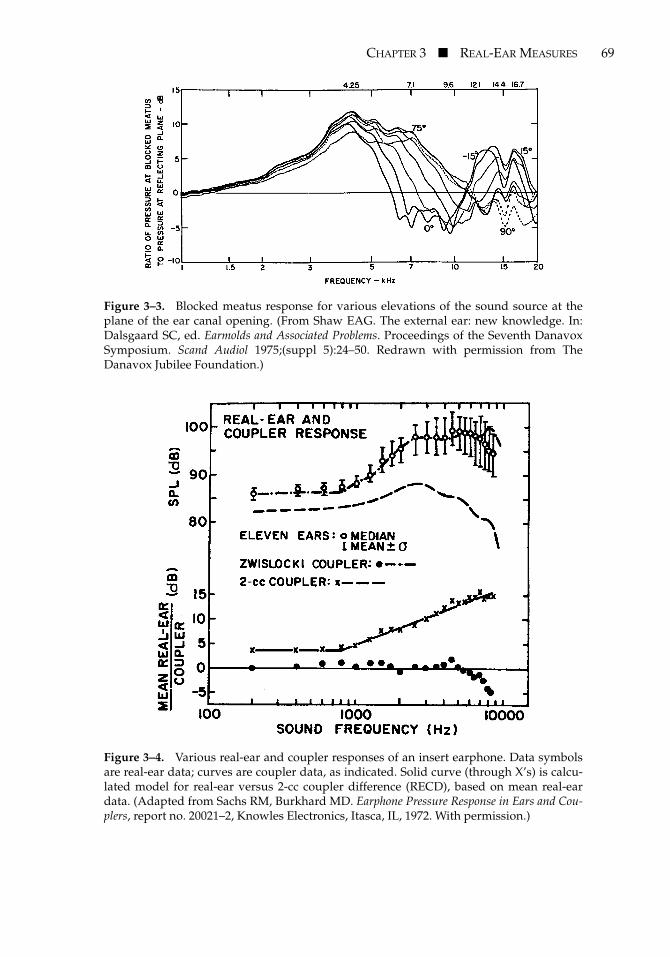
Figure 3–3. Blocked meatus response for various elevations of the sound source at theplane of the ear canal opening. (From Shaw EAG. The external ear: new knowledge. In:Dalsgaard SC, ed. Earmolds and Associated Problems. Proceedings of the Seventh DanavoxSymposium. Scand Audiol 1975;(suppl 5):24–50. Redrawn with permission from TheDanavox Jubilee Foundation.)
Figure 3–4. Various real-ear and coupler responses of an insert earphone. Data symbolsare real-ear data; curves are coupler data, as indicated. Solid curve (through X’s) is calcu-lated model for real-ear versus 2-cc coupler difference (RECD), based on mean real-eardata. (Adapted from Sachs RM, Burkhard MD. Earphone Pressure Response in Ears and Cou-plers, report no. 20021–2, Knowles Electronics, Itasca, IL, 1972. With permission.)
12843.C03.PGS 3/8/02 11:02 AM Page 69

70 STRATEGIES FOR SELECTING AND VERIFYING HEARING AID FITTINGS
in fittings involving ears having any substan-tial difference from the adult average inmiddle-ear function.
A very special case for both unoccludedand occluded ear acoustics involves youngchildren. Because they have very small earcanals, the primary resonance of the open earcanal is about 7000 Hz in newborns, progress-ing downward to nearly the adult resonantfrequency (just under 3000 Hz) by age 3(Kruger, 1987). But more importantly regard-ing hearing aid considerations, the occludedRECD in young children far exceeds the am-plitudes for the average adult (e.g., NelsonBarlow et al, 1988). And so it is urgent that thefitter account for the individual RECD inyoung children. Table 3–1 lists age-dependentreal-ear unaided gain (REUG) values, andTable 3–2 lists age-dependent RECD values.
In keeping with the early knowledge of un-occluded and occluded outer-ear acoustics,Killion and Monser (1980) recognized that theeffective frequency responses of hearing aidschange markedly, yet systematically, whenthey are inserted into ears. Consequently, incoining the term coupler response for flat inser-tion gain (CORFIG), Killion and Monser cau-tioned audiologists to be aware of the differ-ences between the coupler responses and theREIG responses of hearing aids. Specifically,they described what the HA-2, 2-cc coupler
response of behind-the-ear (BTE) hearingaids should look like to give a flat, unity-gain1
insertion response for a sound source at 0-degree azimuth and 0-degree elevation, inthe average adult ear. Killion et al (1987) ex-panded the CORFIG data to include in-the-ear (ITE), in-the-canal (ITC), and completely-in-the-canal (CIC) hearing aids2 in a diffusesound field (“diffuse” means from all direc-tions). Killion and Revit (1993) added COR-FIGs for a 45-degree azimuth of sound inci-dence (see also Bentler and Pavlovic, 1989,and later in this chapter.)
In discussing average-ear corrections be-tween real-ear and coupler response, Killionand colleagues (1987) acknowledged that in-dividual ears can vary substantially in theiracoustical properties, and therefore the fittercan make substantial errors in predictingthe real-ear responses of hearing aids by rely-ing solely on average-ear correction figures.Addressing this problem, Harford (1980)pioneered using real-ear probe-microphonemeasurements in a clinical setting. He and hisstaff measured the REIG of hearing aids onapproximately 500 adult ears using a minia-
Figure 3–5. Standard deviations of real-ear to coupler difference (RECD) for 18 ears (rec-tangles) from Fikret-Pasa and Revit (1992). Crosses are data excluding an ear with a perfo-rated tympanic membrane. Diamonds are data from Sachs and Burkhard (1972). (FromFikret-Pasa S, Revit LJ. Individualized correction factors in the preselection of hearingaids. J Speech Hear Res 1992;35(2):384–400. © American Speech-Language-Hearing Associa-tion. Reprinted by permission.)
1 “Unity gain” means no amplification and no attenu-ation.
2Killion et al (1987) used the term “ITC (deep)” forwhat is now called “CIC.”
12843.C03.PGS 3/8/02 11:02 AM Page 70

CHAPTER 3 � REAL-EAR MEASURES 71
ture microphone (not a probe-tube micro-phone, but a very small microphone housedin a metal case) placed directly in the earcanal between the earmold and the eardrum.They reported that valid measurements couldbe obtained in all but 10 ears, for which theear canal was too small to accommodate both
the earmold and the microphone. No men-tion was made of the distribution of male andfemale subjects in that work.
Along with Harford’s early work withminiature microphones, the 1980s broughtthe widespread availability and use ofpersonal computers, and of soft, slender,
Figure 3–6. Examples of individual real-ear to coupler difference (RECD) from subjectswith abnormal (A) and normal (B) middle ears. Thick curve is the KEMAR RECD. (FromFikret-Pasa S, Revit LJ. Individualized correction factors in the preselection of hearingaids. J Speech Hear Res 1992;35(2):384–400. © American Speech-Language-Hearing Associa-tion. Reprinted by permission.)
12843.C03.PGS 3/8/02 11:02 AM Page 71

72 STRATEGIES FOR SELECTING AND VERIFYING HEARING AID FITTINGS
silicone-rubber tubing that, when affixed tothe sound opening of a microphone, could beplaced in virtually any ear canal relativelysafely and unobtrusively. Steen Rasmussen(Nielsen and Rasmussen, 1984) employedthese technical advances toward creating thefirst commercially available, clinical probe-tube microphone, real-ear measurement sys-tem, the Rastronics CCI-10. Since that time,significant advances in equipment from var-ious manufacturers have included thinner,more flexible probe tubes; very fast, broad-band, real-time digital analysis; and experi-mental test sequences and displays. Creep-ing over the horizon are new ways of testingthe time-varying features of nonlinear hear-ing aids, how they may provide differingperformance in quiet and in noise, and waysof testing that better generalize to the realworld as compared with the steady-statetests in common use today.
Another important advance in REMs hasbeen the completion of an ANSI standard forREMs (ANSI, 1997), entitled American Na-tional Standard Methods of Measurement ofReal-Ear Performance Characteristics of Hearing
Aids. Whenever the term standard is used byitself in this chapter, it refers by default tothis standard. It is recommended that everystudent and practitioner of real-ear measure-ments obtain a copy of the ANSI real-earstandard and endeavor to grasp all of itscontents. Throughout this chapter, numbersin italicized braces (e.g., {3.4.11/10} ) refer thereader to section numbers in the standard.The standard contains definitions of termsand specifications of test conditions and pro-cedures to be used in obtaining REMs. Thestandard also gives rules and tolerances fortest equipment and test conditions. Thischapter describes the standardized termsand procedures, as well as other usefulmethods and properties of REMs. For themost part, where the chapter defines stan-dardized terms, the standard itself containsdefinitions that are more precise.
The Real-Ear Measures and TheirApplications: The “REs” and More
This section defines and describes the REMsin common use. Almost all of these measures
Table 3–2. Average, Age-Dependent Values for RECD
Frequency (Hz) 250 500 750 1000 1500 2000 3000 4000 6000
< 1 year 7.1 9.4 10.3 11.8 13.2 13.5 17.7 20.7 23.21–2 years 9 9.8 10.2 11.4 12.4 13.2 15.3 17.6 16.3
Age: 2–4 years 5.7 7.4 9 10.6 11.9 12.2 14.7 15.3 16.24–5 years 4.5 7.6 8.8 8.6 10.7 11.7 13.2 14.1 15.6> 5 years 3.9 4.2 4.6 5.1 6.4 7.8 10.4 12.2 14.5
Data courtesy Etymonic Design Inc., Dorchester, Ontario, Canada.
Table 3–1. Average, Age-Dependent Values for the REUG (Free Field Reference, 0-DegreeAzimuth and Elevation)
Frequency (Hz) 250 500 750 1000 1500 2000 3000 4000 6000
< 2 months �1 1.4 �1 0 3 4 0 �1 9.52–6 months �1 1 1.9 2 5 5 4.9 5.8 14
Age: 6 months–1 year 0 1 2 2.5 2 1 8 11.8 5.81–2 years �2 �2 �2 �1.9 2 9 16.8 15 122–3 years 0.5 2 2.8 4.5 5 9 16 9 �8> 3 years 1 1.8 2.9 2.6 5.3 12 15.3 14.3 7.3
Data courtesy Etymonic Design Inc., Dorchester, Ontario, Canada.
12843.C03.PGS 3/8/02 11:02 AM Page 72

CHAPTER 3 � REAL-EAR MEASURES 73
are identified by acronyms that begin with theletters “RE,” for “real ear.” Most of these aredefined in the ANSI standard S3.46 (ANSI,1997), but other measures, not defined in thestandard, are also discussed in this chapter.
The reader will see that many of the REMscan be displayed in terms of either “re-sponse” or “gain.” Response, in this context,is taken to mean a measure of absolute SPL,whereas “gain” is taken to mean an outputresponse that is expressed relative to a speci-fied input or reference response. For manyreal-ear applications, the advantage of ob-serving “gain” is that neither the signal levelnor the signal spectrum is apparent in thedisplayed results (they are subtracted out),so the observer sees only the effect that thedevice under test has had on the test signal.For example, the top panel of Figure 3–7shows the spectrum of a speech-weightedcomposite signal, as measured by a probemicrophone in front of the loudspeaker of aREM system. Note that the speech weight-ing causes the high frequencies to be increas-ingly lower in amplitude.3 The middle andlower panels are examples of unaided REMsmade with this signal, yet with the probe mi-crophone picking up the sound deep in theleft ear canal of the author. The center panelis an REUG curve made in this manner. TheREUG curve shows the amplitude-versus-frequency effects of the unoccluded outerear, independently of the signal spectrum.The lower panel is a real-ear unaided re-sponse (REUR) curve, showing dB SPL ver-sus frequency. The higher frequencies roll offcompared to the REUG, because of the su-perimposed shape of the signal spectrumshown in the upper panel. As a rule, thechoice of viewing gain or SPL depends onthe purpose at hand. When prescriptive tar-gets are given in terms of gain, then it makessense to view REMs in terms of gain. Whenprescriptive targets are given in terms of earcanal SPL for a given input signal, then itmakes sense to view REMs in terms of SPL.
REUR/G {3.4.11/10}
The real-ear unaided response (REUR) is ameasure of what the open ear does to sound,all by itself, that is, with no hearing aid. It isthe SPL at or near the eardrum, for a speci-fied sound field outside the ear. When themeasure is displayed as the difference be-tween the SPL inside versus outside the earcanal, it is called the real-ear unaided gain.As described earlier, Figures 3–1 and 3–2 de-
3The overall [root mean square (RMS)] amplitude ofthis signal was 70 dB SPL.
Figure 3–7. Probe-tube microphone responses.Upper curve is spectrum of speech-weightedcomposite test signal [70-dB SPL root meansquare (RMS)]; middle curve is real-ear unaidedgain (REUG); lower curve is real-ear unaided re-sponse (REUR) using signal in upper curve. TheREUR rolls off in the high frequencies, as com-pared with the REUG, because the REUR is thesuperposition of the REUG and the sloping,speech-weighted signal.
12843.C03.PGS 3/8/02 11:02 AM Page 73

74 STRATEGIES FOR SELECTING AND VERIFYING HEARING AID FITTINGS
pict average REUGs for various locations ofthe sound source. Because unaided ears nor-mally benefit by the boost in high-frequencySPL shown in these graphs, the REUR/Gmay serve as a minimum REM on which am-plification must build, to obtain an effective“insertion gain” (see later) when hearingaids are inserted into ears.
Another use of the REUG arises from thefact that it describes the acoustic transforma-tion from the sound field to the eardrum.When unaided hearing thresholds are ex-pressed in terms of sound-field SPLs, theREUG can be used in converting thosethresholds to eardrum SPLs.
A special consideration regarding theREUR/G involves ears having middle-earpathology, or ears that have been surgicallytreated. Such ears may present an REUR/Ghaving an unusual shape. See de Jonge(1996) for a comprehensive discussion, withexamples.
REAR/G {3.4.6/5}
The real-ear aided response (REAR) is the re-sponse of a hearing aid as measured at ornear the eardrum, for a specified sound fieldoutside the ear. When the measure is referredto the sound field outside the ear, it is calledthe “real-ear aided gain” (REAG). Some pre-scription strategies (see Chapter 1) are basedon one or more target REAR/Gs for a speci-fied input signal or set of input signals.
One thing to watch out for in makingREAR/G measurements is that the presenceof the probe tube in the ear canal alongsidethe earmold or shell can add a “slit leak” tothe acoustic picture of a real-ear measure-ment involving an earmold or shell. A slitleak can add not only unintentional venting,but also acoustic “damping” that is not pres-ent without the probe tube. Acoustic damp-ing can reduce the sharpness and amplitudeof a Helmoltz resonance caused by an ear-mold vent, and therefore, the actual REAR/Gmay be greater than what is observed inthe probe-tube microphone measure (seeChapter 6 in the companion book HearingAids: Standards, Options, and Limitations (2nd
edition). New York: Thieme Medical Pub-lishers).
REIG {3.4.7}
The real-ear insertion gain (REIG) is the dif-ference between the REAG and the REUG (orthe REAR and the REUR, if both are mea-sured using the same signal amplitude). Bysubtracting the REUG from the REAG, oneobserves a measure of the “net” acoustic ben-efit, in terms of an increase in the SPL at ornear the eardrum, obtained through the actof inserting a hearing aid. It may seem intu-itive to the reader that such a measure of netbenefit might be the centerpiece of strategiesfor prescribing the gain and frequency re-sponse of hearing aids, and indeed it is (seeChapters 6 to 10 for a thorough discussion ofhearing aid fitting strategies). The readershould note that the REIG was formerlycalled the real-ear insertion response (REIR).But because the measure is always expressedin terms of gain, the S3.46 standard (ANSI,1997) has changed the term to reflect this fact.Figure 3–8 shows an example of an REIGcurve (upper panel), along with the REUG/REAG measurement pair (lower panel) thatdetermined the REIG. This set of curves wasmeasured on a Knowles Electronic Manikinfor Acoustic Research (KEMAR), with an ITEhaving a large vent. The target curve (boldcurve, upper panel) is shown for comparisonpurposes.
Conventional practice (as described in thesection on REIG) advocates subtracting theREUR/G from the REAG in verifying that afitting matches a target REIG, and using theREUR/G in formulating a customized 2-cccoupler prescription (e.g., Mueller, 1989).This author advocates not using the patient’sREUR/G in the above applications, and in-stead using average-ear unaided response/gain curves.4 The rationale for this conclu-sion can be found in the appendix of thischapter, and also in an “open letter” by Revit(1991a).
4The equivalent would be to express the target as anREAG, by subtracting the average-ear REUG from theREIG target.
12843.C03.PGS 3/8/02 11:02 AM Page 74

CHAPTER 3 � REAL-EAR MEASURES 75
REOR/G {3.4.9/8}
The real-ear occluded response (REOR) is ameasure of the SPL at or near the eardrum,for a specified sound field, with a hearing aidin place and turned off. When the measure isreferred to the sound field outside the ear, itis called the real-ear occluded gain (REOG).Mueller (1998) has called the REOR/G the“most misunderstood probe-mic measure.”Several authors (e.g., Sullivan, 1985; Mueller,1992) have studied the REOR and its relationto the REUR, the REAR, and the REIG. Butwhy would the clinician need to know thereal-ear performance of a hearing aid that isturned off? One possible use might be as aquick check that the real-ear measurementsystem is functioning properly while theprobe tube and hearing aid are already in apatient’s ear. If the earpiece of the aid isvented or fits loosely, then the REOG should
have a low-frequency plateau at 0 dB gain,followed by high-frequency attenuation. Ifnot, something must be wrong with the real-ear measurement system (H. Dillon, personalcommunication). An example of such anREOG curve is shown in Figure 3–9.
Another possible use of the REOG mightbe for information purposes, such as in trou-bleshooting an earmold problem, to be ableto observe the part of the sound that getsinto the ear canal acoustically, either throughthe vent or around the earmold or shell. Forexample, if the REAG has an unwanted reso-nant peak or dip near 500 Hz (typical withmany vented fittings, and exemplified bythe dip at 630 Hz in the REAG curve of Fig.3–8), viewing the REOR can reveal the iso-lated contribution of the vent resonance tothat response anomaly. The clinician canthen make adjustments to the earmold, asdesired.
Figure 3–8. Real-ear measure (REM) display for real-ear insertion gain (REIG). Lowergraph shows the real-ear unaided gain (REUG) (thick curve) and the real-ear aided gain(REAG) (thin curve). Upper graph shows the REIG (thin curve), which is the REAG minusthe REUG. Thick curve in upper graph is a target curve, shown for comparison purposes.
12843.C03.PGS 3/8/02 11:02 AM Page 75

76 STRATEGIES FOR SELECTING AND VERIFYING HEARING AID FITTINGS
Interesting to note, in this regard, is thata vent-related resonant peak seen in theREOR/G can cause a dip in the REAR/G, ifthe phase of the output signal from the hear-ing aid is opposite that of the acoustic signalentering the ear through the vent. The oppo-site-phase signals, if they are of similar ampli-tude, cause a pressure null when combined.Such is often the case with class A hearing aidcircuits as well as with many other designs.As a counterexample, the high-fidelity K-AMP circuit does not completely reverse thephase of the output signal, and so it may bemore likely that an unwanted Helmholtz res-onant peak in the REOR/G will be madeeven steeper in the REAR/G in this case.
RESR
The real-ear saturation response (RESR) isan REM akin to the test-box measure known
as the output SPL for a 90-dB input SPL(OSPL90) (formerly SSPL90). The RESR is ameasure of the real-ear output of a hearingaid that is driven by very loud inputs. Thus,it is an estimate of the maximum output ofthe hearing aid, in terms of the SPL at ornear the eardrum. An example of an RESRcurve is shown in Figure 3–10.
The term RESR is not defined in ANSIS3.46 (ANSI, 1997). One possible reason isthat the measure is prone to complexitiesthat make it difficult to standardize. Theprincipal complexity is that the term RESRitself may be misleading. Many hearing aidsdo not reach saturation even for the highestsignal amplitudes available with REM sys-tems (usually 90-dB SPL, but even less insome cases). Also, the plotted SPLs for anRESR measurement depend heavily on thebandwidth of the test signal. For an overallestimate of maximum real-ear output, using
Figure 3–9. Typical real-ear oc-cluded gain (REOG) curve. Theplateau at 0 dB in the low fre-quencies indicates nominal trans-mission of sound through a pin-hole vent or a slit leak. Negativevalues at higher frequencies in-dicate attenuation of sounds orig-inating outside the ear canal.
Figure 3–10. Typical real-earsaturation response (RESR)curve. The SPL in the ear canal atlow frequencies cannot be lowerthan the signal level (90-dB SPL)because of sound transmissionthrough the earmold vent or slitleak.
12843.C03.PGS 3/8/02 11:02 AM Page 76

CHAPTER 3 � REAL-EAR MEASURES 77
the “root mean square (RMS) output” read-ing with a broadband signal can work verywell, assuming a non-peaky spectral shapein the output. But for a frequency-by-fre-quency plot of the maximum real-ear out-put, using narrowband test signals alwaysgives the highest estimate.
To illustrate the importance of using nar-rowband signals for the RESR, Figure 3–11shows two examples of the 2-cc coupler out-put of a BTE hearing aid using a test signal at90-dB SPL. The dashed curve was obtainedwith a broadband (composite) signal, andthe curve with filled boxes was obtainedwith a narrowband (pure-tone) signal. Thepointy curve is the 2-cc coupler output of thehearing aid in response to the signal of anearby fax machine. Also shown is the RMS(overall) output SPL corresponding to thecurve obtained with the broadband signal.The curve obtained with the narrowbandsignal correctly estimated the possible out-put of about 110-dB SPL at 800 Hz, whichwas achieved with the signal from the faxmachine. The curve obtained with the broad-band signal underestimated the possible out-
put for the fax signal, although the RMS out-put measured using the broadband signal(110-dB SPL) provided a good estimate.
RECD
The real-ear-to-coupler difference (RECD) isanother REM that is not described in theS3.46 standard (ANSI, 1997). The reasons forthe omission are likely that the RECD differsfrom the other REMs in form, and that theimportance of the RECD has only recentlybecome widely known. The RECD, however,may be the most useful of all the commonreal-ear measures (Revit, 1993b; Mueller,1998). Therefore, a lot of space in this chap-ter will be given to describing this measureand its applications.
The RECD is the difference between thereal-ear response and the 2-cc coupler re-sponse of a hearing instrument (i.e., real-earresponse minus 2-cc response), using thesame stimulus for both component mea-sures. The hearing instrument used in ob-taining the RECD can be a hearing aid or aninsert earphone. The RECD is not intended
Figure 3–11. 2-cc coupler responses of a behind-the-ear (BTE) hearing aid. Pointy, solidcurve is the spectrum of a signal from a nearby fax machine, recorded through the hearingaid. Upper curve (filled rectangles) was obtained using a 90-dB SPL pure-tone signal. Thepure-tone curve correctly indicated the potential hearing aid output at the frequency ofthe fax signal. The curve plotted using a broadband signal (dashed curve) underestimated thepotential hearing aid output at the frequency of the fax signal, although the RMS output (in-dicated below the graph) provided a reasonable estimate of the potential hearing aid output.
12843.C03.PGS 3/8/02 11:02 AM Page 77

78 STRATEGIES FOR SELECTING AND VERIFYING HEARING AID FITTINGS
to reveal anything about the performance ofthe instrument used in making the test. It is,however, intended to reveal the differencebetween the way a hearing instrument willperform in an individual’s ear, as comparedto the way it will perform in a 2-cc coupler.This measure of difference in SPL directly re-flects the difference in impedance betweenthe individual ear and the 2-cc coupler. Thisdifference is likely to behave in much thesame way for a broad range of hearing in-struments, and so it can be used to predictthe real-ear aided response of a range of in-struments simply by measuring the 2-cc cou-pler responses (and vice versa) (Moodie etal, 1994; Revit, 1997). The RECD can also beused in converting hearing-assessment mea-sures, in dB HL, to SPL in the ear canal.These applications of the RECD are furtherdiscussed in the section Circle of Decibels.
Also, since the RECD reflects the imped-ance looking into the ear, certain characteris-tics of the RECD can be indicative of middle-ear pathologies. For example, an ear that hasa perforated eardrum will present an RECDhaving a deep roll-off (10 to 20 dB or greater)in the low frequencies (see Fig. 3–6, upperpanel, + symbols). An ear having a stiffenedeardrum caused, for example, by elevatednegative middle-ear pressure will present anRECD having an elevated (by up to about 10dB) low- to midfrequency region (see Figure3–6, upper panel, X symbols). See de Jonge(1996) for a comprehensive discussion andexamples of the RECD in pathologic ears.
REDD
The real-ear-to-dial difference (REDD) issomewhat unique among REMs in that itsprimary purpose does not involve hearingaids. Clinicians use the REDD primarilyduring audiometry to convert dB HL valuesto eardrum SPLs, or vice versa. Obtainingthis measure requires that the REM systemand the audiometer be located in the sameplace. One obtains the REDD by measuringthe SPL at or near the eardrum for a set ofaudiometric tones at a particular setting of
the audiometer attenuator dial. One subtractsthe dB value of the audiometer attenuatorsetting from the measured ear canal SPL toarrive at the REDD. More information aboutapplications of the REDD appears in the sec-tion Circle of Decibels.
Measuring the Occlusion Effect
“My voice sounds like it’s in a barrel.” Suchis a common complaint of the first-timehearing aid wearer. A hearing aid wearer’sown voice can sound hollow because low-frequency vocal energy (predominantly inthe range of 200 to 500 Hz) enters the earcanals via vibration of the cartilaginous por-tions of the ear canal walls. With unoccludedears, this vocal sound energy normally exitsthe ear canals through the ear canal open-ings. But when hearing aids occlude the ears,such low-frequency vocal energy cannot es-cape. Thus, the spectrum of the hearing aidwearer’s own voice in the ear canals becomesexcessively bassy, giving one’s own voice ahollow or “barrel-like” sound.
Embodied in the above explanation aretwo clues to ways of alleviating the occlu-sion effect: (1) The fact that the offendingsound energy enters the ear canals throughthe cartilaginous portions of the ear canalssuggests that earmolds or shells having longbores that extend to the bony portions of theear canals could effectively block the vibra-tions of the cartilaginous portions of the earcanals. (2) The fact that the offending soundenergy normally exits through the ear canalopenings suggests that increasing vent sizescould let the offending low-frequency en-ergy escape the ear canals more easily. Afterclinical intervention, aside from simply ask-ing the patient whether the problem hasbeen alleviated, the clinician can use real-earmeasurements to document the extent of theocclusion effect objectively, both before andafter intervention.
Two REM methods are available to mea-sure the occlusion effect. One method re-quires special cooperation by the patient; theother frees the patient from active participa-
12843.C03.PGS 3/8/02 11:02 AM Page 78

CHAPTER 3 � REAL-EAR MEASURES 79
tion. Both methods require using eitherthe “spectrum-analysis” or the “sound-levelmeter” mode of operation of the REM sys-tem. Both of these modes of operation departfrom normal REM-system operation in thatthe signal source (loudspeaker) is turned off.Instead, either the patient’s own voice or anaudiometric bone vibrator provides the testsignal.
When the patient’s own voice providesthe test signal, the patient sustains a vocal“ee” sound while the REM system recordsthe sound level (or spectrum) inside the earcanal. To assist the patient in maintaining aconstant vocal level, a separate sound-levelmeter monitors the sound level outside theear canal, usually from in front of the pa-tient’s mouth. The patient strives to main-tain a consistent reading on the externalsound-level meter under all conditions.
To document the extent of the occlusioneffect, measurements can be made with andwithout the hearing aid in place. The occlu-sion effect can thus be defined as the differ-ence between the recorded vocal sound levelin the ear canal under occluded verses un-occluded conditions, for a constant vocalsound level outside the ear canal. Alter-nately, the vocal sound level in the ear canalcan be recorded before and after a change in
the earmold or venting, to document thechange in the occlusion effect under the twoconditions. Figure 3–12 shows real-ear spec-trum analyses for one subject who sustainedan “ee” sound with the test ear unoccludedand with four aided conditions. As can beseen, the highest SPLs in the ear canal wereat 300 Hz and below for all conditions. Thethree venting conditions shown, sealed, 0.6mm, and 2.0 mm, indicate that as vent sizeincreased, the difference between the unoc-cluded and the aided SPL for the patient’svoice (the occlusion effect) decreased from amaximum of 22 dB to 13 dB. These threeventing conditions were for a moderate in-sertion depth. When a deeply sealed foameartip was used instead of a conventionalearmold, the occlusion effect decreased toonly about 5 dB (Revit, 1992).
As mentioned above, the curves in Figure3–12 were generated by the patient’s ownvoice. When participation by the patient isnot desirable or possible, an audiometricbone vibrator, set to 70 dB HL at either 250 or500 Hz and placed on the mastoid, can pro-vide a suitable substitute for the patient’sown voice. The clinician should keep inmind, however, that if the occlusion effect ina given case lies predominantly at a fre-quency other than the one used, then the
Figure 3–12. Occlusion effect. Real-ear spectrum analyses of sound in ear canal undervaried conditions of occlusion. Test signal is subject sustaining an “ee” sound. Increasingvent sizes diminished the occlusion effect. The least occlusion effect was for a foam tipsealed deeply in the bony portion of the ear canal (dashed curve).
12843.C03.PGS 3/8/02 11:02 AM Page 79
80 STRATEGIES FOR SELECTING AND VERIFYING HEARING AID FITTINGS
measurement could fail to show an effect.One way of avoiding this problem in mostcases would be to obtain measurementsusing both 250 and 500 Hz.
Instrumentation Used in Real-EarMeasures
What Is a Real-Ear Measurement (REM)System?
An REM system is a form of a sound-levelmeter (SLM) having its own signal-deliverysystem. In general, an SLM consists of a mi-crophone and a voltmeter. The microphoneresponds to sound pressures by generatinganalogous electrical voltages at its output.The voltmeter measures and displays thevoltages generated by the microphone. Todisplay voltage readings in terms of dB SPL,the scale of the voltmeter of an SLM is cali-brated in decibels for 20 micropascals (µPa)of sound pressure. That is, the meter willshow a reading of 0-dB SPL when the micro-phone senses a sound pressure of 20 µPa. Toillustrate, for a sound pressure of 63 µPa,which is 10 dB greater than 20 µPa, the meterwill show a reading of +10-dB SPL, and soforth.
Aside from the basic function of using aprobe-tube microphone as the microphonepart of an SLM, many REM systems havecommon operating features that are dedi-cated to real-ear measures. Yet each systemalso has its own unique features. For a briefoverview of many of the REM systems avail-able at this writing, see Mueller (1998).
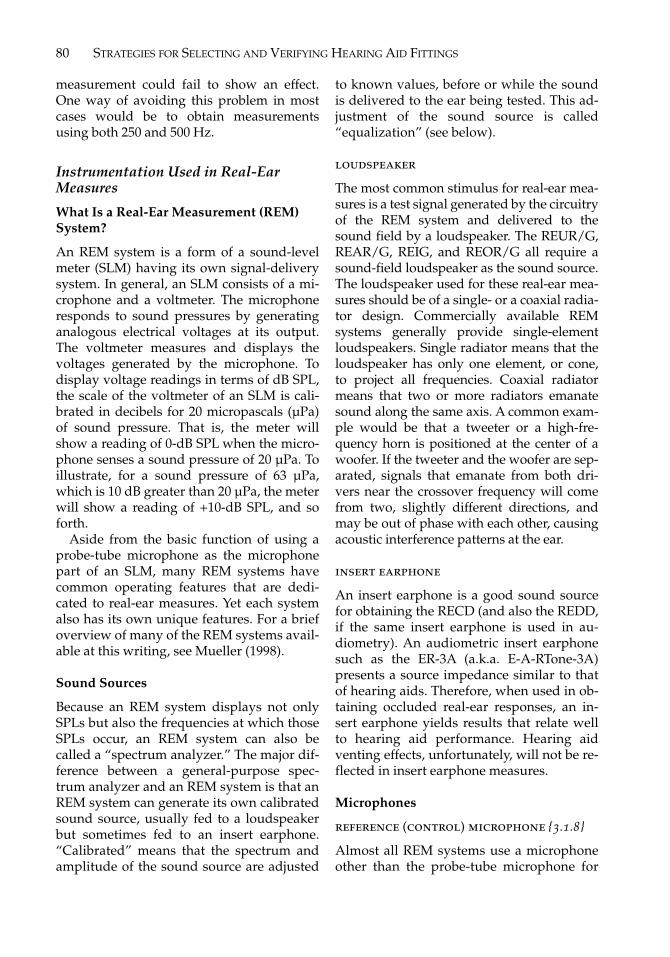
Sound Sources
Because an REM system displays not onlySPLs but also the frequencies at which thoseSPLs occur, an REM system can also becalled a “spectrum analyzer.” The major dif-ference between a general-purpose spec-trum analyzer and an REM system is that anREM system can generate its own calibratedsound source, usually fed to a loudspeakerbut sometimes fed to an insert earphone.“Calibrated” means that the spectrum andamplitude of the sound source are adjusted
to known values, before or while the soundis delivered to the ear being tested. This ad-justment of the sound source is called“equalization” (see below).
loudspeaker
The most common stimulus for real-ear mea-sures is a test signal generated by the circuitryof the REM system and delivered to thesound field by a loudspeaker. The REUR/G,REAR/G, REIG, and REOR/G all require asound-field loudspeaker as the sound source.The loudspeaker used for these real-ear mea-sures should be of a single- or a coaxial radia-tor design. Commercially available REMsystems generally provide single-elementloudspeakers. Single radiator means that theloudspeaker has only one element, or cone,to project all frequencies. Coaxial radiatormeans that two or more radiators emanatesound along the same axis. A common exam-ple would be that a tweeter or a high-fre-quency horn is positioned at the center of awoofer. If the tweeter and the woofer are sep-arated, signals that emanate from both dri-vers near the crossover frequency will comefrom two, slightly different directions, andmay be out of phase with each other, causingacoustic interference patterns at the ear.
insert earphone
An insert earphone is a good sound sourcefor obtaining the RECD (and also the REDD,if the same insert earphone is used in au-diometry). An audiometric insert earphonesuch as the ER-3A (a.k.a. E-A-RTone-3A)presents a source impedance similar to thatof hearing aids. Therefore, when used in ob-taining occluded real-ear responses, an in-sert earphone yields results that relate wellto hearing aid performance. Hearing aidventing effects, unfortunately, will not be re-flected in insert earphone measures.
Microphones
reference (control) microphone {3.1.8}
Almost all REM systems use a microphoneother than the probe-tube microphone for
12843.C03.PGS 3/8/02 11:02 AM Page 80

CHAPTER 3 � REAL-EAR MEASURES 81
equalizing and calibrating the sound field.This microphone is called the “reference” or“control” microphone. During the equaliza-tion process (also called “leveling”), the ref-erence microphone records the spectrumand amplitude of the sound field producedby the loudspeaker. The REM system usesthese recordings to adjust the signal sourceto achieve specified values. The referencemicrophone is usually placed either justover the pinna (Fig. 3–13), just under theearlobe, or next to the ear. The position ofthe sound inlet of the reference microphoneduring equalization is called the “field ref-erence point” {3.1.6} . In measurements ofreal-ear gain, other than insertion gain, theSPL measured by the reference microphoneat the field reference point is subtracted
from the ear canal SPL to determine thegain.
probe-tube microphone {3.4.4}
The main measuring microphone of an REMsystem consists of a slender, flexible tube(often made of silicone rubber) that can beplaced unobtrusively in the ear canal, withits sound inlet near the eardrum. The probetube connects to a small microphone hous-ing placed outside the ear (for example, asin Fig. 3–13). The frequency response of aprobe tube is not flat; it rolls off at high fre-quencies, typically more than 20 dB at 8000Hz. Therefore, the probe-tube microphoneitself requires corrective equalization. Cor-rective equalization of the probe-tube micro-
Figure 3–13. Typical arrangementof probe and reference microphonesfor real-ear measures. Field refer-ence point is the center of the soundopening of the reference micro-phone. (Courtesy of Frye Electron-ics, Inc.)
12843.C03.PGS 3/8/02 11:02 AM Page 81

82 STRATEGIES FOR SELECTING AND VERIFYING HEARING AID FITTINGS
phone may be accomplished either acousti-cally or electronically, or in combination, de-pending on the specific design of the micro-phone.
internal noise {4.3.3}
It is important to recognize that, because aprobe tube requires more than 20 dB of high-frequency boost to obtain a flat frequency re-sponse, this boost also raises the internalnoise of a probe-tube microphone at highfrequencies. Because of this boost in high-frequency internal noise, the internal noiselevel of a probe-tube microphone can be-come a limiting factor in how soft a soundcan be measured accurately. ANSI S3.46(1997) states that the internal noise of theprobe microphone must be lower than thelowest SPL to be measured, at a given fre-quency, by at least 10 dB. For example, if onewishes to measure an SPL of 60 dB at 2000Hz, the equivalent internal noise of theprobe microphone (the SPL reading given bythe microphone with no signal present)must be no greater than 50-dB SPL at 2000Hz. This rule of thumb ensures that internalnoise does not affect measurements by morethan 1 dB.
crosstalk {3.4.1}
In addition to internal noise, crosstalk is an-other potential technical issue the REM op-erator needs to be aware of. Crosstalk is theunwanted leakage of a signal from onesignal path to another, thus potentially cont-aminating a measurement. In real-ear mea-surements, crosstalk can occur between thesound source and the probe microphone{4.3.4}, and between the signal paths of thetwo microphones {4.3.5}. If the sound sourceis loud enough, and if the isolation of thehousing of the probe-microphone body is in-sufficient, some sound can bypass the soundinlet of the probe microphone, entering themeasuring path directly through the micro-phone body or through the wall of the probetube.
With regard to leakage through the probemicrophone, ANSI S3.46 (1997) calls for anobservation of the reading given by the mi-
crophone with the sound inlet blocked, ascompared to the reading given with thesound inlet open. In each case, the entire mi-crophone is to be placed in the sound field ofinterest. The blocked reading must be at least10 dB below that of the open reading at eachfrequency of interest, again ensuring an ef-fect of leakage of less than 1 dB. For crosstalkbetween the main and reference signal paths,ANSI S3.46 states that the manufacturer ofthe REM system must report the maximumdifference between the signals in the mainand reference signal paths, as a function offrequency, for which crosstalk will not affectmeasurements by 1 dB. This maximum dif-ference usually refers to the maximumacoustic gain of hearing aids that can be mea-sured accurately, although it could also referto the maximum attenuation of an earplugthat can be measured accurately.
Test Signals {4.2.2, Annex A}
Available signals vary considerably acrossmodels and manufacturers of REM equip-ment. Most REM systems have a choice ofseveral test signals. The tester needs to beaware of how a given choice of signal will af-fect a measurement. For true linear hearingaids, the problem is of little importance: lin-ear hearing aids respond the same way toevery test signal. Hearing aids having anysort of adaptive signal processing, however,respond differently to differing signals. Someof the basic variables in test signals are band-width, spectrum, crest factor, and so-calledtemporal properties. With but a few excep-tions, most available test signals in REM sys-tems are what is known as stationary signals.That is, they don’t vary over time; they are offixed bandwidth, spectrum, crest factor, andtemporal properties (all described below).Natural signals, such as speech, are not sta-tionary; they constantly vary in the above di-mensions. Thus, no stationary signal can ad-equately describe hearing aid performanceunder conditions of natural use.
Much work is ongoing to create signalsthat better represent natural speech andother real-world signals, for the purposes oftesting hearing aids. The following descrip-
12843.C03.PGS 3/8/02 11:02 AM Page 82

CHAPTER 3 � REAL-EAR MEASURES 83
tions of the properties of test signals are in-tended to give the clinician questions as wellas answers, to aid in the making of informedchoices of test signal and interpretations oftest results.
bandwidth
Bandwidth refers to the range of frequenciespresented by a signal at any given time.Many nonlinear hearing aids perform differ-ently for signals having differing band-widths. The signal having the narrowest pos-sible bandwidth is a pure tone (or sinusoid).This signal has only one frequency at a time.Two common narrowband signals, whosebandwidths are slightly broader than that ofa pure tone, are warble tones and -octavebands of noise. An example of a signal hav-ing a broad bandwidth is speech-weightedcomposite noise. This signal presents all theimportant speech frequencies at once. Nat-ural speech continually varies in bandwidth.But it is almost never as narrow in band-width as a pure tone, warble tone, or -octaveband of noise, and it is almost never as widein bandwidth as a speech-weighted compos-ite noise.
spectrum
Spectrum refers to the relative amplitudesand phases of the frequencies presented bya signal. Many nonlinear hearing aids per-form differently for signals having differ-ing spectral shapes. By manipulating theshape of the amplitude spectrum, one cre-ates what is known as “spectral weighting.”In a “speech-weighted” signal, for example,the amplitude spectrum is shaped to con-form to that of a long-term sample of speech.Speech-weighted signals can be either nar-row band or broadband. By definition, a sin-gle pure tone has only one spectral point(has only one frequency), and so can haveno spectral shape. A succession, or a sweep,of pure tones, however, can be either “iso-amplitude” (the same amplitude at all fre-quencies) or spectrally weighted such that thecollection of tones presented over the courseof the sweep follows a spectrally shaped pat-tern. Sweeps of warble tones or -octave
bands of noise can similarly be either iso-amplitude or spectrally weighted. Broad-band signals can also be flat (the same am-plitude over frequency) or speech weighted.Broadband speech-weighted signals typi-cally consist of either random noise or deter-ministic tone composites, also known aspseudo-random noise. The clinician shouldcheck the manufacturers’ specifications tobecome familiar with the peculiarities of thehearing instrument under test, as related toperformance, with signals having variousspectral shapes.
crest factor
Crest factor refers to the decibel ratio of thepeak amplitude of a signal versus the RMS,or effective amplitude of the signal. An ex-ample of a signal with a low crest factor (onewhose RMS level is close to its peak level) isa pure tone or sinusoid. A pure tone has acrest factor of 3 dB; that is, the peak level(as if read on an oscilloscope) is only 3 dBhigher than the RMS level (as if read on anAC voltmeter). An example of a signal witha high crest factor is a click. A click on an os-cilloscope would show a high peak ampli-tude that occurs over a very short period oftime. If one attempted to measure a clickwith an AC voltmeter, the signal wouldbegin and end so quickly that the meterwould not even have a chance to register. Sothe ratio of the peak to RMS levels (the crestfactor) of a click is very high.
Test signals having varying crest factorscan result in varying degrees of measuredperformance (e.g., gain, output, frequencyresponse) for a given hearing aid. It may beimportant with certain hearing aids to usetest signals having speech-like crest factors.Natural speech, on average, has an averagecrest factor of about 12 dB,5 which is higher
13
13
13
5This value applies when comparing the instanta-neous waveform peaks to a short-term RMS sample(125-msec integration time). Short-term RMS levels ofspeech can be 12 dB higher than the long-term RMSlevel, so, relative to the long-term RMS level, the crestfactor of speech can be as high as 25 dB (Harvey Dillon,personal communication).
12843.C03.PGS 3/8/02 11:02 AM Page 83

84 STRATEGIES FOR SELECTING AND VERIFYING HEARING AID FITTINGS
than that of a sine wave, but lower than thatof a click. With certain broadband signals,such as digitally generated tone composites,a speech-like crest factor can be achieved (insoftware) by setting the relative phases ofthe tonal components of the composite in acertain way. With random noise, the peaklevel can be limited by clipping, which re-duces the crest factor, but which may alterthe signal spectrum.
temporal properties
A fourth basic quality of test signals is called“temporal properties.” Temporal propertiesare the ways in which a signal varies overtime. Natural signals, like speech, are notstationary; they vary in many ways overtime. And so hearing aids that adapt withsignals that change over time may behavedifferently with stationary signals, as com-pared to the way they behave with natural,temporally varying signals.
experimental signals
The stationary test signals mentioned abovemay be the best tools currently available forreal-ear measures,6 yet these signals cannotreveal performance that is completely gener-alizable to the real world. Some experimen-tal signals that address real-world perfor-mance are either already available in REMsystems or are being tested for future re-lease. Descriptions of some of these follow,including broadband signals with bias tones,roving warble tones, International Collegiumof Rehabilitative Audiology (ICRA) noise,fluctuating composites, and maximum lengthsequences.
Broadband Signals with Bias TonesWith this stimulus, a broadband, speech-weighted signal analyzes the frequency re-sponse of hearing aids, in the presence of apure tone or other narrowband “bias” signal.The bias signal simulates the presence ofbackground noise that is constant in ampli-
tude. In automatic gain control (AGC) cir-cuits, the bias tone will set the overall gain (aswould a constant level of background noise),whereas the broadband signal reveals the fre-quency response of the instrument under thebiased condition. The broadband signal andbias tone can have various relative amplitudesto simulate various signal-to-noise ratios.
Roving Warble TonesWith this stimulus, a sequence of warbletones presents either a predetermined or arandom order of frequencies that follow sta-tistically prescribed criteria for duration andamplitude. The notion is to test how hearingaids perform with stimuli that vary some-what like speech does.
ICRA NoiseICRA7 has created an audio compact disc(CD) containing samples of a novel speech-simulating signal. The signal is a random-type noise that has been modulated by realspeech in such a way as to overlay, on thenoise, the long-term spectral and short-termtemporal qualities of speech. In some digitalhearing aids, this signal has been demon-strated to result in performance similar to thatachieved with real speech inputs [S. Wester-mann, personal communication; see Chapter1 in the companion book, Hearing Aids: Stan-dards, Options, and Limitations. (2nd edition).New York: Thieme Medical Publishers].
Fluctuating CompositeWith this signal, a speech-weighted tonecomposite has been adjusted to fluctuate ac-cording to the short-term temporal qualitiesof real speech. This signal is somewhat simi-lar to ICRA noise, except that it uses a deter-ministic, pseudo-random source, instead ofa random source. This signal is currentlyavailable in some REM systems, with thefeature that the operator has the ability not
6Find a thorough discussion of the interaction of tra-ditional test signals with hearing aids in Revit (1994).
7For information about ICRA, contact: Dr. W. A.Dreschler, Academisch Medisch Centrum, KNO-Audi-ologie D2, Meibergdreef 9, 1105 AZ Amsterdam ZO,The Netherlands; or Dr. S. Westermann, Widex Aps, NyVestergaardsvej 25, DK 3500, Vaerlose, Denmark.
12843.C03.PGS 3/8/02 11:02 AM Page 84

CHAPTER 3 � REAL-EAR MEASURES 85
only to select between the ICRA and S3.42(ANSI, 1992) long-term spectra, but also toadd a bias tone to simulate backgroundnoise.
Maximum Length Sequence (MLS)A maximum length sequence is a periodic,digitally generated pseudo-random noise.An MLS starts out as a binary sequence thatis arranged such that, after conversion toanalog form, the amplitudes and phasesover the course of the signal are normallydistributed, creating a flat spectral shape.The beauty of this signal is that, becauseit is deterministic, a complete frequency re-sponse measurement is captured in only onesample, yet its spectral properties resemblethose of random white noise, which requiresseveral averaged test samples to get a goodreading. And unlike the infinitely high crestfactor of random noise (which must be lim-ited by clipping), the crest factor of a maxi-mum length sequence is relatively low.
room acoustics {4.1.2}
The validity and repeatability of real-earmeasures depends to a large extent on thechoice of the test space and on the physicalarrangement of the equipment. Use the fol-lowing guidelines when deciding where andhow to set up a REM system.
Choose as large a room as possible, andone having the least amount of reverbera-tion as possible. A rule of thumb I use forroom size is that the distance both from thesubject and from the loudspeaker to any re-flective surface (wall, desk, furniture, REMsystem, etc.) should be at least twice the dis-tance between the subject and the loud-speaker.8 For example, in Figure 3–14, if theworking distance (WD) is 18 inches, then theminimum distance from both the subjectand the loudspeaker to any reflective surfaceshould be 2 � WD, or 36 inches. Whenever
possible, choose a room large enough toaccommodate that criterion. Also, to mini-mize standing waves and multiple reflec-tions between opposing walls or corners, itmay help to aim the loudspeaker so it is notpointing directly at a wall or a corner. Tominimize reverberation (a form of extrane-ous noise), cover large reflective surfaceswith sound-absorbing materials: The floorshould be carpeted (as thickly as is feasible),and the ceiling should be acousticallytreated. Drapes on the walls help too. Smallaudiologic test booths, because of their size,are generally a poor choice for setting up aREM system, even though all surfaces maybe sound-treated.
ambient noise {4.1.1}
Choose a room that is relatively free of ambi-ent noise. In addition to blatant interferencewith test signals, excessive ambient noisecan activate AGC action in hearing aidswhose compression thresholds are below theambient noise level.
location of the rem equipment
First of all, remember to apply the rule ofthumb given above regarding the locationsof the subject and the loudspeaker. Then, itis important to choose a location for theREM system that lets the clinician operatethe equipment conveniently, yet where nei-ther the equipment nor the clinician willbe acoustically in the way. When possible,avoid operating REM equipment from a po-sition near the direct path of sound betweenthe loudspeaker and the patient. The shadedarea in Figure 3–14 is the area the operatorshould avoid. In general, the best place fromwhich to operate the REM system is slightlybehind and well to the side of the loud-speaker.
Once the clinician knows where the pa-tient will be during REM testing and the di-rection the patient will face, it may be a goodidea to place the video monitor or liquid-crystal display (LCD) display of the REMsystem where the patient can look at thescreen easily when facing in the desired di-
8The distance between the emanating surface of theloudspeaker and the center of the subject’s head is calledthe “working distance” {3.1.12}, denoted as "WD" inFigure 3–14.
12843.C03.PGS 3/8/02 11:02 AM Page 85

86 STRATEGIES FOR SELECTING AND VERIFYING HEARING AID FITTINGS
rection (Fig. 3–14). Asking the patient to lookat the screen during measurements mayhelp the patient remain still and in the de-sired position. When using a 0-degree az-imuth of the loudspeaker (i.e., directly infront of the listener), an orange dot at the topor bottom of the housing of the loudspeakermay fulfill this purpose.
Real-Ear Measures and Clinical Factsof Life
The environment of an audiology clinic pre-sents limitations to the obtaining of “per-fect” real-ear measures. Many of these limi-tations have been minimized by hardwareand software processes contained within
REM systems. I now turn to some of theselimitations and their remedies.
Smoothing
Clinicians do not have the luxury of subjectswho always sit absolutely still and do notwear acoustically obtrusive jewelry, stylisticclothing, and coiffures. Also, it is rare to finda clinic test space large enough or anechoicenough to guarantee sound-field uniformityand stability (Walker et al, 1984). Because ofenvironmental acoustic anomalies, real-earmeasurements made under clinical condi-tions might ordinarily appear so jagged andhard to read as to render a response curveimpossible to interpret. This situation can be
Figure 3–14. Room setup for real-ear measures. The working distance (WD) is the dis-tance between the center of the subject’s head and the emanating surface of the soundsource. Ideally, reflective surfaces, such as walls, test equipment, and personnel, should beat least twice the working distance from either the subject or the sound source.
12843.C03.PGS 3/8/02 11:02 AM Page 86

CHAPTER 3 � REAL-EAR MEASURES 87
improved by a common feature of real-earmeasures known as “smoothing.”
Smoothing is a process by which the reso-lution (precision) of a measurement is inten-tionally smeared, across frequency, to by-pass many of the effects of environmentalacoustic anomalies while maintaining mostof the important features of a measurement.An analogy might be a photographer’s useof a diffusion filter in portraiture to obscurethe small wrinkles on a face while preserv-ing the important features that define thecharacter behind that face. Figure 3–15 showsan example of an REIG curve whose REARcomponent was measured with and withoutsmoothing. The important features, such asthe amplitudes and frequencies of the pri-mary and secondary resonance peaks, aremore clearly visible in the smoothed version(lower panel) than in the unsmoothed ver-sion (upper panel). Notice, however, that theabsolute amplitudes of the peaks are some-
what greater in the unsmoothed version,partly because of the greater precision of theunsmoothed measurement. It is importantthat the clinician be aware of the compro-mise on precision from using smoothedcurves, yet it is clear that smoothed curvesare far more usable than are unsmoothedones.
Smoothing can be accomplished by sev-eral means, depending on the type of testsignal. Each means, however, uses a similarprocess: Each data point plotted on a fre-quency response graph effectively is the av-erage of several data points taken over arange of frequencies. With pure-tone stimulithis process is performed mathematicallyin the software of the REM system. Thismethod is called postmeasurement smooth-ing. An example is that a point plotted for2000 Hz may be the arithmetic average ofmeasurements made at 1800, 1900, 2000,2100, and 2200 Hz. The same method would
Figure 3–15. Smoothing.Upper curve is a REIG ob-tained without smoothing.Lower curve is a REIG ob-tained under the same condi-tion except that postmeasure-ment smoothing was applied.
12843.C03.PGS 3/8/02 11:02 AM Page 87

88 STRATEGIES FOR SELECTING AND VERIFYING HEARING AID FITTINGS
apply for broadband stimuli that are com-posites of many pure tones presented simul-taneously. In contrast, with warble-tone and-octave-band noise stimuli, the smoothing
process occurs at the same time as the mea-surement is made. The smoothing is derivedfrom the intentionally imperfect precision ofthe signal itself. For example, with a warbletone centered at 2000 Hz, the signal maywaver along the frequency range between1800 and 2200 Hz. Such “frequency modula-tion” is what makes the tone sound “war-bled.” The data point plotted for 2000 Hz, inthis case, effectively is the average of mea-surements that were taken over a 400-Hzrange centered at 2000 Hz. With -octave-band noise, each signal spans a -octaverange of frequencies. So a data point plottedfor 2000 Hz, again, effectively is the averageof measurements taken over the -octaveband centered at 2000 Hz.
Noise Reduction
Another fact of life of clinical real-ear mea-sures is that extraneous noises in the test en-vironment can interfere with the accuracyand repeatability of measurements. Thereare several ways REM systems can reducethe effects of extraneous noise without com-promising the precision or accuracy of mea-surements.
filtering
One way to reduce the effects of extraneousnoise is to filter the measured signal with anotch-shaped band-pass filter. For example,when measuring the SPL at 2000 Hz, only anarrow band of frequencies centered around2000 Hz is measured. Other frequencies arefiltered out. In this way, noise occurring atfrequencies outside the pass-band of the fil-ter is rejected from the measurement beforeit is recorded.
signal averaging
Some REM systems that operate with deter-ministic signals use a measurement method
known as “synchronous analysis” {3.4.14}.This method calculates the average of a se-ries of samples of the measured waveform insynchronism with the period of the test sig-nal. Over several synchronized averages, thewaveform of the measured signal remainsconstant in amplitude and phase, whereasthe waveform of the extraneous noise ran-domly fluctuates between positive and neg-ative values across samples. When the sam-ples are averaged, the randomly fluctuatingnoise cancels out (the average of the posi-tives and negatives approaches zero), butthe signal remains intact. The same methodis used in brainstem-evoked response mea-surements to extract specific neural re-sponses from amidst a multitude of neuralevents, and in otoacoustic emission mea-surements to extract very weak cochlear sig-nals from the extraneous noises in the testenvironment.
Sound-Field Equalization (Leveling) {3.1.5}
Another clinical fact of life is that the test en-vironment for REMs may be anything butideal in terms of uniformity of the test soundfield. The question of uniformity is, Howpredictable or repeatable are the level andthe spectrum of the test sound field at thefield reference point from one test to an-other? In almost every clinical test space, theanswer is that the level and spectrum ofthe sound field are highly unpredictable,depending on the precise locations of thesubject, the person giving the test, theloudspeaker, the reference microphone, andother objects in the room.
The problem of unpredictability of thesound field is solved by correcting the soundfield either immediately before or duringeach measurement. This correction of thesound field is called “leveling” or “equaliza-tion” {3.1.5, 6.3}. Equalization of the soundfield has the following goal: If the signalsource is intended to have a flat spectrum,then the signal measured at the field refer-ence point (at the inlet of the control/refer-ence microphone) will also have a flat spec-
13
13
13
13
12843.C03.PGS 3/8/02 11:02 AM Page 88

CHAPTER 3 � REAL-EAR MEASURES 89
trum. Of course, it follows that if the spec-trum of the signal source is shaped in a par-ticular way, then the same spectral shapingshould appear at the sound-field referencepoint.
In REM systems, sound-field equalizationcan occur in two general ways:
1. Concurrent equalization {3.1.3}: Alsoknown as “real-time” or “on-line”equalization, this method adjusts thesound source at the same time as themeasurement is made. The REM systemcontinuously adjusts the electrical sig-nal drive to the loudspeaker, such thatthe intended sound amplitude remainsconstant at the field reference point (ref-erence microphone) throughout themeasurement process. The advantage ofthis method is that if the subject movesduring the measurement, any position-related changes in the sound field willbe compensated for.
2. Stored equalization {3.1.9}: With storedequalization, the REM system recordsthe equalization data at the referencemicrophone before the measurement ismade. With digital REM systems thatdeliver broadband composite signals,the constant updating of the signalspectrum that would be required byconcurrent equalization can be compu-tationally intensive, potentially slowingdown the measurement process. So thefact that the equalization data have al-ready been stored frees the REM systemto perform very fast, real-time analysis,frequency response measurements thatupdate several times per second. Ascomputer speed increases, however, thecomputational complexity will becomeless of a factor.
A potential disadvantage of stored equal-ization is that if the subject moves betweenthe time of leveling and measurement, re-sulting changes in the sound field can influ-ence the results. The best way to avoid thispitfall is to level the REM system immedi-ately before each measurement. If it is likely
that the subject has moved between levelingand measurement, one may re-level beforemaking the next measurement, after savingany previous measurements that must bekept.
Two ways of implementing the aboveequalization methods are the substitutionmethod of equalization and the modifiedpressure method. Real-ear measures per-formed in a laboratory in experimental re-search often use what is known as the sub-stitution method of equalization {3.1.10},which is a form of stored equalization withwhich the sound-field reference point coin-cides with the position of center of the sub-ject’s head. With the subject absent, and withthe inlet of the reference microphone at theposition in the room where the center of thesubject’s head will be during testing, the REMsystem measures and stores the equalizationdata necessary for leveling the sound field.Later, the subject is positioned at the testpoint, around which the free-field-referredmeasurements can be made.
For valid, repeatable measurements withthe substitution method, the room must ex-hibit a high degree of acoustic uniformityaround the field reference point (Walker et al,1984). With clinical real-ear measures, suchacoustic uniformity is rare, and so an alter-nate method of equalization becomes theclinical norm. It is called the modified pres-sure method of equalization.9 With thismethod, the inlet of the reference microphoneis placed close to the subject’s head, near thetest ear, and yet away from the acoustic influ-ence of both the pinna and the hearing aid(exemplified in Fig. 3–13). From this location,the REM system measures the equalizationdata necessary for leveling the sound field.
9Standard test-box measurements of hearing aids usethe “pressure method” (ANSI S3.22-1996b). The pres-sure method calls for the reference microphone to bewithin a few millimeters of the inlet of the hearing aidmicrophone. With real-ear measurements, the referencemicrophone may be located relatively distantly fromthe hearing aid microphone, and thus the term modifiedpressure method applies.
12843.C03.PGS 3/8/02 11:02 AM Page 89

90 STRATEGIES FOR SELECTING AND VERIFYING HEARING AID FITTINGS
The modified pressure method can use eitherconcurrent or stored equalization data.
Output Limiting
Perhaps the most important clinical fact oflife regarding real-ear measures is the factthat hearing aids can often produce real-earSPLs that are either uncomfortable or evendamaging to the wearer. In fact, the main rea-son to do real-ear measurements is becauseone cannot be sure, from coupler measuresalone, how a given hearing aid will performon a given ear. Of special importance is thequestion, What is the real-ear maximum out-put? Most clinicians recommend the obtain-ing of at least some measure of the maximumoutput of new hearing instruments beforeseeing the patient out the door. The reason isthat if the hearing aids are capable of exces-sive outputs, it is better to find out early, inthe clinic, where adjustments can be made,rather than for the patient to find out later inan intolerably loud real-life situation. Mea-suring the RESR provides an objective clini-cal assessment of maximum output. Butwithout the proper precautions, such clinicalmeasurements could result in excessive SPLsin the patient’s ears.
All REM systems let the clinician specifythe maximum SPL permitted at the inlet tothe probe microphone. Thus, when theprobe microphone is in the ear canal, theREM system effectively limits the maximumreal-ear output of the hearing aid. The REMsystem accomplishes this by reducing thesignal drive level the moment the prese-lected SPL is exceeded at the inlet to theprobe microphone. Before doing any aidedreal-ear measurement on a patient, the clini-cian must check the setting of the REM sys-tem’s output limiting to see that the settingis appropriate for that patient.
Preparing to Make Real-EarMeasurements
Otoscopic Inspection
For two purposes, the clinician must inspectthe patient’s ear canals otoscopically before
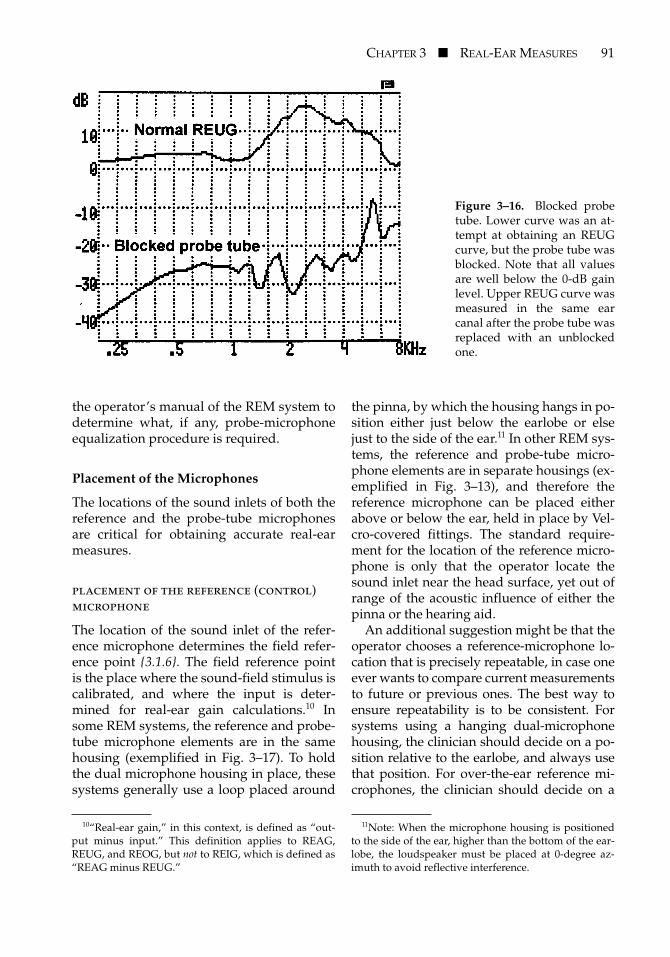
beginning REM testing: (1) to determine thatno pathology is present that might affect adecision to proceed with testing, and (2) todetermine that the ear canal is sufficientlyfree from cerumen or other obstructions ordebris that might interfere with testing. Notonly could such obstructions make it difficultto insert the probe tube, but cerumen can eas-ily clog the opening of the probe tube, ren-dering the probe microphone inoperative.Some REM systems have automatic softwarethat can detect conditions correlating with ablocked probe tube, but it is easy for the clin-ician to tell when this condition is presentjust by looking at the measurement results.Figure 3–16 shows an example of two REUGmeasurements, one (upper panel) with a nor-mal probe tube and one (lower) with ablocked probe tube. When the probe tube isblocked, the measured output or gain will beunusually low (near the noise floor of theREM system). The same will be true even foran aided response measurement.
Calibration of the Probe-Tube Microphone
The frequency response of a probe-tube mi-crophone is not usually flat without the useof internal equalization (distinct from thesound-field equalization discussed earlier).The required internal equalization changessomewhat with each type of probe tube.Some REM systems specify the consistentuse of a particular model of probe tube, andtherefore those systems can store the probe-microphone equalization internally. OtherREM systems require that the probe tube mi-crophone be equalized before each use, in asimple procedure performed by the opera-tor. The operator places the sound inlet ofthe probe tube at the center of the soundinlet of the reference microphone, so thateach microphone picks up the same signal(Fig. 3–17). The coincident microphones arethen held in front of the loudspeaker whilethe REM system automatically compares thefrequency responses of the two. The REMsystem then equalizes the probe-micro-phone response so that it matches the re-sponse of the reference microphone. Check
12843.C03.PGS 3/8/02 11:02 AM Page 90
CHAPTER 3 � REAL-EAR MEASURES 91
the operator’s manual of the REM system todetermine what, if any, probe-microphoneequalization procedure is required.
Placement of the Microphones
The locations of the sound inlets of both thereference and the probe-tube microphonesare critical for obtaining accurate real-earmeasures.
placement of the reference (control)microphone
The location of the sound inlet of the refer-ence microphone determines the field refer-ence point {3.1.6}. The field reference pointis the place where the sound-field stimulus iscalibrated, and where the input is deter-mined for real-ear gain calculations.10 Insome REM systems, the reference and probe-tube microphone elements are in the samehousing (exemplified in Fig. 3–17). To holdthe dual microphone housing in place, thesesystems generally use a loop placed around
the pinna, by which the housing hangs in po-sition either just below the earlobe or elsejust to the side of the ear.11 In other REM sys-tems, the reference and probe-tube micro-phone elements are in separate housings (ex-emplified in Fig. 3–13), and therefore thereference microphone can be placed eitherabove or below the ear, held in place by Vel-cro-covered fittings. The standard require-ment for the location of the reference micro-phone is only that the operator locate thesound inlet near the head surface, yet out ofrange of the acoustic influence of either thepinna or the hearing aid.
An additional suggestion might be that theoperator chooses a reference-microphone lo-cation that is precisely repeatable, in case oneever wants to compare current measurementsto future or previous ones. The best way toensure repeatability is to be consistent. Forsystems using a hanging dual-microphonehousing, the clinician should decide on a po-sition relative to the earlobe, and always usethat position. For over-the-ear reference mi-crophones, the clinician should decide on a
Figure 3–16. Blocked probetube. Lower curve was an at-tempt at obtaining an REUGcurve, but the probe tube wasblocked. Note that all valuesare well below the 0-dB gainlevel. Upper REUG curve wasmeasured in the same earcanal after the probe tube wasreplaced with an unblockedone.
10“Real-ear gain,” in this context, is defined as “out-put minus input.” This definition applies to REAG,REUG, and REOG, but not to REIG, which is defined as“REAG minus REUG.”
11Note: When the microphone housing is positionedto the side of the ear, higher than the bottom of the ear-lobe, the loudspeaker must be placed at 0-degree az-imuth to avoid reflective interference.
12843.C03.PGS 3/8/02 11:02 AM Page 91

92 STRATEGIES FOR SELECTING AND VERIFYING HEARING AID FITTINGS
position relative to the apex of the pinna andshould always use that position.
placement of the probe tube
The location of the sound inlet of the probe-tube microphone is called the “measurementpoint” {3.4.3}. The measurement point in theear canal determines, for high frequencies,how accurately the measured SPL representsthe SPL at the eardrum. The REM operatormust keep two acoustic conditions in mind.First, at the measurement point in the earcanal, sound reflected from the eardrum caninterfere with sound just arriving. Such re-
flective interference causes sound-pressurenulls at distances from the eardrum equal toone-quarter the wavelength of the frequencyof interest. Figure 3–18 illustrates this point(Dirks and Kincaid, 1987). Each curve repre-sents the SPL at a given high frequency, mea-sured by a probe-tube microphone in the earcanal at varied distances from the eardrum.Note that for relatively lower frequencies(which means longer wavelengths), the pres-sure nulls occur at greater distances from theeardrum. For frequencies lower than about2000 Hz, these nulls are not a problem. Thetake-home message is that for the most accu-rate estimates of the SPL at the eardrum for
Figure 3–17. Example of hous-ing that combines probe-tubeand reference microphones.Sound inlet of probe tube isshown in calibration position, atsound inlet of reference micro-phone. (Courtesy of EtymonicDesign, Inc.)
Figure 3–18. Difference between probe-microphone SPL and eardrum SPL at varied dis-tances from the eardrum, for various frequencies. Sound-pressure nulls occur at distancesfrom the eardrum equal to approximately one-fourth the wavelength of the test tone. (FromDirks D, Kincaid G. Basic acoustic considerations of ear canal probe measurements. Ear Hear1987;8(suppl 5):60S-67S. Reprinted with permission from Lippincott Williams & Wilkins.)
12843.C03.PGS 3/8/02 11:02 AM Page 92

CHAPTER 3 � REAL-EAR MEASURES 93
high frequencies, one must place the tip ofthe probe tube as close as possible to theeardrum. For clinical purposes, however,placing the sound inlet of the probe tubewithin 6 mm (about a quarter-inch) of theeardrum assures that the measured SPL willagree with the SPL at the eardrum within 2dB through about 6000 Hz, and within 4 dBthrough about 8000 Hz. This 6-mm rule ofthumb applies to all open- and occluded-earmeasurements.
A second acoustic consideration for place-ment of the probe tube applies only foraided real-ear measurements. When soundemanates from a small opening into a largerdiameter (such as the sound emanatingfrom hearing aids into an ear canal), sound-pressure nulls form at high frequencies inthe vicinity of the sound outlet (Sachs andBurkhard, 1971) (Fig. 3–19). These nulls canbe explained by the physics of radial waves,which is beyond the scope of this chapter. Insimple terms, the greater the distance fromthe sound outlet, the higher the frequency ofthe null. Therefore, for accurate estimatesof the SPL at the eardrum for high frequen-cies, always place the sound inlet of theprobe microphone well beyond the region ofthe null at the highest frequency of interest.
For sound outlets of 3 mm or more (for ex-ample, a BTE with a 3-mm horn), placing thesound inlet of the probe microphone at least5 mm medially to the sound outlet of thehearing aid will assure negligible radial-wave interference through about 8000 Hz.For smaller sound outlets (e.g., for no. 13tubing, which has an internal diameter of1.93 mm, or for most ITEs, which have asound outlet diameter of 1.35 mm), a greaterdistance from the sound outlet is required toavoid interference. None of this applies tohearing aids that terminate within 5 mm ofthe eardrum. Most commonly, these will beCIC hearing aids.
The reader will note that because the REIGrepresents a difference between two real-earmeasures (REAG minus REUG), the absoluteposition of the sound inlet of the probe-tubemicrophone is less important than with otherREMs (Hawkins and Mueller, 1986). Any
acoustic anomalies related to probe positionwill be common to both the REAG and theREUG measures, and will subtract out of theREIG. What is important is that the measure-ment point stays in precisely the same placefor both the REAG and the REUG.
methods of positioning the probe tube
Researchers and clinicians have developedmany methods for determining that theprobe tube is in an acceptable position forreal-ear measurements. This chapter pre-
Figure 3–19. Schematic representation of soundentering an occluded ear canal simulator througha 3-mm opening. Contour lines with numbers in-dicate sound-pressure nulls at indicated frequen-cies (in kHz); a rule of thumb is to extend theprobe tube at least 5 mm beyond a 3-mm soundoutlet. Deeper extension is required for high-frequency accuracy as the diameter of the soundoutlet decreases. (From Sachs RM, Burkhard MD.On making pressure measurements in insert ear-phone couplers and real ears. Presented at the82nd Meeting of the Acoustical Society of Amer-ica, Denver, Colorado, October 19–22. Reprintfrom Knowles Electronics, Itasca, IL, 1971. Withpermission.)
12843.C03.PGS 3/8/02 11:02 AM Page 93

94 STRATEGIES FOR SELECTING AND VERIFYING HEARING AID FITTINGS
sents four such methods: the otoscopicmethod, the acoustic method, the average-length method, and the earmold method.
Otoscopic MethodTo many clinicians, viewing the probe tubein the ear canal with an otoscope is the mostreliable way to determine reasonably accu-rately that the tip of the probe tube is within6 mm of the eardrum. First, while lookinginto the ear canal with an otoscope, visuallyestimate the length of the ear canal. Then,mark the probe tube at a position you esti-mate will correspond to the tragus, once thetip of the probe tube lies within 6 mm of theeardrum. On average, the adult ear canal is24 mm long, so for an ear canal of averagelength the probe tip needs to be positionedat least 18 mm medially to the opening of theear canal. The distance between the openingof ear canal and the tragus is about another10 mm. So for the average-size ear youwould mark the probe tube at 28 mm fromthe tip. For smaller ears and shorter earcanals, you could use 25 or 26 mm as thestarting point; for children’s ears, even less.Once you have marked the probe tube, in-sert it slowly into the ear canal, stoppingwhen the mark lies near the tragus or the in-tertragal notch. Now look into the ear oncemore with the otoscope to see how far fromthe eardrum the tip of the probe tube lies.Carefully adjust the position of the probetube, if necessary, so that the tip lies within 6mm of the eardrum and then confirm the po-sition with the otoscope.
Acoustic MethodThere are three variations of the acousticmethod. An acoustic method for positioningthe probe tube in real-ear measurementswas described by Sullivan (1988). Sullivan’smethod requires that the clinician create ahomemade device, using a paper clip, forstabilizing the probe tube at various inser-tion depths. Begin placement by introducinga 6000-Hz warble tone into the ear canal at afield reference level of at least 60-dB SPL.Slowly insert the probe tube until a positionis found to produce a minimum SPL. Ac-
cording to Figure 3–18, a null for 6000 Hzcorresponds to a distance of about 15 mmfrom the eardrum. With the probe tube inthis position, mark the tube at the tragus orintertragal notch, and then at a point 10 mmlateral to the first mark. Insert the probe tubeso that the second mark is now even withthe tragus or intertragal notch. The result isa measurement point that is approximately5 mm from the eardrum.
A variation of this method, using a real-time or repeatedly swept signal, goes as fol-lows: Introduce a broadband or repeatedlyswept warble-tone signal at a field referencelevel of 70-dB SPL. While watching the real-time readout on the screen, slowly advancethe probe tube into the ear canal until youobserve an SPL minimum at 6000 Hz. Con-tinue to advance the probe tube slowly, at in-crements of perhaps 2 mm. The SPL at 6000Hz will begin to rise out of the null. Con-tinue until no appreciable additional rise inSPL is seen at 6000 Hz as the tube is ad-vanced the next increment.
Average-Length MethodAccording to various studies (e.g., Zwis-locki, 1980; Zemplenyi et al, 1985), the lengthof the average adult human ear canal is be-tween 23 and 25 mm. The average-lengthmethod, thus, begins by assuming the pa-tient’s ear canal is approximately 24 mmlong. The pre-REM otoscopic inspection ei-ther will support the assumption of an earcanal of average length or will suggest amodification of that assumption. For an earcanal of seemingly average length, the clini-cian marks the probe tube at perhaps 28 mmfrom the tip. This distance corresponds to 24mm for the ear canal, plus 10 mm for the dis-tance between the ear canal opening and thetragus or intertragal notch, minus 6 mm forthe target distance from the eardrum. Theprobe tube is then placed in the ear canalsuch that the mark is even with the tragus orintertragal notch. Because it is desirable tobe within 6 mm of the eardrum for all earcanals, the 28-mm rule may be adjusted ac-cording to age and sex. The 28-mm mark isoften used for women, whose ear canals, on
12843.C03.PGS 3/8/02 11:02 AM Page 94
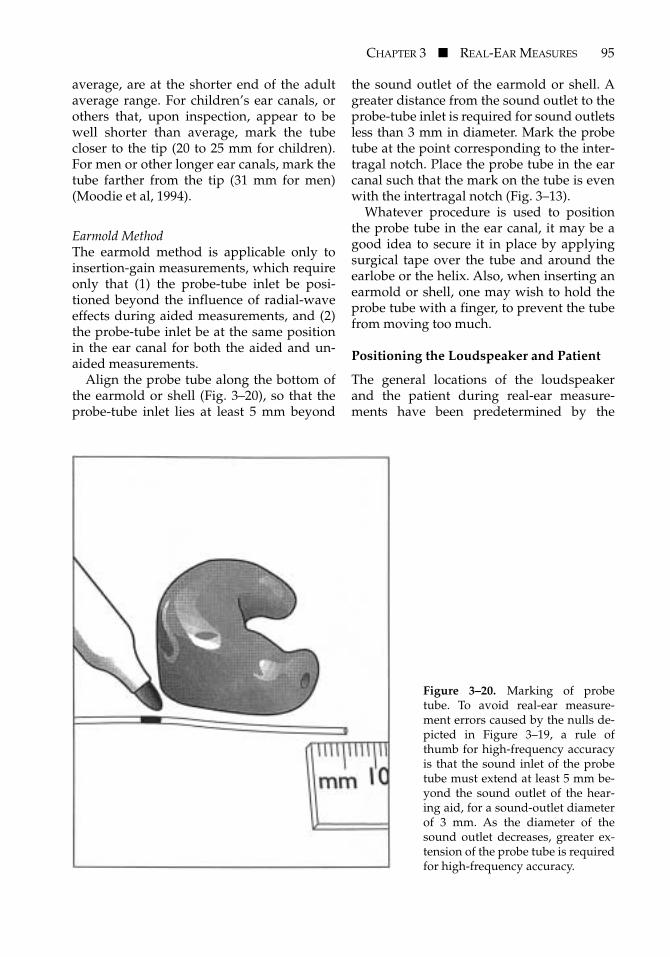
CHAPTER 3 � REAL-EAR MEASURES 95
average, are at the shorter end of the adultaverage range. For children’s ear canals, orothers that, upon inspection, appear to bewell shorter than average, mark the tubecloser to the tip (20 to 25 mm for children).For men or other longer ear canals, mark thetube farther from the tip (31 mm for men)(Moodie et al, 1994).
Earmold MethodThe earmold method is applicable only toinsertion-gain measurements, which requireonly that (1) the probe-tube inlet be posi-tioned beyond the influence of radial-waveeffects during aided measurements, and (2)the probe-tube inlet be at the same positionin the ear canal for both the aided and un-aided measurements.
Align the probe tube along the bottom ofthe earmold or shell (Fig. 3–20), so that theprobe-tube inlet lies at least 5 mm beyond
the sound outlet of the earmold or shell. Agreater distance from the sound outlet to theprobe-tube inlet is required for sound outletsless than 3 mm in diameter. Mark the probetube at the point corresponding to the inter-tragal notch. Place the probe tube in the earcanal such that the mark on the tube is evenwith the intertragal notch (Fig. 3–13).
Whatever procedure is used to positionthe probe tube in the ear canal, it may be agood idea to secure it in place by applyingsurgical tape over the tube and around theearlobe or the helix. Also, when inserting anearmold or shell, one may wish to hold theprobe tube with a finger, to prevent the tubefrom moving too much.
Positioning the Loudspeaker and Patient
The general locations of the loudspeakerand the patient during real-ear measure-ments have been predetermined by the
Figure 3–20. Marking of probetube. To avoid real-ear measure-ment errors caused by the nulls de-picted in Figure 3–19, a rule ofthumb for high-frequency accuracyis that the sound inlet of the probetube must extend at least 5 mm be-yond the sound outlet of the hear-ing aid, for a sound-outlet diameterof 3 mm. As the diameter of thesound outlet decreases, greater ex-tension of the probe tube is requiredfor high-frequency accuracy.
12843.C03.PGS 3/8/02 11:02 AM Page 95

96 STRATEGIES FOR SELECTING AND VERIFYING HEARING AID FITTINGS
arrangement of the test room, as describedand depicted in Figure 3–14. The remainingfine-tuning involves two steps: (1) the pre-cise designation of a “test point” {3.1.11},which is where the center of the head of thepatient will be during testing; and (2) theplacement of the loudspeaker relative tothe test point. The distance between the ema-nating surface of the loudspeaker and the testpoint is called the “working distance” (Fig.3–14) {3.1.12}. The greater the working dis-tance, the more that room acoustics caninfluence the measurement results. Thesmaller the working distance, the more thepatient’s head movements can influence themeasurement results. Obviously, the clini-cian must arrive at a compromise. With thesmall loudspeakers normally used in clinical
REM systems, a working distance of 30 to 60cm (1 to 2 feet) usually works well. The hori-zontal angle of the loudspeaker relative tothe “plane of symmetry” directly in front ofthe patient is called the “azimuth angle”(Fig. 3–21, upper panel). The vertical angleof the loudspeaker relative to the “horizon-tal plane” at ear level is called the “elevationangle” (Fig. 3–21, lower panel). Figures 3–2and 3–3 show the relative effects of azimuthand elevation for REUR measures. Note inFigure 3–2 that the ear canal SPL generallyincreases as the azimuth angle increasesfrom 0 to 90 degrees. Also, in Figure 3–3 notethat the high-frequency “concha” dip (atabout 8000 Hz) moves higher in frequencyand becomes more shallow as the elevationangle increases beyond 0 degrees (note that
Figure 3–21. Schematic representations of azimuth (upper panel) and elevation (lowerpanel) angles.
12843.C03.PGS 3/8/02 11:02 AM Page 96

CHAPTER 3 � REAL-EAR MEASURES 97
the curves in Figure 3–3 are measurementsof the “blocked meatus,” not the open earcanal, so the primary canal resonance at 2700Hz is not seen).
It is worth noting that the choice of the az-imuth and elevation of the loudspeaker re-mains somewhat controversial. Intuitively, itmay seem that real-ear testing should bedone with the loudspeaker directly in frontof the patient. The idea is that, in the realworld of conversational speech, the talkerand the listener would normally stand or sitfacing each other. Yet I observe that peoplehardly ever face one another directly whileconversing; usually they partially face oneanother and then they complete the appro-priate eye contact by pointing their eyes to-ward one another. For example, observe agroup of two or more diners sitting at adja-cent sides of a square table. When the personimmediately to a listener’s side begins totalk, does the listener turn one’s head as faras is necessary to directly face the talker? Ordoes the listener turn partially toward thetalker, and point one’s eyes in the direction
of the talker to complete the appropriate eyecontact? There would be a lot of sore necks ifthe former were true.
In real life, people listen from many az-imuth angles, and no single azimuth anglewill clearly represent the majority of listeningpositions. The question of the best position ofthe loudspeaker for real-ear testing then be-comes, Which azimuth angle yields the mostreliable real-ear measures? A 1987 study of in-sertion-gain repeatability versus loudspeakerlocation addressed that question (Killion andRevit, 1987). Results showed that placing theloudspeaker at an azimuth angle of 45 de-grees toward the test ear produced signifi-cantly better repeatability than did placingthe loudspeaker at 0 degrees (Fig. 3–22).These results were independently replicatedin a later study (Trede, 1990).
Regarding choices of loudspeaker posi-tion, the clinician should be aware that someportable REM systems have a hinged orbuilt-in loudspeaker, which, when attachedto the main unit, sits directly behind a reflec-tive horizontal surface and directly in front
Figure 3–22. Average standard deviations for repeated REIG measurements at variousloudspeaker locations. As per convention, each curve label gives the azimuth angle fol-lowed by the elevation angle. The best repeatability was obtained using a 45-degree az-imuth and a 45-degree elevation. No reference microphone was used in obtaining thesemeasurements. (Adapted from Killion MC, Revit LJ. Insertion gain repeatability versusloudspeaker location: You want me to put my loudspeaker W-H-E-R-E? Ear Hear 1987;8(5Suppl):68S-73S. Reprinted with permission from Lippincott Williams & Wilkins.)
12843.C03.PGS 3/8/02 11:02 AM Page 97

98 STRATEGIES FOR SELECTING AND VERIFYING HEARING AID FITTINGS
of a reflective vertical surface (such as thatcontaining an LCD). Other systems mayhave an unhinged, built-in loudspeaker setback from the front of the unit, again behinda reflective horizontal surface (the rest of theunit). Avoid operating a REM system withthe loudspeaker in such positions, as reflec-tive interference from the horizontal andvertical surfaces can confound measure-ments. In practice, the REM unit itself effec-tively becomes a nearby reflective floor andwall. With these REM systems, always sepa-rate the loudspeaker from the REM unit, orotherwise move the loudspeaker forward, toavoid interference from the horizontal andvertical surfaces of the unit.
Positioning the Operator
The position of the operator should not in-fluence the sound field during leveling ortesting. The shaded area in Figure 3–14shows where the operator should not be. Ingeneral terms, the operator should be eitherwell behind or well to the side of either theloudspeaker or the patient.
Choosing a Signal Type and Amplitude
The choice of the type and the amplitude ofthe test signal is, of course, limited to what isavailable on the REM system. Beyond thatlimitation, the choice depends on what thetester wishes to accomplish.
One special consideration is worth men-tioning at the outset. When measuring theRESR, it is best to use a narrowband signal atthe highest amplitude possible. If available,use short bursts of tones, so that the patient’sexposure to loud sounds is minimized. Be-fore testing the RESR, be certain that the “out-put limiting” feature of the REM system is setproperly, for patient protection.
For real-ear testing of the general perfor-mance of hearing aids, the following guide-lines may be helpful. In some cases, thereader is directed to use a specific signal fora given purpose. In other cases, the readeris provided only general information thatcan help with a decision as to which signalto use.
linear hearing aids
When hearing aids are operating linearly,REM results will be the same regardless ofthe signal type and amplitude. However,when a linear hearing aid is saturated by ahigh-amplitude signal, the instrument is nolonger operating linearly and is thereforesensitive to the type of signal. For observingthe frequency response of hearing aids undersaturated conditions, use a broadband sig-nal, if possible. But to see the highest-possi-ble case of maximum output (i.e., the RESR),use a narrowband signal (Revit, 1994).
compression hearing aids with single-channel, broadband detectors
To determine the amount of gain to producefor a given circumstance, compression hear-ing aids have circuits that detect the amp-litude of the input signal. Single-channelcompression hearing aids (and some multi-channel aids as well) have only one such de-tector, and it is a broadband one. When themicrophones in such hearing aids have flatfrequency responses, the measured frequencyresponses of the instruments will be the samefor both broadband and narrowband test sig-nals. But if the responses of the hearing aidmicrophones are sloping, a narrowband sig-nal can yield potentially misleading resultsfor frequency response tests such as those ob-tained through REMs.
The potential for error arises from the factthat the sloping response of each hearing aidmicrophone alters the amplitude of the sig-nal entering the detection circuitry of thehearing aid, from one frequency to the next,even though the SPL at the hearing aidmicrophone may stay constant. Because ofthe gain-reduction action of wide dynamicrange compression (WDRC), frequencies ofrelatively low amplitude in the detection cir-cuit will show higher gain than will frequen-cies of relatively high amplitude. The resultis a “blooming” of the frequency-responsecurve at low frequencies when using iso-amplitude narrowband signals (exempli-fied in Fig. 3–23). Such blooming of mea-sured low-frequency response would be an
12843.C03.PGS 3/8/02 11:02 AM Page 98

CHAPTER 3 � REAL-EAR MEASURES 99
accurate portrayal of real-world response fornarrow-band signals such as whistles andbeeps, but not for most speech sounds.
multichannel compression hearing aidswith multichannel detector circuits
This is a unique class of hearing aids, in that,when presented with a broadband signal,the hearing aids themselves narrow the ef-fective bandwidth of the input signal. Thatis, the circuitry of the hearing aids splits theinput signal into multiple, comparativelynarrow bands, creating multiple channelsfor both audio processing and level detec-
tion. It is possible to have multiple audiochannels without having multiple detectors.In such circuits, the energy within the rangeof one frequency band can affect the perfor-mance in another frequency band. This ef-fect can be seen in the 2-cc coupler curves ofFigure 3–24, where changes in the inputamplitude of a speech-weighted signal, inwhich low frequencies predominate, causedchanges in the gain at high frequencies. Onlyone level detector in this circuit controlledthe compression in all audio bands.
With multiple detectors, however, eachaudio channel of the hearing aid behaves in-dependently of the others. In such cases, the
Figure 3–23. Real-ear aidedgain (REAG) measures of adual-channel, dual-detectorhearing aid having widedynamic-range compression(WDRC). Curve marked “nar-row” (filled rectangles) wasobtained using a pure-tonesignal. Curve marked “broad”(no symbols) was obtainedusing a speech-weighted com-posite signal.
Figure 3–24. 2-cc coupler re-sponses of a single-channel, sin-gle-detector WDRC hearing aidhaving a “treble increases at lowlevels” (TILL) response charac-teristic, for varied RMS inputSPLs.
12843.C03.PGS 3/8/02 11:02 AM Page 99
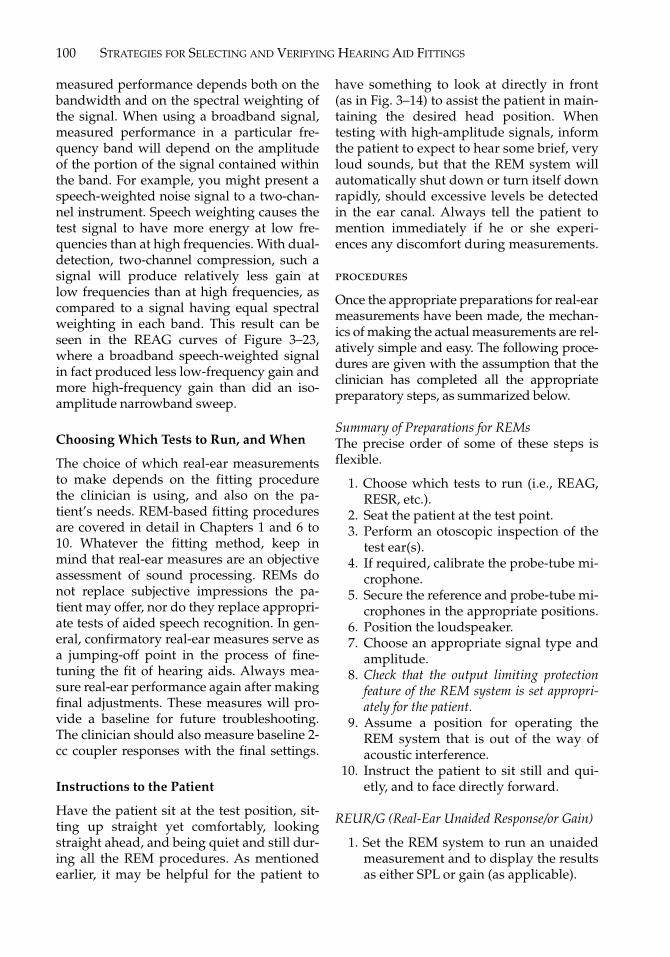
100 STRATEGIES FOR SELECTING AND VERIFYING HEARING AID FITTINGS
measured performance depends both on thebandwidth and on the spectral weighting ofthe signal. When using a broadband signal,measured performance in a particular fre-quency band will depend on the amplitudeof the portion of the signal contained withinthe band. For example, you might present aspeech-weighted noise signal to a two-chan-nel instrument. Speech weighting causes thetest signal to have more energy at low fre-quencies than at high frequencies. With dual-detection, two-channel compression, such asignal will produce relatively less gain atlow frequencies than at high frequencies, ascompared to a signal having equal spectralweighting in each band. This result can beseen in the REAG curves of Figure 3–23,where a broadband speech-weighted signalin fact produced less low-frequency gain andmore high-frequency gain than did an iso-amplitude narrowband sweep.
Choosing Which Tests to Run, and When
The choice of which real-ear measurementsto make depends on the fitting procedurethe clinician is using, and also on the pa-tient’s needs. REM-based fitting proceduresare covered in detail in Chapters 1 and 6 to10. Whatever the fitting method, keep inmind that real-ear measures are an objectiveassessment of sound processing. REMs donot replace subjective impressions the pa-tient may offer, nor do they replace appropri-ate tests of aided speech recognition. In gen-eral, confirmatory real-ear measures serve asa jumping-off point in the process of fine-tuning the fit of hearing aids. Always mea-sure real-ear performance again after makingfinal adjustments. These measures will pro-vide a baseline for future troubleshooting.The clinician should also measure baseline 2-cc coupler responses with the final settings.
Instructions to the Patient
Have the patient sit at the test position, sit-ting up straight yet comfortably, lookingstraight ahead, and being quiet and still dur-ing all the REM procedures. As mentionedearlier, it may be helpful for the patient to
have something to look at directly in front(as in Fig. 3–14) to assist the patient in main-taining the desired head position. Whentesting with high-amplitude signals, informthe patient to expect to hear some brief, veryloud sounds, but that the REM system willautomatically shut down or turn itself downrapidly, should excessive levels be detectedin the ear canal. Always tell the patient tomention immediately if he or she experi-ences any discomfort during measurements.
procedures
Once the appropriate preparations for real-earmeasurements have been made, the mechan-ics of making the actual measurements are rel-atively simple and easy. The following proce-dures are given with the assumption that theclinician has completed all the appropriatepreparatory steps, as summarized below.
Summary of Preparations for REMsThe precise order of some of these steps isflexible.
1. Choose which tests to run (i.e., REAG,RESR, etc.).
2. Seat the patient at the test point.3. Perform an otoscopic inspection of the
test ear(s).4. If required, calibrate the probe-tube mi-
crophone.5. Secure the reference and probe-tube mi-
crophones in the appropriate positions.6. Position the loudspeaker.7. Choose an appropriate signal type and
amplitude.8. Check that the output limiting protection
feature of the REM system is set appropri-ately for the patient.
9. Assume a position for operating theREM system that is out of the way ofacoustic interference.
10. Instruct the patient to sit still and qui-etly, and to face directly forward.
REUR/G (Real-Ear Unaided Response/or Gain)
1. Set the REM system to run an unaidedmeasurement and to display the resultsas either SPL or gain (as applicable).
12843.C03.PGS 3/8/02 11:02 AM Page 100

CHAPTER 3 � REAL-EAR MEASURES 101
2. If necessary, equalize (level) the soundfield.
3. Obtain the REUR or REUG.
Note: The signal amplitude for theREUR/G is of little consequence, becausethe unaided open ear is a totally passive de-vice that will produce the same relative SPLat the eardrum for any signal amplitude. Theonly requirement of signal amplitude is thatit must exceed the noise floor of the test sys-tem (including room noise) by at least 10 dBat all test frequencies.
REAR/G (Real-Ear Aided Response/or Gain)
1. While taking care that the probe tubedoes not move appreciably during in-sertion, insert the earmold or shell ofthe hearing aid into the test ear.
2. If necessary, equalize (level) the soundfield.
3. Turn the hearing aid on and set the vol-ume control and/or programming tothe desired settings.
4. Set the REM system to run an aidedmeasurement and to display the resultsas either SPL or gain (as applicable).
5. Set the signal type and amplitude, asdesired.
6. Obtain the REAR or REAG.7. For nonlinear hearing aids, repeat the
REAR/G measurement at several sig-nal amplitudes (e.g., 50-, 65-, and 80-dBSPL), as desired.
REIG (Real-Ear Insertion Gain)
1. Set the REM system for insertion-gainmeasurement.
2. Obtain the REUR or REUG.12
3. Obtain the REAR or REAG. (Note: WithREAR measurements for insertion gain,the signal amplitude must be the same
as was used to obtain the REUR, unlessthe REM system compensates for thelevel change. This requirement does notapply when working with the REAGand REUG)
4. The REM system will subtract theREUR/G from the REAR/G, display-ing the result as the REIG. For nonlin-ear hearing aids, repeat the REAR/G,thus displaying a new REIG, for severalsignal levels, as desired. If workingwith the REAR for this step, the REIGsoftware should compensate for differ-ences in signal amplitude, as comparedto that used for the REUR.
One further note regarding probe place-ment for insertion-gain measurements: Themark on the probe tube may have to bemoved slightly more medial for the aidedmeasurement than for the unaided measure-ment, to ensure the same position of the tipof the tube for both measurements. This ad-justment may be necessary because of theextra distance the probe tube must cover toget around the shape of the earmold or shell(Revit, 1993a).
REOR/G (Real-Ear Occluded Response/Gain)
1. After marking the probe tube and plac-ing it in the ear in the normal way, in-sert the earmold or shell of the hearingaid into the test ear, taking care not tomove the position of the probe tube.
2. Do not turn the hearing aid on.3. Set the REM system to run an aided
measurement and to display the resultsas either SPL or gain (as applicable).
4. Set the signal type and amplitude, asdesired, but to an amplitude greatenough so that the attenuated responsemeasured of sound leaking through theearmold will be more than 10 dB abovethe noise floor of the REM system, foreach frequency of interest.
5. If necessary, equalize (level) the soundfield.
6. Record the REOR or REOG in the sameway you would record the REAR orREAG.
12For prescriptive insertion-gain applications, the au-thor recommends using a prestored, “average-ear”curve for the REUR/G instead of using the individualmeasure, provided such an average-ear curve is avail-able for the specific system setup being used. (See theappendix of this chapter for a rationale for the above.)
12843.C03.PGS 3/8/02 11:02 AM Page 101

102 STRATEGIES FOR SELECTING AND VERIFYING HEARING AID FITTINGS
RESR (Real-Ear Saturation Response)
1. IMPORTANT! Set the output limitingof the REM system to an appropriatemaximum permitted SPL.
2. If necessary, equalize (level) the soundfield.
3. Inform the patient to expect a test ofmaximum possible output of the hear-ing aid. Tell the patient that he/shewill hear very loud sounds, but thosesounds will be very brief and theyshould not cause discomfort. Explainthat the REM system is set to preventexcessive sound levels, but ask the pa-tient to mention if any discomfort oc-curs.
4. Insert the earmold or shell of the hear-ing aid into the test ear, turn it on, andset the volume control and program-ming as desired. (Note: For true satura-tion response, showing the maximumpossible output, the volume controlshould be set to full-on, or to the high-est possible setting before audible feed-back.)
5. Set the REM system to display the out-put SPL, for short tone bursts at thehighest possible signal amplitude.
6. Obtain the RESR.
The reader will note that for REM systemsusing stored sound-field equalization, it ispossible to achieve signal amplitudes higherthan the maximum setting on the REM unit.To do this, first level the system in the nor-mal way. Now halve the working distance(move the loudspeaker halfway toward thepatient). The signal amplitude will now be6 dB higher than the setting shows. Halvingthe working distance again will increase thesignal amplitude by another 6 dB.
REMs of CROS and BICROS Hearing Aids
There are no standardized methods for real-ear testing Contraleteral Routing Of Signals(CROS) and Bilateral CROS (BICROS) instru-ments, yet the following special procedurescan serve as guidelines (see Chapter 9 in this
book and Chapter 16 of Dillon (2001) forstrategies for fitting CROS and BICROS in-struments).
CROS Head-Shadow Benefit
This procedure can demonstrate how well aCROS instrument overcomes the acousticshadow of the head for sounds arrivingfrom the poorer-ear side. (The REM systemallows the probe and reference microphonesto be placed on opposite sides of the head.Some REM systems may require a specialaccessory.)
1. Referring to Figure 3–25, with the open-ing of the probe microphone placed inthe ear canal of the better ear, and withboth the loudspeaker and the referencemicrophone13 placed on the poorer-earside, obtain and save an unaided mea-surement (REUR/G).
2. After placing the hearing aid receiver(turned on) into the better ear and thehearing aid microphone at the poorerear, obtain and save an aided measure-ment (REAR/G). The difference be-tween the aided and unaided measure-ments, the REIG, will show the netbenefit (to the better ear) for soundsoriginating from the poorer-ear side.
BICROS Head-Shadow Benefit
This procedure is similar to the proceduregiven above for CROS aids, but with somedifferences.
1. Referring to Figure 3–25, obtain an aidedmeasurement (REAR/G) with the open-ing of the probe microphone placed inthe ear canal of the better ear and boththe loudspeaker and the reference mi-crophone placed on the poorer-ear side.For this first measurement, keep thehearing aid microphone on the poorer-
13In Figure 3–25, the reference microphone is shownabove the poorer ear; the above-the-ear position is onlyan example. The procedure should use whatever is thenormal position of the reference microphone, althoughat the poorer ear.
12843.C03.PGS 3/8/02 11:02 AM Page 102

CHAPTER 3 � REAL-EAR MEASURES 103
ear side turned off (or unplugged). Savethis measurement as if it were an un-aided measurement, even though it isactually an aided measurement.
2. Now turn on (or plug in) the hear-ing aid microphone on the poorer-earside and obtain a second REAR/G, thistime saving it as an aided measure. Thecurve labeled “insertion gain” (eventhought it is not truly an REIG) willshow the net benefit to the better ear ofadding the microphone on the poorer-ear side, for sounds arriving from thepoorer-ear side.
Overall Insertion-Gain Measures forCROS and BICROS Instruments
Follow the normal REIG procedure givenearlier, but in setups that normally use a 45-degree azimuth for the loudspeaker, use ex-clusively 0 degrees for CROS and BICROSmeasurements. With BICROS, be sure bothhearing aid microphones are turned on.
FM Systems
When obtaining real-ear measures of an FMsystem or other similar assistive listening de-vice, one must alter REM procedures in twoways: (1) The reference microphone used forequalization and calibration must be placedat the location of the transmitting micro-phone of the FM system. This means that onemust be able to separate the reference micro-phone from the probe microphone, if theREM system uses concurrent equalization.(This alteration of procedure applies to all
real- ear measures of FM systems, such as theREAR/G and the RESR.) (2) For estimatingthe REAR/G for real-world speech signalsinto an FM system, one must use a highersignal level than for hearing aids, becausethe talker is usually very close to the trans-mitting microphone. Ideally, the amplitudeand spectral weighting of the signal shouldmatch those of the speech signals generallyencountered by the transmitting microphoneof an FM system. For a lapel-type transmit-ting microphone, the nominal level is ap-proximately 85-dB SPL. For a boom micro-phone, the nominal signal level is very muchgreater, so use the maximum signal levelavailable on the REM system. When possi-ble, use a speech-weighted signal and, whenapplicable, a signal whose speech weightinghas been compensated for the location of thetransmitting microphone in actual use.
Note: No consensus has been reached asto the best real-ear procedure to use for fit-ting FM systems, although the commonlyused clinical approach, at this time, is tomatch the performance of a patient’s FMsystem to that of the patient’s hearing aid,assuming the hearing aid has been properlyfitted and is working properly.
Directional Microphones
When obtaining REMs of hearing aids hav-ing directional microphones, testing withjust one direction of the sound source (i.e.,from 0- or 45-degree azimuth) does not pro-vide information regarding the directionalperformance these instruments. A possiblesolution would be to make one measure-
Figure 3–25. Setup for measuringhow well a CROS or BICROS hear-ing aid overcomes the head-shadoweffect. (Courtesy of Frye Electronics,Inc.)
12843.C03.PGS 3/8/02 11:02 AM Page 103
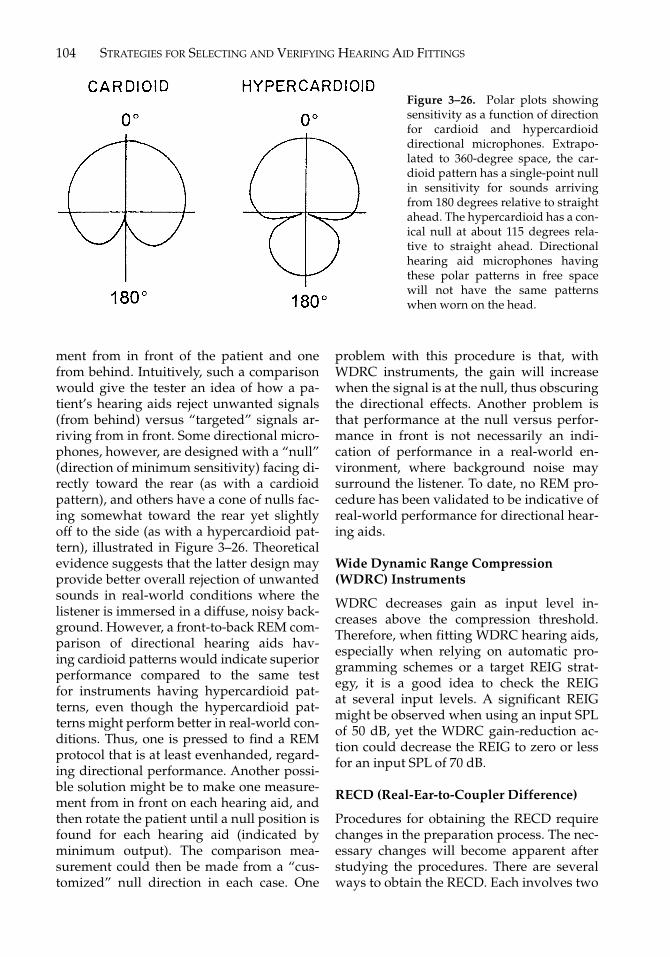
104 STRATEGIES FOR SELECTING AND VERIFYING HEARING AID FITTINGS
ment from in front of the patient and onefrom behind. Intuitively, such a comparisonwould give the tester an idea of how a pa-tient’s hearing aids reject unwanted signals(from behind) versus “targeted” signals ar-riving from in front. Some directional micro-phones, however, are designed with a “null”(direction of minimum sensitivity) facing di-rectly toward the rear (as with a cardioidpattern), and others have a cone of nulls fac-ing somewhat toward the rear yet slightlyoff to the side (as with a hypercardioid pat-tern), illustrated in Figure 3–26. Theoreticalevidence suggests that the latter design mayprovide better overall rejection of unwantedsounds in real-world conditions where thelistener is immersed in a diffuse, noisy back-ground. However, a front-to-back REM com-parison of directional hearing aids hav-ing cardioid patterns would indicate superiorperformance compared to the same testfor instruments having hypercardioid pat-terns, even though the hypercardioid pat-terns might perform better in real-world con-ditions. Thus, one is pressed to find a REMprotocol that is at least evenhanded, regard-ing directional performance. Another possi-ble solution might be to make one measure-ment from in front on each hearing aid, andthen rotate the patient until a null position isfound for each hearing aid (indicated byminimum output). The comparison mea-surement could then be made from a “cus-tomized” null direction in each case. One
problem with this procedure is that, withWDRC instruments, the gain will increasewhen the signal is at the null, thus obscuringthe directional effects. Another problem isthat performance at the null versus perfor-mance in front is not necessarily an indi-cation of performance in a real-world en-vironment, where background noise maysurround the listener. To date, no REM pro-cedure has been validated to be indicative ofreal-world performance for directional hear-ing aids.
Wide Dynamic Range Compression(WDRC) Instruments
WDRC decreases gain as input level in-creases above the compression threshold.Therefore, when fitting WDRC hearing aids,especially when relying on automatic pro-gramming schemes or a target REIG strat-egy, it is a good idea to check the REIGat several input levels. A significant REIGmight be observed when using an input SPLof 50 dB, yet the WDRC gain-reduction ac-tion could decrease the REIG to zero or lessfor an input SPL of 70 dB.
RECD (Real-Ear-to-Coupler Difference)
Procedures for obtaining the RECD requirechanges in the preparation process. The nec-essary changes will become apparent afterstudying the procedures. There are severalways to obtain the RECD. Each involves two
Figure 3–26. Polar plots showingsensitivity as a function of directionfor cardioid and hypercardioiddirectional microphones. Extrapo-lated to 360-degree space, the car-dioid pattern has a single-point nullin sensitivity for sounds arrivingfrom 180 degrees relative to straightahead. The hypercardioid has a con-ical null at about 115 degrees rela-tive to straight ahead. Directionalhearing aid microphones havingthese polar patterns in free spacewill not have the same patternswhen worn on the head.
12843.C03.PGS 3/8/02 11:02 AM Page 104

CHAPTER 3 � REAL-EAR MEASURES 105
measurements using the same signal. In gen-eral terms: (1) obtain the 2-cc coupler re-sponse of an insert earphone or hearing aid,and (2) obtain the real-ear response of thesame insert earphone or hearing aid. Theprocedures below use the “insertion-gain”facility of the REM system to obtain theRECD. Unless the REM system has soft-ware dedicated specifically to obtaining theRECD, it is convenient to use the insertion-gain software for this purpose, because, likethe REIG, the RECD involves calculating thedifference between two measures. If theREM system has dedicated RECD software,the manufacturer’s instructions will super-sede the procedures below. Check the manu-facturer’s instructions anyway, because eachREM system has unique qualities that couldalter the RECD procedure, often leading tosimplified procedures that may take less ofthe clinician’s time.
For REM systems that use the insertion-gain setup for RECD measurements (as inthe procedures given below), the facility nor-mally used to obtain the REUR/G is used in-stead to obtain the 2-cc coupler response ofthe insert earphone or hearing aid. Then, thefacility normally used to obtain the REAR/Gis used instead to obtain the real-ear re-sponse of the insert earphone or hearing aid.The difference between the two measures,what would normally be displayed as theREIG, will instead be the RECD. If one isusing the same insert earphone or hearingaid to obtain repeated RECD measurements,one will not need to remeasure the 2-cc cou-pler response for each RECD. If the REM sys-tem has the necessary facility, one can storethe 2-cc coupler response in memory andthen transfer the data to the REUR/G loca-tion of the REM system each time it isneeded, rather than measure it each time.
The sound source for the RECD procedurecan be a well-damped hearing aid in a soundfield, a well-damped hearing aid having adirect audio input (which is, in effect, an in-sert earphone with active signal processing),or any insert earphone whose source imped-ance resembles that of a well-damped hear-ing aid. Three RECD procedures are givenbelow. The first procedure uses an ER-3A
(a.k.a. E-A-RTone-3A) or other insert ear-phone as the sound source (Fikret-Pasa andRevit, 1992). Two special features are re-quired of the REM system for this proce-dure: the operator must be able to (1) disablethe reference microphone during measure-ments, and (2) disconnect the test signalfrom the loudspeaker and instead connectthe signal source to the insert earphone. ForREM systems not having these features, analternative procedure follows, which uses ahearing aid in a sound field instead of the in-sert earphone (Revit, 1991b). A third RECDprocedure is applicable exclusively for usewith fitting BTE hearing aids, and thereforeis especially applicable to working withyoung children (Moodie et al, 1994). Theseprocedures are intentionally generic, that is,not directly linked to one REM system or an-other. Variations will likely be required, de-pending on the specific features of the REMsystem being used.
RECD Procedure Using ER-3A(or E-A-RTone) Insert Earphone
part a: obtain the ha-1 2-cc couplerresponse
1. Set the REM system to measure “inser-tion gain.” Also set the REM system todisable the reference microphone dur-ing measurements, and, if possible, tooperate without equalization of the sig-nal source (a condition called “un-leveled” with some systems). With somereal-ear systems you may have to cir-cumvent the above requirement byequalizing the signal drive using the“substitution-method” mode of opera-tion, with the loudspeaker still attached.
2. Disconnect the loudspeaker from thesignal source of the REM system andinstead connect the insert earphone.
3. Using a darning needle, thread a probetube through the foam eartip of the in-sert earphone, so that the tip of theprobe tube extends 6 mm beyond thesound outlet of the eartip, as shown inFigure 3–27. Always be sure the probetube extends 6 mm (±1 mm) with thiscoupler measurement, even if you will
12843.C03.PGS 3/8/02 11:02 AM Page 105

106 STRATEGIES FOR SELECTING AND VERIFYING HEARING AID FITTINGS
use a different extension of the probetube for the real-ear measurement inpart B (doing so results in the tip of theprobe tube being placed near the bot-tom of the 2 cc cavity).
4. Place a mark on the eartip at the junc-tion between the main tube and theeartip tube, as shown in Figure 3–27.Throughout the procedure, be sure themark stays aligned in that position, soyou know that the probe tube has notchanged position relative to the soundoutlet of the eartip.
5. As you would an ITE hearing aid, affixthe eartip of the insert earphone, whichcontains the probe tube, to an HA-1 2-cccoupler (e.g., using putty), as shown inFigure 3–28a. Be sure that the probetube extends into the coupler. Beforeproceeding, check to see that the markon the probe tube is still properlyaligned with the junction of the ear-phone tube and the eartip.
6. Attach the coupler microphone to the 2-cc coupler, as if to perform a test-boxmeasurement. The coupler microphoneis not actually used in measurement,but provides the completion of the nor-mal coupler configuration.
7. Connect the probe tube to the probe mi-crophone of the REM system, takingcare not to shift the position of theprobe tube relative to the eartip.
8. Using any type of test signal, obtain the2-cc coupler response of the insert ear-phone. Use the same equipment opera-tions as for measuring the REUR. Before
capturing the measurement, adjust thesignal amplitude to produce approxi-mately 70-dB SPL in the coupler. Thiswill assure an undistorted measure-ment, and that when measuring thereal-ear response, the signal will be at acomfortable, yet measurable, level. (Notethat the signal level in the coupler willnot be calibrated to the amplitude set-ting displayed by the REM system.)
9. Record the measurement as the REUR,and, if applicable, store it in permanentmemory for future use.
part b: obtain the real-ear response
1. With the probe tube threaded through afoam eartip, as in steps 3 and 4 of Part A(do not yet connect the probe tube tothe probe microphone), roll and insertthe eartip, with the probe tube, into thetest ear, so that the lateral surface ofthe eartip aligns with the entrance tothe ear canal, as shown in Figure 3–28b.Alternately, use the anticipated depthto which the final hearing aid will be in-serted. Note that the dimensions shownin Figure 3–27 apply to the real-ear re-sponse for the average length of the earcanal of a female patient. For ear canalsthat are shorter than the female aver-age, one may have to decrease the in-sertion depth to avoid bumping theeardrum with the probe tube. For earcanals that are longer than the femaleaverage, one may have to increase theinsertion depth to ensure that the mea-surement point is close enough to the
Figure 3–27. Preparation for RECD measurement. Using a darning needle, the probetube was threaded through the foam eartip of an insert earphone. (Courtesy of Frye Elec-tronics, Inc.)
12843.C03.PGS 3/8/02 11:02 AM Page 106

CHAPTER 3 � REAL-EAR MEASURES 107
eardrum. For deep-insertion hearingaids, such as CIC fittings, use a muchshorter protrusion of the probe tube be-yond the eartip, as well as a deep inser-tion of the eartip, unless the REM sys-tem has a compensation built into thesoftware. Before proceeding, check tosee that the mark on the probe tube isproperly aligned with the junction ofthe earphone tube and the eartip. (Op-tionally, instead of threading the probetube through the eartip for obtainingthe real-ear response, one may place theprobe tube in the ear canal in the usualway, so that the tip is within 6 mm ofthe eardrum, and then roll and insertthe foam tip into the ear, taking care notto shift the position of the probe tube.)
2. Using precisely the same signal as usedto obtain the 2-cc coupler response, ob-tain the real-ear response of the insert
earphone. Use the same equipment op-erations as for obtaining the REAR foran insertion-gain measure.
3. Record the measurement as the REAR.The curve displayed as “insertion gain”is actually the RECD (the real-ear re-sponse minus the coupler response).
RECD Procedure Using a Hearing Aid in aSound Field
part a: obtain the ha-1 2-cc couplerresponse
Option 1If the REM system has a facility for usingtest-box measurements to estimate real-earmeasurements, follow these steps for Part A:
1. Choose a well-damped, “stock” BTEhearing aid having a broad frequencyrange and relatively low gain.
Figure 3–28. a: Coupler part of RECD measurement pair. Response of insert earphone ismeasured in a 2-cc coupler. (Courtesy of Frye Electronics, Inc.) b: Real-ear part of RECDmeasurement pair. Response of same insert earphone as in Figure 3–28a, using same sig-nal, is measured in the ear. (Courtesy of Frye Electronics, Inc.)
(a) (b)
12843.C03.PGS 3/8/02 11:02 AM Page 107

108 STRATEGIES FOR SELECTING AND VERIFYING HEARING AID FITTINGS
2. Using the same earmold or stock eartipas will be used for the real-ear response(Part B), affix the hearing aid with theearmold to an HA-1 coupler.
3. In the test box, adjust the signal ampli-tude until a coupler SPL of about 70 dBis reached. (This signal level will assurecomfort for the real-ear Part B.)
4. Obtain the 2-cc coupler response of thehearing aid. The only difference be-tween this measurement and a stan-dard (ANSI S3.22–1996b) test-box mea-surement of a BTE hearing aid is that astandard test-box measurement woulduse an HA-2 coupler with its earmoldsimulator instead of the HA-1 couplerand the actual earmold.
5. Transfer this curve to the “REUR” loca-tion of the REM system.
Option 2If the REM system does not have a facilityfor using test-box measurements to estimatereal-ear measurements, one would use thefollowing steps for Part A. The hearing aidwill be attached to the 2-cc coupler, whichthe clinician holds at the ear during a sound-field measurement:
1. Set the REM system to measure “inser-tion gain.”
2. Choose a well-damped, “stock” BTEhearing aid having a broad frequencyrange and relatively low gain.
3. Tape the volume control (or set the pro-gramming) of the hearing aid so thatthe gain is very low (perhaps 10 dB of 2-cc coupler gain).
4. Align a probe tube along the bore of theearmold (or stock eartip), such that thetip of the tube extends 6 mm beyondthe sound outlet of the earmold. (Do notyet connect the probe tube to the probemicrophone.) Always be sure the probetube extends 6 mm (±1 mm) with thiscoupler measurement, even when usinga different extension of the probe tubefor the real-ear measurement in Part B.Also, for the coupler measure only, anyvent in the earmold must be sealed.
5. Place a reference mark on the probetube, just laterally to the lateral surfaceof the earmold or eartip, or at any con-venient place for checking the positionof the probe tube relative to the ear-mold once they are in the ear.
6. With the tip of the probe tube protrud-ing 6 mm into the coupler and with thereference mark aligned as in the previ-ous step, affix the bore of the earmoldor eartip, along with the probe tube, toan HA-1 2-cc coupler (e.g., using putty).Before proceeding, check to see that thereference mark on the probe tube is stillin position.
7. Attach the coupler microphone to the 2-cc coupler, as if to perform a test-boxmeasurement.
8. Carefully connect the probe tube to theprobe microphone, taking care not toshift the position of the probe tube rela-tive to the earmold.
9. Place the reference microphone in thenormal position at the ear. If the refer-ence microphone and probe micro-phone have the same housing, care-fully hold the coupler/hearing aidapparatus at the ear while placing themicrophone housing at the ear in theusual way. If the reference and probemicrophone have separate housings,place the housing of the probe micro-phone in its normal place at the earwhile holding the coupler/hearing aidapparatus nearby.
10. While holding the coupler/hearing aidapparatus at the ear, place the BTEhearing aid over the ear, as it wouldnormally be worn, taking care not toshift the position of the probe tube rela-tive to the earmold.
11. Turn on the hearing aid.12. While holding the apparatus in place
near the ear, and with one’s hands asout of the way of the microphones aspossible, level the sound field (if ap-plicable) and measure the coupler re-sponse, as if measuring the REUR.(Hint: The clinician might want to kneelbehind the patient during leveling and
12843.C03.PGS 3/8/02 11:02 AM Page 108

CHAPTER 3 � REAL-EAR MEASURES 109
measurement, so as to be as acousti-cally out of the way as possible.)
13. Record this measurement as the REUR.
part b: obtain the real-ear response
Part B is used with both options of Part A.
1. If not already done, place a referencemark on the probe tube for real-earmeasurements in the usual way (e.g.,corresponding to the intertragal notch).
2. Attach the probe tube to the probe mi-crophone and place the probe tube inthe ear such that the tip lies within6 mm of the eardrum.
3. Insert the earmold or eartip, taking carenot to move the probe tube, and placethe housing of the hearing aid over theear.
4. Turn on the hearing aid and be sure thegain is set the same as for the 2-cc cou-pler measurement.
5. If applicable, equalize (level) the soundfield.
6. Using precisely the same signal as usedto obtain the 2-cc coupler response, ob-tain and record the real-ear response ofhearing aid (the REAR). The curve dis-played as “insertion gain” is actuallythe RECD (the real-ear response minusthe coupler response).
RECD Procedure for BTEs (Using HA-2Coupler and Insert Earphone)14
part a: obtain the ha-2 2-cc couplerresponse
1. Set the REM system to measure “inser-tion gain.” Also set the REM system todisable the reference microphone, and tooperate without equalization of thesignal source (a condition called “un-leveled” with some systems). With some
real-ear systems it may be necessary tocircumvent the above requirement byequalizing the signal drive using the“substitution-method” mode of opera-tion, with the loudspeaker still attached.
2. Disconnect the loudspeaker from thesignal source of the REM system andinstead connect the insert earphone.
3. By whatever means available, obtain theHA-2 2-cc coupler response of the insertearphone. With some REM systems, onecan use the normal coupler microphoneto obtain this measure, but one must besure the system allows the transfer ofthe coupler curve to the REM software.If one instead is using the probe micro-phone to measure the HA-2 response,one must have a means of positioningthe tip of the probe tube inside the cou-pler, within 3 mm of the bottom of the 2-cc cavity. With some REM systems, onecan position the tip of the probe tube in-side the coupler by using an adapterthat is normally used in calibrating theprobe tube. The adapter, which has achannel through which to feed theprobe tube, can be fitted to the bottomof the coupler in place of the normalcoupler microphone. With other REMsystems, the HA-2 coupler has a venthole large enough to accommodate aprobe tube (see Moodie et al, 1994).With the RECD procedures using theHA-1 coupler, given earlier, the probetube was threaded through the openingat the top of the coupler. This is not pos-sible with an HA-2 coupler.
4. Obtain and record the coupler responseof the insert earphone as if it were theREUR.
part b: obtain the real-ear response,using the patient’s earmold
1. Instead of using the normal eartip, con-nect the sound outlet (main tube) of theinsert earphone to the tubing of the pa-tient’s custom earmold.
2. Mark and position the probe tube, as ifto obtain the REAR of a hearing aid. Butinstead of measuring a hearing aid, the
14Some REM systems let the clinician use this proce-dure in fitting ITEs, ITCs, and CICs, as well as BTEs.With these systems, software-applied corrections com-pensate for the differences between the HA-2 and theHA-1 couplers, and, in the case of CICs, for the as-sumed deep insertion of the CIC in the ear canal.
12843.C03.PGS 3/8/02 11:02 AM Page 109

110 STRATEGIES FOR SELECTING AND VERIFYING HEARING AID FITTINGS
clinician will be measuring the real-earresponse of the insert earphone, yet de-livered through the patient’s own ear-mold.
3. Obtain and record the real-ear responseof the insert earphone, delivered via thepatient’s earmold, as if to record anREAR. The curve displayed as “inser-tion gain” will actually be the HA-2RECD (the real-ear response minus thecoupler response).
REDD (Real-Ear-to-Dial Difference)
Obtaining this measure requires that theREM system and the earphones of an au-diometer are located near to each other inthe same room.
1. Set the REM system so that the probe-tube microphone serves as a sound-level meter (i.e., so that it continuouslymonitors dB SPL).
2. Mark and place the probe tube in theear in the normal way.
3. While taking care not to disturb the po-sition of the probe tube, place the au-diometric earphone on or in the ear, asapplicable. Note: When using insertearphones, one can thread the probetube through the foam eartip, as wasdescribed in the first RECD procedure,above.
4. Set the audiometer dial for 70 dB HL.5. For each audiometric frequency deliv-
ered at 70 dB HL, record the real-earSPL.
6. Subtract 70 dB from the dB SPL readingfrom the probe-tube microphone foreach frequency. These values constitutethe REDD.
Circle of Decibels
Aside from providing a means of directlychecking the in situ performance of hearingaids (see Chapters 6 to 10), real-ear measurescan provide individualized conversion fac-tors that let the audiologist transfer patientdata from one decibel system to another. Inthe course of a hearing aid fitting, the clini-
cian may encounter three decibel systems:the hearing evaluation is observed in termsof dB HL, the hearing aid prescription isgiven in terms of dB SPL or gain in a 2-cccoupler, and the acoustic part of the fittingverification is observed in terms of dB SPLor gain at the eardrum of the wearer. Each ofthese decibel systems has advantages for itsintended application. Yet in considering themany phases of hearing aid fittings, clini-cians may find it useful to have a means ofconverting data from one decibel system toanother. Computer-driven equipment usedin hearing aid fitting (e.g., audiometers, testboxes, and REM systems) often provides suchconversions internally to the equipment. Yeteven if performed within the software of clin-ical equipment, the clinician should be awareof the processes and limitations involved inapplying those conversions.
The “circle of decibels” (Fig. 3–29) is a vi-sual aid to understanding how the three deci-bel systems used in hearing aid fitting are re-lated (Revit, 1997). Eardrum SPL occupies theuppermost position. Ultimately, every acous-tic consideration regarding a hearing aid fit-ting culminates at the eardrum. Connectingeardrum SPL with 2-cc SPL and with dB HLare two real-ear measures described earlier,the RECD and the REDD. The RECD andREDD are of a special class of measures,called “transforms” because, when applied toa set of data, they transform the data from onedecibel system to another. A third transform,the 2-cc/DD (2-cc coupler to audiometer dialdifference), connects 2-cc SPL with dB HLalong the bottom of the circle. The 2-cc/DD isnot a real-ear measure; it is a known, stan-dard set of values used for calibrating an au-diometer for use with insert earphones (e.g.,ANSI S3.6–1996a). In ANSI S3.6, these cali-bration values are called reference earphonesound pressure levels (RETSPLs). Here theyare called “2-cc/DD” so as to avoid confusingthe RE of REMs with the RE of RETSPLs. Fig-ure 3–30 repeats the circle of decibels, but thistime with instructions on how to use thetransforms to get from one decibel system tothe next. The rules are as follows: when mov-ing from top to bottom or from left to right on
12843.C03.PGS 3/8/02 11:02 AM Page 110

CHAPTER 3 � REAL-EAR MEASURES 111
the circle, the transform is subtracted; whenmoving from bottom to top or from right toleft, the transform is added. For example, intransforming data from dB HL to eardrumSPL, the REDD is added to the dB HL values.But it is equally correct to add the 2-cc/DDand then add the RECD. A study reported byScollie et al (1998) confirmed that the two al-ternate paths between dB HL and dB SPL arevirtually equivalent. If, for example, a pa-
tient’s RECD is already on hand but not theREDD, the clinician can use the alternatetransformation path, interchangeably.
In addition to estimating eardrum SPLfrom hearing-test data in the form of dB HL,another valuable use of the circle of decibelsis to estimate real-ear performance (eardrumSPL) from 2-cc coupler measurements. Afterperforming just one real-ear measurement,either the RECD or the REDD, the clinician
Figure 3–29. The circle of decibels.Shows three decibel systems usedin hearing aid fittings (within hori-zontal ovals) and the transforms formaneuvering between them (withincircular band).
Figure 3–30. The circle of de-cibels, with arrows showingwhether to add or subtract agiven transform when maneu-vering from one decibel systemto the next. The rule is to subtractwhen moving downward orfrom left to right on the circle;add when moving upward orfrom right to left on the circle.
12843.C03.PGS 3/8/02 11:02 AM Page 111

112 STRATEGIES FOR SELECTING AND VERIFYING HEARING AID FITTINGS
can conveniently do all testing and tuning ofthe hearing aid in the test box, with an accu-rate eye on real-ear performance.
Table 3–3 summarizes all the possiblepaths around the circle of decibels. The take-home message of Figure 3–30 and Table 3–3is that as long as a clinician has either theRECD or the REDD, one can easily trans-form data from any of the three decibel sys-tems to any other of the three. And it can bedone with a high degree of precision, be-cause both the RECD and the REDD are in-dividualized real-ear measures. So one real-ear measurement, either the RECD or theREDD, is all that is required to get aroundthe circle of decibels.
When using the circle of decibels to esti-mate eardrum SPL from 2-cc coupler data, itis important to remember that the effects ofthe acoustic coupling of the patient’s ear-mold or shell should not be part of the esti-mate, unless one is fitting a BTE and one isusing the BTE/HA-2 method for obtainingthe RECD. In any case, venting effects can-not be accurately predicted using RECDs.
When using the circle of decibels to esti-mate an RESR from an OSPL90 2-cc couplermeasurement, one simply adds the RECD tothe OSPL90 to get the estimated RESR. Butto estimate an REAR from a 2-cc couplermeasure, one must add not only the RECD,but also the presumed acoustic gain seen bythe hearing aid microphone because of its lo-cation at the ear (Table 3–4). At low frequen-
cies, these acoustic-gain effects are negligi-ble; and at high frequencies, the magnitudeof the acoustic-gain is generally low, about 3dB for BTEs (Bentler and Pavlovic, 1989,1992), increasing to 8 dB for CICs (Cornelisseand Seewald, 1997). However, when observ-ing the REARs of hearing aids that are incompression, one must first divide the mi-crophone-location effects by the compres-sion ratio, before adding them to the RECD.So with high compression ratios (3:1 orgreater), microphone-location effects will beminimal. Microphone location effects, how-ever, will directly affect the compressionthreshold on a dB-for-dB basis.
Using the circle of decibels to estimate theeardrum SPL from 2-cc SPL is particularlyhelpful and effective with young children,who do not easily sit quietly and in placeeven for the brief period of time required forreal-ear measures. When fitting BTEs, usethe BTE/HA-2 RECD method for the mostvalid and reliable results (Sinclair et al,1996). See Table 3–2 for average RECDs inchildren of various ages, data that can beused when no individual real-ear measure-ment is possible.
When using the circle of decibels to esti-mate the eardrum SPL of CICs from 2-ccSPL, one must account for the fact that theinsertion depth of a CIC is much deeper thanthat of other hearing aids or of audiometricinsert earphones. Deeper insertion will in-crease the relative eardrum SPL, for equal
Table 3–3. Comprehensive Instructions for Navigating the Circle of Decibels
If You Have And You Want Direct Path Long Way Around
dB HL Eardrum SPL Add the REDD Add the 2-cc/DD and add the RECD
dB HL 2-cc SPL Add the 2-cc/DD Add the REDD and subtract the RECD
2-cc SPL Eardrum SPL Add the RECD Subtract the 2-cc/DD and add the REDD
2-cc SPL dB HL Subtract the 2-cc/DD Add the RECD and subtract the REDD
Eardrum SPL 2-cc SPL Subtract the RECD Subtract the REDD and add the 2-cc/DD
Eardrum SPL db HL Subtract the REDD Subtract the RECD and the 2-cc/DD
12843.C03.PGS 3/8/02 11:02 AM Page 112

CHAPTER 3 � REAL-EAR MEASURES 113
electrical signal drive levels to an insert ear-phone. Either one must use a deeply in-serted earpiece to obtain the patient’s RECDdata, or else one must apply an average-eartransform between normal insertion anddeep insertion (Table 3–5). Some REM sys-tems can apply such a transform in software.
Coupler Response for Flat Insertion Gain (CORFIG)
An older cousin of the circle of decibels isCORFIG, the transform used to convert
insertion-gain targets to 2-cc coupler gainprescriptions. Its inverse (sometimes called“GIFROC”) is used to estimate REIG perfor-mance from 2-cc coupler measures. Figure3–31 shows how CORFIG is applied. Whenconverting a target REIG to a 2-cc couplerprescription, one adds the appropriate COR-FIG to the target REIG. To estimate the REIGfrom 2-cc coupler measures, one subtractsthe CORFIG from the 2-cc coupler data. Ap-plying a CORFIG to an REIG-based fittingstrategy is similar to applying the circle ofdecibels to an REAR-based fitting strategy
Table 3–4. Average Hearing Aid Microphone Location Effects for Various LoudspeakerAzimuths and Field Reference Points
Frequency 250 500 750 1000 1500 2000 3000 4000 6000 8000
0°, center of headBTE* 1 1 1 0 2 4 3 4 0 3ITE* 1 2 2 2 0 4 4 4 2 1ITC* 0 0 0 1 �2 2 4 6 2 �2CIC† 0 0 0 1 2 3 6 8 4 �645°, over the earBTE‡ — — — — — — — — — —ITE‡ 0 1 1 1 1 3 2 5 5 2ITC‡ 0 1 1 1 1 3 3 9 8 5Diffuse, center
of headBTE§ 1 1 1 2 3 3 3 3 3 3ITE§ 1 1 1 2 2 3 4 5 5 6ITC§ 0 2 2 2 3 4 6 8 8 6CIC|| 1 1 2 2 3 4 7 10 9 7
*Data from Bentler and Pavlovic (1989).†Data from Cornelisse and Seewald (1997).§Data from Bentler and Pavlovic (1992).||Data from Killion et al (1987).‡Data from Frye Electronics, Inc. Tigard, OR.
Table 3–5. Average 2-cc Coupler RECDs for Normal and Deep (CIC) Insertion
Frequency 250 500 750 1000 1500 2000 3000 4000 6000 8000
Average RECD 4 4 4 5 7 8 10 12 15 15normal*:
Average RECD 6 8 10 11 13 14 17 20 23 23deep†:
Correction for 2 4 6 6 6 6 7 8 8 8CIC:
*Data from Bentler and Pavlovic (1989).
†Data from Seewald et al (1997).
12843.C03.PGS 3/8/02 11:02 AM Page 113

114 STRATEGIES FOR SELECTING AND VERIFYING HEARING AID FITTINGS
(see Chapters 6 to 10). Both transforms in-clude the RECD and the effects of the loca-tion of the hearing aid microphone. Yet be-cause REIG includes both REAG and REUG,CORFIG also includes the REUG. Specifi-cally:
1. CORFIG = REUG - RECD - HA micro-phone-location effects.
2. Prescribed 2-cc coupler gain = TargetREIG + CORFIG.
3. Estimated REIG = 2-cc coupler gain -CORFIG.
The REUG, as well as the effects of the lo-cation of the hearing aid microphone, are di-rection-dependent at high frequencies. SoCORFIGs will vary with varying locations ofthe sound source used in obtaining these ele-mental measures. A “diffuse” sound sourcehas sound coming equally from all direc-tions, and so a diffuse-field CORFIG is es-sentially the average CORFIG for all pos-sible sound sources. Figure 3–32 showsdiffuse-field CORFIGs for the average adultear, from Killion, et al (1987). Table 3–6 givesthe same data in numerical form as well as
average CORFIG values for 0 and 45 de-grees.
As with using the circle of decibels to pre-scribe 2-cc coupler SPL from a target REAR(eardrum SPL), it is important to rememberthat using CORFIG to prescribe 2-cc couplergain from a target REIG will not accountfor earmold coupling effects, unless theBTE/HA-2 method is used in obtaining theRECD. Even then, precise, individual esti-mates of venting effects cannot be made. Asa compromise, Table 3–7 provides averageventing corrections to use when prescribing2-cc coupler gain from a target REIG. Addthese corrections to the prescribed 2-cc cou-pler response, as applicable.
For a broader discussion of CORFIG, seeKillion and Revit (1993) and Revit (1994).
General Considerations in REMs
Display Considerations: InterpretingWhat’s on the Screen
Today’s REM equipment offers severalchoices of display environments. Typically,
Figure 3–31. Coupler response forflat insertion gain (CORFIG). Showswhether to add or subtract the ap-propriate CORFIG when maneu-vering between REIG and 2-cc cou-pler gain.
Figure 3–32. Diffuse-fieldCORFIGs for various hearingaid types: BTE (solid), in-the-ear (ITE) (thin dashes), in-the-canal (ITC) (dots), andcompletely-in-the-canal (CIC)(thick dashes). (Reprintedwith permission from KillionMC, Berger EH, Nuss RA. Dif-fuse field response of the ear. JAcoust Soc Am 1987;81(suppl1):S75, Acoustical Society ofAmerica.)
12843.C03.PGS 3/8/02 11:03 AM Page 114

CHAPTER 3 � REAL-EAR MEASURES 115
REMs are displayed in either REIG, HL-O-Gram, and SPL-O-Gram screens. Figure 3–8shows a typical REIG screen. The lower graphshows the REAG and REUG curves. Theupper graph shows the difference betweenthe two lower curves (the REIG) as well as aprescriptive REIG target for comparison.
Figure 3–33 shows real-ear data in a differ-ent fashion. An audiogram graph displaysthe patient’s thresholds, as well as estimatesof aided thresholds based on REAG mea-surements.15 Also shown on this HL-O-Gram is a “speech banana” and articulationindex calculations for unaided and aidedconditions. It is also possible to show a tar-get-aided threshold curve based on a pre-scriptive formula (not in this example).
Figure 3–34 shows yet another form ofreal-ear display, the SPL-O-Gram. The verticalaxis is sound pressure level at the eardrum. Inthis example, the patient’s hearing thresholdsare indicated with “T”s, and uncomfortableloudness levels (UCLs) with “U”s. The thick
curve is a target derived for a speech-weighted signal from the National AcousticsLaboratories “revised-profound” (NAL-RP)fitting formula. The lower curve, labeled withnumeral ones, is the patient’s REUR, mea-sured with a speech-weighted composite sig-nal at 65-dB SPL. The curve labeled with nu-meral “2”s is an REAR using the same signal.The “3”s indicate the RESR, measured withshort tone bursts at 90-dB SPL. According tothese results, the gain of the patient’s hearingaid is only marginally adequate, because theREAR values lie only just above the thresh-olds, and only at 2000 Hz and below. Also, the
Table 3–6. Average CORFIG Values for 0 Degrees, and Diffuse Incidences of the SoundSource: For GIFROC values, Simply Change the Sign of Each Number
Frequency 250 500 750 1000 1500 2000 3000 4000 6000 8000
0° BTE* �4 �4 �3 �3 �3 0 3 �2 �8 �1645° BTE† �1 0 �1 �2 �1 4 4 3 �1 �8Diffuse BTE‡ �3 �3 �3 �3 �2 1 3 �2 �8 �130° ITE* �4 �4 �4 �4 �1 0 2 �2 �8 �1445° ITE† �1 �1 �2 �2 �2 2 3 �2 �6 �10Diffuse ITE‡ �3 �3 �3 �3 �2 1 2 �4 �10 �150° ITC* �3 �2 �2 �4 �1 2 1 �4 �10 �1145° ITC† �2 �1 �2 �3 �2 1 1 �7 �9 �13Diffuse ITC‡ �3 �3 �3 �3 �2 1 0 �8 �1 �15CIC‡§ �6 �6 �7 �7 �7 �5 �7 �16 �22 �24
Note: The values in the table are rounded to the nearest dB; some values are interpolated.
*Data from Bentler and Pavlovic (1989) (free field reference).†Data from Killion and Revit (1993) (over-the-ear reference).‡Data from Killion et al (1987) (center-of-head reference).§The diffuse-field CIC values apply for all sound-source angles because the direction-dependent variables cancel inboth the CORFIG calculation and the REIG measurement.
Table 3–7. Average Vent Corrections for CORFIGPrescriptions of 2-cc Gain from a Target REIG
Frequency 250 500 750 1000 1500
Tight seal — — — — —Slit leak 2 2 1 — —1 mm 1* 2* 1 — —2 mm 7* 1* — — —Long open 17* 10* 4* 1* —Short open 26* 21* 14* 10* 5*
Add these values to the prescribed 2-cc coupler gain to achievethe desired insertion gain. Use starred values only if the pre-scribed insertion gain is greater than 0 dB at that frequency.Otherwise, use no correction. Blanks indicate use no cotrrec-tion. A slit leak assumed for all vent conditions except “tightseal”. (Derived from Dillon, 1991.)
15The formula for estimating an aided sound-fieldthreshold using REAG measurements is: Aided sound-field threshold = Insert-phone threshold + (IndividualRECD2cc � Average RECD2cc) � (REAG � AverageREUG).
12843.C03.PGS 3/8/02 11:03 AM Page 115

Figure 3–33. HL-O-Gram REM display. REM data are presented in terms of HL. Solidcurve without numbers is the patient’s threshold audiogram. Curves with numbers repre-sent estimated aided thresholds, based on REARs for three hearing aid settings or threesignal levels. Estimates of the articulation index (AI) are given for each curve.
Figure 3–34. SPL-O-Gram REM display. REM data are presented in terms of dB SPL atthe eardrum. In this example, the patient’s thresholds are shown as “T”s, the uncomfort-able loudness levels (UCLs) as “U”s. A target curve (bold) was derived using the NationalAcoustics Laboratories (NAL) formula. Three real-ear measures are shown. Lower thincurve (with “1”s) is the REUR using a speech-weighted composite signal at 65-dB SPL.Upper thin curve (with “2”s) is the REAR using the same signal; “3”s indicate the RESRmeasured with brief tone bursts.
116 STRATEGIES FOR SELECTING AND VERIFYING HEARING AID FITTINGS
12843.C03.PGS 3/8/02 11:03 AM Page 116

CHAPTER 3 � REAL-EAR MEASURES 117
RESR values at the high frequencies reachthe patient’s UCLs, so the maximum outputof this hearing aid should be adjustedslightly down in the high frequencies, to pro-vide a margin for comfort.
The display in Figure 3–34, and in all theother REM curves presented thus far exceptfor Figure 3–33, are presented in standard-ized (ANSI, 1996b) aspect ratios. The aspectratio determines the “look” of a given curve.Specifically, it determines the vertical dis-placement corresponding to a given hori-zontal displacement. The aspect ratio forfrequency-response graphs is designated interms of the number of decibels on the verti-cal axis corresponding to a range of fre-quency on the horizontal axis. ANSI S3.22(ANSI, 1996b) recommends an aspect of 50decibels per decade of frequency when spec-ifying hearing aid performance characteris-tics. That is, for the length on the frequencyscale (x-axis) corresponding to a 10-fold
change in frequency (a decade), that samelength on the decibel scale (y-axis) corre-sponds to a 50-decibel change in amplitude.This is the aspect ratio used in Figure 3–34.For audiograms, ANSI S3.6 (ANSI, 1996a)specifies an aspect ratio of 20 decibels peroctave of frequency. This is the aspect ratioused in the HL-O-Gram of Figure 3–33.
The real-ear performance of a hearing aidcan have differing appearances when viewedon displays having differing aspect ratios. InFigure 3–35, the lower graph uses an aspectratio of 50 decibels per decade, while theupper graph uses an aspect ratio of about 100decibels per decade. The higher the decibelfigure in the aspect ratio, the more shalloware the peaks and valleys in a curve. Thus, thereduced vertical displacement of the uppergraph serves to smooth the peaks and valleysof the REIG, as compared with the REIG inthe lower graph. Smoothing (as describedearlier) can either enhance the clarity or
Figure 3–35. Effect of aspect ratio. An REIG was measured twice for the same patient,same hearing aid, using two different REM systems. The data in the lower graph are dis-played using conventional (ANSI, 1996b) aspect ratio for hearing aids (50 dB/decade);data in the upper graph are displayed using an aspect ratio of about 100 dB/decade.
12843.C03.PGS 3/8/02 11:03 AM Page 117

118 STRATEGIES FOR SELECTING AND VERIFYING HEARING AID FITTINGS
“readability” of a curve (as in Figure 3–15), orit can obscure the impact of amplitude devia-tions in a measurement. Thus, it is importantfor the clinician to be aware of aspect ratiosand other smoothing characteristics whenviewing hearing aid performance graphs,both in the clinic and in the literature.
Sources of Variability in Real-Ear Measures
Several factors can contribute to within-subjects variability in real-ear measures.Table 3–8 lists many of them. Despite thesepossible sources of variability, when real-eartechniques are applied with care, reliableresults can be expected. For the techniquesdescribed in this chapter, the clinician can
expect the variability between test and retestto be on the order of 5 dB through 4000 Hz.This estimate of within-subjects variability isbased on multiplying the standard devia-tions shown in Figure 3–22 by two, thus giv-ing the 95% confidence intervals for REIGmeasures. For a comprehensive discussion ofacross-subjects variability in real-ear mea-sures, see de Jonge (1996).
Hazards to the Patient in Clinical Real-Ear Measurements
The hazards to the patient in clinical real-earmeasurements are few. Indeed, the risks of notobtaining REMs in the course of hearing aidfittings may be greater than the risks of ob-taining them. Sending a new hearing aid
Table 3–8. Sources of Variability in Real-Ear Measures
Source of Variability Study
Change in placement of the hearing aid across measurements Killion, 1983Movement of probe microphone inlet between unaided and aided Ringdahl and Leijon, 1984
measurements (for REIG)Change in position of probe microphone across measurement pairs Ringdahl and Leijon, 1984Movement of subject’s head during or between measurements Ringdahl and Leijon, 1984Room acoustics—reflections, etc. Ringdahl and Leijon, 1984Deformation of probe tube Dillon and Murray, 1987Equipment noise Dillon and Murray, 1987Change in level to the hearing aid Hawkins and Mueller, 1986Carelessness by the clinician Hawkins, 1987Improper seating of earmold or shell Hawkins, 1987Environmental noise in the room Revit, 1987Diffraction effects of head ornaments, jewelry, measuring apparatus Revit, 1987
(housings of probe and reference mics, etc.)Change in insertion depth of eartip, when not a custom earmold Revit, 1987Change in density and arrangement of hair in the vicinity of the ear Revit, 1987Change in loudspeaker placement Revit, 1987Change in hearing aid output/gain Revit, 1987Change in body posture Revit, 1987Cerumen—change in ear canal impedance and/or blockage of Revit, 1987
probe tubeNoises made by the patient (external and/or internal) Revit, 1987Leaks between earmold and probe tube Tecca et al, 1987Change in field reference point Ickes et al, 1991Varying degrees of slit leak caused by the presence of the probe tube —
between the earmold and the wall of the ear canal
12843.C03.PGS 3/8/02 11:03 AM Page 118

CHAPTER 3 � REAL-EAR MEASURES 119
wearer out the door with hearing aids that arenot producing the expected real-ear resultscan easily lead to rejection of amplification bythe patient. Obtaining a quick set of real-earmeasurements can prevent this result.
In any clinical procedure, there may besome hazards that are predictable and othersthat are not. The predictable hazards ofREMs lie in two categories: (1) excessive SPLin the ear canal, and (2) contact of the probetube with the eardrum. Both can cause dis-comfort and, although unlikely, both can bedamaging to the patient.
Excessive SPL in the ear canals can occureither when the amplitude of the input sig-nal is high or when the gain of the hearingaids is high. In particular, the risk of exces-sive ear canal SPLs is greatest when makingRESR measurements with high-gain hearingaids. For example, if the input signal is 90-dB SPL (typical for obtaining the RESR) andthe acoustic gain of the hearing aids is 55 dB,then it is possible to have an SPL of 145 dB inthe ear canals during testing. Excessive SPLin the ear canals resulting from signals con-trolled by REM equipment during measure-ments can be avoided if, before turning onthe signal, the clinician ascertains that theoutput limiting of the REM system is set toan appropriate amplitude. Note: This safe-guard works only when the probe micro-phone is in the ear canal and is active.
The probe tubes used in REM systems aregenerally very flexible and normally will notcause damage if brought into contact with ahealthy eardrum. But if a probe tube comesinto contact with a patient’s eardrum, it islikely that the patient will be slightly star-tled or will feel some discomfort. Many pa-tients will not tolerate repeated contact of aprobe tube with the eardrum.
Some probe tubes are more flexible thanare others. Moreover, as the length of the ex-posed portion of a probe tube decreases, theability of the tube to bend or buckle de-creases, thus making the tube effectivelystiffer. For example, when a hearing aid orinsert earphone is present along with aprobe tube in an ear canal (e.g., Fig. 3–28b),the relatively small length of tubing extend-
ing beyond the earpiece is effectively stifferthan when no earpiece is present (e.g., Fig.3–13). When inserting an earpiece into an earcanal with a probe tube already in place, usecare (such as by holding the tube with yourfinger) to see that the earpiece does not dragthe probe tube toward the eardrum as youinsert the earpiece.
When fitting deep-canal (CIC) hearingaids, or when fitting hearing aids on smallchildren, small residual ear canal volumeslead to increased ear canal SPLs as com-pared with 2-cc coupler SPLs. Thus, the clin-ician is strongly advised to obtain RESRmeasures (or to estimate the RESR from the2-cc coupler OSPL90 by adding the RECD16)in such cases, to prevent excessive ear canalSPLs from occurring once the patient leavesthe clinic. For the same reason, extra caremust be taken in such cases to avoid exces-sive ear canal SPLs during clinical RESR pro-cedures.
Conclusion
With the growing availability of “automaticfitting” software associated with program-mable hearing aids, a growing number ofclinicans are skipping the necessary stepof measuring real-ear performance beforesending patients on their way (S. Jelonek,personal communication). Although ongo-ing improvements in hearing aid compo-nents and circuitry provide the potential forcontinued improvements in the auditorylives of hearing aid wearers, audiologistsshould not overlook the step of verifying,through REIG measures, the simple goal ofseeing that a patient’s hearing aids amplifyconversational speech to levels that exceedthe levels provided by the patient’s unaidedears.
Toward the future, we look for broader so-phistication in real-ear measures. Better testsignals, which better represent real-worldconditions both in signal and in noise back-
16See the section on the circle of decibels, and Table3–3, in this chapter.
12843.C03.PGS 3/8/02 11:03 AM Page 119

120 STRATEGIES FOR SELECTING AND VERIFYING HEARING AID FITTINGS
grounds, should provide better clinical as-sessments of potential real-world perfor-mance. Improved probe microphones, thatare electrically less noisy and that are me-chanically and/or acoustically less obtru-sive, should provide measurements that aremore accurate.
Appendix: Rationale for Pseudo-REIG:Using the Average-Ear REUG inInsertion-Gain Applications
Audiometric thresholds expressed in dB HLare behavioral measures referred to theacoustically average, normal ear. In otherwords, for the acoustically average, normalear, thresholds obtained either in a soundfield, or using insert earphones, or usingsupra-aural earphones, would all be 0 dBHL. With due consideration to the fact thatdB HL threshold norms ultimately are alltraceable to minimum audible pressuresat the eardrum, it follows that earphonethreshold measures (which occlude the ear,thereby extinguishing the effect of theREUG) implicitly carry the assumption of anaverage transform from the free-field to theeardrum (an average REUG), as well as anaverage middle-ear impedance (implying anaverage RECD) (Revit, 1996). Further, be-cause hearing aids, in general, occlude theears in which they are placed, individualREUGs are not part of the signals that hear-ing aids deliver to eardrums, but RECDsare. Consequently, introducing individualREUGs into insertion-gain prescriptions orverifications based on earphone thresholdsintroduces an extraneous variable. The indi-vidual RECD remains in the picture, how-ever, because it plays a role in both the ear-phone thresholds and the REAG. For theskeptical, a mathematical proof follows.
First, it must be agreed that insertion-gainprescriptions are based on the notion offunctional gain, which implies improvedaided sound-field thresholds or sensationlevels. As stated above, for the acousticallyaverage ear (having an average REUG andRECD), thresholds in dB HL would be the
same under any measurement condition(earphone or sound field). So let the termAvg.HTL represent the hearing thresholdlevel (HTL) for an individual having theacoustically average ear (that person’s thresh-olds are assumed to be whatever they are, de-termined by the condition of one’s inner andmiddle ears). Now, for the individual nothaving the acoustically average ear, the un-aided sound-field (USF) threshold would bealtered by the difference from average in theREUG, or
USFHTL = Avg.HTL � (REUG �Avg.REUG). (1)
Notice that when the REUG equals the aver-age, the right-most term cancels out, and
USFHTL = Avg.HTL.
The functional-gain approach says that theaided sound-field threshold equals the un-aided sound-field threshold minus the func-tional gain, or
ASFHTL = USFHTL � Functional Gain. (2)
And by the equivalence of insertion gain tofunctional gain,
ASFHTL = USFHTL � REIG, orASFHTL = USFHTL � (REAG � REUG). (3)
Substituting the right side of equation 1 forUSFHTL in equation 3,
ASFHTL = Avg.HTL � (REUG �Avg.REUG) � (REAG � REUG).
The REUG terms cancel out, leaving
ASFHTL = Avg.HTL � (REAG �Avg.REUG). (4)
By definition17, equation 4 can be rewritten as
ASFHTL = Avg.HTL � Pseudo-REIG. (5)
Now, for earphone thresholds on any ear,the ear is occluded, and so, similarly toequation 1,
17Define “Pseudo-REIG” as REAG minus Avg.REUG.
12843.C03.PGS 3/8/02 11:03 AM Page 120

CHAPTER 3 � REAL-EAR MEASURES 121
Earphone HTL = Avg. HTL �(RECD � Avg.RECD). (6)
After solving equation 6 for Avg.HTL andsubstituting the result in equation 5,
ASFHTL = Earphone HTL �Pseudo-REIG + (RECD � Avg.RECD). (7)
The aided sound-field threshold equalsthe earphone threshold in dB HL, minus thepseudo-real-ear insertion gain, plus the dif-ference from average in the RECD. Thus, it isseen that use of the average-ear REUG as areference condition for REIG leads to esti-mates of real-ear gain that are more accuratethan the traditional approach, which usesthe individual REUG (see Table 3–9 for adultaverage REUG values).
As an example, assume someone has col-lapsed ear canals that decrease the REUGsfrom the normal 15 dB at 3000 Hz down to 0dB (not unusual, because the small, remain-ing slits at the ear canal openings effectivelydampen the ear canal resonances). Let’s as-sume hearing threshold levels are measuredusing insert earphones, and they are foundto be 50 dB HL, bilaterally. Let’s further as-sume that the individual’s ears have averageRECD values, and therefore the impedanceloading of the insert earphones is exactly theaverage, leading to minimum audible pres-sures at the eardrums that are exactly theaverage for the measured hearing levels. Fi-nally, for this example let’s assume the FIG6fitting procedure is being used, which wouldprescribe 30 dB of REIG for low-level sig-nals, to bring the patient’s aided sound-fieldthresholds at 3000 Hz to 20 dB HL.
Now, as part of conscientious fitting prac-tice, the patient’s individual REUGs are in-cluded in the CORFIGs used to set the cou-pler gains of the hearing aids. Because theREUG is an added CORFIG18 quantity, andthe individual REUGs are 15 dB lower thanaverage, the initial setting provides 15 dB
less coupler gain than for ears having the av-erage REUG. When the REIGs are measured,they show that the prescribed target hasbeen matched exactly! But in further confir-mation of the fittings via measurement ofaided sound-field thresholds, it is found thatthey are 15 dB higher than expected. Whathas happened?
It is agreed that the coupler gains of theaids were set to provide 15 dB less REIGthan for ears having the average REUG. Av-erage middle ear impedances (RECDs) wereassumed, and the average RECD was usedin the CORFIGs to preset the aid gains. Andso the aids provide REAGs for our individ-ual that are 15 dB lower than they wouldhave been, had the average-ear REUG beenused in the presetting of the aid gains. Theonly reason that the aids matched the targetREIG upon real-ear measurement is that theREUGs were 15 dB lower than average,thereby leading to subtracting lower num-bers from the REAGs in the REIG calcula-tion, thereby raising the apparent REIGs by15 dB, even though the REAGs were actuallydeficient by 15 dB.
What if the average REUG had been usedall the way through? Now, because both theREUGs and the RECDs are the average val-ues, the aid gains are preset according tothe average-ear CORFIG. So now, on theacoustically average ear, the aids would give30 dB REIG. In clinical verification measure-ments, the pseudo-REIGs are found to pro-vide 30 dB of pseudo-insertion gain to bothears, as expected. Why? Because the middleear impedances are average, and thereforethe REAGs are the same as predicted for theaverage ear, and then, after subtracting theaverage REUGs, the result is the pseudo-insertion gains as predicted for the averageear. Now, in further verification, the aidedthresholds are found to be 20 dB HL, exactlywhat was prescribed! So the aids are effec-tive in exactly the way called for by the fit-ting strategy, based on specific target aidedthresholds. Why? Because the ear has an av-erage-normal middle-ear impedance, andtherefore the REAGs of the aids resulted in
18See Equation (1) in the CORFIG section of thischapter.
12843.C03.PGS 3/8/02 11:03 AM Page 121

122 STRATEGIES FOR SELECTING AND VERIFYING HEARING AID FITTINGS
SPLs at the eardrums that are exactly aswere predicted and desired.
If the above seems confusing, keep inmind, again, that the fitting strategy is con-ceived in terms of desired aided sound-fieldthresholds and that the REUG plays no rolein aided thresholds. In measuring the aidedsound-field thresholds, the individual’s col-lapsed eardrums are no longer collapsed; theaids are holding them open. And therefore,the ears (which have normal impedance) areacting precisely as if acoustically average.The individual REUGs have no role in deter-mining the aided sound-field thresholds,and so, correctly, they should have no role indetermining the REAGs of the hearing aids.
As an exercise, the reader is encouraged towork through a second example, this time forears having RECDs that are different from av-erage. Here, the reader will find that correct-ing the CORFIGs—and thus the aid gain set-tings—according to the individual RECDs(but of course, not the REUGs), results in pre-cise fittings and the achievement of the de-sired aided thresholds and sensation levels.
Oh, and don’t forget to ask the patienthow the aids sound.
Acknowledgments
Frye Electronics of Tigard, Oregon, providedfunding, REM and hearing aid test equip-ment, and graphical support for the creation
of this chapter. Special thanks go to HarveyDillon, who provided important commentsand suggestions.
References
American National Standards Institute. American Na-tional Standard Testing Hearing Aids with a Broad-BandNoise Signal (ANSI S3.42). New York: Standards Sec-retariat, Acoustical Society of America, 1992.
American National Standards Institute. American Na-tional Standard Specification for Audiometers (ANSIS3.6). New York: Standards Secretariat, AcousticalSociety of America, 1996a.
American National Standards Institute. American Na-tional Standard Specification of Hearing Aid Character-istics (ANSI S3.22). New York: Standards Secretariat,Acoustical Society of America, 1996b.
American National Standards Institute. American NationalStandard Methods of Measurement of Real-Ear Perfor-mance Characteristics of Hearing Aids (ANSI S3.46). Stan-dards Secretariat, Acoustical Society of America, 1997.
Bentler RA, Pavlovic CV. Transfer functions and correc-tion factors used in hearing aid evaluation and re-search. Ear Hear 1989;10(1):58–63.
Bentler RA, Pavlovic CV. Addendum to “Transfer func-tions and correction factors used in hearing aid eval-uation and research.” Ear Hear 1992;13(4):284–286.
Cornelisse LE, Seewald RC. Field-to-microphone trans-fer functions for completely-in-the-canal (CIC) in-struments. Ear Hear 1997;18(4):342–345.
De Jonge R. Real-ear measures: individual variationand measurement error. In: Valente M, ed. HearingAids: Standards, Options, and Limitations. New York:Thieme Medical Publishers, 1996, pp. 72–125.
Dillon H. Allowing for real ear venting effects when se-lecting the coupler gain of hearing aids. Ear Hear1991;12(6):406–416.
Dillon H. Hearing Aids. New York: Thieme, 2001.Dillon H, Murray N. Accuracy of twelve methods for
estimating the real ear gain of hearing aids. Ear Hear1987;8(1):2–11.
Table 3–9. Average REUG Values for Various Loudspeaker Azimuths and FieldReference Points
Frequency 250 500 750 1000 1500 2000 3000 4000 6000 8000
0° center of 1 2 3 3 5 12 16 14 8 2head*:
45° over 2 3 3 3 6 13 14 13 8 4the ear†:
Diffuse, center 1 2 3 4 7 11 16 13 9 9of head‡:
Values rounded to nearest dB; some values interpolated.
*Data from Bentler and Pavlovic (1989).†Data from Frye Electronics, Inc., Tigard, OR.‡Data from Killion et al (1987)
12843.C03.PGS 3/8/02 11:03 AM Page 122

CHAPTER 3 � REAL-EAR MEASURES 123
Dirks D, Kincaid G. Basic acoustic considerations of earcanal probe measurements. Ear Hear 1987;8(suppl5):60S-67S.
Fikret-Pasa S, Revit LJ. Individualized correction factorsin the preselection of hearing aids. J Speech Hear Res1992;35(2):384–400.
Filler AS, Ross DA, Wiener FM. The pressure distributionin the auditory canal in a progressive sound field. De-cember 1, 1945, Psycho-Acoustic Laboratory, HarvardUniversity Report PNR-5 (available through Publica-tions Board, U.S. Department of Commerce, Washing-ton, DC). As cited in Wiener and Ross (1946).
Harford ER. The use of a miniature microphone in theear canal for the verification of hearing aid perfor-mance. Ear Hear 1980;1(6):329–337.
Hawkins DB. Variability in clinical ear canal probe micro-phone measurements. Hear Instrum 1987;38(1):30–32.
Hawkins DB, Mueller HG. Some variables affecting theaccuracy of probe tube microphone measures ofhearing aid gain. Hear Instrum 1986;37(1):8–49.
Ickes M, Hawkins DB, Cooper W. Effect of loudspeakerazimuth and reference microphone location on earcanal probe tube measurements. J Am Acad Audiol1991;2:156–163.
Killion MC. Individual insertion gain estimates: a com-parison of methods. Paper presented at the meetingof the American Speech-Language-Hearing Associa-tion, Toronto, Canada, 1983.
Killion MC, Berger EH, Nuss RA. Diffuse field responseof the ear. J Acoust Soc Am 1987;81(suppl 1):S75.
Killion MC, Monser EL. CORFIG: coupler response forflat insertion gain. In: Studebaker GA, Hochberg I,eds. Acoustical Factors Affecting Hearing Aid Perfor-mance. Baltimore: University Park Press, 1980, pp.147–168.
Killion MC, Revit LJ. Insertion gain repeatability versusloudspeaker location: You want me to put my loud-speaker W-H-E-R-E? Ear Hear 1987;8(5 Suppl):68S–73S.
Killion MC, Revit LJ. CORFIG and GIFROC: Real ear tocoupler and back. In: Studebaker GA, Hochberg I,eds. Acoustical Factors Affecting Hearing Aid Perfor-mance, 2nd edn. Boston: Allyn and Bacon, 1993, pp.65–85.
Kruger B. An update on the external ear resonance ininfants and young children. Ear Hear 1987;8:333–336.
Moodie KS, Seewald RC, Sinclair ST. Procedure for pre-dicting real-ear hearing aid performance in youngchildren. Am J Audiol 1994;3(1):23–30.
Mueller HG. Individualizing the ordering of customhearing aids. Hear Instrum 1989;40(2):18–22.
Mueller HG. Terminology and procedures. In: MuellerHG, Hawkins DB, Northern JL, eds. Probe Micro-phone Measurements; Hearing Aid Selection and Assess-ment. San Diego: Singular Press, 1992, pp. 41–66.
Mueller HG. Probe-microphone measurements: yester-day, today, and tomorrow. Hear J 1998;51(4):17–22.
Nelson Barlow NL, Auslander MC, Rines D, Stelma-chowicz PG. Probe-tube microphone measures inhearing-impaired children. Ear Hear 1988;9:243–247.
Nielsen HB, Rasmussen SB. New aspects in hearing aidfittings. Hear Instrum 1984;January:18–20,48.
Revit LJ. New Loudspeaker Locations for Improved Reliabilityin Clinical Measures of the Insertion Gain of Hearing Aids.Masters Thesis, Northwestern University, Evanston,IL, 1987.
Revit LJ. An open letter: new thinking on the proper ap-plication of real-ear measurements to prescriptionsand fittings. NZ J Audiol 1991a;1:1–17.
Revit LJ. Simplified aided-ear customization for target2-cc FOG prescriptions. Larry’s Corner 1991b; Winterissue, Frye Electronics Inc., Tigard, OR.
Revit LJ. Two methods for dealing with the occlusioneffect. Hear Instrum 1992;43(12):16–18.
Revit LJ. The tip of the probe—part 1: adjusting theprobe-tube insertion depth. Larry’s Corner 1993a;Winter issue, Frye Electronics Inc., Tigard, OR.
Revit LJ. The most important real ear measurement youmay ever make. Larry’s Corner 1993b; Spring issue,Frye Electronics Inc., Tigard, OR.
Revit LJ. Using coupler tests in the fitting of hearingaids. In: Valente M, ed. Strategies for Selecting andVerifying Hearing Aid Fittings. New York: Thieme,1994, pp. 64–87.
Revit LJ. Using earphone thresholds and real-ear mea-surements to estimate aided thresholds. Presentationgiven at the annual meeting of the American Speech-Language-Hearing Association, Seattle, WA, 1996.
Revit L. The circle of decibels: relating the hearing test,to the hearing aid, to the real-ear response. Hear Rev1997;4(11):35–38.
Ringdahl A, Leijon A. The reliability of insertion gainmeasurements using probe microphones in the ear.Scand Audiol 1984;13:173–178.
Romanow FF. Methods for measuring the performanceof hearing aids. J Acoust Soc Am 1942;13:194–204.
Sachs RM, Burkhard MD. On making pressure mea-surements in insert earphone couplers and real ears.Presented at the 82nd Meeting of the Acoustical Soci-ety of America, Denver, Colorado, October 19–22.Reprint from Knowles Electronics, Itasca, IL, 1971.
Sachs RM, Burkhard MD. Earphone Pressure Response inEars and Couplers, report no. 20021–2, Knowles Elec-tronics, Itasca, IL, 1972.
Scollie S, Seewald R, Cornelisse L, Jenstead L. Validityand repeatability of level-independent HL to SPLtransforms. Ear Hear 1998;19(5):407–13.
Seewald RC, Cornelisse LE, Richert FM, Block MG.Acoustic transforms for fitting CIC instruments. In:Chasin M, ed. CIC Handbook. San Diego: SingularPublishing Group, 1997, pp. 83–100.
Shaw EAG. Transformation of sound pressure levelfrom the free field to the eardrum in the horizontalplane. J Acoust Soc Am 1974;56(6):1848–1861.
Shaw EAG. The external ear: new knowledge. In: Dals-gaard SC, ed. Earmolds and Associated Problems. Pro-ceedings of the Seventh Danavox Symposium.Scand Audiol 1975;(suppl 5):24–50. Cited in Shaw(1980).
Shaw EAG. The acoustics of the external ear. In: Stude-baker GA, Hochberg I, eds. Acoustical Factors Affect-ing Hearing Aid Performance. Baltimore: UniversityPark Press, 1980, pp. 109–126.
Sinclair ST, Beauchaine KL, Moodie KS, Feigin JA, See-wald RC, Stelmachowicz PG. Repeatability of a real-ear-to-coupler difference measurement as a functionof age. Am J Audiol 1996;5(3):52–56.
Sivian LJ, White SD. On minimum audible fields. J AcoustSoc Am 1933;44:257–263, as cited in Shaw (1974).
Sullivan R. An acoustic coupling-based classificationsystem for hearing aid fittings. Hear Instrum 1985;9:25–28 and 12:16–22.
12843.C03.PGS 3/8/02 11:03 AM Page 123

124 STRATEGIES FOR SELECTING AND VERIFYING HEARING AID FITTINGS
Sullivan R. Probe tube microphone placement near thetympanic membrane. Hear Instrum 1988;39(7):43–44,60.
Tecca JE, Woodford CM, Kee DK. Variability of inser-tion-gain measurements. Hear J 1987;February:18–20.
Trede K. Real-ear measurements: issues of loudspeakerangle and room acoustics. Presented at the annualmeeting of the American Speech-Language-HearingAssociation, Seattle, WA, 1990.
Walker G, Dillon H, Byrne D. Sound field audiome-try: recommended stimuli and procedures. Ear Hear1984;5:13–21.
Wiener FM, Ross DA. The pressure distribution in theauditory canal in a progressive sound field. J AcoustSoc Am 1946;18(2):401–408.
Zemplenyi J, Gillman S, Dirks D. Optical method formeasurement of ear canal length. J Acoust Soc Am1985;78(6):2146–2148.
Zwislocki JJ. An ear simulator for acoustic measure-ments: rationale, principles, and limitations. In:Studebaker GA, Hochberg I, eds. Acoustical FactorsAffecting Hearing Aid Performance. Baltimore: Univer-sity Park Press, 1980, pp. 127–146.
12843.C03.PGS 3/8/02 11:03 AM Page 124