Embed Size (px)
Citation preview
Name ____________________ Class ________________ Data ______________
5/19/2011 Page 1 of 11
Reading GPS Time Series Plots Worksheet
By: Roger Groom and Cate Fox-Lent, UNAVCO Master Teachers in-Residence, Shelley Olds, UNAVCO
The Global Positioning System, GPS, is used to study the Earth, how tectonic plates move, and how Earth’s tectonic plates deform. GPS monuments are attached the ground and measure how the plate moves. While the GPS units in a car measure movement in miles per hour, high-precision GPS units used for scientific studies measure how fast or slow the Earth’s plates move and can measure a few millimeters in a year. Even millimeters can be important because slow moving rock can cause big earthquakes.
Part 1: Build a gum-drop model of a GPS monument and pinpoint location with GPS.
Materials: 1 gum drop = GPS receiver; 4 toothpicks (3 legs, 1 center post) = monument braces; 3 small clay feet = cement; ¼ sheet transparency = ‘see-through’ crust
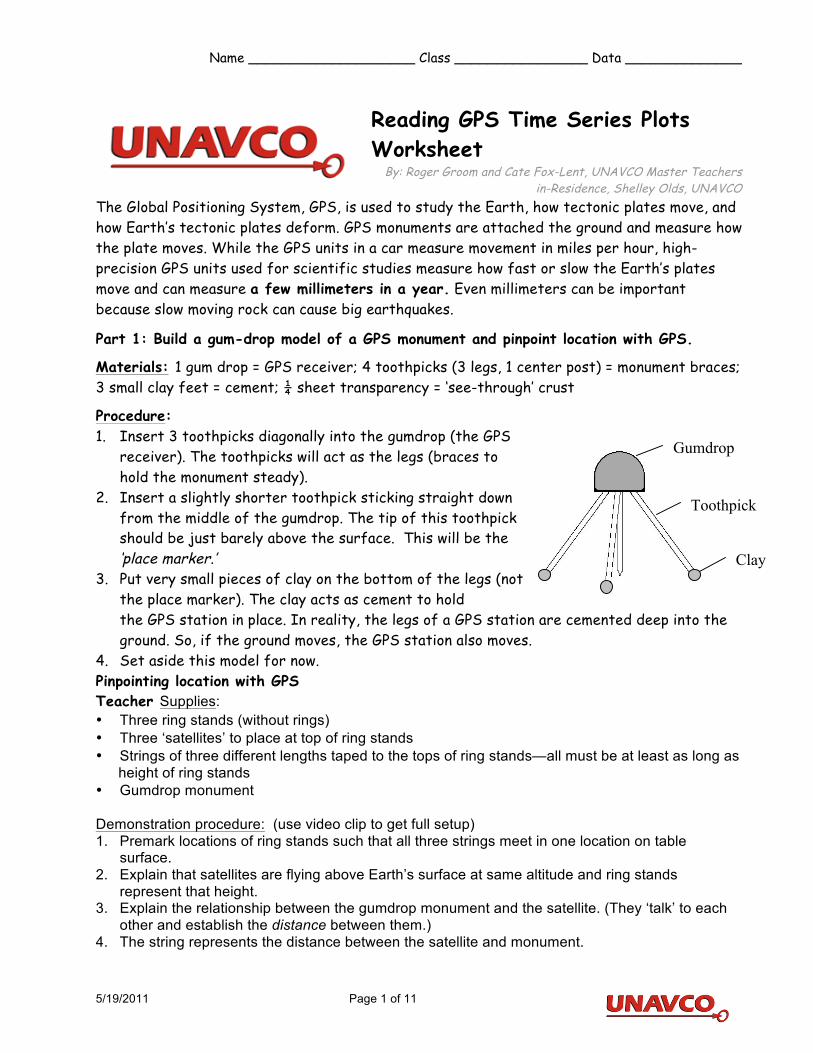
Procedure: 1. Insert 3 toothpicks diagonally into the gumdrop (the GPS
receiver). The toothpicks will act as the legs (braces to hold the monument steady).
2. Insert a slightly shorter toothpick sticking straight down from the middle of the gumdrop. The tip of this toothpick should be just barely above the surface. This will be the ‘place marker.’
3. Put very small pieces of clay on the bottom of the legs (not the place marker). The clay acts as cement to hold the GPS station in place. In reality, the legs of a GPS station are cemented deep into the ground. So, if the ground moves, the GPS station also moves.
4. Set aside this model for now. Pinpointing location with GPS Teacher Supplies: • Three ring stands (without rings) • Three ‘satellites’ to place at top of ring stands • Strings of three different lengths taped to the tops of ring stands—all must be at least as long as
height of ring stands • Gumdrop monument Demonstration procedure: (use video clip to get full setup) 1. Premark locations of ring stands such that all three strings meet in one location on table
surface. 2. Explain that satellites are flying above Earth’s surface at same altitude and ring stands
represent that height. 3. Explain the relationship between the gumdrop monument and the satellite. (They ‘talk’ to each
other and establish the distance between them.) 4. The string represents the distance between the satellite and monument.
Gumdrop
Toothpick
Clay
Name ____________________ Class ________________ Data ______________
5/19/2011 Page 2 of 11
5. Ask a student to move one string (held tautly) in all directions to indicate that the distance is known, but the direction isn’t.
6. Ask another student to move a second string around and note where strings intersect. There should be four possible places this happens. Emphasize again that the only known entity is the distance between the monument and satellite.
7. Ask a third student to move the third string to show where all three strings intersect. There should be two places—one on the Earth surface, and one far above the surface. Note that computers can automatically detect that the one in space is non-sensical.
8. Place the gumdrop at the point where the three strings intersect. 9. Remind students that these measurements are taking place while satellites are moving at 2
kilometers/second! 10. Ask the students to complete the questions in Part 1 of the worksheet. Note: This activity can be done in groups following the same directions. Pose the following questions to your students: 1. What do the tops of the stands (not the stands themselves) represent?
[The tops of the stands represent where the satellites are. They all are at the same height above the Earth.]
2. What does the length of string represent?
[The length of string represents the distance between monuments and satellites.] 3. How many satellites are needed to pinpoint the location of a spot on the Earth?
[At least three satellites are needed to pinpoint the location of the monument on the surface of the earth. In reality, more than three are used.]
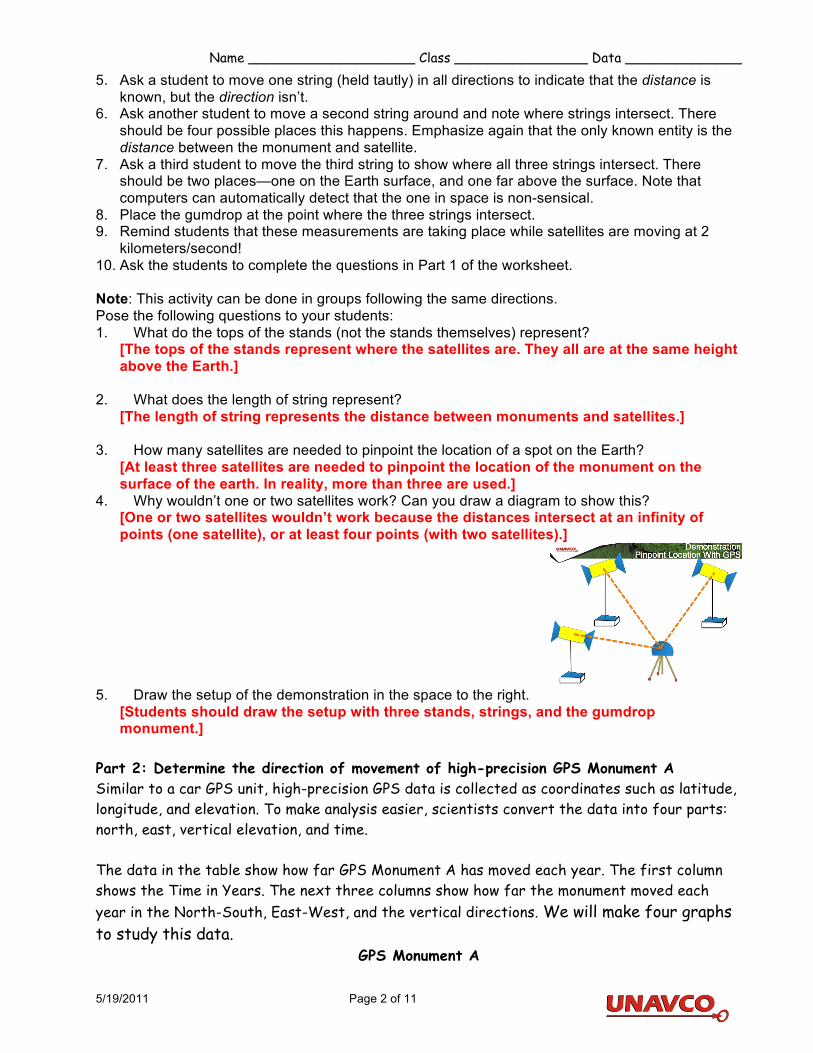
4. Why wouldn’t one or two satellites work? Can you draw a diagram to show this? [One or two satellites wouldn’t work because the distances intersect at an infinity of points (one satellite), or at least four points (with two satellites).]
5. Draw the setup of the demonstration in the space to the right.
[Students should draw the setup with three stands, strings, and the gumdrop monument.]
Part 2: Determine the direction of movement of high-precision GPS Monument A Similar to a car GPS unit, high-precision GPS data is collected as coordinates such as latitude, longitude, and elevation. To make analysis easier, scientists convert the data into four parts: north, east, vertical elevation, and time. The data in the table show how far GPS Monument A has moved each year. The first column shows the Time in Years. The next three columns show how far the monument moved each year in the North-South, East-West, and the vertical directions. We will make four graphs to study this data.
GPS Monument A
Name ____________________ Class ________________ Data ______________
5/19/2011 Page 3 of 11
Year
North (mm)
East (mm)
Height (mm)
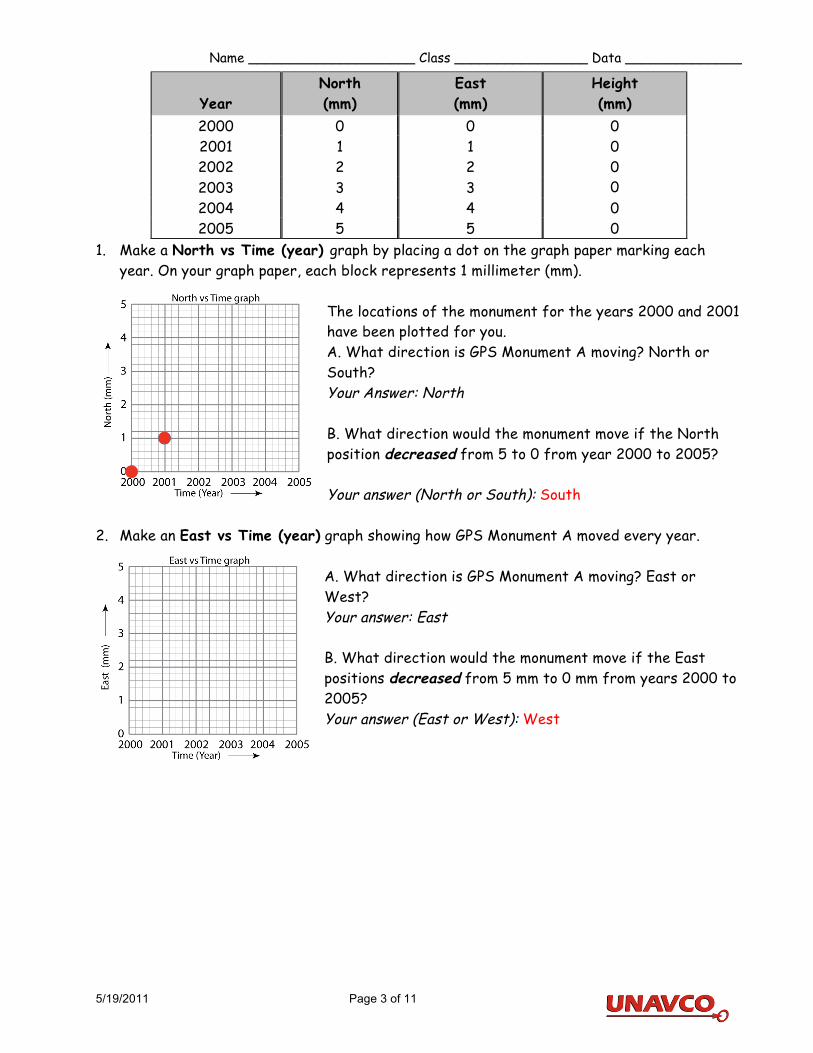
2000 0 0 0 2001 1 1 0 2002 2 2 0 2003 3 3 0 2004 4 4 0 2005 5 5 0
1. Make a North vs Time (year) graph by placing a dot on the graph paper marking each year. On your graph paper, each block represents 1 millimeter (mm).
The locations of the monument for the years 2000 and 2001 have been plotted for you. A. What direction is GPS Monument A moving? North or South? Your Answer: North B. What direction would the monument move if the North position decreased from 5 to 0 from year 2000 to 2005? Your answer (North or South): South
2. Make an East vs Time (year) graph showing how GPS Monument A moved every year.
A. What direction is GPS Monument A moving? East or West? Your answer: East B. What direction would the monument move if the East positions decreased from 5 mm to 0 mm from years 2000 to 2005? Your answer (East or West): West
Name ____________________ Class ________________ Data ______________
5/19/2011 Page 4 of 11
GPS Monument A
Year North (mm)
East (mm)
Height (mm)
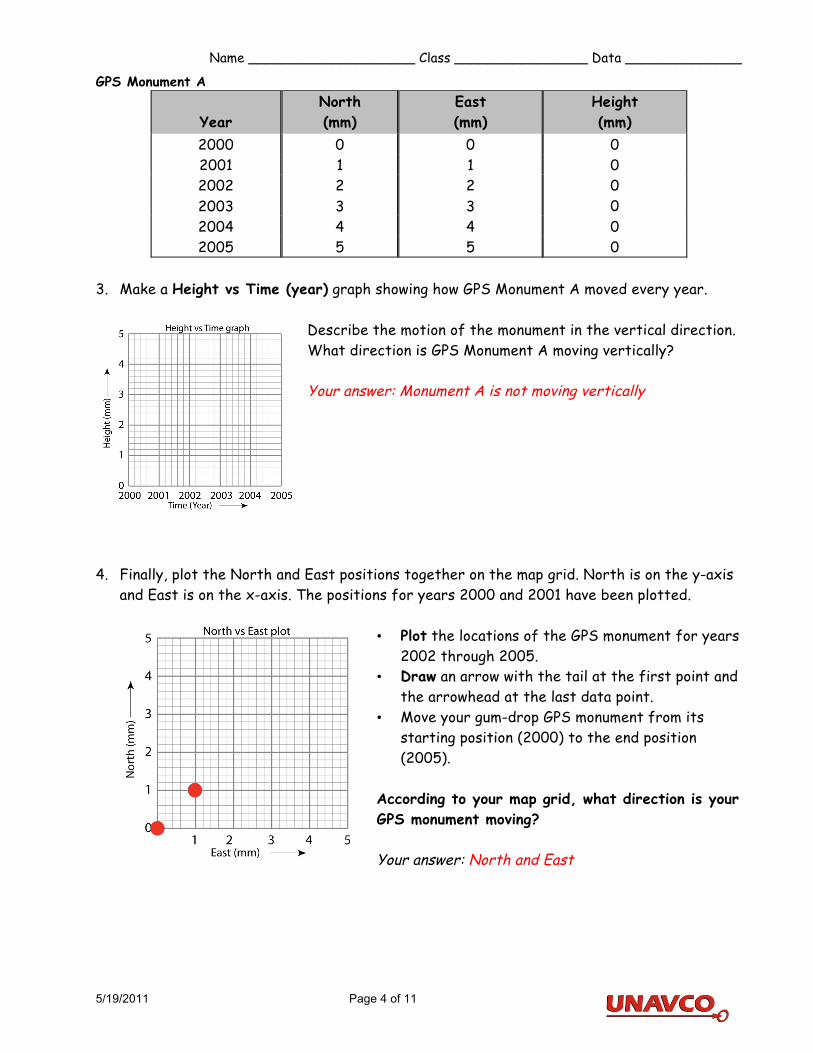
2000 0 0 0 2001 1 1 0 2002 2 2 0 2003 3 3 0 2004 4 4 0 2005 5 5 0
3. Make a Height vs Time (year) graph showing how GPS Monument A moved every year.
Describe the motion of the monument in the vertical direction. What direction is GPS Monument A moving vertically? Your answer: Monument A is not moving vertically
4. Finally, plot the North and East positions together on the map grid. North is on the y-axis
and East is on the x-axis. The positions for years 2000 and 2001 have been plotted. • Plot the locations of the GPS monument for years
2002 through 2005. • Draw an arrow with the tail at the first point and
the arrowhead at the last data point. • Move your gum-drop GPS monument from its
starting position (2000) to the end position (2005).
According to your map grid, what direction is your GPS monument moving? Your answer: North and East
Name ____________________ Class ________________ Data ______________
5/19/2011 Page 5 of 11
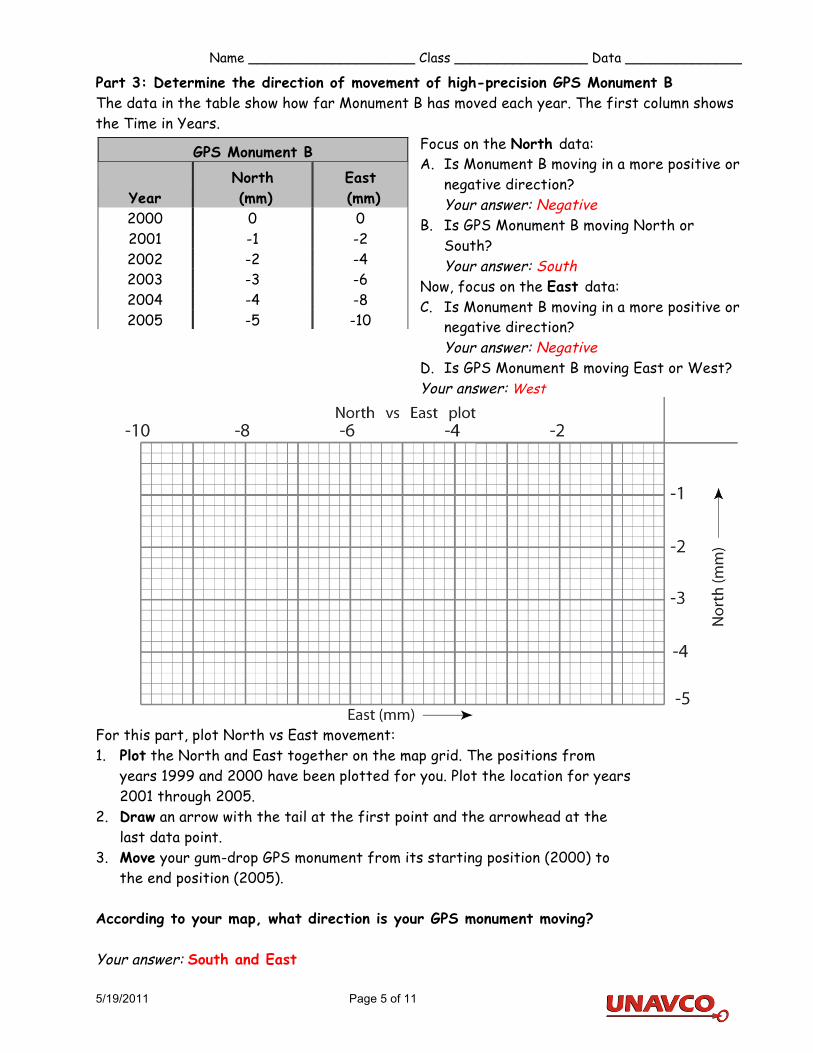
Part 3: Determine the direction of movement of high-precision GPS Monument B The data in the table show how far Monument B has moved each year. The first column shows the Time in Years.
GPS Monument B
Year North (mm)
East (mm)
2000 0 0 2001 -1 -2 2002 -2 -4 2003 -3 -6 2004 -4 -8 2005 -5 -10
Focus on the North data: A. Is Monument B moving in a more positive or
negative direction? Your answer: Negative
B. Is GPS Monument B moving North or South? Your answer: South
Now, focus on the East data: C. Is Monument B moving in a more positive or
negative direction? Your answer: Negative
D. Is GPS Monument B moving East or West? Your answer: West
For this part, plot North vs East movement: 1. Plot the North and East together on the map grid. The positions from
years 1999 and 2000 have been plotted for you. Plot the location for years 2001 through 2005.
2. Draw an arrow with the tail at the first point and the arrowhead at the last data point.
3. Move your gum-drop GPS monument from its starting position (2000) to the end position (2005).
According to your map, what direction is your GPS monument moving? Your answer: South and East
Name ____________________ Class ________________ Data ______________
5/19/2011 Page 6 of 11
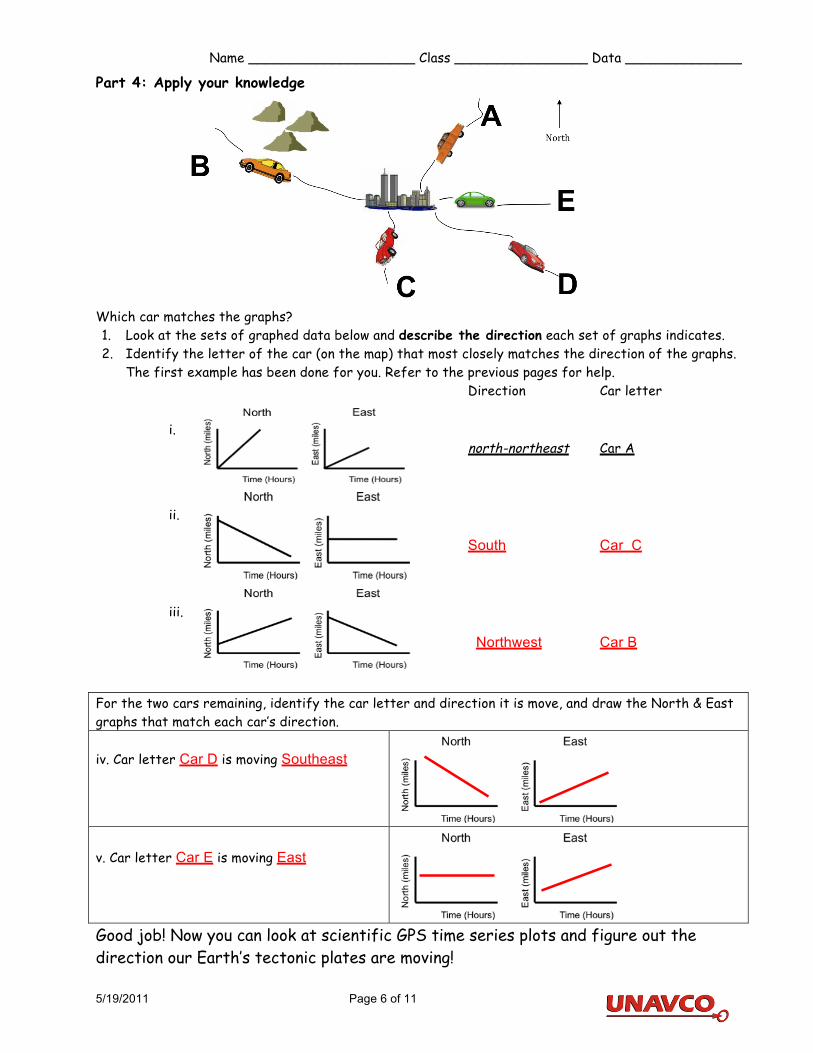
Part 4: Apply your knowledge
Which car matches the graphs? 1. Look at the sets of graphed data below and describe the direction each set of graphs indicates. 2. Identify the letter of the car (on the map) that most closely matches the direction of the graphs.
The first example has been done for you. Refer to the previous pages for help. Direction Car letter i.
north-northeast
Car A
ii.
South
Car C
iii.
Northwest
Car B
For the two cars remaining, identify the car letter and direction it is move, and draw the North & East graphs that match each car’s direction. iv. Car letter Car D is moving Southeast
v. Car letter Car E is moving East
Good job! Now you can look at scientific GPS time series plots and figure out the direction our Earth’s tectonic plates are moving!

Name ____________________ Class ________________ Data ______________
www.unavco.org Page 1 of 8 http://www.unavco.org/edu_outreach/resources/resources.html
Teacher Guide w/ Answer Key: Exploring Plate Motion and Deformation in California Using GPS Data
By: Cate Fox-Lent, UNAVCO Master Teacher Andy Newman, Georgia Institute of Technology, Shelley Olds, UNAVCO; March 2011
Before you begin… A general understanding of plate tectonics is required for this lesson. Many excellent learning resources are available online covering lines of evidence to support the theory of plate tectonics. Many of these resources take a global view of plate tectonics; this lesson explores how high-precision GPS can be used to measure regional plate movement and deformation. An Introduction to Reading GPS Time Series Plots is also recommended before this activity Overview: What’s happening in California? Earthquakes are shifting the landscape, creeping faults are bending the countryside, and the land is moving, but where? In this activity you will work with GPS data downloaded directly from the UNAVCO website to explore plate motion and deformation in California. By analyzing multiple GPS time series plots you can determine the directions and rates of regional deformation. Remember, the GPS stations are permanently cemented to the ground, so if a GPS monument is moving … the Earth’s plate is moving or deforming. Let’s look at the GPS data from California.
Part 1: Analyze real time-series data of two GPS stations
Work with a partner to study the data for two GPS monuments BEMT and SBCC to determine plate tectonic motion and complete the questions.
If you have access to the Internet, follow the instructions below. Otherwise, fill in the table below using the station information provided on page 5 and the time series plots on page 6.
1. Start at www.unavco.org and click on the link for Data for Educators (the direct link is: http://www.unavco.org/edu_outreach/data.html)
2. Move the map (click and drag on the map) until you can see California and zoom to bring BEMT and SBCC into view. [hint: double click on the ocean near southern California multiple times to zoom in]
3. Click on the green balloon with the station name (BEMT or SBCC) and click on the link for PBO Station Page to navigate to the Overview Page about the GPS station.

Name ____________________ Class ________________ Data ______________
www.unavco.org Page 2 of 8 http://www.unavco.org/edu_outreach/resources/resources.html
4. Use the information provided on the Overview page. Notice that nearby GPS stations are also shown on the station area map.
SBCC
BEMT
In which city and state is SBCC located? Mission Viejo, CA What is the latitude and longitude listed under SNARF Reference Frame (to 3 decimal places)? 33.553 , -117.661 (this might vary slightly) What is the elevation? 88.686 m
In which city and state is BEMT located? Twentynine Palms, CA What is the latitude and longitude listed under SNARF Reference Frame? (to 3 decimal places)? 34.001, -115.998 (this might vary slightly) What is the elevation? 1373.649 m
5. Click on the graph below Station Position. Study the plot entitled, “Most Recent Raw Data Times Series Plot”.
6. Calculate the SPEED of each GPS monument. (The convention is to use a negative number for velocities to the south or west)
a. SBCC: How far (on average) has the station moved per year? (Calculate the speed over 5 years, then divide by 5)
b. SBCC North = Approx 27.5 mm/yr Moving North or South? North
a. BEMT: How far (on average) has the station moved? (Calculate the speed over 5 years, then divide by 5)
b. BEMT North = Approx 7.7 mm/yr to the North Moving North or South? North What do you think happened at BEMT?
Name ____________________ Class ________________ Data ______________
www.unavco.org Page 3 of 8 http://www.unavco.org/edu_outreach/resources/resources.html
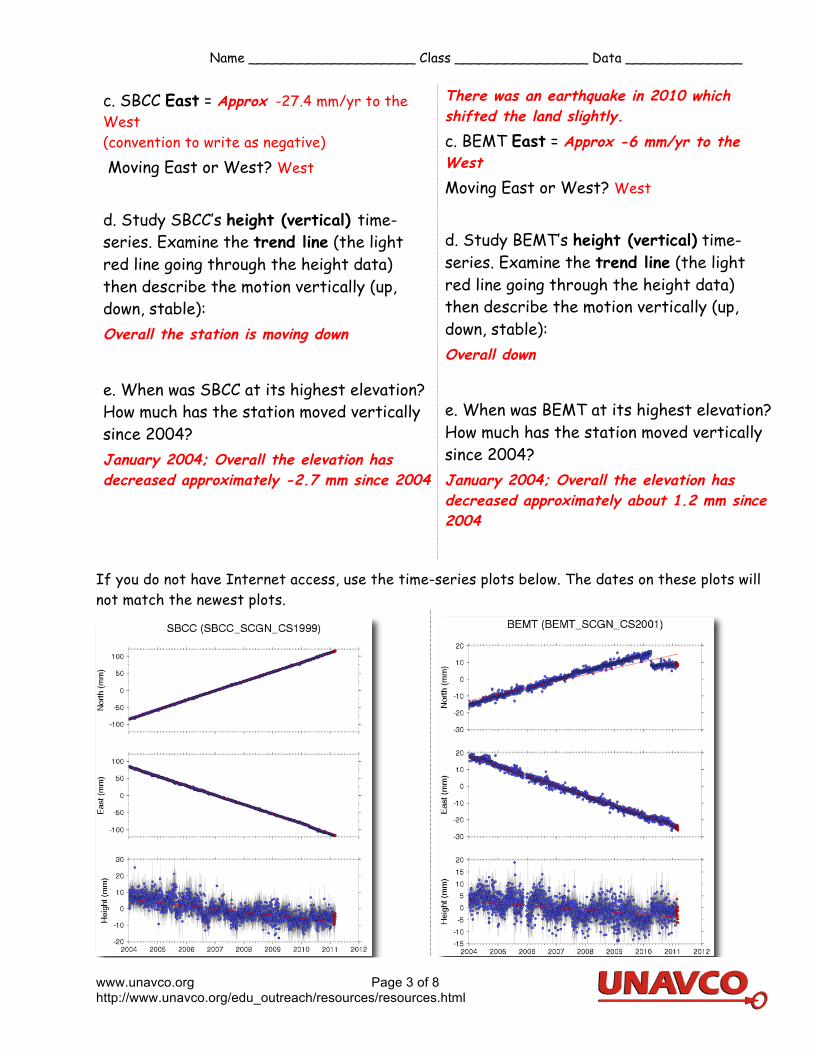
c. SBCC East = Approx -27.4 mm/yr to the West (convention to write as negative) Moving East or West? West d. Study SBCC’s height (vertical) time-series. Examine the trend line (the light red line going through the height data) then describe the motion vertically (up, down, stable): Overall the station is moving down
e. When was SBCC at its highest elevation? How much has the station moved vertically since 2004? January 2004; Overall the elevation has decreased approximately -2.7 mm since 2004
There was an earthquake in 2010 which shifted the land slightly. c. BEMT East = Approx -6 mm/yr to the West Moving East or West? West d. Study BEMT’s height (vertical) time-series. Examine the trend line (the light red line going through the height data) then describe the motion vertically (up, down, stable): Overall down
e. When was BEMT at its highest elevation? How much has the station moved vertically since 2004? January 2004; Overall the elevation has decreased approximately about 1.2 mm since 2004
If you do not have Internet access, use the time-series plots below. The dates on these plots will not match the newest plots.
Name ____________________ Class ________________ Data ______________
www.unavco.org Page 4 of 8 http://www.unavco.org/edu_outreach/resources/resources.html
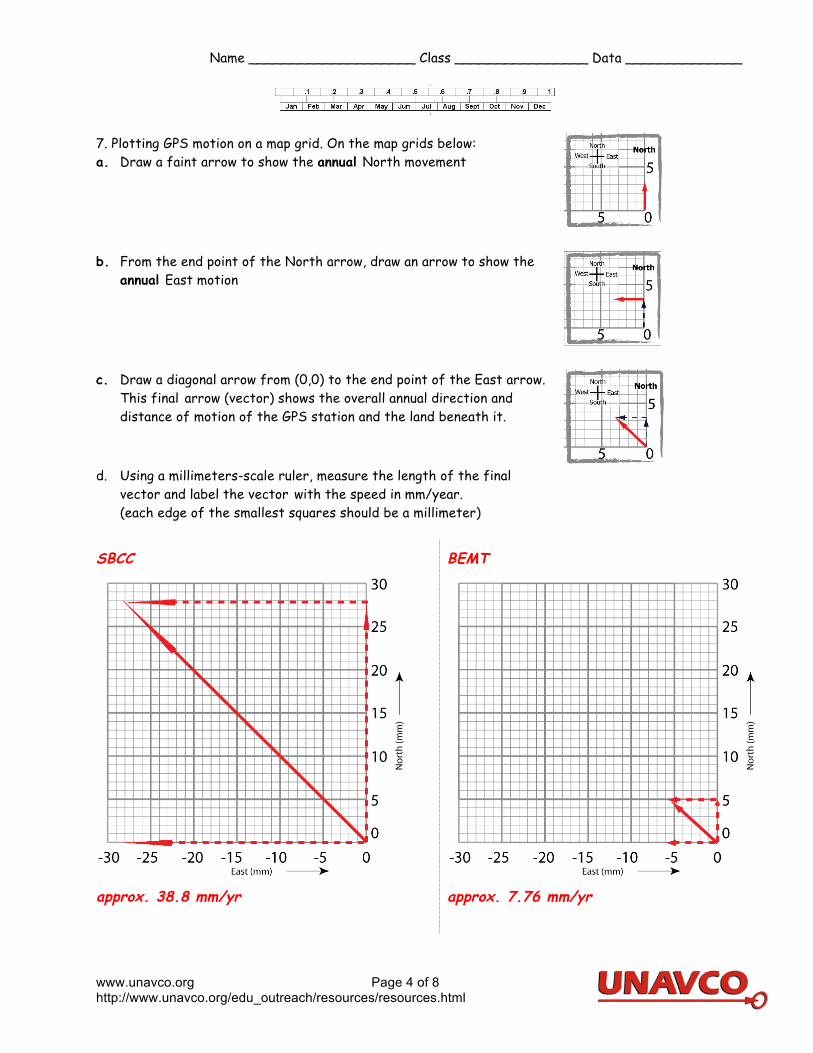
7. Plotting GPS motion on a map grid. On the map grids below: a. Draw a faint arrow to show the annual North movement
b. From the end point of the North arrow, draw an arrow to show the annual East motion
c. Draw a diagonal arrow from (0,0) to the end point of the East arrow. This final arrow (vector) shows the overall annual direction and distance of motion of the GPS station and the land beneath it.
d. Using a millimeters-scale ruler, measure the length of the final
vector and label the vector with the speed in mm/year. (each edge of the smallest squares should be a millimeter)
SBCC
approx. 38.8 mm/yr
BEMT
approx. 7.76 mm/yr
Name ____________________ Class ________________ Data ______________
www.unavco.org Page 5 of 8 http://www.unavco.org/edu_outreach/resources/resources.html
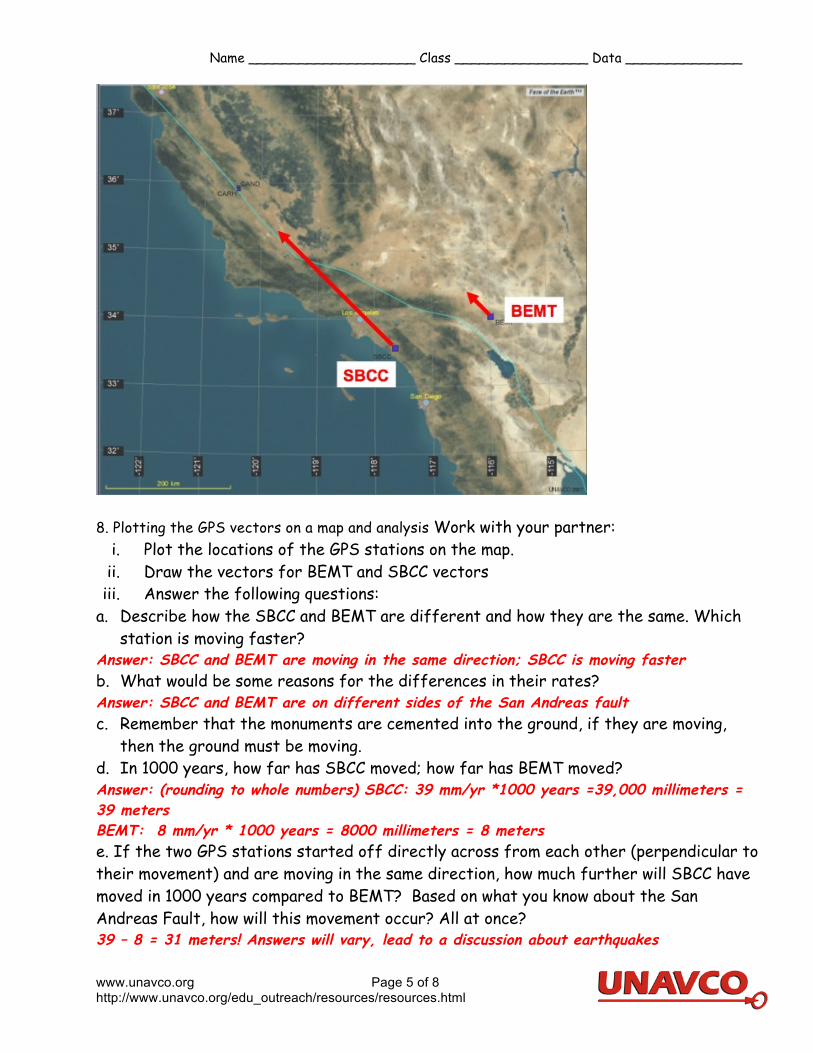
8. Plotting the GPS vectors on a map and analysis Work with your partner:
i. Plot the locations of the GPS stations on the map. ii. Draw the vectors for BEMT and SBCC vectors iii. Answer the following questions:
a. Describe how the SBCC and BEMT are different and how they are the same. Which station is moving faster?
Answer: SBCC and BEMT are moving in the same direction; SBCC is moving faster b. What would be some reasons for the differences in their rates? Answer: SBCC and BEMT are on different sides of the San Andreas fault c. Remember that the monuments are cemented into the ground, if they are moving,
then the ground must be moving. d. In 1000 years, how far has SBCC moved; how far has BEMT moved? Answer: (rounding to whole numbers) SBCC: 39 mm/yr *1000 years =39,000 millimeters = 39 meters BEMT: 8 mm/yr * 1000 years = 8000 millimeters = 8 meters e. If the two GPS stations started off directly across from each other (perpendicular to their movement) and are moving in the same direction, how much further will SBCC have moved in 1000 years compared to BEMT? Based on what you know about the San Andreas Fault, how will this movement occur? All at once? 39 – 8 = 31 meters! Answers will vary, lead to a discussion about earthquakes
Name ____________________ Class ________________ Data ______________
www.unavco.org Page 6 of 8 http://www.unavco.org/edu_outreach/resources/resources.html
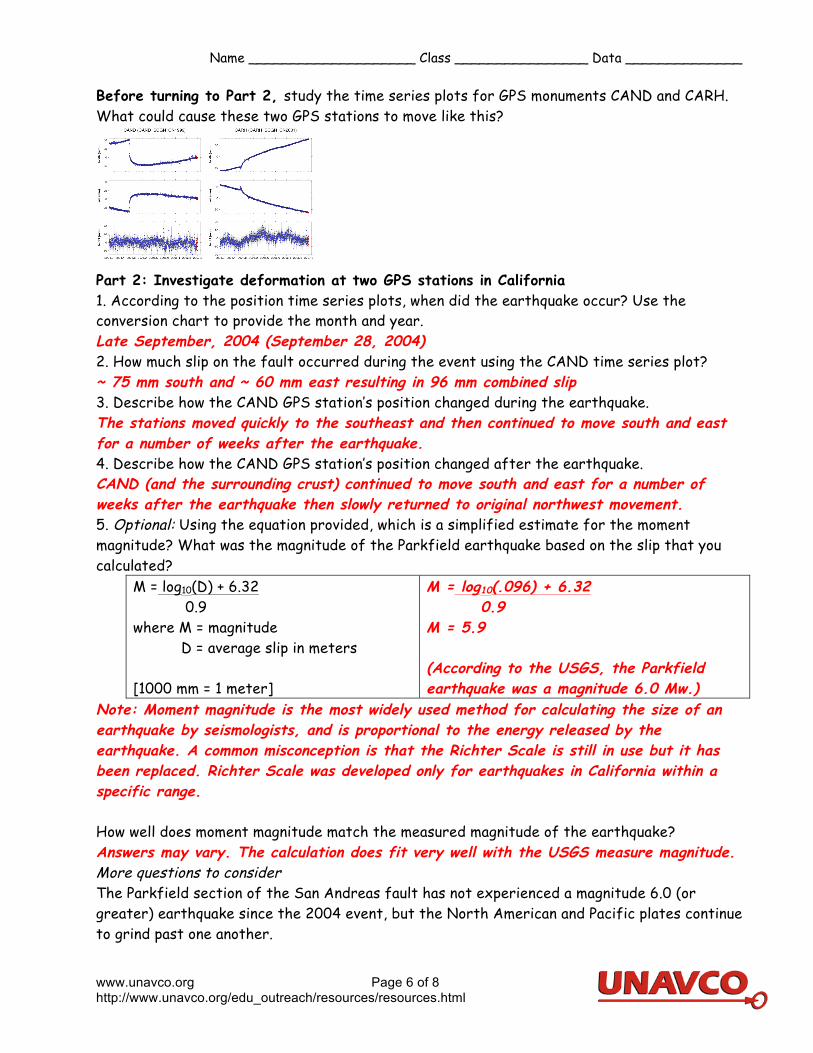
Before turning to Part 2, study the time series plots for GPS monuments CAND and CARH. What could cause these two GPS stations to move like this?
Part 2: Investigate deformation at two GPS stations in California 1. According to the position time series plots, when did the earthquake occur? Use the conversion chart to provide the month and year. Late September, 2004 (September 28, 2004) 2. How much slip on the fault occurred during the event using the CAND time series plot? ~ 75 mm south and ~ 60 mm east resulting in 96 mm combined slip 3. Describe how the CAND GPS station’s position changed during the earthquake. The stations moved quickly to the southeast and then continued to move south and east for a number of weeks after the earthquake. 4. Describe how the CAND GPS station’s position changed after the earthquake. CAND (and the surrounding crust) continued to move south and east for a number of weeks after the earthquake then slowly returned to original northwest movement. 5. Optional: Using the equation provided, which is a simplified estimate for the moment magnitude? What was the magnitude of the Parkfield earthquake based on the slip that you calculated?
M = log10(D) + 6.32 0.9 where M = magnitude D = average slip in meters [1000 mm = 1 meter]
M = log10(.096) + 6.32 0.9 M = 5.9 (According to the USGS, the Parkfield earthquake was a magnitude 6.0 Mw.)
Note: Moment magnitude is the most widely used method for calculating the size of an earthquake by seismologists, and is proportional to the energy released by the earthquake. A common misconception is that the Richter Scale is still in use but it has been replaced. Richter Scale was developed only for earthquakes in California within a specific range. How well does moment magnitude match the measured magnitude of the earthquake? Answers may vary. The calculation does fit very well with the USGS measure magnitude. More questions to consider The Parkfield section of the San Andreas fault has not experienced a magnitude 6.0 (or greater) earthquake since the 2004 event, but the North American and Pacific plates continue to grind past one another.

Name ____________________ Class ________________ Data ______________
www.unavco.org Page 7 of 8 http://www.unavco.org/edu_outreach/resources/resources.html
1. Based on the data about the total slip due to the Parkfield earthquake at CAND and CAHR, and the fact that the plate is moving ~22mm/yr at Parkfield, how long should it take to build enough strain energy to generate an earthquake with a similar magnitude? Answers may vary. ~ 96mm of slip during and after the Parkfield earthquake. 96mm / 22 mm per year = ~4.4 years 2. Look at the diagram from the USGS illustrating when earthquakes with magnitudes similar to the 2004 events have occurred along the Parkfield section of the San Andreas fault. How often did these earthquakes occur during the 20th century? ~ every 20 years 3. Does your calculation from #1 agree with the observed value from #2? No, the calculated number is much lower than the observed. 4. If you answered “no” to #3, can you think of a reason why? There could be many reasons: smaller earthquakes release some of the strain, there could be interaction with nearby faults, etc. Wrap up the lesson: Summarize the activities students have performed and reiterate the connection to plate tectonics and the increasing role GPS is playing in studying current tectonic events. More information: A Strong Earthquake Shakes Central California Fulfilling USGS' Parkfield Forecast: http://www.scec.org/education/040930parkfield.html The Parkfield, California, Earthquake Experiment: http://earthquake.usgs.gov/research/parkfield/index.php An area map of Parkfield, showing epicenters of the main shock and aftershocks within one month of event (in red): http://earthquake.usgs.gov/research/parkfield/2004.php Area map of southern California, showing epicenters of historic earthquakes (in yellow): http://www.data.scec.org/clickmap.html
Name ____________________ Class ________________ Data ______________
www.unavco.org Page 8 of 8 http://www.unavco.org/edu_outreach/resources/resources.html
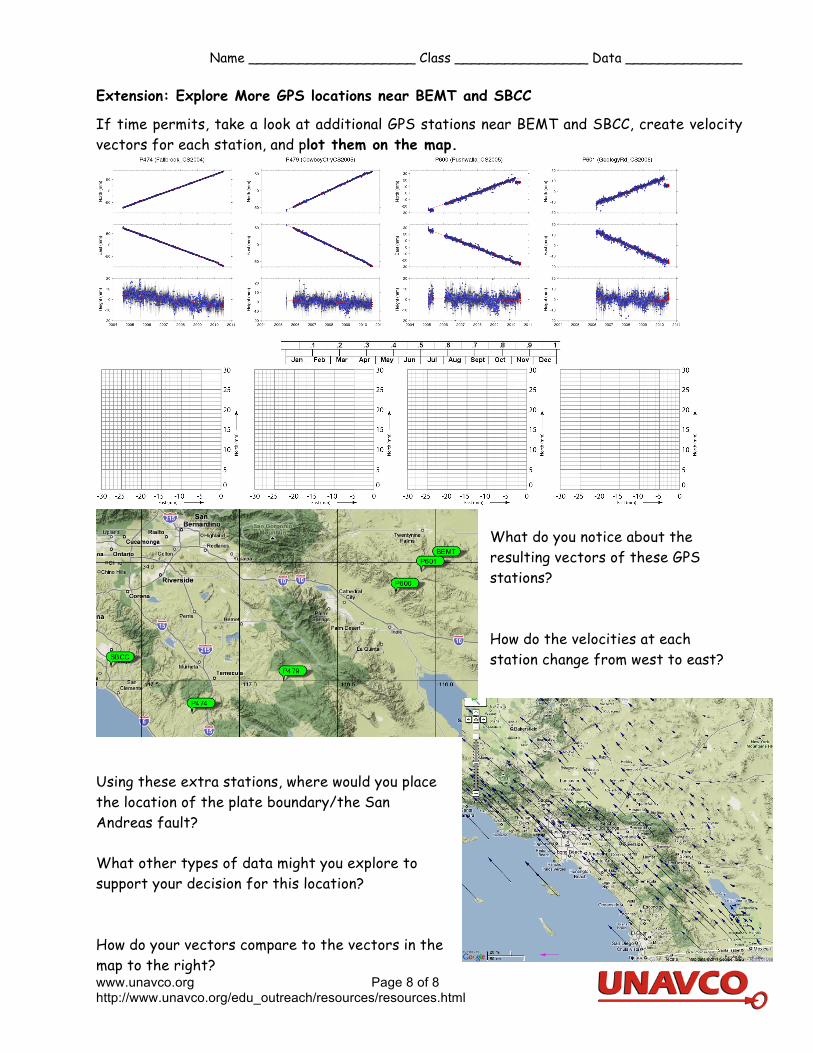
Extension: Explore More GPS locations near BEMT and SBCC
If time permits, take a look at additional GPS stations near BEMT and SBCC, create velocity vectors for each station, and plot them on the map.
What do you notice about the resulting vectors of these GPS stations? How do the velocities at each station change from west to east?
Using these extra stations, where would you place the location of the plate boundary/the San Andreas fault? What other types of data might you explore to support your decision for this location? How do your vectors compare to the vectors in the map to the right?

Name ____________________ Class ________________ Data ______________
11/27/2012 Page 1 of 2
Surprising Discoveries About Iceland: Determine the direction of movement of high-precision GPS Monuments
GPS Monument REYK
North: GPS Monument HOFN
North:
East:
East:
1. What general direction are Monument REYK and HOFN moving? How you determine this? REYK is moving _ Northwest_____ Student should describe the trend in REYK north is increasing (positive slope) thus moving to the North… The East the time series is decreasing (the numbers getting smaller; negative slope), thus moving west HOFN is moving __ Northeast ___ HOFN the trend is positive for both north and east.
North
East
North
Name ____________________ Class ________________ Data ______________
11/27/2012 Page 2 of 2
2. Are the two monuments moving towards each other, away from each other, or in the same direction? Away from each other (but not opposite directions)
3. Calculate annual motions in N/S and E/W directions for REYK and HOFN. (Directions to the south and east are written as negative numbers). REYK is moving: 20.5 millimeters/year to the (North or South) North
REYK is moving: -11 millimeters/year to the (East or West) West
HOFN is moving: 14.8 millimeters/year to the North
HOFN is moving: 13 millimeters / year to the East
4. On the map, write the speed of each station for the north and east (in mm/yr) near the GPS stations. Use your GPS model to simulate the motion. Do you still agree with your answer in question 2? Students might modify their answers
5. Now draw your vectors on the graph paper (each block = 1mm) and add them together. Draw a scale bar on the bottom of the map using the length of the vector as 10 mm/yr.
6. Describe how the vectors are different and how they are the same. [The vector for REYK is longer (thus moving faster.) The two vectors are moving away from each other in the E-W direction but both are moving north.] 7. Remember that the monuments are cemented into the ground. If they are moving then the ground must be moving. If you flew in a plane over Iceland then flew over Iceland 500 years later, what would you see? How much further apart will the stations moved in the east – west direction? The plates are moving slowly (1 to 2 mm/year). 500 years later, you might notice that there is new lava. The precise measurement that GPS data provide makes it very useful for long term measurements. [over 500 years, in the East-west direction: (-13 mm/yr - -11 mm/yr) = 500 yr * (24 mm/yr) = 1200 mm = 1.2 meters] 8. Give one possible explanation for the way the ground is moving in Iceland. [Depending on their educational background, students might say that a valley or hole is opening up in the ground. Others might say that the earth is breaking apart, etc. The North American tectonic plate and the European plate are moving apart in this location, and in fact, all along the Mid-Atlantic Ridge.] 9. Look at the map in the presentation showing the location of lava eruptions in Iceland. Sketch in the mid-Atlantic ridge shown in the slide on your map. In what way does this support or conflict with your explanation? [When tectonic plates move apart, they stretch the crust of the earth, making it thinner. This allows magma from the mantle to break through more easily.] Bonus: 10. There are gaps in the data for REYK. Given what you know about how GPS data are collected, give two possible causes for the gaps. [The location of REYK is in Iceland. Possible causes of data drop are that the equipment iced up, the batteries died, or the station was destroyed by wildlife, weather, or even a volcanic eruption. It took about 5 years before an engineer was able to go out to the site and fix the problem.]
11. Calculate the magnitude of the resulting vector. Two methods: 1. Vector magnitude = √ [(north magnitude/year) 2 + (east magnitude/year)2] 2. Measure the length of the vector _____, measure the width of each block = _______.
The resulting vector = [(length of the Vector)/(width of each block)]