Embed Size (px)
Citation preview

����� �����
�������� ���� ������
���������������� �
�����������
������
SVAZ MĚST A OBCÍČESKÉ REPUBLIKY
SMO

Contents
Welcome by SMO ČR President...........................................................................................2
Welcome by Mayor of Vsetín................................................................................................3
1 Project C2ENET.............................................................................................................4
2 The environment and quality........................................................................................ 18
3 European indicators of sustainable development ........................................................28
4 “Environmental audits of schools and educational organisations” methodology.......42
5 Ecological footprint ......................................................................................................53
6 “Ecological footprint of nursery and primary schools” methodology ......................... 61
7 The environment and strategic management using the BSC method.........................65
Dictionary............................................................................................................................70
Literature.............................................................................................................................72

2
Welcome by SMO ČR President
You have in your hands the reader called „Municipal Approach to the Environment“, the every first output of the Central European Environmental Network (C2ENET) project t where SMO is a partner. The project of cooperation between partners from the Czech Republic, Hungary, Austria and Romania is focused on the environmental issues that resulted from accession to the EU and impact of the EU legislation on local governments of the new member states.
Accession to the EU has brought along a number of obligations for the local governments that significantly affluence municipal environmental life. Measures aimed at adjusting to EU legislation are expensive , and for that reason it pays off to learn from the „older“ EU neighbours. For this purpose C2ENET project was launched.
The Austrian partner to the project, Austrian Association of Cities, is, with its more than ten-year experience of the EU members, an important source of experience and know-how on how to efficiently manager waste management, how to approach energy efficiency or manager waste wa-ter treatment from the point of view of cities, towns and municipalities. The Project Lead Part-ner, Town of Vsetín, may provide partners with precious information from implemented studies and analyse, so needed for local governments of the new member states should they meet all ob-ligations of the EU accession. Partner associations of local and regional governments will then distribute the analyse and pilot studies carried out under the project to other towns and cities in Hungary, Austria and the Czech Republic.
I believe that the reader in you have in your hands will help you find answers to questions, such as how to efficiently implement broad issues of the EU environmental policy, and that it will stimulate you to your further work in your city, town or community.
Oldřich Vlasák
President of the Union of Towns and Municipalities of the Czech Republic

3
Welcome by Mayor of Vsetín
For many years, The Town of Vsetín has done its best to actively implement projects and activities leading to improving of the quality of lives our citizen and the surrounding environment. The Town of Vsetín belongs to the Healthy Towns and Regions Network, we communicate in accordance with Local Agenda 21 principles, the Town Hall has a certified system of quality and respect to the environment in accordance with ISO 9001 and ISO 14001.
Vsetín is active in the field of gaining environmental sources. We are cur-rently building a new logistic venue for separating waste in our industrial zone
for about 200 million CZK. In Vsetínsko Microregion we have a project Bečva, the Clean River (focusing on sewage water). This reader is co-financed by the EU programme INTERREG IIIB CADSES and supported also by the Ministry for Regional Development.
Some of the procedures applied in management of the town, municipal office and our organisa-tions, are covered by this reader. They are activities we are well experienced with. You may find, for example, how we have done environmental audits of our schools, results of sustainable de-velopment indicators, ecological profile of our office, how to calculate ecological footprint etc.
All the texts and guidelines are at your disposal in an electronic version if you write to Mr Stanislav Kocourek at [email protected]. You can also send him all your opin-ions, suggestions and comments to this reader.
Jiří Čunek
Mayor of the Town of Vsetín

4
1 Project C2ENET
1.1 About C2ENET
Project Central Europe Environmental Net (C2ENET) is implemented under INTERREG IIB CADSES programme, priority 4 Environment protection, resource management and risk preven-tion, measure 4.1 Promoting environmental protection and resource management.
Short description
The project is dedicated to helping municipalities from EU10 countries manage existing prob-lems in the field of the environment, taking into account its technical, organisational and financial aspects. The main topics deal with the general issue of the sustainable development, with concen-tration on energy efficiency, waste management and waste water treatment. An analysis of rele-vant European law and a series of Pilot projects create a part of activities of the project. The ex-perience and partners know-how are made available to partner association member towns and municipalities.
Project budget: Total budget (EUR): 826.144,00 ERDF: 540.158,00 Project duration: 05/2005 – 09/2007
1.2 Project Partners
• Town of Vsetín (Lead Partner), Czech Republic
• Union of Towns and Municipalities of the Czech Republic (SMO ČR), Prague, Czech
Republic
• Austrian Association of Cities and Towns (Österreichischer Städtebund), Vienna, Austria
• Hungarian National Association of Local Authorities, Budapest, Hungary
• Town of Szigetszentmiklós, Hungary
• Regional Environmental and Waste Management Association of municipalities of North
Pest and Nógrád County, Kerepes, Hungary
• City of Oradea, Romania

5
Town of Vsetín
About Vsetín
Vsetin is a small Walachian town situated about 30 km northeast far from Zlin which is a birthplace of a well-known Czech businessman Tomas Bata. Bata himself was generally accepted for his modern prosperity and managing methods.
Vsetin is a hilly region and the river Becva runs through it. There are many historical monuments such as wooden cottages or Vsetin chateau. Traditional folk songs and dances are still very popular in Vsetin.
Zapojení do projektu
Vsetín is a Lead Partner to the project. The Town is responsible for the following activities:
− Pilot project – Evaluation of basic array of European indicators A1-A5 and B6-B10 − Pilot project – Study: How to use renewable energy resources like solar technologies,
wind, biomass, heat pumps, etc. − Pilot project – Study: Waste water treatment, clean water supplies − Pilot project implemented on the basis of the Analysis (management of the Town Hall
and projects related to sustainable development)
Other environmental projects
Vsetín is actively working to gain the EU funds. Among other examples there are Bečva, the Clean River Project (focusing on sewage water treatment) or a Logistic Centre for separating waste.
Contact: Town of Vsetín, Stanislav Kocourek, Svárov 1080, 755 24 Vsetín, Czech Republic, phone: +420 571 491 534, e-mail: [email protected]

6
Union of Towns and Municipalities of the Czech Republic (Svaz měst a obcí České republiky, SMO ČR)
SMO ČR is a voluntary, non-political and non-governmental organisation whose members are municipalities as described in the Act regulating municipalities (the Municipal Order). There are approximately 2.5 thousand member municipalities in SMO ČR where is more than 7 million inhabitants.
The Union is a partner to the Government and parliamentary political representation and it col-laborates on amendments of bills and provisions by form of commenting on precepts of law in areas having impact on local governments.
SMO ČR has three chambers – the Chamber of Chartered Cities, the Chamber of Towns and the
Chamber of Municipalities. Each member municipality is a member of one of the Chambers.
SMO ČR is led by an Executive Board politically representing all three Chambers. The Executive
Board has a number of advisory committees that provide professional service to the decision
making in SMO ČR.
The basic objective of SMO ČR is to promote common interests and rights of the municipalities
associated in the Union. Anchoring organisations associating representatives of self-government
into the Constitution or other primary legislation is one of the most important long-term goals of
SMO ČR, besides other objectives, such as protecting the general interests and rights of munici-
palities as local self-government authorities, economic autonomy of municipalities, lobbying
European legislation for the benefit of local authorities, developing contacts abroad etc.
History
One of the main goals of transformation of the society after November 1989 was to renew the
democratic local government in harmony with the principles of a legitimate state. A few short
weeks after, SMO ČR was re-established, building on the local authorities experience from the
period before the WWI, that started with the First Assembly of towns of the Kingdom of Bohe-
mia in Kolín in October 1907. The Constituent Assembly of the modern-day SMO ČR took
place on 16 January, 1990. At the outset, SMO ČR placed mainly emphasis on support and advi-
sory activities, but over the time the need to promote interests of local governments in relation to
central executive and legislative bodies came increasingly to the fore. The focus of SMO ČR´s
activities was subject to an ongoing change of conception. The first successes were achieved dur-
ing 1992 when SMO ČR began to be perceived as a partner by the Government and other state
administrative authorities.
Contact: Svaz měst a obcí České republiky, 5. května 1640/65, 140 21 Praha 4, Phone: +420 234 709 711, Fax. +420 234 709 786, E-mail: [email protected]

7
Association of Austrian Cities and Towns (Österreichischer Städtebund)
History
As early as 1887 regular "Städtetage", or General Assemblies of the Cities, were held aimed at discussing issues of common concern and interest, especially in the financial sector. On 24 September 1915, the Österreichischer Städtebund was set up with a permanent secretariat.
Constitutional Basis
Article 115, subsection 3 of the Austrian Constitution lays down the functions and tasks of the Österreichischer Städtebund, which consist chiefly in representing the interests of local government. Thus, the Österreichischer Städtebund is to a large degree embedded in the general political context of Austria.
Membership By August 2004, the Österreichischer Städtebund had around 250 members among the total of 2,359 local authorities in Austria. Approximately 55% of the total population of Austria live in member communities of the Österreichischer Städtebund. Members include, over and above Vienna and the capitals of the provinces, virtually all communities with more than 10,000 inhabitants. The small-est member counts less than 1,000 inhabitants. Membership in the Österreichischer Städtebund is on a voluntary basis. The association under private law "Österreichischer Städtebund" is funded exclusively through contributions of the member communities.
Tasks of the Österreichischer Städtebund
The principal task is to represent the interests of local government in negotiations over the shar-ing of budgetary funds and taxing rights between the federal government, the provinces and local authorities (revenue sharing). The share of the local authorities in the total public revenue includ-ing Vienna, which is both a province and a city in its own right is 11,8 %, without Vienna 6,1 % of the gross domestic product (2000).
Representation of Interests
The Österreichischer Städtebund is involved in the preparation of legislation and, among other things, comments from the point of view of local government on some 100 federal regulations every year as the cities and municipalities see it. Representatives of the Österreichischer Städtebund are moreover active in a number of advisory bodies in such fields as the environment or welfare.
European Union and Council of Europe
The Österreichischer Städtebund is the first association of local authorities in Europe to have set up an office in Brussels (August 1994), which is connected, physically and organisationally, with Austria's diplomatic representation at the European Union. The Österreichischer Städtebund is there-fore in a position, on the basis of a constitutional regulation to take part in the information and decision-making process both on the domestic and the European level.
Contact: Association of Austrian Cities and Towns, Guido Dornbauer, Rathaus, 1082 Wien, Austria, Phone: +43/1/4000-89992, E-mail: [email protected]

8
Hungarian National Association of Local Authorities
The Hungarian National Association of Local Authorities (TÖOSZ) was founded in 1989 with the aim to create a solid basis for the interest-asserting capacity of the new local government sphere, to give assistance to the development of settlement autonomy and to participate in the creation of a social, economic and legal environment friendly to local
authorities.
More than 1700 local authorities participate in the work of the Association and more than half of the country’s population live in TÖOSZ member municipalities.
TÖOSZ differs from other Hungarian interest representing associations of local authorities not only because it is the oldest with the largest number of members, but also because it comprises all types of local authorities (village, large village, town, town with county rights and county). There-fore, the basic philosophy of TÖOSZ differs from those of the other interest associations that it gives priority to the general and common interest representation of local authorities, and consi-ders only on the basis of these the enforcement of the interest of individual local authorities or types of local authorities (village, town, city).
TÖOSZ is an independent, self-supporting organization. All local authorities may become mem-bers of TÖOSZ on the condition that they accept the following values: voluntarism, legal equali-ty of members, solidarity, promotion of consensus, joint responsibilities, orientation towards the future, promotion of professionalism, pragmatism in a good way, independence from politics in the course of TÖOSZ activities.
The primary tasks of TÖOSZ are in particular:
• revealing, conciliating, mediating, protecting and representing interests • promotion of local self-government operation • encouraging the enlargement and successful operation of local authority assets • professional and organizational support to the cooperation of local authorities • conciliations concerning the budgetary decisions of the Parliament • participating in the international cooperation of local authorities • operating consultative, interest revealing and coordinating forums for the members • promoting information flow and relations between members • assisting members in case of grievances and in legal affairs • promoting the social control of power exertion.
Contact: Hungarian National Association of Local Authorities, Budapest, H-1067. Eötvös u. 10. Address for letters: H-1386 Bp. 62. Pf.: 908, Phone: (36-1)321-2496, E-mail: [email protected]

9
Szigetszentmiklós (Hungary)
Szigetszentmiklós town is located in the south-west of Csepel-island, near the capital and it is more than 700 years old.
The name of the town refers to the guardian saint of the church (Saint Nicolas), while the „Sziget” prefix (which means island) concerns the geographical loca-tion, the Csepel-island.
It has beautiful natural resources between the two branches of the Danube. The Ecological Di-dactic Path presenting rich flora and fauna offers many sights for visitors. Several species both of plant and animanls have been settled here, which paid the attention of the professionals due to their curiosity, and became protected. Apart from the cave lakes, the Danube-branch also repre-sents great values for the fishermen and for the people being fond of water sports.
Szigetszentmiklós has active life concerning entrepreneurs, commerce and industry. Almost all the 3000 ventures function in the service and commercial sphere. Leshegy Industrial Park and ÁTI- Sziget Industrial Park welcome the national and foreign firms as well.
In the last period, an enormous change occured in the life of the town. It would like to extend its great advantages that are the fast and confortable reach and the direct neighborhood of the capi-tal. The results of its facination are that the number of inhabitants is growing spectacularly (nowadays more than 27000 people live here), the cultural life is enriching, the urbanistical image is extending. The standards of its infrastructural development and its vehicular aptitude are good, the semi-motorway M0 ensures direct connection between highways M1, M5 and M7.
Szigetszentmiklós has an active twintown relationship with Gyergyószentmiklóssal (Romania-Pennsylvania), Haukipudas (Finnland), Specchia (Italy), Steinheim (Germany), Busko Zdrój (Po-land), Gorna Orjahovica (Bulgaria) és Kochani (Macedonia).
Its plans for development are determined by the rapid growth of population and and the dinamic extension of the residental sections. Beside infrastructural investments and the development of institutional network, the selective waste collection are among the plans for 2006. Those of the following years include tasks like further building of arterial drainage, implementation of a bypass road, and rehabilitation of Duna-branch at Soroksár.
There is an outstanding sight in the border of the town, the 314 m high Lakihegy Broadcasting Station, which was a technical innovation of the 20th century, and now became an industrial na-tional monument.
The mayor of the town is called Mrs. Fodor Antalné dr., who has been working in the public administration since 1967, and due to the trust of the population, she governs the development of Szigetszentmiklós since 1994.
Contact: Municipality of Szigetszentmiklós Town, Erika Katona, Polgármesteri Hiivatal 2310 Szigetszentmiklós Kossuth L.u.2., Hungary, phone: +436305557975, e-mail: katona.erika@szigetszentmiklós.hu

10
Oradea (Romania)
Oradea City Hall, as a local public authority, was set up in the year 1870. Oradea City Hall is a public institution with permanent activity, which fulfilles, efectively, the decisions of the Local Council, solves the curent problems of the local community and it is constituted of: the Mayor, two Deputy Mayors, the Secretary of the City of Oradea and the Own Apparatus of the Local Council.
In the actual structure, The Local Council of the City of Oradea functions as a result of the local elections, which took place in the 6th of June 2004, by the election of the 27 local councillors. The Mayor of Oradea has been elected after the vote ballot from 20th of June 2004. The selection of the Deputy Mayors and of the Councillors took place during the festiv meeting from 24th of June 2004.
The organization and functioning regulations of the Own Apparatus of The Local Council of Oradea had been issued according to the Law no. 215/2001, concerning the local public admini-stration, and according to the normative acts in force, on the grounds of witch it develops its activity. For a good organisation and developpment of the activity of the Own Apparatus of The Local Council, with the purpose of solving and managing public business in the interest of the local community, The City Hall of Oradea is being structured on compartments and the com-partments on fields of activity, according to the specific and to the local needs, as it follows:
- local public administration - local finances - development of public services - real estate - architecture, urbanism and cadastre - social - information science, human resouces - civil protection
The priorities of the local public administration are being directed towards the improvement of the lives of the inhabitants of the city, of the infrastructure, of the services, improvement of the safety of the jobs, facilities for free time, for integration of the town in the regional, national and european structures.
Staff: 3 dignitaries, 586 employees, out of whom 400 public functionaries, 186 contractual em-ployees, 58 of the total being in leading positions and 528 executives.
Contact: City Hall of Oradea, Alida-Maria Dacin, European Integration and Local Develop-ment, Piata Unirii No 1-3, Oradea, 410100 Romania phone: +40723381745, e-mail: [email protected]

11
International Advisory Centre of Municipalities, MEPCO
MEPCO Company was established in 2004 as a joint venture of the Union of Towns and Municipalities of the Czech Republic (SMO ČR) and the Dutch Association of towns and Municipalities (VNG).
The objective of the MEPCO company is to support regional and local governments their institutions and joint ventures in the
Czech Republic by means of providing counselling, managing and research services, and above that offer Czech administrative know-how on the international market, including sup-port of municipalities in implementing international projects.
The international unit of the advisory centre for municipalities (MEPCO) called MEPCO in-ternational is going to send experts on consultancy and EU projects to the Balkans, Ukraine, Turkey, but also for Africa or Asia.
The MEPCO team of experts uses internationally accepted and supported processes, applies modern instruments of management within the public administration, provides advisory, man-aging and research services to the municipalities and regions, to their institutions and associ-ated companies in the Czech Republic.
Fields of MEPCO specialisation
− Enhancement of public services delivery within local and regional administrations − Capacity building for line ministries/national level Institutions − Training of NGOs, regional and local administrations Trénink NGO, regionální a
místní správy − Formulation of participatory strategic plans on community level − Implementation of socio-economic programmes at local level − Improving cooperation between local administrations, NGOs and citizens − Improving relations between different tiers of government − Establishment of PMU for Implementation of EC service contracts and grants proce-
dures on local level
MEPCO is actively involved in prepring of the key-documents for financing Czech projects on the national level (the National Development Plan, Evaluation of the Point Operational Pro-gramme), projects implemented on the ntaional level (various project financed from PHARE, MATRA, Structural Funds etc.) as well as on the regional level (Joint Regional Programme, ab-sorption kapacity in NUTS III regions).
Contact: MEPCO s. r. o.., Liborova 11, 169 00 Praha 6, Czech Republic, phone: +420 220 515 047, e-mail: [email protected].

12
1.3 Project outputs
A) Analysis:
Preparation of the analysis consists of three steps – analysis of EU legislation, analysis of national legislations, and complex analysis of the organizational, financial and technical impacts of EU legislation to the municipalities.
B) Pilot Projects
Five planned studies (In Vsetín, Oradea and Hungary) will be a basis for a follow-up investment activities and for information exchange (through dissemination activities). One of the studies called “Healthy and sustainable Vsetin” will be specified on the base of the Analysis results.
1. Pilot project – Evaluation of basic array of European indicators A1-A5 and B6-B10
2. Pilot project – Study: How to use renewable energy resources, e. g. solar technologies, wind, biomass, heat pumps etc.
3. Pilot project – Study: Waste water treatment, clean water supplies
4. Pilot project implemented on the basis of the Analysis (management of the Town Hall and projects related to sustainable development)
5. Pilot project - Environmental protection field of intervention
C) Fiancing of Environmental Investments
Three Working Group meetings on Waste management, Energy efficiency and Urban water management and one Conference on are planned. Topics of the conferences and meetings con-centrate on financing and EU funding of municipal waste management projects, energy efficiency and priorities for local and regional authorities and experiences from implementation of a com-plex waste-management system projects.
D) Information Campaign
It is expected that the results of the analysis, Pilot projects and WGMs will be disseminated through three summaries, three readers, via seminars and conferences. At the end a Guidebook summarising the outputs of the analysis will be issued. Results will be available at Association´s Regional Meetings, at Association´s borads, in their newsletters and on their websites, as well as on the LOGON project web site.

13
1.4 Working Group Meeting “Finance and EU funding of municipal waste management projects”
Vienna, Leoben, 20 – 21 October 2005
Ecological structure and objectives of waste management in the European Union
Anne Baum – Rudichhaus, Federation of the German Waste Management Industry, Brussels office
The accession of new member states to the EU marked the launch of an initiative concerning cooperation and exchange of knowledge pertaining to resolving ecological, environmental and legislative matters of towns at the level of the European Union.
Exchange of information and experience within this working group is possible owing to the geo-graphic proximity of the member countries and can therefore be very active.
Solid principles were created 30 years ago, when in 1972 several small-scale projects pertaining to the environment commenced. Since that time, about 200 other projects have been prepared. In 1989 an independent concept of waste management methods was created, incited by the Euro-pean Commission. It was the first document in which the commission raised waste management to the European level.
Germany was one of the first countries to implement directives for waste management at the European level, largely owing to a high environmental standard that was a challenge for other member states with a lower degree of ecological awareness.
For some time, however, environmental protection, both in Germany and the other countries, lost its importance since a number of pivotal ecological issues were successfully resolved. On the other hand, the economic slowdown of a number of countries compelled legislative bodies to pay more attention to economic than environmental matters.
Another reason for this change is the member states’ reluctance as regards timely and consistent implementation of EU regulations. The Union’s enlargement to the East has resulted in the modification of the conditions of the environmental framework too. For this reason, the Euro-pean Environment Committee responds extremely positively when any new proposals in the area of waste management and environmental policy appear. An important role is played here by the programme, part of the Lisbon strategy, aimed at simplification of EU legislation. The objective of the strategy is to make the EU by 2010 the most dynamic and competitive economy in the world.
Legal conditions and the judicial structure of waste management in the EU
Anne Baum – Rudichhaus, Federation of the German Waste Management Industry, Brussels office

14
Brussels issues a large number of strict and complex regulations that must be simplified so that they do not hinder innovation within European industry. The European Commission should announce in what manner the strategy of waste management, reduction of waste production and recycling will develop, and show the path that should be followed by the legislation. The basis for further development is the Environment Action Plan, which defines the objectives for the next 10 years and was approved by the European Parliament in July 2002. It highlights four areas of activity:
1) protection of the planet 2) protection of health and the environment 3) natural biological diversity 4) use of natural resources
The Environment Action Plan reckons with a connection between economic growth and waste production. An important role in waste management is played by recycling.
Structural funds and programmes for 2007 – 2013
Dipl. Ing. Christiane Breznik; Managing Authority INTERREG IIIC East; City of Vi-enna
New financial structures and funds (Austria)
The present financing period (2000-2006) is divided into two areas: national financing and mu-nicipal initiatives.
National financing is focused on three types of areas:
1) areas lagging behind in development 2) areas with structural difficulties 3) areas focused on modernisation of the employment strategy
New member states mainly fall within category 2), with the exception of a few areas in category 1). Thus, within a year and a half they have gained certain experience with financing programmes and structural funds.
At the present time, municipal initiatives focus on cooperation between regions. And since Aus-tria is a small country, virtually all its provinces are also involved in international cooperation with the neighbouring countries. There is an international programme, which also entails activity per-taining to the environmental and waste management and offers possibilities of financing interna-tional projects (PPP). The PPP programme includes projects in which more than one member country participates. For the future, however, the activity of municipal initiatives is abandoned. Instead, transformation programmes will be financed in the new structural period.
Waste management in Austria
SC Dipl.-Ing. Dr. Leopold Zahrer, Austrian Federal Ministry of Environment
Austrian landfill directives

15
Since 1989 more than 60% of household waste has been deposited at landfills, part has been me-chanically separated or biologically degraded, another part has been reused for energy generation.
New Austrian directives came into force in 2004 and their implementation has resulted in the waste deposited at landfills having been mechanically and biologically processed. Since January 1, 2004 the volume of biologically decomposable waste has been reduced from 63% to 42%.
Technology has also improved in facilities that existed before, which can continue in the future. If, however, waste is collected separately (packaging, biological waste, etc.), additional sorting will not be necessary.
Relevance of waste management for climate development
Landfills produce harmful gases, thus contributing to damage of the Earth’s ozone layer.
Sorted, biologically or mechanically treated waste intended for energy recovery can replace fuels, building materials, etc.
At the present time, determination of quality requirements, use of secondary energy and setting the criteria for individual waste types is in progress. The Austrian government has stipulated the obligations for waste management:
1) waste register and allocation 2) statistics 3) balance
Waste management not only encompasses municipal and industrial waste and things people only want to get rid of, but it primarily concerns prevention of waste generation by means of increased pressure on producers and maximum reduction of contaminants.
Waste management in Salzburg
Dr. Helmut Stadler, City of Salzburg
Waste management in Salzburg
The city produces a large amount of waste, therefore it is necessary to resolve this problem for the sake of its citizens alone. A partial solution has become cooperation with private companies. Legislation amenable to the European Court of Justice is divided into national, provincial and municipal, each of which has its own competencies, projects and provides consultancy as regards waste separation.
80,000 tonnes is the average amount of waste generated a year. This figure is significantly in-creased by population growth and flourishing tourism. However, 50% of waste is tackled by re-cycling and separate collection.
The city of Salzburg faces, among other things, the problem of access on narrow roads in pro-tected areas and to mountain areas. Everything is within the competence of the municipality, which regularly carries out a survey of citizens’ satisfaction. On a points scale ranging from 1-5, corresponding to the rating at school, the city received the ranking of 1.06 as regards its waste treatment. .

16
Sums laid out for waste disposal issue from set tables and the city regularly carries out calculation comparison for its citizens.
Waste management is an interesting sector and an economically promising industry, namely, ow-ing to economic and environmental conditions.
Current possibilities of financing municipal waste management projects+ Subsidies for waste management and sorting operations
Andreas Kettenhuber, Deputy Head of Department, Kommunalkredit (special-purpose bank for Austrian local authorities)
DI Christopher Giay, Head of Department, Kommunalkredit
EU directives require enormous investment in the environmental sector, primarily in protection of drinking water resources and waste water treatment.
Approximately one hundred billion euros are to be invested in Central and Eastern Europe over ten years. The statistics regarding the current waste management have revealed that more than 84% of municipal waste in this region is deposited at landfills, as opposed to only 40% in West-ern Europe. Therefore, it will be necessary to close down unsatisfactory landfills, reduce the total number of landfills so that only the most prosperous are operated.
Community funds have been established for drawing sources from the EU, including cohesion funds and structural funds. Cohesion funds and ISPA are virtually the same. They function on the basis of almost identical directives and approval procedures.
These funds are only intended for the transportation and environmental sector and exclusively for the financing of projects. Falling within this area are projects pertaining to drinking water resources, waste-water systems and waste management.
ISPA is a relatively small fund with the budget of € 7 billion up to 2007, while the cohesion fund has at its disposal € 18 billion and the structural fund € 95 billion.
The structural fund is further divided into four smaller funds, thus budgets for individual funds are comparable with those of the cohesion fund. The value of a grant in the case of ISPA amounts to 75% and with the cohesion fund 85%, the maximum value attainable. The budget of projects within the framework of ISPA must have the scope of at least € 5 million, within the framework of the cohesion fund at least € 10 million, which means it concerns relatively large projects, when we also take into consideration the complex structure for a project’s acceptance and administration.
Saubermacher and waste management
Dr. Klaus Tritscher, Saubermacher GmbH
Private companies dealing with waste management
Austria’s Saubermacher is one of the private companies cooperating with the public sector in models.

17
It deals with waste collection, waste transportation, separate collection, waste disposal, landfilling, separation lines, mechanical and biological waste treatment, etc. Saubermarch also has a solution for waste water treatment for which it has recently won an environmental award.
Saubermarch is a partner to public companies in which a municipality is the main shareholder. Several partnerships of this type function in Austria, Slovenia, Hungary and the Czech Republic. The advantage of such a partnership is profit sharing, increased efficiency and easier acquisition of finance.
.A.S.A.
Another private company is .A.S.A., a partner to the public sector in a number of municipalities.
This company deals with waste collection and transportation (including hazardous waste), and owns a facility for mechanical and biological waste treatment.
When preparing projects, a municipality and a private company combine their forces, with the company primarily providing the know-how and finance and the municipality the land and mar-ket. The dividends resulting from mutual cooperation are returned to both partners.
Detailed information about individual conference papers can be found at :
http://www.smocr.cz/en/projects/c2enet/working-group-meetings/finance-and-eu-funding-of-municipal-waste-management-projects.aspx
http://www.mestovsetin.cz/vismo/zobraz_dok.asp?u=18676&id_org=18676&id_ktg=15293&archiv=0&p1=&p2=&p3

18
2 The environment and quality
2.1 What has caused the change?
The terms quality, environmentally sound management system (for example, by means of ISO 14001, ISO 9001, EFQM, benchmarking, Balanced Scorecard (BSC), etc.) can be frequently en-countered in industry and the entire business sphere. Upon hearing these terms, many people get “goose pimples”. They see in them a fashion trend, an increase in work or bureaucracy. When purchasing any type of goods or using a service (for example, dinner in a restaurant, a train jour-ney or repair of anything), they automatically expect to receive a high-quality product or service at a relatively low price. The above-mentioned methods, however, play a decisive role in terms of quality at a reasonable price. In public administration, these methods began to be used to a greater extent before 2000 on the basis of the pressure of change. They serve to increase the quality and efficiency of individual public services and processes (activities), the quality of strate-gic planning, as well as to improve citizens’ quality of life. These methods also appertain to the organisations operating in the environmental sector, including municipal authorities.
2.2 The term “quality in public administration”
Quality in public administration is the degree of fulfilling justified requirements of:
− customers for the provided public service; or, − citizens for the quality of life in a particular municipality, city or region.
While:
− customers (for example, applicants at an office, administrative proceedings participants, etc.) expect their application or need to be settled quickly, without legal and other defi-ciencies, in the required standard,
− citizens expect improvement in the quality of life in their municipality, city or region, − public services are services provided in the public interest.
2.3 What is the objective of public administration?
Why is it necessary to describe something as unambiguous as the “objective of public administra-tion”? Experience has shown that employees at authorities do not have an entirely clear idea about this matter. However, sound management of an authority – if it is to bring about benefits to our citizens – must issue from strategic priorities and at the same time effectively and properly manage all operative tasks (including those related to the environment). In other words, sound management must issue from the public administration’s objective. At the same time, it is neces-sary to adapt this objective to local conditions. This is not possible unless we understand the ob-jective:
In our case, we define the objective of public administration as:
− improvement of citizens’ quality of life while respecting the principles of sustainable de-velopment and, concurrently,

19
− increase in the efficiency and quality of public services provided by authorities.
The objective is depicted by means of the model in Picture 1.
Picture 1: “Objective of public administration” model
2.4 Where to obtain more information
More information about quality methods can be obtained:
In the publication “Management of state administration execution processes”, issued by the Min-istry of the Interior as a case study – it is available from the Ministry of the Interior, Department of Public Administration Modernisation.
In the publication “How to effectively apply CAF”, issued this year by the National Quality Pol-icy (NPJ) – it is available from the Information Centre of the NPJ. In tandem with the Ministry of the Interior, we have prepared the publication “Satisfaction measurement” – it should be avail-able in December.
It is also possible to ask for it in electronic form from the chapter’s authors.
2.5 Appendices
Appendix No. 1 Environmental profile of the Municipal Office of Vsetín at the end of 2005
Public administration objective
Improving the quality of life while respect-ing sustainable development.
Increasing quality and efficiency.
Can be expressed, e.g., as customers’ satisfaction or by means of a service audit or comparison with the best.
Can be expressed, e.g., as citizens’ satis-faction or by means of sustainable devel-opment indicators or comparison with the best.
Applies to customers of these services.Applies to all citizens.
How do we tackle it? -A town ascertains its needs, e.g., by means of Local Agenda 21 (Healthy Town) and carries out benchmarking. -A town controls its strategy, e.g., accord-ing to the Balanced Scorecard (BSC).
How do we tackle it? An authority strives to provide high-quality services efficiently and duly (benchmarking, application of a quality and efficiency system according to ISO, CAF …).
Doing things correctly Doing correct things

20
Appendix No. 1 Environmental profile of the Municipal Office of Vsetín at the end of 2005
ENVIRONMENTAL PROFILE
Municipal Office of Vsetín
Introduction The Town of Vsetín is by law a public-legal corporation. The issue of municipality is stipulated by Act No. 128/2000, on municipalities, as amended by later regulations. The municipality’s bod-ies are the Board, Council, Mayor and Municipal Office. The Municipal Office of Vsetín is con-currently an authorised municipal authority of the 3rd degree for execution of state administration for several municipalities in an administrative district. The Municipal Office is an executive body that ensures the meeting of requirements for: - fulfilment of tasks and activities approved by the Council or Board of the Town of Vsetín (in
the area of its independent operation) and - ensuring the execution of state administration in the administrative district within the scope
determined by special laws (in the area of delegated operation). Pursuant to the Act on municipalities, the Municipal Office of Vsetín is formed by the Mayor, Deputy Mayors, Secretary and other employees of the Town of Vsetín included in the Municipal Office of Vsetín. The Municipal Office’s organisational structure, activities and responsibilities are defined by its rules of organisation of the office. A certified system includes the Municipal Office, apart from elected representatives (Mayor, Deputy Mayor).
Environmental policy In the “Conception of Permanent Improvement of Activities, Environmental Soundness of the Municipal Office of Vsetín” the Municipal Office declares: We want to permanently create conditions to better satisfy the needs of the town and region, improve care for citi-zens, improve the working environment for both visitors to and employees of the Municipal Office, and act in an environmentally sound manner.
Environmental aspects When assessing environmental aspects, the Municipal Office’s activities having an impact on both the indoor and outdoor environment were reviewed. The evaluation has been reflected into the definition of environmental objectives with specific target values. Relevant environmental aspects are marked red or green in the “Register”.
Environmental objectives Environmental objectives are defined by: - the Conception of Permanent Improvement of Activities, Environmental Soundness of the
Municipal Office of Vsetín – environmental policy - the Register of Environmental Aspects In terms of the quality system, the objectives are defined in the “Plan of Health and Quality of Life”.

21
Environmental objectives are defined in the document entitled “Environmental Objectives of the Municipal Office of Vsetín”. Each objective has a description of activities and set target values.
Conception of Permanent Improvement of Activities, Environ-mental Soundness of the Municipal Office of Vsetín
Mission: The town’s mission ensues from Section 2 of Act No. 128/2000, on municipalities. The town’s mission is to take care of all-embracing development of its territory and the needs of its citizens, as well as to protect during fulfilment of tasks the public interest as enshrined in laws. The Municipal Office is the executive body of the town. The Municipal Office’s position and competency is determined by Act No. 128/2000, on municipalities. Our vision for ensuring the mission is: Vsetín, the heart of the Valach region – a pleasant town for life, work and entertainment, a town striving to increase the quality of life while respecting sustainable development. The town’s priorities are as follows: a) Employment opportunities, b) Available housing, c) Leisure time opportunities, d) Healthy and charming town, e) Safe town.
What we want to improve: We want to permanently improve our citizens’ quality of life and the quality of public services provided or ensured by the town (i.e. quality for customers of these services). To do this, it is necessary: A) To have an overview of the needs of both the town and the region, to endeavour to satisfy
our citizens and customers so that “we do the correct things”, i.e. fulfil the town’s priori-ties and vision:
1. The town carries out activities and operations aimed at reducing unemployment so as to cre-ate in the town and region conditions for the creation of motivating employment oppor-tunities.
2. We create conditions to improve the availability of services, care (including health and social care), education and possibilities for social, cultural and spiritual life. The ser-vices also include services provided by the Municipal Office (including execution of state ad-ministration), the town police, technical services, organisations and companies of the town. It is also important to improve citizens’ and customers’ information about the services provided and the activities carried out.
3. Health is one of the crucial values of human life. We strive to ensure that our citizens have a sufficient amount of possibilities for a healthy lifestyle and sports.
4. The possibility to acquire appropriate housing is essential for the life of us all. Those who have a dwelling want to live in a pleasant environment, in a nice, clean – neat town. The town creates the preconditions for this within the framework of its sources.
5. Satisfaction is enhanced by prevention and safety. The town either directly or in coopera-tion with others strives for prevention and safety as regards criminality, road safety, as well as security of supplies of heat, water and other media.
B) Managing and financing of activities in such a manner that they ensure satisfaction of our citizens: 6. The town’s Board, Municipal Office or organisations and companies are approached by a
large number of citizens, entrepreneurs, associations and other organisations with requests

22
for improvement of the standard of a service provided (public transport, promptness of processing requests, etc.), as well as requests for co-financing and contributions, or requests for building up and repairing footpaths, roads, the sewer system, flats and other construc-tions. The town’s finance is limited. Therefore, responsible financing is necessary so as to prevent the town incurring unsustainable indebtedness, and it is also necessary to seek possi-bilities for financing from various sources (the state, the EU, the region, financial participa-tion of an applicant, etc.).
7. As regards the means laid out by the town or its organisations, we always strive to ensure effective management of finance, as well as the town’s property.
C) Carrying out activities (internal processes) “in the correct manner”, so as to make citizens
and customers satisfied and, at the same time, to ensure sufficient financing of activities and economic efficiency:
8. A large proportion of the town’s budget is earmarked for investments. Therefore, sound, effective and thorough preparation and implementation of investment projects is neces-sary.
9. The basis for satisfying citizens and customers and also for economic efficiency and securing sources is everyday high-quality activity of the Municipal Office (the Board, the Council, Committees, Office), the town police, technical services, educational, cultural, sports and other facilities. The Municipal Office applies decision-making based on facts, a proce-dural and systemic approach, active involvement of employees and partners, and other prin-ciples of quality management. Taken into consideration are the sustainable development prin-ciples and the methodology of the National Network of Healthy Towns. We comply with all current and future legal requirements in independent and delegated operation. In addition, the Municipal Office has implemented and practised an integrated system of quality manage-ment and environmental soundness.
10. A significant amount of activities ensured and carried out by someone else take place in the town. To achieve success, it is pragmatic to create conditions for effective partnership for implementation of intentions, plans, enterprise and education, as well as transparent conditions for support of societies and non-profit organisations.
D) In order to accomplish all this, we must learn or improve: 11. Any activity is much more successful if all those involved strive to strengthen the environ-
ment of cooperation, trust and responsibility. It is important to improve the environment for the visitors to the Municipal Office and the town, as well as the working environment and climate for employees. An integral part of the conception is enhancing the responsibility for quality and environmental soundness at the Municipal Office, all its organisations and com-panies, and also creating the conditions for communicating these principles further (other au-thorities, institutions, schools and enterprises operating in the territory of the town and re-gion).
12. In today’s increasingly complex world, it is necessary to master technologies that can help the Municipal Office to more easily find and finance correct solutions for citizens. An important role is played here by constant improvement of community planning and project man-agement. This knowledge is especially crucial when financing activities from EU sources.
13. Carriers and instigators of all activities are people – their willingness, abilities, knowledge, skills, qualifications. To achieve success, it is important to develop skills and knowledge, implement new methods and effective technologies.

23
Register of environmental aspects
Environmental impact
Assessment of environmental impact conse-
quence
Nu
mb
er
Activity, service
Nu
mb
er
Environmental aspect
Nu
mb
er
Environmental impact
Occ
urre
nce
prob
-ab
ility
E
nvir
on. d
amag
e co
nseq
uenc
e C
hang
e po
ssib
il-ity
R
equi
rem
ents
fu
lfilm
ent
Impa
ct o
n im
age
of M
O V
setín
Tot
al e
nvir
on.
con
sequ
ence
Lim
it 2
005
Lim
it 2
006
Objective /
measure
1. Operation of automobiles 1.1 Parking – distinct leakage of op-eration fillings 1.1.1 Pollution of rock environment 1 2 3 1 1 8 10 9
1.1.2 Waste water pollution 1 2 3 1 1 8 10 9
1.2 Starting of engine, drive away, braking, steady driving of automo-biles
1.2.1 Noise emissions from engines 3 2 1 1 1 8 10 9
1.2.2 Emissions of air pollutants from exhausts 3 2 1 1 1 8 10 9 Em
ploy
ee t
rain
ing
1.2.3 Emissions of solid pollutants from clutch disk wear 2 4 1 1 0 8 10 9
1.2.4 Emissions of solid pollutants from tyre wear 2 2 1 1 0 6 10 9
2. Storage of substances hazard-ous to water (oils, diluents, liquid and hazardous waste)
2.1 Impaired tightness of casing (tank) 2.1.1 Risk of pollution of surroundings and subse-quently waste water 1 4 1 1 1 8 10 9
3. Heating of building Svárov 1080 3.1 Thermal energy consumption 3.1.1 Reduction of energy intensity of operation 3 2 1 1 1 8 10 9
4. Occupancy and cleaning of administrative buildings 4.1 Office activities 4.1.1 Formation of municipal waste 3 2 3 1 3 12 10 9
Objective No. 3 recycling, training, audit
4.2 Workplace lighting, operation of office technology, noise of com-puters
4.2.1 Electric energy consumption 3 2 1 1 1 8 10 9
4.2.2 Formation of wastes (discarded equipment, discarded paper) 3 2 1 1 2 9 10 9
4.2.3 Electromagnetic radiation 3 2 2 1 1 9 10 9 Analysis of workplaces
4.2.4 Luminous well-being 2 2 1 1 1 7 10 9
4.2.5 Noise from computing technology 2 2 2 1 0 7 10 9

24
4.2.6 Dust burden 2 2 2 1 1 8 10 9
4.3 Communication with the use of connecting links (radio stations and mobile phones)
4.3.1 Increased level of electromagnetic pollution of the environment 2 2 1 1 0 6 10 9
4.4 Use of welfare facilities 4.4.1 Water consumption, formation of sewage effluent 3 2 1 1 1 8 10 9
4.5 Wet cleaning, washing floors and equipment 4.5.1 Water consumption, formation of sewage
effluent 3 2 2 1 1 8 10 9
4.5.2 Formation of wastes from packaging of deter-gents 2 2 1 1 1 7 10 9
4.5.3 Formation of wastes – used cleaning agents 2 2 1 1 1 7 10 9
4.6 Dry cleaning 4.6.1 Formation of wastes (residues) 2 2 1 1 1 7 10 9
4.6.2 Noise from vacuum cleaners 2 2 1 1 1 7 10 9
4.6.3 Electric energy consumption 2 2 1 1 1 7 10 9
5. Various types of accidents, dissonant operation 5.1
Release of substances in their essence and quantity xenobiotic for the given environment
5.1.1 Causing environmental damage 1 4 1 1 2 9 10 9
6. Management of non-residential premises 6.1 Use of welfare facilities 6.1.1 Water consumption, formation of sewage
effluent 3 2 1 1 1 8 10 9
6.2 Wet cleaning, washing floors and equipment 6.2.1 Water consumption, formation of sewage
effluent 2 2 1 1 1 7 10 9
6.2.2 Formation of wastes from packaging of deter-gents 2 2 1 1 1 7 10 9
6.2.3 Formation of wastes – used cleaning agents 2 2 1 1 1 7 10 9
6.3 Dry cleaning 6.3.1 Formation of wastes (residues) 2 2 1 1 1 7 10 9
6.3.2 Noise from vacuum cleaners 2 2 1 1 1 7 10 9
6.3.3 Electric energy consumption 2 2 1 1 1 7 10 9
7. Management of water-supply facilities 7.1 Use of water-supply facilities 7.1.1 Water consumption 3 2 1 1 1 8 10 9
7.2 Use of water-supply facilities 7.2.1 Quality of water 1 6 2 1 2 12 10 9
The following criteria have been determined for assessment: Occurrence probability: Environ. damage consequence: Change possibility: Requirements fulfilment: Impact on image of MO Vsetín 1. sporadically 0. none 0. none 1. smooth 0. none 2. occasionally 2. small 1. small 2. bordering limit 1. small 3. often, permanently 4. medium 2. medium 3. occasional excess of limit 2. medium
6. large 3. large 3. large Environmental damage consequence = scope, consequence, duration

25
Environmental objectives of the Municipal Office of Vsetín for 2004 – 2005 and on
Planning Description Responsibility Deadlines
Objective 1 Ensuring quality water for consumers from wells and small water-supply facilities of the town
Administration of assets Dept., Investment Dpt. 12/2005
Target value Analysis and quality control of water in water-supply facilities and their construction and property settle-ment
Environmental programme Increasing quality of water Activity 1 Analysis and quality control of water in water-supply facilities of the town Administration of assets Dpt. by 31.12.–annually Activity 2 Construction and property settlement of water-supply facilities owned by the town Administration of assets Dpt. 12/2005 Objective 2 Improvement of the environment in the town of Vsetín Environment Dpt. 12/2003-annually
Target value 70% fulfilled activities of the Plan of Health and Quality of Life for 2004 20% ongoing activities of the Plan of Health and Quality of Life for 2004
Environmental programme Fulfilment of activities of the environmental section of the Plan of Health and Quality of Life for 2003 Activity 1 Quarterly control of fulfilment of the Plan of Health and Quality of Life Environment Dpt. Activity 2 Preparation of the plan for 2004 – 2006 Environment Dpt. 12/2005 Activity 3 Ensuring evaluation Environment Dpt. 1/2006 Activity 4 Discussion with the public Environment Dpt. 2/2006 Activity 5 Adoption by the Board Environment Dpt. 2/2006
Objective 3 Reduction of the amount of unsorted municipal waste in administrative buildings of the Municipality of Vsetín Environment Dpt.
Target value 5% reduction of municipal waste per official in comparison with the 1st half of 2004 Environmental programme Reduction of the amount of produced municipal waste
Activity 3
- Reduction of the amount of municipal waste by means of controls focused on methods and forms of recy-cling
- Analysis and evaluation of the effect of recycling in 2003 and 2004 - Verification of the effect of Directive No. ES 72 -01
Environment Dpt. Environment Dpt. Environment Dpt.
08/2005 04/2005 03/2005
Objective 4 Solution and participation in the European Union programme – ISPA “CLEAN RIVER BEČVA” Environment Dpt. 12/2006
Target value Improvement of basic indicators of surface water quality in municipalitieswith the existing wastewater puri-fication plant by 20%, with newly built wastewater purification plants by 60%
Environmental programme CLEAN RIVER BEČVA project i.e. improvement of quality of surface and subsurface water in selected localities by the end of 2006 by means of investment in sewerage systems and wastewater purification plants amounting to CZK 1.5 billion

26
Activity
Determination of localities complying with the EU directive, drawing up of a plan and study, preparation of basic materials for the application, preparation of project documentation, discussion with citizens and the public about the purpose, intentions and goals of the project, planning and building procedure of individual constructions, subsequent approval procedure of the constructions
Environment Dpt.
Objective 5 Transfer of environmental soundness principles to other subjects controlled by the Municipality of Vsetín Environment Dpt.
Target value 1 Carrying out 18 subsequent environmental audits at organisations controlled by the town Environment Dpt., Education and Culture Dpt. 12/2004
Target value 2 Preparing 20 articles a year related to the environment for the newspaper Vsetínské noviny Environment Dpt. 12/given year Target value 3 Ensuring training of all the town’s employees concerning environmental soundness Environment Dpt. 09/2005 Environmental programme Extending the awareness of environmental soundness, carrying out controls of fulfilment of objectives Activity 1 Training and educational programmes Head of Environment Dpt. 08/2005 Activity 2 Audits of organisations established by the Town of Vsetín Environment Dpt. 12/2005
Activity 3 Work with the public through the media Environment Dpt., Education and Culture Dpt. Continuously
Objective 6 Elimination or reduction of environmental impacts of activities Administration of assets Dpt. 12/2004
Target value Elimination of workplaces with burden Environmental programme Improvement of the quality of the working environment Activity 1 Carrying out analysis of property and implementing possible elimination measures Administration of assets Dpt. 31.1.2005
Objective 7 Commencement of monitoring of the European set of sustainable development indicators Environment Dpt. 12/2005
Target value Monitoring of at least 8 indicators out of 10 by the end of 2007 and 5 indicators by the end of 2005 Environmental programme Improvement of the quality of life in the town Activity 1 In cooperation with TIMUR, updating Indicator A4 – Availability of local public green areas and services Environment Dpt. 31.5.2005 Activity 2 Updating Indicator A 5 – Quality of local outdoor air Environment Dpt. 31.5.2005 Activity 3 Updating Indicator B6 – Children’s journey to and from school Environment Dpt. 31.5.2005 Activity 4 Updating Indicator B 7 – Sustainable management of the local authority and local businesses Environment Dpt. 31.5.2005 Activity 5 Ensuring Indicator A 1 – Citizens’ satisfaction with the local community Environment Dpt. 31.5.2005 Activity 6 Ensuring Indicator A 3 – Local mobility and passenger transportation Environment Dpt. 31.5.2005 Activity 7 Seeking sources for monitoring other indicators Environment Dpt. 31 12.2005 Activity 8 Submitting a report to the Board every year Environment Dpt. 30. 9. annually Objective 8 Launch of monitoring of the ecological footprint Environment Dpt. 12/2005
Target value 1 Ascertaining of the ecological footprint of all primary schools Education and Culture Dpt. (Environ. Dpt.) 31. 12. 2004

27
Target value 2 Ascertaining of the ecological footprint of the Municipality of Vsetín Environment Dpt. 31. 12. 2005 Target value 3 Ascertaining of the ecological footprint of the town Environment Dpt. 31. 12. 2005 Environmental programme 1 See target value 1 Environment Dpt. 31. 12. 2004 Environmental programme 2 See target value 2 Environment Dpt. 31. 12. 2005 Environmental programme 3 See target value 3 Environment Dpt. 31. 12. 2005 Environmental programme 4 On the basis of results, setting of target values for next years Environment Dpt. 31. 12. 2005

28
3 European indicators of sustainable development
The set of European Common Indicators (ECI) of sustainable development at a local level origi-nated as an initiative of the European Commission. Their origination took place in two phases – theoretical preparation and pilot testing. The initiative aims to support local authorities in work leading to sustainability and providing comparative information pertaining to sustainable devel-opment throughout Europe. The indicators make it possible to see problematic areas and show ways how to resolve them. Application of a uniform set of chosen criteria will make it possible, among other things, to assess how a particular municipality is doing in comparison with other municipalities and facilitates cognition of their strengths and weaknesses.
Local authorities throughout Europe are encouraged to join the monitoring initiative through adopting common European criteria and integrate them into the current systems of self-government management. Local authorities should also take an active part in the development of this set of voluntarily adopted criteria throughout the duration of the testing period.
Above all, inhabitants of towns and municipalities themselves obtain continuous information about the evolution of key aspects of their community’s economic, social and environmental de-velopment. They can monitor the consequences of decision-making in local politics and then argue in favour of their justified interests, as well as effectively participate in decision-making. They come to know of some of the strengths and weaknesses of the place in which they live and if they are looking for a place with a good quality of life, they can according to the published re-sults of evaluation of selected indicators choose a municipality or town that meets their require-ments and ideas about a satisfied and healthy life. Municipal representatives acquire feedback on the municipal policy’s success.
A number of indicators evaluate the inhabitants’ subjectively expressed satisfaction with the de-velopment in the selected area, thus politicians can in some cases review the priorities of their voters. They can “boast” the results of their own activities and deeds aimed at local sustainable development. In addition to the municipal office, the results achieved from monitoring the sus-tainability indicators are also used by, for example, the town police, transport utility, individual schools and other organisations. Results from monitoring the indicators can also be used in the case of lodging an application for financial support from European Union funds.
To date, the ECI initiative has been joined by more than 160 towns, mainly from European Un-ion countries, of which 12 towns in the Czech Republic. Methodological support for monitoring European Common Indicators in the Czech Republic is provided by the TIMUR1 initiative (www.timur.cz). A town thus becomes part of this network, which makes it possible by means of the indicators to compare its results with those of other towns. However, it is necessary to ap-proach this comparison with caution, since towns have different starting geopolitical conditions 1 TIMUR – Team Initiative for Local Sustainable Development. It was created in 2002. Its mission is support for sustainable development of towns, municipalities and their associations in the Czech Republic and implementation of local sustainable development indicators. It originated as a free association of non-governmental not-for-profit organisations and partner towns. It was founded by three organisations: Ústav pro ekopolitiku, o.p.s. (Institute for Environmental Policy), REC Česká republika and Agentura Koniklec.

29
and characteristics. Comparison can be primarily applied in groups of towns of similar size. Therefore, the great advantage of the ECI set is that it determines the standard for monitoring sustainability throughout Europe with a high number of involved towns. More important than comparison, however, is repeated monitoring of the same criteria within the involved towns, which makes it possible to reveal the originating positive or negative trends. If we encounter a problem, an indicator can help us determine which method to choose for tackling it.
A general precondition for successful involvement of a particular municipality is interest on the part of the town’s representatives (either representatives of local government or state administra-tion) in the issue of indicators and objective evaluation of the town’s development and the quality of life of its citizens. It concerns a voluntary activity. Therefore, its success depends on a positive approach of the people concerned. Also in evidence must be the willingness to freely disseminate the information obtained, even in the case that it does not give an entirely flattering picture of the town and the work of its managers. When it comes to the towns in the Czech Republic that have joined so far, the opposite is true – the results of the hitherto monitored indicators are in general better than those of their Western European counterparts.
One of the important entry conditions for the success of long-term monitoring and evaluation of indicators is support on the part of the municipal representatives. Hence, preference is given to political approval of accession to the initiative by the Board of Representatives and/or the Mu-nicipal Council. This is usually preceded by several meetings of TIMUR representatives with rep-resentatives of the town, presentation of criteria and the initiative, and preparation of a reason report for the Board of Representatives. As a rule, part of the Board of Representatives’ resolu-tion on accession to TIMUR is assignment of a responsible person within the municipal author-ity, determination of the number of criteria to be monitored and the deadline for their evaluation and presentation for elected representatives of the town.
Implementation and monitoring of indicators not only depends on the personal responsibility of municipal representatives, it also places certain requirements for time and human capacity, espe-cially of the staff of several selected departments of the town (environment, development, educa-tion and culture). Furthermore, it means covering costs connected with monitoring and evalua-tion of data and making the obtained information public.
For the present, it is evident that a number of European indicators have brought about results that towns would sooner or later gather for another purpose (noise study, mobility study, etc.), or data monitored continuously (immission situation).
In 2002 and 2003 a pilot project for implementation of European Common Indicators of local sustainable development took place which led to the involvement of two towns in the Czech Republic – Vsetín and Hradec Králové. In 2004, other towns – Svitavy and Krnov – and the Záhoran microregion joined. In 2005 the initiative was successfully extended to include other partner towns (Chrudim, Kladno, Mladá Boleslav, Třebíč, Příbram, Velké Meziříčí, Děčín, Ko-přivnice).
The first-generation set of ECIs includes a total of ten indicators, or thematic groups. Last year, during evaluation of the first phase of indicators, an additional, eleventh, indicator was proposed – the ecological footprint.

30
Survey of European Common Indicators
A. 1 Citizens' satisfaction with the local community A. 2 Local contribution to global climatic change A. 3 Local mobility and passenger transportation A. 4 Availability of local public green areas and local services A. 5 Quality of local outdoor air B. 6 Children's journey to and from school B. 7 Sustainable management of the local authority and local businesses B. 8 Noise pollution B. 9 Sustainable land use B. 10 Products promoting sustainability
Ecological footprint
3.1 Indicator A. 1 – Citizens’ satisfaction with the local community
Citizens’ quality of life is an important part of sustainable society. It means the possibility to live in conditions that include safe and inexpensive housing, the availability of basic services (schools and education, health care, culture, etc), interesting and satisfactory work, a high-quality envi-ronment and the real possibility to take part in local planning and decision-making. Citizens’ opinions of these issues represent a relevant criterion of overall satisfaction with the given place and, accordingly, they are an important indicator of local sustainability.
The indicator shows citizens’ satisfaction with the life in the municipality (town), as well as satis-faction with various features of the functioning of the municipality (town) and the quality of pub-lic services.
Fulfilment of the indicator is carried out by means of a questionnaire inquiry of a representative sample of citizens of the municipality or town. The representative sample of citizens of the mu-nicipality (town) is selected from a register of inhabitants (older than 18 years of age, several per-sons from the sample should not live in the same household). In the ideal case, questionnaires are distributed by trained persons (students, pensioners…), who not only fill in the questionnaire directly with citizens, but also check the data filled in. Another possibility is distribution by mail or through a municipal newsletter. However, the return and quality of data is low.
The size of a representative sample depends on the size of the municipality (town) and ranges between 700 and 1,000 respondents.

31
Picture 2: Results of Indicator A1 – Citizens’ satisfaction
Results of Indicator A. 1 as a whole for the town of Vsetín Citizens' satisfaction with the local community
33.30%
51.00%
13.90% 2.40%
0%
10%
20%
30%
40%
50%
60%
Very satisfied Satisfied Dissatisfied Very dissatisfied
3.1.1 Comparison of results with other towns of the Czech Republic
Table 1: Comparison of results with other towns of the Czech Republic
How satisfied are you with (0 – lowest, 10 – highest):
Vsetín Chrudim Hodonín Krnov Velké
Meziříčí Třebíč
interhuman relations in the municipality? 6.60 6.61 6.29 5.89 6.90 6.46 the possibilities for your hobbies? 6.87 7.04 6.93 6.05 6.84 6.80 basic public services? 6.85 6.58 6.96 - 7.18 6.48 the quality of the environment? 7.18 6.76 6.27 5.97 6.75 6.93 the employment opportunities in your town?
3.43 4.18 3.06 2.32 4.55 2.87
the possibilities of participating in local planning?
5.33 4.64 5.44 3.09 5.59 4.80
Table 2: Comparison of results with other towns of the Czech Republic
Evaluate the quality of services (0 – lowest, 10 - highest):
Hodonín Chrudim Vsetín Třebíč
Sports facilities 7.16 8.12 7.16 6.85 Theatres and cinemas 6.39 7.74 5.9 6.48 Museums, exhibition halls 6.98 8.00 6.72 6.34 Community centres 6.91 6.33 6.05 6.03 Libraries 8.02 8.58 7.69 7.25

32
This indicator’s results are a demonstration of feedback for a local government that knows its citizens’ opinions of the town’s status and the quality of life in it. It is also possible to include in the questionnaire other questions about topics reflecting the current situation and problems in the town.
3.2 Indicator A. 2 – Local contribution to global climatic change
This indicator is identical with CO2 emissions produced per citizen (the total quantity and change with regard to the reference year). The methodology has already been drawn up but not made use of yet.
3.3 Indicator A. 3 – Local mobility and passenger transportation
The indicator aims to ascertain the time spent travelling, the number of local citizens’ everyday journeys, the total average daily distance per person per type of journey and type of transport and, last but not least, the type of journey and type of transport.
The indicator’s fulfilment is carried out in the same way as in the case of Indicator A1 – i.e. by means of inquiry of a representative sample of citizens of a municipality or town. The standard-ised questionnaire for this indicator is simpler than that of evaluating citizens’ satisfaction and comprises only 3 questions. For the sake of saving financial costs, it is advantageous to combine the two questionnaires, which has proved well in practice during monitoring of the indicator in the three pilot towns, Vsetín, Chrudim and Hodonín, in 2004.
The most important indicator taken into consideration is the ratio between so-called hard trans-port (primarily automobile) and soft transport (cycling transport, public transport, pedestrian transport). It is generally known that in the early 1980s this ratio in Czech towns was 20:80 in favour of soft transport. The trend is the endeavour to reduce the share of hard transport – envi-ronmentally unsound. Unfortunately, the practice is in the opposite direction – automobile trans-portation keeps growing, especially the volume of hard transport.
Picture 3: Share of transportation in Vsetín
Share of transportation in Vsetín (September 2004)
0.30%
21.80%
0.40%
13.70%23.30%
40.50%
0,00%
10,00%
20,00%
30,00%
40,00%
50,00%
Pedestrian Passengercar
Cycling Taxi Motorcycle Publictransport

33
The inquiry results have confirmed a 76 per cent share for soft transport and 24 per cent share for hard transport. Ensuing from this is the fact that in Vsetín a higher percentage of environ-mentally sound transport is applied. However, there is still a relatively high environmental burden in consequence of using passenger cars. For comparison, in terms of the transportation share, European cities also monitoring the mentioned indicators state the following ratio between the hard and soft transport. The data are stated in per cent: Oslo [N] 43:57, Maribor [SLO] 57:43 and Bristol [GB] 58:42.
Picture 4: Indicator A3 Local transportation
The indicator’s results have found extensive use in the practice of Czech and Moravian towns. They allow for better planning of public transport links and improvement of public transport in terms of time distribution of links and higher travelling comfort. In the majority of pilot towns, this indicator serves for the municipal offices planning to further develop cycle tracks and take measures in support of environmentally friendly types of transportation. A town gains a detailed overview of the type of transportation used by its citizens. The indicator provides qualified argu-ments for the town’s elected representatives. Several parameters of the indicator can be com-pared with higher levels (Czech Republic, the EU).
When evaluating the use of transportation means, it can be seen that Vsetín is doing very well. Unlike other European towns, it gives preference to environmentally sounder types of transpor-tation.

34
3.4 Indicator A. 4 – Availability of local public green areas and local ser-vices
Availability is defined as housing within 300 metres of public green areas or local services.
Public green areas are defined as public parks, gardens and open areas serving exclusively for pedestri-ans and cyclists, with the exception of traffic islands and dividing bands and cemeteries (besides the cases when the local government admits their recreational function and/or natural, historical and cultural importance); unroofed sports facilities, available to the public free of charge; private areas (agricultural areas, private parks), available to the public free of charge.
3.4.1 Basic services are defined as follows:
− Primary health-care services for the public; − Public transport links with the frequency of at least part of the working day; − Public schools; − Shops with basic food and shops with fresh fruit and vegetables; − Separated waste collection services and containers for separated waste.
The most effective method for fulfilment of Indicator A.4 is using geographic information sys-tems (GIS). For the indicator’s enumeration, it is necessary to know the numbers of persons in individual marked facilities.
Picture 5: Availability of local public green areas

35
3.4.2 Availability of basic local services (in %)
Table 3: Availability of basic local services (in %)
Hradec Králové Vsetín Svitavy
Primary health-care services 71.6 49.2 48 Public transport links 94.2 - - Public schools 35.0 46.8 72 Shops with basic food and bakery products 71.0 82.8 91 Recycled waste collection places 98.6 87.6 53
The availability of public green areas and basic services to citizens is necessary for the quality of life and viability of the local economy of a sustainable community. Basic services near the place of residence also significantly reduce the necessity of travelling. Unmet basic requirements for food supply and provision of basic health care lead to a failure to satisfy social needs. Lack of shops with fresh fruit and vegetables in a certain part of a town is a sign of social exclusion and also poses a risk to health. Exclusion is also represented by lack of public transport for those dependent on it.
Thanks to the data obtained, it is possible to optimise allocation of containers for recycled waste, public transport stops, as well as influence the existence of shops and health-care consulting rooms. The acquired information can also be used as groundwork for town-planning, transporta-tion and other studies.
3.5 Indicator A.5 – Quality of local outdoor air
Bad air quality impairs human health, as well as the quality of life. Breathing contaminated air may cause a host of health problems, from asthma to cancer. Air pollutants can indirectly result in loss of local labour force and increased health-care expenditure, as well as loss of productive and protective ecosystems. Hence, clean air is a basic factor of sustainability.
Air quality includes assessment of its quality and preparation for implementation of a programme or plan determining measures or projects that must be carried out with the aim to put a cap on limits in the areas in which they are exceeded.
The monitored substances for which the number of immission limits per year was ascertained were: sulphur dioxide (SO2), nitrogen dioxide (NO2), dust particles (PM10), carbon monoxide (CO) and ozone (O3).

36
3.5.1 Number of cases of exceeded immission limits
Table 4: Number of cases of exceeded immission limits
SO2 NO2 PM10 CO O3 Ferrara [I] 0 0 54 0 11 Gdansk [PL] 0 0 4 0 7 Mantova [I] 0 0 51 0 54 Modena [I] 0 0 62 0 454 Parma [I] 0 0 89 0 531 Provincia Torino [I] 0 9 219 0 75 Svitavy [CZ] 0 0 0 0 0 Vsetín [CZ] 0 0 0 0 0
Air quality data are available to the public in an intelligible form. The indicator reflects even mi-nor changes in the quality of local outdoor air. Monitored are the main local air pollutants re-sponding to various pollution sources in a town (traffic, local fireplaces, waste incineration plants, etc). Comparing towns in terms of local outdoor air quality is possible here.
3.6 Indicator B. 6 – Children’s journey to and from school
According to the methodology of European Common Indicators, the main objective of this indi-cator is to ascertain which type of transportation prevails as regards children’s journeys to and from school. The target group is primary schools, but the selection can also be extended to in-clude nursery schools. The indicator’s monitoring can be divided into the summer and winter period and, in addition to the type of transportation, it is also possible to monitor other parame-ters too (the distance between the residence and school, the reason for travelling by car, prob-lematic places, etc.).
The indicator is monitored by means of a questionnaire inquiry which, unlike indicators A1 and A3, takes place directly at schools. Standardised questionnaires determined by the European methodology can be supplemented by locally specific questions, in line with the requirements of the town or representatives of schools. The inquiry is carried out either at all primary schools (and possibly nursery schools) in a town and in all classrooms, or in a representative sample. Prior to the actual inquiry, it is advisable to organise a meeting with school representatives where the objective and purpose of the inquiry is explained, as well as the manner of its execution. Sub-sequently, questionnaires are distributed to pupils, who fill them in either on their own (2nd grade pupils) or together with their parents or teacher (1st grade pupils). The results are put in a com-puter database and evaluated. It can take place within the framework of computing technology lessons at schools.

37
Picture 6: Indicator B6 Children’s journey to and from school
B .6 P ercen tage of ch ildren tran sported to an d from sch ool by car
7 8
3 9
6 .88 .7 81 0
1 31 5
3 1
2 1 .5
0 ,0
10 ,0
20 ,0
30 ,0
40 ,0
50 ,0
60 ,0
70 ,0
80 ,0
90 ,0
K ladno[C Z ]
V setín[C Z ]
N o rdM ilano [I]
T u rku[FIN ]
O slo [N O ]
3.6.1 Transportation shares
Table 5: Transportation shares
City On foot Cycling Public transport By car Other
Kladno [CZ] 57.9 0.4 20.3 21.5 0 Hradec Králové [CZ] 57.2 3.1 30.7 8.7 0 Vsetín [CZ] 68.8 2 22.4 6.8 0 Modena [I] 14 3 4 78 0 Nord Milano [I] 52 1 8 39 0 Bristol [GB] 54 1 11 31 4 Turku [FIN] 38 13 32 15 2 Aarhus [DK] 29 30 11 13 18 Oslo [NO] 78 2 9 10 1 Barcelona [ESP] 65 0 27 8 0
The indicator’s results can be used, for example, when making decisions about the process of optimising the network of primary schools in towns and cities, for strengthening the Town Police patrols (at crossings, etc.) and when planning public transport school links. The indicator can provide a guideline for deciding about priorities as regards reconstructions and building of a new transportation infrastructure. In Hradec Králové its results served as the basis for construction of a new circular crossroads with crossings at one of the most dangerous places in the city, as well as demarcation of new crossings through busy roads and additional construction of footpaths and modification of crossings for pedestrians. In Vsetín, the ascertainment that a small percentage of

38
pupils travel to school by bicycle led to the installation of secure racks for bicycles at all primary schools.
Ascertained within Indicator B. 6 was how children perceive their journey to and from school. The results are as follows (it concerns results attained in Vsetín):
Picture 7: Feeling of safety when going to and from school
Do you consider your journey to school safe?
yes 71%no 29%
In terms of safety of journeys to and from school in Vsetín, almost three-quarters of children consider their journeys safe. The children who do not consider their journeys to school safe most frequently stated as the reason absence of crossings (32% of respondents). Another typical rea-son threatening children’s safety on their journey to and from school is heavy traffic (30%).
3.7 Indicator B. 7 – Sustainable management of the local authority and lo-cal businesses
This relatively simple indicator monitors the proportion of small and medium-size enterprises in the given municipality or town which are certified according to the system of business manage-ment and audit in terms of environmental protection. The indicator also applies to public organi-sations in the town, including the municipal authority. In the Czech Republic it concerns certifi-cation according to EMAS and ISO 14000/14001. These systems of environmental management are also recognised by the European Union. Small and medium-size enterprises are considered businesses with more than 10 employees, in line with the respective recommendation of the European Commission. The indicator only applies to enterprises that have completed the certifi-cation procedure and obtained a certificate.
Indicator B7 is the only indicator from the set of European Common Indicators that can be ful-filled using existing and easily available data. A detailed record of the number of enterprises certi-fied according to the system of business management and audit in terms of environmental pro-tection is maintained in the Czech Republic by the agency EMAS, which is a part of the Czech Environment Institute.
The indicator offers the widest application in the case that an authority itself has undergone the certification procedure (in the Czech Republic, to date Vsetín, Česká Lípa and Prague 10). On the one hand, this creates a positive example for other municipalities and towns and, on the other,

39
provides local governments with the possibility to influence, for example, their suppliers and other subjects in the region. Data on the indicator can also be supplemented by a municipal in-formation system and in the event of repeated monitoring gives the town a picture of the devel-opment of the business environment in terms of the approach to environmental protection.
Picture 8: Percentage of organisations with environmental certification
B.7 Percentage of organisations with environmental certification
0.13
0.20
0.710.76
0.010.020.07
0.11
0.21
0.39
0.56
0.79
0
0,1
0,2
0,3
0,4
0,5
0,6
0,7
0,8
Mal
moe
[S]
Stoc
khol
m [S
]
Aar
hus [
DK
]
Osl
o [N
]
Nor
d M
ilano
[I]
Mod
ena
[I]
Gda
nsk
[PL]
Anc
ona
[I]
Vse
tín [C
Z]
Krn
ov [C
Z]
Svita
vy [C
Z]
Hra
dec
Krá
lové
[CZ]
Note: Values of foreign cities are from 2002, values of Czech towns from 2004
Table 6: Percentage of organisations with environmental certification
Town Indicator value
No. of enterprises
Environ-mental
certifica-tion
Social certi-fication
Certifica-tion in total
Vsetín 0.76% 794 6 0 6 Hradec Králové 0.13% 6003 8 0 8 Svitavy 0.20% 512 1 0 1 Krnov 0.71% 140 1 0 1
3.8 Indicator B. 8 – Noise pollution
Noise from the external environment can affect human health and well-being. A sustainable soci-ety should ensure for citizens the main urban functions, such as housing, work and mobility, without exposing them to “annoying” noise pollution.
3.8.1 The following data are monitored within this indicator:
a) The proportion of citizens exposed to high noise pollution levels from the external environment over the long-term;

40
b) Noise pollution levels in selected areas of a municipality (use instead of a), if the data for a) are not available);
c) The existence and degree of application of a noise prevention action plan. At the present time, citizens’ burden with noise pollution, especially from traffic, is in Czech and Moravian towns one of the most significant environmental problems. Detailed knowledge of this burden provides arguments for taking remediation measures and their identification.
3.9 Indicator B. 9 – Sustainable land use
This indicator concerns sustainable development, recovery and protection of soil and localities in towns and municipalities. Urban expansion results in extension of suburban areas to the detri-ment of virgin land and green areas. In many European, Czech and Moravian towns and cities the trend of abandoning areas with used and contaminated soil has appeared. Sustainable land use means effective land use in towns by means of targeted development of towns, minimisation of assignment of agricultural and virgin land to non-agricultural use and increasing the share of developed areas by means of recovery and refinement.
It is not easy to gain individual data since land use categories differ from the categories stated in land-use plans. However, several items of data (artificially created areas or specially protected areas) can be obtained from these documents. Although other phenomena in the town have been continuously recorded, their detailed register does not, on the most part, exist. To acquire the stated data, it is necessary to combine research in the field where individual information about the area is obtained, with the GIS environment, in which data are processed.
It concerns an indicator that is an important map and data groundwork for preparation of pro-jects tackling unsustainable land use, a groundwork for the updating and processing of land-use plans.
Picture 9: Share of specially protected areas (in %) – Czech and Moravian towns
Specially protected areas in a town
0.0%0.0%0.1%
7.2%
15.7%
0,0%2,0%4,0%6,0%8,0%
10,0%12,0%14,0%16,0%18,0%
Vsetín Chrudim Krnov Hradec Králové Svitavy

41
3.10 Indicator B. 10 – Products promoting sustainability
Products labelled environmentally friendly, organic, energy efficient and fair-trade products con-stitute the implementation of environmentally and socially sound solutions in agriculture, for-estry, food processing and other manufacturing processes. Households, businesses and local au-thorities can promote sustainability by means of purchasing these products.
The task is to ascertain to what extent households and organisations, including local authorities, buy products promoting sustainability.
3.11 Conclusion
What are the benefits of monitoring European indicators of sustainable development for munici-palities, and what are the benefits for citizens?
3.11.1 By acceding to evaluation of European indicators, a municipality acquires:
− Objective values of the quality of local life serving for preparation of development and strategic plans, land-use planning documentation;
− A system on whose basis it is possible to set priorities, in the case of long-term monitor-ing to assess development trends;
− Arguments in relation to citizens; − Basic data for applications, grants – it will enhance their credibility; − Exclusion of empirical and subjective evaluation of citizens’ problems; − Comparison with municipalities in Europe.
3.11.2 By acceding to evaluation of European indicators, a citizen acquires:
− Certainty that the municipality wants to work objectively, without local and other inter-ests;
− Proof of the municipality’s interest in managing public affairs in a transparent manner; − Certainty that the municipality is interested in citizens.

42
4 “Environmental audits of schools and educational organisa-tions” methodology
4.1 Introduction to environmental audits
In 1987 the World Commission on Environment and Development headed by the Norwegian Prime Minister Gro Harlem Brundtland issued a report entitled Our Common Future. It pro-posed that environmental problems be tackled by means of a new type of economic develop-ment, so-called SUSTAINABLE DEVELOPMENT, that would concurrently guarantee the con-servation of life on Earth. It concerns a development that would sustain the functions of nature and not reduce biological diversity, not threaten the interests of another nation and future genera-tions. Such a development presumes transition from anthropocentrism (= human needs are the most important) to perception of the world through biocentrism (= life as an entirety is the cen-tre of attention). It means implementation of technologies friendly to nature, lower demands for material and energy and facilitation of recycling of raw materials.
If a landscape is perceived as a geo-system whose behaviour when exposed to the mutual effect of nature, population and production is under the direct influence of society and the laws of eco-nomics, then resolving issues connected with the environment is conditioned on the active par-ticipation of all sections of production, scientific and other institutions that should deal with these issues. The mentioned institutions undoubtedly include schools. Education in environ-mental care is not an isolated item, it is equal to all other items in the entire educational system. Even though education in the sense of landscape design and protection, environmental conserva-tion does not only apply to youth and is a task for our whole society, a perspective route to its effective solution leads through responsible preparation of children and youths at schools.
Hence, it is natural that towns, as founders of primary and nursery schools, strive to support en-vironmentally friendly behaviour of schools and influence the thinking not only of pupils but also teachers and other staff of these organisations in relation to environmentally sound behaviour. The methodology serving to influence and create this behaviour is Environmental Audits of Schools, whose task is not only to ascertain the current status at schools as regards environmen-tally friendly behaviour but also to assist schools in remediation. The school environment is and will remain a suitable educational model for mimicking and improvement of behaviour models. In the final analysis, it also results in deepening of the relation between the founder and the given organisation, as well as facilitating the transformation of a school to gradually become a natural community and education centre in the particular area.
4.2 Purpose of the methodology
The purpose of this methodology is to ensure a uniform and unambiguous guideline for imple-mentation of environmental audits of schools and school organisations. In a generalised form it can also serve as a manual for environmental audits of other organisations financed from sources of a town.

43
4.3 Wider connections and objective of environmental audits
A school is a public institution within a town’s sphere of activity through which it is possible to both directly and indirectly transfer desirable values and behaviour formulae to a significant part of the population (children, parents, companies, etc.). Consequently, one of the objectives is to contribute to the fact that children feel good at school when learning and teachers feel good when teaching. The endeavour of towns is to deepen cooperation with schools as regards making operation more ecological, as well as to provide methodological assistance in remediation of an unsatisfactory status. It also concerns the establishment and deepening of cooperation between a town and individual organisations in such a manner that schools become for the town a partner for implementation of a common objective (building up a partnership).
The objective of environmental audits is set in such a manner as to support the objective of pub-lic administration.
The objective of public administration is to improve the quality of citizens’ lives while respecting sustainable development. Contributing to this is enhancement of the quality and effectiveness of individual public services. Education is one of the most important public services.
Picture 10: Schematic determination of the objective of public administration:
4.3.1 Specification of the main objectives of environmental audits
1. Demonstrating that public administration gives an example in environmental protection and abiding by the sustainable development principles.
2. Sending a clear signal to schools, school organisations and other non-profit organisations that environmental soundness, application of sustainable development principles in prac-tice, at the local level, is important for the municipal office.
3. Verifying the situation at schools, in school organisations and other non-profit organisa-tions and, if necessary, contributing to improvement of the status.
Objective of public administration
Improving the quality of life while respecting sustainable development
Improving the quality and effi-ciency of public services
Contribution of the envir. audit Contribution of the envir. audit - the opportunity to transfer cor-rect habits from school to family (waste separation, environmentally sound behaviour, responsibility,…) - creating a partnership of school, council and other partners for re-specting sustainable development
- making school operations and ac-tivities environmentally sound - improving the tuition milieu

44
4. Edification – if children are to separate waste at schools, increased waste separation can be expected in households too.
4.4 Specification of basic terms, abbreviations
4.4.1 Definitions, terms
Audit team – a group of persons appointed for the purpose of carrying out an audit; the ap-pointed persons can be employees of a local authority or other specialists in the given area.
Local Agenda 21 - a tool for implementation of sustainable development principles at the local and regional level. It is a process that by means of improving management of public affairs, stra-tegic planning (management), involvement of the public and use of all obtained knowledge about sustainable development in individual areas improves the quality of life in all its aspects and leads to citizens’ responsibility for their lives and the lives of other beings in space and time.
Healthy Cities project – a project of the World Health Organisation intended for towns and regions for implementation of Local Agenda 21. Information at www.nszm.cz
4.4.2 Abbreviations
EA environmental audit EF ecological footprint – comparison and evaluation of a school’s ecological operation
(consumption of energy, materials, goods and areas), related to one pupil EVVO environmental education, training and edification LA 21 Local Agenda 21 MŠMT Ministry of Education, Youth and Sports of the Czech Republic MŽP Ministry of the Environment of the Czech Republic
4.5 Content of environmental audits
4.5.1 The main content is:
1. Verification of fulfilment of the Methodological Direction for Environmental Education, Training and Edification of the MŠMT, compliance with and ful-filment of the State Programme of Environmental Education, Training, Edifi-cation and Tasks of its Action Plan for 2004-2006 in related areas.
2. Verification of the availability of information about the environment and its protection, sustainable development in general.
3. Ascertainment of whether measures leading to a building’s ecological opera-tion and conditions for healthy lifestyle are fulfilled step by step and system-atically.
4. Ascertainment of how a school or school organisation maintains and melio-rates a school garden and the school’s immediate surroundings.
5. Ascertainment of a school’s environmental level – improving the aesthetics of the building of the school or school organisation.

45
6. Verification of whether a school or school organisation has joined EVVO programmes (eco-educational projects, programmes, cooperation with organi-sations dealing with EVVO, etc.).
4.6 Description of activity according to a time schedule
4.6.1 Preparation phase
Measure No.
Time duration before actual
auditing Description of activity
1. 6 months
A town’s decision about carrying out environmental audits – in the ideal case inclusion of environmental audits of schools and school organisations in the tasks of the Health and Quality of Life Action Plan for the respective calendar year.
2. 10 weeks Appointment of the chief auditor and other members of the auditors’ team. The audit team will prepare a methodology – a set of issues it will verify during the audit.
3. 8 weeks
Statutory representatives of schools and school organisations are in-formed of the town council’s plan to implement an environmental audit in their organisation. They are familiarised with the basic group of issues so as to have sufficient time for preparation.
4. 6 weeks Drawing up of a time schedule of audits’ implementation in individual organisations.
4.6.2 Implementation phase
Measure No.
Time duration from actual
auditing Description of activity
1. 6 weeks Gradual implementation of individual audits in institutions /organisations. It entails checking the respective documents and ex-amination of buildings, including school gardens and other related adjacent land the institution/organisation uses for its operation.
2. 10 weeks Evaluation of individual audits, drawing up of an audit report. Discus-sion of the audit report with statutory representatives of individual organisations.
3. 12 weeks Preparation and printing of an audit Certificate. It can be in the form of a graphic sheet the institution/organisation can draw.
4. 14 weeks Organisation of a gala meeting of statutory representatives of organi-sations with the town’s management and handing over of “Ecological School” or “Ecological Organisation” certificates. The certificates are valid for three school years.
4.6.3 Promotion of the project in the media
It is appropriate to visibly and purposefully promote the ongoing activities in the media:
− in local, regional and national press, radio and on television,

46
− organisation of an event for the public, explanation of the importance and interconnec-tion of EA activities and activities in the town, such as the Healthy Cities and Local Agenda 21.
4.7 Group of issues of environmental audits
The proposed group of issues is focused on schools and school organisations. The group of is-sues for other institutions/organisations must be adapted and modified.
1. Information about the environment and its protection, sustainable development in gen-eral, for pupils, teachers and other employees of a school, will be found in designated places in the school building.
2. Gradual and systematic taking of measures leading to ecological operation of the building and conditions for a healthy lifestyle:
− Promotion of healthy diet in the school canteen – whether the canteen’s technical background is in compliance with the valid legislation, diversity of meals, etc., whether the canteen actively cooperates with the Public Health Institute, boarders and parents.
− Promotion of healthy diet in the menu of school buffets and shops in the school building.
− The school has drawn up internal directions for waste management, including prevention of waste formation, separation, disposal and hazardous waste treat-ment.
− Waste separation is carried out in all available places – classrooms, the staff-room, studies, cloakrooms, the school canteen, etc.
− Containers for separated waste are placed in the school’s vicinity. − When purchasing materials and aids, within financial possibilities preference is
given to environmentally friendly products. (The Environmentally Friendly Prod-uct certified labelling, the CzechMade mark, etc.) Reduced to the lowest possible extent are products for one use (including promotion of purchasing drinks in re-turnable packaging, etc.).
− Use of residual and waste materials, for example, for leisure activities of after-school centres and school clubs.
− Abiding by energy management principles (insulation of the building, installation of window sealing, energy-saving taps, energy-efficient incandescent/fluorescent lamps, etc..).
− Other information related to the given issue the school may state.
3. The school systematically maintains and meliorates the school garden and the immediate surroundings of the school. The garden and surrounding nature is used for tuition in various subjects and for after-school activities.
4. The school’s environment – aesthetic improvement of the school building’s interior. Smoking is not tolerated at the school.

47
5. The school’s engagement in EVVO projects and programmes, own projects, cooperation with EVVO centres, relevant non-governmental, non-profit organisations, etc.
6. The school’s involvement in the town’s activities – participation in the Health and Qual-ity of Life Action Plan, Local Agenda 21, etc.
7. Monitoring of the ecological footprint – comparison with the previous period, calculation of the footprint’s size per pupil in comparison with other schools.
8. Children’s journey to and from school (a European indicator of sustainable development at the local level) – comparison of changes with the previous period.
9. The school fulfils the Methodological Direction for Environmental Education, Training and Edification of the MŠMT (appointment of an EVVO coordinator, the EVVO pro-gramme, inter-subject approach, specific activities), further education of teachers, the school’s equipping with teaching and lecture aids, measures leading to environmental im-provement of operation, etc.
10. The number of involved teaching staff (including their specialisation) in further education in the EVVO area (number of training courses, educational events, etc.).
Structure of environmental audits
The EA structure only includes basic issues the audit team can add, modify and extend.
4.7.1 A. Introduction
A. Brief characteristics of the organisation:
− The school’s identification data, the school’s focus (for example, language), − The school’s capacity, number of pupils, number of classes, number of teaching
and operating staff, − The school canteen’s capacity, number of pupils taking meals at the school can-
teen, − The after-school centre’s capacity, the number of pupils attending the after-
school centre, − Description of the building – the year of its placing into operation, the current
technical condition, description of main general repairs and reconstructions, − Description of implemented measures aimed at energy savings (for example, insu-
lation of the building). 4.7.2 B. Content of the audit
B.1. Waste management – the manner of waste treatment
− Control of the directive on waste treatment, − Verification of the contract on municipal waste removal (number of containers,
frequency of waste removal), − Waste separation control,

48
− Review and checking of the frequency of disposal of grease from a collecting re-ceptacle in the school kitchen,
− Checking the manner of disposal of biologically degradable waste originating as a result of the school canteen’s operation,
− Carrying out collection events.
B.2. Environmental education, training and edification
B.2.1. Educational process and edification
− Checking whether an environmental education coordinator has been appointed in compliance with the “Methodological Direction for Environmental Education, Training and Edification at Schools and School Organisations” issued by the MŠMT on 1. 1. 2002,
− Verifying further environmental education of the teaching staff, − Checking in what manner elements of environmental tuition are included in the
educational process (for example, in which subjects and how specifically, whether the school has facultative subjects focused on ecology),
− Checking whether and how waste materials are used for other activities, especially leisure activities at the after-school centre or club.
B.2.2. Cooperation with organisations and the municipality
− Involvement of the organisation in the town’s projects – a partner to Healthy Cit-ies, inclusion of activities in the Health and Quality of Life Action Plan, involve-ment in Local Agenda 21, participation in the campaign for healthy cities, etc.,
− Implementation of EVVO projects, involvement in environmental educational projects, etc.
B.3. Operational-technical area
− Verifying whether the school has introduced the drinking regimen, availability of beverages for pupils (installation of drinks machines),
− Checking the introduction of energy management, including records on the measures implemented,
− Verifying the drawing up of energy audits, − Checking promotion of healthy diet, − Reviewing equipment of the school canteen in linkage to sanitary regulations, − Checking fulfilment of tasks from sanitary examination in the school canteen.
B.4. Care of greenery and the environment at the school complex
− Evaluation of the level and condition of the school garden – maintenance of bushes and trees, amenity planting, cleanliness of the school garden, aesthetic ap-pearance, etc.,

49
− Assessment of the level and condition of school land plots and treatment of other beds, for example, flowerbeds,
− Review of the level of the technical condition and cleanliness of school play-grounds and sports grounds.
4.7.3 C. Ecological footprint
− Monitoring this European Common Indicator, comparison and evaluation of the school’s ecological operation, primarily consumption of energies, materials, goods and areas, related to one pupil.2
4.7.4 D. Children’s journey to and from school
− Introduction of this European Common Indicator, its evaluation and comparison of results with other schools3,
− Monitoring the development of transportation means for children’s journey to and from school, aimed to increase the share of cycling.
4.7.5 E. Statement of the monitored institution/organisation
− Proposals, questions, suggestions, − Intentions and plans in the given area.
4.7.6 F. Proposal for remediation measures, date of their implementation and responsi-bility
4.7.7 G. Conclusion
4.8 Evaluation
Designation of the implementation level on the scale of 1 – 5 points is used for evaluation of every question.
Characteristics of the evaluating degrees of the scale:
1. Activities are only sporadic, not systematic.
2. Activities are planned but not much has been done.
3. Several measures taken are already evident.
4. The school has done a lot, but we believe that it could do more.
5. The school has done the maximum possible under the given conditions.
2 The methodology of the European Common Indicator Ecological Footprint can be found on the website http://www.czp.cuni.cz/Indik/ekologicka_stopa.htm
3 The methodology of the European Common Indicator Children’s Journey to and from School can be found on http://www.timur.agenda21.cz/

50
If a school attains 50% or more of the total sum of points, it will be conferred the Ecological School certificate.
4.9 Budget
4.9.1 Costs for project implementation can be divided into two parts:
− Indirect costs connected with the project – primarily labour costs and, marginally, overhead costs,
− Direct costs laid out from the town’s budget – design, printing and framing of the Ecological School certificate.
4.9.2 Calculation of costs per audit of a primary school:
Table 7: Calculation of costs per audit of a primary school
Description of activity No. of staff
No. of hours of one worker
Total No. of hours
Average hourly wage,
incl. pay-ments
Total costs
INDIRECT COSTS Preparation phase Preparation of audits, issues, time schedule 4 3 12 135 1,620
Discussion with organisations’ man-agers 1 2 2 135 270
Implementation phase Carrying out one audit in an organisa-tion 5 5 25 135 3,375
Calculation of the ecological footprint 1 10 10 135 1,350 Processing ascertained results 3 4 12 135 1,620 Drawing up an environmental audit 1 5 5 135 675 Discussion with auditors and organi-sations’ managers 2 2 4 135 540
DIRECT COSTS Making of the Ecological School cer-tificate 500
TOTAL AUDIT COSTS 9,950
When a larger number of audits are carried out, savings concerning several activities are attained (for example, preparation, discussion with statutory representatives), with the total costs propor-tionally decreasing with the number of environmental audits.
4.10 Environmental audit outputs
Outputs can be characterised on three basic levels:
1. direct advance towards sustainable development (savings of materials and energies, in-creased share of separated waste, improvement of the aesthetic aspect of buildings’ inte-rior, surroundings, etc.),

51
2. enhanced environmental awareness among teachers and pupils (information materials, discussion forums, excursions, participation in EVVO projects and programmes, etc.),
3. increased interest and involvement in the Local Agenda 21 process, 4. expression of a school’s behaviour by means of the “Ecological footprint” indicator.
Another indirect effect is the gaining of a relatively effective tool that can be adapted for any other public institution in the town’s sphere of activity, or for the local authority itself. In addi-tion, it can be generalised and also applied within other municipalities in the Czech Republic.
4.11 Conclusion
Carrying out a school’s environmental audit can be one of many important small steps towards sustainable development of schools, towns and regions. The experiences of the town of Vsetín have confirmed this. Of importance is that the carrying out of environmental audits is not the only small step, but part of the set of measures taken by towns, schools, non-profit organisations and other partners in the territory of the town and region.
Inspiration for these steps can be found, for example, in the network of schools proceeding ac-cording to the “Healthy School” methodology or in the network of towns striving for improve-ment of the quality of life while respecting sustainable development principles (see www.nszm.cz). For instance, the town of Vsetín, in addition to environmental audits, has imple-mented in its primary schools the “Good School” project and has supplemented environmental audits with the “Healthy Lifestyle” audit. If interested, you can ask for information about these projects.
Acknowledgements are in order to all the staff of the town council and schools who participated in the drawing up of the methodology and environmental audits. Acknowledgements are also in order to all Vsetín councillors and representatives who made the carrying out of audits possible. Last but not least, acknowledgements are in order to the National Network of Healthy Cities and the towns of Chrudim and Hodonín, which took part in the methodology’s verification.
4.12 Appendices
Appendix No. 1 Draft structure of conclusion sheets at the level of the town and school

52
4.12.1 Appendix No. 1 – Draft structure of the conclusion sheet at the town level
Draft structure of the “conclusion sheet” at the town level:
1. Venue of the environmental audit of schools (EAS): 2. Date of the environmental audit of schools: 3. Number of schools involved in EAS:
− Number of nursery schools involved − Number of primary schools involved − Number of secondary schools involved − Number of apprentice schools involved − etc.
4. Composition of the audit team carrying out EAS: 5. List of remediation measures proposed by the audit team for individual schools, including
dates of remediation: 6. Comparison of environmental audits of nursery schools and primary schools: 7. Date of granting certificates to the schools involved: 8. Duration of the certificates’ validity: 9. Signatures of the audit team carrying out EAS:
+ attached copies of “conclusion sheets” from individual participating schools
Appendix No. 1 – Draft structure of the conclusion sheet at the school level
Draft structure of the “conclusion sheet” at the school level:
1. Basic data about the school (name, address, number of pupils/students, …): 2. Date of the EAS: 3. Composition of the team representing the school: 4. Evaluation of the school’s condition prior to the commencement of EAS (by individual
areas): − Waste management − EVVO − Care of greenery − etc.
5. Brief evaluation of the school’s condition following the implementation of remediation measures:
6. Signatures of the members of the school team carrying out EAS:

53
5 Ecological footprint
The ecological footprint is considered the 11th European common indicator and assesses the quantity of natural resources an individual, town, region and/or entire state consumes in a given year. Used for calculation are official consumption statistics that are converted to the amount of biologically productive land and water planes necessary for producing the particular resources and for waste assimilation while using the given technologies. With regard to the fact that people use resources from the entire planet and the pollution they produce affects very distant places, the ecological footprint forms the sum total of all areas from various parts of the Earth responsi-ble for our consumption.
5.1 Introduction
5.1.1 Calculation of the ecological footprint is based on five simple factors:
1. We can quantitatively determine the majority of resources we consume and wastes we produce. This information can be obtained from official statistics.
2. The majority of these resources and wastes can be converted into commensurate areas of biologically productive land (i.e. areas of arable land, pastures, forests, water planes, etc., in general ecosystems necessary for provision of live-giving systems).
3. These different areas can be expressed in the same units (hectares), if they are classified according to biomass production. In other words, every hectare (hectare of fields, forests, water planes, etc.) can be converted into the corresponding area with globally average productivity.
4. Forasmuch as every such area has a specific use and every standardised hectare comports with the same quantity of biological productivity, these hectares can be mutually added up. The aggregate forms humankind’s total demand for natural resources.
5. Society’s total demand can be compared with the natural supply of ecological services. Namely, it is possible to estimate the total part of the Earth that is biologically produc-tive.
5.1.2 Units of measurement
The ecological footprint is expressed in “global hectares”, which must not be mistaken with “real hectares”. The necessity to count global hectares arises from the fact that the ecological footprint is a sum total of various categories of biologically productive areas (for example, forests and fields) with different productivity. Every global hectare amounts to one hectare of biologically productive areas with “globally average productivity”. At the present time, the biosphere consists of 10.8 billion hectares of biologically productive areas, which corresponds to less than ¼ of the planet’s surface. Of this, 2.3 billion hectares is the area of productive oceans and seas and 8.5 billion hectares the area of productive dry land.

54
5.1.3 Conservative estimate
Its results underestimate the human impact on nature and overestimate biological capacity owing to:
1. Inclusion of every area only once, even though it provides two or more ecological ser-vices concurrently (a forest providing wood and water at the same time).
2. Selection of a more conservative estimate in the case of doubts.
3. The fact is reckoned with that current industrial harvesting methods (for example, in agri-culture and forestry) are sustainable, i.e. do not cause any yield loss in the future.
4. It does not include some human activities for which we do not have sufficient data
5. Exclusion of activities that constantly impair the regeneration ability of natural systems, such as:
− Use of materials and elements that are not sufficiently assimilated in nature (plu-tonium, PCB, CFC, etc.).
− Procedures that irreversibly damage the biosphere (species extinction, deforesta-tion, desertification).
5.1.4 Calculation of the ecological footprint
The following categories of areas providing consumption are used for calculation of the ecologi-cal footprint:
− “energy” land – the area necessary for drop in CO2 (ha/ per person) produced by fossil fuel combustion, or production of crops (biological fuel) necessary for re-placement of fossil fuel,
− gardens, pastures, fields, forests, water planes – areas necessary for provision of food, housing, transportation, consumer goods and other services,
− degraded land – areas unusable for natural production, asphalted, built-up, or otherwise degraded,
− areas for biodiversity conservation (protected areas, national parks).
5.1.5 Procedure when calculating the ecological footprint
1. Estimation of average personal consumption of selected items (from statistics, produc-tion + import-export)
2. Estimation of the corresponding area per capita (aa) for production of each of the se-lected
− consumed items “i” – acquired by dividing the average annual consumption of the item (“c” in kg/per capita) by its total annual productivity or yield (“p” in kg/ha):
aai = ci/pi

55
3. By adding up all corresponding ecosystem areas corresponding to all consumption items of the annual shopping basket we acquire the overall “ef” of a person:
4. The ecological footprint of the given population is acquired by multiplying the popula-
tion size (N) by the ecological footprint per capita, “ef”:
S = N(ef)
5.2 Ecological footprint of a town
A number of applications for calculating the ecological footprint aim at comprehensive assess-ment of towns’ sustainability. The increasing amount of applications at the level of towns and regions resulted in the EU Expert Group on the Urban Environment proposing that the ecologi-cal footprint become the eleventh indicator of European Common Indicators to whose monitor-ing the town of Vsetín acceded in 2003.
The expert group entrusted specialists in calculation of the ecological footprint (EF) with the drawing up of a SWOT analysis of existing approaches to the EF. The result is the proposal of the Sub-national geographical area Ecological Footprint tool – SGA-tool). This tool makes it possible for representatives of towns and regions to calculate the ecological footprint of their territorial entity in a simple and objective manner. The EF can be assessed on the basis of existing data available at the local level and no specific knowledge of the ecological footprint methodology is necessary.
5.2.1 Basics for calculating the ecological footprint at the municipal/regional level
When calculating the ecological footprint of a town (or region), it is suitable to issue from the national ecological footprint. This basic assessment contains data on ecological productivity, pro-duction of resources, wastes, and business. In calculating the ecological footprint of the Czech Republic, we can utilise the already published data (the most recent calculation of ecological footprints of the states of the world is contained in the report of the WWF “Living planet re-port” (WWF, 2004). A certain amount of data is contained in national statistics (the Czech Statis-tical Office).
5.2.2 Calculation of the ecological footprint of a town includes the following elements of the EF:
− Nutrition – plant and animal products and related energy. − Housing – household energy consumption, built-up areas, consumption of fuel
and wood, energy for house construction. − Mobility – energy consumption by individual types of transportation, areas built-
up with transportation infrastructure. − Goods and services – energy consumption connected with industrial production,
import/export, consumption of services, use of plant, animal and paper products.
The substance of the calculation is ascertainment of the given town or region’s differences (in per cent) from the national average. For example, if the traffic intensity (in person-kilometres) in the

56
particular region is 10% higher than the national average, the value of 110% is applied for the respective cell. In the event that data are not available in the given place, it is possible to leave national values.
The advantage of this approach is that the ecological footprint can be calculated by towns and regions of different sizes. The results can then be compared (at present, the tool has been applied in dozens of European towns and cities) and in the case of time series it is possible to assess pro-gress or deviation from sustainability.
5.2.3 Result – the ecological footprint of the town of Vsetín
The ecological footprint of Vsetín in 2004 was 3.80 gha/person, i.e. 76% of the national average of the Czech Republic (Table 8). Accordingly, the total EF of Vsetín was 109,178 gha. The data on the ecological footprint can be compared with the available biological capacity, whose national average is 2.8 gha/person. Thus, Vsetín creates a deficit amounting to 136%. The results are summed up in Tables 8 and 9, Picture 11.
Comparison of four towns of the Czech Republic whose ecological footprint has been calculated to date is shown in Picture 12. Vsetín forms the second-smallest ecological footprint per inhabi-tant. Comparison between towns is, however, limited due to different conditions and characteris-tics and different data quality from the given towns.
Picture 11: Ecological footprint of Vsetín
Ecological footprint of Vsetín, EF = 3.80 gha/inhabitant
Arable land23%
Pastures4%
Forests15%
Energy50%
Built-up areas4%
Water planes4%

57
Table 8: Size of Vsetín’s ecological footprint in global hectares/inhabitant
Size of Vsetín’s ecological footprint in global hectares/inhabitant
Energy Arable land Pastures Forests Built-up
areas Water planes Total
Czech Republic (LPR 2004) 2.95 0.92 0.14 0.69 0.15 0.14 4.99 Eco-footprint of the town 1.95 0.87 0.14 0.56 0.14 0.14 3.80 Deviation from the CR 66.0% 94.6% 100.0% 81.8% 95.8% 100.0% 76.3%
Table 9: Size of Vsetín’s ecological footprint in global hectares/inhabitant
Size of Vsetín’s ecological footprint in global hectares/inhabitant
Energy Arable land Pastures Forests Built-up
areas Water planes Total
Czech Republic (LPR 2004) 2.95 0.92 0.14 0.69 0.15 0.14 4.99 Eco-footprint of the town 1.95 0.87 0.14 0.56 0.14 0.14 3.80 Deviation 66.0% 94.6% 100.0% 81.8% 95.8% 100.0% 76.3% Foodstuffs 0.17 0.67 0.14 0.14 1.13 of plant origin 0.08 0.30 0.38 of animal origin 0.09 0.38 0.14 0.14 0.75 Housing 0.36 0.02 0.05 0.42 Electricity 0.30 0.30 Natural gas 0.06 0.06 Oil District heating Coal "Green" electricity Biomass 0.02 0.02 Other Transport 0.21 0.01 0.22 Passenger cars 0.08 0.00 0.08 Buses 0.03 0.00 0.03 Rail transport 0.03 0.00 0.03 Water transport 0.00 0.00 Air transport 0.07 0.00 0.07 One-track vehicles 0.00 0.00 Goods 1.08 0.06 0.00 0.15 0.09 0.00 1.38 Of which.. Shops with goods -0.16 -0.16 Other goods 1.24 1.24 (except building industry) Services 0.11 0.11 Hotels & restaurants 0.00 0.00 Education & health care 0.03 0.03 Communal, social and per-sonal services 0.01 0.01
Public administration 0.06 0.06 Trade 0.01 0.01 Other goods Building industry 0.02 0.39 0.41

58
Picture 12: Comparison of EF of four towns in the Czech Republic
Comparison of EF of four towns in the CR (gha/person)
3.263.804.12
5.14
0
1
2
3
4
5
6
Kladno Velké Meziříčí Vsetín Chrudim
5.3 Ecological footprint of a school
In recent years, applications of calculation of the ecological footprint have been developed at lower levels than the state or town. They include calculation of the ecological footprint of indi-viduals (a simple questionnaire in Czech is at the address www.hraozemi.cz/ekostopa) or indi-vidual products and constructions.
Serving as an example can be calculation of the ecological footprint of schools. It not only allows for assessing the environmental sustainability of a school building and some services and activi-ties of schools, but can also be a suitable part of EVVO and the environmental audit of the given school. It is advisable to engage in the assessment pupils and their teachers who can jointly within various subjects collect the data necessary for calculation of the ecological footprint (table of in-put data, see Table 10).
Table 10: Ecological footprint of a school – input data
Ecological footprint of a school – input data EF item Category Result Unit
1. Number of pupils in the given school year number Number of pupils and employees 2. Number of employees in the given school year
3. School land plots in total m2
4. Of which built-up areas – school building + related buildings (after-school centre, gym, etc.) - in total
M2
5. Floor space in multi-storey buildings 6. Year of construction of the school building year 7. Estimated service life of the school building in years 8. Year of insulation of the school building year
School building and land plots
9. Total electricity consumption in the school building kWh

59
10. Gas consumption in the school building kWh 11. Heat and hot service water consumption kWh 12. Water tariff M3 13. Sewage charge M3
14. Energy-saving appliances used at the school YES, NO, PARTIALLY
15. Number of school canteen boarders number Foodstuffs 16. Share of meatless meals % 17. Transported by – car % 18. - public transport % 19. - bicycle %
Transport to/from school
20. - on foot
21. Number of trips and excursions - by bus number per year
22. Average length of one school trip by bus km
23. Number of trips and excursions – by train number per year
24. Average length of one school trip by train km
25. Number of trips and excursions – by air number per year
School trips and excur-sions
26. Average length of one school trip by air km
27. Paper consumption in copiers, printers and other equipment
number of A4
sheets/year28. Use of recycled paper %
29. Number of new printed textbooks and books a year per pupil number per
pupil
30. Consumption of workbooks and notebooks number per pupil
Goods
31. Number of PCs at the school number 32. Share of paper recycled % 33. Share of printer toners recycled % 34. Share of stored bottles recycled % 35. Share of PET bottles recycled % 36. Are other types of waste separated? YES/NO 37. - biological waste (the school has compost) YESNO
Recycling and wastes
38. - hazardous waste YES/NO
Pupils, their teachers and parents can also contribute to gradual reduction of their school’s envi-ronmental impact – for example, by means of separated waste collection, using workbooks from recycled paper or going to and from school on foot or on bikes. The ecological footprint of a school provides a guide and indicator for a set of activities aimed at “ecologisation” and “green-ing” of the school and its operation.

60
5.3.1 Calculation of the ecological footprint of Vsetín primary schools
The ecological footprints of five Vsetín primary schools were, in cooperation with the Institute for Environmental Policy (Mgr. Viktor Třebický), calculated for 2003 (within a project supported by the Ministry of the Environment and coordinated by the National Network of Healthy Cities) and repeatedly for 2004 (RNDr. Viktor Třebický, Ph.D.). The results are shown in Pictures 13 and 14.
Picture 13: EF items of primary schools in 2003 - 2004 (total global hectares)
Picture 14: EF items of primary schools in 2003 - 2004 (global hectares per pupil)
402.7 345.9
416.4
481.8 458.0
400.1358.8
415.3
526.8
460.3
0
100
200
300
400
500
600
Luh Ohrada Rokytnice Sychrov Trávníky
20032004
EF items of primary schools in 2004 in total 2003 -
0.81 0.84 0.88
1.10
0.85 0.83 0.82 0.86
1.19
0.77
0,00
0,20
0,40
0,60
0,80
1,00
1,20
1,40
Luh Ohrada Rokytnice Sychrov Trávníky
20032004
2003 - 2004 per pupil EF items of primary schools in

61
6 “Ecological footprint of nursery and primary schools” method-ology
MOTTO
“Sustainable development of a society is a form of development that retains for both the present and future genera-tions the possibility to satisfy their basic necessities of life while not reducing the diversity of nature and conserving
natural functions of ecosystems.”
(Act No. 17/1992 Coll., on the environment, as amended by later regulations)
6.1 Purpose of the methodology
The ecological footprint is a practical means of displaying the environmental behaviour of nurs-ery and primary schools. It serves not only for environmental education of pupils, but also for proposing specific measures resulting in the lowest possible consumption of non-renewable en-ergy resources per pupil and eventually in reduction of the ecological footprint of individual schools.
This methodology aims to ascertain and mutually and over time compare the sustainable devel-opment and environmentally friendly behaviour of nursery and primary schools.
6.2 Wider connections and objective of the ecological footprint
The ecological footprint of a school is an aggregate indicator whose size is determined by a host of factors – from the school’s management to pupils’ behaviour. They include, for example, the manner and efficiency of the school building’s heating, the size of the school and school land plots, use of energy-saving appliances, food consumption in the school canteen, production and type of separation of wastes, as well as what distance and how children and teachers travel to and from school. The resulting data refer to one pupil of the given school. Simply said, it states what area is necessary to ensure this pupil’s common needs for a certain period of time.
6.2.1 Objectives of the ecological footprint
− The ecological footprint makes it possible to compare nursery and primary schools mutu-ally and over time, and how environmentally soundly they function.
− In an intelligible way, it shows founders, parents, pupils and other citizens how the school treats the environment and what its possibilities are for improvement in this respect.
− The ecological footprint is also a valuable educational and edification tool. This applies doubly in the environment of schools.
− Using a simple method, it offers a number of possibilities, and demonstrates to both chil-dren and adults environmental principles difficult to understand otherwise.
− It is also possible to involve in monitoring the ecological footprint pupils themselves, who can within various subjects collect data for its calculation. Through “tracking”, they will realise the interconnection of seemingly unconnected activities and have the possibil-

62
ity to observe how the footprint can be reduced if they begin behaving in an environmen-tally friendly manner.
6.3 Specification of basic terms, abbreviations
6.3.1 Definitions, terms
Local Agenda 21 - LA21 is a tool for application of sustainable development principles at the local and regional level. It is a process that through improvement of management of public af-fairs, strategic planning (management), involvement of the public and use of all attained knowl-edge about sustainable development in individual areas improves the quality of life in all its as-pects and aims at responsibility of citizens for their lives and the lives of other beings in space and time.
Healthy Cities project – a project of the World Health Organisation intended for towns, cities and regions for application of Local Agenda 21. Information on www.nszm.cz
6.3.2 Abbreviations
MŠ nursery schools ZŠ primary schools EF ecological footprint – comparison and evaluation of a school’s ecological operation
(consumption of energies, materials, goods and areas), related to one pupil EVVO environmental education, training and edification LA 21 Local Agenda 21
6.4 Content of ecological footprints
The main content is:
1. verification of the development of ecological footprints calculated in total for the given school and pupil of individual MŠ and ZŠ in a time curve since 2003,
2. comparison of ecological footprints of individual types of schools, i.e. comparison of the set of nursery and primary schools in individual years,
3. ascertainment of whether measures resulting in ecological operation of buildings and en-vironmentally friendly behaviour have been gradually and systematically taken.
6.5 Legislative stipulations
Directly stipulated for primary schools is the legal obligation to assess themselves:
− in paragraph 1, Section 12, Act No. 561/2004 Coll., on pre-school, primary, secondary, higher professional and other education (the Education Act) “Assessment of a school is carried out as the school’s own assessment and assessment by the Czech School Inspection”,
− in paragraph 5, Section 12, Act No. 561/2004 Coll., on pre-school, primary, secondary, higher professional and other education (the Education Act) “Assessment of a school and school facility can also be carried out by founders according to the criteria they make public in advance”.
On the part of the founder, assessment of a primary school can also include the ecological foot-print of individual organisations. It is possible to proceed similarly in the case of nursery schools.

63
6.6 Description of activities according to a time schedule
6.6.1 Preparation phase
Step No. Description of activity
1. Decision of the town about ecological footprint calculations in MŠ and ZŠ.
2. Training of headmasters of MŠ and ZŠ in the importance and content of EF and their acquaintance with the method of EF calculation to individual organisations.
3. Preparation and summarisation of individual data necessary for EF calculation in coop-eration with the organisation’s economist and founder.
6.6.2 Implementation phase
Step No. Description of activity
1. Entry of the acquired data into the EF record table.
2.
Actual calculation: Current status: sending the record table to the Institute for Environmental Policy, whose employees will calculate the EF, including the calculation of the EF per pupil of the given school Vision: statutory representatives of MŠ and ZŠ will carry out the calculation themselves according to the methodology.
3. Comparison of EF results with results of the previous years.
4. The school management assesses the results of the given year and, if necessary, takes remediation measures.
5. Sending the results to the founder to draw up comparisons with other MŠ and ZŠ.
6. Presentation of summarised EF results to the founder, i.e. the council of the respective municipality.
6.7 Record table of ecological footprint calculation
For actual calculation of the ecological footprint, it is necessary to fill in the “Record table of ecological footprint calculation” for the given nursery or primary school in which a set of ques-tions is precisely specified so that the organisations’ data are processed in a uniform manner.
To simplify the calculation and to make it possible to draw data from the already processed statis-tical data of schools, periods of time for data are determined either for a school year or a calendar year.
6.8 Budget
Budget costs for EF can be defined as indirect. School headmasters assign data collection and their evaluation within the framework of workloads of individual employees, with schools’ economists primarily participating in fulfilment of these tasks. Employees of schools evaluate the time development of the ecological footprint in individual years and the school management as-sesses this development and takes measures.

64
EF assessments for the given period are submitted by headmasters to founders through educa-tion and culture departments whose staff summarise and compare ecological footprints between individual schools.
6.9 Outputs of ecological footprints
Outputs can be characterised at three basic levels:
− Direct advance towards sustainable development (savings of materials and energies, in-creased share of separated waste, etc.),
− Increased environmental awareness among teachers and pupils (information about the ecological footprint at working meetings and within primary school tuition),
− By including calculation of EF of schools and/or households in the tuition of pupils of higher grades of primary schools, it is possible to indirectly influence other town inhabi-tants and thereby influence citizens’ treatment of nature,
− Greater interest and involvement in the LA21 process.
Another indirect effect is gaining a relatively effective tool that can be adapted for any other pub-lic institution operated by the town.
6.10 Conclusion
Regular calculation of ecological footprints of nursery and primary schools, their mutual com-parison and comparison with other schools that will also show their EF can be one of many im-portant small steps towards sustainable development of schools, towns and regions. Of crucial importance is that assessment and comparison of ecological footprints of individual years is not an isolated small step but is part of a set of measures taken by towns, schools, non-profit organi-sations and other partners in the territory of towns and regions.
Inspiration for these measures can be sought in, for example, the network of schools proceeding according to the Healthy School methodology or in the network of towns striving for improve-ment of the quality of life while respecting sustainable development principles (see www.nszm.cz). For example, the town of Vsetín, in addition to environmental audits, has imple-mented in its primary schools the “Good School” project, supplementing environmental audits with the “Healthy Lifestyle” audit. If you are interested, you can ask for information about these projects.

65
7 The environment and strategic management using the BSC method
7.1 What is BSC?
Being environmentally friendly is one of the important priorities of many local governments. A number of towns respect the environmentally friendly approach principles and consider sustain-able development part of their vision and strategies. Vsetín is one of these towns.
If a town council wants to manage the authority and development of the town really efficiently, an assistance in this respect can be the Balanced Scorecard (BSC) method applied in an appropri-ate manner. However, management’s steady support is a necessary precondition. Why? The method resolves the strategic and operative level of management (but this in itself is nothing ex-traordinary). By means of a set of balanced indicators, the endeavour of the town’s authority and organisations is aimed in the set direction. Only when all the effort is aimed in one direction can really great things be accomplished. Few town councils, however, are able to apply in practice this thousands of years old precept about achieving the set objectives. In common practice, priorities are frequently not defined, strategies contradict each other, it is not clear what is considered suc-cess or what are target values, preference is given to urgent, yet sometimes unimportant things, “extinguishing fires” is preferred to prevention, and a host of other problems. The BSC method applied in an appropriate manner should help us to overcome this.
The logic of the BSC method is explained by the following picture. We view a town’s vision and individual strategies from four perspectives that must be balanced.
Picture 15: BSC method for public sector organisations
The method was created by S. Kaplan and P. Norton. It originated in the USA and has been used very successfully both in the USA and throughout Europe in enterprises and public administra-
STRATEGY
VISION
Citizen (cus-tomer) per-
spective
Financial perspective
Internal processes
perspective
Learning and growth perspective
Do we know what citizens want? What to do to make them satisfied?
Cycle of strategic planning improve-ment
What must we learn to accomplish it?
What sources to en-sure to make citizens satisfied?
What processes to use to ensure citizens’ satisfaction and sufficiency of sources?

66
Enhancing the environment of
cooperation, trust and responsibility
Improving the com-munity planning and project management
process
Developing skills and knowledge, introducing new methods and effi-
cient technologies
Learn.,growth
Proper preparation and implementa-
tion of investments
Efficient operation of the town council, town police, technical services, educa-tional, cultural, sports and
other facilities
Partnership for imple-mentation of plans, enter-prise and education; sup-port for societies and non-
profit organisations
Int. processes
Responsible financing and financing from
various sources
Efficient economy of finance and property of
the town
Economy, financ-ing activities
Motiv. job opportu-
nity
Available services, care, education and social, cultural and
spiritual life opportu-nities
Adequate housing and
neat town Preventionand safety
Vsetín, heart of Valach region – a pleasant town for life, work and
leisure; striving to improve quality of life while respecting sustainability
Citizen, client
Job opportunities
Available housing
Leisure time oppor-tunities
Healthy and charming town
Safe town
Healthy lifestyle and sports op-
portunities
tion alike. The Balanced Scorecard also includes indicators relating to the environment, such as, for example, the ecological footprint, availability of public parks and green areas, citizens’ satis-faction, etc.
The core of the BSC method is a set of balanced indicators. Prior to applying the BSC method, it is necessary to define the vision and strategic priorities. The method’s purpose is not to set out the vision and strategies, but to ensure their fulfilment.
7.2 How to apply the method in local authorities
Picture 16: BSC – strategic map of the town of Vsetín

67
At the top of the strategic map is the town’s vision. If the management has a notion of the vision and direction (application of Local Agenda 21 can be extremely helpful in this), it is necessary to say in what manner it wants to attain this vision’s fulfilment, i.e. what strategies it determines (the second row of ovals).
Strategic themes are fed by the perspective of the citizen and customer. Citizens’ satisfaction can either be allocated to this perspective or (as in the example described below) to the town’s vision. Activities for citizens/customers must be financed, so the citizen’s perspective is linked up to by the financial perspective. In it we encounter themes connected with securing financing for a su-perior perspective. All the activities hitherto described are ensured by the perspective of internal processes. Nothing stated so far can be implemented without people, their development and the appropriate technologies – this is resolved by the perspective of learning and growth.
Created for every oval is a certain number of criteria (indicators) that show positive, or negative, development of success of the given theme. A uniterm methodology is determined for the crite-ria. The number of criteria depends on local conditions (with 25 to 35 criteria considered suitable for a town). Also used are hitherto uninvolved, so-called soft factors (satisfaction, quality, etc.), which are for individual citizens often more important than tables showing budget fulfilment. The originated table of criteria is then called the Balanced Scorecard:
Table 11: Balanced Scorecard of the town of Vsetín
Balanced Scorecard of strategic themes
Strategic theme Criterion (indicator) Vision 0.1 Index of citizens’ satisfaction 0.2 Ecological footprint 0.3 Town’s population Citizen, client
1.1 Unemployment rate 1. Motivating job opportunities 1.2 Availability of transportation in relation to
employment 2. Available services, care, education and social, cultural and spiritual life opportuni-ties.
2.1 Availability of selected services and care
3.1 Indicator of the population’s health 3. Healthy lifestyle and sports opportunities 3.2 Possibility of healthy lifestyle 4. Adequate housing and tidy town 4.1 Index of quality of life on housing estates
5.1 Feeling of safety (%) 5.2 Number of prevention projects (criminality, traffic) 5.3 Number of pedestrian deaths and injuries during traffic accidents
5. Prevention and safety
5.4 Index of infrastructure stability Economy and financing of activities
6.1 Indebtedness rate vs. margin (± %) 6. Responsible financing and financing from various sources 6.2 Operating costs/sources ratio (%)

68
6.3 Volume of granted subsidies vs. budget (CZK, %)
6.4 Someone else’s money invested in the town (CZK) 7.1 Use of property7.2 Price of the town’s selected property (CZK) 7.Efficient economy of finance and prop-
erty of the town 7.3 Evaluation of efficiency of management of finance
Internal processes 8.1 Area of zones and their use (m2) 8. Proper preparation and implementation
of investment projects 8.2 Number of prepared and implemented pro-jects 9.1 a) Efficiency evaluation – benchmarking 9.1 b) Evaluation according to the CAF method
9. Quality operation of the town council, town police, technical services, the town’s own educational, cultural, sports and other facilities 9.2. Audit of workplaces, including complaints
10. Partnership for implementation of plans, enterprise and education, support for societies and non-profit organisations
10.1 Fulfilment of the Health and Quality of Life Action Plan
Learning and growth 11. Enhancing the environment of coopera-tion, trust and responsibility 11.1 Employee satisfaction index
12.1 Number of projects 12. Improving the community planning and project management process 12.2 Meeting the conditions of communication
with the public 13.1 Number of newly introduced methods and technologies 13.2 Capabilities index
13. Developing skills and knowledge, intro-ducing new methods and efficient tech-nologies 13.3 Number of accepted innovation proposals
The stated example shows that the indicators relating to the environment or sustainable devel-opment (ecological footprint, citizens’ satisfaction, etc.) have been used for management at the municipal level.
7.2.1 Further procedure
− The Scorecard of the town in the next project phase will be “divided” into the author-ity’s individual departments, the town police, non-profit organisations, companies, etc. The Scorecard of the department is always derived from strategic objectives and criteria of the town, according to the given department’s contribution. Thus, we ensure meas-urement of individual subordinate sections’ contribution to the strategy of the whole town.
− Subsequently, we can derive from scorecards created in this manner so-called personal scorecards, on which we state criteria for a specific employee. Then we interconnect per-sonal scorecards with the remuneration system. At the Municipal Office of Vsetín, per-sonal scorecards are called “performance parameters” and are interconnected with remu-neration.
69
− By means of continuous updating of the strategic map, criteria and personal objectives, we support strategic learning, bring the strategy into everyday life and ensure proper di-recting of our endeavour.
7.2.2 The main advantages of the BSC are:
− lucidity: the strategic map is on one page of A4 format,
− balance: we do not only say what we want to do for citizens, but also under what finan-cial terms, by means of what processes, as well as what we have to learn in order to be able to do it,
− measurability: it is possible to determine a relatively small number of criteria,
− it creates a basis for remuneration (measurement of performance and quality of work).
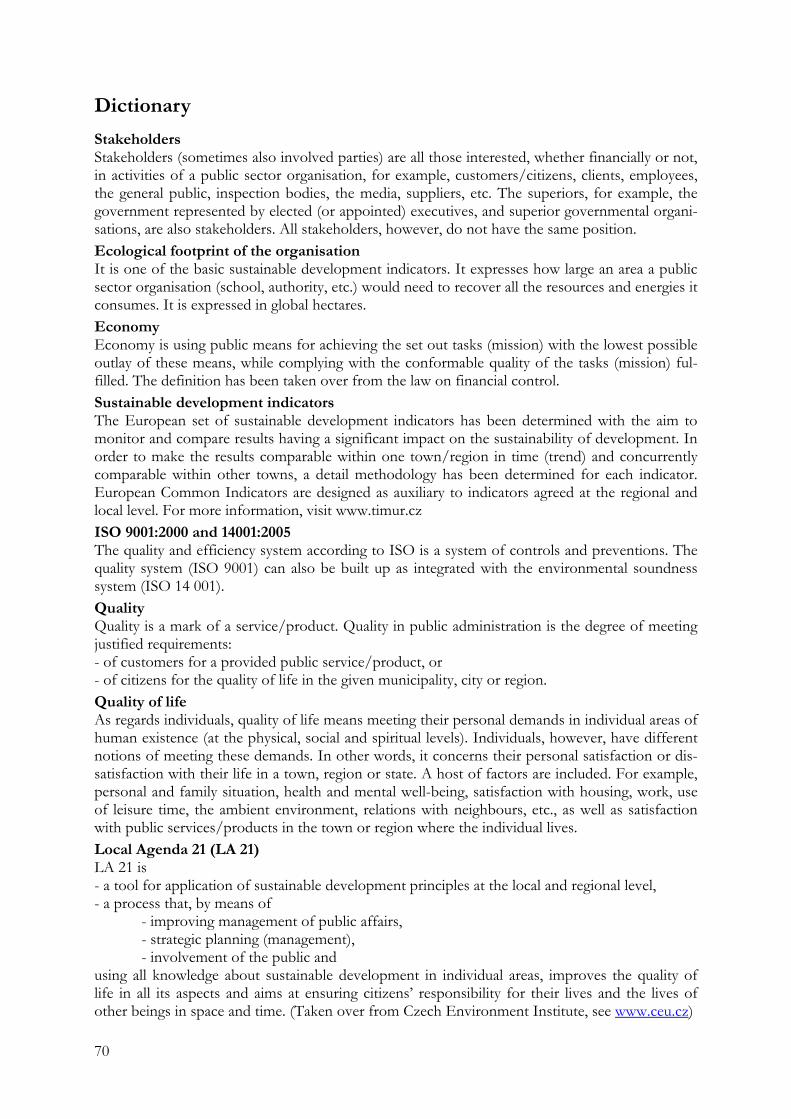
70
Dictionary
Stakeholders Stakeholders (sometimes also involved parties) are all those interested, whether financially or not, in activities of a public sector organisation, for example, customers/citizens, clients, employees, the general public, inspection bodies, the media, suppliers, etc. The superiors, for example, the government represented by elected (or appointed) executives, and superior governmental organi-sations, are also stakeholders. All stakeholders, however, do not have the same position. Ecological footprint of the organisation It is one of the basic sustainable development indicators. It expresses how large an area a public sector organisation (school, authority, etc.) would need to recover all the resources and energies it consumes. It is expressed in global hectares. Economy Economy is using public means for achieving the set out tasks (mission) with the lowest possible outlay of these means, while complying with the conformable quality of the tasks (mission) ful-filled. The definition has been taken over from the law on financial control. Sustainable development indicators The European set of sustainable development indicators has been determined with the aim to monitor and compare results having a significant impact on the sustainability of development. In order to make the results comparable within one town/region in time (trend) and concurrently comparable within other towns, a detail methodology has been determined for each indicator. European Common Indicators are designed as auxiliary to indicators agreed at the regional and local level. For more information, visit www.timur.cz ISO 9001:2000 and 14001:2005 The quality and efficiency system according to ISO is a system of controls and preventions. The quality system (ISO 9001) can also be built up as integrated with the environmental soundness system (ISO 14 001). Quality Quality is a mark of a service/product. Quality in public administration is the degree of meeting justified requirements: - of customers for a provided public service/product, or - of citizens for the quality of life in the given municipality, city or region. Quality of life As regards individuals, quality of life means meeting their personal demands in individual areas of human existence (at the physical, social and spiritual levels). Individuals, however, have different notions of meeting these demands. In other words, it concerns their personal satisfaction or dis-satisfaction with their life in a town, region or state. A host of factors are included. For example, personal and family situation, health and mental well-being, satisfaction with housing, work, use of leisure time, the ambient environment, relations with neighbours, etc., as well as satisfaction with public services/products in the town or region where the individual lives. Local Agenda 21 (LA 21) LA 21 is - a tool for application of sustainable development principles at the local and regional level, - a process that, by means of
- improving management of public affairs, - strategic planning (management), - involvement of the public and
using all knowledge about sustainable development in individual areas, improves the quality of life in all its aspects and aims at ensuring citizens’ responsibility for their lives and the lives of other beings in space and time. (Taken over from Czech Environment Institute, see www.ceu.cz)

71
Best practice First-class performance, methods or approaches resulting in extraordinary efficiency. The best practice is a relative concept, sometimes designating innovation procedures or interesting prac-tices in the management and functioning of an organisation that were identified by means of benchmarking. Sometimes it is more appropriate to talk about good practice, since no one can be sure of the existence of a better practice. Process A process is a set of interrelated or interacting activities, transforming inputs into outputs (or effects), thus adding a value. The nature of processes in public sector organisations may signifi-cantly differ, from relatively abstract activities, for example, support for development of a con-ception or regulation of economic activities, to very specific activities when providing a service or product. Satisfaction Satisfaction is customers’ perception relating to the degree of meeting their requirements. Standardisation of the inquiry method Ensuring identical conditions when acquiring answers from all respondents (for example, it con-cerns identical wording of questions, identical environment, a certain binding time scope, etc.). SWOT analysis Analysis of Strengths, Weaknesses, Opportunities and Threats of public sector organisations. Opportunities are possible advantages, threats are possible difficulties. Strengths and weaknesses are internal effects, opportunities and threats are external effects. Sustainable development Sustainable development is based on integration and balancing of economic, social and environ-mental objectives. Sustainable development is a development that satisfies the needs of the pre-sent generation without threatening future generations’ possibilities to satisfy their own needs. For more information, visit www.nszm.cz. Public opinion The public’s opinions on topical issues ascertained in a public opinion poll. Public services/products Public services are services provided in the public interest. They are created, organised or directed by the state, region or municipality with the aim to cover the needs of the public. Public services include health care, social services, education, police, state administration and local government execution, etc. Public products include, for example, transport and other infrastructure, public buildings, areas, sports grounds, etc. Vision It expresses where we want to head, especially how to achieve a mission. It is an attainable dream of what a public sector organisation wants to do and where it wants to head. Selective set A set of units factually included in research which are selected from the basic set by means of one of the selective methods. Customer/citizen The term customer/citizen is used to emphasise the public administration’s dual relation to users of public services on the one hand and on the other to all members of society who as citizens and tax payers are interested in services/products, their outputs or effects (for example, effect on quality of life, sustainability of development, etc.). Basic set A set of units (most frequently persons) that can potentially become subjects of sociological re-search (for example, inquiry into satisfaction).

72
Literature
BOOKS, MISCELLANIES, SPECIALIST ARTICLES, STANDARDS
1. Standards: ČSN EN ISO 9000:2001, Quality management systems – Basics, principles and dictionary, ČSN EN ISO 9004:2001, Quality management systems – Directive for efficiency improvement, ČSN EN ISO 14001:1997, Environmental management systems – Specifica-tion with instructions for its use, ČSN EN ISO 10006:1997, Quality management – Quality directive for project management
2. Mgr. Petr Rumpel, PhD.: MĚSTSKÝ MARKETING JAKO KONCEPT MĚSTA (UR-BAN MARKETING AS A CONCEPT OF A TOWN). Veřejná správa č. 29, Prague 2002
3. Magdaléna Bernátová, Anna Vaňová: MARKETING PRE SAMOSPRÁVY II (MAR-KETING FOR LOCAL GOVERNMENTS II). Matej Bel University in Banská Bystrica, Faculty of Economics, Institute for Development of Municipalities, Towns and Regions. Banská Bystrica, 1999, ISBN: 80-8055-338-6
4. THE ENVIRONMENT IN THE CZECH REPUBLIC 1989 – 2004, CENIA, Czech Environment Information Agency, Prague 2005, ISBN: 80-85087-56-1
5. Jaroslav Vencálek: PROTISMĚRY ÚZEMNÍ IDENTITY (OPPOSITE DIREC-TIONS OF TERRITORIAL IDENTITY). Vydavatelství OLZA, spol. s r.o., Český Těšín 1998, ISBN: 80-86082-10-5
6. ŘÍZENÍ PROCESŮ VÝKONU STÁTNÍ SPRÁVY (PŘÍPADOVÁ STUDIE VSETÍN) (MANAGEMENT OF STATE ADMINISTRATION EXECUTION PROCESSES) (CASE STUDY: VSETÍN). Ministry of the Interior of the ČR, Prague 2004, ISBN: 80-239-4098-8
7. JAK EFEKTIVNĚ UPLATNIT CAF V SAMOSPRÁVNÝCH ÚŘADECH – SOUBOR PŘÍKLADŮ (HOW TO EFFECTIVELY APPLY CAF IN LOCAL AU-THORITIES – SET OF EXAMPLES). Prague 2005.
8. MĚŘENÍ SPOKOJENOSTI V ORGANIZACÍCH VEŘEJNÉ SPRÁVY – SOUBOR PŘÍKLADŮ (MEASUREMENT OF SATISFACTION IN PUBLIC ADMINISTRA-TION ORGANISATIONS – SET OF EXAMPLES). Ministry of the Interior of the CR, Prague 2005, ISBN: 80-239-6154-3
9. EUROPEAN COMMON INDICATORS, TECHNICAL ADMINISTRATION. European Commission, February 2000.
10. EIPA (European Institute of Public Administration). Study on the use of the Com-mon Assessment Framework in European Public Administrations. May 2005
11. BENCHMARKING VE VEŘEJNÉ SPRÁVĚ (BENCHMARKING IN PUBLIC ADMINISTRATION). Prague: Ministry of the Interior of the CR, 2004, ISBN: 80-239-3933-5
12. Kaplan, N.: BALANCED SCORECARD. Prague: Management Press 2002 13. VSETÍN VYZKOUŠEL METODU BSC, KTERÁ MU PŘINÁŠÍ UŽITEK (VSETÍN
TRIES THE BSC METHOD, WHICH BRINGS BENEFIT TO IT). In.: Moderní obec, 2004, č. 8. Prague Economia, ISSN
INTERNET SOURCES
EUROPEAN SETS OF INDICATORS: www.timur.cz EUROPEAN INSTITUTE OF PUBLIC ADMINISTRATION: www.eipa.nl INTERNATIONAL COUNCIL FOR LOCAL ENVIRONMENTAL INITIATIVES – ICLEI: www.iclei.org

������������� ����������������� ��
��������� ���������������
�������������������������� ��!"#$%� &� ������� '(�����)� ��������������%�*�+����,-.-%�/0�122�34�����%5�����3--2
�� ������� ������ ����� � ��/3)6)�����7��������������)�������8� ������ � ���������� �������������