Embed Size (px)
Citation preview

Employment Strategy Papers
Reaching Millennium Goals: How well does agricultural productivity growth reduce poverty? Nomaan Majid Employment Analysis Unit Employment Strategy Department
2004/12
Foreword
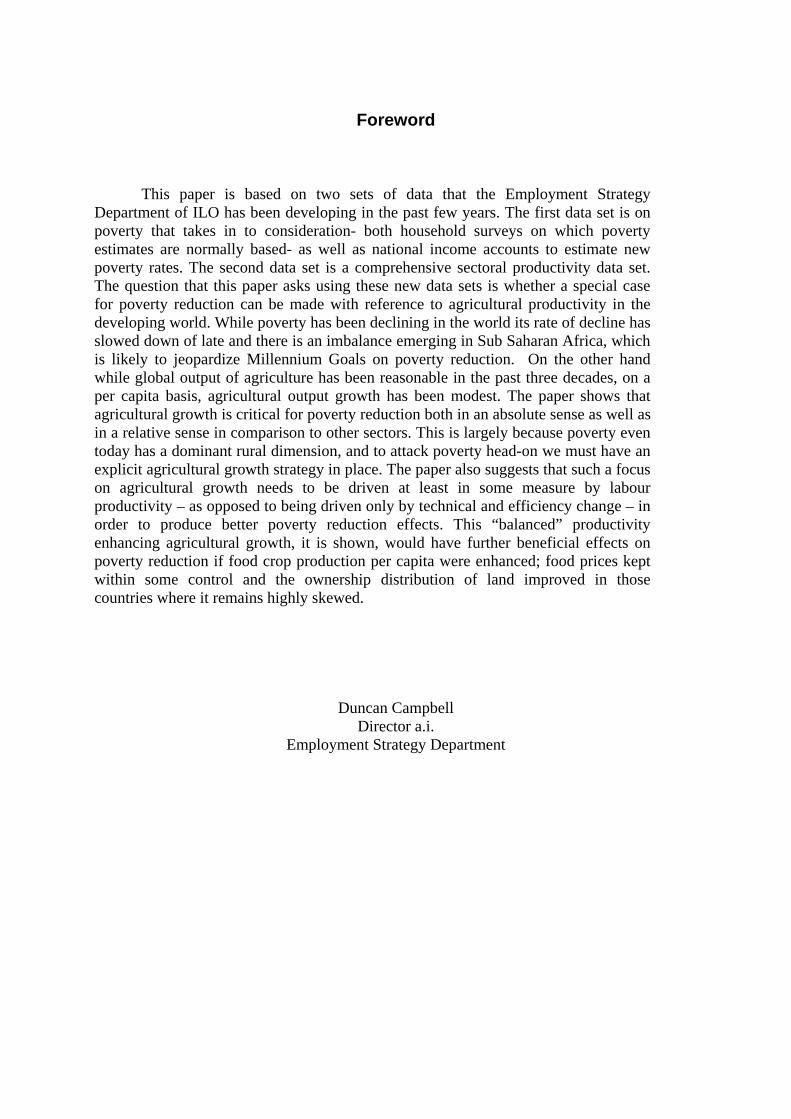
This paper is based on two sets of data that the Employment Strategy
Department of ILO has been developing in the past few years. The first data set is on poverty that takes in to consideration- both household surveys on which poverty estimates are normally based- as well as national income accounts to estimate new poverty rates. The second data set is a comprehensive sectoral productivity data set. The question that this paper asks using these new data sets is whether a special case for poverty reduction can be made with reference to agricultural productivity in the developing world. While poverty has been declining in the world its rate of decline has slowed down of late and there is an imbalance emerging in Sub Saharan Africa, which is likely to jeopardize Millennium Goals on poverty reduction. On the other hand while global output of agriculture has been reasonable in the past three decades, on a per capita basis, agricultural output growth has been modest. The paper shows that agricultural growth is critical for poverty reduction both in an absolute sense as well as in a relative sense in comparison to other sectors. This is largely because poverty even today has a dominant rural dimension, and to attack poverty head-on we must have an explicit agricultural growth strategy in place. The paper also suggests that such a focus on agricultural growth needs to be driven at least in some measure by labour productivity – as opposed to being driven only by technical and efficiency change – in order to produce better poverty reduction effects. This “balanced” productivity enhancing agricultural growth, it is shown, would have further beneficial effects on poverty reduction if food crop production per capita were enhanced; food prices kept within some control and the ownership distribution of land improved in those countries where it remains highly skewed.
Duncan Campbell Director a.i.
Employment Strategy Department

Acknowledgements
The author is grateful to Prasada Rao and Mohammad Allaudin for discussion and
comments on earlier versions of the paper. The data on productivity in the paper is based on the work done for the ILO by the Centre for Efficiency and Policy Analysis, School of Economics, University of Queensland. Sections 8 and 9 and 12 in particular draw on their report to the ILO. David Kucera, Ajit Ghose, Duncan Campbell and Rizwanul Islam gave useful comments. Statistical assistance was ably provided by J.M. Blanco and S. Kapsos as well as CEPA research staff. The usual disclaimer applies.

Contents
1. Poverty reduction and the Millennium Development Goals ..............................................1 2. Trends in the incidence of global poverty Regional shares of global poverty..................1 3. Absolute numbers of the poor ..........................................................................................2 4. Poverty rates .....................................................................................................................4 5. Making sense of the Millennium Goals ..............................................................................5 6. Is growth enough for poverty reduction? .........................................................................6 7. Poverty and rural populations ...........................................................................................7 8. Global shifts in levels and shares of agricultural output and labour.................................8 9. Factors determining agricultural output growth.............................................................10 10. Deconstructing the growth process historically............................................................13 11. Why is agricultural sector growth important for poverty reduction? ...........................15 12. Productivity in agriculture.............................................................................................17 13. Agricultural productivity and poverty reduction ...........................................................24 14. Conclusions....................................................................................................................26
Annex: List of Variables used in Regressions ……………………………………………………….27
Bibliography ........................................................................................................................29 Tables Table 1. Correlations of TFP with labour productivity and land productivity ...................................................... 20
Table 2. Regression Analysis: Dependent variables: Agricultural total factor productivity; labour productivity ..........................................................................................................................................22
Table 3. Regression Analysis: Dependent variable: Poverty headcount rates....................................................... 25

Figures
Figure 1. Regional shares of population living below $1 a day (1985 PPP) – ILO estimates..................................2
Figure 2. Regional shares of population living below $1 a day (1985 PPP) – World Bank estimates.....................2
Figure 3. ILO $1/day poverty counts .......................................................................................................................3
Figure 4. World Bank $1/day poverty counts .........................................................................................................3
Figure 5. ILO $1/day poverty rates ..........................................................................................................................4
Figure 6. World Bank $1/day poverty rates .............................................................................................................4
Figure 7. Poverty versus rural population rates (ILO data)......................................................................................7
Figure 8. Poverty versus rural population rates (Sala-i-Martin data) .......................................................................7
Figure 9. Poverty versus rural population rates (World Bank data).........................................................................7
Figure 10. World and regional agricultural output...................................................................................................8
Figure 11. Agricultural outputs share by region.......................................................................................................9
Figure 12. Agricultural labour share by region ........................................................................................................9
Figure 13. Output by region...................................................................................................................................11
Figure 14. Land index by region ............................................................................................................................11
Figure 15. Labour index by region.........................................................................................................................11
Figure 16. Fertilizer index by region......................................................................................................................11
Figure 17. Tractors index by region.......................................................................................................................11
Figure 18. Agricultural output per capita by region (log scale) .............................................................................12
Figure 19. Crops output per capita by region (log scale) .......................................................................................12
Figure 20. Change in poverty associated with change sectoral growth rates .........................................................14
Figure 21. Regional ownership distribution of land: Gini coefficient....................................................................15
Figure 22. Food per person (1970-2000) ...............................................................................................................16
Figure 23. Regional population weighted food price index ...................................................................................16
Figure 24. Labour productivity by region (weighted by labour force)...................................................................18
Figure 25. Weighted average annual growth in TFP over time (1970-2000) by region.........................................19
1
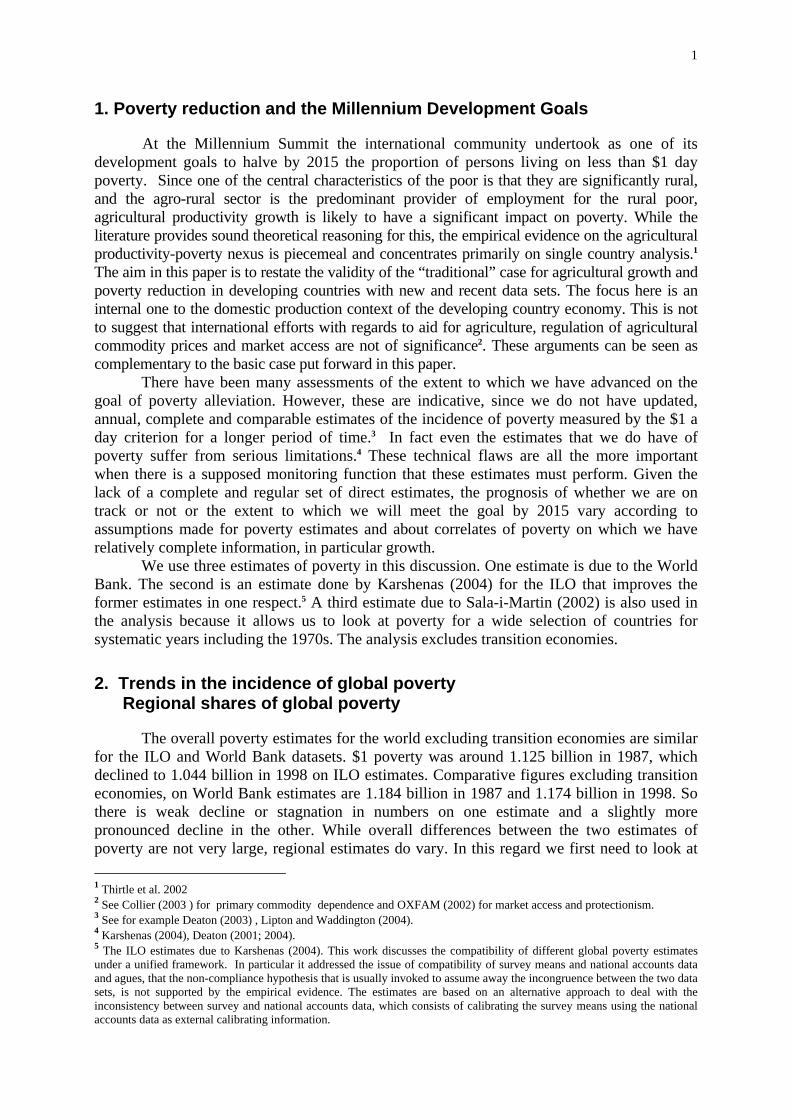
1. Poverty reduction and the Millennium Development Goals
At the Millennium Summit the international community undertook as one of its development goals to halve by 2015 the proportion of persons living on less than $1 day poverty. Since one of the central characteristics of the poor is that they are significantly rural, and the agro-rural sector is the predominant provider of employment for the rural poor, agricultural productivity growth is likely to have a significant impact on poverty. While the literature provides sound theoretical reasoning for this, the empirical evidence on the agricultural productivity-poverty nexus is piecemeal and concentrates primarily on single country analysis.1 The aim in this paper is to restate the validity of the “traditional” case for agricultural growth and poverty reduction in developing countries with new and recent data sets. The focus here is an internal one to the domestic production context of the developing country economy. This is not to suggest that international efforts with regards to aid for agriculture, regulation of agricultural commodity prices and market access are not of significance2. These arguments can be seen as complementary to the basic case put forward in this paper.
There have been many assessments of the extent to which we have advanced on the goal of poverty alleviation. However, these are indicative, since we do not have updated, annual, complete and comparable estimates of the incidence of poverty measured by the $1 a day criterion for a longer period of time.3 In fact even the estimates that we do have of poverty suffer from serious limitations.4 These technical flaws are all the more important when there is a supposed monitoring function that these estimates must perform. Given the lack of a complete and regular set of direct estimates, the prognosis of whether we are on track or not or the extent to which we will meet the goal by 2015 vary according to assumptions made for poverty estimates and about correlates of poverty on which we have relatively complete information, in particular growth.
We use three estimates of poverty in this discussion. One estimate is due to the World Bank. The second is an estimate done by Karshenas (2004) for the ILO that improves the former estimates in one respect.5 A third estimate due to Sala-i-Martin (2002) is also used in the analysis because it allows us to look at poverty for a wide selection of countries for systematic years including the 1970s. The analysis excludes transition economies.
2. Trends in the incidence of global poverty Regional shares of global poverty
The overall poverty estimates for the world excluding transition economies are similar for the ILO and World Bank datasets. $1 poverty was around 1.125 billion in 1987, which declined to 1.044 billion in 1998 on ILO estimates. Comparative figures excluding transition economies, on World Bank estimates are 1.184 billion in 1987 and 1.174 billion in 1998. So there is weak decline or stagnation in numbers on one estimate and a slightly more pronounced decline in the other. While overall differences between the two estimates of poverty are not very large, regional estimates do vary. In this regard we first need to look at 1 Thirtle et al. 2002 2 See Collier (2003 ) for primary commodity dependence and OXFAM (2002) for market access and protectionism. 3 See for example Deaton (2003) , Lipton and Waddington (2004). 4 Karshenas (2004), Deaton (2001; 2004). 5 The ILO estimates due to Karshenas (2004). This work discusses the compatibility of different global poverty estimates under a unified framework. In particular it addressed the issue of compatibility of survey means and national accounts data and agues, that the non-compliance hypothesis that is usually invoked to assume away the incongruence between the two data sets, is not supported by the empirical evidence. The estimates are based on an alternative approach to deal with the inconsistency between survey and national accounts data, which consists of calibrating the survey means using the national accounts data as external calibrating information.

2
the distribution of the poor in the world. The salient difference between the regional distribution of the poor between the two sources is that in the ILO estimates for 1998 the share of South Asia (29 per cent) in the global poor is much lower compared to the World Bank estimates (44 per cent), while the share of China’s poverty is much higher in the ILO estimates (30 per cent) than the in the Banks (18 per cent). The figures below give regional shares of poverty over time. It is clear that on trend the shares of the population of the poor in the world is shifting to Sub Saharan Africa from Asian regions in the ILO estimates, while it is shifting from mainly the East Asian and China region to Sub Saharan Africa and South Asia on the World Banks estimates.
Figure 1. Regional Shares of Population living below $1 a dayin 1985 PPP- ILO Estimates
0 5
10 15 20 25 30 35 40 45
East Asia excl. China
China Latin Americaand the
Caribbean
Middle Eastand North
Africa
South Asia Sub-Saharan Africa
1987
1990
1993
1996
1998
Source : Based on ILO – Karshenas estimates, Karshenas (2004).
Figure 2. Regional Shares of Population living be low $1.08 a day in 1993 PPP - World Bank Estim ates
05
101520253035404550
East Asia excl.China
China Latin Americaand the
Caribbean
Middle East andNorth Af rica
South Asia Sub-SaharanAfrica
1987
1990
1993
1996
1998
Source : Based on World Bank estimates. Chen and Ravallion (2001).
3. Absolute numbers of the poor
While the changing regional shares of poverty are indicative of the regional focus that is internationally needed to combat poverty, we also find that absolute numbers of the poor are changing within regions. This is an important figure to examine though we need to recognize that population increases are often likely to accompany increases in poverty numbers. This is why the Millennium targets are in terms of proportions and not absolute numbers. At a global level, ILO data shows some declines in numbers on trend, though there is an increase in the last period. The World Bank estimates show a smaller change on trend. There is an

3
increase, then a decline and then stagnation in the World Bank numbers over the 1987-98 period. In fact much of the World Bank decreases in numbers are driven by declines in East Asia and China in the early 1990s. Latin America, Sub Saharan Africa and South Asia all show trend increases in poverty numbers in the period. By contrast ILO figures suggest trend declines in absolute numbers almost everywhere except in Sub Saharan Africa where there is a trend increase and South Asia where there are fluctuations. This is an important difference because falling absolute numbers of the poor in conditions of population increases would definitely mean in declines in the poverty rate.
ILO $1/day poverty counts (1985 PPP) World Bank $1/day poverty counts (1993 PPP) 1987 1990 1993 1996 1998 1987 1990 1993 1996 1998 East Asia 505.3 501 492.4 367.6 364.3 417.5 452.5 431.9 265.1 278.3 East Asia (excl. China) 92.6 78.9 75.7 57.9 53.2 114.1 92.0 83.5 55.1 65.2 Lat. America and Carib. 84.4 90.3 83.6 74.1 76.2 63.7 73.8 70.8 76.0 78.2 MENA* 5.7 6.2 5.9 5.1 5.2 9.3 5.7 5.0 5.0 5.6 South Asia 317.9 268.3 283.8 228.3 296.3 474.4 495.1 505.1 531.7 522.0 Sub-Saharan Africa 212.6 232.7 274.5 293.1 302.7 217.2 242.3 273.3 289.0 290.9 World 1125.8 1098.4 1140.2 968.3 1044.7 1183.2 1276.4 1304.3 1190.6 1198.9 (excluding China) 713.2 676.3 723.5 658.6 733.6 879.8 915.9 955.9 980.5 985.7
Notes: Totals exclude Eastern Europe and Central Asia. Source: ILO: Karshenas (2004); World Bank: Chen and Ravallion (2001). *MENA is Middle East and North Africa.
Figure 4. World Bank $1/day poverty counts
0 200
400 600 800
1000
1200 1400
1987 1990 1993 1996 1998
Num
ber b
elow
$1/
day
pove
rty li
ne (i
n
mill
ions
)
Latin America and East Asia excl. China China
South Asia Middle East and North Africa Sub-Saharan Africa World
Figure 3. ILO-$1/day poverty counts
0 200 400 600 800
1000 1200
1987 1990 1993 1996 1998
Num
ber b
elow
$1/
day
pove
rty li
ne (i
n m
illio
ns)
the Caribbean

4
4. Poverty rates
It needs to be seen what has happened to poverty rates, since the latter can increase or decrease with increases in absolute numbers of the poor, which was in evidence in more regions in the World Bank data set. What is clear is a trend decline in the period 1987-98 in global poverty rates on both data sets which is slowing down or stagnating in the last period;
ILO $1/day poverty counts (1985 PPP) World Bank $1/day poverty counts (1993 PPP) Region 1987 1990 1993 1996 1998 1987 1990 1993 1996 1998 East Asia 33.3 31.4 29.6 21.3 20.6 26.6 27.6 25.2 14.9 15.3 (excluding China) 21.3 17.1 15.5 11.3 10.1 23.9 18.5 15.9 10.0 11.3 Latin America 20.3 20.6 18.1 15.3 15.2 15.3 16.8 15.3 15.6 15.6 MENA 2.6 2.6 2.3 1.9 1.8 4.3 2.4 1.9 1.8 2.0 South Asia 30.2 23.9 23.9 18.1 22.7 44.9 44.0 42.4 42.3 40.0 Sub-Saharan 45.6 45.7 49.9 49.2 48.2 46.6 47.7 49.7 48.5 46.3 Total 31.1 28.4 27.8 22.1 23.3 28.3 28.4 28.2 24.5 24.0 (excluding China) 27.6 23.9 24.0 20.5 22.4 28.5 23.9 27.7 27.0 26.2 Notes: Totals exclude Eastern Europe and Central Asia. Sources : ILO: Karshenas (2004); World Bank: Chen and Ravallion (2001).
Figure 6. World Bank $1/day poverty rates
0%
10%
20%
30%
40%
50%
60%
1987 1990 1993 1996 1998
% b
elow
$1/
day
pove
rty lin
e
Latin America & Caribbean East Asia ex-China ChinaSouth Asia MENA Sub-Saharan AfricaWorld
Figure 5. ILO-$1/day poverty rates
0%
10%
20%
30%
40%
50%
60%
1987 1990 1993 1996 1998
% b
elow
$1/
day
pove
rty lin
e

5
ILO data suggest a greater decline in poverty rates and a trend decline in all regions excepted Sub Saharan Africa. The South Asian sub-region however shows a sharp increase in poverty rates in the last period. In contrast, the World Bank data also shows decline in poverty rates on trend in three regions and shows stagnation in two, Latin America and Sub Saharan Africa. The most significant declines are to be seen in China and East Asia.
Thus while poverty rates have been falling on trend in the 1987-98 period in both data sets, this decline has decelerated. Sub Saharan Africa has the worst regional performance and China has been the central good performer in poverty reduction.
5. Making sense of the Millennium Goals
It is obvious but nonetheless important to make a distinction between poverty headcount rates and poverty levels. Millennium poverty goals are about poverty rates (proportions of the $1 poor in the population) and not absolute numbers. The numbers of the poor increasing over time is consistent with their headcount rates declining. While the grand aim may indeed be to eradicate “poverty” altogether it is important to recognize that declines in proportions of the poor are relevant to the Millennium goals. Regions that show declines in both numbers and rates are clearly performing well on stronger grounds than those required by the targets. It is the rate of this change that gives us an indication of how much on or off track we are from the Millennium Development Goals (MDGs),6 and this is what has been the chief source of concern.
It should be equally obvious that predicting the future is based on assumptions we make about the past. Therefore for example projecting the slower rate of decline in poverty witnessed during the 1990s in to the future, i.e. to 2015, is likely to show a shortfall in “reaching the Millennium goals”, while a greater average decline, which we know took place between the 1980s and 1990s, when projected on to 2015, will show better results. These estimates also vary according to the poverty data sources we use, which are based on a host of technical assumptions that are not adequately resolved, and as we have illustrated above that these estimates do vary according the selected source. The recognition that the “achievement” of the Millennium poverty goals may in large part be a consequence of assumptions made on the cut off periods taken to project change as well as the measurement of poverty itself ought to have at least two sobering consequences for policy makers. First is to recognize that it is entirely possible that these targets on some interpretation may not be reached at the world level or be most “off-target” in certain parts of the world (Sub-Saharan Africa) and “on-target” in others (China) on every interpretation. The other consequence is to recognize that goals on poverty reduction need to be seen as broad objectives towards which facilitating policies need to be designed. There is a need to direct concern towards what is to be done in order to improve our performance in reducing poverty, as opposed to mechanically “monitoring” the progress itself, and projecting achievements and shortfalls, which when put under technical scrutiny are bound to appear as equivocal.
If it is assumed that the slower rates of poverty reduction of the 1990s are the yardstick to assess the future then a question to ask in this context is what is needed to get back on track with regards to reaching the poverty reduction goals. Apart from the overall slow down in poverty reduction, and given the resource constraints that operate on the global poverty reduction agenda, the most glaring issue concerns the regional and geographical focus of efforts. It is quite clear that these need to be increased in Africa. This is of course not say that other parts of the world, especially Asia, where there are still more and not less poor people 6 The issue regarding the African experience has been the subject of recent work on the MDGs. Rates of improvement in most living standards measures in Africa show that in the absence of dramatic changes, the MDGs will not be reached there. In particular the problem is much worse for rural areas. Sahn and Stifel (2003).

6
than in Sub Saharan Africa, should be ignored. The point is that whatever the best ways to reduce poverty, they need to be tailored to and applied in the African context with greater urgency than in the past because that is where the global imbalance is appearing in the starkest manner.
6. Is growth enough for poverty reduction?
In terms of ways of tackling the issue of poverty one central finding established by development research in the last two decades is that poverty is reduced by economic growth. However this important result can become the basis of both good and ill-informed policy prescriptions. Substantial academic research as well as international agency reports have been devoted to this topic.7 With more data and detailed studies becoming available, empirical work on the growth-poverty relationship has become more sophisticated but essentially the issue of relevance in our context remains the same. The growth poverty inverse relationship definitely exists but is not perfect. The divergence from the expected level of poverty reduction associated with national income attracts diverse explanations ranging from the institutional to structural. The question that growth is likely to be pro- poor is not seriously at issue, what is at stake is the degree to which it is pro-poor and whether its poor friendliness can be increased. History at least demonstrates that growth though frequently pro-poor is not always equally pro-poor everywhere.8
There are of course claims that overstate the positions on either side. Some of those who argue that growth is good for poverty reduction tend to go for the overkill argument in policy debate, and almost end up suggesting that any kind of growth is ultimately sufficient for poverty reduction. This sufficiency is implied in assumptions made about the “distribution neutrality” of growth.9 Simply put, if growth does not increase inequality (which often cannot be shown to be the case in the shorter run for developing countries) and if it is inversely related to poverty then it must be pro-poor in all circumstances. This argument can be challenged. Establishing the lack of a relationship on the average does not either mean that distributions do not change for the worse or that these distributional changes, however small they may be, do not affect the poor significantly. However refuting the claim that growth is not always equally pro-poor or that it is sufficient for poverty reduction is not the same as holding that the growth-poverty inverse relationship is spurious. The issues involved in this debate get complex, but a commonly acceptable view would be that it is highly likely that growth would reduce some poverty in most circumstances.
The underlying problem we have with respect to the Millennium goal targets is then not the abstract question of whether growth reduces poverty but whether growth and its consequent poverty reductions that we have seen in recent years may be sufficient to bring us to significantly closer to our goals. There are two issues here. First because growth may have been less in the 1990s decade than earlier decades, there is a need to enhance growth. Second because countries may have under-performed their potential in reducing poverty than what would be expected of them on the basis of their growth, there may be a reason to deconstruct the growth process itself. In other words, at least in some parts of the world there may have been a dual problem of both the recent observed slow rate of growth, as well inadequate trickle-down.
7 World Bank, 2002, World Development Report (2001), IFAD (2001). 8 See for example the works in http://www.worldbank.org/poverty/inequal/themgrp/index. 9 Ravallion (2001) discusses the importance of a distribution corrected growth rate as a determinant of the rate of poverty reduction.
7
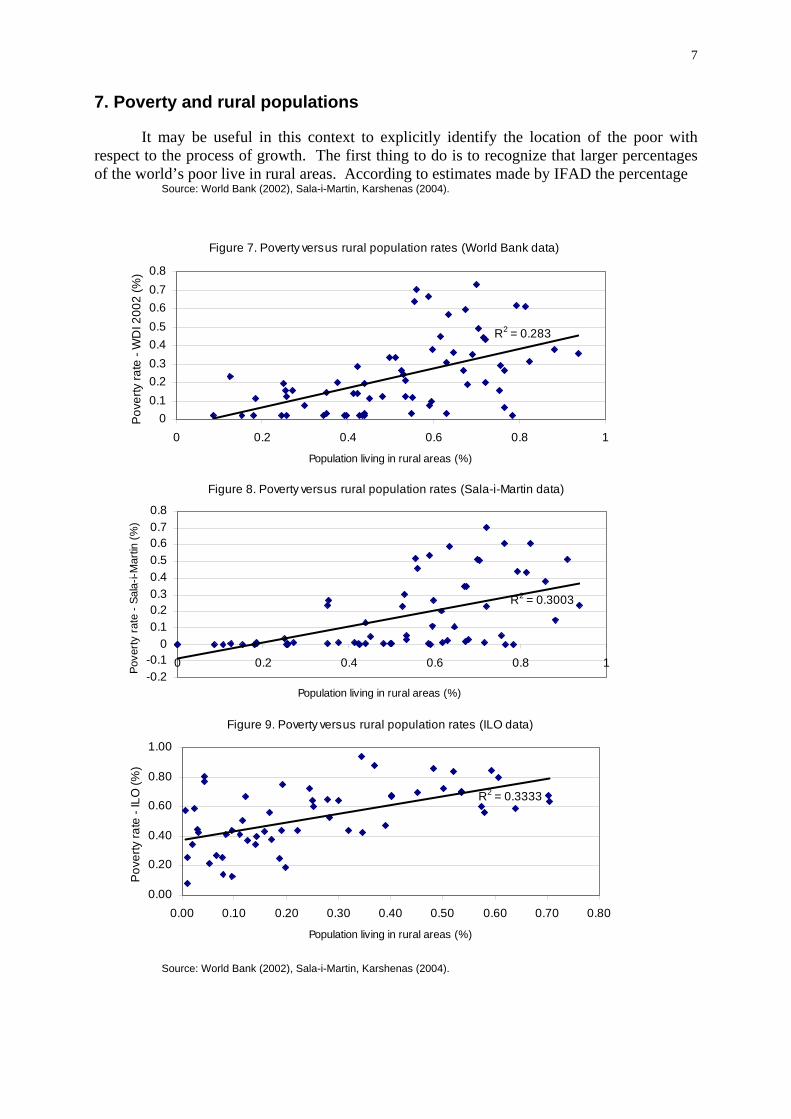
7. Poverty and rural populations
It may be useful in this context to explicitly identify the location of the poor with respect to the process of growth. The first thing to do is to recognize that larger percentages of the world’s poor live in rural areas. According to estimates made by IFAD the percentage
Source: World Bank (2002), Sala-i-Martin, Karshenas (2004).
Source: World Bank (2002), Sala-i-Martin, Karshenas (2004).
Figure 8. Poverty versus rural population rates (Sala-i-Martin data)
R2 = 0.3003
-0.2-0.1
00.10.20.30.40.50.60.70.8
0 0.2 0.4 0.6 0.8 1
Population living in rural areas (%)
Pove
rty ra
te -
Sala
-i-M
artin
(%)
Figure 9. Poverty versus rural population rates (ILO data)
R2 = 0.3333
0.00
0.20
0.40
0.60
0.80
1.00
0.00 0.10 0.20 0.30 0.40 0.50 0.60 0.70 0.80
Population living in rural areas (%)
Pov
erty
rate
- IL
O (%
)
Figure 7. Poverty versus rural population rates (World Bank data)
R2 = 0.283
00.10.20.30.40.50.60.70.8
0 0.2 0.4 0.6 0.8 1
Population living in rural areas (%)
Pov
erty
rate
- W
DI 2
002
(%)

8
of the rural poor is close to 75 per cent of all the world’s poor.10 While most of these rural poor (around 68 per cent) live in South and East Asia, sub Saharan Africa is inhabited by 24 per cent of the world’s rural poor. This over-determining feature of world’s poverty profile being rural is manifest in the positive association between poverty rates and percentages of rural populations. High rural populations by and large tend to be associated with higher poverty. This says little about what needs to be done about reducing poverty but rather, the illustration locationally identifies for us one core part of the poverty problem.
The figures above show, for the three data sets we have on poverty, that there is a positive relationship between the incidence of poverty and rural population. This is by and large true for the regions as well although there is variation in this relationship. At one level this is an obvious expectation that exists in much of development literature. It is implied in two sector models of development as well, although the central mechanism of growth there is in the ‘modern sector’ and consequent cross-sector migrations. However the same illustration in a descriptive and static sense also suggests that poverty is significantly a rural phenomenon. It also stands to reason that for given population distributions, parts of the growth process that are linked to rural areas may have more immediate multiplier effects on improving the well being of the majority of the poor. Consequently, agriculture being the largest part of the rural economy in most developing countries can have lead role to play in pro-poor growth.
8. Global shifts in levels and shares of agricultural output and labour
We have examined trends in poverty with respect to the Millennium goals and also commented on the importance of recognizing the dominantly rural nature of poverty. Before we go on to make a more systematic case for agricultural growth in poverty reduction, it would be instructive to see what has happened to agriculture as such in the last three decades. If we examine the state of global agricultural production and its trends over time we find that agricultural output in the world doubled over the recent 30-year period, increasing from 645.88 billion dollars to 1297.1 billion (1990 dollars) from 1970-2000. During the period the labour input, as measured by population of economically active persons in agriculture, increased by around 40 percent from 898 million to 1.267 billion persons in 2000. Figure 10. World and regional agricultural output (1990 billion US$)
0
50
100
150
200
250
300
350
North Africa Sub-SaharanAfrica
Latin America Asia China
1970
1975
1980
1985
1990
2000
Source: Based on CEPA (2003) Note: “Asia” when shown separately from parts of Asia (e.g. China), excludes those parts.
10 IFAD (2001).

9
Figure 11. Agricultural outputs share by region
1970
2000
North America19%
Latin America
10%Asia 18%
China 10%
Europe 17%
Transition Countries
16% Sub-Saharan Africa
6%
North Africa 4%
North America16%
Latin America
12% Asia 21%
China22%
Europe11%
TransitionCountries
7%Sub-Saharan Africa
6%
North Africa 5%
Source: CEPA (2003). Figure 12. Agricultural labour share by region
1970
2000
Asia 36%
China 37%
Europe 2% Latin
America4%
North America1%
Sub-Saharan Africa10% North Africa
4%
Transition Countries
6%
China41%
Transition Countries
2% Europe1%
North America0%
North Africa 3%
Asia 38%
Latin America
3%
Sub-Saharan Africa12%
Source: CEPA (2003) . Note that the Share for North America in 2000 is between 0 and 1. Of all developing country regions, China posted spectacular growth, more than quadrupling over the period, from $67b to $287b. The agricultural output and labour shares of different regions are shown in Figures 11 and 12.

10
The main feature of the pattern of change is the increase in the global share of agricultural output for China and the rest of Asia over the last three decades. The shares of labour involved in agriculture in different regions of the world have increased by less. China and the rest of Asia account for a major share of the world’s agricultural labour. India and China being the world’s two most populous nations with a large population relying on agriculture, it is hardly surprising that these shares are high and increasing. What is clear from even a cursory examination is that regions with ratios of shares of agricultural output to shares of labour less than 1 are the poorer regions of the world where we expect the incidence of poverty to be high. These regions are Asia, China and Sub Saharan Africa. Trends in this ratio suggest improvements in China as well as in Asia but a worsening for Sub Saharan Africa. This does reflect the broad patterns of declining poverty rates in Asia and in China in particular, and increasing or stagnating ones in Sub Saharan Africa.
9. Factors determining agricultural output growth
Changes in agricultural labour in a country context are dependent on demographic changes and well as cross sector migrations. Labour is however one factor of production and we ask here how the main technical factors behind output growth in agriculture have moved over time. The figures below show trends in output levels and factor use indices for the developing regions of the world estimated on a quinquennal basis from 1970 to 2000. The input indices shown, display growth as they are normalized to 1 in 1970, they do not reflect levels of factor use. Clearly as these are technical factor indices they also do not show the institutional and social contexts of output growth. We find that a spectacular growth performance of China since 1980 is evident. China’s output has grown in excess of 400 per cent over this period, which is roughly twice the growth of the index for world agriculture. Asia also shows an increase, while a more modest increase is in evidence for other regions.
When we break down output growth in to its components of land, labour, fertilizer and tractor use growth indices and look at the Chinese case we find land, labour and fertilizer use indices have shown marked growth while the growth in the tractor use index has tapered off after the mid 1980s, which suggests that China’s agricultural development in the last two decades has not been labour displacing. It is also interesting to look at Sub Saharan Africa, where we find a very modest growth in output, a clear stagnation or worsening in land use, fertilizer use and tractor use indices, and a massive increase in labour use. The latter increase in the context of stagnating complementary inputs and low output growth is like to suggest a worsening situation for agricultural labour.
While trends in outputs and factor inputs are illustrative, this picture of the state of global agriculture, which shows consistent growth is incomplete- if we wish to make its linkage with poverty- unless we look at it in terms of human populations, on a per capita basis. It is important to note this because pure output growth based illustrations can, in their own context, suggest that output growth in agriculture has been very significant in the last three decades. On a per capita basis, we find that the growth in agricultural output as well as value of crops has been modest in the developing world, except for Sub Saharan Africa where we do find a fluctuating trend best classifiable as stagnation.

11
Source: CEPA.
Figure 13. Output by region
050
100150200250300350
1970 1975 1980 1985 1990 1995 2000
Out
put (
US$
Bill.
)North Africa
Sub-Sah Af.
Latin America
Asia
China
Figure 14. Land index by region
0.90
1.10
1.30
1.50
1970 1975 1980 1985 1990 1995 2000
Inde
x
Figure 17. Tractors index by region
0.002.00
4.006.00
8.0010.00
12.00
1970 1975 1980 1985 1990 1995 2000
Figure 15. Labor index by region
0.90
1.10
1.30
1.50
1.70
1.90
1970 1975 1980 1985 1990 1995 2000
Inde
x
Figure 16. Fertilizer index by region
0.00
2.00
4.00
6.00
8.00
1970 1975 1980 1985 1990 1995 2000

12
Figure 18. Agricultural output per capita by region (log scale)
Figure 19. Crop output per capita by region (log scale)
Source: Data from CEPA.
10
10'000
1970
1972
1974
1976
1978
1980
1982
1984
1986
1988
1990
1992
1994
1996
1998
2000
Year
Ag o
utpu
t per
cap
ita North AfricaSub-Sah AfLatin AmericaAsiaChina
100
1970
1972
1974
1976
1978
1980
1982
1984
1986
1988
1990
1992
1994
1996
1998
2000
Year
Crop
s ou
tput
per
cap
ita
North AfricaSub-Sah AfLatin AmericaAsiaChina

13
10. Deconstructing the growth process historically
We have shown until now that poverty rates have been declining in the last three decades although the decline in the 1990s has slowed down. Although ILO regional estimates of poverty differ from other sources, its is probably a matter of some consensus to argue that China is heralding an important change poverty reduction in developing world, while Sub Saharan Africa shows serious signs of a crisis that is so severe that it will jeopardize the Millennium poverty targets. Moreover we do find that while agricultural output growth was reasonable in the last three decades, it has at least in the developing world been limited on a per capita basis. Once again the per capita output trends in China and Sub Saharan Africa do show a consistency with observed poverty trends.
Therefore one can argue that while poverty reduction has been slowing down there is some prima facie evidence to suggest a linkage between poverty reduction and agriculture growth. The question to ask therefore is about the relative importance of agricultural growth in comparison to other sectors in the economy for poverty reduction. Discussions on the importance of rural poverty and agricultural development are not new. These were preponderant in the development literature that emerged during and after the green revolution in the 1970s. The reason why this primacy of agriculture argument is important to re-state in the present policy environment of developing countries is precisely because often in contemporary discussions, until very recently, it has taken a secondary status with the consequence that growth itself is not explicitly distinguished sectorally in relation to the location of the poor. Our preceding discussion suggests why it may be time to examine this issue again. With increased data availability recent research11 shows fairly rigorously the immediate or short run effects of growth on distribution (which are not major) and the longer run effect of growth on distribution (which may be a worsening one) for developing countries. However what some of this research also crucially shows is that it is the structural features of an economy (and the agriculture sector in particular) that influence what happens to the poor in long run growth. These findings have important implications for the sustainability of poverty reducing growth strategies. In particular it has been shown that agricultural productivity growth is more poverty alleviating than non-agricultural productivity led growth in countries where the gap between the rich and poor is not too extreme. The point can be illustrated at a broad macro level too. We know that in the 1990s poverty reduction slowed down, while in the 1970s and 1980s it showed a more rapid decline. It is therefore instructive to look at the effects of changes in value added in each sector on poverty reduction in these periods. Looking at decadal changes in poverty rates and sector value added for three sectors (controlling for change in GDP per capita) we find that it is changes in the agricultural value added that have generally had significant and sizable effects on poverty reduction in the periods of 1970s and 1980s, the periods when the greatest poverty reduction took place. These effects are represented in the charts in Figure 20. It can therefore be argued that agricultural growth significantly reduced poverty in the 1970s and 1980s; the same is also true of services growth in the 1970s.
The simple illustration on a regional basis, for the Sala-i-Martin data, shows the strength of the agricultural coefficient more in the Asian and Sub-Saharan Africa cases. In Latin America where as we can see from Figure 21, land inequality levels are much higher than elsewhere, no case can be made for the agricultural growth and poverty reduction, and it’s the services sector growth in the 1970s which can be associated with poverty reduction here. 11 See P. Timmer (1997) who uses the available income distributional data on quintiles due to Deininger and Squire (1996) to make this case.

14
Figure 20. Change in poverty associated with change sectoral growth rates (in percentage points)
Note: Solid blocks represent statistically significant coefficients at less than 10 per cent. Shaded columns are not statistically significant at 10% or less.
Change in poverty associated with 1% increase in sector value added growth rate
(OLS regression with Sala-i-M artin poverty data)
-0.15%
-0.10%
-0.05%
0.00%
0.05%
0.10%
1970s (n=42) 1980s (n=51) 1990s (n=58)
Agriculture Services M anufacturing
Change in poverty associated with 1% increase in sector value added growth rate in Latin America (OLS regression with Sala-i-M artin poverty data)
-0.10%
-0.05%
0.00%
0.05%
0.10%
0.15%
0.20%
0.25%
1970s (n=18) 1980s (n=21) 1990s (n=22)
Agriculture Services M anufacturing
Change in poverty associated with 1% increase in sector value added growth rate in Sub-Saharan Africa
(OLS regression with Sala-i-M artin poverty data)
-0.25%
-0.20%
-0.15%
-0.10%
-0.05%
0.00%
0.05%
0.10%
0.15%
0.20%
1970s (n=13) 1980s (n=18) 1990s (n=24)
Agriculture Services M anufacturing
Change in poverty associated with 1% increase in sector value added growth rate in Asia
(OLS regression with Sala-i-M artin poverty data)
-0.70%
-0.60%
-0.50%
-0.40%
-0.30%
-0.20%
-0.10%
0.00%
0.10%
0.20%
1970s (n=11) 1980s (n=12) 1990s (n=12)
Agriculture Services M anufacturing
Change in poverty associated with 1% increase in sector value added growth rate
(OLS regression with ILO poverty data)
-0.15%
-0.10%
-0.05%
0.00%
0.05%
0.10%
1990-1996 (n=54)
Agriculture Services M anufacturing
Change in poverty associated with 1% increase in sector value added growth rate in Latin America
(OLS regression with ILO poverty data)
-0.15%
-0.10%
-0.05%
0.00%
0.05%
0.10%
1990-1996 (n=19)
Agriculture Services M anufacturing
Change in poverty associated with 1% increasein sector value added growth rate in Sub-Saharan Africa
(OLS regression with ILO poverty data)
-0.10%
-0.05%
0.00%
0.05%
1990-1996 (n=22)
Agriculture Services M anufacturing
Change in poverty associated with 1% increase in sector value added growth rate in Asia
(OLS regression with ILO poverty data)
-0.35%
-0.30%
-0.25%
-0.20%
-0.15%
-0.10%
-0.05%
0.00%
0.05%
0.10%
1990-1996 (n=10)
Agriculture Services M anufacturing

15
Figure 21. Regional ownership distribution of land (population weighted): Gini coefficient
0.0 10.0 20.0 30.0 40.0 50.0 60.0 70.0 80.0 90.0
East Asia South-East Asia Sub-Saharan Africa
South Asia Middle East and North Africa
Latin America and the Caribbean
Source: CEPA data set .This Gini coefficient for ownership holdings of land is from the CEPA data
set and based on the dataset by Klaus, Deininger, Heng-fu Zou, as well as FAO Statistics on land distribution.
In no case however does manufacturing growth show a direct significant association with poverty reduction. This also makes sense since manufacturing led growth is unlikely to have large first round employment effects. This is of course not to say that manufacturing and its second round demand driven growth effects on other sectors can be ignored, but rather that direct effects of agricultural growth on poverty reduction seem pervasive. This is of course abstracting from the issue of the output composition of that agricultural growth, which we discuss below. Moreover better initial distributional conditions, it would seem, also make the impact of a given sectoral growth rate on the poor better. Similarly, ILO poverty estimates, even for the 1990s, the period of slow poverty reduction, suggests that a case can be made for poverty to have been reduced more by growth in agricultural value added in the developing world, which is a result driven by Asia and more specifically China. Therefore we suggest that if there is a special sector focus of growth that may best achieve the Millennium poverty reduction goals directly it ought to be on the agricultural sector.
11. Why is agricultural sector growth important for poverty reduction?
While the importance of agricultural growth for poverty reduction is undeniable, there is a component of agricultural growth that is particularly relevant for poverty reduction. The rural poor are largely persons with a very limited asset base. They work as causal labourers, sharecroppers or very small operators. While access to food is clearly not the same thing as availability of food, especially when the poor have to purchase it, nevertheless for a given distribution, a greater availability of food output is indicative of a better potential position of the rural poor than a lower availability. Consequently the supply of food within a country, which admittedly reflects cropping patterns and price driven incentive structures, and limited as it is as an indicator, can also be seen as a measure of greater proximity to food for the poor who work within agriculture - where we know the bulk of the poor exist. Interestingly we find dramatic trends in the index of food production per capita in the three regional classifications. The position of Asia has continued to improve on this indicator and much of this improvement is based on the East Asian and Chinese experience. Moreover the reversal that is visible in Sub Saharan Africa, given the poverty trends in this region, suggest that food supply per capita is a reasonable indicator of vulnerability to poverty. Once again we find regional trends in food supply per capita that are consistent with the regional poverty patterns.

16
China Latin America and the Caribbean Sub-Saharan Africa
Figure 22. Food per person index (1990=100)
50 70 90
110 130 150 170
1970 1972 1974 1976 1978 1980 1982 1984 1986 1988 1990 1992 1994 1996 1998 2000
Asia excl. China
Middle East and North Africa
Figure 23. Regional population weighted food price index (1995=100)
0 50
100 150 200 250 300 350 400 450
1980 1982 1984 1986 1988 1990 1992 1994 1996 1998 2000 Asia Latin America and the Caribbean Sub-Saharan Africa
Note: For Figure 22 two indexes are used, the first is one of food production and the second for population. Both are set to 100 for 1990. For Figure 23, price data for China was unavailable.
We know the poor are both purchasers of food and sellers of food output. Claims that
they are always and everywhere net purchasers of food are speculative though not implausible. What can also be claimed is that to the extent the poor are involved in agriculture, there are various contractual arrangements within which they can get to keep some of the crop output as shares, or piece and time rated wages in kind which they can consume and/or sell. This is known to be particularly true for food crops. When we look at the Food Price Index across the regions we also find plausible trends. The Asian trend is one of a gradual increase which does not outstrip the per capita food supply trends. There is a slightly greater rise in the food price index in the Latin American Region. However in the Sub Saharan African region the increases in the 1990s are extremely high. This fact in conjunction with the deteriorating trends in food availability per capita indicates the strong likelihood of anti-poor effects in Sub Saharan Africa.
While food output and prices are a special policy focus within a pro-poor agricultural growth strategy, the case for agricultural growth for poverty reduction also has important supplementary arguments. It may be useful to summarily state these. Firstly, while poverty is largely rural, and agriculture is a major part of the rural economy, there are other activities within the rural economy, which can be stimulated by agricultural growth. Rural non-farm (RNF) activities are not just outside the agricultural sector in a sectoral sense but typically

17
form part of activities of households, particularly poor households engaged in agriculture.12 The RNF sector has also been a neglected sector in much of the developing world, even though it promotes growth and improves welfare. Essentially when we have a situation in which the rural work force is increasing at a rate higher than employment in agriculture, a RNF sector can lower rural underemployment and arrest rural out migration. Apart from the sector itself being a large market for agricultural output, the growth of agriculture can in the presence of a supported RNF sector allow for the consumption of commodities and services produced in the RNF sector, thus constituting sustainable multipliers for rural employment and welfare improvement. Recent work on RNF sector is however limited. A survey of the issue done for the World Development Report of 1995 (Lanjouw and Lanjouw, 1995) argued that support to this sector was undertaken largely in the context of an overall policy framework that was biased against this sector. Given its diversity it is admittedly difficult to give a broad policy perspective. It is possible to find RNF activities that can best be considered survival activities just as it is possible to find examples of growth enhancing productive RNF activities. The point in any particular country context is to sift out the former from the latter and direct appropriate support mechanisms to each. The concern with RNF sector is sometimes driven by the expectation that a success here may accelerate poverty reduction. While independent efforts to support RNF sector may have dividends in themselves, it is important to recognize that the role of this sector in poverty reduction is likely to come in to proper play when there is reasonable growth in agriculture itself. In general, arguments can be advanced to suggest that a productive and diversified agriculture is in a better position to sustain industrialization.13
In short we find that poverty even today is significantly a rural phenomenon, that agricultural development and growth is more crucial for immediate as well as sustainable poverty reduction than growth in other sectors of the economy; that this growth also has supplementary multipliers within the rural areas; and that the role of food production and food price trends within agricultural development may warrant a particular focus within an agricultural growth driven poverty reduction strategy.
12. Productivity in agriculture
We have made a case for the importance of agricultural growth to poverty reduction, identifying some possible distributional, crop specific and price based issues that may be relevant to the poor in developing country agricultural sectors. The latter constitute a possible policy focus – within an agricultural growth strategy – on improving asset distributions, enhancing food crop production, and avoiding extremely sharp increases in food prices. We now move on to the issue of productivity.
A systematic view of labour productivity by regions is given in the Table below. The figure is most informative with respect to relative levels of labour productivity. Latin American levels of labour productivity are the highest in the developing world; this is followed by the Middle East and North Africa region. The East Asian region and Sub-Saharan Africa come next and then we have the Asian sub regions of South Asia and China, where the large number of poor in the world live today.
12 Saith (1992), Lanjouw and Lanjouw (1995). 13 Eswaran and Kotwal, (2002).

18
Figure 24. Labour productivity by region, weighted by labour force
1987 1990 1993 1996 1998
East Asia ex-China 0.0183 0.0192 0.0214 0.0190 0.0175
China 0.0090 0.0090 0.0110 0.0110 0.0110
South Asia 0.0111 0.0120 0.0120 0.0103 0.0102
Asia 0.0112 0.0117 0.0131 0.0121 0.0118
Latin America and the Caribbean 0.0926 0.0927 0.0998 0.0908 0.0905
Middle East and North Africa 0.0414 0.0444 0.0478 0.0456 0.0436
Sub-Saharan Africa 0.0177 0.0181 0.0192 0.0175 0.0167 Based on CEPA data.
It can be suggested from the above illustrations, in conjunction with the earlier discussion
on trends in global poverty, that there is a likely to be a deeper link between agricultural labour productivity growth and poverty reduction. If we look at the labour productivity trends up to the early 1990s we find slow trend increases in all regions. In the later years, there are trend declines except for China, which maintains its levels. This is consistent with the poverty story since we know that poverty reduction slowed down in the 1990s, except in the case of China.
On the other hand if we look at Total Factor Productivity (TFP) in agriculture, it shows consistent increases in all developing countries groups even after the early 1990s. The regional differences in total factor productivity growth are also apparent in the developing world. This suggests to us at a very basic level that if there is a linkage between agricultural productivity and poverty reduction it is likely to be best realized when neither TFP nor labour productivity are declining, or not realized best when only TFP is increasing.
0 0.02 0.04 0.06 0.08 0.1
0.12
1987 1990 1993 1996 1998
Labo
ur P
rodu
ctiv
ity
East Asia excl. China ChinaSouth Asia Latin America and the Caribbean Middle East and North Africa Sub-Saharan Africa
19
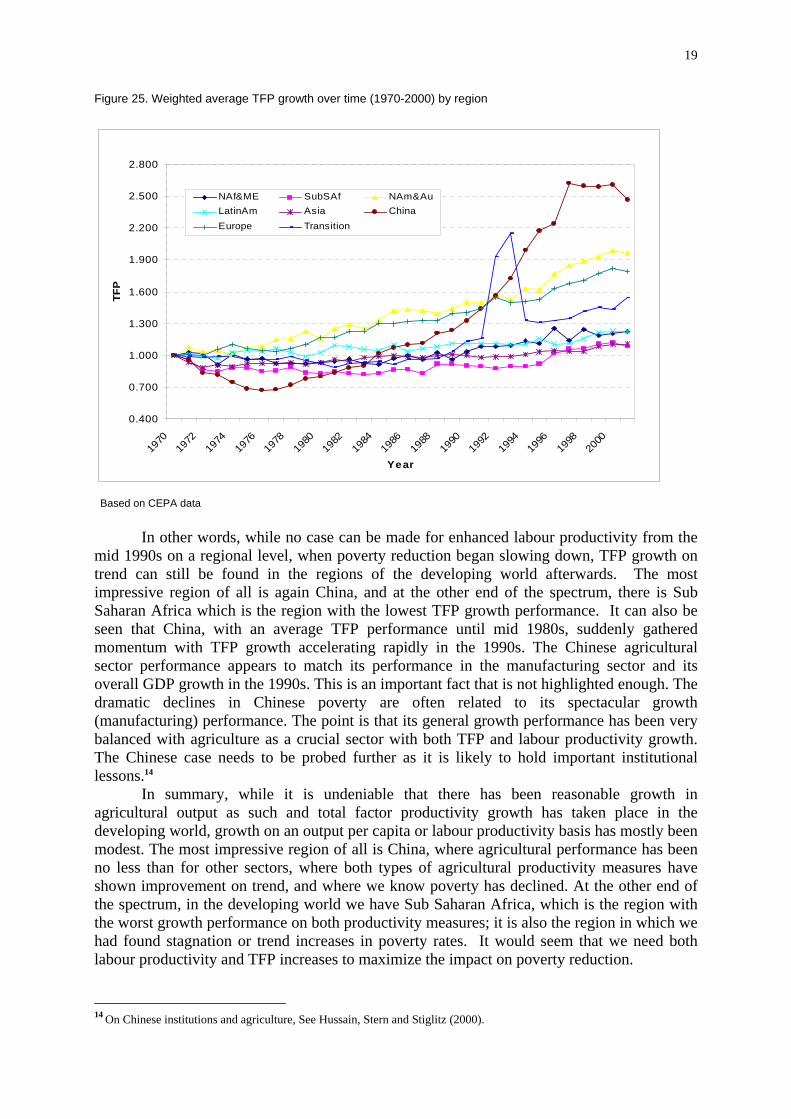
Figure 25. Weighted average TFP growth over time (1970-2000) by region
0.400
0.700
1.000
1.300
1.600
1.900
2.200
2.500
2.800
1970
1972
1974
1976
1978
1980
1982
1984
1986
1988
1990
1992
1994
1996
1998
2000
Year
TFP
NAf&ME SubSAf NAm&AuLatinAm Asia ChinaEurope Transition
Based on CEPA data
In other words, while no case can be made for enhanced labour productivity from the mid 1990s on a regional level, when poverty reduction began slowing down, TFP growth on trend can still be found in the regions of the developing world afterwards. The most impressive region of all is again China, and at the other end of the spectrum, there is Sub Saharan Africa which is the region with the lowest TFP growth performance. It can also be seen that China, with an average TFP performance until mid 1980s, suddenly gathered momentum with TFP growth accelerating rapidly in the 1990s. The Chinese agricultural sector performance appears to match its performance in the manufacturing sector and its overall GDP growth in the 1990s. This is an important fact that is not highlighted enough. The dramatic declines in Chinese poverty are often related to its spectacular growth (manufacturing) performance. The point is that its general growth performance has been very balanced with agriculture as a crucial sector with both TFP and labour productivity growth. The Chinese case needs to be probed further as it is likely to hold important institutional lessons.14 In summary, while it is undeniable that there has been reasonable growth in agricultural output as such and total factor productivity growth has taken place in the developing world, growth on an output per capita or labour productivity basis has mostly been modest. The most impressive region of all is China, where agricultural performance has been no less than for other sectors, where both types of agricultural productivity measures have shown improvement on trend, and where we know poverty has declined. At the other end of the spectrum, in the developing world we have Sub Saharan Africa, which is the region with the worst growth performance on both productivity measures; it is also the region in which we had found stagnation or trend increases in poverty rates. It would seem that we need both labour productivity and TFP increases to maximize the impact on poverty reduction.
14 On Chinese institutions and agriculture, See Hussain, Stern and Stiglitz (2000).

20
ILO-CEPA research on productivity in agriculture allows us to examine movements in total factor productivity as well as Labour productivity in a fair amount of detail. The Table below gives correlations between Total Factor Productivity and Labour and Land Productivity measures in the data set. Table 1. Correlations of TFP with labour productivity and land productivity
Region Sample size Labour productivity
Land productivity
Developing countries 504 0.359 0.262 East Asia 56 0.522 0.456 Latin America and the Caribbean 119 -0.243 0.243 South Asia 35 0.064 0.083 Sub-Saharan Africa 119 0.165 0.643 Based on CEPA data.
While there is a general positive relationship between the TFP and labour productivity,
it is clearly an uneven relationship. In Latin America there is a perverse sign, and in South Asia it is extremely weak. Explaining growth in productivity is a topic in which considerable research effort has been made in the last fifty years. Numerous studies have attempted to explain the trends and levels in labour productivity in agriculture, manufacturing and the economy as a whole. There is a body of growth accounting literature that is devoted to systematically accounting for growth in labour productivity using capital intensity, human capital, land quality and other factors.15 In a fairly comprehensive and influential study Hayami and Ruttan (1985) elaborate on the role of agriculture in development. They provide estimates of land and labour productivity for a large number of countries and then explore the causes of productivity differentials across countries. Much of their analysis focuses on labour productivity and its determinants in the form of changing land/labour ratios and the use of fertilizers and tractors in agricultural production. The work also examines the question of resource constraints and sources of technical change. Hayami (2002) reinforces these ideas in a more recent work where he identifies sources and constraints to productivity growth. In contrast to some of the earlier work on productivity in agriculture that focuses on only on labour productivity, we initially focus on multi- or total factor productivity growth, which takes into account all the important measurable inputs into agriculture.16 Note that looking at patterns of poverty and productivity we found grounds to suggest that TFP and Labour productivity growth together may be required and TFP on its own may not work as well. While labour productivity measures are linked to TFP measures, with TFP measures, once the traditional inputs into agriculture are taken into account, any productivity growth (or change) has to be explained using other factors.17 Improvements in skills of agricultural labour, better quality fertilizers, tractors with greater horse power and better seed varieties are few examples of technical input quality that has direct influence on productivity. In the present context of developing countries our emphasis is on institutional, policy and structural factors in enhancing productivity. The focus here is on Asia, Africa and Latin America – three regions
15 Some recent studies have attempted to measure the influence of research and development (R&D) expenditure on growth in productivity (Craig et al, 1997; Thirtle et al., 2002). 16 In addition to labour, the CEPA-ILO study considers land, fertilizer, tractors and livestock inputs into agricultural production and productivity growth as the Solow residual. Considerable work done in the past on agricultural productivity has been based on estimated production functions or index number calculations and in this sense the results presented in this paper, are an advance on past literature. In contrast to earlier work, the CEPA research for the ILO uses non-parametric frontier methods to estimate productivity change over time. 17 Recently, Craig et al. (1997) investigated the role of input quality, infrastructure and research in explaining total factor productivity growth.

21
consisting of predominantly low-income countries. We assume that geographical, institutional and political factors could be just important as some of the macro-economic variables in explaining agricultural productivity levels in developing countries. Therefore we seek to explain total factor productivity performance in agriculture by considering a number of economic, geographical and institutional factors.18 The results of this analysis are presented in the Table below. The research has used a general to specific modelling approach, in which the “general model” includes an extensive array of variables designed to capture the effects of macroeconomic policy, education, quality of governance, and geography. The first regression in the table presents this general model, while regression 2 is the reduced or specific form as it includes only those variables whose coefficients prove to be significant at the 10 per cent level or higher. In regression 3 we run a fixed effects model in which continental dummy variables for Sub-Saharan Africa (SSA), East Asia (EASIA), South Asia (SASIA) and Latin America and the Caribbean (LATAM) are included. In regression 4 we repeat the approach of regressions 1 and 2, but with the inclusion of the Gini coefficient for the ownership distribution of land (LANDGINI). This model was run separately since the LANDGINI variable is only available for approximately 70 per cent of the countries in our sample; thus it significantly reduces the sample size. The main results of these regressions are as follows:
In general, the regressions perform quite well for yearly data of this nature, explaining about 32-47 per cent of the variation in total factor productivity levels for agriculture. In Regressions 1, 2 and 3 the proportion of land which is irrigated is positive and significant. TRADE and FDI, that can be said to constitute proxies for openness, enhance TFP. Government Investment (GDI) and Government consumption (GOVCON) as percentage of GDP while initially counter intuitive, might show urban biases in resource allocation and State funding of agriculture. On the other hand this may also be reflective of fiscal constraints that developing countries often face in the context of structural reforms.19 While such discrimination can be traced to some early discussions in development policy literature, it is also a result of biases inherent in political systems as well as the fiscal straight jackets normal associated with reforms. The broad point being, that government policy may discriminate against the rural sector both implicitly and explicitly. Human capital (ILLITERACY) and health (∆MALARIA) indicators both show expected negative signs- a healthier and more educated workforce is associated with greater TFP. This is a policy area in which things can be done; it is also one that is directly related to poverty, since health and education are known correlates of poverty. Physical and geographical isolation (DISTANCE), also show a negative relationship with TFP. The regression also shows that the proportion of land in the tropics is positive and significant (TROPLAND). The positive coefficient on TROPLAND, though perhaps counterintuitive in that tropical soils are generally less fertile, may be explained by perhaps beneficial effects of greater rainfall or other meteorological conditions.20 The indicators of basic political participation (POLITY) or extent of political stability (WAR) do not show significant relationships to TFP. Moreover, regressions 4, 5 and 6 present several apparent anomalies. POLITY and WAR are, respectively, negatively and positively correlated with TFP levels, both of which can be construed as somewhat counterintuitive results.
18 Our dependent variable is the level of total factor productivity (TFP) in agriculture measured for 52 low and middle income developing countries. We exclude high income and transition economies, as well as several countries for which limited data was available. These are: Angola, Burundi, Cambodia, Chad, Cuba, Guinea, Iraq, Iran, South Korea, Laos, Mongolia, Myanmar, Nepal, Rwanda, Saudi Arabia, and the Sudan. I am grateful to research staff at CEPA who gave assistance in running these regressions. 19 This correlation holds net of the effect of other variables in the model, such as illiteracy rates, which are largely also a function of government expenditure. 20 Furthermore, when we include fixed effects in Regression 6, the TROPLAND variable becomes negatively correlated with TFP levels.

22
Table 2. Regression analysis: Dependent variable: Agricultural total factor productivity (1-6); Labour productivity (7)
Reg. No. 1 2 3 4 5 6 7
Observations 1450 1497 1497 1023 1023 1023 1023
R2 0.33 0.32 0.35 0.36 0.36 0.47 0.91
R2a 0.33 0.31 0.35 0.35 0.35 0.46 0.91
TRADE 0.08 ***
0.08 ***
0.14 ***
0.05 *
0.05 *
0.08 ***
0.40 ***
ILLITERACY -0.26 ***
-0.26 ***
-0.22 ***
-0.43 ***
-0.42 ***
-0.41 *** --
ICRG3 -1.30 **
-1.60 ***
-0.97 NS
-0.23 NS -- -0.33
NS -0.03 NS
GDI -0.59 ***
-0.57 ***
-0.54 ***
-0.64 ***
-0.64 ***
-0.54 *** --
GOVCON -0.44 ***
-0.27 **
-0.25 ***
-0.72 ***
-0.70 ***
-0.47 ***
-0.54 NS
FDI 2.20 ***
2.13 ***
2.00 ***
2.05 ***
2.06 ***
1.66 ***
8.22 ***
TROPLAND 0.11 ***
0.11 ***
0.01 NS
0.07 ***
0.07 ***
-0.17 ***
1.29 ***
∆MALARIA -0.56 ***
-0.58 ***
-0.28 **
-1.00 ***
-1.01 ***
-1.21 ***
-0.32 ***
RURAL -0.29 ***
-0.26 ***
-0.02 NS
-0.39 ***
-0.39 ***
0.04 NS
-0.51 NS
DISTANCE -0.15 ***
-0.15 ***
-0.17 ***
-0.14 **
-0.14 ***
-0.46 NS --
IRRIGATED 0.20 ***
0.19 ***
0.22 ***
0.24 ***
0.24 ***
0.35 ***
0.95 ***
POLITY 0.08 NS -- -0.24
** -0.24 ***
-0.26 **
0.00 NS
WAR -0.15 NS -- 1.92
** 1.88 ***
2.77 ***
-0.04 NS
AGEDEPEND 0.02 NS -- 0.39
*** 0.38 ***
0.04 **
1.27 ***
LANDGINI -- -- -- -1.52
** -1.51
** -2.33 ***
-0.50 **
TRACTORS 0.07 ***
FERTILIZER -0.02 ***
SSA -- -- 0.06 ** -- -- 0.44
*** --
EASIA -- -- 0.06 ** -- -- 0.34
*** 0.44 ***
SASIA -- -- -0.04 NS -- -- 0.19
*** 0.59 ***
LATAM -- -- 0.18 *** -- -- 0.53
*** 0.95 ***
CONSTANT 0.867 ***
0.86 ***
0.35 ***
0.82 ***
0.82 ***
0.78 ***
-1.74 ***
Notes: * coefficient is significant at < 10% ; ** coefficient is significant at < 5% ; *** coefficient is
significant at < 1 % . Regression 1, 2 and 3 are similar to CEPA (2004), except that in those the % of population in the tropics is used as opposed to TROPLAND, the % land in tropics.

23
In this context it needs to be recognized that many of the best performers in terms of agricultural TFP do not perform well on institutional indices of political participation. Many countries which reportedly performed well in agricultural TFP have performed poorly in terms of increasing “political freedoms”. The point to be made here is that we need to deconstruct democracy much more, in order to meaningfully examine its relationship to agricultural growth.21 Similarly the indicator of institutional quality (ICRG3) shows a negative sign in regressions 1 and 2. Once again while the relationship may appear counter intuitive, it needs to be borne in mind that it is likely that this (and such) measures capture non-agrarian institutional conditions more. The use of such qualitative indicators, assuming them to be applicable to the whole of society- as is fashionable in some literature today- in the analysis of countries with large agrarian parts may therefore be inappropriate. Agrarian institutions and contractual arrangements are informally “institutional” and the likelihood of such frequently used qualitative measures carrying biases that disallow capture of agrarian conditions is illustrated here.22 The variable that is likely to capture “institutional conditions” in agriculture best is probably still the distribution of agricultural ownership holdings (LANDGINI) because it is the distribution of assets that reflect social relations and property rights best in an agrarian context. While the inclusion of LANDGINI also renders the “institutional” quality indicator insignificant (Regression 4), the variable is significantly and negatively correlated with TFP levels, as expected.
We also examine a comparable model in equation 7 with the more standard labour productivity measure as the dependent variable. The model presented was arrived at in a similar way as the TFP models moving from a general to a specific form. Additional explanatory variables used are tractors per thousand workers (TRACTORS)23 and fertilizers per millions workers (FERTILIZERS). We find that TRACTORS is highly significant but the FERTILZERS variable has a negative sign which is difficult to explain. The inclusion of these variables results in several changes to other non-technical coefficients in the model. In particular the coefficients on illiteracy, GDI and GCON (which were negatively correlated with TFP) are no longer significant. This may suggest that urban biases in resource allocation may apply more when we have TFP led growth. DISTANCE is no longer significant; POLITY has a positive sign and is not significant. LANDGINI is negative and significant suggesting that for both TFP and labour productivity more equal land distributions may be beneficial. The overall fit of the regression on labour productivity is better than the TFP models.
In summary, the results give an interesting sketch of possible determinants of agricultural productivity. From broad trends in poverty, labour productivity and TFP we suggested that both may be important to enhance for poverty reduction. It can now be suggested that while many factors that determine TFP, particularly the quantities of land and labour and geography are relatively fixed, sustainable rural development, will come through increases in the quality of labour and land, and through better infrastructure. In particular, our results suggest several avenues by which developing countries may increase their total factor productivity in the rural sector: investment in human capital through education and health outlays is clearly one way, and improving physical infrastructure for the rural sector is another. Both ways are clearly dependent on extent of constraints and biases that a country faces and observes with regards to the sectoral direction as well as the quantum of its public investment. A more open trade regime does seem to be associated with higher agricultural productivity, though one needs to examine more specifically what open trade regimes really 21 Bardhan (1999). 22 The addition of fixed effects (continental dummies; Regression 3) appears to consistently render the coefficients on RURAL and ICRG3 insignificant. 23 The results on labour productivity regressions that were conducted suggest that the number of tractors per 1000 worker to account for about 50 per cent of the variation in labour productivity observed across the developing countries in this data set.

24
mean in an agricultural policy context in particular countries. On the other hand it is also the case that while institutional conditions, extent of democracy as well as political disturbance (and conflict related) factors are important goals to strive for improvements in themselves, they cannot be proposed as factors which if improved, would cause improvements in TFPs or labour productivity. The reason for this may indeed be that our notion of “institutional” improvement sometimes itself carries representational biases reflected in indicators, and more participatory agrarian environments may not be linked to the extent of political freedoms as these are commonly understood. On the other hand, land ownership distributions are relevant and better asset distributional conditions have a beneficial impact on total factor productivity. While some of these features differ in importance or even conflict when we look to enhance labour productivity, which implies examining the role of these factors in greater detail in specific contexts, there are some important commonalities too, that can be seen as pointers towards elements for a general strategy. Openness would seem to be favourable in both contexts, better health of work forces and irrigation benefits both labour and total factor productivity; and the implication for advancing on agendas for improved land ownership distributions in those countries that have not had proper land reform is an important policy intervention to consider even today not on grounds of growth.
13. Agricultural productivity and poverty reduction
We have argued that the 1990s slow down in poverty reduction may affect the Millennium goal targets and while the great realiser of these goals is China its central fall out is likely to be in Sub Saharan Africa. We have also argued that the poverty is primarily though not exclusively a rural and agrarian phenomenon. We also find that the specific case for the superiority of agricultural growth compared to growth in other sectors as a vehicle for poverty reduction can also be made. Moreover within the pattern of agricultural growth it may be important to recognize that the pro-poorness of this growth may be linked to food supply and food price policy. On the other hand we have also made a linkage between trends in agricultural productivity and poverty reduction suggesting that labour productivity may be especially relevant for poverty reduction, or that increases in TFPs alone may not be sufficient for poverty reduction. We have then gone on to identify some factors that may enhance both. This suggests that a case for agricultural growth and poverty reduction can be made on reasonably strong grounds. We now examine what can be said directly in this context.
We pool each of the two poverty data sets (Sala-i-Martin and ILO) respectively for the different years, and examine the relationship between the two measures of productivity and poverty in regressions 1 to 8. The standard variable of per capita income is excluded in the regressions because the productivity measures are themselves related to per capita national income. We find that that the agricultural labour productivity indicator is negatively and significantly related to poverty for both data sets. On the other hand the TFP variable has a negative though insignificant sign with the Sala-i-Martin data set and a positive sign when used with ILO data, where it is statistically significant in one case. Therefore there is a stronger case to be made for the importance of labour productivity growth in poverty reduction, while the same cannot be said directly for total factor productivity- even though in situations that are not characterized by extreme inequality we found TFP and labour productivity to be complementary. The expectation that we had on the basis of examining trends in poverty, TFP and labour productivity as well as looking at the determinants of the two productivity measures seems to be valid. The percentage of rural population, which was considered to be reflective of poverty’s rural dimension, when significant is linked positively to poverty. The inequality variable of income distribution is also positively related to poverty when significant. This is also in accordance with the standard model of poverty that suggests

25
that unequal distributional environments exacerbate poverty or make poverty reduction slower for a given growth rate.
Table 3. Regression analysis: Dependent variable: Poverty headcount rates
Notes: * coefficient is significant at < 10% ; ** coefficient is significant at < 5% ; *** coefficient is
significant at < 1 % ; NS: non significant. Having established broad contours of the agricultural productivity and poverty
relationship controlling for the distribution of populations and incomes we proceed further by qualifying some of the poor-relevant dimensions of agricultural growth, suggested in earlier sections, in models 5 to 8. For this purpose the variables capturing food production per person (food production per capita index), as well as food price index (food price index) are introduced. Recall that we suggested that increased food availability per person is likely to be beneficial for poverty reduction. It was also suggested that while moderately rising food prices may not be harmful for poverty reduction, high food price inflation may be. Thus extreme changes in food prices concomitant with stagnation and declines in food production, as have been evidenced in Sub Saharan Africa may be harmful, but moderately rising food prices within a growth context may not be so problematic for the poor. Since land ownership distribution may be particularly linked to rural dimensions of poverty, a variable on land ownership distribution (LANDGINI) is also introduced.
As indicated, we find that the agricultural labour productivity indicator comes through even more strongly as poverty reducing. TFP is both ambiguous in sign and weaker in the sense that it is not significant. The variable on rural population has a positive sign when significant. While the income distribution is consistently positive and significant, the land ownership distribution gini is always positive and in two cases also significant. This suggests
Sala-i-Martin $1 poverty
Pooled 1970-2000
X XXILO $1 poverty X
XPooled 1987-2000
Sala-i-Martin $1 poverty
Pooled 1970-2000
X XXILO $1 poverty X
XPooled 1987-2000
Sala-i-Martin $1 poverty
Pooled 1970-2000
X XXILO $1 poverty X
XPooled 1987-2000
Sala-i-Martin $1 poverty
Pooled 1970-2000
X XXILO $1 poverty X
XPooled 1987-2000
1 2 3 4 5 6 7 8-0.7669218 6.386307 -0.4106798 5.236602
NS *** NS NS-11.92311 -12.43835 -14.45561 -15.40089
*** *** *** ***-1.316561 0.7782993 18.07156 23.77895 -5.42985 -2.182924 14.41204 20.64375
NS NS *** *** NS NS *** ***9.00198 27.64313 4.701265 31.07215 19.67046 36.06058 21.8341 39.56016
* *** NS *** *** *** *** ***-0.0849498 -0.3760242 -0.2640259 -0.4844959
NS *** ** ***0.0187545 0.010232 0.0243939 0.0179363
*** NS *** **11.30311 17.29657 1.600843 5.25425
** *** NS NS65.96151 3.010619 -7525946 -178.4798 16.91633 -34.95894 -109.1719 -175.8206
** NS *** *** NS NS *** ***
97 124 101 129
--
N 195 180 200 185
0.41 0.53
-- -- -- --
-- -- -- --
0.55 0.64 0.42R-Squared adj 0.36 0.49 0.24
--
Ln LANDGINI
Constant
-- -- --
Food price index -- -- --
Log of TFP
--
Log gini
Log of agricultural output/ labourLog of rural population %
Food production p.c. index -- -- --

26
that interventions in the distribution of land is still an important policy variable to consider when the objective is the reduction of poverty, especially in unequal asset distributional rural settings. Therefore this intervention is valid both on growth and equity grounds. As far as the food production index is concerned we find that it is significant in two cases in which it carries a negative sign. Therefore as a qualifier to the focus on agricultural growth itself, our results suggest that growth in agriculture would be better for poverty reduction if food production per capita also grows or does not decline. The food price index has a positive sign in three instances suggesting that increased food prices do mean more poverty. Thus capping food price inflation may be important.
In light of the above it can be argued that increases in agricultural labour productivity, may have a more significant direct effect on poverty reduction than increases in TFP. This is because TFP is much more broadly based than partial measures such as labour productivity. It needs to be noted as a cautionary note however that some sources of increases in labour productivity, like capital intensive (labour-saving) technology such as tractors, may increase output and labour productivity, but could in some circumstances also be employment reducing. Without social safety nets and growth in other sectors, employment reduction in agriculture can still have serious implications for poverty. One needs to recognize the obvious proviso that output growth is unlikely to be sustainable unless it is also underpinned by technological change as well as sustaining mechanisms in growth in non agrarian sectors. If this is not the case agricultural labour productivity might not rise fast enough or may even stagnate and is unlikely to make a significant dent on poverty. The point however is that within an over growth context there is a case for agriculture to be placed as the leading poverty reducing sector.
14. Conclusions
While poverty has been declining in the world its rate of decline has slowed down and there is a large imbalance in global poverty trends particularly emerging in Sub Saharan Africa, which is likely to jeopardize Millennium poverty goals. While the global output of agriculture has been reasonable in the past three decades, agricultural output growth on a per capita basis has been modest. Agricultural growth however is critical for poverty reduction both in an absolute as well as a relative sense in comparison to other sectors. This is largely because poverty has a very significant rural dimension. This means that to attack poverty head on we must have an explicit agricultural growth strategy in place. We also find that that this focus on agricultural growth itself needs to be driven at least in some measure by labour productivity – as opposed to being driven only by technical and efficiency change – in order to produce better poverty reduction results. This “balanced” productivity enhancing agricultural growth, it is suggested, would have further beneficial effects on poverty reduction if food crop production per capita were enhanced and food prices kept within some control simultaneously. While a more equal income distribution is generally supposed to be better for poverty reduction, in particular we find better ownership distributions of land in agriculture will facilitate both output growth and accelerate poverty reduction further. This constitutes the broad case for reinstating the role of agriculture in the internal development strategies of developing countries for poverty reduction. Clearly a better external environment with respect to both market access as well as commodity price regulation will make the case much stronger.

27
Annex: List of Variables used in Regressions.
Variable Code Data source Notes
The ratio of irrigated land to arable land
IRRIGATED AGROSTAT database of the Food and Agriculture Organization, Rome
The air distance from a country’s capital city to the nearest core city (Amsterdam, New York or Tokyo)
DISTANCE ArcWorld Supplement Database. All geographical data is available at the Harvard University Centre for International Development website
Proportion of land in tropics
TROPLAND CEPA data base
The change in malaria incidence from 1965 to 1994
MALARIA GIS population database, ArcWorld Supplement Database. All data is available at the Harvard University Centre for International Development website
War intensity WAR POLICON III Database. “A two+one level assessment of the number of battle-related casualties per year in the conflict period covered by the observation, plus a special level indicating conflict history in low-intensity conflicts.” Strand, Wilhelmsen and Gleditsch (2003
The degree of democracy less the degree of autocracy
POLITY POLITY IV Project: Political Regime Characteristics and Transitions, 1800-1999 Marshall and Jaggers (2003)
“Institutionalized Democracy: democracy is conceived as three essential, interdependent elements: the institutionalization of choice, constraints on the executive and civil liberties (Marshall and Jaggers, 2003)
Institutional quality ICRG3 PRS Group’s IRIS III data set (see Knack and Keefer 1995)
Revised version of variable. Computed as the average of the three components still reported after 1997
South Asia POP World Bank 2003 Dummy for countries in South Asia
Sub-Saharan Africa SSA World Bank 2003 Codes nations in the southern Sahara as sub-Saharan
East Asia EASIA World Bank 2003 Dummy for Countries in East Asia, including Papua New Guinea
Population POP World Bank 2003 Natural logarithm Exports plus imports over GDP (%)
TRADE World Bank 2003
The proportion of the population living in rural areas
RURAL World Bank 2003
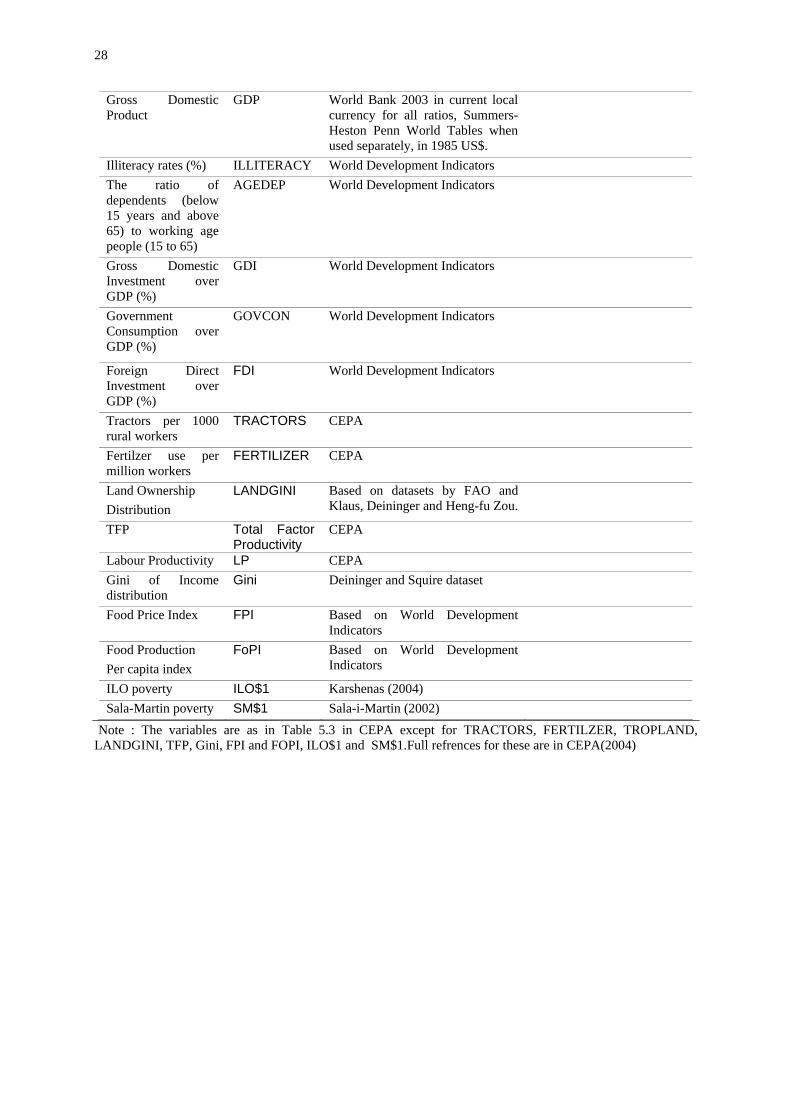
28
Gross Domestic Product
GDP World Bank 2003 in current local currency for all ratios, Summers-Heston Penn World Tables when used separately, in 1985 US$.
Illiteracy rates (%) ILLITERACY World Development Indicators The ratio of dependents (below 15 years and above 65) to working age people (15 to 65)
AGEDEP World Development Indicators
Gross Domestic Investment over GDP (%)
GDI World Development Indicators
Government Consumption over GDP (%)
GOVCON World Development Indicators
Foreign Direct Investment over GDP (%)
FDI World Development Indicators
Tractors per 1000 rural workers
TRACTORS CEPA
Fertilzer use per million workers
FERTILIZER CEPA
Land Ownership Distribution
LANDGINI Based on datasets by FAO and Klaus, Deininger and Heng-fu Zou.
TFP Total Factor Productivity
CEPA
Labour Productivity LP CEPA Gini of Income distribution
Gini Deininger and Squire dataset
Food Price Index FPI Based on World Development Indicators
Food Production Per capita index
FoPI Based on World Development Indicators
ILO poverty ILO$1 Karshenas (2004) Sala-Martin poverty SM$1 Sala-i-Martin (2002)
Note : The variables are as in Table 5.3 in CEPA except for TRACTORS, FERTILZER, TROPLAND, LANDGINI, TFP, Gini, FPI and FOPI, ILO$1 and SM$1.Full refrences for these are in CEPA(2004)

29
Bibliography
Ahluwalia, M. S. 1976. "Inequality, poverty and development." Journal of Development Economics 3:307-342.
–– 1978. "Rural poverty and agricultural performance in India." Journal of Development Studies 14: 298-323.
–– 1985. "Rural poverty, agricultural production and prices: a re-examination." in Mellor, J. W. and G. Desai, 1986. Agricultural change and rural poverty. Oxford University Press, New Delhi.
Bardhan, P. 1999. Democracy and Development: A Complex Relationship, University of California at Berkeley.
Block, S. and C. P. Timmer. 1994. Agriculture and Economic Growth: Conceptual Issues and the Kenyan Experience, mimeo, Harvard Institute for International Development, Cambridge, MA.
CEPA. 2004. Agricultural productivity growth, Employment and Poverty in developing Countries 1970-2000, Centre for Efficiency and Productivity Analysis, School of economics, University of Queensland
Chen, S. and M. Ravallion. 2001. "How did the world's poorest fare in the 1990s?", Review of Income and Wealth, Vol 43 (3), pp. 283-300.
Chen, S., G. Datt, and M. Ravallion. 1993. Is Poverty Increasing in the Developing World? The World Bank, Washington, DC.
Chuta, E. and C. Liedholm. 1981. Rural Non-Farm employment: a review of the State of the Art. East Lansing: Michigan State University.
Collier, P. 2003. “Primary Commodity Dependence and Africa's Future”, in The New Reform Agenda , edited by B. Pleskovic and N. Stern , ABCDE, The World Bank , Oxford University Press.
Craig, B.J., Pardey, P.G. and Roseboom, J. (1997), "International productivity patterns: accounting for input quality, infrastructure, and research", American Journal of Agricultural Economics, 79, 1064-77.
Deaton, A. 2004. "Measuring Poverty in a Growing World" (or "Measuring Growth in a Poor World"), NBER Working Paper: 9822.
–– 2003. "How to Monitor Poverty for the Millennium Development Goals", Journal of Human Development, Vol. 4 (3), pp. 353-378
–– 2002. "Is World Poverty Falling", Finance and Development: A Quarterly Magazine of the IMF, Vol. 39 (2).
–– 2001. "Counting the World's Poor: Problems and Possible Solutions", The World Bank Research Observer, Vol. 16, No. 2, pp. 125-148.
Deininger, K. and L. Squire. 1996. "A New Data Set Measuring Income Inequality", World Bank Economic Review 10 (3).
Deininger, K., L. Squire and T. Zhang. 1995. "A New Data Base on International Income Distribution." mimeo. Policy Research Department, World Bank.
Dollar, D. and A. Kraay. 2002. Growth is good for the poor, Working Paper No. 2587, World Bank, Washington DC.
Eswaran, M and A. Kotwal. 2002. The role of agriculture in development, mimeo. University of British Columbia.

30
Hayami, Y. 2002. "Induced Innovation and Agricultural Development in East Asia," in A. Mason, ed., Population Change and Economic Development in East Asia, Stanford: Stanford University Press, 2002, pp. 96-120.
Hayami Y. and V. Ruttan. 1985. Agricultural Development: An International Perspective, Johns Hopkins University Press, Baltimore, Md. (1971 and 1985).
Hayami, Y. and V. Ruttan, 1970. "Agricultural Productivity Differences Among Countries", American Economic Review, 40, 895-911.
Hongyi L., L. Squire & H. Zou. 1998. “Explaining International and Intertemporal Variations in Income Inequality”, The Economic Journal, Vol. 108, Issue 446.
Huppi, M. and M. Ravallion. 1991. "The Sectoral Structure of Poverty During an Adjustment Period: Evidence for Indonesia in the Mid-1980s." World Development,Vol. 19(12) 1653-1678.
Hussain, A., N. Stern and J. Stiglitz. 1999. “Chinese reforms from a comparative perspective”, in Incentives, organization and public economics, Papers in Honour of Sir James Mirrlees; Hamond and Myles (eds.), Oxford University Press, New York.
IFAD. 2001. The Challenge of Ending Rural Poverty, Rural Poverty Report 2001
Johnston, B. F. and J. W. Mellor. 1961. "The Role of Agriculture in Economic Development." American Economic Review 51, no. 4: 566-93.
Karshenas, M. 2004. Global poverty estimates and the millennium goals: Towards a unified framework, Employment Strategy Paper No. 2004/5, ILO, Geneva.
–– 2003. Global poverty: National accounts-based versus survey-based estimates, Employment Paper No. 2003/49, ILO, Geneva.
Lanjouw, J.O, and P. Lanjouw. 1995. Rural non-farm employment- A survey. Policy Research Working Paper No. 1463 (background paper for the World Development Report, 1995).
Lewis, W. A. 1954. "Economic Development with Unlimited Supplies of Labor." Manchester School 139-191.
Li, H., Squire, L. and Zou, H. 1998. “Explaining International and Intertemporal Variations in Income Inequality”, The Economic Journal Vol. 108 (446).
Lipton, M. 1977. Why Poor People Stay Poor: Urban Bias in World Development. Temple Smith, London and Harvard University Press (1977; 2nd ed., Avebury, 1988).
–– 1993. Urban bias: of consequences, classes and causality. Journal of Development Studies, 29.
–– 1998. Successes in Anti-poverty. International Institute of Labour Studies (for ILO). New edition, 2001
–– 2001. 2015 Poverty targets. What do 1990-98 trends tell us? Poverty Research Unit , University of Sussex. Notes No .3
–– and H. Waddington. 2004. “Halving world poverty”, in Targeting development: critical perspectives on the millennium development goals (R. Black and H. White, eds.) Routledge Studies in Development Economics.
Lundberg, M. and L. Squire. 1999. The Simultaneous Evolution of Growth and Inequality, Manuscript, The World Bank, Washingon DC.
Maddison, A. (1995), Monitoring the World Economy: 1820-1992, OECD, Paris.
Maddison, A. (1997), Chinese Economic Performance in the Long Run, OECD, Paris.

31
Majid, N. 2003. Globalization and poverty, Employment Paper 2003/54, ILO, Geneva.
Majid, N. 2004. What is the effect of open trade regimes on wages and poverty? ILO Mimeo.
Mellor, J.W. 1999. Impact Assessment of Agricultural Policy Reform on Employment and Productivity. Abt Associates Inc., Bethesda, MD.
–– 2000. Faster more equitable growth, CAER Discussion Paper No 70.
OXFAM. 2002. Rigged Rules and Double Standards: Trade Globalisation and the Fight Against Poverty.
Ravallion, M. 1995. “Growth and poverty: Evidence from developing countries in the 1980s”. Economic Letters 48: 411-417.
–– 1996. Issues in Measuring and Modeling Poverty. The World Bank, Washington, DC.
–– 2000. "Should Poverty Measures be Anchored to the National Accounts?" Economic and Political Weekly, Vol. 34 (35&36), August 26, pp. 3245-3252.
–– 2001. “Growth inequality and poverty : looking beyond averages”. World Development, Vol. 29 No 11.
Sahn, D. and Stifel, D. 2003. “Progress toward the millennium development goals in Africa”, in World Development, Vol. 31(1). pp .23-52.
Saith, A. 1992. The rural non-farm economy: Processes and policies, World Employment Programme, ILO, Geneva.
Sala-i-Marin, X. 2002. The world distribution of income, No.8933, NBER Working Papers.
Thirtle, C., L. Lin and J. Piesse. 2002. 'The Impact of research Led Agricultural Productivity Growth on Poverty Reduction in Africa and Latin America', Research paper 016, King's College, Management Research Centre, University of London.
Timmer, C. P. 1997. How Well do the Poor Connect to the Growth Process. Discussion Paper No. 178. Harvard Institute for International Development (HIID), Cambridge, MA.
White, H. and A. Anderson. 2000. "Growth vs. distribution: does the pattern of growth matter?" in White Paper on Eliminating World Poverty: Making Globalization Work for the Poor, Department for International Development (DFID), London.
World Bank. 2001. Globalization, Growth and Poverty. Oxford University Press.
–– 2001. World Development Report 2001.
–– 2002. World Development Indicators 2002, World Bank, Washington DC.

32
33
EMPLOYMENT STRATEGY PAPERS
2004/1
Macroeconomic reforms and a labour policy framework for India, by Jayati Ghosh
2004/2 Macroeconomic reforms, labour markets and labour policies: Chile, 1973-2000, by Guillermo Campero
2004/3
Employment and labour market effects of globalization: Selected issues for policy management, by Haroon Bhorat and Paul Lundall
2004/4 Successful employment and labour market policies in Europe and Asia and the Pacific, by Claire Harasty (ed.)
2004/5 Global poverty estimates and the millennium goals: Towards a unified framework, by Massoud Karshenas
2004/6 The labour market effects of US FDI in developing countries, by Robert E. Lipsey
2004/7 Industrial relations, social dialogue and employment in Argentina, Brazil and Mexico, by Adaberto Cardoso
2004/8 Global employment trends for women, 2004, by Sara Elder and Dorothea Schmidt
2004/9 Active labour market policies around the world: Coping with the consequences of globalization, by Peter Auer, Ümit Efendioglu and Janine Leschke
2004/10 Efectos de la apertura comercial en el empleo y el mercado laboral de México y sus diferencias con Argentina y Brasil (1990-2003), by Enrique Dussel Peters
2004/11 Capital inflows and investment in developing countries, by Ajit K. Ghose
2004/12 Reaching Millennium Goals: How well does agricultural productivity growth reduce poverty?, by Nomaan Majid
2004/13 Labour market policies and regulations in Argentina, Brazil and Mexico: Programmes and impacts
2004/14 Estimating growth requirements for reducing working poverty: Can the world halve working poverty by 2015?, by Steven Kapsos