Embed Size (px)
Citation preview

SKYCITY Entertainment Group Limited Federal House 86 Federal Street PO Box 6443 Wellesley Street Auckland New Zealand
Telephone +64 (0)9 363 6141 Facsimile +64 (0)9 363 6140 www.skycitygroup.co.nz
14 March 2012 Company Announcements Office Australian Stock Exchange Exchange Centre 20 Bridge Street Sydney NSW 2000 AUSTRALIA Dear Sir/Madam RE: SKYCITY ENTERTAINMENT GROUP LIMITED – INTERIM REPORT Please find attached SKYCITY Entertainment Group Limited’s Interim Report for the six month period ended 31 December 2011.
The Interim Report will also be available later today on the company’s website, www.skycityentertainmentgroup.com, in the Investor Centre section.
Yours faithfully Peter Treacy Company Secretary

SKYCITY ENTERTAINMENT GROUP LIMITED
INTERIM REPORT 2012
IR

$78.8 millionHIGHLIGHTS
1H12 1H11 Movement Movement $’��� $’��� $’��� %
Reported Group Revenues (1) 494.0 447.7 46.3 10.3
Reported EBITDA 168.2 150.9 17.3 11.5
Reported NPAT 78.8 67.1 11.7 17.4
(1) On pages 1 to 6, revenues refer to gaming win (GST inclusive to facilitate Australasian comparisons) plus non-gaming revenues.
KEY FINANCIAL RESULTS
pg 1
Rugby WORld CuP 2011 Was a ONE-Off bOOsT TO REvENuE Of $11.5M, EbITda Of $6.5M aNd NPaT Of $4.7M.
CEO’s REPORT 3
FINANCIAL sTATEMENTs 7
DIRECTORy 25
uP 10.3% ON fIRsT half lasT yEaR
$m494.0auCklaNd REvENuEs
uP 14.4% ON 1h11
$m268.9
CONTENTS
REvENuEs(1)
uP ON fIRsT half lasT yEaR
11.5%EbITda
up 17.4% on first Half last year
REpORTEd net profit after tax of
RECORd first Half financial results

$78.8 million
1H12 1H11 Movement Movement $’��� $’��� $’��� %
Normalised Group Revenues (1) 489.0 447.1 41.9 9.4
Normalised EBITDA 165.5 151.4 14.1 9.3
Normalised NPAT 77.0 67.4 9.6 14.2
(1) On pages 1 to 6, revenues refer to gaming win (GST inclusive to facilitate Australasian comparisons) plus non-gaming revenues.
KEY FINANCIAL RESULTS
pg 2
A copy of the FY12 interim result presentation can be found in the investor centre on our company website; www.skycityentertainmentgroup.com
sTRONg balaNCE shEET WITh $585M COMMITTEd uNdRaWN faCIlITIEs, INCludINg NEW aTTRaCTIvEly PRICEd 7-yEaR $185M baNk faCIlITy WhICh WIll bE PaRTly usEd TO REPay ThE $256M usPP duE IN MaRCh 2012.
uP fROM 11.7CPs ON fIRsT half lasT yEaR
EaRNINgs PER shaRE
13.7 cents per sHare
INTERIM dIvIdENd Of
uP 1.0CPs fROM fy11 INTERIM dIvIdENd
9.0 cents per sHare
NET dEbT EbITda Of
2.0:1

pg 3
dEaR ShaREhOldER,I’m pleased to report that the momentum which commenced in January 2011 has continued through the first half of the 2012 Financial Year and this calendar year also, creating a solid platform for a strong financial year.
CHIEF EXECUTIVE’S REVIEw
pg 3
ECORd FIRsT hALF FINANCIAL REsuLTs

pg 4
NIgEl MORRIsON / MaNagINg dIRECTOR aNd ChIEf EXECuTIvE OffICER
CHIEF EXECUTIVE’S REVIEw
RECENT hIGhLIGhTs
• Grouprevenues$494m,up$46.3m(+10.3%)withflagshipAucklandrevenues$268.9m,up$33.8m(+14.4%).
• $50mcapitalinvestmentinAucklandshowingstrongreturnsoninvestedcapitaland together with the Rugby World Cup, drovearecordfirsthalfresultwithReportedNPATof$78.8m,up$11.7m,(+17%).
• PositivenegotiationscontinuewiththeNewZealandGovernmentontheNationalConventionCentre.
• ContinuingdiscussionswiththeSouthAustraliaGovernmentonAdelaidere‑developmentandexpansion.
• Astrongbalancesheet,enhancedbynewattractivelypriced7‑Year$185mbankfunding.
• Gearing(netdebt:EBITDA)remainsstronglyinvestmentgradeat2.0times,with$585mundrawncommittedfacilities.
• EarningsperShareof13.7cpsup2cps(+17%).
• Interimdividendof9.0centspershare,up1.0cent(+12.5%)on1H11.
The2012FinancialYearhadapleasingstartforSKYCITYwiththefirstsixmonths’revenuesup$46.3million(+10.3%)overlastyearand
up$41.9m(+9.4%)onanormalisedbasis.WehavedeliveredarecordfirsthalfNetProfitafterTaxof$78.8mup$11.7m(+17.4%)and$77.0mup$9.6m(+14.2%)onanormalisedbasis.
StrongrevenuegrowthhasledtoGroupEBITDAincreasingto$168.2mup$17.3m(+11.5%)overlastyearandto$165.5mup$14.1m(+9.3%)onanormalisedbasis.
NEw ZEALAND
While not as significant as we originally envisaged,theRugbyWorldCup2011hostedin New Zealand in September and October, providedaninfluxofpeopleacrossourpropertiesinbothAucklandandHamilton,whichweestimatedeliveredaround$11.5minrevenuesand$6.5minEBITDA.However,our strong start to the financial year is mainly duetosolidfundamentalsinourcoreAucklandgamingbusinesses.Thisisattributabletotherecent$50millionrevitalisationoftheAucklandproperty,continuedimprovementsingamingmachinesrevenuesandgrowthinourInternationalBusinessfollowingtheopeningofourHorizonsuitesandsalonsinJuly2011.
AuCkLAND
SKYCITY’ssolidresultshavebeendrivenprimarilyoutoftheAucklandCapExprogramme.Thetransformational$50million

pg 5
CHIEF EXECUTIVE’S REVIEw
continued
revitalisationoftheAucklandpropertywascompleted part way through this first half year and has contributed significantly to the momentuminSKYCITY’sAucklandresults.
ThenewHorizonsuitesandprivategamingsalons are attracting new international players, notpreviouslyvisitingSKYCITYAuckland.FirsthalfInternationalBusinessturnoverinAucklandwasup26%againstlastyearandup195%againstthesameperiodinFY10,withturnoverexceeding$1.4billionto31December2011.TheChineseNewYearperiod in January and early February 2012 has continued to demonstrate growth, with internationalturnoverinAucklandupover50%ontheprioryear.
Our refurbished VIP ‘Platinum’ room and the successfulopeningofthenew‘Diamond’privategamingroomresultedinincreasedmarketshareforSKYCITYAuckland’sgamingmachines,whichwereup16.7%onprioryearrevenue.
ThedevelopmentofourthreenewsignaturerestaurantsandbarsinFederalStreet(DepotbyAlBrown,TheGrillbySeanConnollyandRedHummingbirdbyLukeDallow)has been a resounding success and introduced newcustomerstotheSKYCITYprecinct.IthasreaffirmedSKYCITY’spositioningasAuckland’sleadingentertainmentdestination.ThenewFortunaBuffetisservingrecordnumbersofgamingcustomerswhileTheNation’sClubroomshasprovidedafocalpointforourmajorsponsorships,TheWarriors,TheSKYCITYBreakersandTheBlues.
NormalisedrevenuesatourflagshipAucklandproperty,includingAuckland’sshareofInternationalBusinessrevenue,were$268.9million,up$33.8million(+14.4%)from$235.1million.Non‑gamingrevenuesfromtheSKYCITYGrandandSKYCITYHotel,alongwithourbars,restaurantsandotherfacilitieswereup$13million(+23%),withthismainly due to the Rugby World Cup finals
period in October and the opening of the new FederalStreetoutlets.Asmentionedpreviously,the impact of the Rugby World Cup was less significantthanexpected,butstilldeliveredapproximately$10.7mrevenueand$6mEBITDAtoourAucklandproperty.
Since the re-election of the National GovernmentinNovember2011,discussionswithGovernmenthavebeenprogressingproactivelyandweremainfocuseduponsuccessfully negotiating an outcome which wouldseeSKYCITYinvesting$350milliontodeliveraniconicConventionCentreforNewZealand.Inreturn,weareseekinganearlyrenewaloftheAucklandcasinolicencebeyond2021, an increase in gaming product to meet demandandprovideforfuturegrowthandchanges to gaming regulations which would increasetheefficiencyandattractivenessoftheofferingweareabletoprovideourcustomers.Shareholders should remain assured that unless weareconfidentofachievingacceptablereturnson capital, the project will not proceed.
hAMILTON
OurHamiltonpropertycontinuestoperformwell,withrevenuesof$26.5millionup$3.2million(+13.7%)onthepreviousperiod.Ofthis,weestimaterevenueofapproximately$0.8millionisduetoRugbyWorldCupvisitorswho were present during the early stages of thetournament.ExcludingtheRugbyWorldCup,underlyingrevenuegrowthremainsstrongataround10%comparedtothesameperiodlast year.
Theadditionofa4+starhotelwith135roomsaboveourHamiltonpropertyisstillbeingconsidered.WecontinuetobelievethisdevelopmentwouldbringmuchneededqualityhotelaccommodationtocentralHamiltonandsignificantlyimprovethefacilitiesthatweareabletooffertoourcustomersinamarketwhich continues to demonstrate growth.

pg 6
CHIEF EXECUTIVE’S REVIEw
continued
ADELAIDE Adelaidehascontinueditsstrongmomentumwithrevenueup6.9%andEBITDAup12.9%.Strongvolumegrowthinlocaltablegamesincreasedrevenuebymorethan8%yearonyearandgamingmachinesdeliverednearly9%revenuegrowth.
InOctober,theSouthAustralianStateGovernmentreleaseditsMasterPlanfortheredevelopmentoftheRiverbankPrecinct.TheGovernment’sMasterPlanpotentiallyprovidesforasignificantexpansionandredevelopmentoftheAdelaideCasinowhichwouldallowSKYCITYtocreateatrulyworldclass integrated entertainment facility, featuring aboutique5starhotel,expandedgamingfacilities, including International and VIP gaming suites and salons, signature restaurants and bars, a spa and roof top pool lounge.
SinceDecember,wehavebeenworkingcloselywiththeSouthAustralianCasinoTaskForceregardingthefutureregulatoryframeworkfortheAdelaideCasino.Theoutcomeofthesediscussions will allow us to determine whether to proceed or not with progressing our plans forthetransformationoftheAdelaideCasino.
Whileweareexcitedabouttheoutstandinggrowth opportunity this transformational projectpotentiallyrepresentsforSKYCITY,shareholders should be assured that this project will only proceed if we can be confident ofachievinganacceptablereturnonthepotentialinvestment.
DARwIN OurDarwinpropertyhasexperiencedsomechallenging times following the introduction of thesmokingbanin2010,thebanonlivecattleexports,asofttourismmarketandthehighAustraliandollarencouraginglocalstotravelabroad.However,ourgamingrevenuesarenowreturning to growth and local table games in particularhadastrongfirsthalf,withrevenue
growthup11.9%onlastyear.Afterseveralperiodsofdecline,EBITDAhasnowalsoreturned to modest growth.
OurLagoonResortisonbudgetandscheduledtoopeninJulythisyear.TheLagoonResort,now including a number of International VIP Villasandgamingpavilions,willprovideourDarwinpropertywiththeopportunitytocompeteintheInternationalVIPmarket.Thistogether with the recently announced business classflightsdirectfromSingapore,Darwin’sproximitytoAsiaandtherecentlyannounced$32billionInpexIchthysLNGproject,givesusconfidencethatourDarwinpropertyhasaverybright future.
Furthermore,wearepleasedtoadvisethattheSKYCITYDarwincasinolicencehasbeensuccessfullyextendedforafurtherfiveyearsto30June2031.
OuTLOOk FOR 2012Giventhestrongfirsthalfresults,thecontinuedmomentumwehaveexperiencedinJanuaryand February, including a strong Chinese New Year,theincreasingdemandforourHorizonsuitesandsalonsandthesuccessofourCapExprogrammeinAuckland,weexpectNormalisedNetProfitafterTaxforthefullyeartobeatthetopendofourpreviousguidancerange–inthehigh$140millions,upfrom$130.9mlastyear.
Finally,Iwouldliketothankmyexecutivemanagement team for their commitment and hardwork,theChairmanRodMcGeochandtheBoardforitsguidanceandsupportandallSKYCITYmanagementandstafffortheirdedication and contribution to this result.
Yours sincerely
NIgEl MORRIsON / ChIEf EXECuTIvE OffICER aNd MaNagINg dIRECTOR. 14 MaRCh 2012

pg 7
FINANCIAL STATEMENTS
For the six month period ended 31 december 2011
TRONg BALANCE shEET
Ourstrongbalancesheetincludes$585mcommittedundrawnfacilitiesincludingnewattractivelypricedseven‑year$185mbankfacilitywhichwillbepartlyusedtorepaythe$256mUSPPdueinMarch2012.

pg 8
inDepenDent accountants’ report
to the shareholders of sKycity entertainment Group limited
report on the interim financial statementsWehavereviewedtheinterimcondensedfinancialstatements(“financialstatements”)ofSKYCITYEntertainmentGroupLimited(“theGroup”)onpages9to24,whichcomprisethebalancesheetsasat31December2011,theincomestatements,statementsofcomprehensiveincome,statementsofchangesinequityandstatementsofcashflowsfortheperiodthenended,andthenotestothefinancialstatementsthatincludeasummaryofsignificantaccountingpoliciesandotherexplanatoryinformation.
Directors’ responsibility for the interim financial statementsTheCompany’sDirectorsareresponsibleforthepreparationandpresentationofthefinancialstatementsthatpresentfairlythefinancialpositionoftheGroupasat31December2011anditsfinancial performance and cash flows for the period ended on that date.
accountants’ responsibilityWeareresponsibleforreviewingthefinancialstatementspresentedbytheDirectorsinordertoreport to you whether, in our opinion and on the basis of the procedures performed by us, anything has come to our attention that would indicate that the financial statements do not present fairly the matters to which they relate.
Areviewislimitedprimarilytoenquiriesofcompanypersonnelandanalyticalreviewproceduresappliedtofinancialdataandthusprovideslessassurancethananaudit.Wehavenotperformedanauditonthefinancialstatementsand,accordingly,wedonotexpressanauditopinion.
WehavereviewedthefinancialstatementsoftheGroupfortheperiodended31December2011inaccordancewiththeReviewEngagementStandardsissuedbytheNewZealandInstituteofCharteredAccountants.
Wehavenorelationshipwith,orinterestin,SKYCITYEntertainmentGroupLimitedotherthaninourcapacitiesasaccountantsconductingthisreview,auditors,taxandaccountingadvisors.ThesemattershavenotimpairedourindependenceasaccountantsoftheGroup.
opinionBasedonourreview,nothinghascometoourattentionthatcausesustobelievethatthefinancialstatementswhichhavebeenpreparedinaccordancewithInternationalAccountingStandard34andNewZealandEquivalenttoInternationalAccountingStandard34:InterimFinancialReportingdonotpresentfairlythefinancialpositionoftheGroupasat31December2011anditsfinancialperformance and cash flows for the period ended on that date.
restriction on Distribution or useThisreportismadesolelytotheCompany’sshareholders,asabody.OurreviewworkhasbeenundertakensothatwemightstatetotheCompany’sshareholdersthosematterswhichwearerequiredtostatetotheminanaccountants’reportandfornootherpurpose.Tothefullestextentpermitted by law, we do not accept or assume responsibility to anyone other than the Company and theCompany’sshareholdersasabody,forourreviewprocedures,forthisreportorfortheopinionswehaveformed.
CharteredAccountants Auckland15February2012

FINANCIAL STATEMENTS
pg 9
CONSOlIdaTEd incoMe stateMents
uNaudITEd unauDiteD auDiteD 6 MONThS 6 MontHs 12 MontHs 31 dECEMBER 31 DeceMBer 30 June 2�11 2010 2011 for tHe six MontH perioD enDeD 31 DeceMBer 2011 notes $’��� $’000 $’000
Total receipts including GsT 3 505,223 455,614 902,381Less non-gaming GsT 3 (14,512) (11,526) (22,562)
Gaming win plus non-gaming revenue 3 490,711 444,088 879,819Less gaming GsT 3 (42,721) (37,111) (76,674)
Total revenue 3 447,990 406,977 803,145
Revenue 3 447,990 406,977 803,145Other income 4 873 448 1,261share of net profit of associate 2,419 3,222 5,976Employee benefits expense (139,316) (130,076) (260,676)Other expenses 5 (53,099) (49,785) (92,623)Direct consumables (31,377) (24,950) (52,607)Gaming taxes and levies (32,337) (30,562) (61,275)Marketing and communications (25,587) (23,398) (44,886)Directors’ fees (535) (350) (741)Depreciation and amortisation expense 5 (36,236) (34,521) (69,710)Restructuring costs (800) (648) (3,298)Impairment of Christchurch Casino – – (15,000)Finance costs – net 6 (25,498) (23,180) (43,772)
profit before income tax 106,497 93,177 165,794Tax expense pre Government Budget changes (27,582) (26,025) (48,226)
profit before tax expense relating to Government Budget changes 78,915 67,152 117,568Tax expense relating to Government Budget changes – – 5,435
profit for the year 78,915 67,152 123,003
income tax expense (27,582) (23,180) (42,791)Attributable to:shareholders of sKycity entertainment Group limited 78,826 67,126 122,960Profit attributable to non-controlling interest 89 26 43
78,915 67,152 123,003
CENTS cents cents
earnings per share for profit attributable to the shareholders of the companyBasic earnings per share (cents) 13.7 11.7 21.4Diluted earnings per share (cents) 13.5 10.7 20.9
The above consolidated income statements should be read in conjunction with the accompanying notes.

FINANCIAL STATEMENTS
pg 10
uNaudITEd unauDiteD auDiteD 6 MONThS 6 MontHs 12 MontHs 31 dECEMBER 31 DeceMBer 30 June 2�11 2010 2011 for tHe six MontH perioD enDeD 31 DeceMBer 2011 $’��� $’000 $’000
profit for the period 78,915 67,152 123,003other comprehensive incomeMovement in cash flow hedges (1,111) (2,997) (13,733)Exchange differences on translation of overseas subsidiaries 6,898 18,235 5,397Income tax relating to components of other comprehensive income 243 1,060 4,133
other comprehensive income/(expenses) for the period, net of tax 6,030 16,298 (4,203)
total comprehensive income for the period 84,945 83,450 118,800
Total comprehensive income for the period is attributable to:shareholders of the company 84,856 83,424 118,757Non-controlling interest 89 26 43
84,945 83,450 118,800
The above consolidated statements of comprehensive income should be read in conjunction with the accompanying notes.
STaTEMENT of coMpreHensiVe incoMe

FINANCIAL STATEMENTS
pg 11
uNaudITEd unauDiteD auDiteD 31 dECEMBER 31 DeceMBer 30 June 2�11 2010 2011 as at 31 DeceMBer 2011 notes $’��� $’000 $’000
assets
current assetsCash and bank balances 104,010 76,423 104,577Receivables and prepayments 23,221 27,127 30,901Inventories 7,975 8,592 6,970Tax prepayment 36,428 9,872 36,637Derivative financial instruments 2,626 335 272
Total current assets 174,260 122,349 179,357
non‑current assetsTax prepayment 14,580 30,491 27,789Property, plant and equipment 1,031,554 971,325 991,331Intangible assets 419,125 422,974 410,412Investment in associate 75,210 86,028 73,782Derivative financial instruments 21,700 2,667 –
Total non-current assets 1,562,169 1,513,485 1,503,314
total assets 1,736,429 1,635,834 1,682,671
liaBilities
current liabilitiesPayables 98,714 99,184 110,852Current tax liabilities 9,430 9,846 5,349Derivative financial instruments 1,013 – 10,102Interest bearing liabilities 8 256,073 163,000 247,267
Total current liabilities 365,230 272,030 373,570
non‑current liabilitiesInterest bearing liabilities 8,9 370,817 401,504 350,202subordinated debt – capital notes 56,405 56,393 56,400Deferred tax liabilities 92,378 95,363 94,290Derivative financial instruments 39,968 24,126 33,393
Total non-current liabilities 559,568 577,386 534,285
total liabilities 924,798 849,416 907,855
net assets 811,631 786,418 774,816
eQuity
share capital 10 726,565 729,559 728,616Reserves 11(a) 9,712 24,183 3,682Retained profits 11(b) 73,897 31,325 41,150
Parent entity interest 810,174 785,067 773,448
Non-controlling interest 1,457 1,351 1,368
total equity 811,631 786,418 774,816
The above consolidated balance sheets should be read in conjunction with the accompanying notes.
CONSOlIdaTEd Balance sHeets

FINANCIAL STATEMENTS
pg 12
foreiGn currency sHare HeDGinG translation retaineD Minority total capital reserVes reserVe profits interest eQuity for tHe six MontH perioD enDeD 31 DeceMBer 2011 $’000 $’000 $’000 $’000 $’000 $’000
Balance as at 1 July 2011 728,616 (12,340) 16,022 41,150 1,368 774,816
total comprehensive income/(expense) – (868) 6,898 78,826 89 84,945shares issued under dividend
reinvestment plan 4,736 – – – – 4,736Dividends – – – (46,079) – (46,079)share rights issued for employee services 705 – – – – 705Net purchase of treasury shares (7,492) – – – – (7,492)
Balance as at 31 December 2011 726,565 (13,208) 22,920 73,897 1,457 811,631
Balance as at 1 July 2010 732,910 (2,740) 10,625 17,397 1,325 759,517
total comprehensive income/(expense) – (1,937) 18,235 67,126 26 83,450Dividends – – – (53,198) – (53,198)share rights issued for employee services 459 – – – – 459Net purchase of treasury shares (3,810) – – – – (3,810)
Balance as at 31 December 2010 729,559 (4,677) 28,860 31,325 1,351 786,418
Balance as at 1 July 2010 732,910 (2,740) 10,625 17,397 1,325 759,517
total comprehensive income/(expense) – (9,600) 5,397 122,960 43 118,800shares issued under dividend
reinvestment plan 6,101 – – – – 6,101Dividends – – – (99,207) – (99,207)share rights issued for employee services 1,047 – – – – 1,047Net purchase of treasury shares (11,442) – – – – (11,442)
Balance as at 30 June 2011 728,616 (12,340) 16,022 41,150 1,368 774,816
The above consolidated statements of changes in equity should be read in conjunction with the accompanying notes.
CONSOlIdaTEd stateMents of cHanGes in eQuity

FINANCIAL STATEMENTS
pg 13
STaTEMENTS Of casHflows
uNaudITEd unauDiteD auDiteD 6 MontHs 6 MontHs 12 MontHs 31 dECEMBER 31 DeceMBer 30 June 2�11 2010 2011 for tHe six MontH perioD enDeD 31 DeceMBer 2011 notes $’��� $’000 $’000
cash flows from operating activitiesReceipts from customers 455,510 405,078 795,231Payments to suppliers and employees (252,693) (238,014) (469,413)
202,817 167,064 325,818
Dividends received 996 747 747Interest received 90 104 192Gaming taxes paid (28,699) (26,484) (54,896)Income taxes paid (11,752) (19,169) (62,496)
net cash inflow/(outflow) from operating activities 17 163,452 122,262 209,365
cash flows from investing activitiesPurchase of/proceeds from property, plant and equipment (82,254) (31,848) (74,822)Payments for intangible assets (5,205) (3,783) (1,893)Loan repayment from Christchurch hotels Limited 160 127 194
net cash inflow/(outflow) from investing activities (87,299) (35,504) (76,521)
cash flows from financing activitiesNew borrowings – 163,000 401,799Cash flows associated with derivatives – – (20,884)Repayment of borrowings – (199,359) (362,359)Net purchase of treasury shares (7,492) (3,810) (11,442)Dividends paid to company’s shareholders (41,343) (53,198) (93,106)Interest paid (27,885) (19,474) (44,781)
net cash (outflows) from financing activities (76,720) (112,841) (130,773)
net (decrease)/increase in cash and cash equivalents (567) (26,083) 2,071Cash and bank balances at the beginning of the period 104,577 102,506 102,506
cash and cash equivalents at end of the half‑year 104,010 76,423 104,577
The above statements of cashflows should be read in conjunction with the accompanying notes.

FINANCIAL STATEMENTS
pg 14
1 gENERal INfORMaTION
skyCITy Entertainment Group Limited (skyCITy or the company and its subsidiaries or the Group) operates in the gaming/entertainment, hotel and convention, hospitality, recreation, and tourism sectors. The Group has operations in New Zealand and Australia.
skyCITy is a limited liability company incorporated and domiciled in New Zealand. The address of its registered office is Federal house, 86 Federal street, Auckland. The company is dual listed on the New Zealand and Australian stock exchanges.
skyCITy is a company registered under the Companies Act 1993 and is an issuer in terms of the securities Act 1978. These consolidated interim financial statements have been prepared in accordance with the requirements of the Financial Reporting Act 1993.
These consolidated financial statements have been approved for issue by the board of directors on 15 February 2012.
2 SuMMaRy Of SIgNIfICaNT aCCOuNTINg pOlICIES
These general purpose financial statements for the interim half year reporting period ended 31 December 2011 have been prepared in accordance with generally accepted accounting practice in New Zealand, International Accounting standard 34 and NZ IAs 34 Interim Financial Reporting.
The preparation of interim financial statements in accordance with NZ IAs 34 Interim Financial Reporting requires management to make judgements, estimates and assumptions that affect the application of policies and reported amounts of assets and liabilities, income and expenses. The estimates and associated assumptions are based on historical experience and various other factors that are believed to be reasonable under the circumstances, the results of which form the basis of making the judgements about carrying values of assets and liabilities that are not readily apparent from other sources. Actual results may differ from these estimates.
These financial statements have been prepared under the historical cost convention except for the revaluation of certain financial instruments (including derivative instruments). The Group is designated as a profit‑oriented entity for financial reporting purposes.
The Group has a negative working capital balance as a portion of the usPP debt is a current liability as at 31 December 2011. The Group has the ability to service and repay this debt. As detailed in note 9, the Group has significant committed long term bank facilities that are unutilised and available to repay the due debt.
The accounting policies that materially affect the measurement of the Income statements, Balance sheets and the statements of Cash Flows have been applied on a basis consistent with those used in the audited financial statements for the year ended 30 June 2011 and the unaudited financial statements for the six months ended 31 December 2010.
These interim financial statements do not include all the notes of the type normally included in an annual financial report. Accordingly, this report is to be read in conjunction with the annual report for the year ended 30 June 2011.
(a) changes in accounting policies
There have been no significant changes in accounting policies during the current period. Accounting policies have been applied on a basis consistent with prior half year and annual financial statements.
NOTES to tHe financial stateMents
FINANCIAL STATEMENTS
pg 15
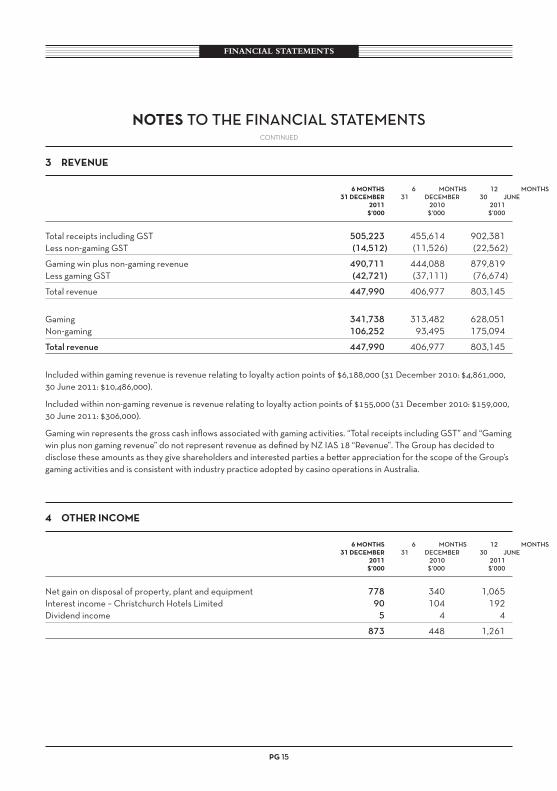
3 REvENuE
6 MONThS 6 MontHs 12 MontHs 31 dECEMBER 31 DeceMBer 30 June 2�11 2010 2011 $’��� $’000 $’000
Total receipts including GsT 505,223 455,614 902,381Less non-gaming GsT (14,512) (11,526) (22,562)
Gaming win plus non-gaming revenue 490,711 444,088 879,819Less gaming GsT (42,721) (37,111) (76,674)
Total revenue 447,990 406,977 803,145
Gaming 341,738 313,482 628,051Non-gaming 106,252 93,495 175,094
total revenue 447,990 406,977 803,145
Included within gaming revenue is revenue relating to loyalty action points of $6,188,000 (31 December 2010: $4,861,000, 30 June 2011: $10,486,000).
Included within non‑gaming revenue is revenue relating to loyalty action points of $155,000 (31 December 2010: $159,000, 30 June 2011: $306,000).
Gaming win represents the gross cash inflows associated with gaming activities. “Total receipts including GsT” and “Gaming win plus non gaming revenue” do not represent revenue as defined by NZ IAs 18 “Revenue”. The Group has decided to disclose these amounts as they give shareholders and interested parties a better appreciation for the scope of the Group’s gaming activities and is consistent with industry practice adopted by casino operations in Australia.
4 OThER INCOME
6 MONThS 6 MontHs 12 MontHs 31 dECEMBER 31 DeceMBer 30 June 2�11 2010 2011 $’��� $’000 $’000
Net gain on disposal of property, plant and equipment 778 340 1,065Interest income – Christchurch hotels Limited 90 104 192Dividend income 5 4 4
873 448 1,261
continued
NOTES to tHe financial stateMents

FINANCIAL STATEMENTS
pg 16
5 pROfIT BEfORE INCOME Tax
6 MONThS 6 MontHs 12 MontHs 31 dECEMBER 31 DeceMBer 30 June 2�11 2010 2011 $’��� $’000 $’000
profit before income tax includes the following specific expenses:Depreciation Buildings 12,648 12,640 24,198 Plant and equipment 17,187 14,184 31,402 Furniture and fittings 3,357 3,568 6,834 Motor vehicles 195 172 404
Total depreciation 33,387 30,564 62,838
amortisation Casino licence (Adelaide) 1,338 1,346 2,736 software 1,511 2,611 4,136
Total amortisation 2,849 3,957 6,872
Total depreciation and amortisation 36,236 34,521 69,710
other expenses includes: utilities, insurance and rates 10,581 9,750 19,616 Community Trust donations 1,622 1,524 3,185 Minimum lease payments relating to operating leases 2,211 2,156 4,408 Other property expenses 8,032 7,690 15,302 Other items (including International commissions) 30,635 28,624 50,031 Provision for bad and doubtful debts 18 41 81
53,099 49,785 92,623
restructuring costs Redundancy and other staff payments 293 648 2,471 Other restructuring costs 507 – 827
800 648 3,298
continued
NOTES to tHe financial stateMents

FINANCIAL STATEMENTS
pg 17
6 fINaNCE COSTS – NET
6 MONThS 6 MontHs 12 MontHs 31 dECEMBER 31 DeceMBer 30 June 2�11 2010 2011 $’��� $’000 $’000
finance costs Interest and finance charges 27,718 24,914 50,280 Exchange gains (640) (780) (2,105) Interest Income (1,580) (954) (2,783) Gain on funding reorganisation – – (1,620)
Total net finance costs 25,498 23,180 43,772
7 SIgNIfICaNT aSSOCIaTES aNd JOINT vENTuRES
The Group holds a 50% (31 December 2010: 50%; 30 June 2011: 50%) interest in Christchurch Casinos Limited (33.3% direct and 16.7% indirect).
8 CuRRENT lIaBIlITIES – INTEREST BEaRINg lIaBIlITIES
31 dECEMBER 31 DeceMBer 30 June 2�11 2010 2011 $’��� $’000 $’000
unsecuredsyndicated Bank Facility – 163,000 –us Private Placement 256,073 – 247,267
Total current interest bearing borrowings 256,073 163,000 247,267
Refer note 9 (Non‑current liabilities) for details of syndicated Bank Facility and usPP.
continued
NOTES to tHe financial stateMents

FINANCIAL STATEMENTS
pg 18
continued
NOTES to tHe financial stateMents
9 NON‑CuRRENT lIaBIlITIES – INTEREST BEaRINg lIaBIlITIES
31 dECEMBER 31 DeceMBer 30 June 2�11 2010 2011 $’��� $’000 $’000
unsecuredus Private Placement 372,129 402,318 350,202Deferred funding expenses (1,312) (814) –
Total unsecured non-current interest bearing borrowings 370,817 401,504 350,202
(a) united states private placement (uspp)
On 15 March 2005 skyCITy borrowed NZ$96,571,000, A$74,900,000 and us$274,500,000 with maturities between 2012 and 2020 from private investors (primarily us based) on an unsecured basis.
In July and August 2009, the Group repurchased usD115,500,000 of usPP debt. All repurchased debt was previously maturing in March 2012.
In March 2011, additional us$175,000,000 of usPP debt was raised, us$100,000,000 with 10 year maturity and us$75,000,000 with 7 years.
The usPP fixed rate us dollar borrowings have been converted to New Zealand and Australian dollar floating rate borrowings by use of cross‑currency interest rate swaps to eliminate foreign exchange exposure to the us dollar within the Income statement. Concurrent with the debt repurchase in 2009, all cross‑currency interest rate swaps and interest rate swaps hedging the relevant debt were closed out.
March 2012 maturities of usPP (us$85,000,000, A$74,900,000, NZ$47,275,000) have been recognised as current liabilities (refer note 8).
The movement in the usPP from 30 June 2011 relates to foreign exchange and interest rate movements.
(b) syndicated bank facility
As at 30 June 2011, the revolving credit bank facility was $400,000,000 being two tranches of $200,000,000 (maturing April 2014 and June 2016).
During the six months to 31 December 2011, the $200,000,000 tranche maturing April 2014 was extended to January 2015. Also, a NZ$85,000,000 revolving credit facility maturing March 2019 and an A$75,000,000 term facility maturing March 2019 were added.
The funding syndicate is comprised of ANZ National Bank Limited, Bank of New Zealand Limited, Commonwealth Bank of Australia, New Zealand Branch and westpac New Zealand Limited. As at 31 December 2011 the bank facility was undrawn (31 December 2010: $163,000,000; 30 June 2011: undrawn).

FINANCIAL STATEMENTS
pg 19
continued
NOTES to tHe financial stateMents
1� ShaRE CapITal
31 dECEMBER 31 DeceMBer 30 June 31 dECEMBER 31 DeceMBer 30 June 2�11 2010 2011 2�11 2010 2011 ShaRES sHares sHares $‘��� $’000 $’000
Opening balance of ordinary shares issued 576,958,340 575,114,687 575,114,687 728,616 732,910 732,910
share rights issued for employee services – – – 705 459 1,047
Employee share entitlements issued 610,404 – 275,034 – – –
Treasury shares issued (2,028,915) – (275,034) – – –Net purchase of treasury shares – – – (7,492) (3,810) (11,442)shares issued under dividend
reinvestment plan 1,418,511 – 1,843,653 4,736 – 6,101
576,958,340 575,114,687 576,958,340 726,565 729,559 728,616
Included within the number of shares are treasury shares of 4,581,160 (31 December 2010: 2,426,800 and 30 June 2011: 4,351,766) held by the company. The movement in treasury shares during the period related to the purchase of shares by an external trustee as part of the executive long term incentive plan. Treasury shares may be used to issue shares under the company’s employee incentive plan or upon the exercise of share rights/options.

FINANCIAL STATEMENTS
pg 20
11 RESERvES aNd RETaINEd pROfITS
6 MONThS 6 MontHs 12 MontHs 31 dECEMBER 31 DeceMBer 30 June 2�11 2010 2011 $’��� $’000 $’000
(a) reserves
hedging reserve – cash flow hedges (13,208) (4,677) (12,340)Foreign currency translation reserve 22,920 28,860 16,022
9,712 24,183 3,682
Hedging reserve – cash flow hedges Balance at the beginning of the period (12,340) (2,740) (2,740) Revaluation 27,728 (26,707) (77,025) Transfer to net profit (28,839) 23,710 63,292 Deferred tax 243 1,060 4,133
Balance 31 December (13,208) (4,677) (12,340)
foreign currency translation reserve Balance at the beginning of the period 16,022 10,625 10,625 Exchange differences on translation of overseas subsidiaries 6,898 18,235 5,397
Balance 31 December 22,920 28,860 16,022
(i) Hedging reserve – cash flow hedgesThe hedging reserve is used to record gains or losses on a hedging instrument in a cash flow hedge that are recognised directly in equity. Amounts are recognised in profit and loss when the associated hedged transaction affects profit and loss.
(ii) foreign currency translation reserveExchange differences arising on translation of the foreign operations are taken to the foreign currency translation reserve. The reserve is recognised in profit and loss when the net investment is disposed of.
(b) retained profit
Movements in retained profit were as follows:
Balance at the beginning of the period 41,150 17,397 17,397Profit attributable to shareholders of the company 78,826 67,126 122,960Dividends (46,079) (53,198) (99,207)
Balance at the end of the period 73,897 31,325 41,150
continued
NOTES to tHe financial stateMents

FINANCIAL STATEMENTS
pg 21
12 dIvIdENdS
31 dECEMBER 31 DeceMBer 30 June 2�11 2010 2011 $’��� $’000 $’000
Prior year’s final dividend 46,079 53,198 53,198Interim dividend – – 46,009
Total dividends provided for or paid 46,079 53,198 99,207
subsequent to balance date the Board of Directors has resolved to pay a 60% imputed/60% franked interim dividend of 9 cents per share.
cents per share
Prior year’s final distribution/dividend 8.00¢ 9.25¢ 9.25¢Interim distribution/dividend n/a n/a 8.00¢
13 CONTINgENCIES
There are no significant contingent liabilities or assets (31 December 2010 and 30 June 2011: none).
14 COMMITMENTS
(a) capital commitments
Capital expenditure contracted for at the reporting date but not recognised as liabilities is as follows:
31 dECEMBER 31 DeceMBer 30 June 2�11 2010 2011 $’��� $’000 $’000
Property, plant and equipment 61,296 26,412 59,695
(b) operating lease commitments 31 dECEMBER 31 DeceMBer 30 June 2�11 2010 2011 $’��� $’000 $’000
Commitments for minimum lease payments in relation to non-cancellable operating leases are payable as follows:
within one year 7,500 7,170 5,482Later than one year but not later than five years 20,062 13,401 13,419Later than five years 326,983 318,338 318,673
354,545 338,909 337,574
continued
NOTES to tHe financial stateMents

FINANCIAL STATEMENTS
pg 22
15 SEgMENT INfORMaTION
Management has determined the operating segments based on the reports reviewed by the Chief Executive Officer/Managing Director that are used to make strategic decisions.
The Group is organised into the following main operating segments:
sKycity aucklandskyCITy Auckland includes casino operations, hotels and convention, food and beverage, carparking, sky Tower, and a number of other related activities.
rest of new ZealandRest of New Zealand includes the Group’s interest in skyCITy hamilton, skyCITy Queenstown Casino and Christchurch Casino.
sKycity adelaideskyCITy Adelaide includes casino operations and food and beverage.
sKycity DarwinskyCITy Darwin includes casino operations, food and beverage and hotel.
international BusinessInternational Business includes commission and complimentary play. The international business segment is made up of customers sourced mainly from Asia, and the rest of the world. The revenue is generated at skyCITy’s Auckland, Darwin, Adelaide and Queenstown locations.
corporate/Grouphead office functions including legal and regulatory, group finance, human resources and information technology, the Chief Executive’s office and directors.
sKycity rest of sKycity sKycity international corporate/ Half year enDeD aucKlanD new ZealanD aDelaiDe Darwin Business Group total 31 DeceMBer 2011 $’000 $’000 $’000 $’000 $’000 $’000 $’000
Revenue from external customers and other revenue 228,121 27,001 93,683 75,658 24,400 – 448,863
share of net profits of associate – 2,419 – – – – 2,419Less Expenses (118,288) (15,317) (69,951) (48,849) (15,818) (14,828) (283,051)Depreciation and amortisation (19,495) (2,874) (5,301) (5,754) – (2,812) (36,236)
segment profit/(loss) (Earnings before Interest and Tax) 90,338 11,229 18,431 21,055 8,582 (17,640) 131,995
Finance costs – net (25,498)
Profit before income tax 106,497
continued
NOTES to tHe financial stateMents

FINANCIAL STATEMENTS
pg 23
sKycity rest of sKycity sKycity international corporate/ Half year enDeD aucKlanD new ZealanD aDelaiDe Darwin Business Group total 31 DeceMBer 2010 $’000 $’000 $’000 $’000 $’000 $’000 $’000
Revenue from external customers and other revenue 201,438 24,716 88,067 74,876 18,328 – 407,425
share of net profits of associate – 3,222 – – – – 3,222Less Expenses (104,583) (14,121) (67,309) (48,428) (12,295) (13,033) (259,769)Depreciation and amortisation (17,327) (2,512) (5,319) (5,875) – (3,488) (34,521)
segment profit/(loss) (Earnings before Interest and Tax) 79,528 11,305 15,439 20,573 6,033 (16,521) 116,357
Finance costs – net (23,180)
Profit before income tax 93,177
sKycity rest of sKycity sKycity international corporate/ year enD enDeD aucKlanD new ZealanD aDelaiDe Darwin Business Group total 30 June 2011 $’000 $’000 $’000 $’000 $’000 $’000 $’000
Revenue from external customers and other revenue 396,208 49,652 180,436 136,539 41,571 – 804,406
share of net profits of associate – 5,976 – – – – 5,976Less Expenses (205,522) (28,343) (135,629) (91,840) (25,356) (29,416) (516,106)Impairment of Christchurch
Casino – (15,000) – – – – (15,000)Depreciation and amortisation (35,089) (5,619) (10,976) (12,030) – (5,996) (69,710)
segment profit/(loss) (Earnings before Interest and Tax) 155,597 6,666 33,831 32,669 16,215 (35,412) 209,566
Finance costs – net (43,772)
Profit before income tax 165,794
continued
NOTES to tHe financial stateMents

FINANCIAL STATEMENTS
pg 24
16 EvENTS OCCuRRINg afTER ThE BalaNCE daTE
Dividend
On 15 February 2012, the directors resolved to provide for an interim dividend to be paid in respect of the six months ended 31 December 2011. The partially (60%) imputed, partially (60%) franked dividend of 9 cents per share will be paid on 5 April 2012 to all shareholders on the company’s register at the close of business on 22 March 2012.
17 RECONCIlIaTION Of pROfIT afTER INCOME Tax TO NET CaSh INflOw fROM OpERaTINg aCTIvITIES
6 MONThS 6 MontHs 12 MontHs 31 dECEMBER 31 DeceMBer 30 June 2�11 2010 2011 $’��� $’000 $’000
Profit for the period 78,826 67,126 122,960Non-controlling interest 89 26 43Depreciation and amortisation 36,236 34,521 69,710Finance costs net 25,498 23,180 43,772Current period share rights expense 705 459 1,047Gain on sale of property, plant and equipment (778) (340) (1,065)Impairment of Christchurch Casinos – – 15,000share of profit of associate not received as dividends (1,428) (2,479) (5,233)Change in operating assets and liabilities Decrease/(increase) in receivables and prepayments 7,680 (3,946) (7,720) (Increase)/decrease in inventories (1,005) (1,430) 192 (Decrease)/increase in payables and accruals (12,138) (2,616) 9,052 (Decrease)/increase in deferred tax liability (1,912) 16 (1,057) Decrease/(increase) in net tax prepayment 17,499 5,779 (22,781)Capital items included in working capital movements 14,180 1,966 (14,555)
Net cash inflow from operating activities 163,452 122,262 209,365
continued
NOTES to tHe financial stateMents
pg 25
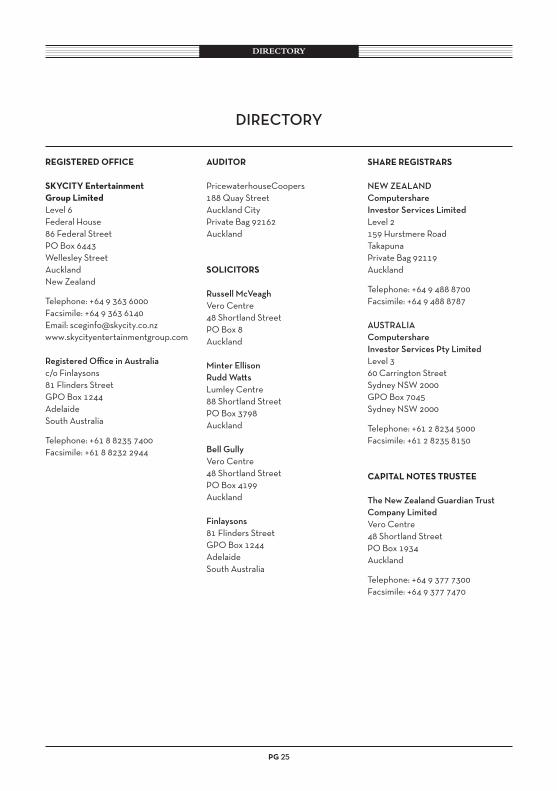
DIRECTORY
REgISTEREd OffICE
SKyCITy Entertainment group limitedLevel 6Federal house86 Federal streetPO Box 6443wellesley streetAucklandNew Zealand
Telephone: +64 9 363 6000Facsimile: +64 9 363 6140Email: [email protected]
registered office in australiac/o Finlaysons81 Flinders streetGPO Box 1244Adelaidesouth Australia
Telephone: +61 8 8235 7400Facsimile: +61 8 8232 2944
audITOR
PricewaterhouseCoopers188 Quay streetAuckland CityPrivate Bag 92162Auckland
SOlICITORS
russell McVeaghVero Centre48 shortland streetPO Box 8Auckland
Minter ellisonrudd wattsLumley Centre88 shortland streetPO Box 3798Auckland
Bell GullyVero Centre48 shortland streetPO Box 4199Auckland
finlaysons81 Flinders streetGPO Box 1244Adelaidesouth Australia
ShaRE REgISTRaRS
new ZealanDcomputershareinvestor services limitedLevel 2159 hurstmere RoadTakapunaPrivate Bag 92119Auckland
Telephone: +64 9 488 8700Facsimile: +64 9 488 8787
australiacomputershareinvestor services pty limitedLevel 360 Carrington streetsydney Nsw 2000GPO Box 7045sydney Nsw 2000
Telephone: +61 2 8234 5000Facsimile: +61 2 8235 8150
CapITal NOTES TRuSTEE
the new Zealand Guardian trustcompany limitedVero Centre48 shortland streetPO Box 1934Auckland
Telephone: +64 9 377 7300Facsimile: +64 9 377 7470
Directory

designedbyinsight.com
SKYC
203

www.skycity.co.nz