Embed Size (px)
Citation preview

Presented to the Skagit County Board of Commissioners
Re-evaluation of Historical Floods on the Skagit R. nr. Concrete, WA
Presented on August 13, 2007, by
Mark Mastin, Surface-Water Specialist USGS Washington Water Science Center
http://wa.water.usgs.gov
1

Topics Covered
• Why is the 1921 peak discharge at the Skagit River near Concrete important?
• How flood discharges are calculated • History of flood calculations at this site • Slope-Area Results • Stage-Discharge Rating-Curve Analysis • Final Evaluation
2

Skagit River Basin Gaging Stations
3

Skagit River near Concrete
Looking downstream. Streamgage* (sta. no. 12194000) on left bank.
4

• 1815 flood* at 69.3 ft gage height • 1856 flood* at 57.3 ft gage height • 1921 flood at 47.6 ft gage height • 2003 flood at 42.2 ft gage height
(166,000 ft3/s, highest since 1921)
• The 1921 peak discharge was used with rating extension to estimate the discharge for the other historic peaks (1897, 1909, and 1917).
* estimates in the USGS peak-flow data file
1815
1856
Oct 2003 1921
Skagit River near Concrete (cont’d)
5

Skagit River near Concrete (cont’d)
Left bank across from gage--Note scour line of October 2003 flood.
6

-
Skagit River near Concrete (cont’d)
HighHigh-Water Marks (Water Marks (HWMsHWMs) from 2003 Flood) from 2003 Flood
Gage Old Gage Location?
7

Skagit River near Concrete (cont’d)
8

Skagit River near Concrete (cont’d)
X S 1
XS3
X S 2
Cableway
9

Determining Flood Discharges • Directly—Current-
meter measurement (rare)
• Stage-Discharge Relation or Rating Curve (most common) – Defined by current-
meter measurements – Peak-flow discharges
determined by extension
10
100
1000 10000 100000 1000000
Discharge, in CFS
Gag
e H
eigh
t, in
feet
Discharge Measurements
60
500,000 cfs
10

Determining Flood Discharges (cont’d)
• Indirectly – Slope Area – Width Contractions
• Post-flood Survey – Channel geometry – Water-surface profile or
High-Water Marks (HWMs)
– Channel Roughness (n value)
11

Slope-Area Calculations
�Manning’s Equation: Q = 1.486/n AR⅔S½
where Q = discharge in ft3/s n = roughness coefficient A = cross section area R = hydraulic radius (A/wetted perimeter) S = friction or energy slope
– Assume uniform, steady-state conditions �Energy Equation:
(h+hv)1 = (h+hv)2 + (hf)1-2 + k(∆hv)1-2
Energy Equation for a reach is: (h+hv)1 = (h+hv)2 + (hf)1-2 + k(∆hv)1-2 where h = elevation of the water surface at the respective sections above a common datum; hv= velocity head at the respective section; hf = energy loss due to boundary friction in the reach; ∆hv= upstream velocity head minus the downstream velocity head; K(∆hv) = energy loss due to acceleration of deceleration in a contracting or expanding reach, and k = a coefficient, 0.5 for expanding reach and zero for contracting reaches.
12

Slope-Area Reach
13

USGS Assigns Flow Computations an Accuracy Rating
For Indirect Measurements: • Good—within 10% of the real value • Fair—within 15% of the real value • Poor—25% or greater of the real value
• A difference of 36,000 cfs in a flood peak that is estimated at 240,000 cfs is 15%
14

Cross section Map View
Flood Hydrology Is Not an Exact Science
15

–
–
– = – –
-
––
History of Calculating the 1921 Peak Discharge
• Winter 1922-23 Stewart surveys HWMs for the December 1921 peak, and computes a width-contraction and slope-area indirect measurement (average discharge= 240,000 ft3/s).
“…floodmarks still were so clear that the profile of the flood could bedetermined within one or two tenths of a foot.” Uses the 1921 indirect measurement with the then current rating toestimate all known historic floods Used channel roughness coefficient (n value) 0.033 Water-surface slope used instead of friction (or energy) slope No subdivisions of the cross sections
• 1950’s Flynn and Benson use 1949 peak flow data for an n verification study and recalculate Stewart’s slope area. They computed a peak flow of 225,000 ft3/s. Bodhaine (1954) approves Flynn and Benson’s analysis, but does not revise Stewart’s estimate because it is a change of less than 10 percent.
No subdivision of the cross sections n value = 0.0305
16

”
– = ––
History of Calculating the 1921 Peak Discharge (cont’d)
• December 2004 PIE report using 1-D HEC-RAS model, estimates 1921 peak at 202,000 ft3/s. Will Thomas (FEMA) and Robert Jarrett (USGS) found errors in PIE analysis.
• 2005 Mastin and Kresch compute a range of n values based on 2003 peak discharge and a range of peak discharges for the 1921 peak from 215,000 to 266,000 ft3/s.
• February 2007 Floodmarks not found in Hamilton House—Evidence of the magnitude of historic floods found to be inconclusive by NHC.
• April 2007 NHC report reviews 1922 [1921] flood and concludes, “the best estimate of the peak discharge for this event of 225,000 cfs as determined byBenson
• August 2007 Mastin revises earlier estimate using 2003 data with 2006 peak water surface profile and re-evaluates the 1921 calculation with Benson and Flynn 1949peak-flow data
n value of main channel 0.0315 Cross section B and C subdivided 1921 peak discharge calculated to be 228,000 ft3/s, which is 5 percent less tan the estimate by Stewart
17

Slope-Area Reach
18

NOTE: n is the roughness coefficient; vertical lines indicate where the cross sections were subdivided
Cross Section 2 (XS2)
19

Results from the 2003/2006 Peak-Flow Analysis
• n value for the main channel is 0.033
• Recalculated 1921 peak using an n value of 0.033, subdivisions and the energy slope is 219,000 ft3/s, which is 9 percent less than the estimate by Stewart
• Is this valid? Have things changed since 1921?
20

21
Has the reach changed since 1921?
XS3, REW

Cross-Section Surveys from Discharge Measurements at the Cableway Skagit R. nr Concrete, 12194000
22

23
1937
Skagit River near Concrete

24
2001
Skagit River near Concrete (cont’d)
Note the island/bar has revegetated since 1937 (previous photo)

25
1932
Island/bar at XS2
Skagit River near Concrete (cont’d)

1948
Island/bar at XS2
Skagit River near Concrete (cont’d)
26

27
1962
Island/bar at XS2
Skagit River near Concrete (cont’d)
Note the vegetation on the island/bar has just begun to develop a forest

28
Skagit River near Concrete (cont’d)
August 2004, looking downstream from Dalles Bridge
XS2
Mouth of Gorge
Bedrock forming the mouth of gorge
Note the vegetation on the island/bar has now matured into a dense forest
2004

Has the reach changed since 1921? • Yes, the reach has changed since 1921 at cross
section 2 (XS2) in the form of a dense forest.
• Are the reach changes since the inception of the forest on the island/bar addressed by the addition of sub sections and increased n value at XS2? Yes, to some extent, but it is difficult to assess the accuracy of the model with these changes.
• Evidence suggests that the reach conditions in 1949 were pretty much the same as in 1921.
29

Water-Surface Slope of 1949 Flood
30

-
Stationing, in feet
Ele
vati
on
, in
feet
(cu
rren
t g
ag
e d
atu
m)
n = 0.0315
n = 0.0315 n = 0.0315
n = 0.0315 n = 0.0315
Using this analysis, the peak discharge for the 1921 flood is 228,000 ft3/s
Cross sections, subdivisions, and n values used in the re-evaluation of the Benson Flynn analysis
Results
31
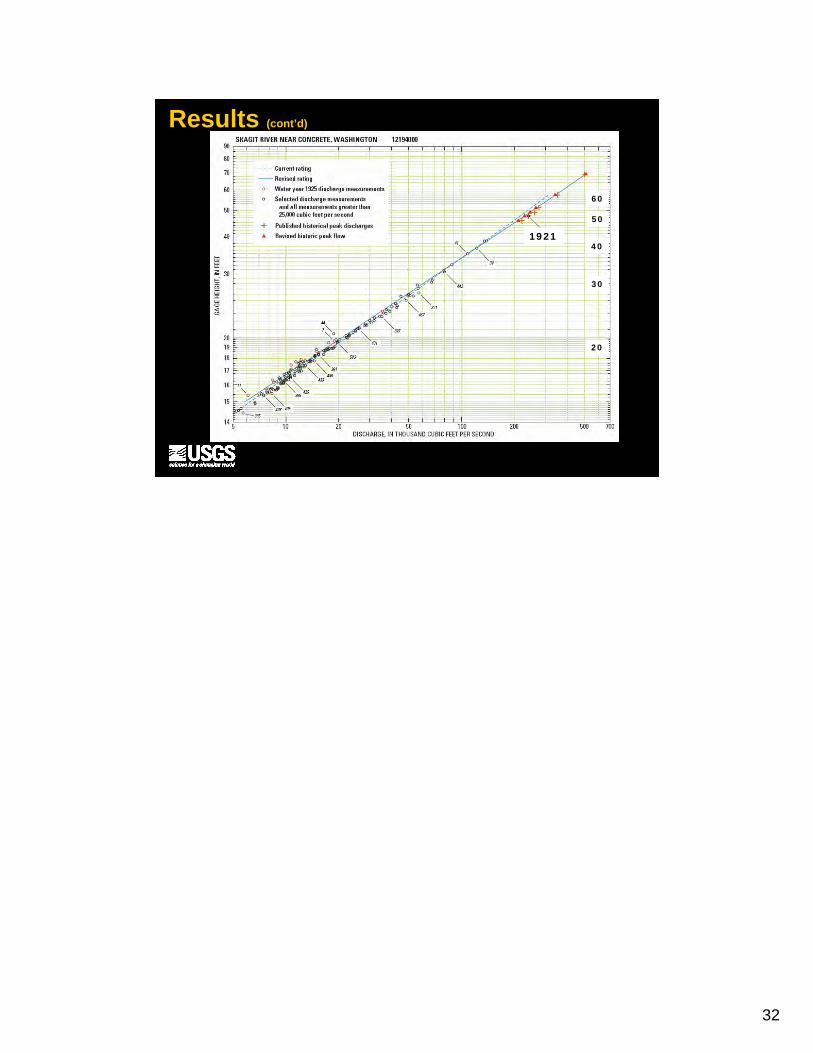
Results (cont’d)
20
60
30
40
50
1921
32

Historical Floods at Concrete
Year
Currently Published Discharge,
ft3/s
Gage Height, in feet (current gage datum)
Revised Peak Discharge % difference
~1815 *500,000 69.3 *510,000 2.0
~1856 *350,000 57.3 *340,000 -2.9
1897 275,000 51.1 265,000 -3.6
1909 260,000 49.1 245,000 -5.8
1917 220,000 45.7 210,000 -4.5
1921 240,000 47.6 228,000 -5.0
*estimates in the USGS peak-flow data file
33

- -
Summary • There are three lines of evidence that all point to the fact that
Stewart’s 1921 indirect peak estimate is slightly high 1. n verification and recalculation using 2003/2006 peak data 2. n verification and recalculation using 1949 peak data 3. Stage-discharge rating extension
• All three of the recalculations are within the error bounds of Stewart’s original calculation and the 10-percent guideline for revision. Even so, USGS has decided to revise the 1921 peak-flowestimate to 228,000 ft3/s because each of the three recalculations is less than the published estimate and the 1921 peak-flow value iscritical for flood planning.
• The n-verification using 1949 peak data is most accurate and it isused to recalculate the 1921 peak discharge.
• Rating extension is used with the 1921 peak discharge to estimate the magnitude of the other historical peak discharges.
34

Questions?
35