Embed Size (px)
Citation preview

RICE UNIVERSITY
Re-Engineering the alkanolamine absorption
process to economize carbon capture
by
Sumedh Warudkar
A Thesis Submitted
in Partial Fulfillment of the
Requirements for the Degree
Doctor of Philosophy
Approved, Thesis Committee:
George J. Hirasaki, ChairA J. Hartsook Professor in Chemical andBiomolecular Engineering
Michael S. WongProfessor of Chemical and BiomolecularEngineering and Chemistry
Kenneth R. CoxProfessor in the Practice at Chemical andBiomolecular Engineering
Walter G. ChapmanWilliam W. Akers Professor of Chemicaland Biomolecular Engineering
W. Edward BillupsProfessor of Chemistry
Houston, TexasApril, 2013

ABSTRACT
Re-Engineering the alkanolamine absorption process to economize carbon capture
by
Sumedh Warudkar
Power plants that burn coal and natural gas to produce electricity generate more
than half of global carbon dioxide (CO2) emissions. Separating the carbon diox-
ide (CO2) emitted at these large sources of emission, followed by long term storage
has been proposed as short to medium term solution to mitigate climate change.
Implementation of this strategy called ’Carbon Capture and Storage’ will allow the
continued use of fossil fuels while simultaneously reduce our carbon dioxide (CO2)
emissions. Technologies such as the alkanolamine absorption process, used to separate
carbon dioxide (CO2) from gas mixtures already exist and are widely used in the natu-
ral gas industry. However, it is presently infeasible to apply them for Carbon Capture
and Storage due to their relatively large energy consumption and the associated cost
penalties. It is estimated that even with the use of state-of-the-art technology, the
cost of electricity will increase by around 90%. The research presented in this thesis
is focused on developing strategies to limit the increase in the cost of electricity due
to implementation of Carbon Capture and Storage. Specifically, three different ap-
proaches have been explored as a part of this research effort. In the first, a process
simulation software; ProMax has been used to optimize the alkanolamine absorption
process to suit Carbon Capture application. The second approach involves exploring
the idea of adding a co-solvent such as an alcohol to reduce the energy consumption
of the carbon dioxide (CO2) removal process. Finally, a novel carbon dioxide (CO2)
separation process involving a combined absorber/desorber unit has been proposed

and demonstrated to work. Combining the absorber and stripper columns can aid
in building a more compact process in addition to providing opportunities for heat
integration and capital savings.

Acknowledgments
It would be untruthful of me to think or feel that the journey over the past five and
half years towards earning my doctorate would have been possible without anyone’s
help or support. Thus, first and foremost; I would like to express my sincere gratitude
to everyone who has been involved with me in any capacity during my time at Rice
University.
Several individuals made sacrifices to make it possible for me to attend graduate
school. I am deeply indebted to my family; my father, Mr. Shripad Warudkar; my
mother, Mrs. Vidya Warudkar; my brother, Mr. Himanshu Warudkar and my sister-
in-law, Mrs. Abha Warudkar. I am particularly thankful to my wife, Pooja who has
provided me incredible support through this entire journey. She has been the calming
influence in my life and backed me to navigate the difficult periods in my research.
She has helped me stay firmly rooted to reality through both, the successful and the
not-so-successful phases in graduate school.
I have been privileged to be able to learn to conduct scientific research under the
guidance of Dr. George J. Hirasaki. His approach to research relies on a careful under-
standing of the fundamental processes that are responsible for observed phenomena.
I have come to realize that this is the single most important transferable skill that
any graduate student can learn while conducting doctoral research. In addition, Dr.
Hirasaki’s work ethics and dedication has always motivated me to step out of my
comfort zone and take up challenges, be it technical, organizational or physical. I will
always be grateful to Dr. Hirasaki for teaching me to think.
I would like to acknowledge Dr. Michael S. Wong for co-advising my research.

v
He has supported me through difficult times, especially during the initial phases of
my research. It was he who motivated me to take up the challenge of writing and
submitting the research proposal to the US Department of Energy. This eventually
resulted in our project being awarded a $1 million award in August 2011.
I would like to thank Dr. Walter G. Chapman, Dr. Kenneth R. Cox and Dr. W.
Edward Billups for serving on my doctoral thesis committee.
I would like to sincerely thank every teacher and educator, who in a formal or
informal role has taught me something useful and helped me improve myself over the
past 27 odd years.
Several students - undergraduate and graduate as well as staff members have
been very helpful during the course of my research at Rice University. Ms. Maura
Puerto has been of immense help in resolving any technical challenges concerning
the design and fabrication of my experimental setups. Dr. Jerimiah Forsythe was
helpful in the setup and commissioning of my experimental prototypes. His insights
based on his knowledge of chemistry were always useful during technical discussions.
Mr. Sriram Chandrasekhar, the Rice University undergraduate student who was
doing exploratory research on this project when I joined it, provided a enthusiastic
companion in the search for the right materials for this research project. Dr. Michael
Rauschhuber, Dr. Neeraj Rohilla, Dr. Sayantan Chatterjee, Dr. Jose Lopez and
other members of Dr. Hirasaki and Dr. Wong’s research groups have been great
individuals for both technical and non-technical discussions concerning research.
Finally, I would like to thank Rice University for offering me the Chemical and
Biomolecular Engineering graduate fellowship and the Loewenstern graduate fellow-
ship in Engineering; to the Energy and Environmental Systems Institute at Rice
University, Rice University consortium for processes in porous media, Schlumberger
Ltd. and the US Department of Energy grant # DE0007531 for funding support.

vi
Contents
Abstract ii
Acknowledgments iv
1 Introduction 1
1.1 Background . . . . . . . . . . . . . . . . . . . . . . . . . . . . . . . . 1
1.2 Organization . . . . . . . . . . . . . . . . . . . . . . . . . . . . . . . 5
2 Climate change and carbon capture and storage 8
2.1 Fossil fuels and climate change . . . . . . . . . . . . . . . . . . . . . . 8
2.2 Carbon Capture and Storage . . . . . . . . . . . . . . . . . . . . . . . 11
2.3 Technologies for Carbon Capture . . . . . . . . . . . . . . . . . . . . 14
2.3.1 Adsorption . . . . . . . . . . . . . . . . . . . . . . . . . . . . 15
2.3.2 Cryogenic separation . . . . . . . . . . . . . . . . . . . . . . . 17
2.3.3 Membrane separation . . . . . . . . . . . . . . . . . . . . . . . 18
2.3.4 Absorption . . . . . . . . . . . . . . . . . . . . . . . . . . . . 20
2.4 Carbon dioxide (CO2), compression, storage and monitoring . . . . . 22
2.5 Challenges with Carbon Capture and Storage . . . . . . . . . . . . . 23
3 Amine absorption technology: technical description and current
research 26
3.1 Amine absorption technology . . . . . . . . . . . . . . . . . . . . . . 26
3.1.1 Original development . . . . . . . . . . . . . . . . . . . . . . . 26
3.1.2 Modifications for use in carbon capture . . . . . . . . . . . . . 34

vii
3.1.3 Remaining challenges . . . . . . . . . . . . . . . . . . . . . . . 35
3.2 Current research and development . . . . . . . . . . . . . . . . . . . . 36
3.2.1 Better absorbents . . . . . . . . . . . . . . . . . . . . . . . . . 37
3.2.2 Process intensification . . . . . . . . . . . . . . . . . . . . . . 40
3.3 Scope for advancing carbon capture research . . . . . . . . . . . . . . 43
3.4 Direction of our research work . . . . . . . . . . . . . . . . . . . . . . 46
4 Effects of variation in stripper operating pressure on the
performance of the amine absorption process for carbon capture:
a technical perspective 48
4.1 Motivation . . . . . . . . . . . . . . . . . . . . . . . . . . . . . . . . . 48
4.2 Research approach . . . . . . . . . . . . . . . . . . . . . . . . . . . . 49
4.2.1 ProMax and amine systems modeling . . . . . . . . . . . . . . 49
4.2.2 Flowsheet development . . . . . . . . . . . . . . . . . . . . . . 52
4.2.3 Evaluating parasitic power loss . . . . . . . . . . . . . . . . . 57
4.2.4 Process and simulation parameters . . . . . . . . . . . . . . . 61
4.3 Results and analysis . . . . . . . . . . . . . . . . . . . . . . . . . . . 65
4.3.1 Effect of stripper operating pressure on reboiler heat duty . . 65
4.3.2 Effect of stripper operating pressure on column sizing . . . . . 70
4.3.3 Effect of stripper operating pressure on heat exchanger sizing . 72
4.3.4 Effect of stripper operating pressure on compression duty . . . 74
4.3.5 Effect of stripper operating pressure on parasitic power losses 76
4.4 Concluding Remarks . . . . . . . . . . . . . . . . . . . . . . . . . . . 80
5 Effects of variation in stripper operating pressure on the
performance of the amine absorption process for carbon capture:
an economic perspective 84
5.1 Motivation . . . . . . . . . . . . . . . . . . . . . . . . . . . . . . . . . 84
5.2 Research approach . . . . . . . . . . . . . . . . . . . . . . . . . . . . 85

viii
5.3 Sizing and rating methodology . . . . . . . . . . . . . . . . . . . . . . 86
5.3.1 Sizing separation columns . . . . . . . . . . . . . . . . . . . . 86
5.3.2 Sizing separator vessels . . . . . . . . . . . . . . . . . . . . . . 88
5.3.3 Rating heat exchangers . . . . . . . . . . . . . . . . . . . . . . 90
5.3.4 Rating Fluid Drivers . . . . . . . . . . . . . . . . . . . . . . . 94
5.3.5 Generic simulation parameters employed for economic evaluation 96
5.4 Effects of variation in stripper pressure on cost of carbon capture . . 96
5.4.1 Effect of variation in stripper pressure on the cost of amine
absorber and stripper . . . . . . . . . . . . . . . . . . . . . . . 98
5.4.2 Effect of variation in stripper pressure on the cost of lean/rich
amine heat exchanger . . . . . . . . . . . . . . . . . . . . . . . 102
5.4.3 Effect of variation in stripper pressure on the cost of amine
reboiler . . . . . . . . . . . . . . . . . . . . . . . . . . . . . . 103
5.4.4 Effect of variation in stripper pressure on the cost of carbon
dioxide (CO2) compression train . . . . . . . . . . . . . . . . . 105
5.4.5 Effect of variation in stripper pressure on the overall cost of
carbon capture plant . . . . . . . . . . . . . . . . . . . . . . . 106
5.5 Concluding Remarks . . . . . . . . . . . . . . . . . . . . . . . . . . . 111
6 Development of superior absorbents for carbon dioxide (CO2)
removal: emphasizing the role of the solvent 113
6.1 Motivation . . . . . . . . . . . . . . . . . . . . . . . . . . . . . . . . . 113
6.2 Research Approach . . . . . . . . . . . . . . . . . . . . . . . . . . . . 115
6.3 Contribution of various constituent physiochemical processes to
reboiler duty . . . . . . . . . . . . . . . . . . . . . . . . . . . . . . . . 117
6.4 Role of the alkanolamine solvent . . . . . . . . . . . . . . . . . . . . . 123
6.5 Estimating the effect of addition of alcohol to alkanolamines on
energy consumption . . . . . . . . . . . . . . . . . . . . . . . . . . . . 126
6.5.1 A brief review of published literature . . . . . . . . . . . . . . 126

ix
6.5.2 Approach to estimating reboiler duty . . . . . . . . . . . . . . 129
6.5.3 General framework for evaluating reboiler duty using
equilibrium approach . . . . . . . . . . . . . . . . . . . . . . . 133
6.5.4 Evaluating reboiler duty for aqueous diethanolamine (DEA)
systems . . . . . . . . . . . . . . . . . . . . . . . . . . . . . . 138
6.5.5 Evaluating reboiler duty for aqueous diethanolamine (DEA)
blended with methanol . . . . . . . . . . . . . . . . . . . . . . 146
6.6 Effect of addition of alcohol on carbon dioxide (CO2) absorption kinetics155
6.6.1 Experimental setup for studying reaction kinetics . . . . . . . 156
6.6.2 Results and analysis of flow experiments to study carbon
dioxide (CO2) absorption kinetics . . . . . . . . . . . . . . . . 158
6.7 Implications of replacing conventional absorbents with alcohol
blended aqueous alkanolamines . . . . . . . . . . . . . . . . . . . . . 162
6.8 Concluding Remarks . . . . . . . . . . . . . . . . . . . . . . . . . . . 167
7 Combined pressure and temperature contrast separation of
carbon dioxide (CO2): key concepts & process development 170
7.1 Motivation . . . . . . . . . . . . . . . . . . . . . . . . . . . . . . . . . 170
7.2 Combining the absorber and stripper columns: developing the
concept of an integrated unit . . . . . . . . . . . . . . . . . . . . . . . 171
7.3 Selecting the right material: ceramic foams . . . . . . . . . . . . . . . 174
7.4 Characterizing the hydrodynamic behavior of ceramic foams . . . . . 181
7.4.1 Experimental setup . . . . . . . . . . . . . . . . . . . . . . . . 182
7.4.2 Experimental procedure . . . . . . . . . . . . . . . . . . . . . 184
7.4.3 Experimental results . . . . . . . . . . . . . . . . . . . . . . . 185
7.5 Characterizing the mass transfer behavior of ceramic foams . . . . . . 190
7.5.1 Experimental setup . . . . . . . . . . . . . . . . . . . . . . . . 191
7.5.2 Experimental method . . . . . . . . . . . . . . . . . . . . . . . 193
7.5.3 Experimental results . . . . . . . . . . . . . . . . . . . . . . . 194

x
7.6 Experiments to determine design parameters for proof-of-concept
demonstration . . . . . . . . . . . . . . . . . . . . . . . . . . . . . . . 200
7.6.1 Experimental procedure . . . . . . . . . . . . . . . . . . . . . 201
7.6.2 Experimental results . . . . . . . . . . . . . . . . . . . . . . . 202
7.7 Concluding Remarks . . . . . . . . . . . . . . . . . . . . . . . . . . . 205
7.7.1 Hydrodynamic studies . . . . . . . . . . . . . . . . . . . . . . 205
7.7.2 Mass transfer studies . . . . . . . . . . . . . . . . . . . . . . . 207
8 Integrating the absorber and stripper units for the separation of
carbon dioxide (CO2): proof of concept demonstration 208
8.1 Development of the experimental prototype . . . . . . . . . . . . . . 209
8.1.1 Choice of materials . . . . . . . . . . . . . . . . . . . . . . . . 209
8.1.2 Design considerations . . . . . . . . . . . . . . . . . . . . . . . 211
8.1.3 Setup of experimental prototype . . . . . . . . . . . . . . . . . 213
8.2 Proof-of-concept demonstration . . . . . . . . . . . . . . . . . . . . . 221
8.2.1 Choice of operating parameters . . . . . . . . . . . . . . . . . 221
8.2.2 Experimental procedure . . . . . . . . . . . . . . . . . . . . . 225
8.2.3 Experimental results and analysis . . . . . . . . . . . . . . . . 228
8.3 Concluding Remarks . . . . . . . . . . . . . . . . . . . . . . . . . . . 238
9 Recommendations for future work 240
9.1 Calibrating the economic feasibility of using waste heat with
coal-fired power plant operational data . . . . . . . . . . . . . . . . . 241
9.2 Development of novel absorbents . . . . . . . . . . . . . . . . . . . . 241
9.3 Generating thermodynamic data and modeling . . . . . . . . . . . . . 242
9.4 Exploring the potential for side reactions between alcohols and amines 244
9.5 Modeling of combined absorber stripper system . . . . . . . . . . . . 246
Appendix A Design sheets for stainless steel prototype and
miniature boiler 248

xi
Bibliography 272

xii
List of Figures
2.1 World energy consumption in Million tonnes of oil equivalent (Mtoe)
(2011) [1] . . . . . . . . . . . . . . . . . . . . . . . . . . . . . . . . . 9
2.2 Growth of atmospheric carbon dioxide (CO2) concentration and
global temperature anomaly over roughly the same time period [2, 3, 4] 10
2.3 Global Greenhouse Gas (GHG) abatement cost curve [5] . . . . . . . 12
2.4 Schematic representation of Carbon Capture and Storage (CCS) [6] . 13
2.5 Schematic representation of adsorption process for carbon dioxide
(CO2) separation from flue gas [7] . . . . . . . . . . . . . . . . . . . 16
2.6 Schematic representation of cryogenic separation process for carbon
dioxide (CO2) separation from flue gas [7] . . . . . . . . . . . . . . . 18
2.7 Schematic representation of membrane separation process for carbon
dioxide (CO2) separation from flue gas [7] . . . . . . . . . . . . . . . 19
2.8 Schematic representation of gas absorption (alkanolamine) separation
process for carbon dioxide (CO2) separation from flue gas [7] . . . . 21
3.1 Chemical structure of various commercial alkanolamines . . . . . . . 27
3.2 Schematic representation of amine absorption process for natural gas
sweetening [8] . . . . . . . . . . . . . . . . . . . . . . . . . . . . . . . 28
3.3 Temperature and acid gas removal profiles in an absorber column . . 30
3.4 Temperature and absorbent regeneration profiles in a desorber column 31
3.5 Heat of reaction for 4 different alkanolamines [9, 10] . . . . . . . . . 32
3.6 Reaction rate at 25oC for different alkanolamines [11, 12] . . . . . . . 33

xiii
4.1 Graphic explanation of model complexity [13] . . . . . . . . . . . . . 51
4.2 Flowsheet for the amine absorption process for CO2 separation with
high pressure strippers . . . . . . . . . . . . . . . . . . . . . . . . . . 53
4.3 Flowsheet for the amine absorption process for CO2 separation with
vacuum strippers . . . . . . . . . . . . . . . . . . . . . . . . . . . . . 54
4.4 Schematic representation of a steam jet ejector [14] . . . . . . . . . . 57
4.5 Flowsheet for the compression of CO2 separated with amine
absorption trains using high pressure strippers . . . . . . . . . . . . . 58
4.6 Flowsheet for the compression of CO2 separated with amine
absorption trains using vacuum strippers . . . . . . . . . . . . . . . . 58
4.7 Flowsheet for the glycol dehydration unit for conditioning CO2 before
transportation . . . . . . . . . . . . . . . . . . . . . . . . . . . . . . . 59
4.8 Electric power equivalence of low pressure steam . . . . . . . . . . . . 60
4.9 Dependence of reboiler energy duty on stripper operating pressure . . 68
4.10 Dependence of absorber diameter on stripper operating pressure . . . 71
4.11 Dependence of stripper diameter on stripper operating pressure . . . 73
4.12 Dependence of CO2 compression duty on stripper operating pressure . 75
4.13 Dependence of parasitic power losses on stripper operating pressure . 77
4.14 Dependence of parasitic power loss for vacuum strippers on waste
heat availability . . . . . . . . . . . . . . . . . . . . . . . . . . . . . . 79
5.1 Dependence of absorber costs on stripper operating pressure . . . . . 99
5.2 Dependence of stripper costs on stripper operating pressure . . . . . . 100
5.3 Dependence of amine heat exchanger costs on stripper operating
pressure . . . . . . . . . . . . . . . . . . . . . . . . . . . . . . . . . . 103
5.4 Dependence of amine reboiler costs on stripper operating pressure . . 104
5.5 Dependence of carbon dioxide (CO2) compression train costs on
stripper operating pressure . . . . . . . . . . . . . . . . . . . . . . . . 105

xiv
5.6 Dependence of the overall cost of carbon capture plants on stripper
operating pressure . . . . . . . . . . . . . . . . . . . . . . . . . . . . 107
6.1 Contribution of stripping vapor energy consumption to reboiler heat
duty . . . . . . . . . . . . . . . . . . . . . . . . . . . . . . . . . . . . 119
6.2 Lumped contribution of heat of reaction and sensible heating duty to
the reboiler heat duty . . . . . . . . . . . . . . . . . . . . . . . . . . . 119
6.3 Ratio of CO2 to H2O partial pressures in equilibrium with different
alkanolamines (α = 0.5 moles-CO2/mole-amine) . . . . . . . . . . . . 121
6.4 Contribution of physiochemical processes to reboiler duty - (MEA 20
wt%) . . . . . . . . . . . . . . . . . . . . . . . . . . . . . . . . . . . . 121
6.5 Contribution of physiochemical processes to reboiler duty - (DEA 40
wt%) . . . . . . . . . . . . . . . . . . . . . . . . . . . . . . . . . . . . 122
6.6 Contribution of physiochemical processes to reboiler duty - (DGA 60
wt%) . . . . . . . . . . . . . . . . . . . . . . . . . . . . . . . . . . . . 122
6.7 A comparison of the specific heat capacity of water and various alcohols125
6.8 A comparison of the heat of vaporization of water and various alcohols 125
6.9 A comparison of the equilibrium partial pressure of carbon dioxide
(CO2) above two diethanolamine (DEA) based absorbent
formulations at 100oC . . . . . . . . . . . . . . . . . . . . . . . . . . 128
6.10 Simplified schematic representation of a typical amine absorption unit 133
6.11 Vapor liquid equilibrium data for aqueous diethanolamine (DEA)
34.8 wt% . . . . . . . . . . . . . . . . . . . . . . . . . . . . . . . . . . 139
6.12 Vapor liquid equilibrium data for aqueous diethanolamine (DEA)
blended with methanol (40:40:20 - wt%) . . . . . . . . . . . . . . . . 147
6.13 Experimental setup used to studying the effect of diglycolamine
(DGA) solvent on CO2 absorption kinetics . . . . . . . . . . . . . . . 157
xv
6.14 Degree of CO2 removal taking place in absorber column with various
diglycolamine (DGA) solvents . . . . . . . . . . . . . . . . . . . . . . 159
6.15 Dielectric constant of different solvents - water, methanol and ethanol 160
6.16 CO2 solubility in different solvents - water, methanol and ethanol . . 160
6.17 Kinematic viscosity of various diglycolamine (DGA) absorbents with
water, methanol and ethanol as solvents . . . . . . . . . . . . . . . . 161
6.18 A comparison of reboiler duty for common aqueous alkanolamines
and methanol blended diethanolamine (DEA) . . . . . . . . . . . . . 165
6.19 A comparison of parasitic power loss for various amine absorption
plant configurations using aqueous diethanolamine (DEA) - with and
without methanol . . . . . . . . . . . . . . . . . . . . . . . . . . . . . 165
7.1 Schematic representation of the novel process with an integrated
absorber and stripper . . . . . . . . . . . . . . . . . . . . . . . . . . . 172
7.2 A commercial sample of alumina foam . . . . . . . . . . . . . . . . . 176
7.3 Different routes to manufacturing ceramic foams [15] . . . . . . . . . 177
7.4 Scanning electron micrographs of a 45 pores per inch (ppi) sample of
alumina foam . . . . . . . . . . . . . . . . . . . . . . . . . . . . . . . 178
7.5 Pore size distribution in a 45 pore per inch (ppi) sample of alumina
foam . . . . . . . . . . . . . . . . . . . . . . . . . . . . . . . . . . . . 179
7.6 Pore size distribution in a 45 pore per inch (ppi) sample of alumina
foam . . . . . . . . . . . . . . . . . . . . . . . . . . . . . . . . . . . . 179
7.7 Schematic representation of experimental setup developed for
studying hydrodynamic behavior of ceramic foams . . . . . . . . . . . 182
7.8 Experimental setup for studying the hydrodynamic behavior of
ceramic foams . . . . . . . . . . . . . . . . . . . . . . . . . . . . . . . 186
7.9 Pressure drop in 45 pores per inch (ppi) ceramic foam at varying gas
and liquid flow-rates . . . . . . . . . . . . . . . . . . . . . . . . . . . 187

xvi
7.10 Pressure drop in 30 pores per inch (ppi) ceramic foam at varying gas
and liquid flow-rates . . . . . . . . . . . . . . . . . . . . . . . . . . . 187
7.11 Pressure drop in 20 pores per inch (ppi) ceramic foam at varying gas
and liquid flow-rates . . . . . . . . . . . . . . . . . . . . . . . . . . . 189
7.12 Schematic representation of experimental setup developed for
studying mass transfer performance of ceramic foams . . . . . . . . . 192
7.13 Degree of CO2 pickup with different tower packing (30 wt% DGA,
gas at 3 SLPM, liquid at 0.02 LPM) . . . . . . . . . . . . . . . . . . 196
7.14 Degree of CO2 pickup with different tower packing (30 wt% DGA,
gas at 5 SLPM, liquid at 0.04 LPM) . . . . . . . . . . . . . . . . . . 198
7.15 Degree of CO2 pickup with different tower packing (60 wt% DGA,
gas at 3 & 5 SLPM, liquid at 0.02 & 0.04 LPM) . . . . . . . . . . . . 198
7.16 Comparison of CO2 removal performance under different gas and
liquid flow conditions (10.2 cm long ceramic foam column) . . . . . . 203
7.17 Comparison of CO2 removal performance under different gas and
liquid flow conditions (15.2 cm long ceramic foam column) . . . . . . 203
7.18 Comparison of CO2 removal performance under different gas and
liquid flow conditions (20.3 cm long ceramic foam column) . . . . . . 205
7.19 Comparison of CO2 removal performance under different gas and
liquid flow conditions (25.4 cm long ceramic foam column) . . . . . . 206
8.1 Rendering of the stainless steel prototype . . . . . . . . . . . . . . . . 214
8.2 An assembly view of the stainless steel prototype . . . . . . . . . . . 215
8.3 An assembly cross-section view of the stainless steel prototype . . . . 216
8.4 Rendering of the miniature steam generator . . . . . . . . . . . . . . 217
8.5 An assembly view of the miniature steam generator . . . . . . . . . . 218
8.6 An assembly cross-section view of the miniature steam generator . . . 219

xvii
8.7 Schematic representation of the experimental setup developed for the
proof-of-concept demonstration . . . . . . . . . . . . . . . . . . . . . 222
8.8 Photograph of the experimental setup developed for the
proof-of-concept demonstration . . . . . . . . . . . . . . . . . . . . . 223
8.9 Degree of CO2 removal at variable gas flow-rates and absorbent
flow-rate of 0.01 liters per minute (LPM) . . . . . . . . . . . . . . . . 230
8.10 Dependence of maximum lateral flow-rate of absorbent on pressure
difference across absorption and stripping chambers . . . . . . . . . . 231
8.11 Degree of CO2 removal at variable gas flow-rates and absorbent
flow-rate of 0.02 liters per minute (LPM) . . . . . . . . . . . . . . . . 232
8.12 Degree of CO2 removal at variable gas flow-rates and absorbent
flow-rate of 0.03 liters per minute (LPM) . . . . . . . . . . . . . . . . 233
8.13 Degree of CO2 removal at variable gas flow-rates, absorbent flow-rate
of 0.01 liters per minute (LPM) and pressure differential (∆ P) of
20.7 kPa - with and without steam . . . . . . . . . . . . . . . . . . . 234
8.14 A schematic representation of the experimental setup used for the
proof-of-concept demonstration - with experimental measurements
and observations . . . . . . . . . . . . . . . . . . . . . . . . . . . . . 235
8.15 Temporal dependence of absorption side external surface temperatures 236
8.16 Temporal dependence of stripping side external surface temperatures 236
xviii
List of Tables
3.1 Typical concentration and amine loading limits practiced in
commercial operation of amine absorption systems [16] . . . . . . . . 34
4.1 Parameters for Evaluation of Equivalent Power Losses [17, 18] . . . . 62
4.2 Composition of flue gas used in simulation studies [19] . . . . . . . . 63
4.3 System parameters used in ProMax simulations . . . . . . . . . . . . 66
4.4 Heat exchanger parameters in the amine absorption system simulations 67
4.5 Absorbent flowrates under different stripper operating conditions . . . 75
4.6 Absorbent flowrates under different stripper operating conditions . . . 79
5.1 Parameters used for economic evaluation of equipment cost . . . . . . 87
5.2 Dimensions of various separation columns in the carbon capture plant 89
5.3 Dimensions of various separation vessels in the carbon capture plant . 91
5.4 Overall heat transfer coefficients for various heat exchangers (U) . . . 92
5.5 Heat transfer surface areas for different heat exchangers in the carbon
capture plant . . . . . . . . . . . . . . . . . . . . . . . . . . . . . . . 93
5.6 Parameters used for rate the various fluid drivers in the carbon
capture plant . . . . . . . . . . . . . . . . . . . . . . . . . . . . . . . 95
5.7 Generic parameters used in evaluation of equipment costs
[20, 21, 22, 23] . . . . . . . . . . . . . . . . . . . . . . . . . . . . . . . 97
5.8 Individual cost of carbon capture plant equipment . . . . . . . . . . . 108
5.9 Individual cost of carbon capture plant equipment (contd..) . . . . . . 109

xix
5.10 Individual cost of carbon capture plant equipment (contd..) . . . . . . 110
6.1 Antoine equation parameters for water and methanol . . . . . . . . . 140
6.2 Parameters used for reboiler duty calculations . . . . . . . . . . . . . 141
6.3 Properties and composition of material streams exiting the absorber . 142
6.4 Properties and composition of rich absorbent: aqueous
diethanolamine (DEA), before and after entering stripper . . . . . . . 143
6.5 Comparison of stripper operational parameters evaluated using
equilibrium approach and ProMax . . . . . . . . . . . . . . . . . . . . 144
6.6 Parameters used for reboiler duty calculations . . . . . . . . . . . . . 149
6.7 Properties and composition of material streams exiting the absorber . 150
6.8 Properties and composition of rich absorbent: methanol blended
aqueous diethanolamine (DEA), before and after entering stripper . . 151
6.9 Stripper and reboiler operational parameters for methanol blended
aqueous diethanolamine (DEA) . . . . . . . . . . . . . . . . . . . . . 152
7.1 Comparison of geometric surface area of ceramic foam and various
tower packings . . . . . . . . . . . . . . . . . . . . . . . . . . . . . . 180
8.1 Properties of porous alumina membrane . . . . . . . . . . . . . . . . 210
8.2 Properties of polyethersulfone membrane . . . . . . . . . . . . . . . . 211
8.3 Diglycolamine (DGA) concentration in stripping chamber effluent . . 237
9.1 Amine degradation products . . . . . . . . . . . . . . . . . . . . . . . 245
1
Chapter 1
Introduction
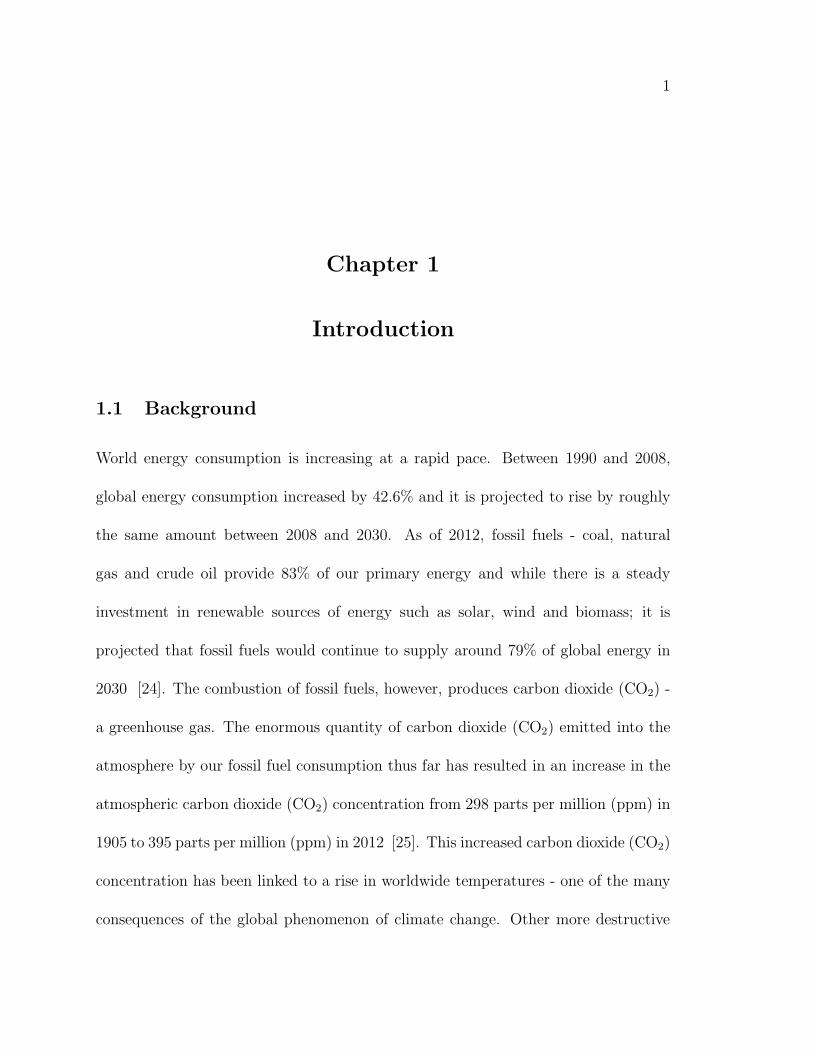
1.1 Background
World energy consumption is increasing at a rapid pace. Between 1990 and 2008,
global energy consumption increased by 42.6% and it is projected to rise by roughly
the same amount between 2008 and 2030. As of 2012, fossil fuels - coal, natural
gas and crude oil provide 83% of our primary energy and while there is a steady
investment in renewable sources of energy such as solar, wind and biomass; it is
projected that fossil fuels would continue to supply around 79% of global energy in
2030 [24]. The combustion of fossil fuels, however, produces carbon dioxide (CO2) -
a greenhouse gas. The enormous quantity of carbon dioxide (CO2) emitted into the
atmosphere by our fossil fuel consumption thus far has resulted in an increase in the
atmospheric carbon dioxide (CO2) concentration from 298 parts per million (ppm) in
1905 to 395 parts per million (ppm) in 2012 [25]. This increased carbon dioxide (CO2)
concentration has been linked to a rise in worldwide temperatures - one of the many
consequences of the global phenomenon of climate change. Other more destructive

2
results of climate change include a rise in sea level, melting of polar ice-caps, increase
in the frequency and severity of extreme events such as hurricanes, tornadoes, etc.
and a change in global precipitation patterns which will quite likely result in severe
droughts in some regions while flooding in others [26]. These effects are expected to
cause unprecedented economic losses in the future, which provides a strong motivation
to mitigate climate change by limiting our carbon dioxide (CO2) emissions. Various
strategies have been proposed to mitigate the disastrous consequences of climate
change. These include short term, low-cost-low-impact options like boosting the
use of energy efficient technology; long term, high-cost-high-impact-options such as
reducing or completely eliminating fossil fuels from the global energy mix and medium
term, moderate-cost-high-impact choices like the switch from coal to natural gas as
well as carbon capture and storage [27].
About 41% of all carbon dioxide (CO2) released by fossil fuel combustion comes
from the generation of electricity. Worldwide, coal and natural gas fired power plants
emit around 12 Gigatons (Gt) of carbon dioxide (CO2) annually [28]. From an eco-
nomic and logistical standpoint, these power plants are an easier emission source to
decarbonize as compared to the tiny carbon dioxide (CO2) emissions from the tailpipe
of individual motor vehicles. Carbon capture and storage (CCS), thus, is the removal
and long term storage of the carbon dioxide (CO2) exhaust from these point sources
of emission. Carbon dioxide (CO2) from power plant exhaust is first separated from
other components of flue gas, compressed to a pipeline pressures of between 8 Mega-

3
pascals (MPa) and 16 Megapascals (MPa) and stored in suitable geolocical locations
such as saline aquifers, depleted oil and gas fields and deep unmineable coal seams
[29]. US Department of Energy’s (DOE) National Energy Technology Laboratory
(NETL) estimates that North America alone has enough geological storage capacity
for 900 years long carbon dioxide (CO2) emissions at current emission rates [30].
Flue gas from power plants is a mixture of several gases in varying proportions.
Combustion of natural gas produces flue gas containing between 3% - 5% carbon
dioxide (CO2), a majority of nitrogen (N2)),excess oxygen (O2), argon (Ar), minute
quantities of nitrogen oxides (NOx)) and water vapor (H2O). Flue gas from coal fired
power plants is composed of between 13% - 15% carbon dioxide (CO2), nitrogen
(N2)),excess oxygen (O2), argon (Ar), minute quantities of nitrogen oxides (NOx)),
sulfur oxides (SOx) as well as water vapor (H2O) [31]. Several methods can be
employed to remove carbon dioxide (CO2) from flue gas. These include physical or
chemical gas absorption using liquid solvents, selective physical or chemical adsorp-
tion on solid adsorbents, membrane separation and cryogenic distillation. Amongst
these, gas absorption using chemical agents like alkanolamines is the most advanced
and commercially preferred method for separating carbon dioxide (CO2) from gas
mixtures. Amine absorption has been used since the 1950s for removal of hydrogen
sulfide (H2S) and carbon dioxide (CO2) from natural gas as a part of a process called
natural gas sweetening. Amine absorption has a favorable performance with both -
feedstocks like natural gas which is supplied at a high pressures of upto 8 Megapascals

4
(MPa) and those at a much lower pressure such as flue gas, which is at atmospheric
pressure [9].
With all its favorable characteristics, a major disadvantage of amine absorption is
the energy intensive nature of this process. In particular, absorbent regeneration in
conventional amine absorption process requires large quantities of low pressure steam
between 350 kilopascal (kPa) - 450 kilopascal (kPa). This energy consumption is
justified in case of natural gas sweetening due to the favorable economics of natural
gas sale. However, the only tangible product of carbon capture is high pressure carbon
dioxide (CO2) - a chemical which will likely command a low market value due to its
large supply and low demand. Thus, it is estimated that when retrofitted with amine
absorption technology for carbon capture; the cost of electricity from conventional
power plants will increase by 21% - 91% [32]. Thus, to make carbon capture and
storage (CCS) economically feasible; significant advances must be made to improve or
modify the amine absorption technology to make it more suitable for carbon capture.
The research presented in this thesis is motivated by a need to optimize the amine
absorption technology to better employ the resources available at a coal-fired power
plant. As discussed above, the conventional amine absorption process requires a large
supply of low pressure steam for carbon dioxide (CO2) desorption. The most con-
venient option at a coal-fired power plant is to draw the steam upstream of the low
pressure (LP) turbine or at one of the suitable steam vent ports along the length of
the turbine. This however, results in the unreasonably large (21%-91%) increase in

5
the cost of electricity (COE) [32]. To overcome this challenge, we have explored the
option of operating the amine absorption process under conditions beyond current
practice. Specifically, we study the effects of varying the operating pressure and tem-
perature in a stripper unit. We have also considered in this study, vacuum strippers,
which make it feasible to use waste heat - very low pressure steam that cannot be used
for electricity generation. Modifications to the operating conditions inevitably affect
other system parameters such as equipment sizing. We have conducted an economic
evaluation to reasonably account for these effects and to determine the most econom-
ical process operating configuration. Finally, we have developed a novel process for
separating carbon dioxide (CO2) from flue gas. The most innovative feature of this
process is its use of a single integrated unit for absorption and stripping instead of
two separate columns. We make use of novel materials called ’ceramic foams’ for
gas-liquid contacting. The latter part of this thesis will be dedicated to elucidating
the research involved in taking the conceptual idea for this process and developing it
to the point of a bench-scale proof-of-concept demonstration.
1.2 Organization
This thesis is divided into seven chapters to clearly organize the work conducted as
a part this dissertation. We begin with a brief discussion of carbon capture and stor-
age (CCS) in Chapter 2. We address the concept of retrofitting existing coal fired
power plants with this technology. We then expand upon our discussion of existing

6
technologies for carbon dioxide (CO2) separation and report the status of current
research towards improving gas absorption technology in Chapter 3. In Chapter
4, we describe the basis for the amine process simulations that were developed to
study the effects of changes in operating conditions. We will also discourse about
our simulation results, comment on system performance under different conditions
and identify the most promising process configurations that are of interest of from
an economics perspective. These research results have been presented at the Ameri-
can Institute for Chemical Engineers (AIChE) conferences and have been published
in the International Journal for Greenhouse Gas Control [33, 34]. Chapter 5 ex-
amines the promising process configurations shortlisted in Chapter 4 by evaluating
the capital and operating costs for the processes. These results have also been pre-
sented at the American Institute for Chemical Engineers (AIChE) conferences and a
manuscript to be submitted to the International Journal of Greenhouse Gas Control
is in the works. In Chapter 6, we will discuss our research on the development of
novel absorbent formulations for carbon dioxide (CO2) removal. These results have
produced a provisional patent application which was filed in October 2012 with the
full application due in late 2013 [35]. Studies conducted to estimate reboiler duty
for aqueous alkanolamine systems blended with alcohol are being written up into a
manuscript. We will elaborate upon the concept of the novel process developed as a
part of this research work in Chapter 7. We discuss the properties of the materials
that have been selected to carry out a bench-scale, proof-of-concept demonstration
7
of this process. Chapter 7 also includes the results of the 2-phase hydrodynamic and
mass transfer studies conducted in a 1-D glass column containing the mass gas-liquid
contacting medium. Details about the design and operation of a plexiglas prototype
developed to conduct 2-phase flow experiments with air and water are listed in Chap-
ter 8. We discuss the design and operation of the stainless steel prototype developed
for a fully functional proof-of-concept demonstration of the process. The results of
this are also described in Chapter 8. Finally, Chapter 9 will contain the scope and
recommendations for future work in this project.
8
Chapter 2
Climate change and carbon capture and storage
2.1 Fossil fuels and climate change
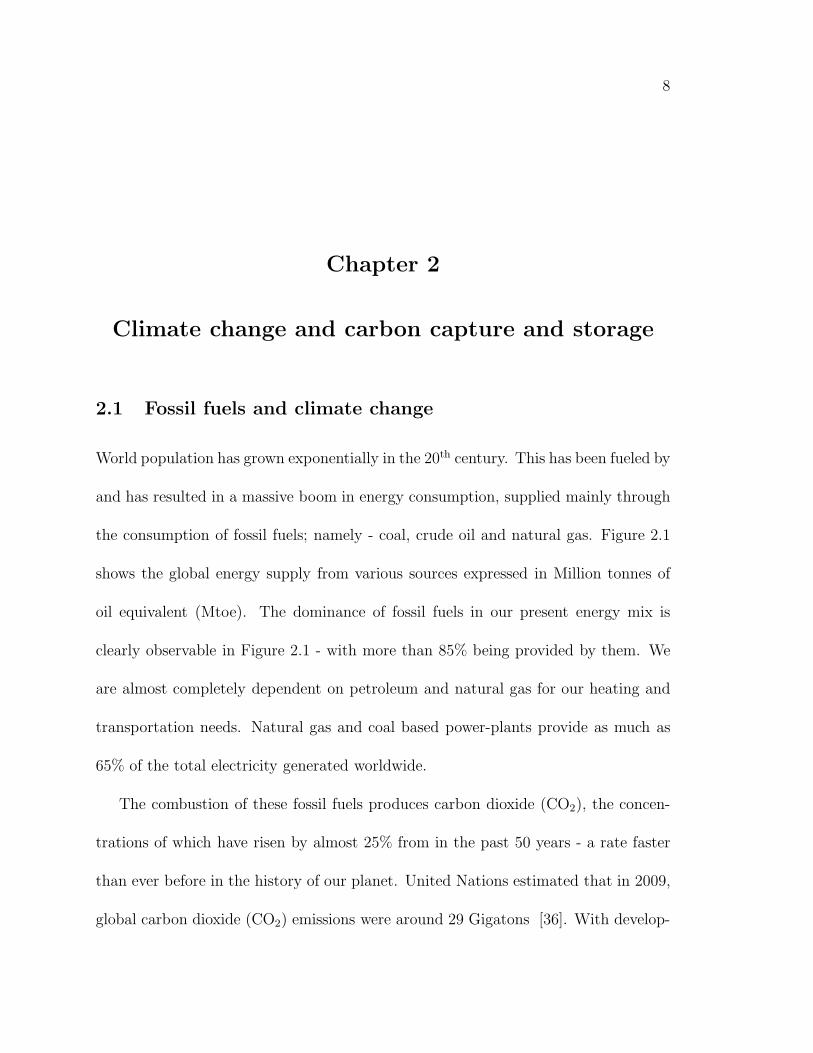
World population has grown exponentially in the 20th century. This has been fueled by
and has resulted in a massive boom in energy consumption, supplied mainly through
the consumption of fossil fuels; namely - coal, crude oil and natural gas. Figure 2.1
shows the global energy supply from various sources expressed in Million tonnes of
oil equivalent (Mtoe). The dominance of fossil fuels in our present energy mix is
clearly observable in Figure 2.1 - with more than 85% being provided by them. We
are almost completely dependent on petroleum and natural gas for our heating and
transportation needs. Natural gas and coal based power-plants provide as much as
65% of the total electricity generated worldwide.
The combustion of these fossil fuels produces carbon dioxide (CO2), the concen-
trations of which have risen by almost 25% from in the past 50 years - a rate faster
than ever before in the history of our planet. United Nations estimated that in 2009,
global carbon dioxide (CO2) emissions were around 29 Gigatons [36]. With develop-

9
Figure 2.1 : World energy consumption in Million tonnes of oil equivalent (Mtoe)
(2011) [1]
ing nations like India, China and Brazil developing economically at a rapid pace, in
the absence of a purposeful change in course; carbon dioxide (CO2) emissions will only
rise further. It is well known that carbon dioxide (CO2) is a greenhouse gas - meaning,
it traps a part of incident solar infrared radiation and prevents it from reflecting back
into space. An increase in atmospheric carbon dioxide (CO2) concentration invariably
results in a rise in global temperatures, which is what has been recorded over the past
50+ years. This phenomenon, along with several associated perturbations in global
weather patterns are collectively termed as ‘global climate change’. Figure 2.2 shows
the rise in atmospheric carbon dioxide (CO2) concentrations along with the global
temperature anomaly - a scientific measure of the departure of global temperatures

10
Figure 2.2 : Growth of atmospheric carbon dioxide (CO2) concentration and global
temperature anomaly over roughly the same time period [2, 3, 4]
from the long-term average.
As seen in Figure 2.2, global temperatures have risen by 0.74oC ± 0.18oC in
the last century and according to the Intergovernmental Panel on Climate Change
(IPCC), they are projected to increase by a further 1.1oC to 2.9 oC over the next
century [4]. While this increase seems minimal and one might even argue that a
slightly warmer world would perhaps be more favorable, the predicted consequences
of this increase are terrifying. Climate change is already resulting in the loss of ice
from our glaciers and polar ice-caps at a faster rate than at which is is replenished each
year. The melting of polar, glacier and sea ice is estimated to contribute to a rise in
sea-level between 18 cm and 59 cm in the 21st century which will result in difficulties

11
at huge coastal settlements which includes world cities like New York,USA; Tokoyo,
Japan and Mumbai, India [26]. The destabilization of polar permafrost is capable of
releasing the massive reserves of methane (CH4) (estimated at 1900 Gigatons) that
are presently trapped as clathrate compounds. Methane (CH4) has 25 times as much
greenhouse effect potential as carbon dioxide (CO2) and studies show that thawing of
permafrost alone could risk a sudden release of upto 50 Gigatons of methane (CH4)
[37].
Rise in temperature is already being linked to an alteration in the global precip-
itation patterns and the increasing instances of flooding and drought conditions in
populated areas of the world. Erratic precipitation behavior will likely have massive
consequences globally since the stability of food production is largely dependent on
the predictable behavior of rainfall. Higher temperatures also favor the formation of
more intense extreme weather phenomena like hurricanes and tornadoes, and at a
greater frequency. They also result in more arid summers and winters, resulting in
higher risk of wildfires; the likes of which are being witnessed all over United States
already. All these outcomes will have adverse effects on human life and the scale of
global economic activity.
2.2 Carbon Capture and Storage
Concerned governments, businesses and agencies have thoroughly studied their op-
tions to mitigate climate change. Figure 2.3 shows one such analysis that shows the

12
Figure 2.3 : Global Greenhouse Gas (GHG) abatement cost curve [5]
estimated cost of reducing carbon dioxide (CO2) emissions by a ton. It shows that
clearly some reduction in the carbon dioxide (CO2) emissions can be achieved by fo-
cusing on better energy efficiency, reforming agricultural and industrial practices and
recycling waste. However, to achieve the target of stabilizing our atmospheric carbon
dioxide (CO2) concentration at 500 ppm by mid-century, before gradually reducing
it; more aggressive strategies need to be adopted. All analysis points towards an in-
evitable, continued dependence on fossil fuels; at least for the next few decades. Large
commercial projects involving alternative energy technologies like biofuels, wind and
solar are currently being initiated, however, it will take more than a few decades for
them to make significant market penetration. This leaves all but one practical option
on the table to shrink our carbon dioxide (CO2) emissions in the short and medium
term - Carbon Capture and Storage (CCS) [5, 32].
13
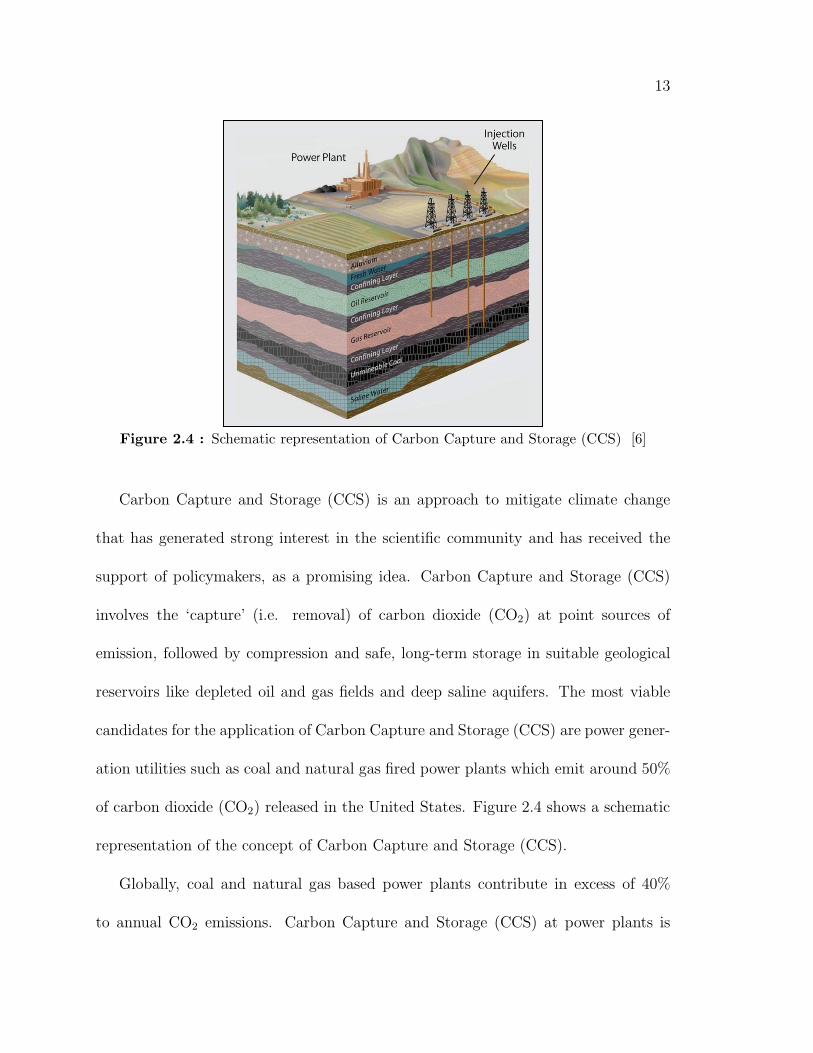
Figure 2.4 : Schematic representation of Carbon Capture and Storage (CCS) [6]
Carbon Capture and Storage (CCS) is an approach to mitigate climate change
that has generated strong interest in the scientific community and has received the
support of policymakers, as a promising idea. Carbon Capture and Storage (CCS)
involves the ‘capture’ (i.e. removal) of carbon dioxide (CO2) at point sources of
emission, followed by compression and safe, long-term storage in suitable geological
reservoirs like depleted oil and gas fields and deep saline aquifers. The most viable
candidates for the application of Carbon Capture and Storage (CCS) are power gener-
ation utilities such as coal and natural gas fired power plants which emit around 50%
of carbon dioxide (CO2) released in the United States. Figure 2.4 shows a schematic
representation of the concept of Carbon Capture and Storage (CCS).
Globally, coal and natural gas based power plants contribute in excess of 40%
to annual CO2 emissions. Carbon Capture and Storage (CCS) at power plants is

14
expected to scale down their emissions by as much as 90%; thus contributing signifi-
cantly towards the goal of limiting atmospheric carbon dioxide (CO2) concentration
goals. Carbon Capture and Storage (CCS) is considered favorably primarily because
it will allow us to continue using fossil fuels while alternative sources gain greater
market share and yet, minimize the impact of the carbon dioxide (CO2) emissions.
As discussed above, Carbon Capture and Storage (CCS) consists of three stages:
• Carbon dioxide (CO2) capture: Separation of carbon dioxide (CO2) from
the flue gas emissions at power plants
• Compression: Compression of carbon dioxide (CO2) to a pipeline pressure
of between 8 and 16 Megapascals (MPa)
• Transport, storage and monitoring (TSM): Transport of compressed carbon
dioxide (CO2) to storage site followed by injection into geological formation and
monitoring for any leaks
We discuss the various aspects of Carbon Capture and Storage in the following
sections.
2.3 Technologies for Carbon Capture
Coal and natural gas are the most common feedstocks used to generate electricity
at thermal power plants. At existing power plants, these fuels undergo combustion
in the presence of excess air to release heat which is used to produce steam and
finally, generate electricity. The combustion of coal and natural gas generates flue

15
gas which typically has a composition of 5–15% carbon dioxide (CO2), 65–75 %
nitrogen (N2), 2–12% oxygen (O2) and 5–15% water vapor (H2O). In addition, there
are small amounts of pollutants like carbon monoxide (CO), oxides of nitrogen and
sulfur (NOx, SOx) and trace quantities of heavy metals like Mercury (Hg) [38].
In carbon capture, carbon dioxide (CO2) in the flue gas is separated using suitable
technology and the ‘decarbonized’ flue gas, consisting mainly of N2 is released into the
atmosphere. Several methods to separate carbon dioxide (CO2) from gas mixtures,
based on different physical and chemical principles have been developed. These are
discussed in detail in the sections below.
2.3.1 Adsorption
The phenomenon of adhesion of gases, liquids or dissolved solids to a surface is called
‘adsorption’. Adsorbents can be naturally occurring materials like coal, charcoal and
certain zeolites or can be synthetically manufactured complex ones like molecular
sieves and metal organic frameworks (MOFs). Gases can be adsorbed physically (i.e.
surface adhesion is supported only by molecular interactions and surface forces) or
chemically (i.e. the adsorbed molecules form chemical bonds with the surface) on
solids to form a film of molecules on the surface. Since the amount of gas adsorbed
on a solid is proportional to the available surface area; highly porous materials with
high specific surface areas act as good adsorbents. Adsorbents can be chemically
treated to increase their capacity as well as their specificity towards a particular com-

16
Figure 2.5 : Schematic representation of adsorption process for carbon dioxide (CO2)
separation from flue gas [7]
ponent that may be present in a gas mixture. In case of carbon capture, carbon
dioxide (CO2) is present in a dilute mixture containing with a ratio of CO2/N2 of
between 1:5 - 1:15. Thus, an adsorbent suitable for carbon capture must possess very
high selectivity towards carbon dioxide (CO2) adsorption. Certain materials like spe-
cially treated activated carbon, some molecular sieves and metal organic frameworks
(MOFs) selectively adsorb carbon dioxide (CO2) on their surface. Such adsorbents
are potential candidates for use in carbon dioxide (CO2) separation. Figure 2.5 shows
a schematic of an adsorptive CO2 separation process.
In a typical adsorptive separation process as represented in Figure 2.5; the gas
mixture is first contacted with the adsorbent in an adsorption column. Operating con-
ditions for the adsorption column are selected on the basis of the inlet gas composition,

17
adsorbent material and the degree of carbon dioxide (CO2) removal desired. After the
adsorbent material is sufficiently saturated with the gas component of interest, it is
regenerated. For adsorptive gas separation, two operational configurations have been
commercialized and are commonly used. These are pressure swing adsorption (PSA)
- saturated adsorbent is regenerated by reducing the system pressure which results in
desorption of gases and temperature swing adsorption (TSA) - saturated adsorbent is
regenerated by providing thermal energy to destabilize the adsorbate-surface bonds
and release it. Adsorption is considered the technology of choice to recover trace
amounts of contaminants or high-value components of gas streams. It is also favored
when the feed gas stream is available at a high pressure.
2.3.2 Cryogenic separation
Distillation is an unit operation commonly performed to separate liquid mixtures
based on differences in the volatility of their components. By liquefying flue gas
through cooling and condensation, it is possible to separate carbon dioxide (CO2) from
other components of the flue gas. This process is called cryogenic distillation. The
scientific basis of cryogenic separation is that when a gas mixture composed primarily
of carbon dioxide (CO2) and nitrogen (N2)is steadily cooled, the CO2 condenses to
form a liquid while N2 remains a gas. The vapor phase consisting mainly of nitrogen
(N2) can be allowed to escape and the liquid carbon dioxide (CO2) transported for
compression and storage. Cryogenic distillation is quite popular for separating carbon

18
Figure 2.6 : Schematic representation of cryogenic separation process for carbon dioxide
(CO2) separation from flue gas [7]
dioxide (CO2) from concentrated feed gas streams ((CO2) concentration: 90% and
above). A schematic representation of cryogenic distillation process is shown in Figure
2.6.
2.3.3 Membrane separation
Membrane separation has been successfully established as an approach for separat-
ing single components of interest from gas mixtures. The petroleum industry has
been using polymeric membranes for separation of carbon dioxide (CO2) from light
hydrocarbons in natural gas. Metallic membranes have been used for recovering un-
reacted hydrogen (H2) from ammonia (NH3) produced in Haber’s process. A variety
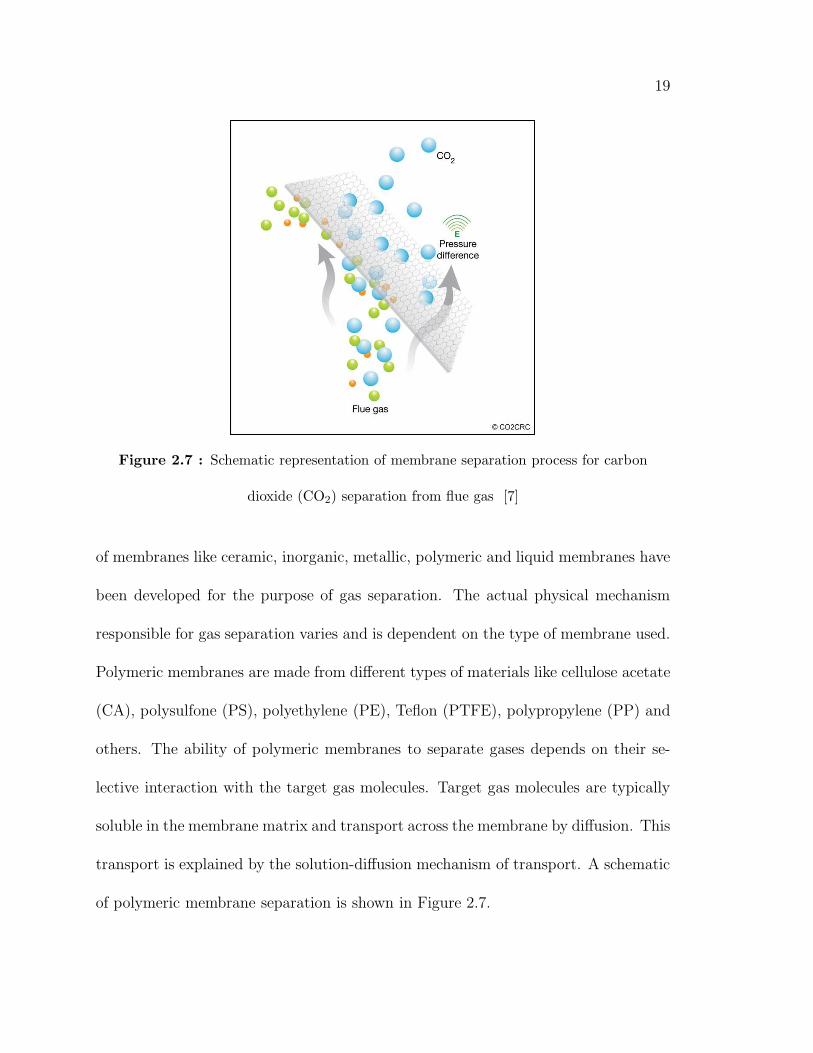
19
Figure 2.7 : Schematic representation of membrane separation process for carbon
dioxide (CO2) separation from flue gas [7]
of membranes like ceramic, inorganic, metallic, polymeric and liquid membranes have
been developed for the purpose of gas separation. The actual physical mechanism
responsible for gas separation varies and is dependent on the type of membrane used.
Polymeric membranes are made from different types of materials like cellulose acetate
(CA), polysulfone (PS), polyethylene (PE), Teflon (PTFE), polypropylene (PP) and
others. The ability of polymeric membranes to separate gases depends on their se-
lective interaction with the target gas molecules. Target gas molecules are typically
soluble in the membrane matrix and transport across the membrane by diffusion. This
transport is explained by the solution-diffusion mechanism of transport. A schematic
of polymeric membrane separation is shown in Figure 2.7.
20
Unlike polymeric membranes, ceramic and metallic membranes are typically porous.
Ceramic membranes are commonly manufactured from oxides of metals like aluminum
(e.g., Al2O3), silicon (e.g., SiO2), titanium (e.g., TiO2) and zirconium (e.g., ZrO2).
Metallic membranes are commonly made of noble metals like platinum (Pt) and pal-
ladium (Pd). Depending on the sizes of pores in the membrane, the gas molecules
either permeate through the membrane or get blocked. Thus, in principle the mem-
branes act like sieves to separate the gas molecules based on their sizes. Both metallic
and ceramic membranes are stable at high temperatures. In addition, ceramic mem-
branes are chemically inert and can be used in extreme environments of high acidity
or basicity, where polymeric or metal membranes fail to function efficiently. Due to
the inherent nature of the process which relies on the differences in the physical prop-
erties of the gases being separated, membrane separation is favored in systems where
there is a large contrast in the properties of the components of the mixture. As with
adsorption, high feed gas pressure is a requirement for membrane separation in order
to handle realistic gas flow rates (since diffusion mechanisms are slow).
2.3.4 Absorption
Absorptive separation processes rely on the affinity of liquid absorbents for one com-
ponent over others in a gas mixture. Gas absorption is by far the most widely used
method for carbon dioxide (CO2) separation from gas mixtures. Gases can be ab-
sorbed into liquids by two different mechanisms, namely - physical and chemical

21
Figure 2.8 : Schematic representation of gas absorption (alkanolamine) separation
process for carbon dioxide (CO2) separation from flue gas [7]
absorption. Physical absorption involves the dissolution of gases into liquids without
an accompanying chemical reaction. Chemical absorption on the contrary involves
binding of the absorbed gas molecules into the liquid by the formation of reaction
products between the gas and the absorbent chemical. Physical and chemical ab-
sorbents are used extensively in the chemical industry. SelexolR© - a proprietary
mixture of dimethyl ethers of polyethylene glycol and RectisolR© - essentially refrig-
erated methanol are two physical absorption processes have been used to separate
carbon dioxide (CO2) from syngas produced by coal and biomass gasification. The
petroleum industry has used alkanolamines for a long time in natural gas sweeten-
ing by removal of carbon dioxide (CO2) and hydrogen sulfide (H2S). Figure 2.8 is a
schematic representation of a typical alkanolamine absorption process.

22
Physical absorption processes are typically operated at high pressures (300 - 2000
psia) as the amount of gas dissolved in liquids is proportional to the partial pressure
of the component of interest in the gas phase (i.e. Henry’s law). Solvents with high
dissolution capacity for the gas components of interest are ideal choices for physical
absorption processes. Chemical absorption on the contrary is a favored process when
the feed stream is at a relatively low pressure. Thus, the alkanolamine process using
aqueous monoethanolamine (MEA, C2H7NO), diethanolamine (DEA, C4H11NO2),
diglycolamine (DGA, C4H11NO2)and other chemicals is the preferred technology for
removal of carbon dioxide (CO2)and hydrogen sulfide (H2S)from natural gas.
2.4 Carbon dioxide (CO2), compression, storage and moni-
toring
Carbon dioxide (CO2) separated from flue gases is compressed to a pipeline pressure
between 8 and 16 Megapascals (MPa) and transported to the storage site [29]. The
compressed carbon dioxide (CO2) is injected into suitable geological formations either
for storage or applications such as enhanced oil recovery (EOR). Different geological
formations have been identified and their carbon dioxide (CO2) storage capacity eval-
uated. Depleted oil and gas fields are considered as the primary storage sites. The
storage capacity for these reservoirs is estimated at between 675 and 900 Gigatons
(Gt) of carbon dioxide (CO2) [29]. In addition to their substantial storage capac-
ity, the petroleum industry has also developed detailed understanding of petroleum

23
reservoirs geology. This is critical towards analyzing and monitoring the risk associ-
ated with the storage of enormous quantities of carbon dioxide (CO2) into geological
formations. An application of captured carbon dioxide (CO2) which is gaining ap-
preciable support from all quarters is enhanced oil recovery (EOR) which will help
recover greater amounts of oil from depleted oil fields and partly offset the involved
costs.
Other potential reservoirs for captured carbon dioxide (CO2) include coal deposits
that are either too thin or lie too deep to be mined economically. These are collectively
classified as unminaeble coal seams. The storage capacity of unmineable coal seams
is expected to be between 15 and 200 Gigatons (Gt) of carbon dioxide (CO2). Saline
aquifers - formations that contain highly mineralized brine and are considered of no
benefit to humans are considered to be another massive potential carbon dioxide
(CO2) sink. However, a better understanding of the geology of such formations needs
to be developed first.
2.5 Challenges with Carbon Capture and Storage
Carbon capture and storage (CCS) presents a unique opportunity to make a smooth
transition from carbon-based energy to alternative energy sources like nuclear, so-
lar and wind while minimizing the impact of the associated carbon dioxide (CO2)
emissions. Several gas separation methods and technologies are available for the
removal of carbon dioxide (CO2) from gas mixtures. However, amongst these; the

24
alkanolamine absorption process is the closest to a ready-to-deploy method for carbon
dioxide (CO2) capture. However, while it is the closest in terms of scale and the gas
conditions to be handled; it isn’t optimized for post-combustion carbon capture. The
alkanolamine absorption process is very energy intensive, requiring massive quantities
of low pressure steam (60-75 psia) to regenerate the chemical absorbent. This makes
the existing process extremely costly to implement for carbon dioxide (CO2) removal
at fossil fuel based power plants.
A typical 500 Megawatt (MW) power plant emits around 10,000 tonnes/day of
carbon dioxide (CO2) and around 70,000 tonnes/day of flue gas [39]. Even with
the use of state-of-the-art amine absorption technology to for carbon capture; the
cost of electricity is projected to increase by between 43%–88% [29]. Other untested
technologies are projected to result in an even higher increase the cost of electricity.
Application of alkanolamine absorption technology for carbon capture will result in
the consumption of a part of the steam produced and the electricity generated at the
power plant to regenerate the absorbent and operate the process auxilliaries. The
cumulative loss in the power plant output due to carbon capture is called ‘parasitic
power load’. It is estimated that application of current amine absorption process to
a 500 MW plant would a parasitic load of around 115 MW, resulting in almost 23%
reduction in the net electricity output of the power plant [40]. This reduction in
energy output, along with the capital expenditure involved in the design and con-
struction of the carbon capture and compression units results in an increase in the

25
cost of electricity produced. Carbon dioxide (CO2) absorption and compression to-
gether account for between 90%–95% of the carbon capture and storage (CCS) cost.
The share of the absorption process is the dominant one and accounts for 85%–90%
of the total cost increase [40].
The National Energy Technology Laboratory (NETL), a science, technology and
energy laboratory owned and operated by US Department of Energy (DoE) is coordi-
nating the US government’s carbon capture and sequestration (CCS) program. The
targets set for the NETL program on post-combustion carbon capture and storage
(CCS) are 90% CO2 capture with no more than 35% increase in the cost of electricity
(CoE) as compared to an existing coal-based power plant without carbon capture
[40]. For NETL targets for carbon capture and storage (CCS) to be realized; im-
mediate breakthroughs in technology will be required so that the energy penalties in
separation processes can be reduced significantly.

26
Chapter 3
Amine absorption technology: technical
description and current research
3.1 Amine absorption technology
3.1.1 Original development
Alkanolamine (amine) absorption is an old technology. Triethanolamine (TEA), the
first alkanolamine to become commercially available; was used in early gas-treating
plants in the 1930s [9]. As other alkanolamines like monoethanolamine (MEA), di-
ethanolamine (DEA), methyldiethanoamine (MDEA) and diglycolamine (DGA) be-
came commercially available; the slower reacting triethanolamine (TEA) was gradu-
ally displaced from commercial operation. Even after 80+ years, amine absorption
continues to be the technology of choice for natural gas sweetening in large parts due
to the extensive amounts of design and operational data available for the process and
due to its effectiveness in removing carbon dioxide (CO2) and hydrogen sulfide (H2S)
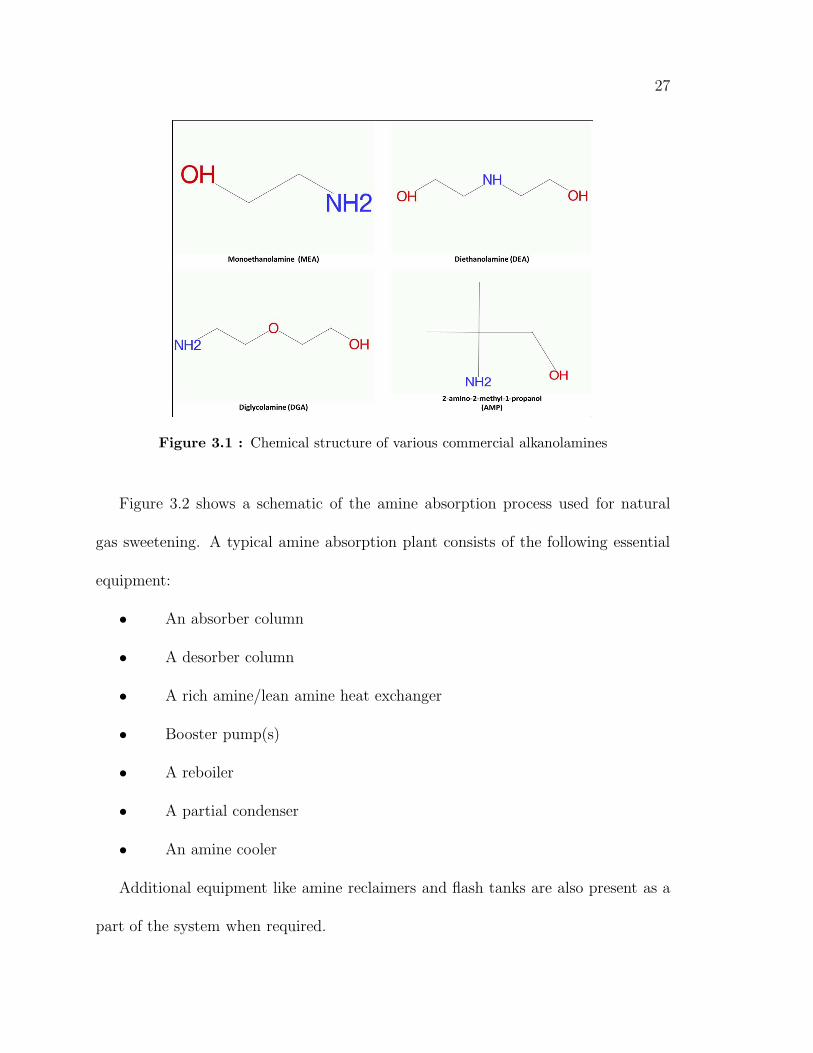
under a wide range of feed conditions. Figure 3.1 shows the chemical structure for
four different alkanolamines.
27
Figure 3.1 : Chemical structure of various commercial alkanolamines
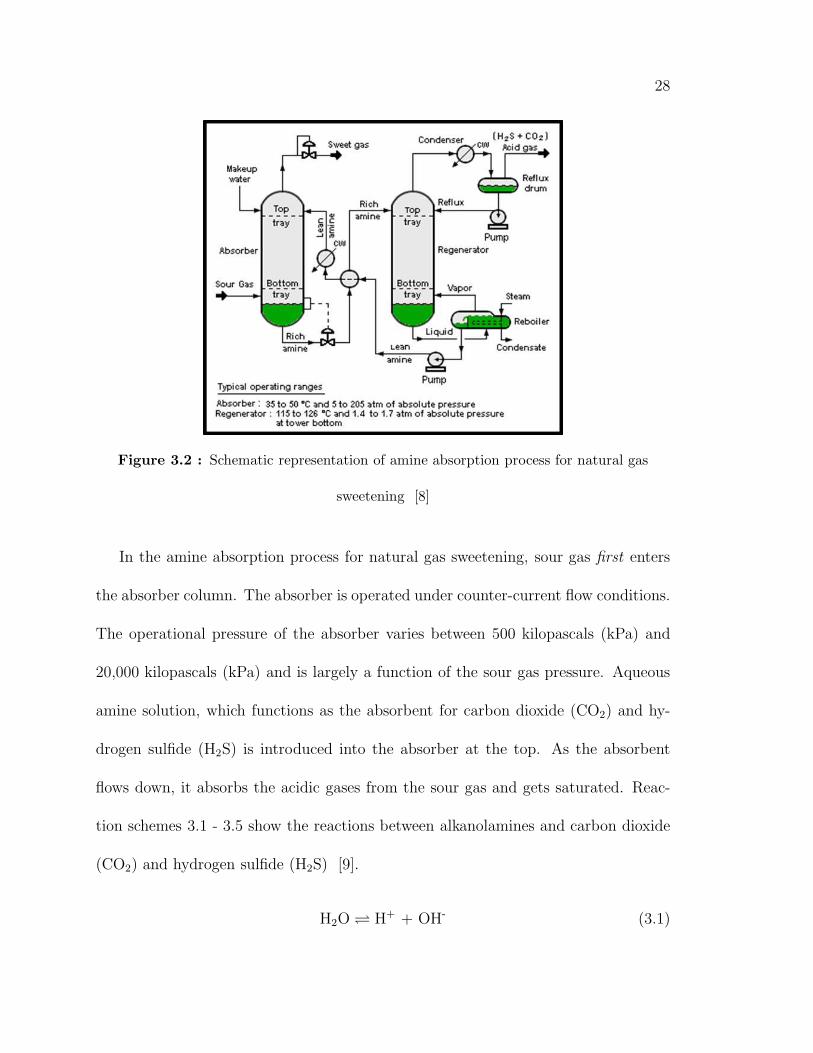
Figure 3.2 shows a schematic of the amine absorption process used for natural
gas sweetening. A typical amine absorption plant consists of the following essential
equipment:
• An absorber column
• A desorber column
• A rich amine/lean amine heat exchanger
• Booster pump(s)
• A reboiler
• A partial condenser
• An amine cooler
Additional equipment like amine reclaimers and flash tanks are also present as a
part of the system when required.
28
Figure 3.2 : Schematic representation of amine absorption process for natural gas
sweetening [8]
In the amine absorption process for natural gas sweetening, sour gas first enters
the absorber column. The absorber is operated under counter-current flow conditions.
The operational pressure of the absorber varies between 500 kilopascals (kPa) and
20,000 kilopascals (kPa) and is largely a function of the sour gas pressure. Aqueous
amine solution, which functions as the absorbent for carbon dioxide (CO2) and hy-
drogen sulfide (H2S) is introduced into the absorber at the top. As the absorbent
flows down, it absorbs the acidic gases from the sour gas and gets saturated. Reac-
tion schemes 3.1 - 3.5 show the reactions between alkanolamines and carbon dioxide
(CO2) and hydrogen sulfide (H2S) [9].
H2O ⇋ H+ + OH- (3.1)

29
H2S ⇋ H+ + HS- (3.2)
CO2 + H2O ⇋ HCO3- + H+ (3.3)
RNH2 + H+⇋ RNH3
+ (3.4)
RNH2 + CO2 ⇋ RNHCOO- + H+ (3.5)
When amines react with hydrogen sulfide (H2S), they form a salt with the bisulfide
ion (HS-) - a product of hydrogen sulfide (H2S) dissociation. The reaction between
amines and carbon dioxide (CO2) is more complex. Primary and secondary amines
react with carbon dioxide (CO2) to form a carbamate as explained in reaction 3.5. At
higher carbamate saturations, a significantly slower reaction takes place which results
in the formation of a bicarbonate. Tertiary amines cannot form carbamates and thus,
undergo the slower bicarbonate formation reaction.
The reaction between amines and carbon dioxide (CO2) and hydrogen sulfide
(H2S) is exothermic, which results in a constant change in the temperature of the
absorbent throughout its flow in the column. Figure 3.3 shows the temperature and
carbon dioxide (CO2) removal profile in a column operating at 7000 kilopascals (kPa)
with 22 wt% monoethanolamine (MEA) as the absorbent. The aqueous amine solu-
tion, loaded with acidic gases exits the absorber column at the bottom; at a temper-
ature of around 65oC. This amine solution with high acid gas saturation (henceforth
referred as ‘rich amine solution’) flows to a heat exchanger unit commonly referred
to as the lean/rich amine heat exchanger. The heat exchanger contacts the hot re-
generated amine solution coming from the reboiler and the cold rich amine from the

30
Figure 3.3 : Temperature and acid gas removal profiles in an absorber column
absorber. The heated rich amine solution subsequently flows to the desorber column.
Desorbers are typically operated at a pressure ranging between 150 kilopascals (kPa)
and 200 kilopascals (kPa) and a temperature ranging between 105oC and 120oC. The
heated rich amine solution enters the desorber at temperatures close to 100oC and
undergoes heating after entering it. In order to regenerate the absorbent, it must be
stripped of the absorbed acid gases by breaking the amine - acid gas complexes. The
energy required to heat the rich amine and drive the endothermic desorption reactions
is provided by low pressure steam provided to a reboiler located at the base of the
desorber. Supplied steam is typically in a pressure range of 400 kilopascals (kPa) -
500 kilopascals (kPa) and a temperature of 200oC and 250oC. The actual carrier for
thermal energy in the desorber is the stripping vapor - primarily steam; generated by

31
Figure 3.4 : Temperature and absorbent regeneration profiles in a desorber column
evaporating a fraction of the amine solution. The stripping vapor exits the desorber at
the top, along with the liberated acid gases and enters a partial condenser where the
stripping vapor is condensed and returned to the desorber column as a reflux stream.
The acid gases maybe released into the atmosphere or sent to a Claus process plant
for desulfurization of the hydrogen sulfide (H2S). Figure 3.3 shows the temperature
profile and the gradual regeneration of acid gas loaded monoethanolamine in a des-
orber column operating at 190 kilopascals (kPa). The regenerated amine leaves the
lean/rich amine heat exchanger in the vicinity of 60oC and undergoes further cool-
ing in an amine cooler to bring down its temperature to around 40oC, which is the
optimum inlet temperature for the process.
Several alkanolamines are considered practical in today’s commercial operations.

32
Figure 3.5 : Heat of reaction for 4 different alkanolamines [9, 10]
These include but are not limited to monoethanolamine (MEA), diethanolamine
(DEA), diglycolamine (DGA), methyldiethanolamine (MDEA) and diisopropylamine
(DIPA). In addition, several commercial operators prefer to operate blended alka-
nolamines; wherein, a secondary amine such as diethanolamine (DEA) - a slower re-
acting amine with a low heat of reaction is ‘activated’ with a faster reacting primary
amine such as monoethanolamine (MEA) or piperazine (PZ). Studies have shown that
blended amines may have advantages in reducing reboiler energy duty as compared
to single amines [41].
Figure 3.5 and 3.6 show the heat of reaction and the reaction rate for 4 differ-
ent alkanolamines. Monoethanolamine (MEA) and diglycolamine (DGA) are pri-
mary amines, diethanolamine (DEA) is a secondary amine and 2-amino-2-methyl-1-

33
Figure 3.6 : Reaction rate at 25oC for different alkanolamines [11, 12]
propanol (AMP) is a primary amine, albeit with a bulky side group which results in
steric hindrance that destabilizes the carbamate. Comparing figures 3.5 and 3.6 shows
a clear trend that faster reacting amines also have higher heat of reaction. An inter-
esting feature revealed in this comparison, however, is that whereas diethanolamine
(DEA) and 2-amino-2-methyl-1-propanol (AMP) have a reaction rate less than half
that of monoethanolamine (MEA) and diglycolamine (DGA), their heats of reaction
are not proportionally smaller. The heat of reaction for diethanolamine (DEA) is
only 20% smaller than that of monoethanolamine (MEA). Thus, when selecting the
absorbent; careful consideration is typically given to the composition and proper-
ties of the feed gas, particularly the ratio of the acidic gases and the economics of
constructing and operating the gas processing unit.
34
Almost all columns used in gas sweetening operation are constructed with carbon
steel. Alkanolamine systems, particularly those which involve the handling of natural
gas rich in carbon dioxide (CO2) are particularly susceptible to corrosion problems.
These problems are known to become more severe with an increase in the amine
concentration, the acid gas loading of the amine solution and the temperature. The
use of corrosion inhibitor chemicals is common practice to prevent or reduce the rate of
equipment corrosion. It is however, standard practice to operate the amine absorption
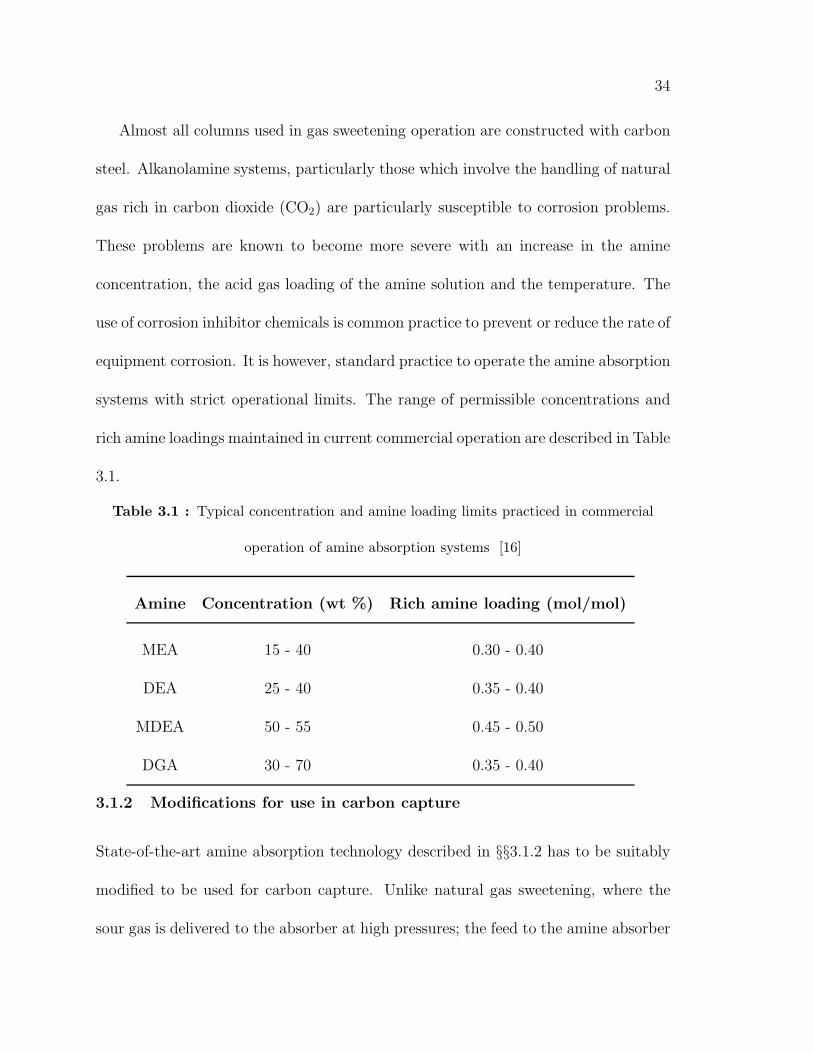
systems with strict operational limits. The range of permissible concentrations and
rich amine loadings maintained in current commercial operation are described in Table
3.1.
Table 3.1 : Typical concentration and amine loading limits practiced in commercial
operation of amine absorption systems [16]
Amine Concentration (wt %) Rich amine loading (mol/mol)
MEA 15 - 40 0.30 - 0.40
DEA 25 - 40 0.35 - 0.40
MDEA 50 - 55 0.45 - 0.50
DGA 30 - 70 0.35 - 0.40
3.1.2 Modifications for use in carbon capture
State-of-the-art amine absorption technology described in §§3.1.2 has to be suitably
modified to be used for carbon capture. Unlike natural gas sweetening, where the
sour gas is delivered to the absorber at high pressures; the feed to the amine absorber

35
in a carbon capture system is power plant exhaust - flue gas, at atmospheric pres-
sure. In order to provide sufficient fluid head to overcome the pressure drop in the
absorber column, a flue gas blower is installed upstream of the absorber. Even with
the additional pressure, it is only economical to operate the absorber at around 150
kilopascals (kPa). The low operating pressure has another significant consequence - a
low partial pressure for carbon dioxide (CO2); the effects of which can be observed in
the reaction rates, especially for the slower reacting amines like methyldiethanolamine
(MDEA) and 2-amino-2-methyl-1-propanol (AMP). A more important difference gas
sweetening and carbon capture though is the nature of the application itself. Natural
gas sweetening is an essential step before any sour natural gas can be sold to indus-
trial or residential consumers. Thus, the output of the gas sweetening operation is a
value-added product which attracts revenue. Carbon capture on the contrary, in the
current regulatory environment is similar to a tax; one that is an economic burden
on the energy producers. For this reason, carbon capture demands a much tighter
optimization of all available resources - capital, space, materials and energy than gas
sweetening.
3.1.3 Remaining challenges
As discussed in §§3.1.2, the amine absorption process is energy intensive; requiring low
pressure steam at 400 - 500 kilopascals (kPa) for continuous operation. At an existing
pulverized coal (PC) power plant, the most convenient source of steam under current
36
setup is located upstream of the low pressure (LP) turbine. Drawing steam from
the turbine system, however, will result in a decrease in the power plant electricity
output. This loss of generation capacity along with the parasitic electric load of the
process auxillaries like pumps, blowers and compressors will result in a net increase
in the cost of electricity (CoE). It is estimated that the use of current technology
at an existing coal-fired power plant will result in a 42 - 66 % increase in the cost
of electricity (CoE) [42]. This includes the contributions of both the capital and
operating expenses of the carbon capture process. This extent of increase in cost of
electricity is considered unacceptable for economic reasons. Hence, researchers across
the globe are engaged in developing solutions aimed at minimizing or eliminate any
increase in cost of electricity (CoE) associated with carbon capture. In §3.2, we
discuss the scope and development of current research work.
3.2 Current research and development
Current research on amine absorption technology for carbon capture can be classified
to be focusing on two broad themes as described below:
• Developing better absorbents
• Process intensification
In the following subsections, we discuss some of the research developments that
are most relevant to the research conducted as a part of this dissertation research.
37
3.2.1 Better absorbents
Several physical and chemical properties are of importance when selecting an ab-
sorbent for the amine absorption process. Desirable characteristics include a low
molecular weight, high reaction rate and a low heat of reaction; whereas the undesir-
able ones are high cost, high volatility, corrosivity and toxicity. Primary amines such
as monoethanolamine (MEA) and diglycolamine (DGA) have high reaction rates -
significantly higher than those for secondary amines like diethanolamine (DEA). How-
ever, primary amines also have a higher heat of reaction as compared to secondary
amines; which adversely affects the reboiler duty. Monoethanolamine (MEA) has a
significantly higher volatility than other amines, which, in addition to its corrosiv-
ity; limits the absorbent concentration used in commercial operation. One of the
main focal points for research on carbon capture has been to develop absorbents with
reasonably fast reaction kinetics while maintaining a low heat of reaction [9].
Mitsubishi Heavy Industries (MHI) have developed their proprietary hindered
amines (KS-1, KS-2 and KS-3), which are claimed to result in a significantly lower
reboiler duty than monoethanolamine (MEA). Hindered amines are primary amines
with bulky side groups which lead to substantial destabilization of the amine car-
bamate, resulting in a closer approach to the 1:1 stoichiometry which results in the
formation of the amine bicarbonate. Carbamate instability results in a lower heat of
reaction than the comparable primary amines - a favorable characteristic. However,
the large side groups and unstable intermediates also result in thermodynamic con-

38
ditions which cause slower reactivity between the amine and carbon dioxide (CO2).
Mitsubishi Heavy Industries have reported a steam consumption for KS-1 that is 30%
lower than that for monoethanolamine (MEA) [43].
Researchers at the University of Texas at Austin have been actively studying the
use of piperazine to increase the reactivity of slower reacting amines and bicarbonates.
Piperazine (C4H10N2) is a cyclic diamine. Although a weak base itself, piperazine has
a reactivity that is orders of magnitude higher than that of primary amines such as
monoethanolamine (MEA) and diglycolamine (DGA) [44]. One approach adopted
by the researchers involves the use of potassium carbonate (K2CO3) solutions blended
with small quantities of piperazine. Potassium carbonate reacts with carbon dioxide
(CO2) to form potassium bicarbonate (KHCO3). The reaction between potassium
carbonate and carbon dioxide (CO2) is slow, which makes it infeasible to use aqueous
solutions of this salt by itself. However, the addition of piperazine promotes the
reaction and depending on the conditions, can result in rates that are 2x - 3x higher
than those for 30 wt% monoethanolamine (MEA) [45, 46]. One of the more recent
efforts by the group involves the use of aqueous piperazine for carbon dioxide (CO2)
absorption. As discussed above, reaction kinetics studies with 0.6 M and 2.0 M
solutions of piperazine have shown it to react significantly faster than commonly
used primary amines. Although the use of aqueous piperazine hasn’t yet progressed
beyond pilot plant studies, it is estimated that the reboiler energy duty for piperazine
is around 10% lower than for 30 wt% monoethanolamine (MEA) [47].
39
A very novel alternative to conventional absorbents has been presented with the
invention of ionic liquids. Ionic liquids are salts that exist in a molten state at room
temperature and thus have a very different set of physiochemical properties than
conventional absorbents like alkanolamines which are all organic compounds with co-
valent bonds. Ionic liquids possess some very favorable features, the most notable
ones being low volatility, high conductivity, high thermal stability and favorable sol-
vating properties for a wide range of both polar and non-polar compounds. Carbon
dioxide (CO2) exhibits an exceptional solubility in numerous ionic liquids (ILs) and
hence they are potential absorbents for its removal from flue gases. Several research
groups in both academic and industrial settings are active in ionic liquid research.
Researchers at Clarkson University, University of Tennessee and Oak Ridge National
Laboratory (ORNL) investigated the use of ionic liquids for separation of carbon
dioxide (CO2)/ nitrogen (N2) mixtures. Amongst the ionic liquids (ILs) examined,
1-butyl-3-methyl imidazolium bis[trifluoromethylsulfonyl] amide had the highest se-
lectivity of 127 and a Henry’s law constant (H) of 35 bar [48]. Researchers at Queen’s
University in Canbada and Georgia Institute of Technology synthesized a novel sol-
vent which could be switched between a non-polar, non-ionic liquid and a polar ionic
liquid by changing the atmosphere composition. They reported that a 1:1 mixture of
1,8-diazabicyclo-[5.4.0]-undec-7-ene (DBU) and 1-hexanol could be switched between
a non-ionic and ionic liquid by addition and removal of carbon dioxide (CO2) from
its atmosphere. Thus, in an atmosphere composed mainly of carbon dioxide (CO2);

40
the ionic liquid existed while under an atmosphere of nitrogen (N2) it reverted back
to the non-ionic form. This absorbent thus introduced a different class of absorbents
which don’t require heat to be supplied for regeneration [49]. Much research has
been conducted in the field of ionic liquids since then with a focus on developing ionic
liquids consisting of single salts, high carbon dioxide (CO2) uptake capacity and low
energy requirement for regeneration [50].
3.2.2 Process intensification
While selection of a good absorbent is of critical importance to the success of a gas
separation process based on physical or chemical absorption, process configuration,
operation and resource utilization are of equal importance. As discussed before, amine
absorption technology has been in use for a long time. However, carbon capture as a
target application is significantly different both in terms of resource availability and
separation challenges. Thus, researchers have concentrated their focus on themes like
process intensification, optimization and developing novel separation processes.
Researchers at University of Texas at Austin conducted simulation studies using
AspenPlus to explore the performance of the amine absorption process using novel
stripper configurations and operating conditions. As discussed in §§3.1.1, conven-
tionally stripper columns have been operated between 150 kilopascals (kPa) and 200
kilopascals (kPa). The limiting factor in operating stripper columns at higher pres-
sures is the thermal degradation of absorbents as well as equipment corrosion; both

41
of which worsen with an increase in the pressure and thus, the temperature. Develop-
ment of novel absorbent formulations that are thermally stable at higher temperatures
and use of corrosion inhibitors could potentially make it feasible to operate stripper
columns at higher pressures than today. Based on this rationale, researchers explored
system performance for stripper units operating at a higher pressure of 300 kilopascals
(kPa). They found that operating at higher stripper pressures resulted in a reduced
reboiler duty. In addition to high pressure strippers, they studied the viability of using
vacuum strippers for carbon capture application. Vacuum strippers are an interest-
ing possibility since they operate at lower temperatures than conventional strippers
and open the possibility of using alternative energy sources such as waste heat, for
absorbent regeneration. The team of researchers at University of Texas studied the
performance of a vacuum stripper at 30 kilopascals (kPa) and found that although
the stripping operation itself was feasible; under the selected operating conditions,
the compression costs were infeasible [51, 52, 53].
Ammonia can be considered the simplest of all amines and thus, the most basic
and most reactive. It has been long considered a theoritically superior substitute
to the conventional alkanolamines used for carbon dioxide (CO2) absorption. How-
ever, the use of ammonia in an absorption process poses very unique cchallenges; the
most important of which is its extremely high volatility even at room temperature
and potential problems with the solubility of ammonium bicarbonate formed by the
reaction between ammonia and carbon dioxide (CO2). Researchers at Alstom, how-

42
ever, were able to make a breakthrough into the use of aqueous ammonia solution
as an absorbent with the development of their patented ‘chilled ammonia process’.
Like the conventional alkanolamine process, the chilled ammonia process has an ab-
sorber and a stripper column. However, to minimize the loss of ammonia through
vaporization; the absorber is operated at a low temperature - between 2oC - 10oC.
These below atmospheric temperatures are maintained with the use of a dedicated
refrigeration unit which cools the absorber column. In addition, the process requires
the use of additional equipment to reclaim ammonia escaping with the decarbonized
flue gas [54, 55]. The reboiler steam requirement for the chilled ammonia process
has been found to be comparable to that for monoethanolamine (MEA). However,
due to higher reactivity and a reaction stoichiometry of 1:1 for the ammonia - carbon
dioxide (CO2) reaction; Alstom researchers believe that cost savings are achievable
through smaller equipment and requirements for lesser absorbent chemicals.
Amidst efforts to modify the amine absorption process to make it more suitable for
carbon capture application have been attempts to develop novel processes aimed at
achieving cost savings by challenging conventional process configurations. One such
notable effort was advanced by researchers at the Research Institute of Innovative
Technology for the Earth (RITE) in Kyoto, Japan. They challenged the conventional
setup of the amine absorption process which involves a separate absorber and stripper
column and instead used a porous polymeric membrane such as a hollow fiber as
the support to achieve both absorption and desorption. Early iterations of the the

43
‘membrane flash process’ involved co-current gas and liquid flow through a hollow
fiber membrane. As the liquid flowed vertically upwards through the membrane, it
absorbed carbon dioxide (CO2) from the flue gas and simultaneously permeated out
through the membrane. A combination of higher temperature and vacuum maintained
on the exterior of the membrane resulted in release of the absorbed carbon dioxide
(CO2) through flashing. Since the process effectively employed vacuum stripping,
absorbent regeneration was at a lower temperature and permitted the use of waste
heat. As the process was developed further, scalability became a greater factor and
the researchers decided to separate the absorber from the desorber. In the modified
configuration, absorption still took place in a conventional column but to desorb the
carbon dioxide (CO2) a flash tank was used. Energy consumption for the membrane
flash process was estimated at around 1.8 Gigajoules/ton-CO2, significantly lower
than that for monoethanolamine (MEA) [56, 57].
3.3 Scope for advancing carbon capture research
The discussion in §3.2 explains about current research initiatives to advance gas
absorption technology to reduce the cost of carbon capture. However, few technologies
have been commercialized. The main hindrance towards the commercialization of
these novel processes has been cost - none of them has been successful in bringing a
serious reduction in the cost of carbon capture. Major and minor problems can be
identified with all the technologies discussed in previous sections; some of the more

44
prominent ones are discussed here.
Potassium carbonate promoted by piperazine was found to be a promising ab-
sorbent in lab studies. However, researchers at the University of Texas at Austin
observed several incidents of foaming behavior with the absorbent in pilot plant stud-
ies [58]. Foaming problems in columns result in reduced mass transfer efficiency
along with operational issues. Hence, absorbents susceptible to foaming problems
are typically considered inferior to comparable non-foaming alternatives. Piperazine,
which is currently promoted by University of Texas as a 2nd generation amine, capa-
ble of replacing monoethanolamine (MEA) suffers suffers from potential operational
problems. Piperazine as well as the products of its reactions with carbon dioxide
(CO2) have limited solubility in water. This requires the operation of the absorption
process within relatively strict tolerances to avoid the precipitation of salts which
can result in equipment scaling and other problems. Additionally, piperazine does
not biodegrade and is reported to form nitrosamines when in contact with nitrogen
oxides (NOx) [59]. Ionic liquids are currently at early stages of development and
it will require significant amounts of optimization, lab and pilot scale testing before
industrial operators adopt them for use.
We have previously discussed the potential for achieving energy savings by mod-
ifying the operating conditions for the amine absorption process. Further, operating
the stripper unit under vacuum create opportunities to use waste heat; which can sig-
nificantly reduce economic costs. However, when researchers at University of Texas

45
studied the performance of the amine absorption process utilizing a vacuum strip-
per operating at 30 kilopascals (kPa); they concluded that the process was infeasible
due to enormous compression costs and decided not to pursue further research. This
conclusion, however, has been drawn based on a few unrealistic assumptions. In
their work, the researchers assumed that because the vacuum stripper was operating
at 30 kilopascals (kPa); separated carbon dioxide (CO2) would be delivered to the
compression train at the same pressure. Thus, it seems to have been assumed that
vacuum pumps will be used in an industrial-scale stripper column - an impractical
proposition. Further, an operating pressure of 30 kilopascals (kPa) itself is low and it
may be possible to operate under vacuum but much closer to atmospheric pressure.
Thus, a more complete study is required to assess the potential of vacuum stripping
and waste heat use. Similarly, it has been claimed by researchers at Alstom that
the chilled ammonia process is superior to conventional amine absorption. However,
the comparisons they present are based on reboiler duty alone. It has been shown
through detailed studies by independent groups that additional refrigeration required
to cool the absorber increases the energy penalty of the chilled ammonia process by
a significant enough margin that it cannot be discounted [60]. The membrane flash
process suffered from flow instability problems in addition to the inherent problem of
scalability to industrial operation.

46
3.4 Direction of our research work
The direction of our research has been motivated by novel, original ideas and the
desire to advance promising concepts previously studied. The research performed as
a part of this dissertation can be divided into three distinct parts, as follows:
• Exploring the viability of the use of waste heat for absorbent
regeneration in carbon capture application
In this part of our work, we have used the process modeling software - ProMax
to study the performance of the amine absorption process under different stripper
operating conditions. While keeping the energy source (60 psia steam) constant, we
explore the effect of varying the stripper operating pressure between 150 kilopascals
(kPa) and 300 kilopascals (kPa). Similarly, we study the effect of varying the vacuum
in a stripper column between 30 kilopascals (kPa) and 75 kilopascals (kPa), while
using waste heat (20 psia steam). Based on the sizes and rating for various equipment,
we calculate the capital cost of each scenario using Aspen Process Economics Analyzer
software.
• Developing superior absorbents
We have performed a detailed analysis of the distribution of energy to the various
physiochemical processes taking place in the reboiler and stripper column. This anal-
ysis revealed that the two processes responsible for consuming a majority of the energy
in the reboiler and stripper are the energy required for heating the amine solution
entering the stripper and the energy consumed to vaporize water to generate stripping

47
vapor. This knowledge has helped us identify superior absorbent formulations that
are estimated to reduce energy consumption by between 20 - 25%.
• Developing the ‘combined pressure and temperature contrast pro-
cess for carbon dioxide (CO2) separation’
In the final part of the work performed as a part of this dissertation, we work on
developing a process that combines the absorber and stripper column into a single
integrated unit. The objective of combining them is driven by the desire to reduce
equipment size, auxiliary equipment and to potentially achieve better heat integra-
tion. We use novel ceramic materials called ceramic foams which have significantly
higher surface area than conventional tower packing as gas-liquid contactors. The
tasks performed towards this project have aimed as taking an original concept and
moving it through various stages of process development to eventually conducting a
proof-of-concept demonstration of the novel process.
In the following chapters, we discuss our research efforts, present our analysis and
draw conclusions about the viability of these ideas.
48
Chapter 4
Effects of variation in stripper operating pressure
on the performance of the amine absorption
process for carbon capture: a technical perspective
4.1 Motivation
Alkanolamine absorption is considered to be the most deploy-ready technology for
carbon dioxide (CO2) removal from power plant flue gas. Extensive operational ex-
perience is available about this process due to its widespread use in natural gas
sweetening application. A notable difference between the two applications of the
same technology, however, is the availability of energy resources at the plant location.
Amine absorption units are an integral part of a gas sweetening plant and boilers
to provide process steam are incorporated into original plant design. Existing coal
and natural gas fired power plants, however, will be retrofitted with this technology
and required steam must be sourced through reconfiguration or existing resources or
added at the facility. While a coal fired power plant, likely will not have sufficient
capacity to provide process steam to the stripper unit(s); there is a higher likelihood

49
of large, waste heat sources being available at these power generation utilities. The
conventional amine absorption process, as adapted for carbon capture employs an
absorber column operating at a pressure close to atmospheric and a stripper unit
operated between 150 kilopascals (kPa) and 200 kilopascals (kPa). A majority of the
energy consumed in the amine absorption process is utilized towards absorbent re-
generation. Thus, it can be expected that system performance as gauged by reboiler
energy duty and process economics is sensitive to a change in the stripper operating
conditions. Further, by operating the stripper column under low vacuum conditions;
it could be possible to use waste heat for absorbent regeneration instead of low pres-
sure steam. The work discussed in this chapter describes our research into studying
the effects of operating the stripper column at pressures ranging from 30 kilopascals
(kPa) and 300 kilopascals (MPa) and exploring the feasibility of the use of waste heat
for absorbent regeneration.
4.2 Research approach
4.2.1 ProMax and amine systems modeling
As described in 3.1.1, the absorption of carbon dioxide (CO2) in alkanolamine so-
lutions is accompanied by exothermic reactions. The reaction occurs in the liquid
phase (amine) in a film close to the gas - liquid interface. This enhances the carbon
dioxide (CO2)mass transfer. It also results in a coupling of the reaction kinetics, mass
and heat transfer phenomena. Traditionally, modeling of reactive absorption systems
50
has been based on the equilibrium stage model, which assumes that each gas stream
leaving a tray or a packing segment (stage) is in thermodynamic equilibrium with
the corresponding liquid stream. However, the assumption of thermodynamic equi-
librium is seldom realized in actual operation. To account for these physical realities,
correlation parameters such as tray efficiencies and height-equivalent-to-theoretical-
plate (HETP) are used. However, these simplified concepts fail for multicomponent
mixtures; which is the case for amine absorption. In the view of the failure of these
simplified approaches to modeling, a more physically consistent approach which in-
volves the direct evaluation of the rates of multicomponent mass and heat transfer
and reaction kinetics must be adopted. Additionally, the presence of alkanolamines,
carbon dioxide (CO2) and their intermediates in aqueous solutions results in their
ionization which leads to large non-idealities in their behavior. These must be ac-
counted for with the use of suitable models for electrolytes [13, 61, 62]. Figure 4.1
shows the variations in the complexity of the different models used most commonly.
Due to the involvement of such complexity in predicting the performance of amine
absorption units, we have selected a process simulation software, ProMax (developed
by Bryan Research & Engineering), to model the operation of the amine absorption
process under different conditions. ProMax has a built-in package, TSWEET which
accounts for the amine - CO2 reaction kinetics in the absorber. The actual mechanism
which limits the rate of carbon dioxide (CO2) absorption in amines is its ionization in
water. This is handled in ProMax by the TSWEET kinetics model which is analogous

51
Figure 4.1 : Graphic explanation of model complexity [13]
to a liquid-side resistance in a mass transfer model. The TSWEET kinetics model
calculates simultaneous distillation and chemical reaction to account for the relatively
slow CO2 - amine reaction rate. The total contacting time between the sour gas and
the absorbent streams is a major factor in determining the amount of carbon dioxide
(CO2) picked up. In ProMax, columns are often simulated using ideal trays rather
than real trays. The liquid residence time on an individual tray is evaluated based
on the tray geometry and further used to evaluate the total residence time in the
column by multiplying it with the ratio of ideal to real stages. ProMax has been
demonstrated to be reliable in predicting the performance of amine gas sweetening
units under a variety of system operating conditions [63, 64, 65]. In addition to
accurately modeling amine absorption, ProMax has in-built functionalities to provide

52
several analyses useful for optimizing the amine absorption process. This includes
an evaluation of the acid gas loading of the amine solution and a calculation of the
lean and rich approach of the amine solution (which aids in fine-tuning the absorbent
flow-rate).
4.2.2 Flowsheet development
For the purposes of our study, we have designed flowsheets for the amine absorption
train, the carbon dioxide (CO2) compression train and the glycol dehydration plant.
Figure 4.2 and 4.3 show the flowsheets developed for studying the amine absorption
process with high pressure strippers and vacuum strippers respectively. Flue gas
enters the system at atmospheric pressure. A blower pressurizes the flue gas in order
to overcome pressure drop encountered in the absorber column. Before entering the
carbon capture unit, flue gas passes through the Flue Gas Desulfurization (FGD) unit
which reduces the sulfur oxides (SOx) concentration to around 100 ppmv [66]. Sulfur
oxides (SOx) compounds form Heat Stable Salts (HSS) with alkanolamines which
result in absorbent losses. To minimize these losses, the flue gas is passed through
a polishing scrubber where the Sulfur oxides (SOx) concentration is reduced to 10
ppmv by contacting it with a dilute sodium hydroxide solution [67]. After passing
through the polishing scrubber, flue gas enters a cooler where it’s temperature is
brought down to around 30oC. At this temperature, flue gas enters the absorber
column. Lean amine solution flows in at the top of the absorber at a temperature of

53
Figure 4.2 : Flowsheet for the amine absorption process for CO2 separation with high pressure strippers

54
Figure 4.3 : Flowsheet for the amine absorption process for CO2 separation with vacuum strippers
55
45oC. As the amine solution flows down, carbon dioxide (CO2) from flue gas dissolves
in the absorbent and reacts reversibly with the amine to form a soluble intermediate.
The amine - CO2 reaction is exothermic and results in a moderate increase in the
solution temperature. The decarbonized flue gas leaves the absorber column at the
top along with some absorbent vapors. For volatile amines like monoethanolamine
(MEA), these losses can be significant and a water wash section at the top of the
absorber is required to recover lost absorbent. Rich amine solution exits the absorber
at the bottom, where a booster pump provides the hydraulic head to overcome the
flow resistances downstream. Rich amine solution from the absorber is contacted
with hot lean amine exiting the reboiler in a heat exchanger to transfer sensible heat.
After passing through the heat exchanger, lean amine enters a make-up/blow-down
unit where water and/or amine is added or removed to maintain the set absorbent
concentration and flow rate. A booster pump provides pressure head to the lean
amine. At this point, lean amine temperature is around 65oC which is brought down
to 45oC in the amine cooler. Rich amine solution enters the stripper, where the
amine - CO2 intermediate dissociates to release the carbon dioxide (CO2) and amine
molecules. Energy for the stripping process is provided by steam to a reboiler located
at the base of the stripper column.
When operating the stripper under vacuum, a mechanical assembly called a ‘steam
jet ejector’ is used to create and maintain vacuum in the column. Figure 4.4 is
a schematic representation of a steam jet ejector. A steam jet ejector works on the

56
concept of a converting - diverging nozzle to transform the pressure energy of a motive
fluid to kinetic energy which creates a low pressure zone which draws and entrains the
suction fluid [68]. In industrial processes, steam jet ejectors are preferred to vacuum
pumps due to their simplicity, absence of moving parts and the resulting reliability.
Steam jet ejectors have a low isentropic efficiency of around 80% and require high
pressure steam as a motive fluid. Carbon dioxide (CO2) along with water vapor exits
the stripper at the top. It passes through a partial condenser where most of the water
vapor condenses and is refluxed back into the stripper. In case of vacuum strippers,
an additional gas-liquid separator is used to separate out the condensed steam from
the ejector.
Carbon dioxide (CO2) leaving the condenser enters a compressor–intercooler train
for compression to a pipeline pressure of 16 MPa. Before the compressed carbon
dioxide (CO2) can, however, be moved to the pipeline; it must be conditioned ap-
propriately to lower its water content below 150 ppm. At high pressures and low
temperatures, such as those prevalent in the pipeline transport, the presence of wa-
ter can lead to formation of hydrate plugs; a major flow assurance problem. The
compressed carbon dioxide (CO2) is conditioned by contacting it with triethylene
glycol (TEG) in glycol dehydration unit. Once conditioned, the compressed carbon
dioxide (CO2) is ready to be transported. Figures 4.5 and 4.6 show the compression
trains used for high pressure strippers and vacuum strippers respectively. Separated
carbon dioxide (CO2) from amine trains with vacuum strippers is delivered to the

57
Figure 4.4 : Schematic representation of a steam jet ejector [14]
compression train at atmospheric pressure, lower than from the high pressure strip-
pers. This results in the requirement of an additional compressor in the train. Figure
4.7 shows the glycol dehydration unit where the compressed carbon dioxide (CO2) is
conditioned to make it suitable for transportation.
4.2.3 Evaluating parasitic power loss
At a power plant retrofitted with amine absorption technology for carbon capture,
there are several energy sinks that lead to a reduction in the net power output. In
addition to the reboiler energy duty, which is the most significant of energy loads;
plant auxiliaries such as flue gas blowers and pumps and compressors contribute to the
reduction in output. The cumulative loss in plant output expected due to these energy
sinks is termed as parasitic power loss. Energy consumed in the reboiler is typically
reported as energy consumed per unit mass of carbon dioxide (CO2) separated.

58
Figure 4.5 : Flowsheet for the compression of CO2 separated with amine absorption trains using high pressure strippers
Figure 4.6 : Flowsheet for the compression of CO2 separated with amine absorption trains using vacuum strippers

59
Figure 4.7 : Flowsheet for the glycol dehydration unit for conditioning CO2 before transportation

60
Figure 4.8 : Electric power equivalence of low pressure steam
However, such an evaluation is based on enthalpic considerations and is hence, in-
dependent of the equivalent work that can be extracted from the steam used in the
reboiler. It is a well-understood fact that the equivalent work capacity of steam varies
with pressure. Figure 4.8 shows a plot of the change in the electrical equivalence of
steam with it’s pressure.
Thus, the real impact of the carbon capture installation at a power plant can
be gauged only by calculating the parasitic power loss, including the reduction in
electrical output due to the reboiler. Some basic parameters are required to calcu-
late the electrical equivalence of reboiler steam. These are compiled in Table 4.1.
Assuming the expansion of steam through the turbine to isentropic, the amount of
steam required to generate one unit of electricity depends only on the inlet and outlet

61
conditions of steam and the efficiency of the turbine. The relation between these
is described in Equation 4.1 where the units of the steam flow rate are kgkWh
, ηt is
the turbine efficiency, H1 is the mass enthalpy of the steam at its inlet pressure and
temperature into the low pressure (LP) turbine and H2s is the mass enthalpy at exit
pressure and the entropy corresponding to the inlet conditions [69]. It is known that
the low pressure (LP) turbine contributes around 45% of the electric output of the
power plant [18]. This allows for the calculation of the steam circulation rate to
the low pressure (LP) turbine which is 324.4 kg/s. With the plant setup remaining
unaltered, this is the maximum amount of steam available to the reboiler. For each
simulation case, the reboiler steam consumption is known. This allows for evalua-
tion of the power generated by the reboiler steam and thus, its contribution to the
parasitic power loss.
4.2.4 Process and simulation parameters
A typical 400 MegaWatts (MW) coal–fired power plant emits approximately 3 million
toness/year of carbon dioxide (CO2) [70]. The corresponding flue gas flow rate is
approximately 32 Million Sm3/day, which is the flow rate used in this study. The
molar composition of flue gas used in this study is provided in Table 4.2 [19].
Steam rate =1548.1
ηt · (H1 −H2s)(4.1)

62
Table 4.1 : Parameters for Evaluation of Equivalent Power Losses [17, 18]
Parameters for Evaluation of Equivalent Power Loss
Steam to: ↓ / Properties: → Pressure (kPa) Temperature (oC) Enthalpy (kJkg) Entropy ( kJ
kgoC)
LP Turbine 630 284.6 3029.4 7.3
High Pressure Strippers 413.7 144 2928 7.3
Vacuum Strippers 122 140 2684 7.3
Downstream Condenser 5.52 34.5 2236.2 7.3
Steam Jet Ejector 630 284.6 3029.4 7.3

63
Table 4.2 : Composition of flue gas used in simulation studies [19]
Component Value (mole %)
Water (H2O) 11.69
Carbon dioxide (CO2) 14.59
Oxygen (O2) 2.85
Nitrogen (N2) 69.95
Sulfur dioxide (SO2) 0.01
Argon (Ar 0.91
As can be seen, the carbon dioxide (CO2) concentration in flue gas is low which
results in a low partial pressure. These are unfavorable conditions for the absorption
of carbon dioxide (CO2) into the absorbent. Coal combustion occurs in the presence
of excess air, leading to the presence of unused oxygen in flue gas. Oxygen reacts with
the alkanolamines and results in absorbent degradation problems. A single absorber
– stripper train configuration results in an impractically large equipment design on
account of the large flue gas, absorbent and stripping vapor flow rates to be handled.
Hence, we use a 3 absorber - stripper train configuration for this study. We examine
the performance of three alkanolamines; monoethanolamine (MEA) - a fast reacting
primary amine with high heat of regeneration, diethanolamine(DEA) - a slow reacting
secondary amine with a low heat of regeneration and diglycolamine(DGA) - another
fast reacting primary amine with a high heat of reaction but lower vapor pressure

64
than monoethanolamine(MEA). In order to simulate the amine absorption process
under conditions similar to those maintained in commercial practice, we introduce
the following constraints and guides.
1. At least 90% of the entering carbon dioxide (CO2) must be captured and com-
pressed [71].
2. All amines are studied at the typical concentrations that they are used at
in commercial practice. These are: monoethanolamine(MEA) - 20 wt%, di-
ethanolamine(DEA) - 40 wt% and diglycolamine(DGA) - 60 wt% [9].
3. The maximum carbon dioxide (CO2) loading of amine solutions is 0.4 moles-
CO2/ mole-amine [9, 16].
Corrosion problems in carbon steel equipment with alkanolamines, especially at
high concentrations and high solution loadings are quite well known. It is possi-
ble to achieve significantly higher carbon dioxide (CO2) loadings by switching to
stainless steel equipment; however it comes at a significantly higher cost. Stainless
steel is 2 – 3x more expensive than carbon steel. While it can be argued that the
higher cost maybe justified by lowered parasitic power losses, carbon steel equipment
represents current technology that has been found to be reliable and economically fea-
sible. This forms the scientific rationale behind the constraints imposed above. Mo-
noethanolamine (MEA) and diglycolamine (DGA) react with carbon dioxide (CO2)
much faster than diethanolamine (DEA); thus requiring fewer trays/stages in the ab-

65
sorber column. In this study, we used absorber columns with 2 ideal stages for all
monoethanolamine (MEA) and diglycolamine (DGA) simulations and 10 ideal stages
for all diethanolamine (DEA) cases. Various simulation parameters used in this study
are compiled in Table 4.3.
Heat exchangers are important pieces of equipment at amine absorption facilities.
Two of the most critical heat exchangers in the amine absorption flowsheet shown in
Figures 4.2 and 4.3 are the lean/rich amine heat exchanger and the reboiler. Two
key parameters which decide the sizing of the heat exchanger units are the end ap-
proach temperature and the energy duty (quantity of heat transferred). Both these
parameters for the two heat exchangers for the different simulation cases are tabu-
lated in Table 4.4. With an objective of avoiding excessive complexity, in this study,
we have chosen to vary the reboiler steam properties only when transitioning from
amine absorption units with vacuum strippers to those with high pressure strippers.
4.3 Results and analysis
4.3.1 Effect of stripper operating pressure on reboiler heat duty
Energy provided to the reboiler is consumed for heating the rich amine solution
entering the stripper, to drive the amine–CO2 desorption reaction and to vaporize
water to generate stripping vapor (steam). A conventional stripper column is operated
between 150 kilopascals (kPa) – 200 kilopascals (kPa) and at a temperature of around
105o – 110o; depending on the choice of absorbent. Stripper operating temperature

66Table 4.3 : System parameters used in ProMax simulations
Parameter Vacuum Strippers High Pressure Strippers
Flooding Fraction 0.8 0.8
Tray Type Sieve Sieve
Tray Spacing 0.61 meters 0.61 meters
Weir Height 0.076 meters 0.076 meters
Condenser Temperature 30o C 30o C
Absorber # of Trays (MEA, DGA) 2 2
Absorber # of Trays (DEA) 10 10
Stripper # of Trays (MEA, DGA) 15 10
Stripper # of Trays (DEA) 10 10
Heat Exchanger End Approach Temperature 5o C 5o C
Steam Jet Ejector Delivery Pressure 101.3 (kPa) 101.3 (kPa)
Contribution of LP Turbine to Plant Output 45 % 45 %
Overall Efficiency of Turbine–Generator System 70 % 70 %
Isentropic Efficiency of Steam Jet Ejector 80 % 80 %
Steam flow to LP Turbine 324.4 (kg/s) 324.4 (kg/s)
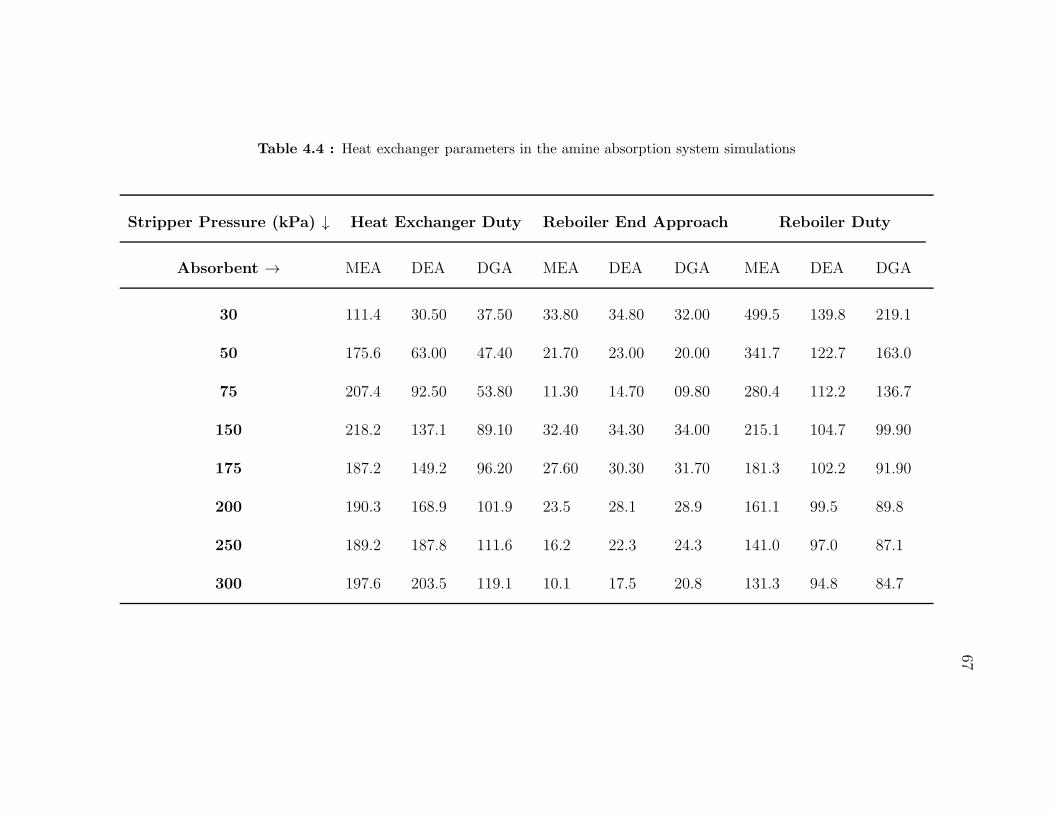
67
Table 4.4 : Heat exchanger parameters in the amine absorption system simulations
Stripper Pressure (kPa) ↓ Heat Exchanger Duty Reboiler End Approach Reboiler Duty
Absorbent → MEA DEA DGA MEA DEA DGA MEA DEA DGA
30 111.4 30.50 37.50 33.80 34.80 32.00 499.5 139.8 219.1
50 175.6 63.00 47.40 21.70 23.00 20.00 341.7 122.7 163.0
75 207.4 92.50 53.80 11.30 14.70 09.80 280.4 112.2 136.7
150 218.2 137.1 89.10 32.40 34.30 34.00 215.1 104.7 99.90
175 187.2 149.2 96.20 27.60 30.30 31.70 181.3 102.2 91.90
200 190.3 168.9 101.9 23.5 28.1 28.9 161.1 99.5 89.8
250 189.2 187.8 111.6 16.2 22.3 24.3 141.0 97.0 87.1
300 197.6 203.5 119.1 10.1 17.5 20.8 131.3 94.8 84.7
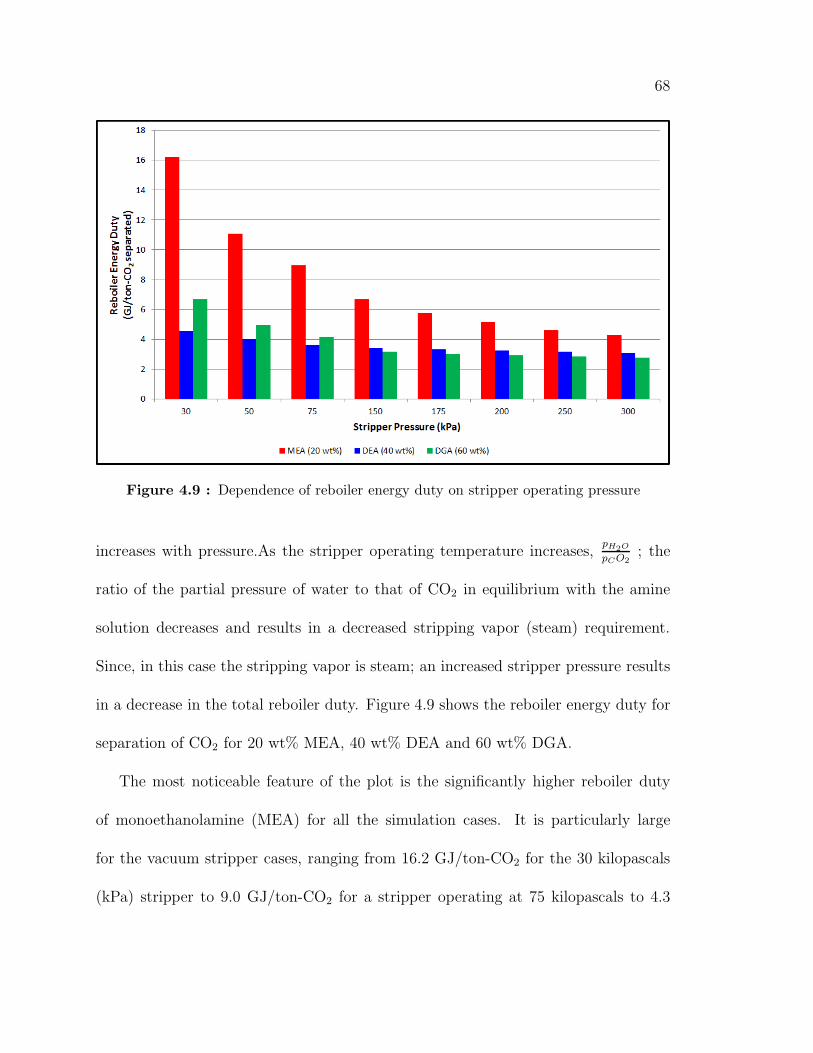
68
Figure 4.9 : Dependence of reboiler energy duty on stripper operating pressure
increases with pressure.As the stripper operating temperature increases,pH2O
pCO2; the
ratio of the partial pressure of water to that of CO2 in equilibrium with the amine
solution decreases and results in a decreased stripping vapor (steam) requirement.
Since, in this case the stripping vapor is steam; an increased stripper pressure results
in a decrease in the total reboiler duty. Figure 4.9 shows the reboiler energy duty for
separation of CO2 for 20 wt% MEA, 40 wt% DEA and 60 wt% DGA.
The most noticeable feature of the plot is the significantly higher reboiler duty
of monoethanolamine (MEA) for all the simulation cases. It is particularly large
for the vacuum stripper cases, ranging from 16.2 GJ/ton-CO2 for the 30 kilopascals
(kPa) stripper to 9.0 GJ/ton-CO2 for a stripper operating at 75 kilopascals to 4.3

69
GJ/ton-CO2 for the 300 kilopascals (kPa) stripper. This trend of a gradual reduc-
tion in the reboiler energy duty with an increase in stripper pressure is also observed
for diethanolamine (DEA) and diglycolamine (DGA). However, the reboiler duty for
both diethanolamine (DEA) and diglycolamine (DGA) are significantly lower. It
varies from 4.6 GJ/ton-CO2 to 3.1 GJ/ton-CO2 for diethanolamine (DEA) when the
pressure is increased from 30 kilopascals (kPa) to 300 kilopascals (kPa). Under the
same range of conditions, the reboiler duty for diglycolamine (DGA) decreases from
6.7 GJ/ton-CO2 to 2.8 GJ/ton–CO2. Where diglycolamine (DGA) has an advantage
over diethanolamine (DEA) is in that diglycolamine (DGA) solutions can be used at a
significantly higher concentration without serious corrosion or solvent loss problems.
In spite of this, diethanolamine (DEA) has a lower reboiler duty than diglycolamine
(DGA) in vacuum strippers; mainly because the diglycolamine–CO2 complex is more
stable than the corresponding diethanolamine (DEA) complex. This results in a
lower equilibrium partial pressure for carbon dioxide (CO2) in the stripper column,
requiring larger quantities of stripping steam for dilution. However, the absorbent
performance in high pressure strippers is significantly different, with 60 wt% digly-
colamine (DGA) having a reboiler duty that is almost 10% lower than the 40 wt%
diethanolamine (DEA). The decrease is energy consumption is primarily a result of
reduced stripping vapor (steam) requirement. A detailed analysis of the contributions
of the 3 constituent processes of absorbent stripping is given in §§6.2.
The reboiler duty values for monoethanolamine (MEA) in published literature

70
when the carbon dioxide (CO2) concentration of flue gas is around 15% lie between
3.57 GJ/ton-CO2 and 4.01 GJ/ton-CO2. The reboiler duty value we report for mo-
noethanolamine (MEA) with the 200 kilopascals (kPa) stripper is around 5.8 GJ/ton-
CO2 which is close to twice the previously reported value. To understand this, we
must refer back to §§4.2.4 where we discussed that rich amine loading must be main-
tained below 0.4 moles-CO2 mole-amine to avoid excessive corrosion. The carbamate
formed by the reaction between monoethanolamine (MEA) and carbon dioxide (CO2)
is reasonably stable. In order to constrain the amine loadings, higher amine circu-
lation and steam flow rate must be maintained. With other parameters unchanged,
an increase in the amine circulation rate or the reboiler steam flow results in an in-
creased carbon dioxide (CO2) pickup in the absorber and consequently a higher rich
amine loading. Consequently, significantly larger amounts of energy must be pro-
vided to the reboiler to maintain lower rich amine loadings. The reboiler duty for
monoethanolamine (MEA) and diglycolamine (DGA) when the rich amine loading is
constrained to 0.4 mole–CO2/ mole-amine is similar to the value of 5.6 GJ/ton-CO2,
reported elsewhere in published literature [72].
4.3.2 Effect of stripper operating pressure on column sizing
In the design of an amine absorption unit, energy consumption is the most impor-
tant contributor to the operating costs. One of the significant contributions to the
capital investment is the absorber and stripper column size, which is also strongly

71
Figure 4.10 : Dependence of absorber diameter on stripper operating pressure
influenced by amine selection. ProMax uses the degree of fractional flooding as an
input parameter to calculate column diameter. As disclosed in Table 4.3, all columns
in this study are set to operate at 80% flooding. Figure 4.10 shows the effect of amine
selection and stripper operating pressure on absorber diameter. It can be seen that
the absorber diameter varies only marginally depending on the amine selected and
the stripper pressure. This is because the most important factor influencing column
diameters is the vapor flowrate. Since, in all cases flue gas inflow rate of flue gas
remains constant, there’s only a small change in the absorber diameter.
Figure 4.11 shows the effect of the stripper pressure and amine choice on the
stripper diameter. Unlike absorbers; the stripper column shows a strong dependence

72
on both the choice of amines and the stripper pressure. As before, this can be ex-
plained by observing the vapor inflow rates to the stripper. As the stripper pressure
increases, the stripping vapor (steam) requirement reduces. Due to an increase in
the stripper pressure, there is also a reduction in the volume of the stripping vapor
(steam) and the carbon dioxide (CO2) flowing inside the column. These two factors
combine to reduce the overall vapor flow rate in the stripper column which conse-
quently reduces the stripper size. Since monoethanolamine (MEA) has the highest
stripping vapor (steam) requirement it requires the largest stripper column for all
amines compared, irrespective of stripper pressure. As with the reboiler heat duty
however, diethanolamine (DEA) use requires smaller strippers than diglycolamine
(DGA) with vacuum strippers. At higher pressures, strippers used for diglycolamine
(DGA) are smaller than those used for diethanolamine (DEA).
4.3.3 Effect of stripper operating pressure on heat exchanger sizing
In addition to the absorber and stripper columns, the rich/lean heat exchanger is a
critical and expensive piece of equipment at an amine absorption plant. Heat ex-
changers are typically rated on the basis of their surface area which is dependent
on their heat duty and the temperature driving force. In all the simulations devel-
oped in this study, we have maintained a end approach temperature in the rich/lean
heat exchanger at 5 oC. Thus, the energy duty is a reasonable measure for the heat
exchanger sizing. Heat exchanger duties for all three absorbents at stripper operat-

73
Figure 4.11 : Dependence of stripper diameter on stripper operating pressure
ing pressures between 30 kilopascals (kPa) and 300 kilopascals (kPa) are compiled
in Table 4.4. A clear trend can be observed in case of diethanolamine (DEA) and
diglycolamine (DGA) systems - the heat exchanger duty increases with an increase
in the stripper pressure. This is consistent with an increased stripper/reboiler op-
erating temperature, which results in a hotter lean amine stream entering the heat
exchanger and thus, a larger quantity of energy transfer taking place in the heat ex-
changer. Monoethanolamine (MEA), has a similar trend while the stripper pressure
increases from 30 kilopascals (kPa) to 150 kilopascals (kPa). However, there is no
clear trend thereafter as the pressure is increased to 300 kilopascals (kPa). This can
be explained by observing the absorbent flowrates for monoethanolamine (MEA) for

74
different stripper operating pressures. Table 4.5 is a compilation of the absorbent
flowrates for all three absorbents under different stripper operating conditions. It can
be observed from the data that the reduction in absorbent flowrate with an increase in
stripper pressure for monoethanolamine(MEA) is much more significant than either of
the other two amines. Whereas, there is negligible change in the absorbent flowrates
for diethanolamine (DEA) and diglycolamine (DGA) when the stripper pressure is
changed from 150 kilopascals (kPa) to 300 kilopascals (kPa); there is a 35% reduc-
tion for monoethanolamine (MEA). The rapid decrease in absorbent circulation can
be attributed to the an increase in stripper temperatures at higher pressures, which
results in a lower lean amine loading and hence, lower flowrates to achieve the twin
goals of 90% carbon dioxide (CO2) removal and a maximum rich amine loading of 0.4
moles-amine/mole–CO2.
4.3.4 Effect of stripper operating pressure on compression duty
Carbon dioxide (CO2) separated from the flue gas is compressed to a pipeline pressure
of 16 Megapascals (MPa). Compression duty accounts for nearly 10% of the total
energy consumption. As demonstrated in previous sections, an increase in the stripper
pressure results in a reduction in the reboiler steam requirement. However, it also
influences the compression duty since a change in the stripper pressure affects the
pressure at which carbon dioxide (CO2) is delivered to the compression train. Figure
4.12 shows the dependence of the compression duty on stripper pressure.

75Table 4.5 : Absorbent flowrates under different stripper operating conditions
Amine MEA 20 wt% DEA 40 wt% DGA 60 wt%
Stripper Pressure Flowrate (lpm) Flowrate (lpm) Flowrate (lpm)
30 kPa 115,949 54,423 66,109
50 kPa 101,682 49,262 45,824
75 kPa 87,487 49,219 35,679
150 kPa 61,564 44,045 35,237
175 kPa 48,848 44,045 35,096
200 kPa 46,118 47,483 35,096
250 kPa 40,700 47,508 35,116
300 kPa 38,924 47,520 35,098
Figure 4.12 : Dependence of CO2 compression duty on stripper operating pressure

76
As may be expected, the choice of absorbent has a negligble effect on the compres-
sion duty irrespective of the stripper pressure. It can be noticed that the compression
duty is near constant for all vacuum strippers. This results from the use of steam
jet ejectors which have been setup to deliver the separated carbon dioxide (CO2) to
the compressor train at 101.3 kilopascals (kPa). As the stripper operating pressure is
increased, however, to 150 kilopascals (kPa) and beyond; there is a gradual reduction
in the compression duty because carbon dioxide (CO2) is delivered to the compressors
at increasingly larger pressures and hence, lower specific volumes. The compression
duty for amine absorption units with strippers operating at 300 kilopascals (kPa)
is around 25% lower than those for vacuum strippers. This suggests that a higher
stripper operating pressure has advantages in reducing the energy duty during the
compression of carbon dioxide (CO2).
4.3.5 Effect of stripper operating pressure on parasitic power losses
Figure 4.9 shows that the reboiler energy duty for vacuum strippers, expressed in
terms of energy required per unit mass of carbon dioxide (CO2) separated is greater
than that for high pressure strippers. However, reboilers for vacuum strippers are
supplied with steam at 122 kilopascals (kPa) which has significantly lower ‘useful’
energy content than the 415 kilopascals (kPa) steam required for high pressure strip-
pers systems. Since the reboiler steam for vacuum and high pressure strippers is at
different conditions, their resulting equivalent power loss is not the same - a larger

77
Figure 4.13 : Dependence of parasitic power losses on stripper operating pressure
quantity of the 122 kilopascals (kPa) steam must be drawn to result in the same
power loss as the 415 kilopascals (kPa). Figure 4.13 is a plot of the parasitic power
loss at the reference 400 Megawatt (MW) power plant, expressed as a % of the rated
generation capacity.
The most remarkable feature of this plot is the absence of any data points for
monoethanolamine (MEA) and diglycolamine (DGA) corresponding to a stripper
pressure of 30 kilopascals (kPa) and for monoethanolamine (MEA) for 50 kilopascals
(kPa) and 75 kilopascals (kPa). In all cases, this is a result of the reboiler steam
requirement being greater than the flow-rate of steam circulated to the low pressure
(LP) turbine, suggesting that it is practically impossible to implement the 30 kilopas-
cals (kPa) configuration with any of the absorbents except diethanolamine (DEA). We

78
also note that with diethanolamine (DEA) and diglycolamine (DGA) as absorbents,
the 75 kilopascals (kPa) stripper has a competitive performance with all the high
pressure strippers. Diethanolamine (DEA) in particular has a lower parasitic power
loss than all the high pressure stripper configurations.
In the case considered above, we have assumed that all the reboiler steam required
for vacuum strippers is drawn downstream of the low pressure (LP) turbine. This,
unavailability of waste heat represents the worst case scenario for vacuum strippers.
In order to consider more realistic scenarios, we have considered five different scenarios
of waste heat availability at the power plant. These are described in Table 4.6. At one
end of the range is the case where no suitable sources of waste heat are available at
the power plant (discussed above). At the other end of the spectrum is a case where
enough waste heat is available at the power plant to provide all reboiler steam and no
steam is required from the turbine system. Three other intermediate scenarios where
25%, 50% and 75% of the reboiler steam is provided by waste heat are considered in
this study.
Figure 4.14 shows the variance in parasitic power loss for diethanolamine (DEA)
and diglycolamine (DGA) systems with vacuum strippers under different scenarios
of waste heat availability. There is a gradual reduction in the parasitic power loss
as the source of the reboiler steam is switched from the turbine system to the waste
heat source. The parasitic power losses reduce by 15–17 percentage points for the 50
kilopascals (kPa) strippers and by 12–15 percentage points for the 75 kilopascal (kPa)

79
Table 4.6 : Absorbent flowrates under different stripper operating conditions
Simulation Case Assumption
0% All reboiler steam is tapped from downstream of LP turbine at 122 kPa
25% 25% of the reboiler steam provided by waste heat sources
50% 50% of the reboiler steam provided by waste heat sources
75% 75% of the reboiler steam provided by waste heat sources
100% 100% of the reboiler steam provided by waste heat sources
Figure 4.14 : Dependence of parasitic power loss for vacuum strippers on waste heat
availability

80
strippers when the steam source is changed from the turbine system to waste heat.
The main reason for the higher parasitic duty for the 50 kilopascal (kPa) strippers is
the greater jet ejector steam requirement and increased duty for the pumps due to
larger absorbent flowrates. As can be seen from Figure 4.14, when all the reboiler
steam is provided by waste heat sources, the parasitic power loss for diethanolamine
(DEA) and diglycolamine (DGA) at 75 kilopascals (kPa) is around 21% and the
difference between them is less than 1%. This suggests that both these absorbents
have a reasonably similar performance with the vacuum strippers.
4.4 Concluding Remarks
In this study, we have performed an in-depth exploration of the potential for us-
ing alternative stripper operating conditions than those used in current practice. In
particular, evaluating the use of vacuum strippers utilizing waste heat for absorbent
regeneration has been a major focus of this work. We have considered various rele-
vant factors to analyze high pressure and vacuum strippers and remark that vacuum
strippers, although previously discarded on the basis of excessive compression costs
are competitive with conventional and high pressure stripper systems. In a scenario
where a large supply of waste heat is available at the power plant site; however, uti-
lization of a stripper column operated at 75 kilopascals (kPa) can result in parasitic
power losses that are up to 15 percentage points lower than those for conventional
and high pressure systems. There are operational advantages, disadvantages and
81
challenges towards the use vacuum strippers. These are summarized below:
1. When all reboiler steam is tapped from the turbine system and the stripper
vacuum reduced from 50 kilopascals (kPa) to 75 kilopascals (kPa), the parasitic
power loss for diethanolamine (DEA) decreases from 41.4% to 34.5% while that
for diglycolamine (DGA) reduces from 41.3% to 32%. The parasitic power loss
for both diethanolamine (DEA) and diglycolamine (DGA) is within 1% of that
corresponding to a stripper pressure of 300 kilopascals (kPa).
2. Absorber diameters are not sensitive to a change the stripper pressure. We find
that the absorber columns for vacuum stripper systems are almost the same
size as the high pressure systems.
3. Stripper diameters are quite sensitive to the stripper operating pressures. When
the stripper pressure is changed from 30 kilopascals (kPa) to 75 kilopascals
(kPa), the size of the monoethanolamine (MEA) stripper decreases from 18
meters (m) to 11.8 meters (m), the diethanolamine (DEA) stripper from 9.7
meters (m) to 7.8 meters (m) and diglycolamine (DGA) stripper from 11.8
meters (m) to 8 meters (m). When compared to the high pressure strippers, we
see that a 300 kilopascals (kPa) stripper with monoethanolamine (MEA) has a
6.5 meters (m) stripper column, diethanolamine (DEA) has 6.6 meters (m) and
diglycolamine (DGA) has a 5.5 meters (m) column. Thus, vacuum strippers
are significantly bigger in size than the conventional or high pressure strippers;
which can be expected to increase the capital expenditure for the plant.

82
4. Since vacuum strippers operate a low temperature (less than 100oC), they may
be expected to have a major operational advantage over conventional systems -
low equipment corrosion. In addition, the lower temperature will have no ther-
mal degradation problems as opposed to the 300 kilopascals (kPa) configuration
which may be expected to have solvent loss problems.
5. Under the conditions used in this study, it is practically infeasible to use MEA
as an absorbent for amine absorption systems with vacuum stripping due to the
extremely large requirement for reboiler steam and impossibly large stripper
columns. Similarly, the 30 kilopascals (kPa) stripper configuration may be
practically infeasible unless a very large source of waste heat is available at the
power plant. Even then, this configuration will not be competitive with the 75
kilopascals (kPa) system.
6. We conclude that vacuum stripping at 75 kilopascals (kPa) and high pressure
stripping at 300 kilopascals (kPa) are more competitive configurations than con-
ventional amine absorption. While high pressure stripping may be challenged
by problems like thermal degradation, corrosion and absorbent losses, finding
sources of waste heat is critical to the cost effective deployment of vacuum
strippers. The higher equipment cost of vacuum stripping maybe justified if a
significant reduction in parasitic power loss can be achieved.
Since, the economics of a process - the capital and operating costs are critical
to the success of any industrial process; an economic evaluation is a must to make

83
a reasonably accurate judgment of the superiority of a novel process configuration.
In Chapter 5, we present the economic analysis conducted to compare the two best
process configurations identified in this part of work.

84
Chapter 5
Effects of variation in stripper operating pressure
on the performance of the amine absorption
process for carbon capture: an economic
perspective
5.1 Motivation
Economic feasibility of a chemical process is the ultimate factor considered in deciding
its large-scale, commercial deployment. Several researchers have thoroughly analyzed
the conventional alkanolamine process for its economic feasibility for carbon dioxide
(CO2) capture at coal-fired power plants [73, 74, 75, 42]. As described previously in
Chapters 3 and 4, several new and clever rearrangements of the alkanolamine process
have been suggested to reduce the energy consumption [57, 53, 52, 76]. Few of
these research studies, however, have been concluded with an analysis to quantify
the economic implications of these modifications. The work presented in this chapter
was performed with the objective of conducting a reasonable economic assessment of
the various modified configurations of the alkanolamine absorption process. Although
85
based off a relatively simple assessment, these results provide an objective assessment
of the viability of these different process configurations.
5.2 Research approach
The basic requirement for conducting an economic assessment of any chemical pro-
cess is a knowledge of the equipment sizing/rating. As described in Chapter 4, we
have used ProMax to model the amine absorption process. In addition to simulat-
ing the amine absorption process, ProMax can also be used for sizing/rating most
equipment used in it. We have chosen to rate the heat exchangers independently by
evaluating their heat transfer areas using the heat transfer rate and logarithmic mean
temperature difference (LMTD) values simulated in ProMax and overall heat transfer
coefficients (U) and logarithmic mean temperature difference (LMTD) correction fac-
tors from published literature. This size/rating information, thus generated, is used
as input in the Aspen Process Economic Analyzer software (formerly Aspen Icarus
Process Evaluator). Aspen Process Economic Analyzer is a powerful project scoping
tool that is commonly used for evaluation of the economic impacts of process designs.
For simple, preliminary cost estimations similar in scope to this work; Aspen Process
Economic Analyzer can generate estimates with a minimal number of sizing/rating
parameters. In a few cases, where actual equipment size/rating generated with Pro-
Max cannot be evaluated with the Economic Analyzer; the economic costs can be
scaled off the cost of the maximum sized/rated equipment using the 6–10th rule (see

86
Equation 5.1 below) [77]. These parameters corresponding to each equipment type,
required for economic evaluation and the method used to size/rate the equipment are
listed in Table 5.1.
CB = CA
[
SB
SA
]0.6
(5.1)
5.3 Sizing and rating methodology
Table 5.1 lists the different type of equipment used at the carbon capture plant.
While most equipment can be sized and rated in ProMax, it is important to present
the methodology used to do so. In the subsections below, we have discussed the
methods used to size/rate complex equipment such as separation columns, pressure
vessels and heat exchangers.
5.3.1 Sizing separation columns
ProMax has a built-in package, TSWEET which accounts for the aminecarbon dioxide
(CO2) reaction kinetics in the absorber. The actual mechanism which limits the rate
of carbon dioxide (CO2) absorption in amines is its ionization in water. This is
handled in ProMax by the TSWEET kinetics model which is analogous to a liquid-
side resistance in a mass transfer model. The TSWEET kinetics model calculates
simultaneous mass transfer (physical process) and chemical reaction to account for
the relatively slow amine-carbon dioxide (CO2) reaction rate.

87
Table 5.1 : Parameters used for economic evaluation of equipment cost
Equipment ↓ Sizing/Rating Parameter(s)) Sizing/Rating Method
Separation columns Column Diameter & Height ProMax
Pumps Liquid Flowrate & Fluid Head ProMax
Compressors Vapor Flowrate (volumetric) & Compression Ratio ProMax
Process Vessels Vessel Diameter & Height ProMax
Gas Blower Vapor Flowrate (volumetric) ProMax (6–10th rule invoked)
Steam Jet Ejector Vapor Flowrate (mass) ProMax (6–10th rule invoked)
Heat Exchangers Surface Area Calculated Independently

88
The total contacting time between the sour gas and the absorbent streams is
a major factor in determining the amount of carbon dioxide (CO2) picked up. In
ProMax, columns are often simulated using ideal trays rather than real trays. The
liquid residence time on an individual tray is evaluated based on the tray geometry
and further used to evaluate the total residence time in the column by multiplying
it with the ratio of ideal to real stages. In commercial operation, however, packed
columns are often preferred to tray columns due to their higher efficiency. In order
to estimate the equivalent height of packing required, a parameter called ‘height
equivalent to theoretical stage (HETP)’ is used. The tower height is the product of
the height equivalent to theoretical stage (HETP) and the number of trays in the
column. In order to evaluate the column diameter, ProMax utilizes the degree of
column flooding as an input parameter. With the degree of flooding, the liquid and
vapor flowrates known; it is possible to evaluate the column diameter. The towers in
the glycol dehydration unit use a similar methodology for evaluation of column height
and diameter, except the Soave-Redlich-Kwong (SRK) package is utilized. Table 5.2
summarizes the dimensions of the different separation columns used in this study
[78].
5.3.2 Sizing separator vessels
Horizontal and vertical 2-phase separators vessels are sized in Promax using correla-
tions in published literature [79, 80, 81]. The sizing correlations for vapor/liquid
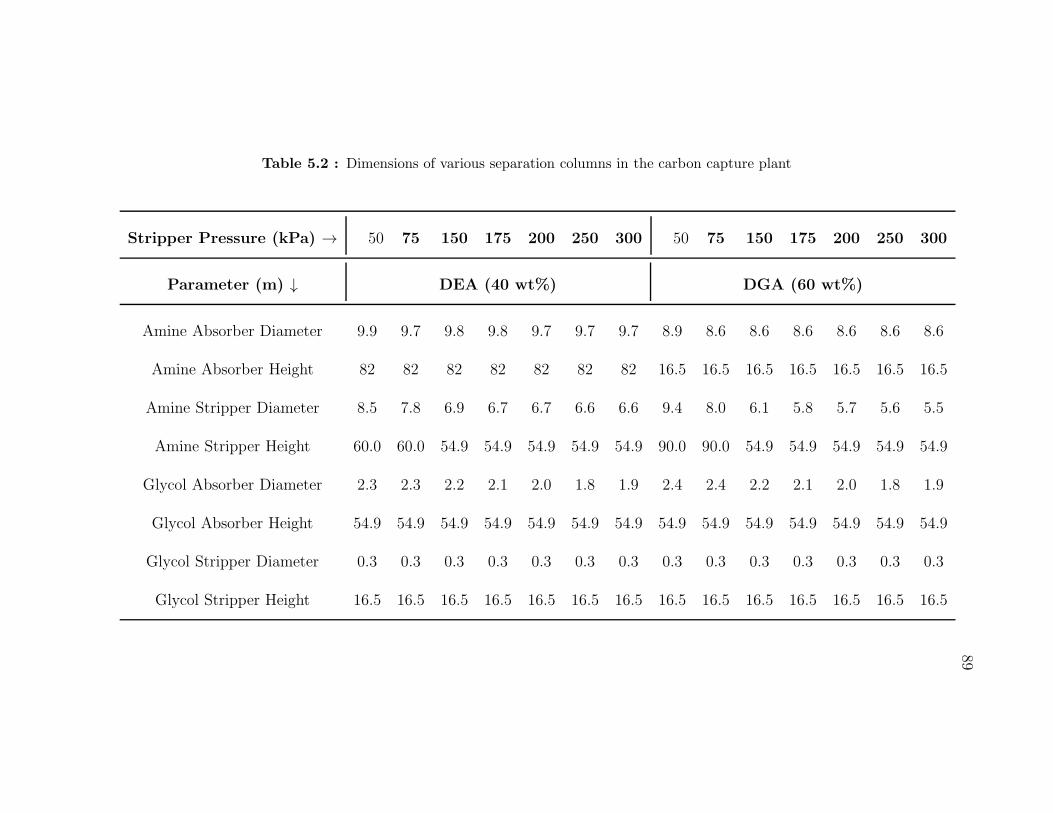
89
Table 5.2 : Dimensions of various separation columns in the carbon capture plant
Stripper Pressure (kPa) → 50 75 150 175 200 250 300 50 75 150 175 200 250 300
Parameter (m) ↓ DEA (40 wt%) DGA (60 wt%)
Amine Absorber Diameter 9.9 9.7 9.8 9.8 9.7 9.7 9.7 8.9 8.6 8.6 8.6 8.6 8.6 8.6
Amine Absorber Height 82 82 82 82 82 82 82 16.5 16.5 16.5 16.5 16.5 16.5 16.5
Amine Stripper Diameter 8.5 7.8 6.9 6.7 6.7 6.6 6.6 9.4 8.0 6.1 5.8 5.7 5.6 5.5
Amine Stripper Height 60.0 60.0 54.9 54.9 54.9 54.9 54.9 90.0 90.0 54.9 54.9 54.9 54.9 54.9
Glycol Absorber Diameter 2.3 2.3 2.2 2.1 2.0 1.8 1.9 2.4 2.4 2.2 2.1 2.0 1.8 1.9
Glycol Absorber Height 54.9 54.9 54.9 54.9 54.9 54.9 54.9 54.9 54.9 54.9 54.9 54.9 54.9 54.9
Glycol Stripper Diameter 0.3 0.3 0.3 0.3 0.3 0.3 0.3 0.3 0.3 0.3 0.3 0.3 0.3 0.3
Glycol Stripper Height 16.5 16.5 16.5 16.5 16.5 16.5 16.5 16.5 16.5 16.5 16.5 16.5 16.5 16.5

90
separation are based on the K-factor method outlined in Section 7 of the Gas
Processors Suppliers Association (GPSA) Databook and Svrcek [80, 79]. The K-
factor method is an empirical correlation which is dependent upon operating pressure,
presence of mist eliminator, presence of glycol or amine, separator orientation, and
minimum particle size carried overhead. For both the horizontal and vertical separator
orientations, the maximum terminal vapor velocity, V, is calculated by a Souders-
Brown equation using the appropriate K value and the vapor and liquid densities [82].
The terminal vapor velocity is used to determine the diameter of vertical separators
and length of horizontal separators where disengagement is controlling. In this study,
we have specified the material of construction for the vessels and the required corrosion
allowance. Other parameters necessary for calculating vessel dimensions are used at
their default values. The dimensions of various separation vessels as evaluated using
ProMax are listed in Table 5.3.
5.3.3 Rating heat exchangers
When rating heat exchangers, the parameter of most interest is the heat transfer area.
In this study, we have evaluated the heat transfer area for different heat exchangers
independent of ProMax. For every heat exchanger that is a part of the carbon capture
plant, the heat transfer rate, the inlet and outlet temperatures of the fluids and the
log mean temperature difference (LMTD) are known. These values can be used to
determine the heat transfer area by employing Equation 5.2, where Q is the heat

91
Table 5.3 : Dimensions of various separation vessels in the carbon capture plant
Stripper Pressure (kPa) → 50 75 150 175 200 250 300 50 75 150 175 200 250 300
Parameter (m) ↓ DEA (40 wt%) DGA (60 wt%)
SO2 Scrubber Diameter 9.8 9.8 9.8 9.8 9.8 9.8 9.8 9.8 9.8 9.8 9.8 9.8 9.8 9.8
SO2 Scrubber Height 10.2 10.3 10.3 10.2 10.2 10.2 10.2 10.2 10.2 10.2 10.2 10.2 10.2 10.2
Amine Condenser Diameter 5.5 4.9 4.0 3.8 3.8 3.5 3.4 5.6 5.0 4.1 3.8 3.7 3.5 3.4
Amine Condenser Height 6.5 5.8 5.1 4.9 4.8 4.6 4.4 6.9 6.1 5.0 4.7 4.5 4.3 4.2
2-Phase Separator 1 Diameter 4.3 4.3 0.0 0.0 0.0 0.0 0.0 4.4 4.4 0.0 0.0 0.0 0.0 0.0
2-Phase Separator 1 Height 5.2 4.9 0.0 0.0 0.0 0.0 0.0 5.3 5.0 0.0 0.0 0.0 0.0 0.0
2-Phase Separator 2 Diameter 2.0 2.0 1.8 1.8 1.7 1.5 1.7 2.0 2.1 2.0 1.8 1.7 1.5 1.7
2-Phase Separator 2 Height 3.0 3.1 2.9 2.9 2.9 2.8 2.9 3.0 3.0 2.9 2.9 2.9 2.8 2.9
Glycol Condenser Diameter 0.5 0.5 0.5 0.5 0.5 0.5 0.5 0.5 0.5 0.5 0.5 0.5 0.5 0.5
Glycol Condenser Height 1.9 1.9 1.9 1.9 1.9 1.9 1.9 1.9 1.9 1.9 1.9 1.9 1.9 1.9

92
Table 5.4 : Overall heat transfer coefficients for various heat exchangers (U)
Heat Exchanger Overall HT Coefficient (W/m2-K)
Flue Gas Cooler Surface Area 200.00
Amine Cooler Surface Area 1200.00
Lean/Rich Amine Heat Exchanger 1250.00
Amine Reboiler 3000.00
All Intercoolers 200.00
Glycol Reboiler 750.00
Glycol Cooler 500.00
Glycol Heat Exchanger 300.00

93Table 5.5 : Heat transfer surface areas for different heat exchangers in the carbon capture plant
Stripper Pressure (kPa) → 50 75 150 175 200 250 300 50 75 150 175 200 250 300
Surface area (m2) ↓ DEA (40 wt%) DGA (60 wt%)
Amine Heat EXCHR (x 103) 10.7 16.5 15.2 15.5 17.8 20.8 22.5 7.8 9.0 9.4 9.6 10.0 11.3 11.6
Cooler 1 (x 103) 3.3 3.3 3.3 3.3 3.3 3.3 3.3 3.3 3.3 3.3 3.3 3.3 3.3 3.3
Cooler 2 (x 103) 1.4 1.4 1.2 1.2 1.3 1.3 1.3 1.4 1.1 1.0 1.0 1.0 1.0 1.0
Amine Reboiler (x 103) 1.1 1.3 1.0 1.0 1.0 1.3 1.4 1.6 2.0 0.9 0.8 0.9 1.0 1.1
Intercooler 1 258 259 284 277 273 268 265 277 277 293 277 272 266 263
Intercooler 2 322 324 322 311 305 297 293 345 346 333 311 304 295 290
Intercooler 3 361 364 361 347 340 333 331 387 388 373 347 339 331 329
Intercooler 4 388 390 397 356 373 352 388 416 417 410 357 372 349 385
Intercooler 5 364 367 369 386 412 516 317 391 392 382 386 411 512 314
Intercooler 6 390 395 647 800 812 762 804 418 420 669 800 808 757 798
Intercooler 7 844 855 485 231 123 0 0 906 909 498 231 122 0 0
Glycol Reboiler 2.9 3.0 2.5 2.4 2.3 2.6 2.4 3.2 3.2 2.6 2.4 2.3 2.6 2.3
Glycol Cooler 3.8 3.7 3.3 3.0 2.9 3.0 2.9 4.1 4.0 3.4 3.0 2.9 3.0 2.9
Glycol Heat EXCHR 27 27 20 18 17 18 17 28 29 21 18 17 18 17
94
transfer rate, U is the overall heat transfer coefficient, A is the heat transfer area,
LMTD is the log mean temperature difference and f is the LMTD correction factor.
The LMTD correction factor (f) is a configuration correction factor which depends
on the exact arrangement of the streams within the heat exchangers, the number of
exchangers in series and the temperatures of the incoming and outgoing streams. F
factor values for various configurations of shell and tube heat exchangers, available
in published literature were used in this study [83]. Overall heat transfer coefficients
available in published literature and suitable for the fluids in each heat exchanger
were used to evaluate the heat transfer surface areas. These are summarized in Table
5.4 The heat transfer areas for the different heat exchangers in the carbon capture
plant are listed in Table 5.5.
Q = U · A · LMTD · f (5.2)
5.3.4 Rating Fluid Drivers
Fluid drivers are simpler to rate than separation columns, vessels and heat exchangers.
Booster pumps are rated on the basis of the liquid flowrate they process and their
dynamic fluid head. Gas blowers and compressors are rated on the basis of the input
vapor flowrates and their compression ratios. The dynamic fluid head for the pumps
employed in the amine absorption and glycol dehydration trains and the compression
ratios for the gas blower and compressors are listed in Table 5.6.
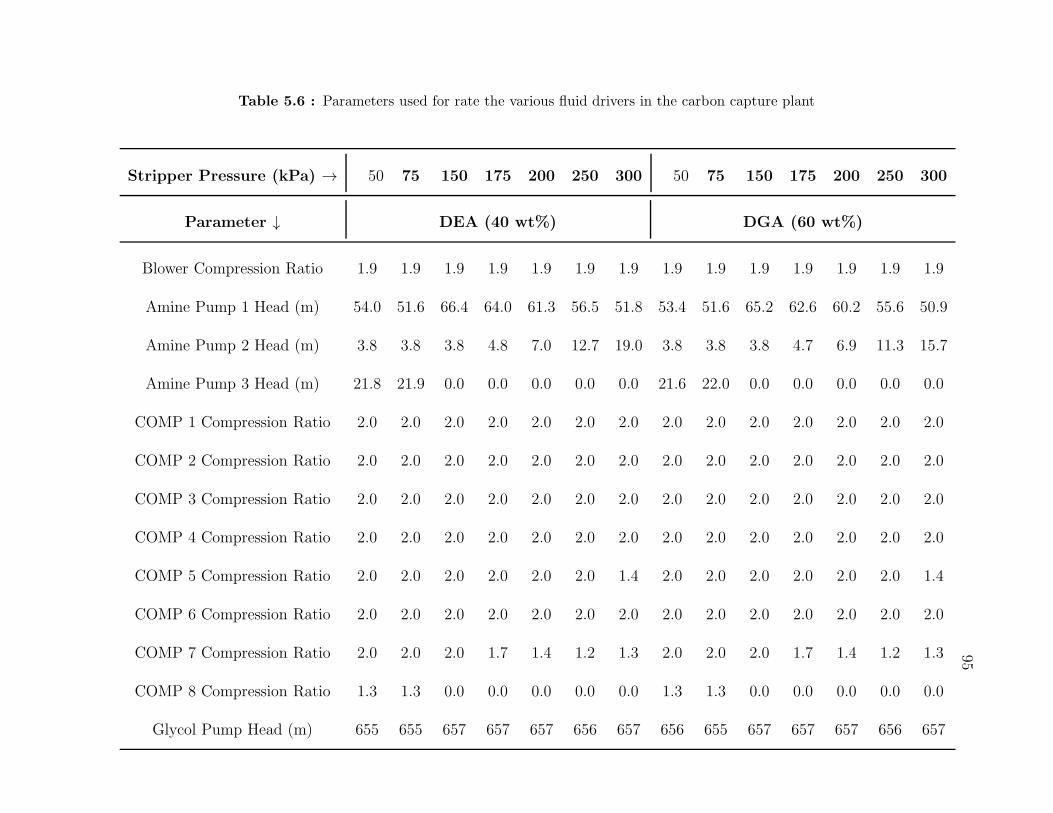
95Table 5.6 : Parameters used for rate the various fluid drivers in the carbon capture plant
Stripper Pressure (kPa) → 50 75 150 175 200 250 300 50 75 150 175 200 250 300
Parameter ↓ DEA (40 wt%) DGA (60 wt%)
Blower Compression Ratio 1.9 1.9 1.9 1.9 1.9 1.9 1.9 1.9 1.9 1.9 1.9 1.9 1.9 1.9
Amine Pump 1 Head (m) 54.0 51.6 66.4 64.0 61.3 56.5 51.8 53.4 51.6 65.2 62.6 60.2 55.6 50.9
Amine Pump 2 Head (m) 3.8 3.8 3.8 4.8 7.0 12.7 19.0 3.8 3.8 3.8 4.7 6.9 11.3 15.7
Amine Pump 3 Head (m) 21.8 21.9 0.0 0.0 0.0 0.0 0.0 21.6 22.0 0.0 0.0 0.0 0.0 0.0
COMP 1 Compression Ratio 2.0 2.0 2.0 2.0 2.0 2.0 2.0 2.0 2.0 2.0 2.0 2.0 2.0 2.0
COMP 2 Compression Ratio 2.0 2.0 2.0 2.0 2.0 2.0 2.0 2.0 2.0 2.0 2.0 2.0 2.0 2.0
COMP 3 Compression Ratio 2.0 2.0 2.0 2.0 2.0 2.0 2.0 2.0 2.0 2.0 2.0 2.0 2.0 2.0
COMP 4 Compression Ratio 2.0 2.0 2.0 2.0 2.0 2.0 2.0 2.0 2.0 2.0 2.0 2.0 2.0 2.0
COMP 5 Compression Ratio 2.0 2.0 2.0 2.0 2.0 2.0 1.4 2.0 2.0 2.0 2.0 2.0 2.0 1.4
COMP 6 Compression Ratio 2.0 2.0 2.0 2.0 2.0 2.0 2.0 2.0 2.0 2.0 2.0 2.0 2.0 2.0
COMP 7 Compression Ratio 2.0 2.0 2.0 1.7 1.4 1.2 1.3 2.0 2.0 2.0 1.7 1.4 1.2 1.3
COMP 8 Compression Ratio 1.3 1.3 0.0 0.0 0.0 0.0 0.0 1.3 1.3 0.0 0.0 0.0 0.0 0.0
Glycol Pump Head (m) 655 655 657 657 657 656 657 656 655 657 657 657 656 657

96
5.3.5 Generic simulation parameters employed for economic evaluation
In addition to the size and rating parameters listed in Tables 5.2 - 5.6, others param-
eters are required for providing an accurate economic evaluation of equipment costs.
This includes the material of construction, corrosion allowances, tower packing type,
amongst others. These parameters are summarized in Table 5.7.
5.4 Effects of variation in stripper pressure on cost of carbon
capture
In Chapter 4, we have discussed the effects of varying stripper pressure and reboiler
steam source on the energy cost of carbon capture and the parasitic power loss at the
reference power plant. As argued previously, however, such a technical analysis alone,
fails to identify the optimal operational configuration. The economic assessment
conducted in this chapter aids in analyzing the effect of stripper pressure and reboiler
steam source on the cost of various plant equipment and thus, the overall cost of the
carbon capture plant. In the following subsections, we discuss the effects of these
variations on the cost of major equipment such as amine absorber and stripper, the
lean/rich amine heat exchanger, the amine reboiler and the carbon dioxide (CO2)
compression train.

97
Table 5.7 : Generic parameters used in evaluation of equipment costs [20, 21, 22, 23]
Parameter Value
All equipment - Material of Construction Carbon Steel
Amine Absorber - Corrosion Allowance 3.2 mm
Amine Stripper - Corrosion Allowance 6.4 mm
Glycol Absorber - Corrosion Allowance 3.2 mm
Glycol Stripper - Corrosion Allowance 3.2 mm
Heat Exchanger Tubes - Corrosion Allowance 0.06 mm
Tower Packing Type Ceramic Intalox Saddle
All Absorbers - HETP 1.83 m
High Pressure Strippers - HETP 1.83 m
Vacuum Strippers - HETP 2.0 m

98
In current practice, it is common to construct these with carbon steel. However,
as discussed previously in Chapter 4; equipment corrosion problems are common-
place when alkanolamines are used as absorbents for carbon dioxide (CO2). To limit
the extent of corrosion; the carbon dioxide (CO2) loading of absorbent solutions is
maintained at or below 0.4 moles-CO2/mole of amine. Stainless steel equipment is
corrosion resistant, however, it can also cost 2x-3x higher than carbon steel equipment
of the same size and its commercial viability is questionable. In this study, we have
considered carbon steel as the standard material of construction.
5.4.1 Effect of variation in stripper pressure on the cost of amine absorber
and stripper
The amine absorber and stripper columns are central to the carbon dioxide (CO2)
absorption process and are thus, critical pieces of equipment. Several design parame-
ters such as equipment dimensions, pressure rating and material of construction play
a role in determining the cost of an equipment. In this study, all amine absorber
columns are operated at the same pressure - slightly above atmospheric pressure.
They also handle the same vapor flowrates since the flue gas inflow is the same across
all simulation cases. However, due to the lower reactivity and the resulting slower
reaction kinetics; absorber columns with diethanolamine (DEA) as the solvent are 5
times taller than those with diglycolamine (DGA). In addition, due to a difference in
the absorbent flowrate and the fluid properties, diethanolamine (DEA) columns have

99
Figure 5.1 : Dependence of absorber costs on stripper operating pressure
a slightly larger diameter than those for diglycolamine (DGA). Figure 5.1 shows the
variation in the cost (equipment + labor) of absorber columns for both diethanolamine
(DEA) and diglycolamine (DGA) with stripper pressure. It can be observed that for
a given absorbent choice, there is negligible variation in the cost of the amine ab-
sorber columns. This can be expected because the absorber diameters are only
weakly sensitive to the stripper operating pressure. The cost of absorber columns
for diethanolamine (DEA) as a solvent, however, are nearly 4 times those for diglyco-
lamine (DGA). This can be attributed to a combination of the larger column diameters
for diethanolamine (DEA) as well as the taller columns; both of which result in an
increase in the expenditure.
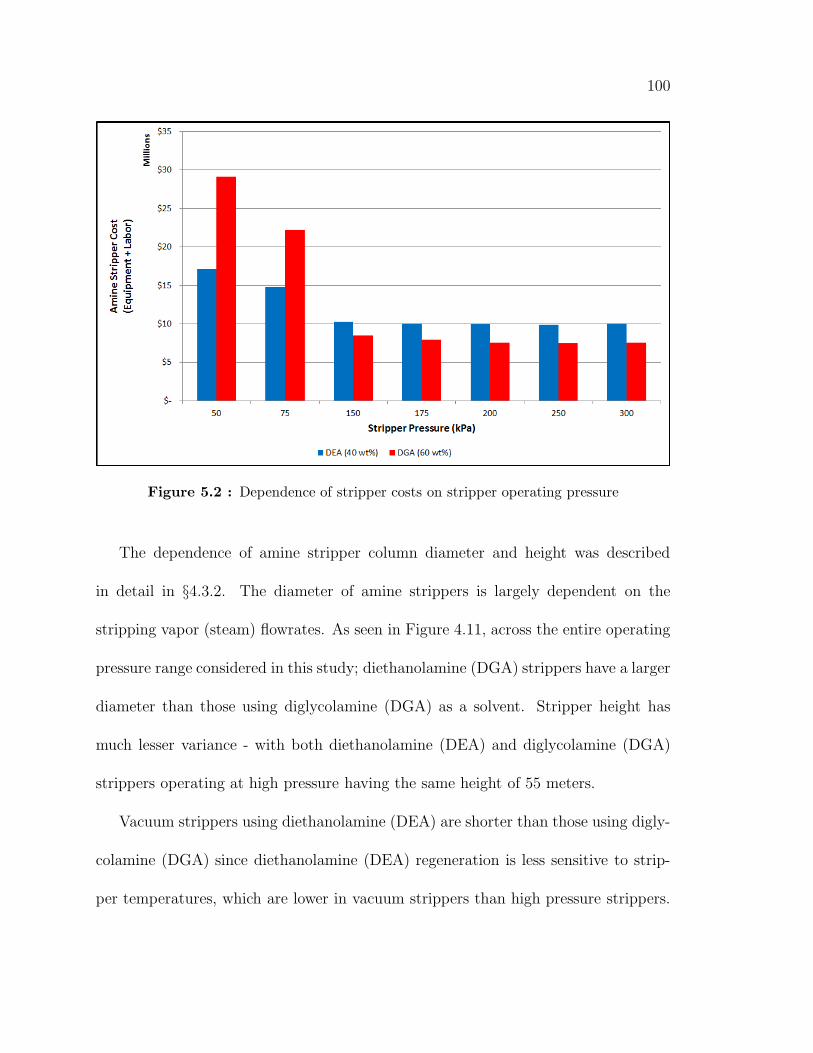
100
Figure 5.2 : Dependence of stripper costs on stripper operating pressure
The dependence of amine stripper column diameter and height was described
in detail in §4.3.2. The diameter of amine strippers is largely dependent on the
stripping vapor (steam) flowrates. As seen in Figure 4.11, across the entire operating
pressure range considered in this study; diethanolamine (DGA) strippers have a larger
diameter than those using diglycolamine (DGA) as a solvent. Stripper height has
much lesser variance - with both diethanolamine (DEA) and diglycolamine (DGA)
strippers operating at high pressure having the same height of 55 meters.
Vacuum strippers using diethanolamine (DEA) are shorter than those using digly-
colamine (DGA) since diethanolamine (DEA) regeneration is less sensitive to strip-
per temperatures, which are lower in vacuum strippers than high pressure strippers.

101
Thus, diethanolamine (DEA) vacuum strippers have a height of 60 meters as com-
pared to diglycolamine (DGA) strippers which are 90 meters tall. Figure 5.2 shows
the dependence of stripper costs (equipment + labor) on stripper pressure. A clear
trend can be seen from the plot - amine stripper costs decrease significantly when
the pressure increases from 50 kilopascals (kPa) to 150 kilopascals (kPa); which sig-
nifies the transition from vacuum strippers to high pressure strippers. Between 150
kilopascals (kPa) and 300 kilopascals (kPa), however, there is insignificant change
in the stripper cost. This is contrary to the trend observable in Figure 4.11 where
the stripper diameter decreases consistently as the operating pressure increases. All
other factors unchanged, a reduction in column diameter should result in decrease
in costs - which is contrary to the observation of this study. This can be explained
by a change in the pressure and temperature rating of the amine strippers. As the
stripper pressure is increased from 150 kilopascals (kPa) to 300 kilopascals (kPa), the
additional internal pressure and temperature must be accounted for in the construc-
tion of the column by increasing its thickness. This negates any potential savings
that maybe achieved through a reduction in column diameter. As might be expected,
however, the larger diethanolamine (DEA) columns are slightly more expensive than
diglycolamine (DGA) columns at all stripper pressures except when operating under
vacuum.

102
5.4.2 Effect of variation in stripper pressure on the cost of lean/rich
amine heat exchanger
The lean/rich amine heat exchanger plays a critical role at an amine absorption facil-
ity by transferring a large quantity of sensible heat from the hot, lean amine solution
exiting the reboiler to the cooler, rich amine solution entering the stripper column.
The quantity of heat exchanged depends on factors such as the absorbent flowrate,
lean and rich amine inlet temperatures. From Table 4.5, we can observe that for the
stripper operating pressure range considered in this economic analysis (50 kilopas-
cals (kPa) to 300 kilopascals (kPa); the absorbent flowrate for all of diethanolamine
(DEA) cases is higher than those for diglycolamine (DGA). For vacuum strippers,
the difference in flowrates ranges between 7% and 27 % whereas for high pressure
strippers, the difference is almost constant at approximately 25%. Consequently, as
listed in Table 4.4; the heat exchanger duty for diethanolamine (DEA) cases is higher
than the diglycolamine (DGA) systems by between 25% - 40%. With the minimum
end approach temperature for the lean/rich heat exchanger across all system config-
urations at a constant 5o C; the larger heat transfer rate translated into a larger heat
transfer surface area in the exchanger. Figure 5.3 shows the variation in the cost of
lean/rich amine heat exchanger with stripper pressure. The dependence of amine heat
exchanger costs closely followed the trend in amine heat exchanger surface area seen
in Table 5.5. As with the costs of the amine absorber and stripper columns in §§5.4.1,
diglycolamine (DGA) heat exchangers significantly less than those for diethanolamine

103
Figure 5.3 : Dependence of amine heat exchanger costs on stripper operating pressure
(DEA) systems; by as much as 60% in some configurations.
5.4.3 Effect of variation in stripper pressure on the cost of amine reboiler
The amine reboiler located at the base of the stripper is a heat exchanger where a
part of the lean amine solution is vaporized to generate stripping vapor that flows
through the column. The amine reboilers utilize steam as the heating fluids. Reboilers
in vacuum strippers utilize steam at 122 kilopascals (kPa) whereas those in high
pressure stripper columns use steam at 450 kilopascals (kPa). In this entire study,
we have chosen to maintain a constant pressure for the reboiler steam across different
stripper pressures. Consequently, the minimum end approach temperature and the

104
Figure 5.4 : Dependence of amine reboiler costs on stripper operating pressure
log mean temperature difference (LMTD) in the reboiler varies with a change in
stripper operating pressure. Figure 5.4 shows the variation in the cost of the amine
reboiler with stripper pressure. Similar to the lean/rich amine heat exchanger,
reboiler costs rise as the stripper pressure is increased. This results from a decrease
in the log mean temperature difference (LMTD) with an increase in stripper pres-
sure; which results in a need for greater heating surface area. Diethanolamine (DEA)
reboilers have lower costs than diglycolamine (DGA) in the vacuum stripping config-
uration due to the relatively lower reboiler duty. However, for high pressure strippers;
diglycolamine (DGA) has a slightly lower reboiler duty than diethanolamine (DEA)
which lowers the cost by 10%-20%.

105
Figure 5.5 : Dependence of carbon dioxide (CO2) compression train costs on stripper
operating pressure
5.4.4 Effect of variation in stripper pressure on the cost of carbon dioxide
(CO2) compression train
Carbon dioxide (CO2) compression is a significant contributor to the energy consump-
tion and the parasitic power loss at coal-fired power plant. Carbon dioxide (CO2)
leaving the amine absorption plant must be compressed to a pressure of 16 Megapas-
cals (MPa) for long distance transportation through pipelines. Compressor units are
costed on the basis of the compression ratio of the outgoing and incoming vapor and
the input vapor flowrate. In case of the compression train, no particular absorbent
has an advantage over another since the cost is dependent only on the quantity of car-

106
bon dioxide (CO2) separated - which is the same for both diethanolamine (DEA) and
diglycolamine (DGA). Figure 5.5 shows the variation in the cost of the compression
train with a change in stripper pressure. A clear trend can be observed in this plot
- both vacuum stripping configurations have the same equipment cost whereas the
compression costs decrease steadily with an increase in stripper pressure. All of this
observed behavior can be attributed to the delivery pressure of the separated carbon
dioxide (CO2) to the compression train. In case of vacuum strippers, irrespective of
the stripper pressure; the carbon dioxide (CO2) is delivered at atmospheric pressure
- due to the use of a steam jet ejector. In case of the high pressure strippers, the
compressors must process a decreasing volume of carbon dioxide (CO2) with increase
stripper pressure which results in a lowering of compressor costs.
5.4.5 Effect of variation in stripper pressure on the overall cost of carbon
capture plant
Figure 5.6 shows the dependence of the cost of a carbon capture plant on the stripper
operating pressure. A more complete breakdown of plant costs is provided in Tables
5.8, 5.9 and 5.10. Clearly, Figure 5.6 is a culmination of the major trends observed in
Figures 5.1 - 5.5. Carbon capture trains with vacuum strippers clearly cost more than
high pressure strippers. Carbon capture plants with amine strippers operating at 75
kilopascals (kPa) cost approximately 25% more than those with strippers operating
at 150 kilopascals (kPa). In case of diethanolamine (DEA) systems, plant cost has

107
Figure 5.6 : Dependence of the overall cost of carbon capture plants on stripper
operating pressure
a minimum when operating at 150 kilopascals (kPa) with the cost maximum at 75
kilopascals (kPa) and 300 kilopascals (kPa) stripper systems. In contrast, diglyco-
lamine (DGA) high pressure strippers costs have negligble dependence on stripper
operating pressure. These numbers about the cost of carbon capture plants under
various system configurations, now provide an opportunity to review their pros and
cons. Vacuum strippers are superior to high pressure strippers in that they operate
at a lower temperature, have lower corrosion problems, and can be constructed with
cheaper, less corrosion resistant materials.

108Table 5.8 : Individual cost of carbon capture plant equipment
Stripper Pressure (kPa) 50 75 150 175 200 250 300 50 75 150 175 200 250 300
Parameter DEA Absorption Train Cost ($ MM) DGA Absorption Train Cost ($ MM)
Blower 17.1 17.1 17.1 17.1 17.1 17.1 17.1 17.1 17.1 17.1 17.1 17.1 17.1 17.1
Cooler 1 2.6 2.6 2.9 2.9 2.9 2.9 2.9 2.6 2.6 2.9 2.9 2.9 2.9 2.9
Amine Absorber 27.3 26.6 27.2 27.2 26.9 26.9 26.9 7.3 6.6 6.6 6.6 6.6 6.6 6.6
Cooler 2 1.3 1.3 1.3 1.3 1.3 1.3 1.3 1.3 1.2 1.1 1.1 1.1 1.1 1.1
Amine Heat EXCHR 16.1 27.6 26.1 27.0 29.7 42.4 45.1 10.1 14.4 14.9 14.9 15.4 16.7 17.1
Amine Pump 1 1.4 1.4 1.3 1.3 1.3 1.3 1.3 1.3 1.0 1.1 1.0 1.0 1.0 1.0
Amine Pump 2 0.9 0.9 0.9 0.9 0.9 0.9 1.1 0.9 0.7 0.6 0.7 0.7 0.7 0.7
Amine Pump 3 1.2 1.2 0.0 0.0 0.0 0.0 0.0 1.1 0.8 0.0 0.0 0.0 0.0 0.0
Amine Reboiler 1.3 3.0 1.2 1.6 1.2 1.3 1.4 1.9 3.3 1.1 1.0 1.1 1.1 1.1
Amine Stripper 17.1 14.8 10.3 10.1 9.9 9.9 10.0 29.1 22.3 8.5 8.0 7.6 7.5 7.6
SO2 Scrubber 2.9 2.9 2.9 2.9 2.9 2.9 2.9 2.9 2.9 2.9 2.9 2.9 2.9 2.9
Amine Condenser 1.3 1.1 0.8 0.7 0.7 0.7 0.7 1.3 1.1 0.8 0.7 0.7 0.7 0.7
2-Phase-separator 1 1.2 0.7 0.0 0.0 0.0 0.0 0.0 1.3 0.8 0.0 0.0 0.0 0.0 0.0
Steam Eductor 1.3 1.3 0.0 0.0 0.0 0.0 0.0 1.3 1.3 0.0 0.0 0.0 0.0 0.0

109Table 5.9 : Individual cost of carbon capture plant equipment (contd..)
Stripper Pressure (kPa) 50 75 150 175 200 250 300 50 75 150 175 200 250 300
Parameter DEA Absorption Train Cost ($ MM) DGA Absorption Train Cost ($ MM)
COMP 1 9.1 9.1 6.3 6.3 5.3 5.3 5.2 9.2 9.2 6.3 6.3 5.3 5.3 5.2
COMP 2 5.3 5.3 5.3 5.2 5.2 5.2 4.2 5.3 5.3 5.3 5.2 5.2 5.2 4.2
COMP 3 5.2 5.2 4.1 4.1 4.2 4.1 4.1 5.2 5.2 4.2 4.1 4.2 4.1 4.1
COMP 4 4.1 4.1 4.1 4.1 4.1 4.2 4.2 4.2 4.2 4.2 4.1 4.1 4.2 4.2
COMP 5 4.1 4.1 4.2 4.2 4.9 4.9 4.2 4.2 4.2 4.2 4.2 4.9 4.9 4.2
COMP 6 4.9 5.0 4.9 4.8 4.8 4.7 4.8 5.0 5.0 5.0 4.8 4.8 4.7 4.7
COMP 7 4.8 4.8 4.5 4.2 4.1 3.8 3.9 4.8 4.8 4.6 4.2 4.1 3.8 3.9
COMP 8 3.9 4.0 0.0 0.0 0.0 0.0 0.0 4.0 4.0 0.0 0.0 0.0 0.0 0.0
Intercooler 1 0.6 0.6 0.6 0.6 0.6 0.6 0.6 0.6 0.6 0.6 0.6 0.6 0.6 0.6
Intercooler 2 0.6 0.6 0.6 0.6 0.6 0.6 0.6 0.6 0.6 0.6 0.6 0.6 0.6 0.6
Intercooler 3 0.6 0.6 0.6 0.6 0.6 0.7 0.7 0.6 0.6 0.6 0.6 0.6 0.7 0.7
Intercooler 4 0.7 0.7 0.7 0.7 0.7 0.7 0.8 0.7 0.7 0.7 0.7 0.7 0.7 0.8
Intercooler 5 0.7 0.7 0.7 0.8 0.8 1.0 0.8 0.7 0.7 0.7 0.8 0.8 1.0 0.8

110
Table 5.10 : Individual cost of carbon capture plant equipment (contd..)
Stripper Pressure (kPa) 50 75 150 175 200 250 300 50 75 150 175 200 250 300
Parameter DEA Absorption Train Cost ($ MM) DGA Absorption Train Cost ($ MM)
Intercooler 6 0.8 0.8 1.4 1.7 2.0 2.2 2.0 0.9 0.9 0.3 1.7 2.0 2.2 2.0
Intercooler 7 2.1 2.1 1.6 1.1 0.9 0.0 0.0 2.1 2.1 1.6 1.1 0.9 0.0 0.0
2-Phase-separator 2 0.4 0.4 0.5 0.5 0.4 0.4 0.5 0.4 0.4 0.5 0.5 0.4 0.4 0.0
Glycol Absorber 1.3 1.3 0.5 0.5 0.5 0.5 0.5 1.4 1.4 0.5 0.5 0.5 0.5 0.5
Glycol Stripper 0.3 0.3 0.1 0.1 0.1 0.1 0.1 0.3 0.3 0.1 0.1 0.1 0.1 0.1
Glycol Pump 0.3 0.3 0.1 0.1 0.1 0.1 0.1 0.3 0.3 0.1 0.1 0.1 0.1 0.1
Glycol Cooler 0.2 0.2 0.1 0.1 0.1 0.1 0.1 0.2 0.2 0.1 0.1 0.1 0.1 0.1
Glycol Heat Exchanger 0.3 0.3 0.1 0.1 0.1 0.1 0.1 0.3 0.3 0.1 0.1 0.1 0.1 0.1
Glycol Reboiler 0.2 0.2 0.1 0.1 0.1 0.1 0.1 0.2 0.2 0.1 0.1 0.1 0.1 0.1
Glycol Condenser 0.2 0.2 0.1 0.1 0.1 0.1 0.1 0.2 0.2 0.1 0.1 0.1 0.1 0.1

111
In the presence of a suitable source of waste heat, carbon capture facilities with
vacuum strippers have significantly lower parasitic power losses than high pressure
strippers. Systems with high pressure strippers, as seen in Figure 5.6 are less costly to
construct and are not dependent on the availability of waste heat sources. However,
corrosion can be a serious concerns especially at elevated pressures; which also result
in higher temperatures.
5.5 Concluding Remarks
Based on the economic evaluation of the carbon capture facility at the reference
coal-fired power plant, we have drawn the following conclusions:
1. Carbon capture facilities benefit from operating strippers at higher pressure due
to a decrease in the parasitic power loss. However, we have found no significant
reduction in the capital expenses. In case of diethanolamine (DEA), there is
an increase in the capital expenditure with an increase in the stripper pressure.
Thus, the choice of operating pressure narrows down to choosing a configuration
with lower capital costs and minimal operational problems.
2. In general, carbon capture plants utilizing vacuum stripping technology are
more capital intensive than those using high pressure strippers. The specific
magnitude of this cost difference is sensitive to the absorbent used in the process.
Based on our results, we conclude that diglycolamine (DGA) at high concen-
trations is a more suitable choice for absorbent than diethanolamine (DEA). It

112
maybe generalized that slower reacting absorbents will require longer absorber
columns which increase the capital expenditure significantly.
3. Since the parasitic power loss at carbon capture plants with vacuum strippers at
power plants lacking waste heat sources is almost comparable with that of high
pressure strippers, the additional capital expenses incurred are not justified.
At facilities with sufficient waste heat supply, however, carbon capture systems
with vacuum stripping are more likely to be considered due to their significant
energy savings and increased, but reasonable capital expenses.

113
Chapter 6
Development of superior absorbents for carbon
dioxide (CO2) removal: emphasizing the role of
the solvent
6.1 Motivation
State-of-the-art amine absorption technology utilizes aqueous solutions of alkanolamines
such as monoethanolamine (MEA), diethanolamine (DEA), diglycolamine (DGA) and
several other similar compounds. The scientific rationale behind the use of these
chemical absorbents along with water - a physical absorbent (albeit, a poor one) was
to achieve good gas absorption even under conditions of low acid gas partial pressure.
Since the days of the invention of triethanolamine (TEA) in 1930, scientific research
has almost solely focused on the development of superior compounds for use as chem-
ical absorbents [84]. This has led to the development of novel chemical absorbents
such as hindered amines, alkanolamine blends and activated absorbents such as acti-
vated methyldiethanolamine (MDEA) and piperazine (PZ) promoted aqueous potas-
sium carbonate (K2CO3). Few of these novel absorbents have been widely accepted

114
in commercial operation and even fewer have resulted in a quantum leap in acid gas
removal technology. As was been discussed in previous chapters, monoethanolamine
(MEA) is still widely considered the standard absorbent for gas treating and carbon
dioxide (CO2) capture. In spite of a high heat of reaction, it has the highest reactivity
with carbon dioxide (CO2) amongst all alkanolamines and a low molecular weight;
both of which are very important characteristics in a good absorbent. When search-
ing for a better absorbent, with the focus being on reducing energy consumption;
one must develop compounds with a lower heat of reaction than monoethanolamine
(MEA) without compromising much on the chemical reactivity. These two charac-
teristics, however, have an direct relationship - lower the heat of reaction and you
get a slower reacting amine and vice versa. As a result, few novel alternatives to mo-
noethanolamine (MEA), diethanolamine (DEA) and diglycolamine (DGA) have been
commercialized beyond pilot-scale plants. The research presented in this chapter has
been motivated by a curiosity to develop a deeper understanding for the distribution
of reboiler duty amongst the physiochemical processes occurring in the stripper unit.
Further, we examine the role that a solvent (e.g. water) plays in determining the
reboiler energy duty and present a few proof-of-concept studies to estimate energy
savings when methanol is added to diethanolamine (DEA) as an absorbent.

115
6.2 Research Approach
Removal of carbon dioxide (CO2) from flue gas for carbon capture application is very
energy intensive. Energy is provided by low pressure steam to a reboiler installed at
the base of the stripper column. Reboiler energy consumption is commonly reported
in terms of the energy consumed per unit mass of separated carbon dioxide (CO2).
However, energy consumed in the stripper column is utilized for three different phys-
iochemical processes. These are:
1. Sensible Heating: Increasing the temperature of the incoming fluids to the
operating temperature of the stripper column
2. Heat of Reaction: Energy required to drive the endothermic carbon dioxide
(CO2) desorption reaction
3. Generation of stripping vapor: Energy consumed to vaporize a part of the
solvent (mostly water) to generate stripping vapor responsible for diluting the
desorbed carbon dioxide (CO2)
Dissecting the reboiler energy consumption into the above constituent processes
can be helpful in developing a deeper insight into stripper operation and the influence
of absorbent selection. Energy required for absorbent regeneration in the stripper
can be described as the sum of contributions of three processes, as shown below in
Equation 1 [85].

116
Qreboiler = Qreaction + Qsensible + Qstripping (6.1)
In Equation 6.1, Qreboiler is the reboiler duty, Qreaction is the heat of reaction for
desorption of carbon dioxide (CO2), Qstripping is the energy consumed to generate
stripping vapor (steam) and Qsensible is the energy required for sensible heating of
the incoming rich amine solution to the stripper operating temperature. To evaluate
these three component terms, we have to make the following simplifying assumptions.
1. All stripping vapor (steam) is condensed in the partial condenser and returned
to the reboiler. Thus, the condenser duty corresponds to the energy carried by
the stripping vapor (steam)
2. Heat of reaction for the amine CO2 desorption reaction is independent of tem-
perature, pressure and amine concentration
Qreboiler = mvapor · Hvapor − mcondensate · Hcondensate (6.2)
Qstripping = mmoist CO2 · Hmoist CO2 − mreflux · Hreflux − mdry CO2 · Hdry CO2 (6.3)
Qreaction = mCO2 ·∆Hreaction (6.4)
Qreboiler is the net energy provided to reboiler by condensing steam. As represented in
Equation 6.2, it is the difference between the enthalpy of entering steam and exiting
condensate. Based on assumption # 1 above, Qstripping is the condenser duty, which
can be evaluated by performing an energy balance on the partial condenser. Based on

117
assumption #2, Qreaction is the energy required to drive the endothermic amine-CO2
desorption reaction. Using equations 6.1, 6.2, 6.3 and 6.4, we can calculate Qsensible
which remains as the unknown from Equation 6.1. With the value of Qstripping, Qsensible
and Qreaction known; the effect of various system parameters on their contribution to
Qreboiler can be studied.
6.3 Contribution of various constituent physiochemical pro-
cesses to reboiler duty
Use of the equations developed in §6.2 allows for the evaluation of the energy con-
sumption by the physiochemical processes occurring in the stripper and reboiler units.
Figure 6.1 shows the energy required to generate the stripping vapors (mostly steam)
flowing in the stripper column. It can be clearly observed that irrespective of the
choice of absorbent, energy consumption decreases as the stripper pressure is in-
creased from 30 kilopascals (kPa) to 300 kilopascals (kPa). A noticeable feature of
the plot is the significantly higher energy consumption for generating stripping vapor
under vacuum stripping conditions. While all three absorbents exhibit this behavior,
the increase is particularly noticeable for monoethanolamine (MEA). The signifi-
cantly higher energy required to generate stripping vapors with monoethanolamine
(MEA) can be attributed to a lower partial pressure of carbon dioxide (CO2) in equi-
librium with the monoethanolamine (MEA), especially at low amine loadings. The
dependence of the energy duty for generation of stripping vapor on stripper pressure is
118
remarkably stronger for monoethanolamine (MEA) than for the other two amines and
this maybe attributed to the higher sensitivity of the equilibrium partial pressure of
carbon dioxide (CO2) on temperature. Thus, for the same reduction in stripper pres-
sure and hence, temperature; energy requirement for the monoethanolamine (MEA)
system increases more rapidly. In general, the drop in energy consumption with an
increase in stripper pressure is a result of the change (increase) in the ratio of the
partial pressures of carbon dioxide (CO2) and water with an increase in stripper pres-
sure. One of the most noticeable features of Figure 6.1 is its close similarity to trend
in Figure 4.9, which presents the effect of stripper pressure on the reboiler duty. This
suggests that the energy consumed for generating stripping vapor is a strong con-
tributor to the overall pressure sensitivty of the reboiler duty. Figure 6.2 is a plot
of the lumped contribution of sensible heating and heat of reaction to reboiler heat
duty. As seen in the plot, the combined contribution of these two processes is near
constant and is only weakly sensitive to changes in stripper pressure. This confirms
the hypothesis made previously that the pressure sensitivty of reboiler duty is a direct
result of changes to the stripping vapor generation duty.
The dependence of stripping vapor (steam) requirement on pressure can itself
be explained by analyzing the ratio of partial pressure of carbon dioxide (CO2) in
equilibrium with the rich amine solution to that of water. Using a modified form
of the Clausius-Clapyeron equation (6.5), the ratio of the partial pressure of carbon
dioxide (CO2) to water can be expressed as shown below [85].

119
Figure 6.1 : Contribution of stripping vapor energy consumption to reboiler heat duty
Figure 6.2 : Lumped contribution of heat of reaction and sensible heating duty to the
reboiler heat duty

120
(
psatwat
psatco2
)
=
(
psatwat,T ref
psatco2,T ref
)
·
([
T − Tref
RTTref
]
[∆Hvap,H2O −∆Habs,CO2]
)
(6.5)
Figure 6.3 shows the changes in ratio of the partial pressures of carbon diox-
ide (CO2) and water at different temperatures between carbon dioxide (CO2) and
carbon dioxide (CO2) for monoethanolamine (MEA), diethanolamine (DEA) and
diglycolamine (DGA). The partial pressure of carbon dioxide (CO2) presented here
is measured above an aqueous alkanolamine solution with a carbon dioxide (CO2)
loading of 0.5 moles-CO2/mole-amine [86, 9, 87, 88, 89]. As seen here, this ratio
increases rapidly with temperature which results in a sharp reduction in the strip-
ping vapor requirement and thus, the reboiler duty. Figure 6.3 explains both the
pressure dependence of stripping vapor requirement and the higher reboiler duty for
monoethanolamine (MEA) as compared to diethanolamine (DEA) and diglycolamine
(DGA).
Figures 6.4, 6.5 and 6.6 show the contribution of each of the three physiochemical
processes to the total reboiler duty in percentage (%) terms. Clearly, at lower strip-
per pressures (and hence, temperatures); energy consumption to generate stripping
vapor dominates the reboiler duty. From the data presented in these figures, it is also
apparent that when primary amines - monoethanolamine (MEA) and diglycolamine
(DGA) are selected; a larger fraction of the reboiler duty is consumed to generate
stripping vapor. This can be explained on the basis of their relateively stronger bind-
ing with the absorbed carbon dioxide (CO2) and hence, a lower equilibrium partial
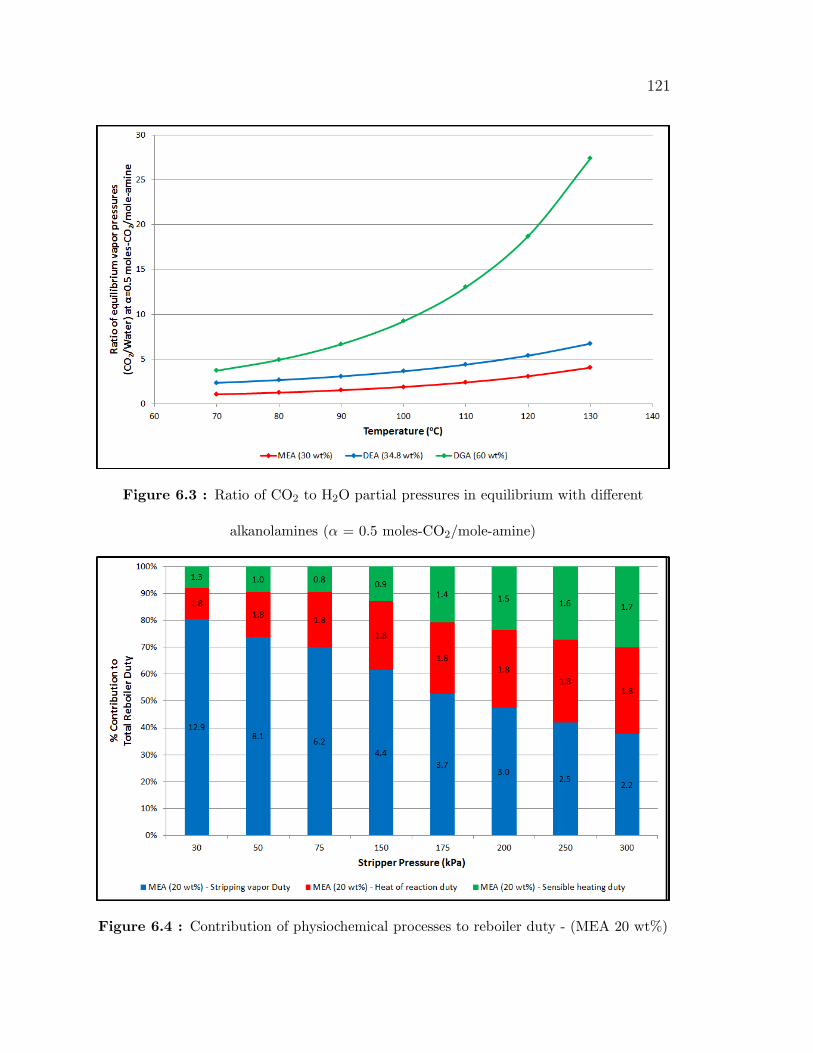
121
Figure 6.3 : Ratio of CO2 to H2O partial pressures in equilibrium with different
alkanolamines (α = 0.5 moles-CO2/mole-amine)
Figure 6.4 : Contribution of physiochemical processes to reboiler duty - (MEA 20 wt%)

122
Figure 6.5 : Contribution of physiochemical processes to reboiler duty - (DEA 40 wt%)
Figure 6.6 : Contribution of physiochemical processes to reboiler duty - (DGA 60 wt%)

123
pressure as compared the secondary amine - diethanolamine (DEA). The contribution
of energy consumed for the carbon dioxide (CO2)-amine desorption reaction is almost
independent of stripper pressure (it is assumed that the heat of reaction has no tem-
perature dependence, although in reality there is a weak temperature dependence).
As with stripping vapor generation energy duty, it is also apparent from the data that
the sensible heating requirement is slightly higher for diethanolamine (DEA) than for
monoethanolamine (MEA) and diglycolamine (DGA). This can be attributed to two
factors - a stripper temperature which is not significantly lower than that for the pri-
mary amines and a lower temperature for the rich amine exiting the absorber column
(due to its lower heat of reaction).
6.4 Role of the alkanolamine solvent
As discussed previously, all scientific research in the area of chemical absorption for
carbon dioxide (CO2) capture is focused on the development of better absorbent chem-
icals. However, commercially used absorbents are composed of between 7% (mole)
and 30% (mole) alkanolamine with the rest being water. Water has been the solvent
of choice for alkanolamines because it is ubiquitous, cheap and is miscible with most
amines in all proportions. This choice of solvent, however, plays a crucial role in
several of the physiochemical processes occuring during the absorption and stripping
processes. Since, water is the primary component of the circulating absorbent solu-
tion; it plays a determining role in physiochemical properties. These include carbon

124
dioxide (CO2) solubility, the carbon dioxide (CO2)-amine vapor liquid equilibrium,
solution viscosity, specific heat capacity, heat of vaporization, surface tension amongst
others. Carbon dioxide (CO2) solubility plays a key role in determining the rate of
mass transfer of carbon dioxide (CO2) from the vapor phase into the liquid. Specific
heat capacity of the solution is one of the factors that controls the degree of sensible
heating that must take place in the stripper. Similarly, the heat of vaporization of the
absorbent solution determines the energy input required to generate sufficient strip-
ping vapor in the column. Finally, a solvent can affect the vapor liquid equilibrium
that exists between the carbon dioxide (CO2) and the amine solution. From purely
an energy standpoint, the specific heat capacity and the heat of vaporization are the
two most important physiochemical properties of the selected solvent. A solvent with
a low specific heat capacity and low heat of vaporization might be preferable over
one with higher values for these two properties. Figures 6.7 and 6.8 show a compar-
ison between the specific heat capacity and the heat of vaporization for water and
a select few alcohols [68]. It is apparent from both these charts that most alcohols
are superior as compared to water on the basis of these two properties. The change
in solvent could further affect the rate of the carbon dioxide (CO2)-amine reaction
and will result in a novel ternary system, the vapor liquid equilibria for which could
be significantly different from that of the aqueous alkanolamine one. Based on this
scientific rationale, we hypothesize that if water used in the circulating alkanolamine
absorbent were to be replaced - partially or fully with an alcohol; then there are

125
Figure 6.7 : A comparison of the specific heat capacity of water and various alcohols
Figure 6.8 : A comparison of the heat of vaporization of water and various alcohols
126
potential energy savings to be achieved [35]. In the next section, we examine the
available information from published literature where the effects of alcohol addition
to aqueous alkanolamines have been studied to some extent. We have also assumed
vapor-liquid equilibrium to estimate the reboiler energy duty for scenarios where these
novel absorbent formulations are used in the amine absorption process.
6.5 Estimating the effect of addition of alcohol to alkanolamines
on energy consumption
6.5.1 A brief review of published literature
We have hypothesized in §6.4 that the complete or partial replacement of water in
industrial absorbents for carbon dioxide (CO2) removal can result in energy savings
in the absorption process. In order to estimate the energy consumption in the amine
absorption process using these novel solvent formulations, information is required
regarding the vapor-liquid equilibria (VLE) and heats of mixing for the quaternary
system involving the alkanolamine, water, alcohol and carbon dioxide (CO2). When
such thermodynamic data is available, it can be used to model the non-ideal be-
havior exhibited by the solvent by fitting available experimental data to a suitable
thermodynamic model (e.g. Non Random Two Liquids (NRTL), Electrolyte Non
Random Two Liquids (E-NRTL)). However, there is little information in published
literature documenting the effect of alcohols on the behavior of aqueous alkanolamine
systems. The thermodynamic behavior (vapor liquid equilibria (VLE) and heats of

127
mixing) of the ternary system - water, methanol and diethanolamine (DEA) has been
studied by Horstmann and coworkers. They have fitted the experimentally mea-
sured vapor liquid equilibria (VLE) and heats of mixing data to the Non Random
Two Liquids (NRTL) model and obtained the temperature dependent coefficients
for the expressions used to predict the binary interaction parameters [90]. Archane
and coworkers have studied the effect of methanol addition on the vapor-liquid equi-
librium to aqueous diethanolamine (DEA) at room temperature [91]. A similar,
however, much more detailed study was performed by Tounsi and coworkers to char-
acterize the vapor-liquid equilibrium for the quaternary system of water, methanol,
diethanolamine (DEA) and carbon dioxide (CO2) at 50oC, 60oC, 80oC, 100oC and
120oC. Additionally, they have attempted to correlate the measurements using the
Kent and Eisenberg approach for describing the behavior of alkanolamine systems
[92, 93]. Figure 6.9 shows the comparison between the equilibrium partial pressure of
carbon dioxide (CO2) for two different diethanolamine based absorbent blends at a
temperature at 100oC. The red curve represents a conventional aqueous alkanolamine
blend containing 34.8 % diethanolamine (DEA) by weight, balance water (Aq). The
blue curve shows the carbon dioxide (CO2) partial pressure for an absorbent blend
containing 40 % diethanolamine (DEA), 40 % water (Aq) and 20 % methanol (MeOH)
by weight. Clearly, under the temperature conditions at which conventional amine
strippers are operated; carbon dioxide (CO2) has a much higher partial pressure for
the formulation containing alcohol than the conventional absorbent. A higher carbon

128
Figure 6.9 : A comparison of the equilibrium partial pressure of carbon dioxide (CO2)
above two diethanolamine (DEA) based absorbent formulations at 100oC
dioxide (CO2) partial pressure for the absorbent is favorable in the stripper unit as it
results in lower stripping vapor requirement and potentially, a lower reboiler energy
consumption. It is however a disadvantage in the absorber unit because corresponding
to the same partial pressure of carbon dioxide (CO2) in the feed gas, a lower carbon
dioxide (CO2) loading can be achieved in the absorbent solution. This reduction in
the carbon dioxide (CO2) loading capacity of the absorbent must be compensated for
either by increasing the flue gas pressure or by increasing the absorbent circulation
rate.

129
6.5.2 Approach to estimating reboiler duty
Aqueous diethanolamine (DEA) blended with methanol is the most studied system of
its type in published literature. However, as discussed in §§6.5.1; even for this system,
there is no data on the heats of mixing for scenarios when carbon dioxide (CO2) has
been dissolved into the absorbent liquid. In the absence of sufficient thermodynamic
data, two different approaches can be adopted to estimate the reboiler duty. One
approach involves using available Non Random Two Liquid (NRTL) binary interac-
tion parameters for the ternary system - methanol, water and diethanolamine; and
fitting the Henry’s Law constant (without accounting for temperature dependence)
to match the vapor-liquid equilibrium (VLE) data. This approach involves the use
of a process simulation software such as AspenPlus or AspenHYSYS and the tedious
process of attempting to fit a suitable Henry’s Law constant. One source for error in
calculations conducted using this approach are the lack of temperature dependence
of the fitted Henry’s Law constant. Another source of error stems from the fact that
the Non Random Two Liquid (NRTL) model doesn’t account for the ionization of
the diethanolamine (DEA), water, carbon dioxide (CO2) and their reaction products
present in the liquid phase. Additionally, closed loop simulations in AspenPlus and
AspenHYSYS are difficult to converge in the absence of suitable guesses for system
parameters which are typically based on existing plant data.
An alternate and simpler approach involves assuming the existence of equilib-
rium between the vapor and liquid phases. This approach was widely used before

130
sophisticated rate-based models could be used in process simulators. In this ap-
proach, various system parameters such as the absorbent circulation rate, rich amine
loading and temperature, reboiler temperature and stripping vapor composition and
flow-rate, amongst others are calculated using available physical properties and vapor-
liquid equilibrium data and by performing simple, mass and enthalpy balances. The
reboiler duty itself can be calculated by estimating the energy consumed for gen-
erating stripping vapor, the sensible heating requirement for the absorbent solution
and energy consumed by the endothermic amine-CO2 desorption reaction. The main
source for error in the calculations performed using this approach is the assumption
for an ideal liquid phase which can result in calculated vapor pressures for water
and methanol that deviate from experimentally measured values. Additionally, since
the column calculations have to be performed manually and don’t involve the use of
process simulators; it is infeasible to predict the pressure and temperature profiles at
each stage/tray inside the column. The use of process simulators in this approach
is limited to predicting the pressure, temperature and physical properties of various
material streams.
Since our interest in performing these calculations is purely to produce a proof-
of-concept of our hypothesis; we have selected to utilize the simpler and faster equi-
librium method. In order to verify the validity of the results generated using this
approach, however, we first use vapor-liquid equilibrium data (VLE) from published
literature to estimate the reboiler duty for an aqueous diethanolamine (DEA) system

131
containing 34.8% amine by weight. We evaluate the reboiler duty for this system
under two different stripper operating pressures - 150 kilopascals (kPa) and 200 kilo-
pascals (kPa). The results are compared to those generated for the same system
conditions in ProMax. After establishing the validity of this approach, we proceed
to calculating the reboiler duties for a process using an absorbent formulation of 40
wt% diethanolamine (DEA), 40 wt% water and 20 wt% methanol under the same two
stripper operating pressures. We make several simplifying, yet reasonable assump-
tions to ease our calculations. These are listed below:
1. Flue gas entering the absorber column is composed of water, nitrogen(N2) and
carbon dioxide (CO2).
2. Exactly 90% of the incoming carbon dioxide (CO2) is removed.
3. The only component of flue gas transferring to the absorbent is carbon dioxide
(CO2). There is no loss of water, methanol or diethanolamine (DEA) occurring
in the absorber column. This is a reasonable assumption since nitrogen(N2) has
a very limited solubility in water and diethanolamine (DEA) has an extremely
low pressure even at high temperatures. In reality, some water and methanol
is transferred to the vapor phase; however, losses can be minimized by using a
solvent wash stage for recovery.
4. Decarbonized flue gas leaving the absorber is in thermal equilibrium with the
lean absorbent solution entering the column.

132
5. Rich absorbent solution leaving the absorber is compositionally in equilibrium
with the incoming flue gas. Thus, the rich amine loading is determined by the
temperature of amine solution and the partial pressure of carbon dioxide (CO2)
in the flue gas.
6. Vapors exiting the stripper column and entering the partial condenser are in
equilibrium with the incoming rich absorbent solution.
7. Energy consumed for sensible heating in the stripper column is the difference
between the enthalpies of the hot lean amine solution exiting the reboiler and
the rich absorbent entering the stripper.
8. For the cases involving aqueous diethanolamine blended with methanol, the
partial condenser is operated at a lower temperature than for the conventional,
aqueous diethanolamine (DEA) case to minimize methanol carryover with the
carbon dioxide (CO2). Carryover losses, if any, are assumed to be small.
9. The heat of reaction for the diethanolamine-CO2 reaction is unchanged by the
addition of methanol to aqueous diethanolamine (DEA).
In the following section, we discuss the framework used to performing the equilibrium
calculations. The results of these calculations are presented as well.

133
Figure 6.10 : Simplified schematic representation of a typical amine absorption unit
6.5.3 General framework for evaluating reboiler duty using equilibrium
approach
Figure 6.10 shows a schematic of an amine absorption plant complete with various
auxiliary units such as heat exchangers, coolers and pumps. When performing amine
absorption process calculations using the equilibrium approach method, the first
parameter to determine is the absorbent circulation rate. This is typically determined
by evaluating the carbon dioxide (CO2) loading of the lean and rich amine solutions
- using vapor-liquid equilibrium (VLE) and previously, plant data. Once these values
are fixed, the carbon dioxide (CO2) loading capacity of the absorbent solution is
known and the amine circulation rate can be determined on the basis of the carbon
dioxide (CO2) to be removed. Since, the absorbent composition is known a priori; the
absorbent circulation rate can be determined. In Equations 6.6 and 6.7, mDEA is the
molar flow rate of diethanolamine (DEA), mCO2 is the molar removal rate of carbon

134
dioxide (CO2), αrich and αlean are the carbon dioxide (CO2 loadings of rich and lean
absorbent, Mabsorbent is the mass flow-rate of the absorbent, MWDEA is the molecular
weight of diethanolamine (DEA) and wDEA is the weight fraction of diethanolamine
(DEA) in the absorbent.
mDEA =(mCO2)
(αrich − αlean)(6.6)
Mabsorbent =(mDEA ·MWDEA)
wDEA(6.7)
With the lean and rich absorbent flow-rates known, the outlet temperature of
the rich absorbent exiting the absorber can be evaluated by performing an enthalpy
balance on the absorber. There are a total of 4 material streams entering and exiting
the absorber. Additionally, there is an exothermic reaction taking place between
diethanolamine (DEA) and carbon dioxide (CO2) in the liquid phase. Equation 6.8
describes the enthalpy balance performed on the absorber column. In Equation 6.8,
Hrxn is the product of the mass flow-rate of carbon dioxide (CO2) and the heat of
reaction for the diethanolamine-CO2 reaction. The enthalpy of material streams is
the product of their mass flow-rates, specific heat capacities and temperatures. Since
the specific heat capacity of the rich amine solution itself has some temperature
dependence, an iterative procedure must be used to determine the temperature of
the rich absorbent stream.

135
Hrich =(
Hlean + Hgas,in + Hrxn
)
−(
Hgas,out
)
(6.8)
The next parameter to be determined is the reboiler temperature, which is also
the temperature of the lean absorbent stream exiting the reboiler. In industrial oper-
ation, it is common to set the stripper/reboiler bottoms pressure; which then makes
the stripper temperature a dependent variable. The pressure at the bottom of the
stripper/reboiler is the cumulative contribution of the vapor pressures of carbon diox-
ide (CO2) and other components of the liquid absorbent in equilibrium with the lean
absorbent solution at the reboiler temperature. This is represented mathematically
in Equation 6.9.
Pstripper/reboiler = PCO2 + PDEA + Pwater + PMeOH (6.9)
The reboiler temperature is determined by iteratively finding the temperature at
which PDEA, PWater, PMeOH (if present) and PCO2 - the partial pressure of carbon
dioxide (CO2) in equilibrium with the lean absorbent solution add up to the required
stripper pressure. Once the stripper pressure is determined, it is possible to deter-
mine the temperature of the rich absorbent solution entering the stripper column by
fixing the minimum end approach temperature in the lean/rich heat exchanger unit.
The pressure of the rich absorbent solution should be sufficiently high to avoid the
formation of a vapor phase through flash evaporation of the solution.
When the rich absorbent solution exits the lean/rich heat exchanger, it is at

136
a high pressure and doesn’t comprise of any vapor. However, its entry into the
stripper column; which is operated at a lower pressure results in flash evaporation
which results in a drop in its temperature, pressure and a change in its composition.
These flash calculations have been performed using the process simulation software -
ProMax. Once the compositions of the vapor and liquid phases in the entering rich
absorbent solution are determined, the pressure at the top of the stripper column can
be evaluated. In a process simulator like ProMax and AspenPlus, a rigorous mass
and energy balance is conducted on the top stage in the column to determine the
composition of the vapors leaving the stripper. In the equilibrium approach method,
the vapor composition can be determined by assuming it to be in equilibrium with
the ‘flashed’ rich absorbent solution. As before, the total pressure is the sum of
the partial pressures of carbon dioxide (CO2), diethanolamine (DEA), water and
methanol. In order to determine the flow-rates of each of these components in the
overhead vapors, we take advantage of the fact that the mass flow-rate of carbon
dioxide (CO2) is known (90% CO2 removal). With the molar composition and flow-
rate of carbon dioxide (CO2) known, the flow-rates of other components of the vapor
can be determined.
With all the necessary information available, we can begin reconstituting the
reboiler duty on the basis of the knowledge that it is the cumulative contribution
of the energy expended in generating the stripping vapors, for the endothermic
diethanolamine-CO2 desorption reaction and the sensible heat required to raise the

137
temperature of the incoming rich amine solution to that of the reboiler. The contribu-
tion of each of these terms is expressed in Equations 6.10, 6.11, 6.12 and 6.12. In these
equations, Qrxn, Qsensible, Qstripping and Qreboiler are the energy duties for heat of reac-
tion, sensible heating, stripping vapor generation and total reboiler duty respectively.
MCO2, MDEA, Mwater, MMeOH , Mrich and Mlean are the mass flow-rates for carbon
dioxide (CO2), diethanolamine (DEA), water, methanol, rich and lean absorbent re-
spectively. ∆Hvap,DEA, ∆Hvap,water and ∆Hvap,MeOH are the heats of vaporization for
diethanolamine, water and methanol respectively. cp,lean, cp,rich, Tlean and Tlean are
the specific heat capacity and temperatures of the lean and rich absorbent streams
respectively. In the next section, we apply this framework to calculating the reboiler
duty for two strippers operated at 150 kilopascals (kPa) and 200 kilopascals (kPa)
with 34.8 wt% diethanolamine (DEA) as the absorbent.
Qrxn = MCO2 ·∆Hrxn (6.10)
Qstripping = MDEA ·∆Hvap,DEA + Mwater ·∆Hvap,water + MMeOH ·∆Hvap,MeOH (6.11)
Qsensible =(
Mlean · cp,lean · Tlean
)
−(
Mrich · cp,rich · Trich
)
(6.12)
Qreboiler = Qsensible + Qstripping + Qreaction (6.13)

138
6.5.4 Evaluating reboiler duty for aqueous diethanolamine (DEA) sys-
tems
We have discussed in sufficient detail the assumptions that have been made in eval-
uating reboiler duty using the equilibrium approach method. Before applying the
framework developed in §§6.5.3 to aqueous diethanolamine (DEA) systems blended
with methanol, it is important to verify the validity of these assumptions and estimate
the degree of error they result in by comparing a baseline system against process sim-
ulator output. For this purpose, we have selected an aqueous diethanolamine (DEA)
system containing 34.8 wt% amine. Vapor-liquid equilibrium (VLE) data for this
system at a wide range of temperatures is available in published literature. Figure
6.11 shows the dependence of equilibrium partial pressure of carbon dioxide (CO2)
on amine loading for this system for a range of temperatures [94]. This vapor-liquid
equilibrium (VLE) data will be used throughout these baseline calculations.
Before applying the framework developed in §§6.5.3, certain parameters such as
the flue gas flow-rate, carbon dioxide (CO2) loading of lean amine solution must be
fixed. These are tabulated below in Table 6.1. Using these and the framework, other
relevant parameters including the compositions of various material streams can be
evaluated. In evaluating these parameters, the temperature dependence of the vapor
pressure of water is expressed using the Antoine equation shown in Equation 6.14
below.

139
Figure 6.11 : Vapor liquid equilibrium data for aqueous diethanolamine (DEA) 34.8 wt%
P = 10A−( B
C+T ) (6.14)
Table 6.1 lists the Antoine coefficients for water and methanol. Presented in Table 6.3
are the properties and composition of the decarbonized flue gas and the rich absorbent
streams exiting the absorber column. We have previously stated our assumption that
the only component transferred from vapor phase to the absorbent is carbon dioxide
(CO2). This allows evaluation of component mass flow-rates as well as the carbon
dioxide (CO2) loading of the absorbent. Temperature of the rich absorbent exiting
the column is an unknown and this can be evaluated by performing an enthalpy
balance on the absorber column. Enthalpy of reaction for the absorption of carbon

140
Table 6.1 : Antoine equation parameters for water and methanol
Component A B C Tmin (oC) Tmax (oC)
Water 8.07131 1730.63 233.426 1 100
Water 8.14019 1810.94 244.485 99 374
Methanol 8.08097 1582.27 239.7 15 100
Methanol 7.9701 1521.23 234 65 214
dioxide (CO2) is evaluated by linear interpolation between two values at different
temperatures obtained from published literature.
Table 6.4 summarized the composition and properties of the rich amine before
and after entering the stripper column. After exiting the absorber, the rich absorbent
solution is sufficiently pressurized to avoid 2-phase flow in the pipelines. Rich ab-
sorbent flows through the lean/rich heat exchanger which operates at a minimum
end approach temperature of 5oC. In order to simulate the flash evaporation of the
rich absorbent stream that takes place after entering the stripper column, the rich
absorbent is passed through a throttling valve in ProMax. As seen in Table 6.4, this
results in approximately 8oC drop in the amine temperature along with a decrease
in the amine loading due to the release of some carbon dioxide (CO2) into the vapor
phase.
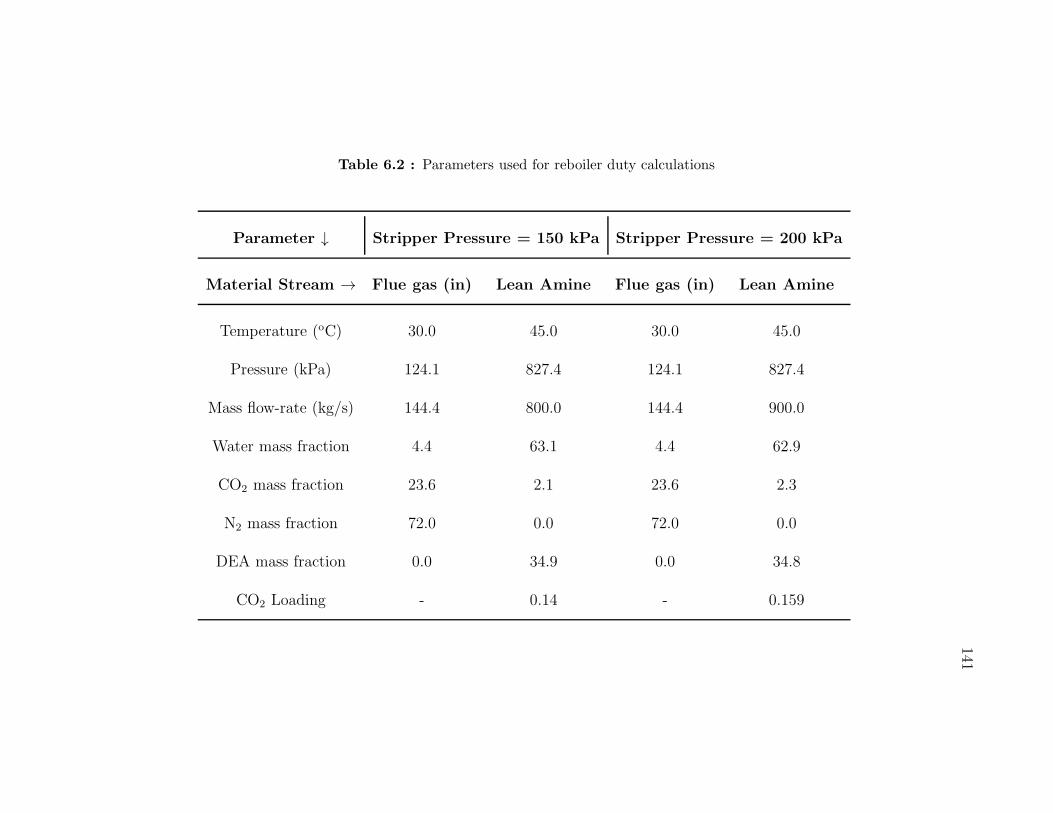
141
Table 6.2 : Parameters used for reboiler duty calculations
Parameter ↓ Stripper Pressure = 150 kPa Stripper Pressure = 200 kPa
Material Stream → Flue gas (in) Lean Amine Flue gas (in) Lean Amine
Temperature (oC) 30.0 45.0 30.0 45.0
Pressure (kPa) 124.1 827.4 124.1 827.4
Mass flow-rate (kg/s) 144.4 800.0 144.4 900.0
Water mass fraction 4.4 63.1 4.4 62.9
CO2 mass fraction 23.6 2.1 23.6 2.3
N2 mass fraction 72.0 0.0 72.0 0.0
DEA mass fraction 0.0 34.9 0.0 34.8
CO2 Loading - 0.14 - 0.159

142
Table 6.3 : Properties and composition of material streams exiting the absorber
Parameter ↓ Stripper Pressure = 150 kPa Stripper Pressure = 200 kPa
Material Stream → Flue gas (out) Rich Amine (out) Flue gas (out) Rich Amine (out)
Temperature (oC) 45.0 60.0 45.0 58.3
Pressure (kPa) 110.3 124.1 110.3 124.1
Mass flow-rate (kg/s) 113.7 830.7 113.7 930.7
Water mass fraction 5.5 60.7 5.5 60.8
CO2 mass fraction 3.0 5.7 3.0 5.5
N2 mass fraction 91.5 0.0 91.5 0.0
DEA mass fraction 0.0 33.6 0.0 33.7
CO2 Loading - 0.40 - 0.39

143
Table 6.4 : Properties and composition of rich absorbent: aqueous diethanolamine (DEA), before and after entering stripper
Parameter ↓ Stripper Pressure = 150 kPa Stripper Pressure = 200 kPa
Material Stream → To Stripper Flash (Liquid) Flash (Vapor) To Stripper Flash (Liquid) Flash (Vapor)
Temperature (oC) 102.9 94.4 94.4 109.1 101.4 101.4
Pressure (kPa) 455.1 136.2 136.2 524.0 186.2 186.2
Mass flow-rate (kg/s) 830.7 815.0 15.6 930.7 914.1 16.6
Water mass fraction 60.7 61.2 33.8 60.8 61.3 31.1
CO2 mass fraction 5.7 4.5 66.2 5.5 4.4 68.9
N2 mass fraction 0.0 0.0 0.0 0.0 0.0 0.0
DEA mass fraction 33.6 34.3 0.0 33.7 34.3 0.0
CO2 Loading 0.403 0.314 - 0.393 0.306 -

144Table 6.5 : Comparison of stripper operational parameters evaluated using equilibrium approach and ProMax
Parameter ↓ Stripper Pressure = 150 kPa Stripper Pressure = 200 kPa
Evaluation Method → Equilibrium Approach ProMax Equilibrium Approach ProMax
Reboiler Temperature (oC) 108.5 111.4 114.9 117.7
PCO2 (Reboiler, kPa) 27.0 26.3 48.6 64.2
PH2O (Reboiler, kPa) 123.1 123.7 151.4 135.8
PCO2 (Overhead, kPa) 44.5 54.8 63.2 82.8
PH2O (Overhead, kPa) 73.0 81.3 95.2 103.4
yCO2 (Overhead) 0.38 0.40 0.40 0.44
PH2O (Overhead) 0.62 0.60 0.60 0.56
CO2 Flow-rate (kg/s) 30.7 30.7 30.7 30.7
H2O Flow-rate (kg/s) 20.6 18.6 18.9 15.7
Reboiler Duty (GJ/ton-CO2) 3.70 3.64 3.65 3.4
% Difference 1.57 6.05

145
Since the objective of performing these calculations is to assess the validity of our
assumptions and to gauge the adequacy of the equilibrium approach in estimating
reboiler duty for alkanolamine systems, Table 6.5 provides a side-by-side comparison
of various stripper operational parameters obtained using the equilibrium approach
method and simulated using ProMax. The first and most important parameter to be
noted is the reboiler duty. As seen, at a stripper operating pressure of 150 kilopascals
(kPa), the difference between the two methods is less than 2%. At a higher pressure
of 200 kilopascals (kPa), the reboiler duty estimated by the equilibrium approach
calculations is 6% higher than that calculated with ProMax. Clearly, despite the sig-
nificant number of simplifying assumptions made in using the equilibrium approach;
reboiler duty estimated using this method is remarkably accurate. A more detailed
analysis of the data compiled in Table 6.5 shows that there is little difference be-
tween the reboiler temperatures estimated by the two methods. Additionally, vapor
phase compositions estimated using the two methods have only a small difference.
One parameter that differs noticeably between the calculations made using these two
methods is the stripper pressure at the top of column. Whereas the sum of the partial
pressures of carbon dioxide (CO2) and water as calculated by ProMax add up to the
required value (136 kilopascals (kPa) and 186 kilopascals (kPa)) after accounting for
a 14 kilopascals (kPa) pressure drop in the column, those estimated using the equilib-
rium approach deviate from this value by around 14%. This deviation is likely caused
by the inability of the equilibrium approach to account for liquid phase non-idealities

146
resulting from the presence of electrolytes. In spite of this, the comparison clearly
demonstrates the effectiveness of the equilibrium approach as a simple, fast and rea-
soanably reliable means of estimating reboiler duty. Having established the validity
of our selected approach, we next proceed to evaluating the operational parameters
and the reboiler duty for the aqueous diethanolamine (DEA) system blended with
methanol.
6.5.5 Evaluating reboiler duty for aqueous diethanolamine (DEA) blended
with methanol
In §§6.5.5 we have established the validity of applying the equilibrium approach
method as a means of estimating reboiler duty with the use of vapor-liquid equi-
librium (VLE) and physiochemical property data only. In this section, we apply
the principles developed in §§6.5.3 to evaluate the reboiler duty for the amine ab-
sorption process utilizing an aqueous diethanolamine (DEA) absorbent blended with
methanol. This absorbent is composed of 40 % diethanolamine (DEA) and water by
weight and 20 % methanol. Figure 6.12 shows the dependence of the carbon dioxide
(CO2) vapor pressure on the carbon dioxide (CO2) loading of the absorbent solution
and on temperature.
A comparison of Figures 6.11 and 6.12 shows that the addition of methanol results
in a significantly higher equilibrium vapor pressure of carbon dioxide (CO2). This
has two important implications, the first of which is a reduction

147
Figure 6.12 : Vapor liquid equilibrium data for aqueous diethanolamine (DEA) blended
with methanol (40:40:20 - wt%)
in the stripping vapor requirement in the desorber column and second, a reduction
in the maximum possible carbon dioxide (CO2) loading in the rich absorbent, which
in turn results in an increased absorbent circulation rate. This increase in absorbent
circulation rate can be limited by reducing the temperature of the absorbent solu-
tion entering the absorber column. This results in a relatively cooler rich absorbent
solution which can then absorb a greater quantity of carbon dioxide (CO2).
As before, the properties and composition of the lean absorbent solution and the
flue gas must be fixed before proceeding with the calculations. These are provided
in Table 6.6. The temperature and composition of the decarbonized flue gas and the
rich absorbent solution leaving the absorber is evaluated by performing a material
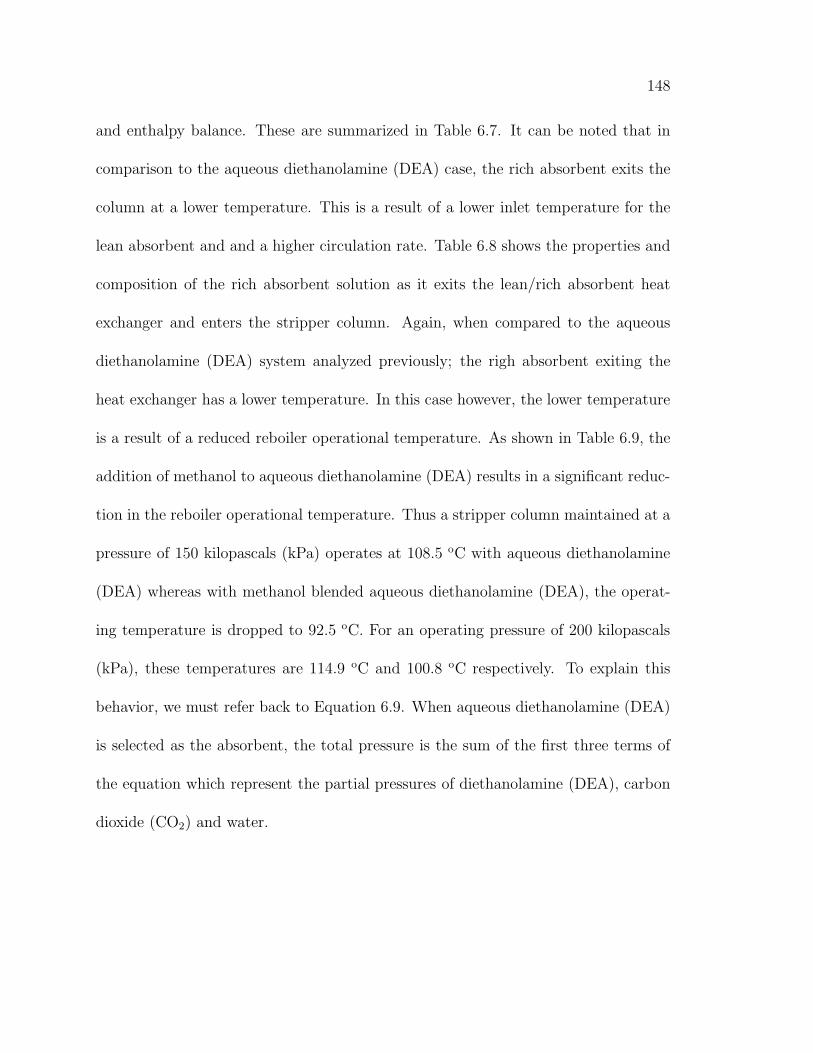
148
and enthalpy balance. These are summarized in Table 6.7. It can be noted that in
comparison to the aqueous diethanolamine (DEA) case, the rich absorbent exits the
column at a lower temperature. This is a result of a lower inlet temperature for the
lean absorbent and and a higher circulation rate. Table 6.8 shows the properties and
composition of the rich absorbent solution as it exits the lean/rich absorbent heat
exchanger and enters the stripper column. Again, when compared to the aqueous
diethanolamine (DEA) system analyzed previously; the righ absorbent exiting the
heat exchanger has a lower temperature. In this case however, the lower temperature
is a result of a reduced reboiler operational temperature. As shown in Table 6.9, the
addition of methanol to aqueous diethanolamine (DEA) results in a significant reduc-
tion in the reboiler operational temperature. Thus a stripper column maintained at a
pressure of 150 kilopascals (kPa) operates at 108.5 oC with aqueous diethanolamine
(DEA) whereas with methanol blended aqueous diethanolamine (DEA), the operat-
ing temperature is dropped to 92.5 oC. For an operating pressure of 200 kilopascals
(kPa), these temperatures are 114.9 oC and 100.8 oC respectively. To explain this
behavior, we must refer back to Equation 6.9. When aqueous diethanolamine (DEA)
is selected as the absorbent, the total pressure is the sum of the first three terms of
the equation which represent the partial pressures of diethanolamine (DEA), carbon
dioxide (CO2) and water.

149
Table 6.6 : Parameters used for reboiler duty calculations
Parameter ↓ Stripper Pressure = 150 kPa Stripper Pressure = 200 kPa
Material Stream → Flue gas (in) Lean Amine Flue gas (in) Lean Amine
Temperature (oC) 30.0 37.5 30.0 37.5
Pressure (kPa) 124.1 827.4 124.1 827.4
Mass flow-rate (kg/s) 144.4 950.0 144.4 950.0
Water mass fraction 4.4 37.4 4.4 37.4
CO2 mass fraction 23.6 2.6 23.6 2.6
N2 mass fraction 72.0 0.0 72.0 0.0
DEA mass fraction 0.0 40.0 0.0 40.0
MeOH mass fraction 0.0 20 0.0 20
CO2 Loading - 0.155 - 0.155

150
Table 6.7 : Properties and composition of material streams exiting the absorber
Parameter ↓ Stripper Pressure = 150 kPa Stripper Pressure = 200 kPa
Material Stream → Flue gas (out) Rich Amine (out) Flue gas (out) Rich Amine (out)
Temperature (oC) 37.5 51.8 37.5 51.8
Pressure (kPa) 110.3 124.1 110.3 124.1
Mass flow-rate (kg/s) 113.7 980.7 113.7 980.7
Water mass fraction 5.5 36.2 5.5 36.2
CO2 mass fraction 3.0 5.6 3.0 5.6
N2 mass fraction 91.5 0.0 91.5 0.0
DEA mass fraction 0.0 38.7 0.0 38.7
MeOH mass fraction 0.0 19.4 0.0 19.4
CO2 Loading - 0.348 - 0.348

151
Table 6.8 : Properties and composition of rich absorbent: methanol blended aqueous diethanolamine (DEA), before and after
entering stripper
Parameter ↓ Stripper Pressure = 150 kPa Stripper Pressure = 200 kPa
Material Stream → To Stripper Flash (Liquid) Flash (Vapor) To Stripper Flash (Liquid) Flash (Vapor)
Temperature (oC) 87.5 83.2 83.2 95.3 90.4 90.4
Pressure (kPa) 524.0 136.2 136.2 524.0 186.2 186.2
Mass flow-rate (kg/s) 980.7 970.5 10.2 980.7 968.7 12.0
Water mass fraction 36.2 36.5 15.1 36.2 36.5 14.5
CO2 mass fraction 5.6 5.3 41.8 5.6 5.2 45.7
N2 mass fraction 0.0 0.0 0.0 0.0 0.0 0.0
DEA mass fraction 38.7 39.2 0.0 38.7 39.2 0.0
MeOH mass fraction 19.4 19.1 43.1 19.4 19.1 39.9
CO2 Loading 0.348 0.321 - 0.348 0.314 -
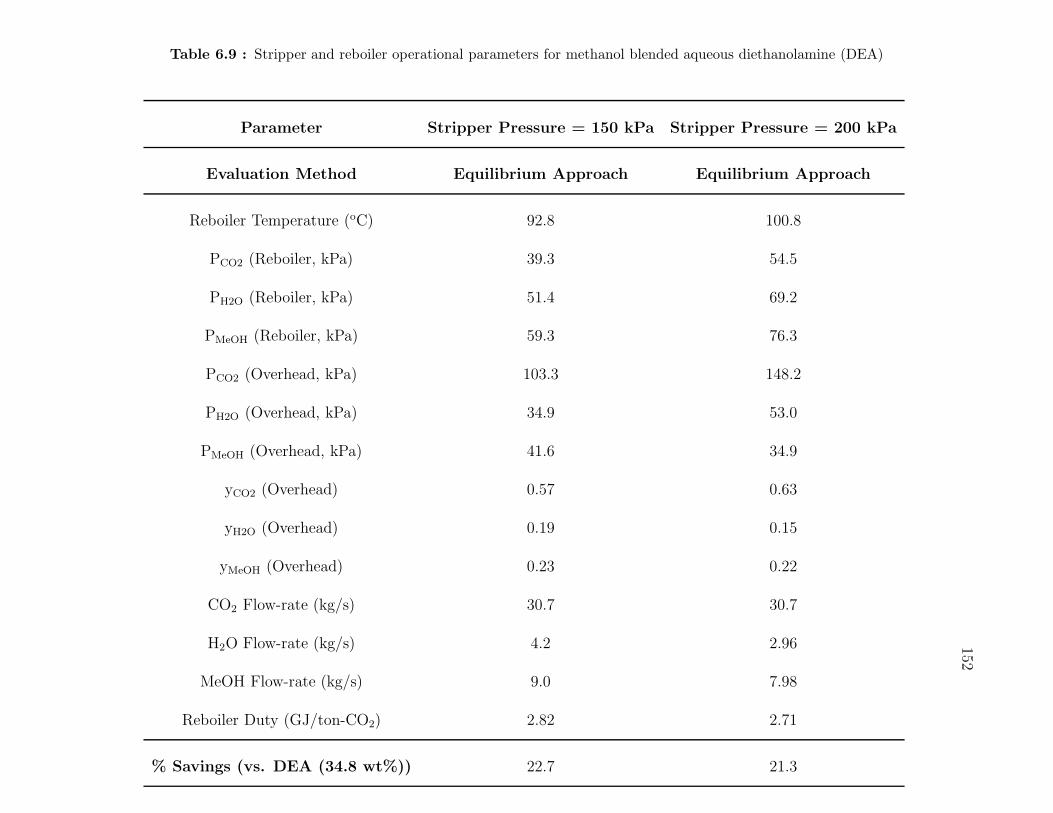
152
Table 6.9 : Stripper and reboiler operational parameters for methanol blended aqueous diethanolamine (DEA)
Parameter Stripper Pressure = 150 kPa Stripper Pressure = 200 kPa
Evaluation Method Equilibrium Approach Equilibrium Approach
Reboiler Temperature (oC) 92.8 100.8
PCO2 (Reboiler, kPa) 39.3 54.5
PH2O (Reboiler, kPa) 51.4 69.2
PMeOH (Reboiler, kPa) 59.3 76.3
PCO2 (Overhead, kPa) 103.3 148.2
PH2O (Overhead, kPa) 34.9 53.0
PMeOH (Overhead, kPa) 41.6 34.9
yCO2 (Overhead) 0.57 0.63
yH2O (Overhead) 0.19 0.15
yMeOH (Overhead) 0.23 0.22
CO2 Flow-rate (kg/s) 30.7 30.7
H2O Flow-rate (kg/s) 4.2 2.96
MeOH Flow-rate (kg/s) 9.0 7.98
Reboiler Duty (GJ/ton-CO2) 2.82 2.71
% Savings (vs. DEA (34.8 wt%)) 22.7 21.3

153
The reboiler temperature is calculated by determining the unique temperature at
which the sum of these three vapor pressures is equal to the set stripper pressure.
With the addition of methanol however; a fourth, significantly more volatile com-
ponent is added to the liquid phase. In spite of a concentration of 20 mole % only,
methanol is the largest contributor to the total pressure on account of its high volatil-
ity. As explained previously, the effect of flash evaporation is simulated by passing
the hot, rich absorbent through a throttling valve in ProMax. A comparison between
the conditions of the rich absorbent streams (before and after flash evaporation) for
aqueous diethanolamine (DEA) and methanol blended diethanolamine (DEA) shows
that the temperature drop for the latter of the two cases is much larger. This can
be explained by noting that flash evaporation is mostly an adiabatic process. Energy
required to convert the liquid into vapor is drawn from within the liquid itself. This
results in the reduced temperature for the flash liquid and vapor as compared to the
original liquid. Since the heat of vaporization of methanol is less than half that of
water; less energy is consumed for the methanol blended diethanolamine (DEA) case.
Table 6.9 is a compilation of operational parameters for a stripper column operated
with aqueous diethanolamine blended with methanol as the absorbent. There are sev-
eral interesting distinctions between these and those for the aqueous diethanolamine
(DEA) system compiled in Table 6.5. The most important of these, and the one of
greatest interest to us is the reboiler duty. Addition of 20 wt% methanol (and removal
of an equivalent amount of water) is estimated to reduce the reboiler duty by 22.7%

154
and 21.3% for the 150 and 200 kilopascals (kPa) cases respectively. These compar-
isons were made with reference to the results obtained for aqueous diethanolamine
(34.8 wt%) using ProMax. The addition of methanol appears to affect the stripper
operation in a significant way resulting in a lowered reboiler duty. This lowering of
reboiler duty can be attributed to two important properties of the methanol blended
diethanolamine (DEA) absorbent. First, as shown in Figure 6.12; the addition of
methanol appears to significantly increase the equilibrium vapor pressure of carbon
dioxide (CO2). This has an important implication on the stripper system - when
maintaining the same stripper pressure, carbon dioxide (CO2) accounts for a larger
fraction due to its higher partial pressure. Conversely, the quantity of stripping va-
por required is decreased. Secondly, due to the addition of methanol; the stripping
vapor is composed of almost equal parts of water and methanol. As shown in Figure
6.8, water and methanol have a heat of vaporization of 2260 kJ/kg and 1102.5 kJ/kg
respectively. Thus, to generate the required stripping vapor; less energy must be
expended on account of the addition of methanol. As noted previously, the stripper
column and reboiler for the methanol blended diethanolamine (DEA) case operated at
a lower temperature than for the aqueous system. This difference is quite significant -
15.8 oC and 10.7 oC for the 150 kilopascals (kPa) and 200 kilopascals (kPa) strippers
respectively. Contrary to the case of the aqueous diethanolamine (DEA) systems,
where the sum of the partial pressures of carbon dioxide (CO2) and water evaluated
using the equilibrium approach method was less than the expected set pressure; that

155
for the methanol blended diethanolamine (DEA) system is higher. The difference
between the evaluated pressure and set pressures (assuming a 13.8 kilopascals (kPa)
pressure drop) is around 30%, which is significantly higher than the 14% difference
noted for the aqueous diethanolamine (DEA) systems. The increased deviation can
be accounted as before by non-idealities in the liquid phase on account of the presence
of electrolytes. Additionally, methanol and water form a strongly non-ideal system
on account of their complex solvent behavior [95]. The relatively significant devia-
tion of calculated pressure from the set point could result in reduced accuracy of the
predicted reboiler duty. Nevertheless, these calculations provide a proof-of-concept
for our original hypothesis that the addition of an alcohol would result in reduced
reboiler duty for the amine absorption process.
6.6 Effect of addition of alcohol on carbon dioxide (CO2)
absorption kinetics
In Chapter 3, we have outlined the reaction scheme for absorption of carbon dioxide
(CO2) in aqueous alkanolamine solutions. As shown in Reaction scheme 3.3, the role
of water is not just limited to a being a solvent for the amine but also to participate
in the actual reactions. The first step in the absorption of carbon dioxide (CO2) in
aqueous alkanolamines is its mass transfer from vapor phase to liquid, followed by its
ionization into a bicarbonate ion and a proton. Since, carbon dioxide (CO2) forms the
weakly acidic carbonic acid (H2CO3); the ionization process is slow and often rate-

156
limiting [9]. It may be expected then that solvent properties such as carbon dioxide
(CO2) solubility, polarity and viscosity can significantly affect the absorption kinetics.
We have proposed the replacement of water in aqueous alkanolamine with an alcohol
such as methanol or ethanol. Although water and alcohols are similar in many ways,
there are significant differences in their physical properties; especially those mentioned
above. In order to study the influence of addition of alcohols on carbon dioxide
(CO2) absorption, we have conducted simple, bench-scale experimental studies using
the primary amine - diglycolamine (DGA). Diglycolamine (DGA) was selected as
the absorbent due to its fast kinetics, low volatility at room temperature and easy
availability through its manufacturer, Huntsman Chemicals.
6.6.1 Experimental setup for studying reaction kinetics
To study the effect of change in the solvent for diglycolamine (DGA) on the reaction
kinetics, we have developed a simple experimental setup consisting of a counter-
current flow absorption column. Figure 6.13 shows a schematic representation of
the experimental setup. As seen here, the heart of the setup is a glass column 30
centimeters (cm) long with a diameter of 2.5 centimeters (cm). The glass column
is filled with 6 millimeter (mm) ceramic Raschig rings. A peristaltic pump (FPU
500, FPUMT) supplied by Omega Engineering draws absorbent solution from the
absorbent reservoir and delivers into the column at the top. Simulated flue gas,
consisting of 13 (v/V) % carbon dioxide (CO2), balance nitrogen (N2) supplied by

157
Figure 6.13 : Experimental setup used to studying the effect of diglycolamine (DGA)
solvent on CO2 absorption kinetics
Matheson TriGas is supplied to the column with the inflow rate being controlled using
a mass flow controller (FMA6528ST) supplied by Omega Engineering.
The decarbonized gas leaves the top of the column where it is sampled, diluted with
pure nitrogen (N2) and fed to a non-dispersive infrared detector for analysis. The non-
dispersive infrared detector (LI 820) is provided by LI-COR Biosciences. The need
for sampling and dilution of the exit gas arises due to a flow limitation of 1 standard
liter per minute (SLPM) and a upper carbon dioxide (CO2) concentration detection
limit of 20,000 parts per million (ppm). Volumetric flow rate of the sampled gas is
measured using a rotameter whereas that of the dilution nitrogen (N2) is controlled
using another mass flow controller (FMA6528ST). Spent absorbent is collected in a

158
reservoir for suitable disposal whereas the decarbonized gas is let out in a fume hood.
6.6.2 Results and analysis of flow experiments to study carbon dioxide
(CO2) absorption kinetics
To study the effect of the diglycolamine (DGA) solvent on the carbon dioxide (CO2)
absorption kinetics, we have conducted counter-current 2-phase flow experiments us-
ing the experimental setup developed above. Absorbents prepared for these experi-
mental studies contain 30 wt% diglycolamine (DGA) by weight, balance the solvent
used. Experiments were conducted at a temperature of 30oC, a gas flow rate of 3
standard liter per minute (SLPM) and absorbent flow-rate of 20 cubic centimeters
per minute (ccpm). Figure 6.14 is a plot of the degree of carbon dioxide (CO2) re-
moval taking place in the absorber column when water, methanol and ethanol are
used as diglycolamine (DGA) solvents. Clearly, the diglycolamine (DGA) absorbents
containing methanol and ethanol as solvents have a superior absorption performance
than that containing water. Whereas under the experimental conditions described
above, aqueous diglycolamine (DGA) achieves around 70% carbon dioxide (CO2) re-
moval; methanolic diglycolamine (DGA) achieves almost complete removal (98%) and
ethanolic diglycolamine (DGA) - 90% removal of carbon dioxide (CO2) from the inlet
gas stream.
The dependence of absorption kinetics on solvent choice appears to be contrary
to conventional reasoning. As shown in Figure 6.15, both methanol and ethanol are

159
Figure 6.14 : Degree of CO2 removal taking place in absorber column with various
diglycolamine (DGA) solvents
solvents with much lower polarity than water and are as such unfavorable for the
carbon dioxide (CO2) ionization reaction. The unfavorable solvent environment may
be expected to further slow the ionization reaction which is also the rate-limiting
step in the carbon dioxide (CO2) absorption process. The observed increase in the
carbon dioxide (CO2) removal kinetics in the absorber clearly suggest the presence of
more than one solvent effect. To analyze this further, it is important to take a deeper
look at the physical processes occurring during the absorption process. Physical ab-
sorption of carbon dioxide (CO2 from vapor to liquid is dependent on its solubility
in the selected absorbent. Once a carbon dioxide (CO2) molecule is dissolved in the
liquid, it must diffuse to the nearest water or amine molecule in order for a reaction to

160
Figure 6.15 : Dielectric constant of different solvents - water, methanol and ethanol
Figure 6.16 : CO2 solubility in different solvents - water, methanol and ethanol
161
Figure 6.17 : Kinematic viscosity of various diglycolamine (DGA) absorbents with
water, methanol and ethanol as solvents
take place. While the mass diffusivity of a gas molecule in a solvent is dependent on
temperature and pressure, it is also a function of its kinematic viscosity (also called
momentum diffusivity). Since, changing the diglycolamine (DGA) solvent from wa-
ter to an alcohol changes both the carbon dioxide (CO2) solubility and the kinematic
viscosity; it is of interest to compare the trends of these parameters between water,
methanol and ethanol. Figure 6.16 shows the solubility of carbon dioxide (CO2) in
water, methanol and ethanol at 25 oC and 101.3 kilopascals (kPa). Methanol has
a solubility for carbon dioxide (CO2) that is almost 6 times that of water. Ethanol
has a lower solubility for carbon dioxide (CO2) as compared to methanol, yet it is
more than 4 times that of water under the same conditions. Figure 6.17 shows the

162
kinematic viscosities of the various 30 wt% diglycolamine (DGA) absorbents prepared
using water, methanol and ethanol as absorbents. These kinematic viscosities were
estimated at a temperature of 25 oC and a pressure of 101.3 kilopascals (kPa) using
ProMax. Methanolic diglycolamine (DGA) clearly has the lowest kinematic viscosity
amongst the three absorbents. It is less than half that of water. The kinematic vis-
cosities of aqueous diglycolamine (DGA) and ethanolic diglycolamine (DGA) on the
other hand are quite similar. On comparing the aqueous and ethanolic diglycolamine
(DGA) properties side-by-side, it is clear that the biggest difference between the aque-
ous and alcohol based diglycolamine (DGA) is the carbon dioxide (CO2) solubility.
The results of our flow experiments and the comparisons made between the absorbent
properties lead us to believe that although the low polarity of methanol and ethanol
is unfavorable for the ionization of carbon dioxide (CO2); the significantly higher sol-
ubility for carbon dioxide (CO2) in these absorbents more than compensates for any
slowing down of the absorption process. The absorption process is also aided by an
increase in the mass diffusivity of the carbon dioxide (CO2) in the methanolic and
ethanolic diglycolamine (DGA) as compared to the aqueous diglycolamine (DGA).
6.7 Implications of replacing conventional absorbents with
alcohol blended aqueous alkanolamines
We have demonstrated in §§6.5.5 that the addition of methanol to aqueous diethanolamine
(DEA) reduces reboiler duty. Figure 6.18 shows a graphical comparison between the

163
reboiler duty for three conventional, aqueous absorbents - monoethanolamine (MEA)
- 20 wt%, diethanolamine (DEA) - 40 wt% and diglycolamine (DGA) - 60 wt%
and the aqueous diethanolamine (DEA) blended with methanol. Two cases of the
monoethanolamine (MEA) system - 150 and 200 kilopascals (kPa) and three cases
of diethanolamine (DEA) and diglycolamine (DGA) - 75, 150 and 200 kilopascals
(kPa) are compared against the 150 and 200 kilopascals (kPa) configurations of the
methanol blended aqueous diethanolamine (DEA). As seen, the two cases utilizing
aqueous diethanolamine (DEA) blended with methanol have lower reboiler duties as
compared to other systems.
The addition of methanol to aqueous diethanolamine (DEA) also results in a very
interesting phenomenon. As stated in Table 6.9, when the stripper column is main-
tained at a pressure of 150 kilopascals (kPa); the reboiler operates at a temperature
of 92.5 oC. This temperature is within 1 oC of the operating temperature of a vac-
uum stripper operating at 75 kilopascals (kPa) with 40 wt% aqueous diethanolamine
(DEA) as the absorbent, which operates at 91.9 oC. As stated previously in Chapter
4, a vacuum stripper at 75 kilopascals (kPa) can be operated using waste heat - steam
at approximately 125 kilopascals (kPa) and 140 oC. The ability to operate a strip-
per with waste heat without having to reduce stripper pressure below atmospheric
pressure has significant practical implications. Some of these are:
1. Use of waste heat results in significantly reduced parasitic power loss. In a
scenario that all the required waste heat is available at the power plant site, the

164
only parasitic power loss is that caused by the auxiliary equipment.
2. Unlike vacuum stripping, where a steam jet ejector is required to maintain
vacuum and consumes low pressure steam as a motive fluid; no mechanism
required to operate the 150 kilopascals (kPa) stripper.
3. Separated carbon dioxide (CO2) exiting the stripper column will be delivered
to the compression train at around 135 kilopascals (kPa) - significantly higher
than the 101.3 kilopascals (kPa) for vacuum strippers.
4. Reduced compression requirements result in reduced parasitic power loss. Ad-
ditionally, 1 fewer compressor and intercooler stage is required. This results in
a reduction in the capital expenditure.
Figure 6.19 shows a comparison of the parasitic power loss for five different systems
utilizing diethanolamine (DEA) absorbents. Three systems utilize aqueous 40 wt%
diethanolamine (DEA) and are operated at 75, 150 and 200 kilopascals (kPa), with
the 75 kilopascals (kPa) system using waste heat for reboiler steam. The remaining
two systems considered utilize the methanol blended aqueous diethanolamine (DEA)
and are operated at 150 and 200 kilopascals (kPa). As seen from the plot, the two
systems utilizing waste heat have the lowest reboiler duties amongst all presented.
Amongst these, the methanol blended system has a 2.25 percentage points advantage
over the aqueous diethanolamine (DEA) system. While most of this advantage is
a result of the reduction in the compression duty, a smaller fraction is also due to

165
Figure 6.18 : A comparison of reboiler duty for common aqueous alkanolamines and
methanol blended diethanolamine (DEA)
Figure 6.19 : A comparison of parasitic power loss for various amine absorption plant
configurations using aqueous diethanolamine (DEA) - with and without methanol
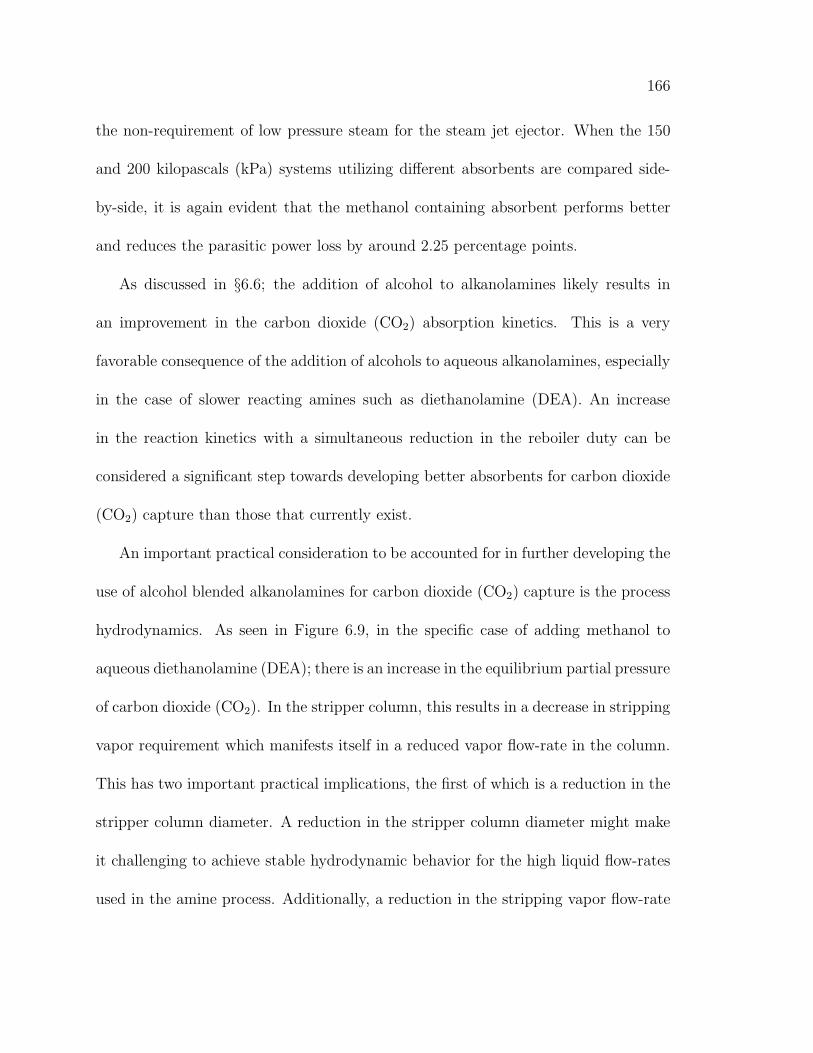
166
the non-requirement of low pressure steam for the steam jet ejector. When the 150
and 200 kilopascals (kPa) systems utilizing different absorbents are compared side-
by-side, it is again evident that the methanol containing absorbent performs better
and reduces the parasitic power loss by around 2.25 percentage points.
As discussed in §6.6; the addition of alcohol to alkanolamines likely results in
an improvement in the carbon dioxide (CO2) absorption kinetics. This is a very
favorable consequence of the addition of alcohols to aqueous alkanolamines, especially
in the case of slower reacting amines such as diethanolamine (DEA). An increase
in the reaction kinetics with a simultaneous reduction in the reboiler duty can be
considered a significant step towards developing better absorbents for carbon dioxide
(CO2) capture than those that currently exist.
An important practical consideration to be accounted for in further developing the
use of alcohol blended alkanolamines for carbon dioxide (CO2) capture is the process
hydrodynamics. As seen in Figure 6.9, in the specific case of adding methanol to
aqueous diethanolamine (DEA); there is an increase in the equilibrium partial pressure
of carbon dioxide (CO2). In the stripper column, this results in a decrease in stripping
vapor requirement which manifests itself in a reduced vapor flow-rate in the column.
This has two important practical implications, the first of which is a reduction in the
stripper column diameter. A reduction in the stripper column diameter might make
it challenging to achieve stable hydrodynamic behavior for the high liquid flow-rates
used in the amine process. Additionally, a reduction in the stripping vapor flow-rate

167
can result in a slowing down of carbon dioxide (CO2) mass transfer due a lowering of
the driving force. This could possibly result in the need for a longer stripper column
when compared to the conventional alkanolamine process.
6.8 Concluding Remarks
We have developed and presented a simplified approach to resolve the energy contri-
butions of various physiochemical processes taking place in the amine stripper to the
reboiler duty. Based on our analysis, we hypothesized that the replacement of water
in aqueous alkanolamine absorbents with an alternative solvent such as an alcohol
is capable of bringing significant reduction in the reboiler energy consumption. We
have developed a satisfactorily reliable framework to estimate reboiler duty for novel
absorbent systems (in the absence of sufficient thermodynamic data) using physio-
chemical properties and vapor-liquid equilibrium (VLE) data alone. Our conclusions
are summarized below:
1. Energy consumed in sensible heating of the absorbent and to generate stripping
vapor is the largest contributor to the reboiler duty. This contribution varies
between 40 and 65 % depending on the choice of solvent.
2. Application of the equilibrium approach method to evaluate reboiler duty for
aqueous diethanolamine (DEA) was found to be sufficiently accurate. Results
calculated by this method were compared with those obtained with the process
simulation software, ProMax. The maximum error noted was 6%.

168
3. Application of the equilibrium approach method to evaluate reboiler duty for
methanol blended aqueous diethanolamine (DEA) predicts an approximately
23% reduction in reboiler duty as compared to the aqueous diethanolamine
(DEA) system under the same stripper operating pressure conditions.
4. Amine strippers utilizing methanol blended diethanolamine (DEA) operate at
a significantly lower temperature than those using aqueous diethanolamine
(DEA). A stripper column using the methanolic absorbent at 150 kilopascals
(kPa) operates at the same temperature of 92 oC as a vacuum stripper operating
at 75 kilopascals (kPa) and using aqueous diethanolamine (DEA).
5. The methanolic absorbent considered in this study produce an average of 2.25
percentage point reduction in the parasitic power loss as compared to aqueous
absorbents. Since waste heat can, however, be used with a 150 kilopascals (kPa)
methanolic stripper; its parasitic power loss can be reduced to approximately
19.5 % of the rated power generation capacity of a coal-fired power plant.
6. Addition of alcohols such as methanol and ethanol appears to improve the
carbon dioxide (CO2) reaction kinetics. We believe that this is primarily a result
of the higher solubility for carbon dioxide (CO2) in the alcohol as compared to
water.
7. The analysis performed on methanol blended aqueous diethanolamine is unable
to account for practical considerations such as column hydrodynamics. Careful

169
consideration needs to be given to understanding the effects of reduction in
stripping vapor flow-rate on the stability of column operation as well as carbon
dioxide (CO2) mass transfer.

170
Chapter 7
Combined pressure and temperature contrast
separation of carbon dioxide (CO2): key concepts
& process development
7.1 Motivation
In §3.3, we have discussed the state of current research and development in the area
of carbon capture and storage. As described, different approaches have been adopted
to improve existing technology in order to make it more suitable for the removal of
carbon dioxide (CO2) from power plant flue gas. As seen, however, most research is
focused on reducing energy consumption - thereby attempting to achieve reductions in
operational costs. From a practical standpoint, however, it is important to advance
existing technology by developing and using superior materials and clever process
configurations to reduce capital expenditure. Alkanolamine absorption is considered
a favorable technology for use in post-combustion carbon capture. If implemented,
existing coal and natural gas fired power stations will have to be retrofitted with
this technology for the removal of carbon dioxide (CO2). In such scenarios, space

171
availability may become a critical resource and the availability of novel, compact
process configurations may become necessary. It is with these motives that we explore
the idea of combining the absorber and stripper units of the amine absorption process
into a single, integrated unit.
7.2 Combining the absorber and stripper columns: develop-
ing the concept of an integrated unit
Figure 7.1 shows a schematic illustration of the novel, proposed process for the sep-
aration of carbon dioxide (CO2) from flue gas. The novelty of this process hinges
on the idea of combining an amine absorber and stripper into a single integrated
unit with the use of advanced materials and clever engineering. In the conventional
alkanolamine absorption process, both the absorber and stripper columns operate sep-
arately in a counter-current flow pattern. In order to achieve carbon dioxide (CO2)
absorption and stripping in a single unit, a mechanism is required for facilitating the
lateral flow of the liquid absorbent. Additionally, unlike in the conventional amine
absorption process; the decarbonized flue gas exiting the absorption side must be
prevented from mixing with the separated carbon dioxide (CO2) leaving the stripper.
With the recognition of these basic requirements, a theoretical basis was developed
for this novel process. At the heart of the process is a composite porous body (e.g.
ceramic) that combines the absorption and stripping media. This composite porous
body consists of three layers - a first layer (shown in blue in Figure 7.1) that acts as the

172
Figure 7.1 : Schematic representation of the novel process with an integrated absorber
and stripper
gas absorber, a center layer (shown in green in Figure 7.1) that has a function similar
to a semipermeable membrane for gas-liquid separation and a third layer (shown in
red in Figure 7.1) that functions as the stripping section of the unit. Each layer
should allow for the lateral flow of liquid from the absorption side to the stripping
side - a characteristic that is critical to the success of the process. From a generic
viewpoint, the properties of the absorption and stripping layers are selected such
that good gas-liquid contacting can be achieved. This maybe achieved through the
selection of a porous material with a bimodal pore-size distribution such that liquid
transport occurs predominantly through the small pores in the material whereas gas
flow takes place through the larger pores. The decarbonized flue gas can be prevented

173
from flowing into the stripper with the use of a porous membrane. The behavior of
two fluids (e.g. gas and liquid) through porous materials can be explained on the
basis of the Young-Laplace equation shown in Equation 7.1.
pc =2γcosθ
R(7.1)
In equation 7.1, pc is the capillary entry pressure, γ is the surface tension, θ is the
angle of contact and R is the radius of a capillary. When applied to the case of gas
and liquid flowing through a porous membrane; equation 7.1 predicts that the non-
wetting phase (i.e.gas) will displace the wetting phase (i.e.liquid) from a saturated
capillary or pore of diameter R only after the pressure differential across the mem-
brane is greater than the capillary entry pressure pc. When the pressure differential
between the absorption and stripping sides is maintained at or below capillary entry
pressure; liquid absorbent will selectively flow between the two sides. Clearly, the
choice of material for the gas-liquid separator membrane and its properties will be
determined by the pressure differential to be maintained and the liquid throughput to
be achieved. The regenerated absorbent will flow down in the stripping section and
enter a reboiler installed at the bottom of the unit. Here, the absorbent solution will
be heated using low pressure steam of waste heat to generate the required stripping
vapor flow. After leaving the reboiler, the regenerated absorbent will flow to an amine
cooler where its temperature will be reduced to the optimal choice for the process
after which it will be pumped back into the integrated unit for another absorption
174
cycle. If implemented, this novel process configuration promises to incorporate sev-
eral favorable characteristics discussed in §7.1 and could potentially bring significant
cost savings.
7.3 Selecting the right material: ceramic foams
We have laid out the theoretical concepts for designing a novel process consisting of
an integrated absorber and stripper for the removal of carbon dioxide (CO2) from
coal fired power plant flue gas. The key to advancing these theoretical concepts
into a demonstrable bench-scale process is the choice of suitable advanced process
materials. As discussed previously, the concept of a combined absorber and desorber
unit rests in its entirety on achieving lateral flow of liquid absorbent through the
gas-liquid contacting materials. In selecting the most suitable materials for gas-liquid
contacting, a strong emphasis was laid on three indispensable characteristics, namely:
1. A bimodal pore-size distribution
2. Large geometric surface area for good gas-liquid contacting
3. Ease of reproducibility and commercial availability
The significance of the first two characteristics has been discussed previously whereas
the third is critical to the advancement of the theoretical concepts of §7.2 to a bench-
scale demonstration and further in a reasonable time-scale.

175
A rigorous search was conducted to determine suitable materials, the outcome of
which was the discovery of a class of materials called ceramic foams. Ceramic foams
are highly porous cellular ceramic structures. Figure 7.2 shows a sample of commercial
alumina (Al2O3) foam. As shown in Figure 7.3, ceramic foams can be made by a
variety of methods [96]. However, the most common approach to manufacturing
ceramic foams on a commercial scale is to coat a sample of open cell polyurethane
(PU) foam template of required shape and dimensions with a slurry of the required
ceramic material followed by removal of the foam template by pyrolysis. Alumina
(Al2O3) is the most frequently used ceramic, though others such as zirconia (ZrO2),
silicon carbide (SiC) can be used for specialized applications.
As can be seen in Figure 7.2, ceramic foams are highly porous with void fraction of
the order of 0.9 or more, have high geometric surface areas and possess high tortuosity
due to their interconnected cellular structure. At present, ceramic foams are mainly
used for filtration of molten metals like aluminum and iron to remove inclusions [15].
They are also being explored as catalyst supports due to their excellent mass and
heat transfer properties [97].
Figure 7.4 shows scanning electron micrographs (SEM) of a commercial alumina
foam sample of 45 pores per inch (ppi) grade. These images are quite revealing and
clearly show the presence of dual porosity. Figure 7.4a shows the alumina foam sample
at a magnification of 50x. Millimeter (mm) sized pores present in the alumina foam
are clearly seen in this image. Also seen in Figure 7.4c are the cracks and triangular

176
Figure 7.2 : A commercial sample of alumina foam
openings that exist in the struts of the alumina foam at a magnification of 290x.
These openings form the high permeability conduits for the entry of liquid absorbent
into the ceramic matrix. Figure 7.4b, d at magnifications of 280x and 11,000x clearly
show the existence of a microporous ceramic matrix. The presence of a microporous
matrix can facilitate the transport of liquid absorbent from the absorption section of
the integrated unit to the stripping side.
In order to characterize the porosity in the alumina foam sample further, a 25 millime-
ter (mm) long and 25 millimeter (mm) diameter sample was cored in an alumina foam
slab. This sample was then analyzed at Core Laboratories, Inc., Houston. Mercury

177
Figure 7.3 : Different routes to manufacturing ceramic foams [15]
porosimetry measurements were performed on the sample to determine the pore size
distribution and the void fraction associated with the micro and macroporosity. Fig-
ures 7.5 and 7.6 show that almost 90% of the void volume is contained in pore spaces
larger than 100 microns (µ) in radius. These large pores make up the macroporosity
in the alumina foam. The remaining void volume is largely distributed, almost equally
between two different types of porosities - microporosity in the alumina matrix which
comprises of pores ranging from 0.25 to 0.5 microns (µ) and cracks and openings in
the struts consisting of pores ranging from 25 to 50 microns (µ). It is apparent from
these results that the material possesses the most critical characteristic necessary to

178
Figure 7.4 : Scanning electron micrographs of a 45 pores per inch (ppi) sample of
alumina foam
be used for implementing the concept of a combined absorber and stripper.
Additionally, ceramic foams possess a number of properties that makes them ideally
suited for use in the novel carbon dioxide (CO2) separation process being developed.
Some of these are:
1. Low pressure drop due to the very high porosity and interconnected pores
2. Very high geometric surface area
3. High mass and heat transfer rates due to high geometric surface areas
Table 7.1 shows a comparison between the geometric surface area for ceramic
foams and several commonly used tower packing materials [97, 98, 99]. Clearly,
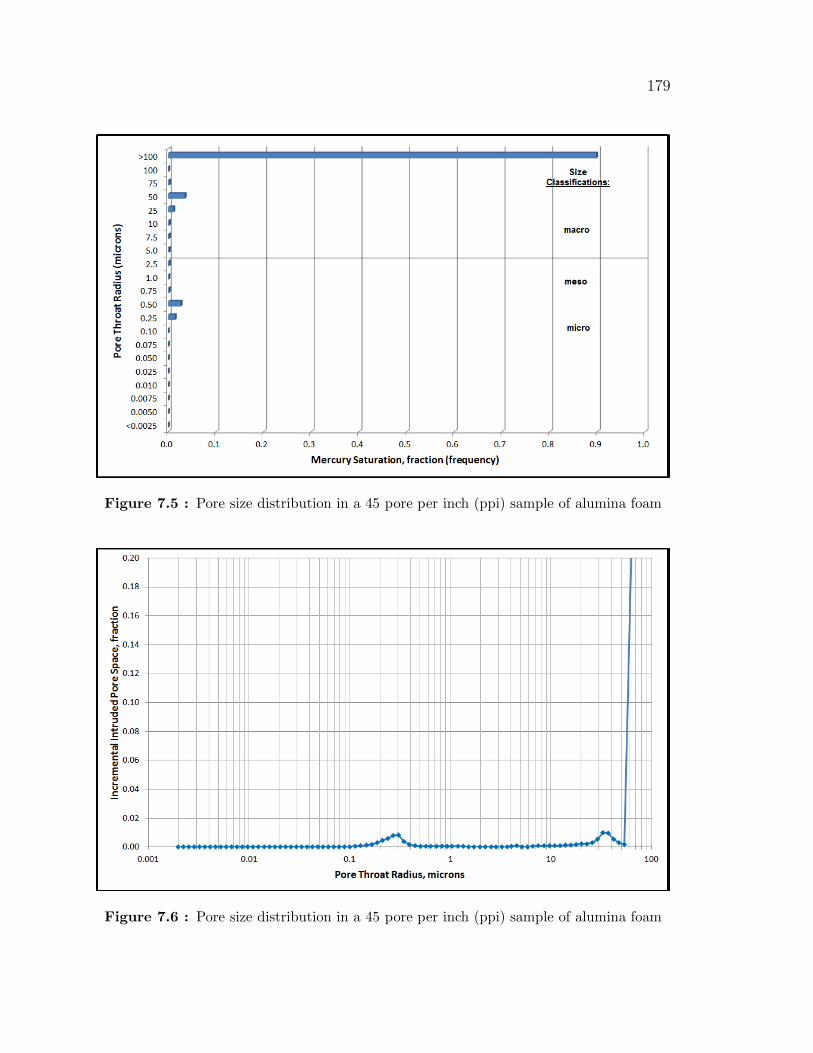
179
Figure 7.5 : Pore size distribution in a 45 pore per inch (ppi) sample of alumina foam
Figure 7.6 : Pore size distribution in a 45 pore per inch (ppi) sample of alumina foam

180
the 30 pores per inch (ppi) grade ceramic foam has a significantly higher geometric
surface area as compared to conventional packing.
Table 7.1 : Comparison of geometric surface area of ceramic foam and various tower
packings
Structure S (m3/m3) Porosity (ǫ)
5 mm packing spheres 600 0.392
Raschig ceramic rings, 6 mm 789 0.73
Raschig ceramic rings, 25 mm 200 0.646
Corrugated metal structured packing 500 0.93
30-PPI -Al2O3 foam 3360 0.83
Since, the rate of mass transfer is proportional to the gas-liquid interfacial surface
area; a greater geometric surface area in the tower packing promotes better mass
transfer. Thus, ceramic foams possess all the features required of the gas-liquid
contacting material as described in this section and §7.2. Having selected ceramic
foam as the material of choice for gas-liquid contacting, the next logical step in
process development is to characterize the ceramic foam for its hydrodynamic and
mass transfer behavior.
181
7.4 Characterizing the hydrodynamic behavior of ceramic
foams
Selection of a tower packing material for gas absorption operation is an optimization
problem with several variables to consider. Some of the factors considered are the
geometric surface area of the packing material, pressure drop, hydrodynamic behav-
ior under different gas-liquid flow conditions and corrosion resistance. The geometric
surface of packing materials increase by reducing the void fraction or pore sizes. Thus,
as seen in Table 7.1; 6 mm Raschig rings have a greater geometric surface area than
25 mm Raschig rings. However, as the void fraction and pore-sizes decrease; the re-
sistance offered by the packing material to fluid flow which results in greater pressure
drops. In commercial operation, it is often economical to operate a column at gas
and liquid flow-rates close to their maximum limits. One of the main constraints
on determining these limits is the hydrodynamic behavior of the packing material;
more specifically, the flooding point. Flooding in case of an absorption or distillation
column is the condition at which the vapor flow-rate and the pressure drop in the
column is large enough to disrupt the unhindered downward flow of liquid. When
flooded, liquid entrainment begins to take place in the column which results in a
sharp increase in the differential pressure in the column and a reduced separation
efficiency. It is clear from this description of flooding that increasing the surface area
of tower packing by reducing the void fraction and pore size will result in lowering
of the flooding point - an unfavorable characteristic. It is clear from this discussion

182
Figure 7.7 : Schematic representation of experimental setup developed for studying
hydrodynamic behavior of ceramic foams
that while ceramic foams possess several favorable characteristics; developing an un-
derstanding of their hydrodynamic behavior is critical to further development of the
novel process.
7.4.1 Experimental setup
In order to study the hydrodynamic behavior of the ceramic foams, a simple experi-
mental setup was developed in-house. Figure 7.7 shows a schematic representation of
this setup. The experimental setup involves a glass tube with an inner diameter (ID)
of 2.8 centimeters (cm). The glass tube is designed to encase 7 foam plugs, each of

183
which is 5.1 centimeters (cm) in length with 5.1 centimeters (cm) headspace at the
top and 2.54 centimeters (cm) space at the bottom. Ceramic foam plugs composed
of 99.5% α alumina (Al2O3) with 2.54 centimeter (cm) diameter and 5.1 centimeter
(cm) length were ordered from Ask-Chemicals, Alfred, NY. Three different grades of
ceramic foams 20, 30 and 45 pores-per-inch (ppi) were procured. 6 foam plugs of the
same grade were wrapped tightly, end-to-end in heat-shrink Teflon tubing to prevent
the bypass of gas or liquid on the side of ceramic foam plugs. The 7th foam is used
as a sacrificial plug it serves to hold the water build up due to capillary end effects
in the foam plugs [100]. The 7th foam plug is inserted into the glass tube below the
30.5 centimeters (cm) long rod. Both the 30.5 centimeters (cm) rod and the 7th foam
plug are held in place using Viton fluoroelastomer O-rings (Dash #21). The O-rings
prevent the bypass of gas or liquid through any empty spaces between the glass walls
and the ceramic foam rod.
Pure nitrogen gas (N2) supplied by Matheson Trigas was introduced above the
last plug from the bottom. In order to prevent any escape of the entering gas with
the exiting liquid, a plastic graduated cylinder was added to the experimental setup
as shown to provide a liquid seal. The liquid seal works by providing a static head
of water which acts as a back pressure regulator and prevents the escape of inlet gas
through the liquid outlet port. Pressure drop across the column was measured using a
water manometer built in-house. Since water is used as the manometer fluid, pressure
differences as low as 20 Pascals (Pa) can be detected. This degree of sensitivity

184
is particularly important with our experimental setup due to the relatively short
column of packing and the low pressure drops encountered in such porous materials.
Water was delivered to the column using a peristaltic pump (FPU500, FPUMT)
supplied by Omega Engineering. Liquid was distributed on the ceramic foam with a
piece of stainless steel wool at the top of the ceramic foam column. Nitrogen (N2)
flow was controlled accurately using a mass flow controller (MFC) (FMA6528ST)
manufactured by Omega Engineering. To minimize pressure drops caused by flow
fittings used in the experimental setup, nylon fittings supplied by Swagelok were used
along with plastic tubing where feasible.
7.4.2 Experimental procedure
When studying the hydrodynamic behavior of ceramic foam, the key parameters of
interest are the dependence of pressure drop on gas and liquid flux and the flooding
behavior of the material. Flooding in case of tower packing is defined as the condition
in operation of a tray or packed column when the vapor flow-rate is large enough to
severely hinder the downward flow of liquid. Operating a tray or packed column under
flooding conditions results in an unstable environment due to a build-up of liquid in
the column, resulting in poor conditions for gas-liquid mass transfer. Flooding in
a tray or packed tower can be determined by a abrupt change in the slope of the
pressure drop vs. gas flux curve. As a part of this study, we explored ceramic foam
hydrodynamics between a wide range of gas and liquid flow-rates. The gas flow-rate

185
was varied between 0 and 9 standard liters per minute (SLPM) and the liquid flow-
rate was varied between 0 and 0.1 liters per minute (LPM). The range of values was
selected on the basis of the potential gas and liquid flux that are of interest for a later
proof-of-concept demonstration. When performing the experiments, the gas flux was
held constant at a specific value and the liquid flux was varied. For each flux, it was
ensured that the system was operationally stable for at least 20 minutes. Pressure
drops in the column corresponding to these operating conditions were recorded after
the water levels in the manometer reached steady state. Since pressure drops in the
ceramic foams are small, it is important to account for all external sources of pressure
drop that contribute to the experimentally measured values. The most important of
these factors are the tubing and fittings that are a part of the experimental setup. To
quantify the value of these pressure drops, we conducted measurements on the empty
glass tube with fittings and tubing unchanged from the hydrodynamic measurements.
As before, the gas flux is varied to measure the corresponding pressure drop values.
The pressure drop measurements conducted on the ceramic foam are then corrected
for these external pressure drop resistances to derive the contribution of the ceramic
foams to the pressure drop.
7.4.3 Experimental results
Figure 7.9 is a plot of the pressure drop versus flow-rate for 45 ppi alumina foam for
the range of gas and liquid flow-rates measured as a part of this study. As can be

186
Figure 7.8 : Experimental setup for studying the hydrodynamic behavior of ceramic
foams
seen in the plot, the pressure drop per meter of packing varies linearly with the gas
flow-rate. Under the conditions explored in this study, we found that liquid flow-rate
has little effect on the pressure drop in the ceramic foam column.
Under all the operating conditions explored, no flooding behavior was observed in this
ceramic foam column; suggesting that flooding point had not been reached and the
system was within the limits of operating conditions. Assuming a linear relationship
between pressure gradient and gas flow-rate till the flooding point is reached allows for
the estimation of the flooding point gas flow-rate by balancing the pressure gradient
with the product of fluid density and gravitational acceleration. This is expressed in
Equation 7.2.
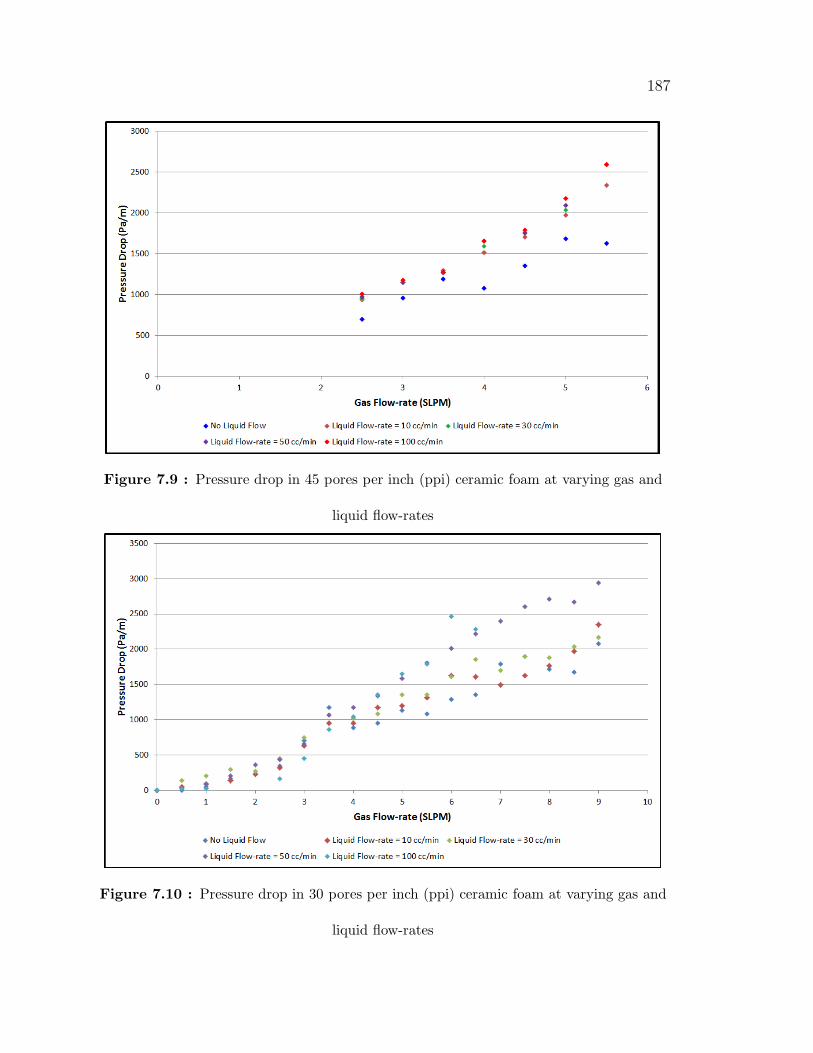
187
Figure 7.9 : Pressure drop in 45 pores per inch (ppi) ceramic foam at varying gas and
liquid flow-rates
Figure 7.10 : Pressure drop in 30 pores per inch (ppi) ceramic foam at varying gas and
liquid flow-rates

188
dp
dx= ρ · g (7.2)
For diglycolamine, ρ 1040 (kg/m3) at 100 oF. This results in an approximate
flooding point pressure gradient ( dpdx) of 10202.5 (Pa/m). Linear extrapolation of
the experimental data in Figure 7.9 for the liquid flow-rate of 0.1 liter per minute
(LPM) results in a mass flux of 0.93 kg-m-2s-1 at the approximate flooding point
for the 45 pores per inch (ppi) ceramic foam. For the 2.8 centimeter (cm) diameter
glass column, this corresponds to a gas flow-rate of 22.5 standard liters per minute
(SLPM). Figure 7.10 is a plot of the pressure drop versus flux for 30 ppi alumina foam
for the range of gas and liquid flux studied as a part of this work. Comparing Figures
7.9 and 7.10 clearly shows that the 45 pores per inch (ppi) grade ceramic foam has
a greater pressure drop as compared to the 30 pores per inch (ppi) grade material.
This is clearly a result of an increase in the size of the macropores in the latter
material. Performing the same calculation for pressure gradient and corresponding
vapor flow-rates results in a flooding point gas flow-rate of 28.1 standard liters per
minute (SLPM) or a mass flux of 1.16 kg-m-2s-1.
Figure 7.11 shows the dependence of pressure gradient on the gas and liquid flow-rates
for 20 pores per inch (ppi) grade alumina foam. Clearly, there is a noticeable decrease
in the pressure drop as compared to the 30 and 45 pores per inch (ppi) samples due
to an increase in the size of the macropores in the foam. Using the same methodology
for estimating flooding point yields a flooding point at a gas flow-rate of 33.5 standard

189
Figure 7.11 : Pressure drop in 20 pores per inch (ppi) ceramic foam at varying gas and
liquid flow-rates
liters per minute (SLPM) or a gas mass flux of 1.385 kg-m-2s-1.
We have compared the values measured as a part of our study with those reported
for 40 pores per inch (ppi) metal foams in published literature. The pressure drops
for metal foams are roughly 1/10 th as compared to our measurements [101]. This
can be attributed to the higher thickness of struts in alumina foam as compared to
those in metal foams. Thicker struts result in smaller pores and lower porosity which
eventually results in greater pressure drops in the column. Strut thickness is a vari-
able that can be controlled during the manufacture of ceramic foam and thus a factor
that can be worked upon with the ceramic foam manufacturer. Optimized ceramic
foam materials will result in significantly lower pressure drops than what we are cur-

190
rently using for our studies. This would also mean significantly higher gas-flux at the
flooding point. In conclusion, we remark that commercially available ceramic foams
performed satisfactorily in the hydrodynamic studies. Next, we conduct experimental
studies to determine the mass transfer performance of ceramic foams using simulated
flue gas and aqueous diglycolamine (DGA).
7.5 Characterizing the mass transfer behavior of ceramic
foams
When selecting tower packing for gas absorption operation, in addition to the hydro-
dynamic properties; mass transfer performance plays a critical role. Irrespective of
physical or chemical gas absorption, the first step in the process is the transfer of the
component of interest from the gas phase to the liquid. The rate of mass transfer
from gas to liquid depends on the gas-liquid interfacial surface area and the driving
force for mass transfer (difference in concentrations). Increasing the geometric surface
of a packing generally increases the rate of mass transfer. The exact magnitude of
this change, however, is dependent on several factors such as the actual increase in
the interfacial surface area, effect of tower packing fluid flow properties and flow dy-
namics itself. Since most advanced packing materials such as ceramic foams possess
extremely complex 3-dimensional structures; it is impossible to analytically predict
their mass transfer performance. In this section, we describe the experiments per-
formed to study the mass transfer behavior of various ceramic foam samples. In

191
addition, we use these results to start determining the dimensions of a stainless steel
prototype that will be developed further for a proof-of-concept demonstration.
7.5.1 Experimental setup
Figure 7.12 is a schematic representation of the experimental setup that we have
developed for conducting mass transfer studies on various grades of ceramic foam.
In order to obtain a perspective, we compare the mass transfer performance of these
ceramic foam samples with a reference tower packing material 6 mm ceramic Raschig
rings. Conceptually, this setup is very similar to the one used for the hydrodynamic
studies except no water manometer is required in these experiments. As can be
seen, the core elements of the setup such as the glass column, gas delivery to the
column on the side, below the 6th ceramic foam plug from the top are similar to
the hydrodynamic studies setup of Figure 7.7. For mass transfer measurements,
we are using a CO2/N2 mixture with 13% carbon dioxide (CO2); balance nitrogen
(N2) supplied by Matheson TriGas as the ‘simulated’ flue gas (mass flow controller
calibration ratio: 1.06). 30 wt% and 60 wt% diglycolamine (DGA) solutions prepared
from 99.5% pure diglycolamine (DGA) agent supplied by Huntsman Chemicals were
used as the absorbent. This absorbent solution is delivered from the solvent reservoir
on to the ceramic foam plug by a peristaltic pump. Spent absorbent is collected in a
carboy for discarding.
As shown in Figure 7.12, gas supply to the glass column can be switched between

192
Figure 7.12 : Schematic representation of experimental setup developed for studying
mass transfer performance of ceramic foams
pure nitrogen (N2) and simulated flue gas using a 3-way valve. This arrangement
has been implemented in order to facilitate purging the air in the glass column before
commencing a trial. Outlet gas is analyzed for its carbon dioxide (CO2) concentration
with a non-dispersive infrared detector (LI 820) manufactured by LI-COR Biosciences.
The detector can measure carbon dioxide (CO2) concentrations between 0 and 20,000
ppm with 3% accuracy (measured value) and can handle inlet gas flux up to 1 standard
liter per minute (SLPM). Since, the simulated flue gas has a carbon dioxide (CO2)
concentration of 130,000 ppm; we have implemented a dilution system as shown in
Figure 7.12, wherein we sample a small part of the outlet gas stream from the glass
column and dilute it with a known flux of nitrogen (N2), controlled using a mass flow
193
controller (MFC). The quantity of exit stream being sampled is controlled using a
needle valve and measured with a rotameter. The dilution ratio can be calculated
using the following equation. In the Equation 7.3, D is the dilution ratio, QN2 is the
nitrogen (N2) flow-rate and Qsample is the flow-rate of sampled exit gas.
D =
(
QN2 + Qsample
)
(
Qsample
) (7.3)
7.5.2 Experimental method
When comparing the mass transfer performance of ceramic foams against that of
Raschig rings, the key parameter of interest is the degree of carbon dioxide (CO2)
removal under the same operating conditions (i.e. gas and liquid flow-rates). As
described in §7.5, even if the geometric surface areas of the two packing materials are
known to be the same; their geometric structure, surface properties and arrangement
in the column are critical factors that affect the extent of gas absorption. As a part
of this study, we have conducted the comparison between ceramic foams and Raschig
rings under 2 different conditions of gas and liquid flow-rate conditions. These are:
• Gas flow-rate = 3 standard liter per minute (SLPM), Liquid flow-rate = 0.02
liter per minute (LPM)
• Gas flow-rate = 5 standard liter per minute (SLPM), Liquid flow-rate = 0.04
liter per minute (LPM)
194
The gas to liquid ratio in both these cases is similar to that maintained in industrial
scale absorbers. In addition, we conduct trials at the above gas and liquid flow-rates
with 30 wt% and 60 wt% diglycolamine (DGA) solutions respectively to study the
effect of absorbent concentration on the degree of carbon dioxide (CO2) pickup.
Before commencing a trial, we purge the ceramic foam column with pure nitrogen
(N2) to remove most of the air and residual carbon dioxide (CO2) from previous
experiments. Once the carbon dioxide (CO2) concentration in the column is down to
around 10 ppm, nitrogen (N2) flow is stopped and simulated flue gas is introduced
into the column. Simultaneously, the dilution nitrogen (N2) stream to the detector is
turned on. In all the trials conducted, a flow-rate of 0.8 SLPM was maintained for the
dilution nitrogen (N2) stream using a mass flow controller (MFC). The outlet carbon
dioxide (CO2) level measured by the analyzer is recorded using a desktop computer
and data acquisition software provided by LI-COR Biosciences. The float level in the
rotameter is recorded as a function of time since it is sensitive to fluctuations in the
inlet gas flux as well as the composition of the outlet gas. After the experiment is
complete, the analyzer is purged with the dilution nitrogen (N2) stream till carbon
dioxide (CO2) levels are down to almost zero.
7.5.3 Experimental results
Figure 7.13 shows a plot of the comparison of the degree of carbon dioxide (CO2)
pickup taking place in a 30.5 centimeters (cm) long glass column filled with 45 pores-

195
per-inch (ppi) and 20 pores per inch (ppi) ceramic foams and 6 millimeter (mm)
Raschig rings corresponding to a gas flow-rate of 3 standard liters per minute (SLPM),
a liquid flow-rate of 0.02 liters per minute (LPM) and an absorbent concentration of
30 wt%. As can be seen from the above plot, the use of 6 millimeter(mm) Raschig
rings results in around 60% carbon dioxide (CO2) pickup, 20 pores per inch (ppi)
ceramic foam achieves around 40% removal and 45 pores per inch (ppi) ceramic foam
results in only 25% carbon dioxide (CO2) pickup. The performance of the 20 and 45
pores per inch (ppi) ceramic foams, however, seems contrary to expectations. The
45 pores per inch (ppi) foam sample has almost 2x the geometric surface area that
of the 20 pores per inch (ppi) foam. Since a larger geometric surface area is largely
a favorable characteristic for good mass transfer, the 45 pores per inch (ppi) foam
maybe expected to have a better carbon dioxide (CO2) removal performance than
the 20 pores per inch (ppi) sample. A closer examination of the 45 and 20 pores per
inch (ppi) foams reveals that the macropores in the 45 pores per inch (ppi) foam are
significantly smaller than the ones in the 20 pores per inch (ppi) sample. Whereas
a large geometric surface area can aid in increasing the rate of mass transfer, it
is of far greater importance that a high gas-liquid interfacial area be available. We
hypothesize that during gas absorption operation, macropores in the 45 pores per inch
(ppi) foam - now filled with liquid absorbent offer a smaller interfacial surface area as
compared to the 20 pores per inch (ppi) sample. This could result from the presence
of insufficient gas in the macropores of the foam or could result from a segregation

196
Figure 7.13 : Degree of CO2 pickup with different tower packing (30 wt% DGA, gas at 3
SLPM, liquid at 0.02 LPM)
of flow, wherein there is almost a separate flow of gas and liquid through the pores
of the foam resulting in poor mass transfer. The 20 pores per inch (ppi) foam has
a relatively poorer performance as compared to the 6 millimeter (mm) Raschig rings
even though their geometric surface areas are comparable. We believe this is also a
result of the smaller pore spaces for gas-liquid flow in the ceramic foam as compared
to the 6 millimeter (mm) Raschig rings. The smaller size of the macro-pores is a
result of the ceramic struts of the foam being too thick, which can be optimized as
was described previously in §§7.4.3.
Figure 7.14 shows a comparison of the degree of carbon dioxide (CO2) removal with

197
the use of 20 pores per inch (ppi) ceramic foam and 6 millimeter (mm) Raschig rings.
These experiments are conducted at a gas flow-rate of 5 standard liter per minute
(SLPM), a liquid flow of 0.04 liter per minute (LPM) and absorbent concentration of
30 wt% diglycolamine (DGA). As can be seen from the plot, there is a slight change
in the degree of carbon dioxide (CO2) removal by both the ceramic foam and the
Raschig rings. Whereas the ceramic foam shows a reduction in the carbon dioxide
(CO2) pickup (by around 7%), the Raschig rings exhibit an increase of around 5%
in the carbon dioxide (CO2) uptake. We believe that the explanation for this lies in
the experimental conditions in the bench-scale column in which the experiments are
being conducted.
When the gas flow rate is changed from 3 standard liter per minute (SLPM) to 5
standard liter per minute (SLPM), the residence time of the gas in the column re-
duces by 40%. A smaller time for gas-liquid contacting will result in lesser uptake of
carbon dioxide (CO2). However, the flow-rate of the absorbent solution is doubled
as well which results in an increased carbon dioxide (CO2) uptake. With two com-
peting factors are play, the effectiveness of mass transfer depends on good gas-liquid
contacting and the presence of sufficient interfacial surface area. We suggest that
the smaller pore spaces in ceramic foam as compared to Raschig rings result in the
observed changes in the carbon dioxide (CO2) uptake.
Figure 7.15 shows a comparison of the degree of carbon dioxide (CO2) uptake with
60 wt% diglycolamine (DGA) as the absorbent with gas flow-rates at 3 and 5

198
Figure 7.14 : Degree of CO2 pickup with different tower packing (30 wt% DGA, gas at 5
SLPM, liquid at 0.04 LPM)
Figure 7.15 : Degree of CO2 pickup with different tower packing (60 wt% DGA, gas at 3
& 5 SLPM, liquid at 0.02 & 0.04 LPM)
199
standard liter per minute (SLPM) and liquid flow-rate of 0.02 and 0.04 liter per
minute (LPM). In the first case of lower gas and liquid flow-rates, carbon dioxide
(CO2) pickup with the ceramic foam sample is almost the same as that with 30%
diglycolamine (DGA) whereas that with Raschig rings increases by around 30%. In
the later case involving higher gas and liquid flow-rates, we observe that the 20 pores
per inch (ppi) ceramic foam picks up around 36% of the entering carbon dioxide (CO2)
whereas the Raschig rings result in around 74% pickup. An increase in the amine
concentration can normally be expected to increase the extent of carbon dioxide
(CO2) uptake except under a scenario where the degree of carbon dioxide (CO2)
removal isn’t limited by the availability of unreacted amine molecules. This effect
can clearly be observed in the case of Raschig rings, however in case of ceramic foam
the carbon dioxide (CO2) uptake surprisingly exhibits no change. Industrial absorbers
are suitably optimized to maintain operating conditions to minimize mass transfer
resistances in both gas and liquid phases. In case of carbon dioxide (CO2) absorption,
liquid phase resistances are crucial in particular since the carbon dioxide (CO2) must
first dissolve in the liquid absorbent and then undergo hydration to be able to react
with the amine. The experimental conditions in the bench-scale apparatus we have
setup in our lab are not optimized. Results from the carbon dioxide (CO2) absorption
experiments conducted thus far suggest the presence of liquid phase mass transfer
resistances in the ceramic foam system and to a lesser extent in the Raschig ring
setup. Thus, an increase in the amine concentration fails to have any significant
200
effect on the extent of carbon dioxide (CO2) removal in ceramic foam system. This
clearly suggests that carbon dioxide (CO2) absorption is limited by its mass transfer
from gas to liquid as opposed to the unavailability of unreacted amine molecules. In
case of Raschig rings, mass transfer does not appear to be a significant limiting factor
likely due to the larger macro-pores. Consequently, an increase in the diglycolamine
(DGA) concentration results in an increase in the carbon dioxide (CO2) uptake rate.
7.6 Experiments to determine design parameters for proof-
of-concept demonstration
Experiments presented in §§7.5.2 and 7.5.3 were conducted with an objective of char-
acterizing the mass transfer performance of ceramic foams. The end objective of this
research is to develop a working prototype of the novel carbon dioxide (CO2) sepa-
ration process for conducting a proof-of-concept demonstration. In order to provide
a direction for our design efforts, two important success criteria were designated for
the proof-of-concept demonstration. These are:
• 90% or more carbon dioxide (CO2) removal from inlet simulated flue gas stream
• Absorption and desorption of carbon dioxide (CO2) in a single integrated unit
using aqueous amine absorbent (e.g. diglycolamine)
The results presented in §§7.5.3 describe the mass transfer characteristics of the
20 pores per inch (ppi) ceramic foam. However, in all the cases considered; the degree

201
of carbon dioxide (CO2) removal is less than 90%. Thus, further experiments needed
to be performed to determine the gas-liquid flow-rates and the height of ceramic foam
sufficient for removal of 90% of the inlet carbon dioxide (CO2). It is important to
clarify at this point that a proof-of-concept prototype is far from optimized. Thus,
the gas-liquid flow-rates used in this design study for achieving 90% carbon dioxide
(CO2) removal are not representative of the performance of an optimized system.
7.6.1 Experimental procedure
The experimental setup used for conducting these studies has been described previ-
ously in §§7.5.1. The experimental procedure has been described in §§7.5.2. For all
experiments, 30 wt% diglycolamine (DGA) was used as the absorbent. The key pa-
rameter of interest in these studies is the dependence of the degree of carbon dioxide
(CO2) removal on (i) gas flow rate, (ii) liquid flow rate and (iii) height of ceramic
foam packing. As a part of this study, we have compared the performance of 20 pores
per inch (ppi) ceramic foams of 4 different lengths under different conditions of gas
and liquid flow. These are:
• Ceramic foam lengths = 10.2, 15.2, 20.3 and 25.4 centimeters (cm)
• Gas flow-rate = 0.25 standard liter per minute (SLPM), Liquid flow-rate = 0.01,
0.02, 0.03 liter per minute (LPM)
• Gas flow-rate = 0.50 standard liter per minute (SLPM), Liquid flow-rate = 0.01,
0.02, 0.03 liter per minute (LPM)
202
• Gas flow-rate = 0.75 standard liter per minute (SLPM), Liquid flow-rate = 0.01,
0.02, 0.03 liter per minute (LPM)
• Gas flow-rate = 1.0 standard liter per minute (SLPM), Liquid flow-rate = 0.01,
0.02, 0.03 liter per minute (LPM)
7.6.2 Experimental results
Figure 7.16 is a plot of the comparison of the degree of carbon dioxide (CO2) pickup
in a 20 pores per inch (ppi) ceramic foam column of 10.2 centimeters (cm) length
under the different gas and liquid flow conditions listed above. As can be seen, there
is a gradual increase in the carbon dioxide (CO2) removal both as the liquid flow-
rate is increased and the gas flow rate is decreased. The closest configuration to the
required 90% carbon dioxide (CO2) pickup is at a liquid flow-rate of 0.03 liter per
minute (LPM) and a gas flow rate of 0.25 standard liter per minute (SLPM), under
which condition, around 80% of the incoming carbon dioxide (CO2) is removed.
Figure 7.17 is a plot of the performance of a 15.2 centimeters (cm) long ceramic
foam column for carbon dioxide (CO2) removal under different gas and liquid flow
rates. It can be seen from the plot that the optimal configuration for 90% removal of
inlet carbon dioxide (CO2) is a gas flow-rate between 0.25 standard liter per minute
(SLPM) and 0.5 standard liter per minute (SLPM) and liquid flow-rate between 0.02
and 0.03 liter per minute (LPM). Figure 7.18 is a plot of the degree of carbon dioxide
(CO2) removal in a ceramic foam column with a length of 20.3 centimeters (cm).
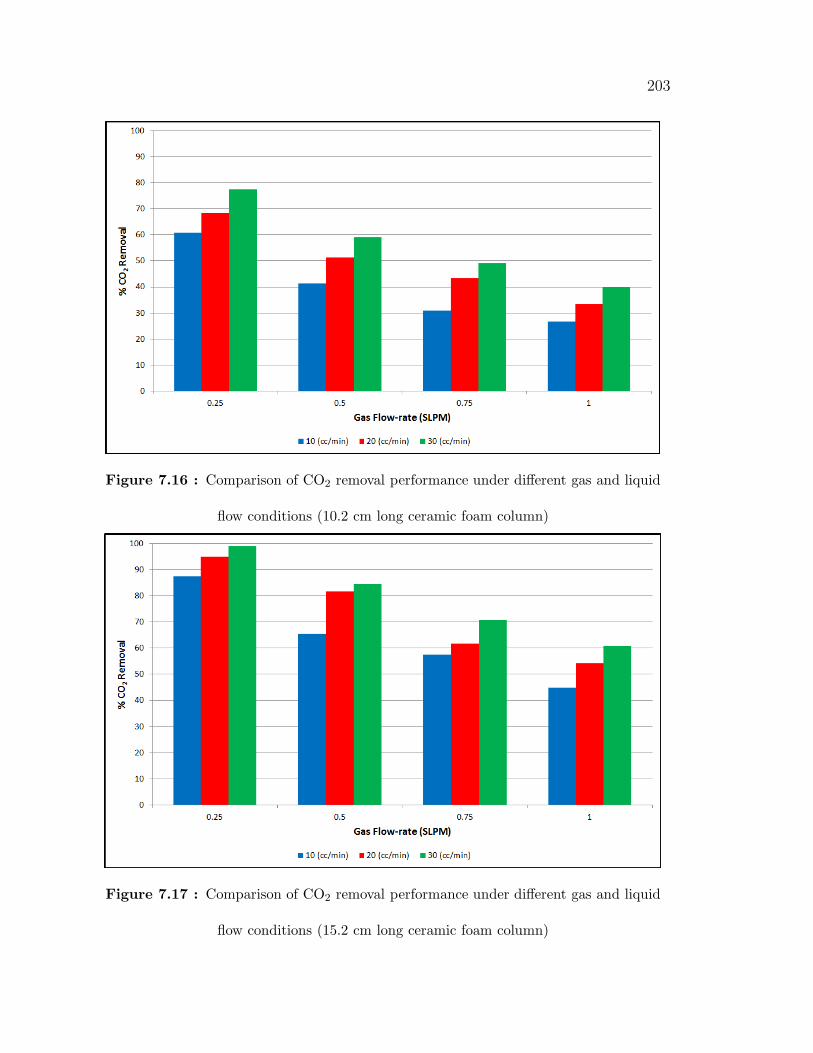
203
Figure 7.16 : Comparison of CO2 removal performance under different gas and liquid
flow conditions (10.2 cm long ceramic foam column)
Figure 7.17 : Comparison of CO2 removal performance under different gas and liquid
flow conditions (15.2 cm long ceramic foam column)

204
The trend observed in the dependence of carbon dioxide (CO2) removal on gas and
liquid flow-rates is consistent with that noticed in Figures 7.16 and 7.17. However,
while there is a significant change (increase) in the carbon dioxide (CO2) removal
with an almost identical change in system conditions between Figures 7.16 and 7.17,
there is almost no change in the data represented in Figures 7.17 and 7.18. This
suggests that the gains in carbon dioxide (CO2) removal achieved by adding an extra
5.1 centimeters (cm) of ceramic foam is minimal. Figure 7.19 is a plot of the degree
of carbon dioxide (CO2) removal with a ceramic foam column of 25.4 centimeters
(cm) length. As seen, there is only a marginal improvement in carbon dioxide (CO2)
pickup with the addition of the 5.1 centimeters (cm) ceramic foam plug to the 20.3
centimeter (cm) column used previously. Clearly, the addition of tower packing had
little effect in increasing the removal of carbon dioxide (CO2). This can be attributed
to the macro-structure and the size of pore-spaces in the ceramic foam. The pore-
spaces in ceramic foam are significantly smaller than those in the 6 millimeter (mm)
raschig rings. The smaller pores in ceramic foam can result in liquid flow that is
dominated by surface tension as compared to gravity. An outcome of this is be the
channeling of liquid absorbent in the ceramic foam which could result in the observed,
poor mass transfer performance in spite of large geometric surface area.

205
Figure 7.18 : Comparison of CO2 removal performance under different gas and liquid
flow conditions (20.3 cm long ceramic foam column)
7.7 Concluding Remarks
Based on the experimental studies performed to characterize the hydrodynamic and
mass transfer properties of ceramic foams, we can reach the conclusions summarized
in §§7.7.1 and 7.7.2.
7.7.1 Hydrodynamic studies
1. Hydrodynamic behavior of three different grades of ceramic foam 20 pores per
inch (ppi), 30 pores per inch (ppi) and 45 pores per inch (ppi) were studied
under a wide range of gas and liquid flux.

206
Figure 7.19 : Comparison of CO2 removal performance under different gas and liquid
flow conditions (25.4 cm long ceramic foam column)
2. Pressure drop in the ceramic foam columns was found to have a linear depen-
dence on the gas flux and a low sensitivity to the liquid flux under the conditions
studied.
3. Theoretically calculated flooding points for 20 pores per inch (ppi), 30 pores
per inch (ppi) and 45 pores per inch (ppi) ceramic foams corresponding to a
liquid flux of 3.33 kg-m-2s-1 is a gas flux of 1.385 kg-m-2s-1, 1.23 kg-m-2s-1 and
0.93 kg-m-2s-1.
4. The pressure drop in ceramic foams is relatively higher as compared to metal
foams of similar grade. We believe that this is a result of thicker struts in

207
the ceramic foam and which is a feature that can be optimized to reduce the
pressure drop in ceramic foam.
7.7.2 Mass transfer studies
1. 20 pores per inch (ppi) ceramic foam results in superior mass transfer perfor-
mance as compared to 45 pores per inch (ppi) foam. This is due to smaller
macropores in the finer grade foam sample which results in larger mass transfer
resistances due to gas and liquid channeling.
2. 20 pores per inch (ppi) foam results in less carbon dioxide (CO2) removal than
6 millimeter (mm) Raschig rings.
3. An increase in absorbent concentration results in a significant improvement in
the carbon dioxide (CO2) removal with Raschig rings. However, there is almost
no improvement in the performance with the use of 20 pores per inch (ppi)
ceramic foam.
4. 90% carbon dioxide (CO2) removal can be achieved in a ceramic foam column
20.3 centimeters (cm) in length at a gas flow-rate of around 0.25 standard liter
per minute (SLPM) and liquid flow-rate of 0.02 liter per minute (LPM).

208
Chapter 8
Integrating the absorber and stripper units for the
separation of carbon dioxide (CO2): proof of
concept demonstration
In Chapter 7, we have discussed the concept of a novel carbon dioxide (CO2) separa-
tion system that combines the absorber and stripper into a single, integrated unit. We
have laid out the feasibility requirements for developing this novel process. Further,
we have identified a class of suitable materials - ceramic foams and characterized their
hydrodynamic and mass transfer performance using an experimental setup developed
in-house. The next step in the process development cycle is to conduct a proof-of-
concept demonstration by constructing a working experimental setup and operating it
under different operating conditions. The proof-of-concept demonstration is a critical
step in validating the technical feasibility of the proposed process. In this chapter, we
discuss the design and construction of an experimental prototype for conducting the
proof-of-concept demonstration. We also present the results of these demonstration
type experiments.

209
8.1 Development of the experimental prototype
From the experiments conducted and described in Chapter 7, we have concluded
that in order to achieve 90% carbon dioxide (CO2) removal at a gas flow-rate of
0.25 standard liters per minute (SLPM) and an absorbent flow-rate of 0.02 liters per
minute (LPM); the minimum height of ceramic foam required is 20.3 centimeters
(cm). It is understood at this point that the more accurate measure of tower packing
is its volume. However, in the present scenario; gas-liquid distribution on ceramic
foams is not very well understood, thus requiring using the height of tower packing
as a parameter. For the proof-of-concept demonstration, it was decided to construct
a stainless steel prototype capable of withstanding high temperatures.
8.1.1 Choice of materials
20 pores per inch (ppi) alumina foam was selected as the material for gas-liquid
mass transfer on the absorption and stripping sides. 99.5% α-alumina (Al2O3) foam
blocks, 20.3 x 10.2 x 2.54 centimeters (cm) were procured from ASK-Chemicals, Al-
fred, NJ. The choice of a suitable material for the gas-liquid separator membrane
was slightly challenging. Using a single microthin membrane is risky since it can
easily get damaged (e.g. tear, punctures, etc.). Thus, it was decided to use a porous
ceramic membrane of high permeability and lower entry pressure as a support for a
microthin membrane. Such a 99.5% α-alumina (Al2O3) porous membrane was pur-
chased from Refractron Technologies, Newark, NJ. The properties of this membrane

210
are summarized below in Table 8.1. Capillary connectivity between the ceramic foam
and the microthin membrane was maintained using a hydrophilic fiber glass wool
blanket purchased from the Ceramic Store Inc., Houston, TX as a wicking material.
Table 8.1 : Properties of porous alumina membrane
Property Value
Material Alumina (99.5 %)
Dimensions (mm) 203.2 x 101.6 x 25.4
Mean pore-size (µ) 19.3
Porosity (%) 43.4
Bubble point pressure (kPa) 5.8
Gas permeability (@ 30 psi) (m2) 5.3 E-12 (5.38 Darcy)
For the gas-liquid separator membrane, several commercially available polymeric
membranes were considered. One important characteristic required of this mem-
brane material is for it to be hydrophilic or water-wetting. Additional requirements
include good chemical resistance under alkaline conditions and thermal stability at
temperatures up to 150 oC. Based on these properties, polyethersulfone (PES) was
identified as the membrane material. Polyethersulfone (PES) has excellent chemical
resistance against bases and has a glass transition temperature of 230 oC [102, 103].
Polyethersulfone (PES) membranes were provided by Pall Life Sciences Corporation,

211
Port Washington, NY (Part # S80720). The properties of these membranes are
summarized in Table 8.2.
Table 8.2 : Properties of polyethersulfone membrane
Property Value
Material Polyethersulfone Membrane (Hydrophilic)
Glass transition temperature (oC) 220
Membrane thickness (µ) 114.3 - 165.1
Dimensions (mm) 203.2 x 101.6
Mean pore-size (µ) 0.8
Liquid Permeability (L− s−1 −m−2) 13.3 - 63.3
Bubble point pressure (kPa) 103.4 - 213.7
8.1.2 Design considerations
Stainless steel was selected as the main material of construction with an aim of pro-
viding sufficient structural strength and avoiding corrosion problems. Several impor-
tant design objectives that were critical towards the success of the proof-of-concept
demonstration were identified. These are presented below.
• No gas or liquid bypass around the ceramic foam blocks

212
• No gas channeling along with liquid exiting the absorber or stripper at the
bottom
• No gas leakage from absorption chamber to stripping chamber
• No leakage of ambient air into stainless steel prototype
• Staggered configuration for absorption and stripping side ceramic foams to max-
imize the gas-liquid contacting effect of ceramic foam
• Suitable distribution mechanisms for gases and liquids entering the prototype
• Capillary contact between ceramic foam and polyethersulfone (PES) membrane
(using hydrophilic fiber glass wool)
After identifying the required features in the stainless steel prototype, LumaDyne
LLC., a Houston based scientific design, analysis and manufacturing company was
selected to design the prototype. Designers at LumaDyne, used SolidWorks - a 3D
CAD design software to accomplish this task. Figures 8.1 - 8.3 show the 3-D render-
ings of the stainless steel prototype. It can be seen from these design images that the
absorption and stripping chambers are sealed using mechanisms such as teflon spac-
ers and o-rings. Additionally, lateral forces are exerted on the ceramic foam blocks
on both sides with the use of incompressible teflon spacers to achieve good capillary
contact which is crucial for lateral flow of the absorbent solution. In order to prevent
gas bypass around the absorption or stripping side ceramic foam blocks, all the non-
flowing faces of the ceramic foam blocks are sealed by painting them with waterproof
213
epoxy paint (McMaster Part # 7617T5). The epoxy paint prevents any escape of
liquid through the non-flowing faces of the ceramic foam, thereby channeling all fluid
flow through the main body of the ceramic foam. Finally, stainless steel ‘tee’ fittings
purchased from Swagelok with appropriate sized bore holes were used for distributing
all incoming gases and liquids. Since, a part of the proof-of-concept demonstration
involves injecting steam into the stripping chamber; a steam generator is required.
Commercially available steam generators were considered for this application, how-
ever, analysis showed that their capacity was too large for the present application.
Hence, a miniature steam generator was designed by LumaDyne LLC. Figures 8.4
- 8.6 show the design details of this miniature steam generator. Five 80 Watt (W)
cartridge heater elements purchased from Omega Engineering were installed in the
miniature steam generator. A temperature controller purchased from Schneider Elec-
tric was used to control the heating elements. When operating with water at boiling
temperature (i.e. 100 oC at 101.3 kilopascals (kPa), the miniature steam generator
can generate steam at 0.64 kilograms per hour (kg/h).
8.1.3 Setup of experimental prototype
Having fabricated the stainless steel prototype and the miniature steam generator, the
next step towards the proof-of-concept demonstration was to design the experimental
setup for performing the experiments. Figure 8.7 shows a schematic representation of
the experimental setup developed for performing the proof-of-concept demonstration.

214
Figure 8.1 : Rendering of the stainless steel prototype
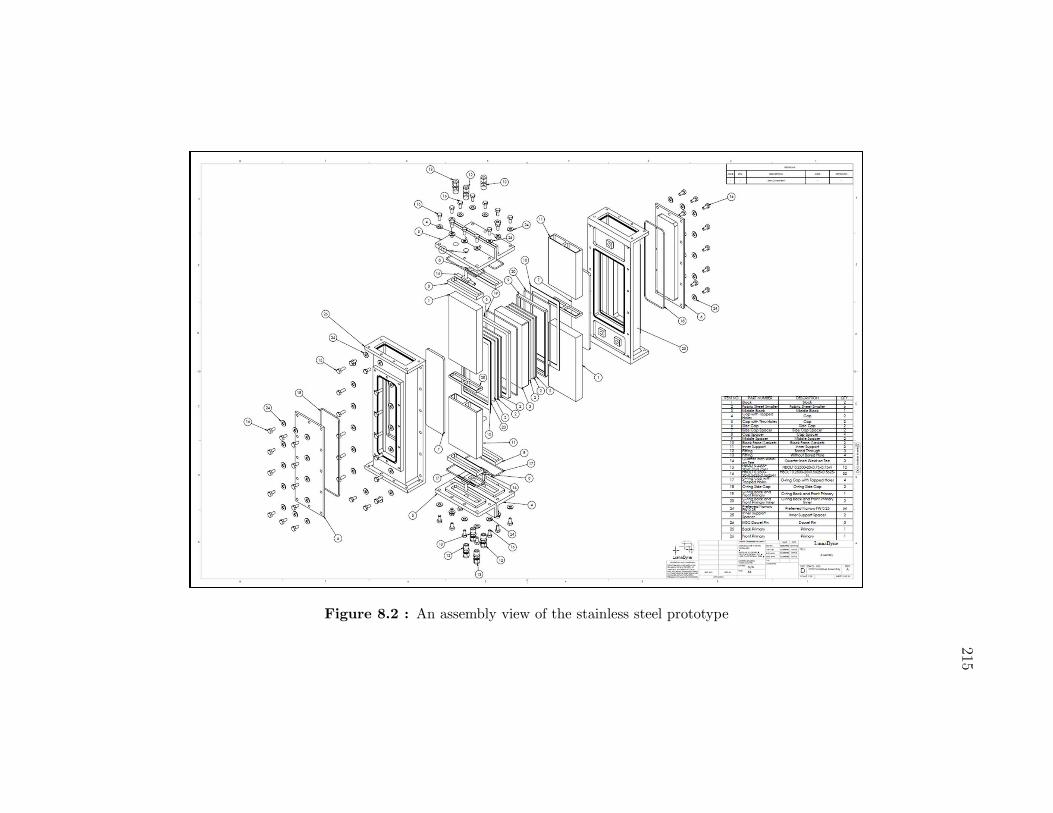
215
Figure 8.2 : An assembly view of the stainless steel prototype
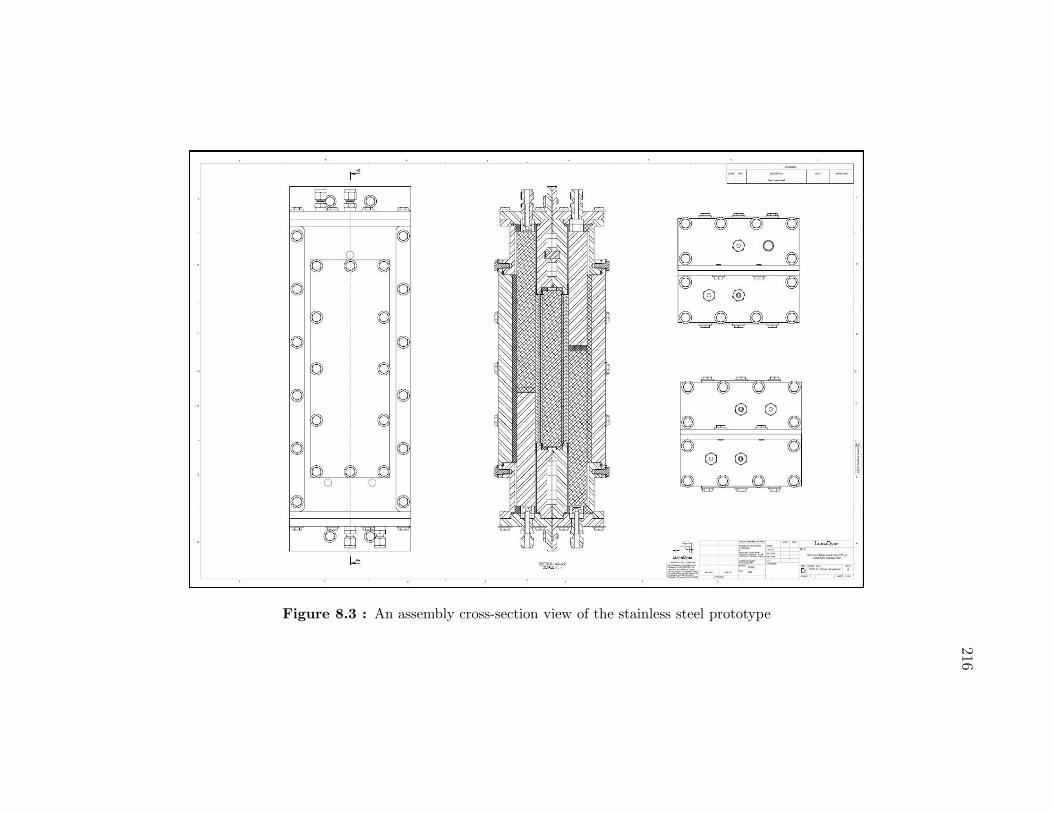
216
Figure 8.3 : An assembly cross-section view of the stainless steel prototype

217
Figure 8.4 : Rendering of the miniature steam generator
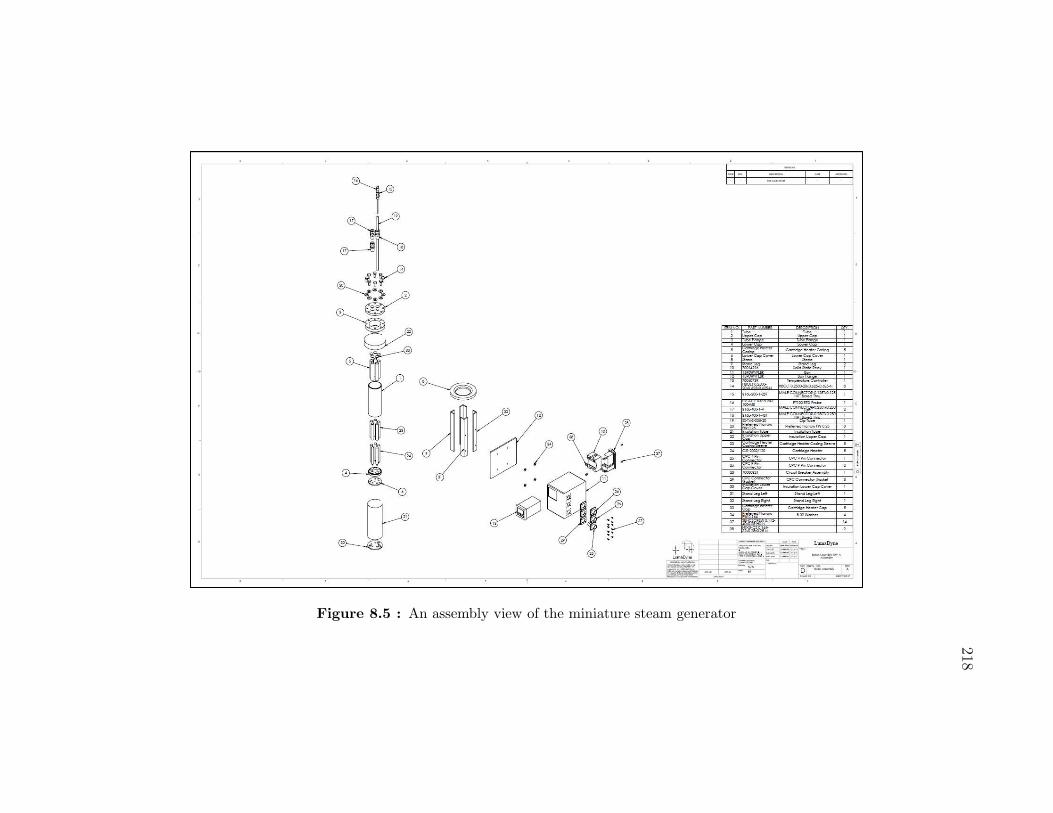
218
Figure 8.5 : An assembly view of the miniature steam generator

219
Figure 8.6 : An assembly cross-section view of the miniature steam generator

220
Conceptually, this setup is quite similar to that previously described in Chapter
7 and Figure 7.12. However, unlike the mass transfer setup which was operated
at atmospheric pressure; the absorption chamber in the stainless steel prototype is
pressurized between 0 and 20.7 kilopascals (kPa). This required making certain design
changes to the setup, specifically to prevent the channeling of gas along with exiting
absorbent. Whereas a liquid seal could be used in the experimental setup shown in
Figure 7.12, application of a similar concept in the present case would result in the
requirement of an improbably long liquid seal if water were used. To overcome this
problem, a spent absorbent reservoir was added to the system as shown in Figure
8.7. The spent absorbent reservoir acts both as a reservoir for any spent absorbent
leaving the absorption or stripping sides and prevents the escape of any gas. In order
to maintain a set pressure in the absorption chamber, an adjustable back pressure
regulator is installed downstream of the stainless steel prototype.
While in operation, a peristaltic pump draws the absorbent from a fresh ab-
sorbent reservoir and delivers it at the top of the stainless steel prototype where it
is distributed on the ceramic foam surface. Simulated flue gas containing 13% car-
bon dioxide (CO2) and 87 % nitrogen (N2) is introduced at the required flow-rate
by a mass flow controller. The decarbonized flue gas exiting the absorption chamber
through the adjustable back pressure regulator is analyzed using a LI-COR carbon
dioxide (CO2) detector. Spent absorbent flowing across to the stripping chamber
exits the prototype at the bottom of the stripping chamber.

221
When demonstrating simultaneous absorption and stripping operation, steam gen-
erated in the steam generator is introduced into the stripping chamber of the stainless
steel prototype at the bottom. Hot water at a temperature in excess of 95oC pro-
duced in a metallic hot water reservoir is constantly delivered to the miniature steam
generator using a second peristaltic pump. Absorbent along with steam condensate
exits the chamber at the bottom where it accumulates in the solvent reservoir. Figure
8.8 shows the experimental setup developed for the proof-of-concept demonstration of
the novel process with a combined absorber and stripper unit. As seen in this image,
the external surface of the stripping side chamber is covered with a thermal insula-
tion material made of alumina fiber material. The thermal insulation was purchased
from McMaster-Carr and has a K-factor of 0.48 at 800 oF (Part # 87575K84). Metal
fittings used for steam inlet and stripping side effluent were also wrapped in ther-
mal insulation to prevent excessive heat loss. The hot water reservoir and peristaltic
pump assembly used to operate the miniature steam generator on a continuous basis
is also seen in this image.
8.2 Proof-of-concept demonstration
8.2.1 Choice of operating parameters
The objective of the proof-of-concept demonstration is threefold. The first of these
is to demonstrate the feasibility of the proposed concept of achieving a lateral flow of
the absorbent solution, from the absorption chamber to the stripping side. This
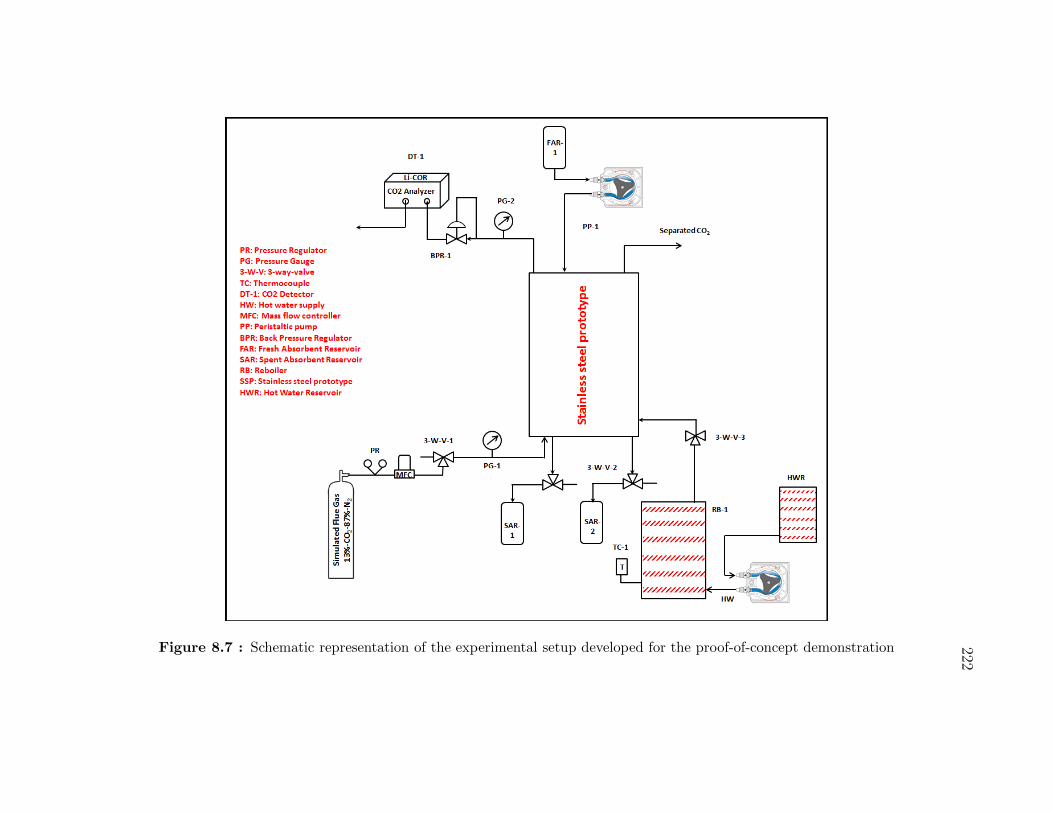
222
Figure 8.7 : Schematic representation of the experimental setup developed for the proof-of-concept demonstration

223
Figure 8.8 : Photograph of the experimental setup developed for the proof-of-concept demonstration

224
involves a complex operation of the prototype in which the simulated flue gas and
lean absorbent enter the absorption chamber and steam enters the stripping side. A
second goal is to operate the system at lower temperatures (without steam supply to
the stripping chamber) but wider range of operating pressures and flow-rates to collect
experimental data which can be used later to validate the results generated using a
computer model developed for this process. Finally, this proof-of-concept demonstra-
tion provides the first opportunity to test the proposed concept for the novel carbon
dioxide (CO2) separation process and thus, is an opportunity to observe it for design
and operational issues. As a part of the complete proof-of-concept demonstration,
thus, we have operated the process with a pressure differential of 20.7 kilopascals
(kPa) while injecting simulated flue gas at flow-rates of 0.25, 0.5 and 1.0 standard
liters per minute (SLPM) and 30 wt% diglycolamine (DGA) at 0.01 liters per minute
(LPM). Steam was introduced into the stripping chamber at a temperature of 102 oC
and 109 kilopascals (kPa-absolute). When operating without steam, the differential
pressures between the absorption and stripping chambers were varied between 6.9
and 20.7 kilopascals (kPa), simulated flue gas flow-rate was maintained at 0.25, 0.35,
0.5 and 1.0 standard liters per minute (SLPM) and the absorbent flow-rates studied
were 0.01, 0.02 and 0.03 liters per minute (LPM).
225
8.2.2 Experimental procedure
The objectives of the proof-of-concept demonstration experiments have been clearly
described in §§8.2.1. Since this stainless steel prototype was the first opportunity
to test the concept of an integrated absorber and stripper, establishing experimen-
tal protocol was considered critical to collecting reliable experimental data. When
operating the stainless steel prototype without steam, the absorption chamber was
first purged with nitrogen. When the measured carbon dioxide (CO2) concentration
of the exiting gas reduced to very low levels (e.g. 50 ppm); simulated flue gas was
introduced into the chamber. Simultaneously, the back pressure regulator installed
downstream of the stainless steel prototype was adjusted to achieve the required pres-
sure in the absorption chamber. This pressure was monitored with a pressure gauge
connected to the back pressure regulator. The gauge pressure is also the pressure
differential across the absorption and stripping chambers since the stripping side is
maintained at atmospheric pressure. Once, the absorption chamber was pressurized,
30 wt% diglycolamine (DGA) was flowed into the absorption chamber.
It was observed that when the system operation was started from a dry condition
(meaning the ceramic foam, fiber glass wool packing and alumina membrane were
completely dry), all the absorbent flowed across laterally into the stripping chamber
even at the lowest pressure difference tested (6.9 kilopascals (kPa)). However, when
the effluent flow-rate from the stripping chamber was measured; it was found to be
lower than the input rate. The lateral flow can be attributed to the existence of a large

226
pressure gradient between the absorption and stripping chambers which promotes the
flow of liquid. The difference between the input and outlet flow-rates, suggested the
accumulation of the absorbent liquid in the prototype. This can be attributed to
an increase in the liquid saturation of the ceramic foam, the alumina membrane and
the fiber glass wool. Collection of experimental data during this transient phase
would lead to faulty interpretation of system behavior and was carefully avoided.
After allowing the absorbent flow to continue in excess of 60 minutes, collection
of experimental data was commenced. The parameters measured were the degree of
carbon dioxide (CO2) removed in the absorption column and the lateral throughput of
liquid absorbent. Since the measurement of absorption side liquid effluent would result
in a disruption of the system operation, stripping side liquid effluent was measured
and a mass balance performed to determine the lateral flow-rate. Corresponding to
each operating condition (i.e. gas and liquid flow-rate and pressure difference), at least
three readings were made for the absorbent mass balance. Once these were found to
be repeatable, the experimental data was noted. In Figures 8.11 and 8.12, the points
corresponding to no data represent the cases under which no measurements were made
because the lateral transport of the absorbent solution was significantly smaller than
the inflow-rate. Specific precautions were taken to avoid absorbent accumulation in
the absorption chamber by draining the any accumulated solution periodically.
Operating the stainless steel prototype with steam was conceptually similar but
practically significantly more complicated due to the introduction of steam into the
227
stripping chamber. When operating with steam, the electrical heating tape on the
metallic hot water reservoir was switched on before commencing the flow experiments.
The heat rate was set to raise the water temperature to around 100 oC. Once this
set temperature was reached, the miniature steam generator was switched on. The
boiler vessel in the steam generator has a volume of 0.2 liters. This was loaded with
approximately 0.2 liters of hot water to expedite steam generation. Once a steady
flow of steam was observed coming out of the steam generator, the peristaltic pump
supplying hot water to the steam generator was turned on and set to flow at 0.01
liters per minute (LPM).
Simultaneously, simulated gas flow was turned on and the absorption side cham-
ber was pressurized. Once the chamber was pressurized, absorbent flow was initiated.
After allowing the flow to reach steady state, steam was introduced into the strip-
ping chamber. Simultaneously, temperature readings were made at the 10 equispaced
nodes located on the side-faces of the stainless steel prototype. Measuring these
temperatures using a conventional thermometer (e.g. thermocouple thermometer) is
impractical due to the significant time lag involved in attaining a steady reading.
Hence, a hand-held infrared thermometer purchased from McMaster-Carr was used
for making the temperature measurements. The thermometer has a response time of
around 1 second, a resolution of 0.1 oF and an accuracy of ± 1.8 oF. Temperature
measurements were made every 10 minutes till the temperatures reached a steady
state. It was observed that the heat losses, especially through the stripping side

228
of the stainless steel prototype were quite significant despite the use of thermal in-
sulation. This resulted in steam condensation occurring in the stripping chamber.
During constant operation, this steam condensate was periodically drained from the
stripping chamber by opening a 3-way valve installed on the liquid outlet port. Since
both the steam condensate and the laterally transported absorbent solution exit the
stainless steel prototype through the same outlet port, a direct measurement of the
lateral flow-rate is not possible. An indirect approach was developed to detect the
presence of diglycolamine (DGA) in the stripping chamber effluent. Several samples
of the stripping chamber effluent were collected in glass vials. A known quantity
of the effluent was then titrated with 0.1 Normal (N) hydrochloric acid (HCl) using
phenolphthalein as an indicator. Diglycolamine (DGA) is a base and reacts with
hydrochloric acid (HCl) to form its chloride salt. Thus, the lateral flow of absorbent
liquid can be confirmed by using the indirect acid-base titration technique. In the
subsequent section, we present the results of the proof-of-concept demonstration ex-
periments. Also presented are the results of the acid-base titration conducted to
detect the presence of diglycolamine (DGA) in the stripping side effluent.
8.2.3 Experimental results and analysis
Figure 8.9 shows a plot of the degree of carbon dioxide (CO2) removal taking place in
the absorption chamber of the stainless steel prototype when operating without steam
at a temperature of 23 oC and a liquid flow-rate 0.01 liters per minute (LPM). As

229
expected, the extent of carbon dioxide (CO2) removal taking place decreases gradually
as the gas flow-rate is increased. However, it appears that the degree of carbon dioxide
(CO2) removal has some dependence on the pressure differential maintained across
the absorption and stripping sides. It can be observed that the degree of carbon
dioxide (CO2) removed decreases as the pressure differential is increased. This can
likely be attributed to the dependence of the lateral flow of absorbent on the pressure
differential. As shown in Figure 8.10, the maximum lateral flow of absorbent solution
at a pressure difference of 6.9 kilopascals (kPa) is around 0.006 liters per minute
(LPM). This would result in the excess absorbent flowing down on the entirety of the
absorption side ceramic foam and exiting the chamber at the bottom. For the 13.8
and 20.7 kilopascals (kPa) cases, the maximum lateral flow-rates are both greater
than 0.01 liters per minute (LPM) resulting in all of the absorbent flowing across
to the stripping side. The dependence of lateral throughput on pressure drop is
observed to be linear except when the pressure differential was maintained at 20.7
kilopascals (kPa). The linear behavior is consistent with Darcy’s law (Equation 8.1)
which states that for a fluid of constant permeability (k) and viscosity (µ); fluid
flux (QA) is dependent only on the pressure gradient (P
L). At 20.7 kilopascals (kPa),
however, it is possible that the absorbent solution flowing laterally to the stripping
side did not wet the entire length of the absorption side resulting in the observed
trend. As seen in Figure 8.10, however, the experimentally measured flow-rates are
at least one order of magnitude lower than the calculated maximum flow-rate across
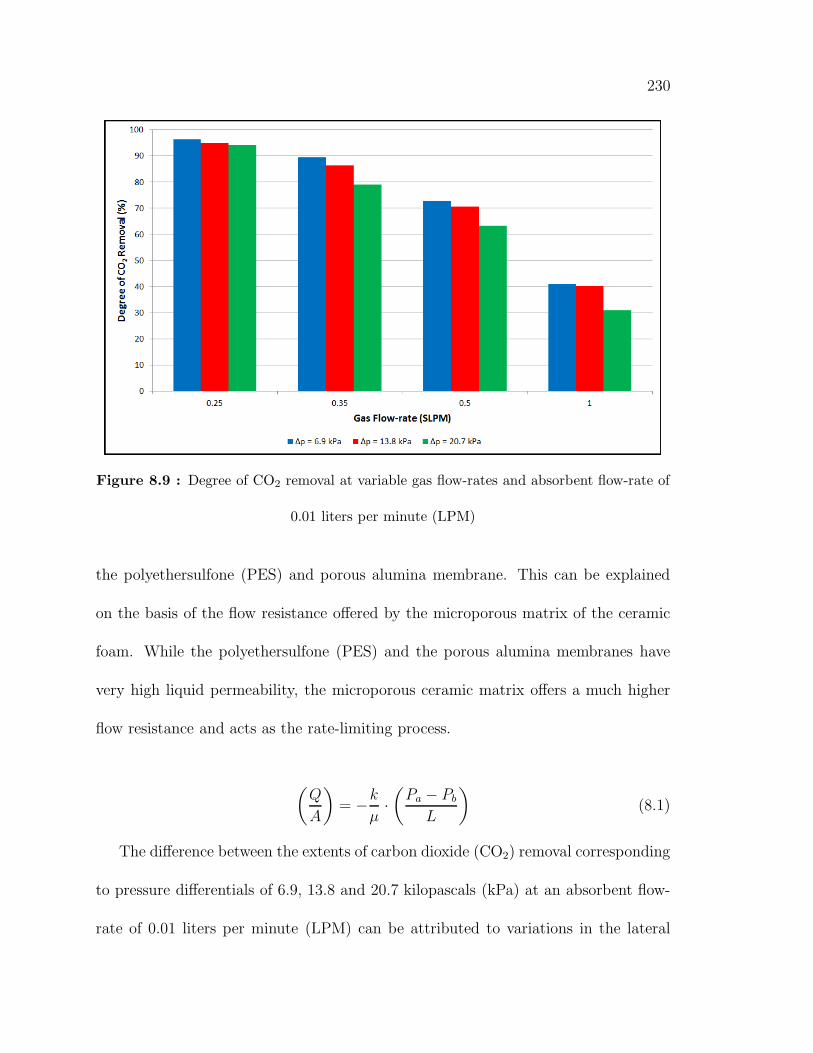
230
Figure 8.9 : Degree of CO2 removal at variable gas flow-rates and absorbent flow-rate of
0.01 liters per minute (LPM)
the polyethersulfone (PES) and porous alumina membrane. This can be explained
on the basis of the flow resistance offered by the microporous matrix of the ceramic
foam. While the polyethersulfone (PES) and the porous alumina membranes have
very high liquid permeability, the microporous ceramic matrix offers a much higher
flow resistance and acts as the rate-limiting process.
(
Q
A
)
= −k
µ·
(
Pa − Pb
L
)
(8.1)
The difference between the extents of carbon dioxide (CO2) removal corresponding
to pressure differentials of 6.9, 13.8 and 20.7 kilopascals (kPa) at an absorbent flow-
rate of 0.01 liters per minute (LPM) can be attributed to variations in the lateral

231
Figure 8.10 : Dependence of maximum lateral flow-rate of absorbent on pressure
difference across absorption and stripping chambers
transport of the absorbent. At lower pressure differentials, the absorbent flows down
a greater length of the ceramic foam before either draining at the bottom or completely
flowing across to the stripping side. At higher pressure differentials, the liquid flows
across laterally without wetting the entire ceramic foam surface which results in
decreased carbon dioxide (CO2) pickup. Figure 8.11 shows the extent of carbon
dioxide (CO2) removal for the two cases of 13.8 and 20.7 kilopascals (kPa) when
operating at an absorbent flow-rate of 0.02 liters per minute (LPM). No experiment
was conducted corresponding to a pressure differential of 6.9 kilopascals (kPa) case
since the absorbent flow-rate significantly exceeded the maximum lateral flow achieved
at that pressure. The trend observed for the dependence of carbon dioxide (CO2)

232
Figure 8.11 : Degree of CO2 removal at variable gas flow-rates and absorbent flow-rate
of 0.02 liters per minute (LPM)
removal on pressure difference in this plot is different from that in Figure 8.9. At an
absorbent flow-rate of 0.02 liters per minute (LPM), excess absorbent flows down the
entire length of the ceramic foam in both cases.
Figure 8.12 shows the degree of carbon dioxide (CO2) removal at an absorbent
flow-rate of 0.03 liters per minute (LPM) and a pressure differential of 20.7 kilopascals
(kPa). Better carbon dioxide (CO2) removal is observed in this case as compared to
the previous two cases involving lower flow-rates. Based on these results, it can
be concluded that it is possible to achieve more than 90% removal of inlet carbon
dioxide (CO2) in the combined absorption/desorption process while achieving lateral
flow absorbent.

233
Figure 8.12 : Degree of CO2 removal at variable gas flow-rates and absorbent flow-rate
of 0.03 liters per minute (LPM)
Figure 8.13 shows a comparison of the degree of carbon dioxide (CO2 removal
taking place in the absorption chamber of the stainless steel prototype when operat-
ing without and with steam flowing into the stripping chamber. The simulated gas
flow-rates maintained were 0.25, 0.5 and 1.0 standard liters per minute (SLPM), the
absorbent flow-rate was 0.01 liters per minute (LPM) and the pressure differential
between the absorption and stripping chambers was 20.7 kilopascals (kPa). During
the experiment, it was observed that there was a constant flow of liquid exiting the
absorption chamber. This observation is in contrast to the results of our previous
experimental studies conducted without steam (see Figure 8.10). This significant re-
duction in lateral transport of absorbent solution can be attributed to the changes

234
Figure 8.13 : Degree of CO2 removal at variable gas flow-rates, absorbent flow-rate of
0.01 liters per minute (LPM) and pressure differential (∆ P) of 20.7 kPa - with and
without steam
in its physical properties such as viscosity. Steam entering the stripping chamber
increases the temperature in the absorption chamber which results in a reduction of
the solution viscosity. This promotes the downwards flow of the absorbent solution
by gravity drainage. The trend observed in the dependence of carbon dioxide (CO2
removal is similar to those observed previously in Figures 8.9 - 8.12.
To verify the lateral flow of liquid from the absorption to stripping side, acid-base
titrations were performed. The results of these are summarized in Table 8.3. The
significant variance in the titration volumes can be attributed to the ejection of the
stripping chamber effluent in spurts as the entering steam escapes along with the

235
Figure 8.14 : A schematic representation of the experimental setup used for the
proof-of-concept demonstration - with experimental measurements and observations
liquid. These results clearly show the presence of a base in the stripping chamber ef-
fluent. Since the steam condensate itself is ‘distilled water’ and because no other basic
compound is injected into the stainless steel system, the source of this basicity was
concluded to be diglycolamine (DGA) flowing across from the absorption chamber.
Figure 8.14 shows a schematic representation of the experimental setup with the vari-
ous measurements and observations made during the proof-of-concept demonstration
with steam.
Figure 8.15 and Figure 8.16 show the temperatures measured on the external

236
Figure 8.15 : Temporal dependence of absorption side external surface temperatures
Figure 8.16 : Temporal dependence of stripping side external surface temperatures

237
Table 8.3 : Diglycolamine (DGA) concentration in stripping chamber effluent
Effluent Case # Effluent Volume Acid Concentration Acid Volume Base concentration in Effluent (N)
0.5 SLPM #1 10 0.1 11.4 0.114
0.5 SLPM #2 10 0.1 17.2 0.172
1.0 SLPM #1 10 0.1 10.1 0.101
1.0 SLPM #2 10 0.1 9.7 0.097

238
surfaces on the absorption and stripping sides of the stainless steel prototype. In these
figures, the lower number represents nodes at the top of the stainless steel prototype
whereas the higher number represents a node at the bottom. Addition of the steam
clearly resulted in a heating of the stripping chamber. However, it also resulted in a
significant increase in the absorption side temperature; a factor that could influence
both the lateral flow of absorbent solution as well as the degree of carbon dioxide
(CO2) removal.
8.3 Concluding Remarks
Based on the experimental results and observations presented in §§8.2.2, we can
conclude the following:
1. The concept of a performing carbon dioxide (CO2) absorption and stripping in
a single integrated unit is feasible. The experimental results shown in §§8.2.2
demonstrate that in excess of 90% carbon dioxide (CO2) removal can be achieved
using the combined absorber/stripper configuration.
2. As a material itself, ceramic foam can be used as a gas-liquid contactor in the
combined absorption and stripping unit. Significant property optimization is
however be required to improve hydrodynamic and mass transfer properties of
ceramic foam. Specifically, the use of coarser grade ceramic foam with larger
macro-pores may help in both, improving its hydrodynamic as well as mass
transfer properties.

239
3. The present configuration of the combined absorption and stripping process
is sufficient for a proof-of-concept demonstration. Optimization efforts are re-
quired next, to improve process design and operation.

240
Chapter 9
Recommendations for future work
The research results presented as a part of this thesis have provided answers to several
previously unanswered questions. With the use of process simulation and economic
evaluation softwares, we have demonstrated the feasibility of using vacuum stripping
accompanied with the use of ‘waste heat’ for absorbent regeneration. Our simula-
tion work has resulted in the invention of novel absorbent blends for the removal
of carbon dioxide (CO2). Using the limited thermodynamic data available, we have
demonstrated the potential for these absorbent blends to reduce energy consump-
tion by almost 25%. Similarly, we have advanced the innovative concept of a carbon
dioxide (CO2) separation process with a combined absorber and stripper to a proof-
of-concept stage. The interesting nature of these results has raised further questions
that must be answered in order to generate sufficient commercial interest. In this
chapter, we summarize these as the recommendations for future work.

241
9.1 Calibrating the economic feasibility of using waste heat
with coal-fired power plant operational data
In Chapters 4 and 5, we have focused on determining the technical and economic
feasibility of using waste heat for absorbent regeneration. We have identified that
using waste heat is a technically feasible proposition. In the absence of actual power
plant data and waste heat availability details, different hypothetical scenarios were
assumed to evaluate the parasitic power losses. While this has certainly helped in
establishing the benefits of using vacuum strippers in conjunction with waste heat,
these results are a step away from being of direct commercial use due to the lack
of calibration with actual plant data. Thus, the logical next step in the research
process is to collaborate with a power generation utility such as the Lower Colorado
River Authority (LCRA) which operates the coal-fired Fayette Power Project located
near La Grange, TX. A coal-fired power plant is a complex utility facility typically
operated with tight resource optimization. Information about the plant’s operation
and resource availability will make it feasible to conduct a more accurate evaluation
of the operational costs for the amine absorption process.
9.2 Development of novel absorbents
In Chapter 6, we have discussed our research on dissecting the reboiler energy duty
into the contributions of the three constituent physiochemical processes taking place
in the stripper/reboiler. This research has led to the invention of what we believe is
242
a new class of absorbents for the removal of carbon dioxide (CO2). We hypothesized
in Chapter 6 that the partial or complete replacement of water with an alternate
solvent such as an alcohol could potentially result in a large reduction in the reboiler
duty. Using the limited publicly available thermodynamic data describing the be-
havior of alkanolamine systems after the addition of alcohols, we have been able to
demonstrate almost 23% reduction in the reboiler duty for for a system consisting
of diethanolamine, methanol and water. While these certainly constitute as break-
through results, much remains to be studied about this invention.
9.3 Generating thermodynamic data and modeling
As discussed in Chapter 6, there is a very limited thermodynamic data available in
published literature to describe the behavior of carbon dioxide (CO2) loaded alka-
nolamine solutions blended with alcohols. The only system explored in some detail
is aqueous diethanolamine (DEA) mixed with methanol. However, as described in
Chapter 6; the physiochemical properties of other alcohols - especially the specific
heat capacity and heat of vaporization is as favorable towards reducing the reboiler
energy duty as that of methanol. Additionally, based on our results; it maybe ex-
pected that increasing the methanol content of the diethanolamine (DEA) blend from
20 wt% will result in further lowering of reboiler duty. Clearly, the bottleneck factor
toward advancing this research is the availability of sufficient, high quality thermo-
dynamic data describing the vapor-liquid equilibrium and mixing behavior. Thus,

243
it is strongly recommended that the necessary thermodynamic data be obtained by
conducting suitable experiments. At a minimum, the behavior of commonly used
alkanolamine such as monoethanolamine (MEA), diethanolamine (DEA) and digly-
colamine (DGA) mixed with alcohols such as methanol, ethanol and propanol(s) in
various proportions be explored.
The thermodynamic data measured thus can be fitted to a suitable thermody-
namic model such as the Electrolyte NRTL. The temperature dependent parameters
can be used with a commercial process simulator such as ProMax or AspenPlus to
simulate a closed loop amine absorption plant. Using process simulators to screen
the performance of novel absorbent blends has a significant benefit - it allows for a
complete estimation of the influence of alcohol addition to aqueous alkanolamines.
Both methanol and ethanol are significantly more volatile than water. This sug-
gests a significant escape of these alcohols along with the overhead vapors in both
the absorber and stripper columns. The use of auxiliary equipment such as water
wash stages in absorbers is a commonly used strategy to avoid excessive solvent loss.
However, it maybe expected that a more significant operation will be required with
the use of alcohol blended aqueous alkanolamines. On the stripper side, presence of
significant quantities of alcohol in the overhead vapors may require the operation of
the overhead partial condenser at a lower temperature than in case of conventional
absorbents. Additional separation maybe required downstream to reduce the alcohol
content of compressed carbon dioxide (CO2) to acceptable levels. Since the addition

244
of alcohols to aqueous alkanolamines appears to result in significant change in process
operation, it is important from a commercialization viewpoint to carefully analyze not
just the beneficial elements but also potential increases in the capital and operational
expenditure.
9.4 Exploring the potential for side reactions between alco-
hols and amines
A problem that the natural gas industry has worked on for a long time is equipment
corrosion with the use of aqueous alkanolamines [104, 9]. Another problem com-
monly observed with the use of aqueous alkanolamines is the oxidative degradation
of amines. Amines are known to react with oxygen (O2) dissolved in the absorbent
solution and undergo several side reactions. Diethanolamine (DEA), for example, is
known to form tris(hydroxyethyl)ethylenediamine (THEED) in the presence of carbon
dioxide (CO2), oxygen (O2) and sulfur dioxide (SO2) in the liquid absorbent. Other
commonly used amines are known to form complex ethylenediamine derivatives as
well. However, amine degradation chemistry is not as straightforward as just the for-
mation of these salts. Studies have shown that ethylenediamines are generated by the
reactions taking place between a series of intermediate compounds formed because of
amine degradation. Table 9.1 lists some of the more common degradation products
formed during amine degradation [105, 106].

245
Table 9.1 : Amine degradation products
Absorbent Reactant Reaction Products
All amines O2
Carboxylic acids
Imidazolidone
Monoethanolamine (MEA) CO2
Oxazolidone (OZD)
Hydroxyethyl Imidazolidone (HEI)
Hydroxyethyl Ethylenediamine (HEED)
Diglycolamine (DGA) CO2 bis-Hydroxyethyl-ethoxy Urea (BHEEU)
Diethanolamine (DEA) CO2
Hydroxyethyl Oxazolidone (HEOD)
bis-Hydroxyethyl Piperazine (BHEP)
tris-Hydroxyethyl Ethylenediamine (THEED)

246
Most of these compounds are formed only in small quantities after extended process
operation. Alcohols, however, are chemically active solvents and can react with most
of these degradation products to further form compounds such as amides, esters
amongst others. For this reason, it is of great importance to study the effects of
alcohol addition on the stability of aqueous alkanolamines and the rate of equipment
corrosion.
9.5 Modeling of combined absorber stripper system
In Chapters 7 and 8, we have discussed our idea of a novel process for the separation of
carbon dioxide (CO2) which involves combining of the absorber and stripper columns
into a single integrated unit. We have discussed our research efforts to identify suitable
materials for use in this process, their characterization and finally - developed a
bench-scale stainless steel prototype to demonstrate the proof-of-concept. As shown
in Chapter 8, the bench-scale prototype was developed using off-the-shelf materials.
This resulted in a system that was suitable for a proof-of-concept demonstration,
however, will have to be significantly optimized to compete with existing technology.
In order to optimize the process, it is important to first model it. Modeling the
system will aid in determining the relationship between different material properties,
process variables and design parameters. As an example, it was concluded in Chapter
7 that the commercial ceramic foam would have to be optimized to allow larger
macropore sizes which would permit better gas-liquid mass transfer and lower pressure

247
drops. Similarly, the lateral flow of liquid through the ceramic foam matrix is strongly
dependent on its material properties - specifically, the permeability. Modeling tools
such as COMSOL Multiphysics or ANSYS Fluent can be used to model the fluid flow
in this complex porous media. The results generated thus can be used to predict the
optimal parameters for a scaled-up system.
To summarize, we believe that the research performed as a part of this disser-
tation holds significant promise in reducing the economic penalties associated with
the removal of carbon dioxide (CO2) from power generation utilities. Much work, of
course, remains to be performed to move these developments forward out of a labo-
ratory environment to commercialization. However, with dedicated research efforts;
further refinement of these technologies is possible.

248
Appendix A
Design sheets for stainless steel prototype and
miniature boiler
This appendix contains the design drawings for the stainless steel prototype and the
miniature steam generator as provided by LumaDyne, LLC.

249

250

251

252

253

254

255

256
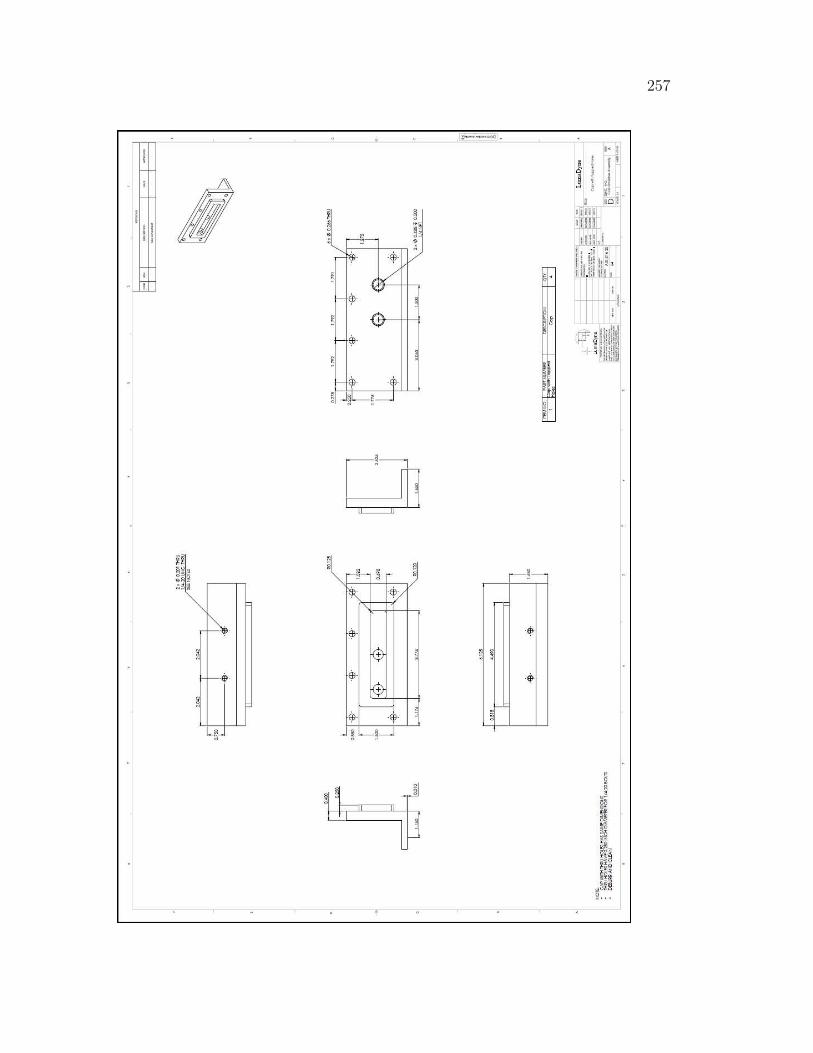
257

258

259
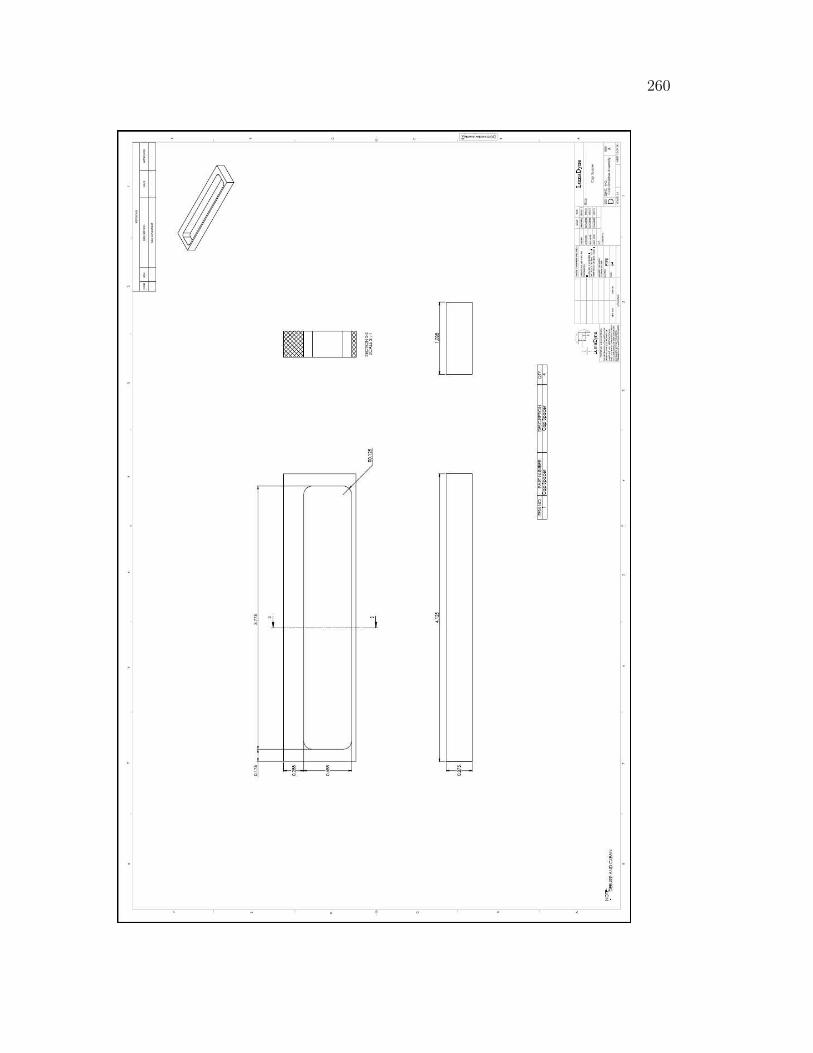
260

261

262

263

264

265

266

267

268

269

270

271

272
Bibliography
[1] British Petroleum, “Statistical Review of World Energy, June 2011”, 2012.
[2] A. Neftel, H. Friedli, E. Moor, H. Lotscher, H. Oeschger, U. Siegenthaler, and
B. Stauffer, “Historical Carbon Dioxide Record from the Siple Station Ice Core”,
Trends 93: A Compendium of Data on Global Change. ORNL/CDIAC-65. Car-
bon Dioxide Information Analysis Center, Oak Ridge National Laboratory, Oak
Ridge, Tenn, pp. 11–14, 1994.
[3] J.M. Barnola, D. Raynaud, C. Lorius, and N.I. Barkov, “Historical Carbon
Dioxide Record from the Vostok Ice Core”, Nature, vol. 329, pp. 408–414,
1987.
[4] National Oceanic and Atmospheric Administration (NOAA), “Global Surface
Temperature Anomalies”, 2013.
[5] P. Enkvist, T. Naucler, and J. Rosander, “A Cost Curve for Greenhouse Gas
Reduction”, McKinsey Quarterly, vol. 1, pp. 34, 2007.
[6] Image Courtesy of California CCS Coalition, “CCS Primer: Introduction to
CCS”, 2013.

273
[7] Image Courtesy of Cooperative Research Center for Greenhouse Gas Technolo-
gies (CO2CRC), “CO2CRC: Images & Videos”, 2013.
[8] Image Courtesy of Wikimedia Foundation, “Amine Gas Treating”, 2013.
[9] A.L. Kohl and R.B. Nielsen, Gas Purification, Gulf Professional Publishing,
1997.
[10] R. Sakwattanapong, A. Aroonwilas, and A. Veawab, “Behavior of Reboiler
Heat Duty for Carbon Dioxide (CO2) Capture Plants using Regenerable Single
and Blended Alkanolamines”, Industrial & engineering chemistry research, vol.
44, no. 12, pp. 4465–4473, 2005.
[11] E. Alper, “Kinetics of Reactions of Carbon Dioxide with Diglycolamine and
Morpholine”, The Chemical Engineering Journal, vol. 44, no. 2, pp. 107–111,
1990.
[12] P.D. Vaidya and E.Y. Kenig, “CO2 - Alkanolamine Reaction Kinetics: A Review
of Recent Studies”, Chemical Engineering & Technology, vol. 30, no. 11, pp.
1467–1474, 2007.
[13] E.Y. Kenig, R. Schneider, and A. Gorak, “Reactive Absorption: Optimal Pro-
cess Design via Optimal Modelling”, Chemical engineering science, vol. 56, no.
2, pp. 343–350, 2001.
[14] Image Courtesy of Dong Suh Machinery Co., “Product Info: Steam Jet Vacuum

274
Ejector”, 2013.
[15] M. Scheffler and P. Colombo, Cellular Ceramics, Wiley-Vch, 2006.
[16] M.S. DuPart, T.R. Bacon, and D.J. Edwards, “Understanding Corrosion in
Alkanolamine Gas Treating Plants”, Hydrocarbon Processing, vol. 72, no. 5,
pp. 89–94, 1993.
[17] H. Spliethoff, Power Generation from Solid Fuels, Springer Verlag, 2010.
[18] Foucher J.C. Hestermann R. Hilton B. Keegan B. Stephen D. Bartley, P., “Max-
imizing Economic and Environmental Performance of Existing Coal-fired As-
sets”, 2007.
[19] D. Singh, E. Croiset, P.L. Douglas, and M.A. Douglas, “Techno-economic Study
of CO2 Capture from an Existing Coal–fired Power Plant: MEA scrubbing vs.
O2/CO2 Recycle Combustion”, Energy Conversion and Management, vol. 44,
no. 19, pp. 3073–3091, 2003.
[20] H.Z. Kister, Distillation Design, vol. 1, McGraw-Hill New York, 1992.
[21] R. Safruddin, “Twenty Year Experience in Controlling Corrosion in Amine
Unit of Badak LNG Plant”, Corrosion (Paper: 00497, 2000.
[22] M. Nouri and D.R. Clarida, “Interaction of Process Design, Operating Con-
ditions and Corrosion in Amine Systems”, Corrosion Conference and Expo
(Paper: 07398), 2007.

275
[23] N. Raut, R.M. Chaudhari, and V.S. Naik, “Failure of Amine Regenerating
Column of Amine Treatment Unit”, Corrosion Conference and Expo (Paper:
09334), 2009.
[24] J. Conti and P. Holtberg, “International Energy Outlook 2011”, Department
of Energy, US Energy Information Administration, Washington, DC, 2011.
[25] National Oceanic and Atmospheric Administration (NOAA), “Trends in Car-
bon Dioxide”, 2013.
[26] D.J. Griggs and M. Noguer, “Climate Change 2001: The Scientific Basis.
Contribution of Working Group I to the Third Assessment Report of the Inter-
governmental Panel on Climate Change”, Weather, vol. 57, no. 8, 2002.
[27] S. Pacala and R. Socolow, “Stabilization Wedges: Solving the Climate Problem
for the Next 50 Years with Current Technologies”, Science, vol. 305, no. 5686,
pp. 968–972, 2004.
[28] International Energy Agency, “CO2 Emissions from Fuel Combustion: High-
lights”, 2013.
[29] B. Metz, IPCC Special Report on Carbon Dioxide Capture and Storage, Cam-
bridge University Press, 2005.
[30] National Energy Technology Laboratory, “Carbon Sequestration Atlas of the
United States and Canada: Third Edition (Atlas III)”, 2013.

276
[31] H. Herzog, “What Future for Carbon Capture and Sequestration?”, Environ-
mental Science and Technology, vol. 35, no. 7, pp. 148, 2001.
[32] D. Aaron and C. Tsouris, “Separation of Carbon Dioxide (CO2) from Flue Gas:
A Review”, Separation Science and Technology, vol. 40, no. 1, pp. 321, 2005.
[33] S.S. Warudkar, K.R. Cox, M.S. Wong, and G.J Hirasaki, “Influence of Stripper
Operating Parameters on the Performance of Amine Absorption Systems for
Post-combustion Carbon Capture: Part I. High Pressure Strippers (In Press)”,
International Journal of Greenhouse Gas Control, 2013.
[34] S.S. Warudkar, K.R. Cox, M.S. Wong, and G.J Hirasaki, “Influence of Strip-
per Operating Parameters on the Performance of Amine Absorption Systems
for Post-combustion Carbon Capture: Part II. Vacuum Strippers (In Press)”,
International Journal of Greenhouse Gas Control, 2013.
[35] S.S. Warudkar, K.R. Cox, M.S. Wong, G.J Hirasaki, and J.C. Forsythe, “Pro-
visional patent: Improved Absorbents for Carbon Dioxide Separation”, 2012.
[36] United Nations, “Millenium Development Goals Indicators: Global Carbon
Dioxide Emissions”, 2013.
[37] N. Shakhova, I. Semiletov, A. Salyuk, and D. Kosmach, “Anomalies of Methane
in the Atmosphere over the East Siberian Shelf: Is there any sign of Methane
Leakage from Shallow Shelf Hydrates?”, in Geophysical Research Abstracts,
2008, vol. 10, p. A01526.

277
[38] A. Chakma, A.K. Mehrotra, and B. Nielsen, “Comparison of Chemical Solvents
for Mitigating Carbon Dioxide (CO2) Emissions from Coal-fired Power Plants”,
Heat Recovery Systems and CHP, vol. 15, no. 2, pp. 231, 1995.
[39] C. Alie, L. Backham, E. Croiset, and P.L. Douglas, “Simulation of Carbon
Dioxide (CO2) Capture using MEA Scrubbing: A Flowsheet Decomposition
method”, Energy Conversion and Management, vol. 46, no. 3, pp. 475, 2005.
[40] J.P. Ciferno, P. DiPietro, and T. Tarka, “An Economic Scoping Study for
Carbon Dioxide (CO2) Capture using Aqueous Ammonia”, US DOE Final
report, 2005.
[41] H. Yang, Z. Xu, M. Fan, R. Gupta, R.B. Slimane, A.E. Bland, and I. Wright,
“Progress in Carbon Dioxide Separation and Capture: A Review”, Journal of
Environmental Sciences, vol. 20, no. 1, pp. 14–27, 2008.
[42] E.S. Rubin, C. Chen, and A.B. Rao, “Cost and Performance of Fossil Fuel
Power Plants with Carbon Dioxide (CO2) Capture and Storage”, Energy Policy,
vol. 35, no. 9, pp. 4444–4454, 2007.
[43] Mitsubishi Heavy Industries, “Mitsubishi’s Carbon Capture Technology: Ks-1,
hindered amine”, 2013.
[44] S. Bishnoi and G.T. Rochelle, “Absorption of Carbon Dioxide into Aqueous
Piperazine: Reaction Kinetics, Mass Transfer and Solubility”, Chemical Engi-
neering Science, vol. 55, no. 22, pp. 5531–5543, 2000.

278
[45] J.T. Cullinane and G.T. Rochelle, “Carbon Dioxide Absorption with Aqueous
Potassium Carbonate Promoted by Piperazine”, Chemical Engineering Science,
vol. 59, no. 17, pp. 3619–3630, 2004.
[46] J.T. Cullinane and G.T. Rochelle, “Kinetics of Carbon Dioxide Absorption
into Aqueous Potassium Carbonate and Piperazine”, Industrial & Engineering
Chemistry Research, vol. 45, no. 8, pp. 2531–2545, 2006.
[47] S.A. Freeman, R. Dugas, D.H. Van Wagener, T. Nguyen, and G.T. Rochelle,
“Carbon Dioxide Capture with Concentrated, Aqueous Piperazine”, Interna-
tional Journal of Greenhouse Gas Control, vol. 4, no. 2, pp. 119–124, 2010.
[48] R.E. Baltus, R.M. Counce, B.H. Culbertson, H. Luo, D.W. DePaoli, S. Dai,
and D.C. Duckworth, “Examination of the Potential of Ionic Liquids for Gas
Separations”, Separation Science and Technology, vol. 40, no. 1-3, pp. 525–541,
2005.
[49] P.G. Jessop, D.J. Heldebrant, X. Li, C.A. Eckert, and C.L. Liotta, “Green
Chemistry: Reversible Nonpolar-to-Polar Solvent”, Nature, vol. 436, no. 7054,
pp. 1102–1102, 2005.
[50] F. Karadas, M. Atilhan, and S. Aparicio, “Review on the use of Ionic Liq-
uids (ILs) as Alternative Fluids for CO2 Capture and Natural gas Sweetening”,
Energy & Fuels, vol. 24, no. 11, pp. 5817–5828, 2010.

279
[51] B.A. Oyenekan, Doctoral Dissertation: Modeling of Strippers for Carbon Diox-
ide Capture by Aqueous Amines, ProQuest, 2007.
[52] B.A. Oyenekan and G.T. Rochelle, “Energy Performance of Stripper Configu-
rations for Carbon Dioxide (CO2) Capture by Aqueous Amines”, Industrial &
Engineering Chemistry Research, vol. 45, no. 8, pp. 2457–2464, 2006.
[53] M.S. Jassim and G.T. Rochelle, “Innovative Absorber/Stripper Configurations
for Carbon Dioxide (CO2) Capture by Aqueous Monoethanolamine”, Industrial
& Engineering Chemistry Research, vol. 45, no. 8, pp. 2465–2472, 2006.
[54] V. Darde, K. Thomsen, W.J.M. van Well, and E.H. Stenby, “Chilled Ammonia
Process for CO2 Capture”, Energy Procedia, vol. 1, no. 1, pp. 1035–1042, 2009.
[55] F. Kozak, A. Petig, E. Morris, R. Rhudy, and D. Thimsen, “Chilled Ammonia
Process for CO2 Capture”, Energy Procedia, vol. 1, no. 1, pp. 1419–1426, 2009.
[56] K. Okabe, H. Mano, and Y. Fujioka, “Separation and Recovery of Carbon
Dioxide by a Membrane Flash Process”, International Journal of Greenhouse
Gas Control, vol. 2, no. 4, pp. 485–491, 2008.
[57] K. Okabe, S. Kodama, H. Mano, and Y. Fujioka, “Separation andRrecovery
of Carbon Dioxide by a Membrane Flash Process Utilizing Waste Thermal
Energy”, Energy Procedia, vol. 1, no. 1, pp. 1281–1288, 2009.
[58] E. Chen, Doctoral Dissertation: Carbon Dioxide Absorption into Piperazine

280
promoted Potassium Carbonate using Structured packing, ProQuest, 2007.
[59] P. Jackson and M. Attalla, “Environmental Impacts of Post-combustion
Capture–New Insights”, Energy Procedia, vol. 4, pp. 2277–2284, 2011.
[60] P.M. Mathias, S. Reddy, and J.P. OConnell, “Quantitative Evaluation of the
Chilled–Ammonia Process for CO2 Capture using Thermodynamic Analysis and
Process Simulation”, International Journal of Greenhouse Gas Control, vol. 4,
no. 2, pp. 174–179, 2010.
[61] E. Kenig and P. Seferlis, “Modeling Reactive Absorption”, Chemical Engineer-
ing Progress (CEP), vol. 1, pp. 65–73, 2009.
[62] R. Taylor and R. Krishna, “Modelling Reactive Distillation”, Chemical Engi-
neering Science, vol. 55, no. 22, pp. 5183–5229, 2000.
[63] E. Alfadala and E. Al-Musleh, “Simulation of an Acid Gas Removal Process
Using Methyldiethanolamine; an Equilibrium Approach”, in Proceedings of the
1st Annual Gas Processing Symposium, 2009, pp. 10–12.
[64] X. Luo, J.N. Knudsen, D. De Montigny, T. Sanpasertparnich, R. Idem,
D. Gelowitz, R. Notz, S. Hoch, H. Hasse, E. Lemaire, P. Alix, F.A. Tobiesen,
O. Juliussen, M. Kopcke, and H.F. Svendsen, “Comparison and Validation
of Simulation Codes against Sixteen Sets of Data from Four Different Pilot
Plants”, Energy Procedia, vol. 1, no. 1, pp. 1249–1256, 2009.

281
[65] J. Polasek and J. Bullin, “Selecting Amines for Sweetening units.”, Energy
Progress., vol. 4, no. 3, pp. 146–149, 1984.
[66] K.S. Sajwan, I. Twardowska, T. Punshon, and A.K. Alva, “Coal Combustion
Byproducts and Environmental Issues”, 2006.
[67] S. Reddy, D. Johnson, and J. Gilmartin, “Fluor’s Econamine FG Plus Technol-
ogy for CO2 Capture at Coal-fired Power Plants”, in Power Plant Air Pollutant
Control Mega Symposium, 2008, pp. 25–28.
[68] R.H. Perry and D.W. Green, Perry’s Chemical Engineers’ Handbook, McGraw-
Hill New York, 2008.
[69] V. Ganapathy, Steam Plant Calculations Manual, Revised and Expanded,
vol. 87, CRC, 1993.
[70] J. Katzer et al., “The Future of Coal: Options for a Carbon–Constrained
World”, Massachusetts Institute of Technology, 2007.
[71] J.D. Figueroa, T. Fout, S. Plasynski, H. McIlvried, and R.D. Srivastava, “Ad-
vances in CO2 Capture TechnologyThe US Department of Energy’s Carbon
Sequestration Program”, International Journal of Greenhouse Gas Control,
vol. 2, no. 1, pp. 9–20, 2008.
[72] Y.K. Salkuyeh and M. Mofarahi, “Reduction of CO2 Capture Plant Energy
Requirement by Selecting a Suitable Solvent and Analyzing the Operating Pa-

282
rameters”, International Journal of Energy Research (Available Online), 2012.
[73] M.O. Schach, R. Schneider, H. Schramm, and J.U. Repke, “Techno-economic
Analysis of Post-combustion Processes for the Capture of Carbon Dioxide from
Power Plant Flue Gas”, Industrial & Engineering Chemistry Research, vol. 49,
no. 5, pp. 2363–2370, 2010.
[74] M.R.M. Abu-Zahra, L.H.J. Schneiders, J.P.M. Niederer, P.H.M. Feron, and
G.F. Versteeg, “CO2 Capture from Power Plants: Part I. A Parametric Study of
the Technical Performance based on Monoethanolamine”, International Jour-
nal of Greenhouse Gas Control, vol. 1, no. 1, pp. 37–46, 2007.
[75] J. Klemes, I. Bulatov, and T. Cockerill, “Techno-economic Modelling and Cost
Functions of CO2 Capture Processes”, Computers & chemical engineering, vol.
31, no. 5, pp. 445–455, 2007.
[76] A. Cousins, L.T. Wardhaugh, and P.H.M. Feron, “A Survey of Rrocess Flow
sheet Modifications for Energy Efficient CO2 Capture from Flue Gases using
Chemical Absorption”, International Journal of Greenhouse Gas Control, vol.
5, no. 4, pp. 605–619, 2011.
[77] M.S. Peters, K.D. Timmerhaus, and R.E West, Plant Design and Economics
for Chemical Engineers, vol. 5, McGraw-Hill NY, 2003.
[78] Bryan Research and Engineering, “Promax User Manual”, 2013.

283
[79] J. Wagner, GPSA Engineering Data Book Revitalization and Maintenance:
Water-hydrocarbon Mutual Solubility Data, Gas Processors Association, 1999.
[80] W.Y. Svrcek and W.D. Monnery, “Design Two-phase Separators within the
Right Limits”, Chemical Engineering Progress, vol. 89, no. 10, pp. 53–60, 1993.
[81] F.S. Manning and R.E. Thompson, Oilfield Processing of Petroleum: Crude
Oil, vol. 2, Pennwell Corporation, 1995.
[82] M. Souders and G.G. Brown, “Design of Fractionating Columns I. Entrainment
and Capacity”, Industrial & Engineering Chemistry, vol. 26, no. 1, pp. 98–103,
1934.
[83] L. Theodore, Heat Transfer Applications for the Practicing Engineer, vol. 4,
Wiley, 2011.
[84] R.R Bottoms, “Process for Separating Acidic Gases”, Dec. 2 1930, US Patent
1,783,901.
[85] J. Oexmann and A. Kather, “Minimising the Regeneration Heat Duty of Post-
combustion CO2 Capture by Wet Chemical Absorption: The Misguided Focus
on Low Heat of Absorption Solvents”, International Journal of Greenhouse Gas
Control, vol. 4, no. 1, pp. 36–43, 2010.
[86] F.Y Jou, F.D. Otto, and A.E. Mather, “Vapor-liquid Equilib-
rium of Carbon dioxide in Aqueous Mixtures of Monoethanolamine and

284
Methyldiethanolamine”, Industrial & Engineering Chemistry Research, vol. 33,
no. 8, pp. 2002–2005, 1994.
[87] J.D. Lawson and A.W. Garst, “Gas sweetening data: Equilibrium Solubil-
ity of Hydrogen Sulfide and Carbon Dioxide in Aqueous Monoethanolamine
and Aqueous Diethanolamine Solutions”, Journal of Chemical and Engineering
Data, vol. 21, no. 1, pp. 20–30, 1976.
[88] M.L. Kennard and A. Meisen, “Solubility of Carbon Dioxide in Aqueous Di-
ethanolamine Solutions at Elevated Temperatures and Pressures”, Journal of
Chemical and Engineering Data, vol. 29, no. 3, pp. 309–312, 1984.
[89] J.L. Martin, F.D. Otto, and A.E. Mather, “Solubility of Hydrogen Sulfide
and Carbon Dioxide in a Diglycolamine Solution”, Journal of Chemical and
Engineering Data.
[90] S. Horstmann, P. Mougin, F. Lecomte, K. Fischer, and J. Gmehling, “Phase
Equilibrium and Excess Enthalpy Data for the System Methanol + 2, 2’-
Diethanolamine + water”, Journal of Chemical & Engineering Data, vol. 47,
no. 6, pp. 1496–1501, 2002.
[91] A. Archane, L. Gicquel, E. Provost, and W. Furst, “Effect of Methanol Addition
on Water–CO2–Diethanolamine System: Influence on CO2 Solubility and on
Liquid Phase Speciation”, Chemical Engineering Research and Design, vol. 86,
no. 6, pp. 592–599, 2008.

285
[92] R.L. Kent and B. Eisenberg, “Better Data for Amine Treating”, Hydrocarbon
Processing, vol. 55, no. 2, pp. 87–90, 1976.
[93] K.N. Habchi Tounsi, A. Barreau, E. Le Corre, P. Mougin, and E. Neau, “Mea-
surement of Carbon Dioxide Solubility in a Solution of Diethanolamine Mixed
with Methanol”, Industrial & Engineering Chemistry Research, vol. 44, no. 24,
pp. 9239–9243, 2005.
[94] J.I. Lee, F.D. Otto, and A.E. Mather, “Solubility of Carbon Dioxide in Aque-
ous Diethanolamine Solutions at High Pressures”, Journal of Chemical and
Engineering Data, vol. 17, no. 4, pp. 465–468, 1972.
[95] A. Wakisaka, H. Abdoul-Carime, Y. Yamamoto, and Y. Kiyozumi, “Non-
ideality of Binary Mixtures Water/ Methanol and Water/Acetonitrile from the
Viewpoint of Clustering Structure”, Journal of the Chemical Society, Faraday
Transactions, vol. 94, no. 3, pp. 369–374, 1998.
[96] A.R. Studart, U.T. Gonzenbach, E. Tervoort, and L.J. Gauckler, “Process-
ing Routes to Macroporous Ceramics: A Review”, Journal of the American
Ceramic Society, vol. 89, no. 6, pp. 1771–1789, 2006.
[97] M.V. Twigg and J.T. Richardson, “Theory and Applications of Ceramic Foam
Catalysts”, Chemical Engineering Research and Design, vol. 80, no. 2, pp.
183–189, 2002.

286
[98] M.H. De Brito, U. Von Stockar, A.M Bangerter, P. Bomio, and M. Laso, “Ef-
fective Mass Transfer Area in a Pilot Plant Column Equipped with Structured
Packings and with Ceramic Rings”, Industrial & Engineering Chemistry Re-
search, vol. 33, no. 3, pp. 647–656, 1994.
[99] Data Courtesy of AceChemPack Tower Packing Co Ltd, “Geometric Surface
Areas of Common Tower Packing”, 2013.
[100] S.L. Sah, Encyclopaedia of Petroleum Science and Engineering, vol. 1, Gyan
Publishing House, 2010.
[101] C.P. Stemmet, J.N. Jongmans, J. Van der Schaaf, B.F.M. Kuster, and J.C.
Schouten, “Hydrodynamics of Gas–Liquid Counter-current Flow in Solid Foam
Packings”, Chemical Engineering Science, vol. 60, no. 22, pp. 6422–6429, 2005.
[102] Sterlitech Corporation, “Chemical Compatibility Chart for General Laboratory
Filtration Products (available online)”, 2013.
[103] L.K. Wang, J.P. Chen, Y. Hung, and N.K. Shammas, Membrane and Desali-
nation Technologies, Humana Press, 2010.
[104] A.L. Cummings, S.W. Waite, and D.K. Nelsen, “Corrosion and Corrosion
Enhancers in Amine Systems”, in Brimstone Sulfur Conference. Banff, AB,
Canada, 2005.

287
[105] R. Haws, “Contaminants in Amine Gas Treating”, in Gas Processors Associa-
tion Houston Regional Meeting, 2001, pp. 1–13.
[106] H. Lepaumier, D. Picq, and P.L. Carrette, “New Amines for CO2 Capture.
I. Mechanisms of Amine Degradation in the Presence of CO2”, Industrial &
Engineering Chemistry Research, vol. 48, no. 20, pp. 9061–9067, 2009.


![Solubility of CO2 in Aqueous Solutions of Diethanolamine ...€¦ · 2 are absorption with chemical solvents such as alkanolamines [4,5]. Diethanolamine (DEA) is one of the alkanolamine](https://img.dokumen.tips/doc/110x75/5f30bd3df0b38f5b1d7f5ad2/solubility-of-co2-in-aqueous-solutions-of-diethanolamine-2-are-absorption-with.jpg)