Embed Size (px)
Citation preview
Re-Election Rates in the House of Representatives1946-1998
Elec tion Year
1 9 9 8
1 9 9 4
1 9 9 0
1 9 8 6
1 9 8 2
1 9 7 8
1 9 7 4
1 9 7 0
1 9 6 6
1 9 6 2
1 9 5 8
1 9 5 4
1 9 5 0
1 9 4 6
1 0 0
9 0
8 0
7 0
6 0
5 0
Pc t o f Se e k e rs
Re e l e c te d
Pc t o f E l i g i b l e
Re e l e c te d
Mean = 91.9%
Mean = 84.6%
*

Cracking the Minority
Packingthe Minority
Cracking the Majority
Gerrymandering: Drawing Electoral Boundaries for Political Advantage *
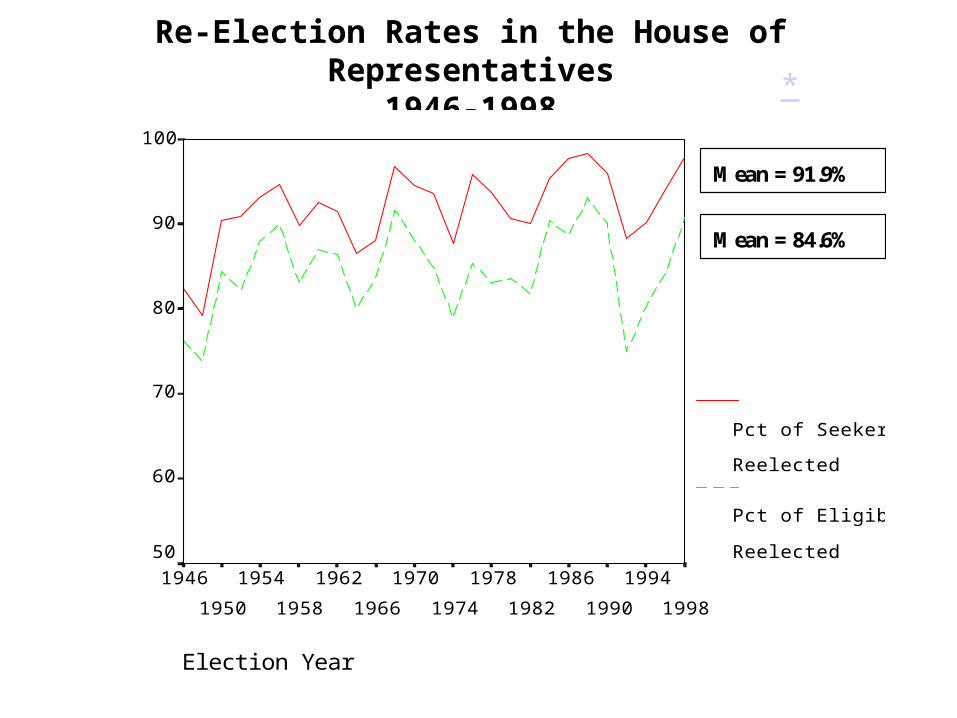
Porkbarrel Representation *

Casework Representation *

Year
1 9 9 6
1 9 9 4
1 9 9 2
1 9 9 0
1 9 8 8
1 9 8 6
1 9 8 4
1 9 8 2
1 9 8 0
1 9 7 8
1 9 7 6
1 9 7 4
1 9 7 2
1 9 7 0
Va
lue
1 0 0 0 0
8 0 0 0
6 0 0 0
4 0 0 0
2 0 0 0
0
Ho u s e Pe rs o n a l Sta f f
(T o ta l )
Ho u s e Pe rs o n a l Sta f f
i n D.C.
Ho u s e Pe rs o n a l Sta f f
i n Di s tri c t
THE IMPORTANCE OF CONSTITUENCY SERVICE:THE GROWTH IN DISTRICT STAFF *

An Example of the Franking Privilege *

YEAR
1993
1992
1991
1990
1989
1988
1987
1986
1985
1984
1983
1982
1981
1980
1979
1978
1977
1976
Me
an
Pe
rce
ntag
e C
han
ge100
50
0
-50
-100
Change in Congressional Mailings: Election Year vs. Off Year
*
Off-Year Mean Change: -32%
Election-Year Mean Change: +44%

Campaign Spending: Incumbents and Challengers *
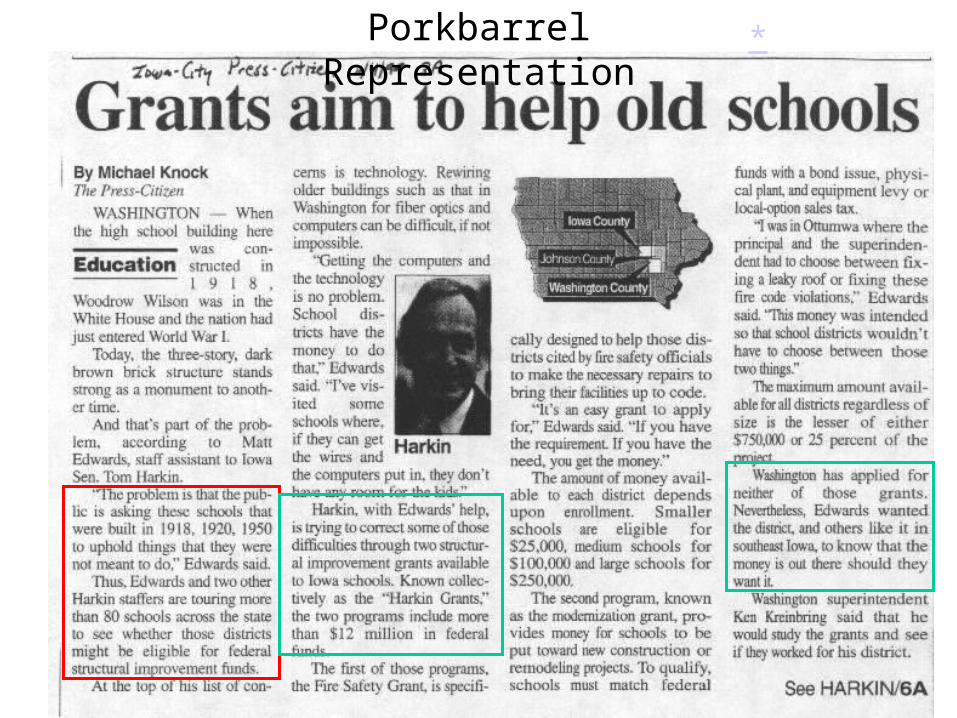
Effects of Campaign Spending: Name Recognition *

C o n g re s s
1 0 4
1 0 2
1 0 0
9 8
9 6
9 4
9 2
9 0
8 8
8 6
8 4
8 2
8 0
1 0 0
8 0
6 0
4 0
2 0
0
B ills In tro d u c e d
p e r W o rk d a y
B ills P a s s e d
p e r W o rk d a y
P o st-1 9 7 7M e a n : 3 5
P o st-1 9 7 7M e a n : 2
(1977)
LEGISLATIVE ACTIVITY IN THE HOUSE OF REPRESENTATIVES80TH –105TH CONGRESS
*

Year
10000
8000
6000
4000
2000
0
House Com m it t ee
St af f
Senat e Com m it t ee
St af f
House Per sonal
St af f
Senat e Per sonal
St af f
Source: VSAP, 2000, Figure 5-2
CONGRESSIONAL STAFFING1930-1997
*

The Simplified/Idealized Legislative Process *

Conservative Nature of Congress: Percent of Bills That Pass,1947-1998
Congress
1 0 41 0 21 0 09 89 69 49 29 08 88 68 48 28 0
Perc
ent o
f Int
rodu
ctio
ns th
at P
ass
1 6
1 4
1 2
1 0
8
6
4
2
Mean Percent ofBills that Pass: 6.7%
*
(1947-48) (1997-98)
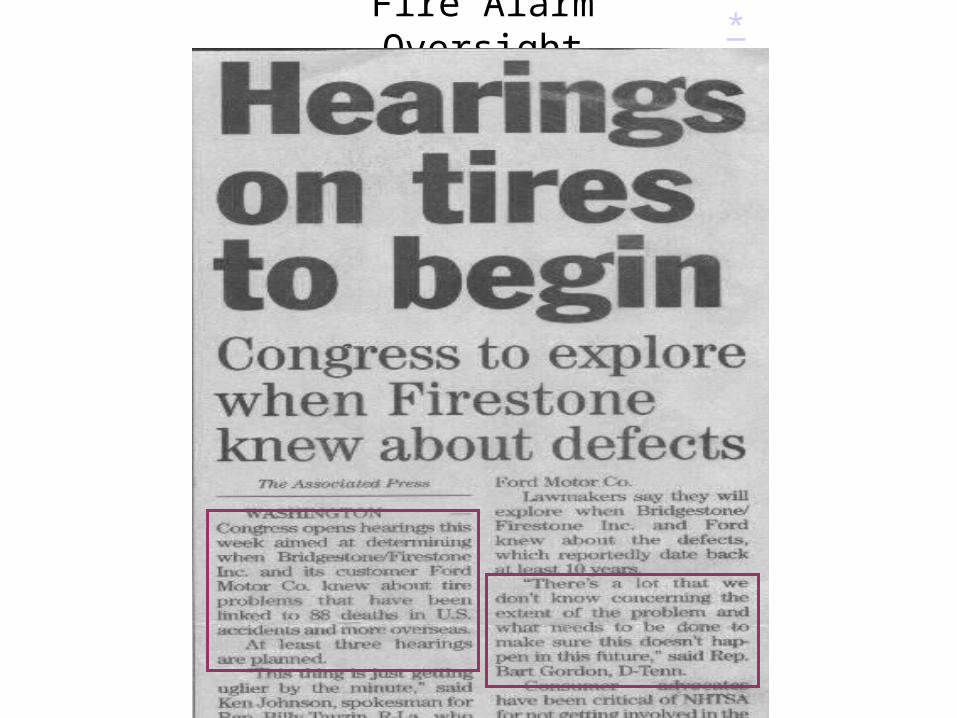
Fire Alarm Oversight *
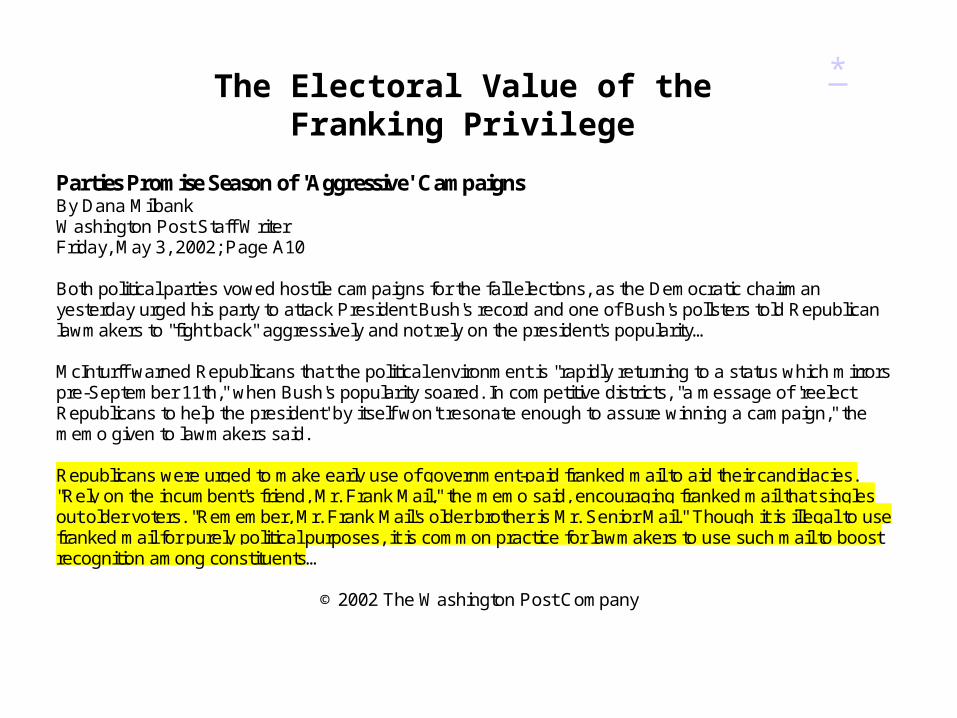
The Electoral Value of the Franking Privilege
Parties Promise Season of 'Aggressive' CampaignsBy Dana MilbankWashington Post Staff WriterFriday, May 3, 2002; Page A10
Both political parties vowed hostile campaigns for the fall elections, as the Democratic chairmanyesterday urged his party to attack President Bush's record and one of Bush's pollsters told Republicanlawmakers to "fight back" aggressively and not rely on the president's popularity…
McInturff warned Republicans that the political environment is "rapidly returning to a status which mirrorspre-September 11th," when Bush's popularity soared. In competitive districts, "a message of 'reelectRepublicans to help the president' by itself won't resonate enough to assure winning a campaign," thememo given to lawmakers said.
Republicans were urged to make early use of government-paid franked mail to aid their candidacies."Rely on the incumbent's friend, Mr. Frank Mail," the memo said, encouraging franked mail that singlesout older voters. "Remember, Mr. Frank Mail's older brother is Mr. Senior Mail." Though it is illegal to usefranked mail for purely political purposes, it is common practice for lawmakers to use such mail to boostrecognition among constituents…
© 2002 The Washington Post Company
*
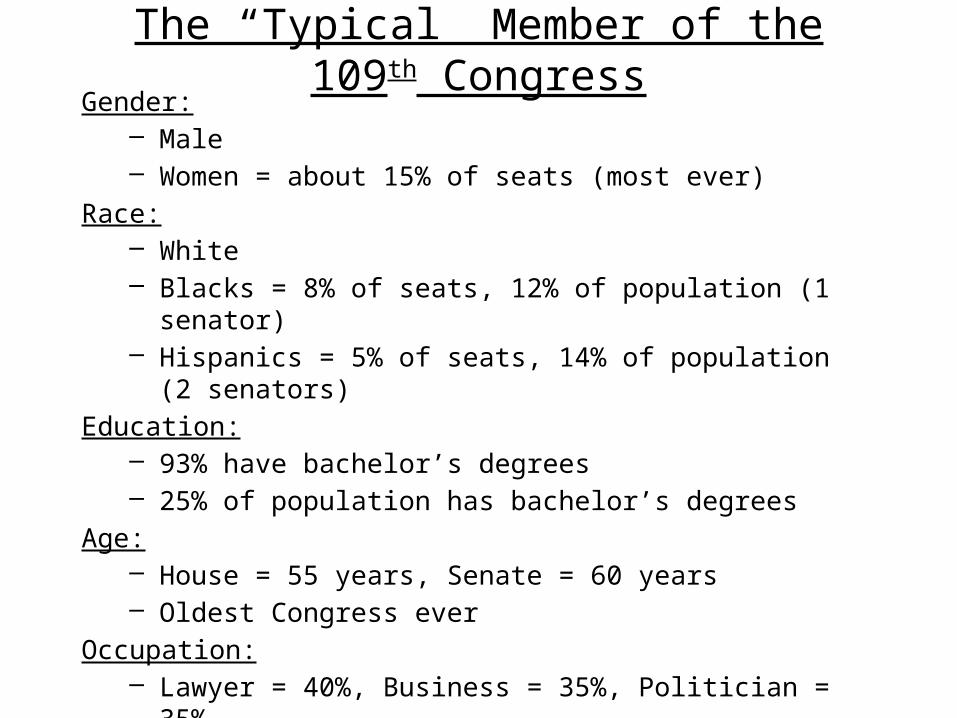
The “Typical” Member of the 109th CongressGender:
– Male– Women = about 15% of seats (most ever)
Race:– White– Blacks = 8% of seats, 12% of population (1 senator)– Hispanics = 5% of seats, 14% of population (2 senators)
Education: – 93% have bachelor’s degrees– 25% of population has bachelor’s degrees
Age: – House = 55 years, Senate = 60 years– Oldest Congress ever
Occupation:– Lawyer = 40%, Business = 35%, Politician = 35%
Return

“Quality Challengers”: The Chicken and the Egg
• To be a quality challenger, you need:
A good chance at winning, so that people
take your candidacy seriously.
In order to have a good chance at winning you need. . .
Funding, so that you can get your name recognized.In order to get funding, you need. . .
Return

Congres s
106
105
104
103
102
101
100
99
98
97
96
95
94
93
92
.20
.18
.16
.14
.12
.10
.08
.06
.04
.02
0. 00
Women as Percentage
of House
Af rican Americans as
Percent age of House
Hispanics as
Percentage of House
Source: VSAP 2000, Table 5-2
WOMEN, AFRICAN AMERICANS AND HISPANICS IN THE HOUSE OF REPRESENTATIVES
92nd - 106th CONGRESS
Return

Henry Clay and the “Unbounded” Congress:• 1806-07: Served in Senate (not yet 30) to fill the vacancy caused
by resignation• 1808-09: State house of representatives, speaker in 1809• 1810-11: Served in Senate to fill the vacancy caused by
resignation• 1811-14: House of Representatives, Speaker of the House • 1814: appointed one of the commissioners to negotiate the treaty
of peace with Great Britain• 1815-21: Speaker of the House• 1821-1823: “Retired”• 1823-1825: Speaker of the House• 1824: Ran for President• 1825-29: Secretary of State• 1831-42: Senate, chairman, Committee on Foreign Relations,
Committee on Finance• 1832: Ran for President• 1844: Ran for President• 1849-52: Senate• 1852: Dead Return

Violence in Pre-Civil War Congress
Return
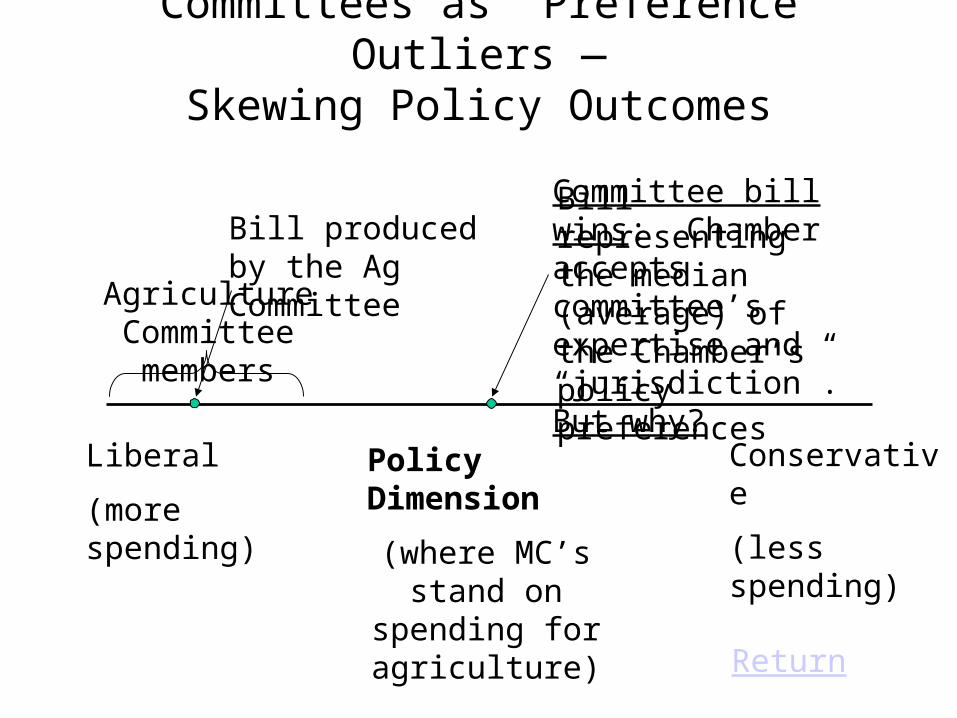
Committees as “Preference Outliers”—Skewing Policy Outcomes
Policy Dimension
(where MC’s stand on spending
for agriculture)
Liberal
(more spending)
Conservative
(less spending)
Agriculture Committee members
Bill representing the median (average) of the Chamber’s policy preferences
Bill produced by the Ag Committee
Committee bill wins: Chamber accepts committee’s expertise and “jurisdiction”. But why?
Return

Committees as Party Agents—Skewing Policy Outcomes
Policy Dimension
(where MC’s stand on spending
for agriculture)
Liberal
(more spending)
Conservative
(less spending)
Majority Party members
Bill representing the median (average) of the Chamber’s policy preferences
Bill produced by the majority-controlled Ag Committee
Majority party-favored bill wins: Party-agents on committee protect the majority party’s interests
Return

The Chamber Rules—Centrist Policy Outcomes
Policy Dimension
(where MC’s stand on spending
for agriculture)
Liberal
(more spending)
Conservative
(less spending)
Bill representing the median (average) of the Chamber’s policy preferences
Return
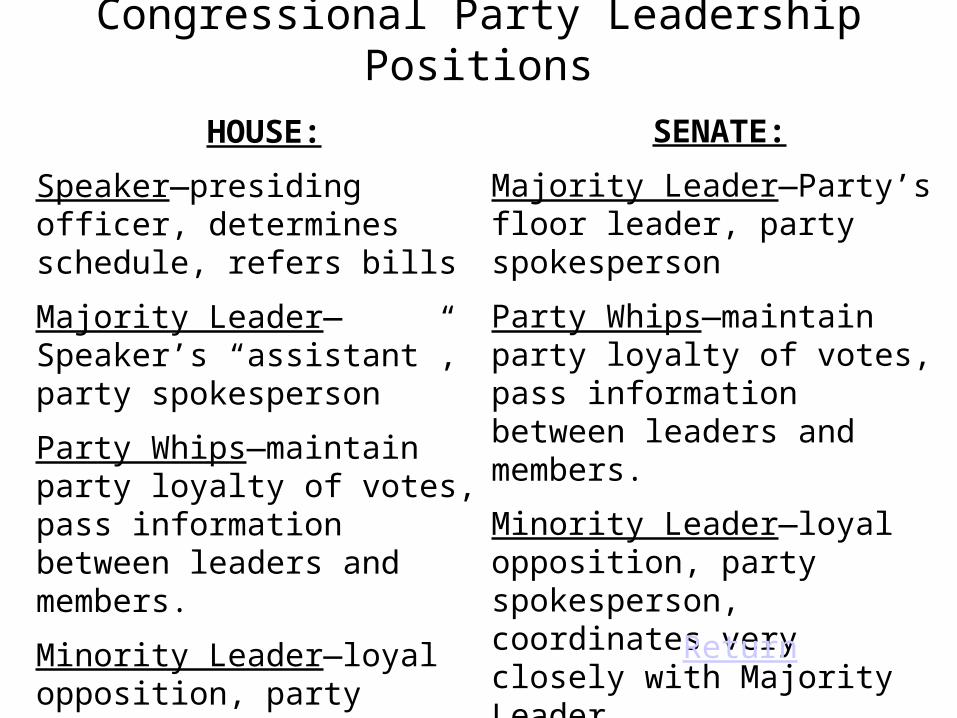
Congressional Party Leadership Positions
HOUSE:
Speaker—presiding officer, determines schedule, refers bills
Majority Leader—Speaker’s “assistant”, party spokesperson
Party Whips—maintain party loyalty of votes, pass information between leaders and members.
Minority Leader—loyal opposition, party spokesperson
SENATE:
Majority Leader—Party’s floor leader, party spokesperson
Party Whips—maintain party loyalty of votes, pass information between leaders and members.
Minority Leader—loyal opposition, party spokesperson, coordinates very closely with Majority Leader
Return

Cheating in 2305—Your Options
Keep Your Mouth Shut Spill It
KYMS
Spill It
Student 1
Student 2
C C
B F
F B
D D

Cheating in 2305—Your Options
Keep Your Mouth Shut Spill It
KYMS
Spill It
Student 1
Student 2
C C
B F
F B
D D

Cheating in 2305—Your Options
Keep Your Mouth Shut Spill It
KYMS
Spill It
Student 1
Student 2
C C
B F
F B
D D

Cheating in 2305—Your Options
Keep Your Mouth Shut Spill It
KYMS
Spill It
Student 1
Student 2
C C
B F
F B
D D

Cheating in 2305—Your Options
Keep Your Mouth Shut Spill It
KYMS
Spill It
Student 1
Student 2
C C
B F
F B
D D

Prisoner’s Dilemma
• By acting rationally individually, the group collectively ends up with sub-optimal outcomes.
Return

Serving on a Committee—Your Options
Stick ToBudget Spend Like Crazy
STB
SLC
Committee 1
Committee 2
+2 -15 +10
+10 -15 -10 -10
+2
Return