Embed Size (px)
Citation preview

Re-Analysis Report
Daylighting in Schools, Additional Analysis
February 14, 2002 HMG Project # 0008 NBI PIER Element 2
Final Reports, Task 2.2.1 through 2.2.5 File name: 2D2.2.5b_021402.doc
Submitted to: Cathy Higgins
New Buildings Institute, Inc. (509) 493-4468 x11
on behalf of the California Energy Commission
PIER Program
Submitted by: HESCHONG MAHONE GROUP 11626 Fair Oaks Blvd. #302
Fair Oaks, CA 95628 Phone:(916) 962-7001 Fax: (916) 962-0101
e-mail: [email protected] website: www.h-m-g.com

DAYLIGHTING IN SCHOOLS, RE-ANALYSIS REPORT ACKNOWLEDGMENTS
ACKNOWLEDGMENTS
This report is a part of the Integrated Energy Systems - Productivity and Buildings Science program, a Public Interest Energy Research (PIER) program. It is funded by California ratepayers through California's System Benefit Charges administered by the California Energy Commission (CEC) under (PIER) contract No. 400-99-013, and managed by the New Buildings Institute.
Project Director: Lisa Heschong. Data collection and report writing: Ihab Elzeyadi and Carey Knecht, Heschong Mahone Group.
Statistical Analysis: Dr. Roger Wright, director; Stacia Okura, analyst. RLW Analytics, Inc.
Review and Advisory Committee: Steven Selkowitz, LBNL; Bob Clear, LBNL; Dr. Rick Diamond, LBNL; Dr. Jed Waldman, California Department of Public Health; Dr. Gage Kingsbury, Northwest Evaluation Association; Dr. Judith Heerwagen, private consultant; Abby Vogen, Wisconsin Energy Center; Dr. Cliff Federspiel, Center for the Built Environment; Dr. Jeff Bristow, Capistrano Unified School District; Dr. Larry Zander, Fresno Unified School District.
Project Management: Peter Schwartz and Cathy Higgins, New Buildings Institute; Don Aumann, California Energy Commission.
LEGAL NOTICE
THIS REPORT WAS PREPARED AS A RESULT OF WORK SPONSORED BY THE CALIFORNIA ENERGY COMMISSION (COMMISSION). IT DOES NOT NECESSARILY REPRESENT THE VIEWS OF THE COMMISSION, ITS EMPLOYEES, OR THE STATE OF CALIFORNIA. THE COMMISSION, THE STATE OF CALIFORNIA, ITS EMPLOYEES, CONTRACTORS, AND SUBCONTRACTORS MAKE NO WARRANTY, EXPRESS OR IMPLIED, AND ASSUME NO LEGAL LIABILITY FOR THE INFORMATION IN THIS REPORT; NOR DOES ANY PARTY REPRESENT THAT THE USE OF THIS INFORMATION WILL NOT INFRINGE UPON PRIVATELY OWNED RIGHTS. THIS REPORT HAS NOT BEEN APPROVED OR DISAPPROVED BY THE COMMISSION NOR HAS THE COMMISSION PASSED UPON THE ACCURACY OR ADEQUACY OF THE INFORMATION IN THIS REPORT.
HESCHONG MAHONE GROUP February 14, 2002

DAYLIGHTING IN SCHOOLS, RE-ANALYSIS REPORT ABSTRACT
Title: Daylighting in Schools: Additional Analysis
Abstract: This study expands and validates previous research by Heschong Mahone Group that found a statistical correlation between the amount of daylight in elementary school classrooms and the performance of students on standardized math and reading tests. This research was performed under the California Energy Commission’s Public Interest Energy Research (PIER) Program and was managed by New Buildings Institute.
The researchers reanalyzed the 1997–1998 school year student performance data from the Capistrano Unified School District (California) and the Seattle Public School District (Washington) to answer questions from the peer review panel. The reanalysis findings are as follows:
• Overall, elementary school students in classrooms with the most daylight showed a 21% improvement in learning rates compared to students in classrooms with the least daylight.
• A teacher survey and teacher bias analysis found no assignment bias that might have skewed the original results; more experienced or more educated teachers “better” teachers were not significantly more likely to be assigned to classrooms with more daylighting.
• A grade level analysis found that the daylighting effect does not vary by grade.
• An absenteeism analysis found that physical classroom characteristics (daylighting, operable windows, air conditioning, portable classrooms) are not associated with variations in do not have an effect on student absenteeism. This seems to contradict claims that have been made about the health effects of daylight or other environmental conditions, as reflected in absenteeism rates of building occupants.
These results, which are consistent with the original findings, affirm that daylight has a positive and highly significant association with improved student performance. These findings may have important implications for the design of schools and other buildings.
Author: Lisa Heschong, Heschong Mahone Group.
Keywords: Daylight, Productivity, Student Performance, Window, Skylight, Absenteeism, Attendance, Health, Classroom Condition, School Design
Location: www.newbuildings.org/pier
HESCHONG MAHONE GROUP February 14, 2002

DAYLIGHTING IN SCHOOLS, RE-ANALYSIS REPORT TABLE OF CONTENTS
TABLE OF CONTENTS
EXECUTIVE SUMMARY __________________________________________ V
1. INTRODUCTION_______________________________________________ 1
1.1 Study Tasks _______________________________________________ 2 1.2 Literature Review of Research on Teachers' Influence ______________ 2
1.2.1 Differences with Our Study _______________________________ 5 1.3 Summary of Previous Study___________________________________ 5
2. TEACHER SURVEY (TASK 2.2.3)_________________________________ 8 2.1 Methodology_______________________________________________ 8
2.1.1 Survey Structure _______________________________________ 9 2.2 Teacher Characteristics _____________________________________ 10
2.2.1 Years of Experience ___________________________________ 10 2.2.2 Education Level, Certificates and Honors ___________________ 11 2.2.3 Classroom Preferences_________________________________ 13 2.2.4 Criteria for Classroom Selection __________________________ 14 2.2.5 Permanent vs. Portable Classroom Preference ______________ 16 2.2.6 Classroom Energy Management__________________________ 17
2.3 Conclusions ______________________________________________ 19 3. TEACHER BIAS ANALYSIS (TASK 2.2.4) _________________________ 21
3.1 Hypothesis _______________________________________________ 21 3.2 Methodology______________________________________________ 21
3.2.1 Teacher Credentials ___________________________________ 21 3.2.2 Assignment Bias ______________________________________ 22 3.2.3 Decision to Focus on Daylight Code Only___________________ 24 3.2.4 Daylight Code as a Dependant Variable ____________________ 24 3.2.5 Teacher Assignment Bias Models_________________________ 25
3.3 Findings _________________________________________________ 25 3.4 Conclusion _______________________________________________ 27
3.5 Discussion _______________________________________________ 27 3.5.1 Findings of Different Study Population Models _______________ 28 3.5.2 Conclusions of Different Study Population Models ____________ 31
HESCHONG MAHONE GROUP February 14, 2002i
DAYLIGHTING IN SCHOOLS, RE-ANALYSIS REPORT TABLE OF CONTENTS
4. GRADE LEVEL ANALYSIS (TASK 2.2.1) __________________________ 32
4.1 Hypothesis _______________________________________________ 32 4.2 Methodology______________________________________________ 33
4.3 Findings _________________________________________________ 33 4.4 Conclusions ______________________________________________ 35
5. ABSENTEEISM ANALYSIS (TASK 2.2.2) __________________________ 36 5.1 Hypothesis _______________________________________________ 37
5.2 Methodology______________________________________________ 38 5.3 Findings _________________________________________________ 39
5.3.1 Absenteeism Findings__________________________________ 39 5.3.2 Tardiness Findings ____________________________________ 40
5.4 Conclusions ______________________________________________ 40 5.5 Discussion _______________________________________________ 41
6. RE-ANALYSIS CONCLUSIONS (TASK 2.2.5) ______________________ 43 6.1 Grade Level Analysis _______________________________________ 43
6.2 Absenteeism Analysis ______________________________________ 43 6.3 Teacher Survey ___________________________________________ 43
6.4 Bias Analysis _____________________________________________ 44 6.5 Re-Analysis Report ________________________________________ 45
7. APPENDICES________________________________________________ 46 7.1 Statistical Terminology ______________________________________ 46
7.2 Teacher Survey ___________________________________________ 48 7.2.1 Three Most Important Criteria in Selection of Classroom _______ 50 7.2.2 Permanent v. Portable Classrooms _______________________ 57 7.2.3 Additional Comments __________________________________ 61
7.3 Bias Analysis Models _______________________________________ 65 7.4 Grade Level Models ________________________________________ 74
7.5 Absenteeism Models _______________________________________ 81
HESCHONG MAHONE GROUP February 14, 2002ii

DAYLIGHTING IN SCHOOLS, RE-ANALYSIS REPORT TABLE OF CONTENTS
TABLE OF FIGURES
Figure 1: Daylight Code Definitions___________________________________ 6
Figure 10- Correlation of Teacher Variables to Daylight Variables, Student level
Figure 11 - Change in Capistrano Math Model with Addition of Teacher
Figure 12 - Change in Capistrano Reading Model with Addition of Teacher
Figure 2: Surveyed vs. Original Population Distribution by Daylight Code _____ 9 Figure 3: Number of Years Teaching for Survey Respondents_____________ 11 Figure 4: Teacher Education Level __________________________________ 12 Figure 5: Teacher Certificates and Honors (Recognition) _________________ 13 Figure 6: Most Preferred Attributes of Classrooms ______________________ 15 Figure 7: Permanent vs. Portable Classroom Preference_________________ 16 Figure 8: Teachers' Energy Management of Classrooms _________________ 17 Figure 9: Teachers' Lighting Management of Classrooms ________________ 18
Analysis, Capistrano__________________________________________ 23
Variables___________________________________________________ 26
Variables___________________________________________________ 26 Figure 13: Surveyed, Original, and Expanded Populations________________ 28 Figure 14: Daylight Affect for Different Populations, with and without Teacher
Variables, on Reading Tests in Capistrano ________________________ 29 Figure 15: Daylight Affect for Different Populations, with and without Teacher
Variables, on Math Tests in Capistrano ___________________________ 29 Figure 16: Teacher Variables and Daylight effect on Reading for the Three
Populations Compared________________________________________ 30 Figure 17: Teacher Variables and Daylight effect on Math for the Three
Populations Compared________________________________________ 31 Figure 18: Capistrano Grade Level Models with Interactive Variables
Summary __________________________________________________ 34 Figure 19- Seattle Grade Level Models with Interactive Variables Summary __ 34 Figure 20- Distribution of Absences and Tardies _______________________ 38 Figure 21- Equation for natural log of attendance data ___________________ 39
APPENDICES:
Figure 22 - Capistrano Reading Models, Original Population, with and without Teacher Variables ___________________________________________ 65
Figure 23 - Capistrano Math Models, Original Population, with and without
Figure 24 - Capistrano Reading Model, Teacher Survey Population, with and Teacher Variables ___________________________________________ 66
without Teacher Variables _____________________________________ 67
HESCHONG MAHONE GROUP February 14, 2002iii

DAYLIGHTING IN SCHOOLS, RE-ANALYSIS REPORT TABLE OF CONTENTS
Figure 25 - Capistrano Math Model, Teacher Survey Population, with and without Teacher Variables ___________________________________________ 68
Figure 26 - Capistrano Reading Model, Expanded Population, with and without Teacher Variables ___________________________________________ 69
Figure 27 - Capistrano Math Model, Expanded Population, with and without Teacher Variables ___________________________________________ 70
Figure 28 - Descriptive Statistics, Capistrano Original Population __________ 71 Figure 29 - Descriptive Statistics, Capistrano Teacher Survey Population ____ 72 Figure 30 - Descriptive Statistics, Capistrano Expanded Population_________ 73 Figure 31- Capistrano Grade Level Interaction, Reading Daylight __________ 74 Figure 32- Capistrano Grade Level Interaction, Math Daylight _____________ 75 Figure 33- Seattle Grade Level Interaction, Reading Daylight _____________ 76 Figure 34 - Seattle Grade Level Interaction, Math Daylight________________ 77 Figure 35- Descriptive statistics, Capistrano Grade Level, Reading and Math _ 78 Figure 36- Descriptive statistics, Seattle Grade Level, Reading ____________ 79 Figure 37- Descriptive statistics, Seattle Grade Level, Math_______________ 80 Figure 38 - Capistrano Absenteeism Model ___________________________ 81 Figure 39 - Capistrano Tardiness Model______________________________ 82 Figure 40 - Capistrano Absenteeism/Tardiness Descriptive Statistics _______ 83
HESCHONG MAHONE GROUP February 14, 2002iv

DAYLIGHTING IN SCHOOLS, RE-ANALYSIS REPORT EXECUTIVE SUMMARY
EXECUTIVE SUMMARY
This report is a follow-on study to the Daylighting in Schools study1 that was completed in 1999, which found a compelling statistical correlation between the amount of daylighting in elementary school classrooms and the performance of students on standardized math and reading tests. This re-analysis of the original study data was intended to answer key questions raised by the peer review of the earlier study, and expand our understanding of methodological choices for further work.
The original findings potentially have very important implications for the design of schools and other buildings where people live, work and play. Daylight used to be common and even required in schools, homes and offices, but fully daylit buildings became increasingly rare as electric lighting became more the norm. This re-analysis study helps to provide greater certainty for the original findings.
For this re-analysis study HMG conducted four tasks:
The Teacher Survey collected information from a sample of teachers in the Capistrano school district about their education and experience levels, preferences for classroom features and operation of those features. The primary purpose of the survey was to provide input to a subsequent "assignment bias" analysis. In addition, we learned some useful information about teacher preferences, attitudes and behaviors in response to classrooms conditions.
While the teachers we surveyed generally had a preference for windows, daylight and views in their classrooms, these preferences were not found to be driving classroom preferences. Far more important was an almost universal desire for more space, a good location, quiet, lots of storage and water in the classroom.
Environmental control was also found to be an important issue for teachers, especially for those who did not have full control. Teachers seemed to hold a basic expectation that they would be able to control light levels, sun penetration, acoustic conditions, temperature and ventilation in their classrooms. They made passionate comments about the need for improvement if one or more of these environmental conditions could not be controlled in their classroom.
The Teacher Bias Analysis further examined information from the Teacher Survey. The survey data was coded into variables and statistically analyzed in relation to both assignment to daylit classrooms and the student performance models. The goal of the Bias Analysis was to discover if the original study had over-inflated the effect of daylight on student learning by not accounting for a potential "assignment bias" of better teachers to more daylit classrooms.
We conclusively found that there was not an “assignment bias” influencing our results. None of the individual teacher characteristics we identified were significant in explaining assignment to a daylit classroom in the Capistrano District. Considering all teacher characteristics together only explained 1% of the variation in assignment to daylit classrooms. We did find that a few types of teachers, those with more experience or
1 Heschong Mahone Group (1999). Daylighting in Schools. An investigation into the relationship between daylight and human performance. Detailed Report. Fair Oaks, CA. (http://www.h-m-g.com/Daylighting/daylighting_and_productivity.htm)
HESCHONG MAHONE GROUP February 14, 2002v

DAYLIGHTING IN SCHOOLS, RE-ANALYSIS REPORT EXECUTIVE SUMMARY
honors, were slightly more likely (1%-5%) to be assigned to classrooms with more windows or some types of skylights.
When we added the teacher characteristics to the original student performance models, the daylight variables were not reduced in significance. Further analysis of other sub-populations repeated these findings. Among twelve models considered, we identified a central tendency of a 21% improvement in student learning rates from those in classrooms with the least amount of daylight compared to those with the most.
In the Grade Level Analysis, we re-analyzed the original student test score data for both Capistrano and Seattle by separate grade level, instead of aggregating the data across the four grade levels (2-5). Our goal was to determine if this method would more accurately explain the relationship of student performance to daylighting. We tested for statistical significance and correlation, and we looked at any patterns discovered in the analysis.
The data did not show any significant patterns between a daylight effect and the separate grade levels, neither an increase or decrease in daylight effects by grade level. Thus, we conclude that there do not seem to be progressive effects as children get older, nor do younger children seem to be more sensitive to daylight than older children. Allowing the results to vary by grade did not noticeably improve the accuracy of the models. Therefore, we conclude that looking at data across grade levels is a sufficiently accurate methodology.
In the Absenteeism Analysis, we used absenteeism and tardiness data in the original Capistrano data set as dependent variables and evaluated them against the full set of explanatory variables from the original study, plus the new information on teacher characteristics. These models would allow us to assess whether daylighting or other classroom physical attributes potentially impacted student health, as measured by changes in student attendance.
Student attendance data is certainly not the best indicator of student health. Yet to the extent that attendance data does reflect student health, our findings do not suggest an obvious connection between physical classroom characteristics and student health. Notably, daylighting conditions, operable windows, air conditioning and portable classrooms were not found to be significant in predicting student absences.
Overall, the strength of the daylight variable in predicting student performance stands out sharply across all of these re-analysis efforts.
This analysis also demonstrated that the findings of these models are more strongly dependent upon the sample population then the subtleties of the explanatory variables. Thus, we believe that it will be more informative to replicate this study with a different population, to continue to try to refine the models with further detail in the explanatory variables.
HESCHONG MAHONE GROUP February 14, 2002vi

DAYLIGHTING IN SCHOOLS, RE-ANALYSIS REPORT INTRODUCTION
1. INTRODUCTION
The Daylighting in Schools study1 completed in 1999 by the Heschong Mahone Group on behalf of the California Board for Energy Efficiency found some a compelling statistical correlation between the amount of daylighting in elementary school classrooms and the performance of students on standardized math and reading tests.
The study was reviewed by a panel of experts, recruited by Lawrence Berkeley National Laboratory and involved a wide range of disciplines related to the study. In general the review panel was satisfied with the soundness of the basic methodology and the rigor of the statistical analysis. An additional “classroom level analysis” (included in the Appendix of the detailed version) verified the robustness of the initial results. The peer reviewers, however, expressed two primary concerns2 that could only be addressed in follow-up studies. These are:
1. The results might be confounded by a potential bias whereby "better" teachers might be more likely to be assigned to more daylit classrooms
2. The analysis might be more accurate if performed by grade level, rather than aggregating data from four grade levels together
The study described in this report, supported through the California Energy Commission's Public Interest Energy Research (PIER) program, was designed to address these two concerns, while also expanding other areas of our knowledge about the interaction of students, teachers and daylighting. The series of four tasks described in this report were the necessary first steps in resolving remaining questions about the Daylighting and Schools study. The results of these initial re-analysis studies will also be used to inform the methodology and data collection for the forthcoming PIER productivity studies in schools, retail, manufacturing, and offices.
This report discusses the re-analysis of the 97-98 school year student performance data on standardized math and reading tests from the Capistrano Unified School District in Southern California and the Seattle Public School District in Seattle Washington. The re-analysis of the original study data was intended to answer key questions raised by the peer review of the earlier study, and expand our understanding of methodological choices for further work.
1 Heschong Mahone Group (1999). Daylighting in Schools. An investigation into the relationship between daylight and human performance. Detailed Report. Fair Oaks, CA.
2 Heschong Mahone Group (1999). Daylighting and Productivity. An investigation into the relationship between daylight and human performance. Review Report. Fair Oaks, CA.
HESCHONG MAHONE GROUP February 14, 20021

DAYLIGHTING IN SCHOOLS, RE-ANALYSIS REPORT INTRODUCTION
1.1 Study Tasks
Four study tasks were defined, which are briefly summarized here, and described fully later:
w Teacher Survey
w Teacher Bias Analysis
w Grade Level Analysis
w Absenteeism Analysis
The Teacher Survey surveyed a sample of teachers in the Capistrano school district to determine their years of teaching experience, education level, and other characteristics that might be associated with being a "better" teacher. While we were conducting a survey, we decided to include a few additional questions to learn more about the teacher's perspective on classroom assignments, their preferences for the physical qualities of classrooms, and how they operated their classrooms.
The survey fed into the second task Teacher Bias Analysis. The teacher information from the survey was coded into variables that could be analyzed statistically. First we looked at the assignment bias, to see if some types of teachers were more likely to be assigned to more daylit classrooms in the Capistrano District. Next, we added the information about the teachers to the original Capistrano student test score models to see if accounting for teacher characteristics would impact the significance or magnitude of the daylight variables.
In addition to the tasks described above, we also re-analyzed the original data in two other ways. The Grade Level Analysis looked at the original student test score data for both Capistrano and Seattle by grade level to see if this was a more accurate way to study the relationship of student performance to daylighting.
The original Capistrano data set also included information on student attendance--both absences and tardiness. This gave us the opportunity to see if daylighting, or other physical characteristics of the classrooms in Capistrano, were associated with changes in attendance. For the Absenteeism Analysis task, we set student absenteeism and tardiness as dependent variables, and used the full set of explanatory variables used in the original study, plus the new information on teacher characteristics, to see if daylighting or other classroom attributes were associated with student attendance.
1.2 Literature Review of Research on Teachers' Influence
We looked to research by educational researchers in our effort to understand how teacher characteristics might be described and included in our models. Various educational researchers have analyzed the relationship between teacher performance and student achievement, and have identified a number of teacher
HESCHONG MAHONE GROUP February 14, 20022

DAYLIGHTING IN SCHOOLS, RE-ANALYSIS REPORT INTRODUCTION
characteristics that seem to fairly reliably predict student learning in the classroom. Factors that have been found to be significant in previous studies include a teacher's general intelligence, teaching experience, certain personality traits, knowledge of the subject matter, knowledge of teaching strategies, continuing education, and certification1. The following summary is based on an extensive literature review by Prof. Linda Darling-Hammond of the Stanford University School of Education (Darling-Hammond 2000) of the recent research on the relationship between teacher performance and student achievement. The reader is referred to her report for specific citations or further detail on studies.
This literature review helped inform the classification of teacher characteristic variables for in this study. The discussion below includes both the approach of other researchers to define variables of interest and a brief summary of some of their findings.
General intelligence: General intelligence as measured by IQ test or college grade point average shows the weakest performance as a predictor of subsequent student performance. While early studies in the 40's positively correlated teachers' intelligence and student achievement, these correlations are generally statistically insignificant and have not held up over time. Two meta-reviews of these studies performed in the 80's found little or no correlation.
Teaching experience: Researchers have usually measured teaching experience by the number of years a teacher has spent in the profession. While various studies have found a positive relationship between teachers' experience and student learning, this relationship is not always significant or linear. Although many studies conclude that inexperienced teachers generally perform less well than those with more experience, the benefits of experience tend to level off after approximately five years. This seems, however, to be dependent on the organizational structure of the school district: in districts that emphasize the importance of continuing education, long time teachers are more likely to improve throughout their career.
Teacher personality traits: Studies have found scant correlation between student learning and various teacher personality traits. One exception is a set of personality traits variously defined as "flexibility," "creativity," or "adaptability." This would seem to be consistent with a theory that a teacher's ability to creatively adjust their teaching methods to fit the needs of the students and the instructional goals would correlate positively with student learning. Some researchers have found that "flexibility" is also closely correlated to variables measuring a teacher's professional education, implying that teachers who have studied formally are more likely to be able to adjust teaching strategies for students' different learning styles.
Knowledge of subject matter: Knowledge of the subject matter to be taught, as measured by number of college classes taken or by scores on a subject matter
1 Darling Hammond, L. (2000). Teacher Quality and Student Achievement: A review of state policy evidence. Education Policy Analysis Archives, Vol. 8, number 1, available on-line, http://epaa.asu.edu/epaa/v8n1/
HESCHONG MAHONE GROUP February 14, 20023

DAYLIGHTING IN SCHOOLS, RE-ANALYSIS REPORT INTRODUCTION
test, has been found to be less important than might be expected. A variety of studies have shown small, statistically insignificant relationships, both positive and negative. One recent study found that teachers' coursework in the subject field relates positively to student achievement in mathematics and science, but that the number of courses show diminishing returns above a certain threshold level (Monk, 1994). A teacher's knowledge of the subject was found to be more important for higher-level classes and higher-achieving students (Hawk, Coble, & Swanson, 1985). Thus, a certain level of subject matter knowledge appears important, but above that point, other factors, such as the ability to effectively convey this knowledge, become more important to student achievement.
Teaching strategies: Knowledge of teaching strategies has been measured by number of education classes taken in teaching methods and level of college degree (BA or MA). These variables generally capture variance in teacher performance more effectively than the variables discussed above. Ferguson and Womack (1993) studied 200 graduates of one teacher education program. They concluded that the amount of education coursework was responsible for more than four times the variance (16.5 %) in teacher performance than measures of content knowledge, as determined by National Teacher Examination subject matter test scores and GPA in the major (4.5 %).
Continuing education: It is also seems to be important that teachers continue to refresh and update their knowledge through continuing education. Greater student achievement has been linked to mathematics teachers' opportunities to participate in sustained professional development courses. Similar results have been suggested for literature-based instruction. Not only is the amount of ongoing education important, but also how recent it is.
Certification: Standard certification usually requires a teacher to graduate from an accredited teacher training program, have a major or minor in the field to be taught, and pass a test on basic skills and teaching strategies. Therefore, certification status (standard certification vs. emergency, temporary or provisional certification issued to those lacking the above credentials) is a measure of both knowledge of the subject and of teaching skills. Linda Darling-Hammond compiled data from all 50 states using the 1993-94 Schools and Staffing Surveys (SASS) and the National Assessment of Educational Progress (NAEP). She found that at the state level, the percentage of well-qualified teachers (with full certification and a major in their field) was the strongest, consistently positive predictor of student achievement (.61 < r < .80, p<.001) while the percentage of newly hired, uncertified teachers was the strongest, most consistently negative predictor of student achievement (-.63 < r < -.40, p<.05).
Scores on state licensing examinations: Another variable that combines several important factors are scores on state licensing examinations, which test both basic skills and teaching knowledge. Ronald Ferguson (1991) examined 900 Texas school districts, controlling for student background and district differences, and found that a combination of teacher qualification variables – scores on a licensing examination, education level, and years of experience --explained more of the inter-district variation in students' reading and mathematics
HESCHONG MAHONE GROUP February 14, 20024

DAYLIGHTING IN SCHOOLS, RE-ANALYSIS REPORT INTRODUCTION
achievement gains than student socioeconomic status. The strongest of these variables were the scores on the state licensing exam.
1.2.1 Differences with Our Study
These studies formed a context of our work. However, the goal of our study was not to determine the effect of teachers’ credentials, qualifications, and experience on student performance. Our goal, rather, was to discover whether daylighting in classrooms remained a significant indicator of student performance even when teacher characteristic variables were included in a statistical regression model. Thus, our study differed from those discussed above in several important ways.
First of all, our data collection procedure of teacher variables was limited, due to privacy concerns, to the variables we could reliably measure through self-reporting. We had to exclude original sources such as transcripts, college or licensing board test scores, or classroom observations.
Second, the data in other studies was often aggregated to the district or state level. We, on the other hand, analyzed the data at the student and classroom level, which may yield different results or emphasize different factors.
1.3 Summary of Previous Study
For the original schools study we identified three study sites of large school districts that had a range of daylighting conditions in their classrooms. We collected test scores and demographic information for all second through fifth graders in the district, and classified their classrooms for the amount and quality of daylight available. We choose to work with data on elementary school children since they typically spend all year in one classroom. Thus, we could directly isolate the effects of that one classroom. We also specifically selected districts that had a number of classrooms lit from above with skylights or roof monitors (“toplighting”). We reasoned that daylight provided through windows might have a number of complicating factors, such as the quality of view, whereas daylight provided from above typically had fewer other qualities that might influence results, thus we would be more likely to be looking a pure “daylighting” effect.
The three districts were located in San Juan Capistrano, (Southern) California; Seattle, Washington; and Fort Collins, Colorado. These three districts have very different climates, different school building types, different curriculums and different testing protocols. The districts also provided us with information about student demographic characteristics, special school programs, size of schools, etc.
We added information to these data sets about the physical conditions of the classrooms to which these children were assigned. We reviewed architectural plans, aerial photographs and maintenance records and visited a sample of the schools in each district to classify the daylighting conditions in over 2000
HESCHONG MAHONE GROUP February 14, 20025

DAYLIGHTING IN SCHOOLS, RE-ANALYSIS REPORT INTRODUCTION
classrooms. Each classroom was assigned a series of codes on a 0-5 scale (see Figure 1) indicating the size and tint of its windows, the presence and type of any skylighting, and a holistic daylighting code indicating the overall quality and quantity of daylight expected from both windows and toplighting combined. In Capistrano, the skylights were given a variable type (A, AA, B, C, D) rather than a scalar. The configuration of these skylight types is described in the original report. The Daylight Code, which is used predominately for reporting findings in this report, was based on the following qualitative criteria, with foot candle levels at midday conditions are provided as an illustration rather than a criteria.
Daylight Code 5 Classroom is adequately and uniformly lit with daylight, such that teacher could successfully instruct with electric lights off, for most of the school year. 50± footcandles on most desks.
Daylight Code 4 Classroom has major daylight component, and could occasionally be operated without any electric lights. Daylight may have strong gradient. 30± footcandles on many desks.
Daylight Code 3 Classroom has adequate levels in limited areas, such as near windows. Some, but not all, electric lights could occasionally be turned off. 15± footcandles at some desks.
Daylight Code 2 Classroom has poor and/or very uneven daylight. Not likely to ever operate without electric lights fully on. 10± footcandles in limited areas.
Daylight Code 1 Classroom has minimal daylight. Very small and/or darkly tinted windows or inadequate toplighting. Not possible to operate without electric lights. 5± footcandles in limited areas.
Daylight Code 0 Classroom has no daylight.
Figure 1: Daylight Code Definitions
Ultimately the study analyzed test scores performance for 8000 to 9000 students per district. We looked at both math and reading scores in all three districts, and analyzed each separately, alternately using the holistic daylight code and the separate window and skylight codes, for a total of twelve statistical models.
The Capistrano Unified School District proved to be our most interesting study site for a number of reasons. The District administers standardized tests both in the fall and spring, allowing us to compare the change in students’ math and reading test scores while they spent the year in one classroom environment. Because the District, like most in California, has a number of standardized portable classrooms at every elementary site, we were able to use these portables as a standardized condition controlling for the influence of individual school sites or neighborhoods. We also collected additional information at this district about the HVAC and ventilation conditions of the classrooms, which was also included in the analysis.
In Capistrano, using a regression equation that controlled for 50 other variables, we found that students with the most daylighting in their classrooms progressed
HESCHONG MAHONE GROUP February 14, 20026

DAYLIGHTING IN SCHOOLS, RE-ANALYSIS REPORT INTRODUCTION
20% faster on math tests and 26% on reading tests in one year than those with the least. Similarly, students in classrooms with the largest window areas were found to progress 15% faster in math and 23% faster in reading than those with the least. Students that had a well-designed skylight in their room, one that diffused the daylight throughout the room and which allowed teachers to control the amount of daylight entering the room, also improved 19-20% faster than those students without a skylight. Classrooms with a skylight that allowed direct beam sunlight into the classroom and did not provide the teacher with a way to control the amount of daylight were actually seen to have a negative association with student performance. In addition, in three of the four Capistrano models, the presence of an operable window in the classroom was also seen to have a positive effect on student progress, associated with 7-8% faster learning. These effects were all observed with 99% statistical certainty.
The Seattle and Fort Collins school districts administer only one standardized test at the end of the school year. In these districts, the study used the final scores on math and reading tests at the end of the school year and compared the results to the district-wide average test score. In both of these districts we also found positive and highly significant (99%) effects for daylighting. Students in classrooms with the most daylighting were found to have 7% to 18% higher scores than those with the least.
The three districts have different curricula and teaching styles, different school building designs, and very different climates. And yet, the results of the studies show consistently positive and highly significant effects. This consistency across such diverse school environments persuasively argues that there is a valid and predictable effect of daylighting on student performance.
These models explained from 25% to 44% of the variation in student scores (R2= .25 to .44). Thus another 56% to 75% of the variation might be explained by other factors not included in our equation such as teacher quality, home life, health, nutrition, individual talents and motivation, etc. There always remains the possibility that some other variable left out of the equation is influencing results on the variable of interest.
Reviewers of the original school study specifically asked if “better” teachers were more likely to be assigned to the more daylight classrooms, thus influencing the results. Additionally, they asked if the analysis might be more accurate if performed by grade level rather than aggregating data from four grade levels together. This follow-on study addresses those concerns by re-examining our most detailed models for the Capistrano district.
HESCHONG MAHONE GROUP February 14, 20027

DAYLIGHTING IN SCHOOLS, RE-ANALYSIS REPORT TEACHER SURVEY
2. TEACHER SURVEY
The first task for the follow-up study was to collect additional information about the teachers that could be added to the original models. We choose to work with the Capistrano Unified School District for three reasons: they had provided us with the most detail in the original study, they were willing to cooperate with us on further studies, and they were physically the closest district to us.
2.1 Methodology
We asked the District the best way to compile additional information about the specific teachers in the study that would be useful in our re-analysis. The District was unable to provide us with information about their teachers directly due to confidentiality restrictions. However, they agreed that we could solicit such information from the teachers, in a survey. A survey gave the teachers an opportunity to decline to participate, and allowed us to collect additional information that could be kept confidential from the District.
We agreed that the District would review and approve the instrument, and also help us to locate the teachers in our sample for distribution of the survey. A two-page survey was developed and reviewed by the District and members of our Technical Advisory Committee. A draft version was tested on a number of local elementary teachers for ease of use and clarity.
The final survey, with a explanatory cover letter from the District office, was distributed to a stratified sub-sample of teachers from our original data set. We identified 14 schools with a balanced sample of all window and skylight conditions found in the original 27 elementary schools included in the 97-98 database. Our goal was to achieve a sufficient population of teachers in each daylighting condition, in order to have the best chance to achieve statistical certainty in our new analysis. We provided the District a list of all teacher names used in mapping the data for those 14 schools. The District then located these teachers for us. Over the two year period, between the survey and the original data mapping, about 17% of the teachers had left the district or moved to non-teaching jobs and about 6% had re-located to a different school in the district. As a result, our sub-sample of teachers now resided at every elementary school in the district.
Surveys were mailed to each school office, with a list of teachers to whom they were to be distributed. After two days, the responses were collected in a confidential master envelope and returned to us for analysis. Ultimately, we received completed surveys from 68% of the teachers on our distribution list, or 206 teachers, representing 3900 students in our data set. Some school offices disregarded our list and distributed the survey to all of their teachers, so we received responses from an additional 44 teachers who were not in our original study, for a total of 250 responses.
HESCHONG MAHONE GROUP February 14, 20028
DAYLIGHTING IN SCHOOLS, RE-ANALYSIS REPORT TEACHER SURVEY
0%
10%
20%
30%
40%
50%
0 1 2 3 3.5 4 4.5 5
Daylight Code
Per
cent
age
of S
tude
nts
Original Surveyed
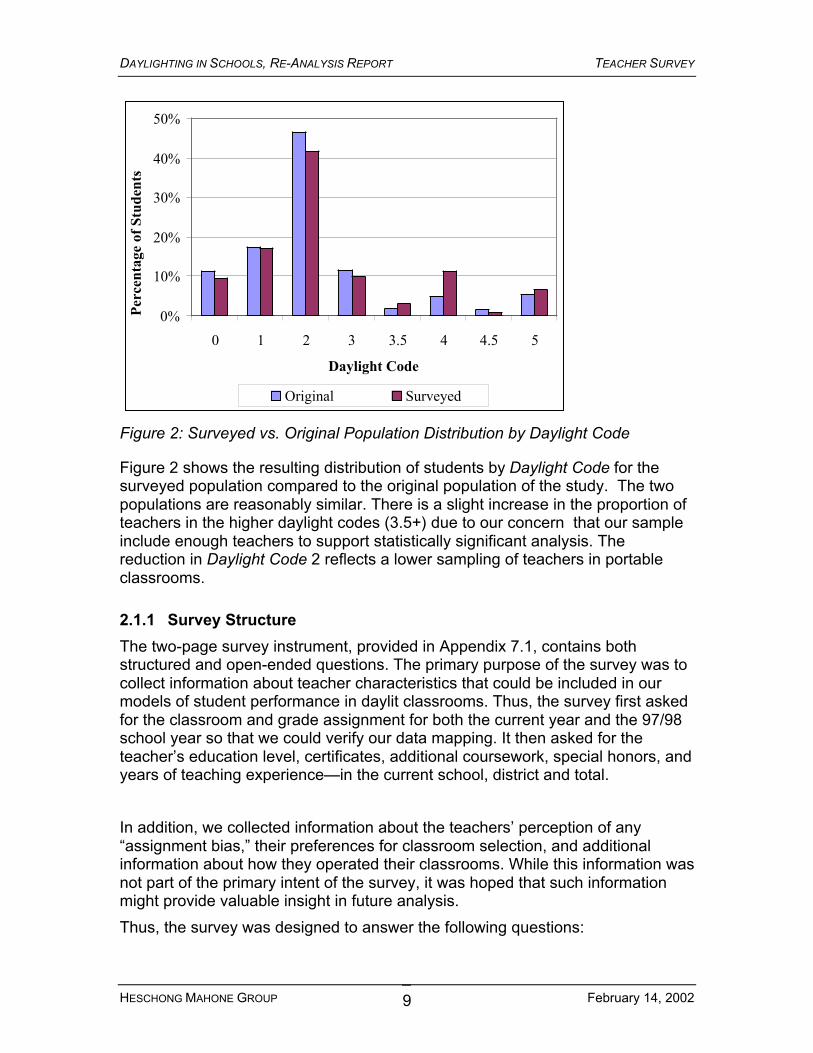
Figure 2: Surveyed vs. Original Population Distribution by Daylight Code
Figure 2 shows the resulting distribution of students by Daylight Code for the surveyed population compared to the original population of the study. The two populations are reasonably similar. There is a slight increase in the proportion of teachers in the higher daylight codes (3.5+) due to our concern that our sample include enough teachers to support statistically significant analysis. The reduction in Daylight Code 2 reflects a lower sampling of teachers in portable classrooms.
2.1.1 Survey Structure
The two-page survey instrument, provided in Appendix 7.1, contains both structured and open-ended questions. The primary purpose of the survey was to collect information about teacher characteristics that could be included in our models of student performance in daylit classrooms. Thus, the survey first asked for the classroom and grade assignment for both the current year and the 97/98 school year so that we could verify our data mapping. It then asked for the teacher’s education level, certificates, additional coursework, special honors, and years of teaching experience—in the current school, district and total.
In addition, we collected information about the teachers’ perception of any “assignment bias,” their preferences for classroom selection, and additional information about how they operated their classrooms. While this information was not part of the primary intent of the survey, it was hoped that such information might provide valuable insight in future analysis.
Thus, the survey was designed to answer the following questions:
HESCHONG MAHONE GROUP February 14, 20029

DAYLIGHTING IN SCHOOLS, RE-ANALYSIS REPORT TEACHER SURVEY
1. What are the educational qualifications and experience of the teachers who taught in classrooms included in the 97-98 data set?
2. Did they believe that they have been allowed to choose their own classroom or have any influence on where they are assigned?
3. If they could choose a classroom, what attributes of a classroom would they give top priority in their selection?
4. How do these teachers operate the energy-using features of their classrooms? For example, if they have operable windows, how often do they open them?
2.2 Teacher Characteristics
The survey responses were categorized, cleaned and entered into a database. Information from open-ended questions was coded for analysis. The teacher characteristic information was eventually transformed into variables for inclusion in the statistical models of later tasks in this study.
The Capistrano Unified School District tries to maintain uniformly high education and training standards among its teachers, which tends to reduce the variation in teacher quality across classrooms. In discussions with Capistrano administrators prior to the survey, we were told that the District was not hiring teachers with provisional or emergency credentials. Beyond requiring all of their teachers to be certified, the district highly values continuing education for all teachers. A sliding salary scale rewards additional college education, in addition to years of experience. The District also provides opportunities for on-site training classes that are specifically tailored to the curriculum needs of the district.
2.2.1 Years of Experience
The 250 teachers who responded to the survey varied in their teaching experience from one or two years to more than 40 years. They averaged 11 years of teaching in the CSUD district and 13.5 years of teaching in total (see Figure 3).
HESCHONG MAHONE GROUP February 14, 200210

DAYLIGHTING IN SCHOOLS, RE-ANALYSIS REPORT TEACHER SURVEY
Teachers Experience
0
5
10
15
20
25
30
35
40
45N
o. o
f Y
ears
Tea
chin
g
Years teaching in district
Years teaching total
Figure 3: Number of Years Teaching for Survey Respondents
2.2.2 Education Level, Certificates and Honors
Teachers were asked to report their highest educational degree, plus additional college course work, training programs, and special certificates and honors. This information was described qualitatively by the teacher respondents, thus we needed to classify the responses into meaningful categories that could be used to analyze the data. The first step was to understand the educational requirements for elementary school certification in California, and similarly the District’s standards for hiring and promotion.
There are two levels of accreditation in California elementary schools. A Preliminary Credential is good for the first five years of teaching. It requires as a minimum completion of a bachelor's degree and a teacher preparation program, knowledge of the US Constitution, plus additional certification in teaching reading, passing a standardized test of knowledge (CBEST) and the multiple subject assessment for teachers (MSAT). The second level of accreditation is called the Professional Clear. It requires an additional fifth year of study beyond the bachelor's including course work in computer, health and special education.
Based on interviews with the District personnel officers and review with our Technical Advisory Group, we decided to group the teachers’ education levels for analysis into two simple categories, BA and MA, with three sub-categories, as follows:
HESCHONG MAHONE GROUP February 14, 200211

DAYLIGHTING IN SCHOOLS, RE-ANALYSIS REPORT TEACHER SURVEY
• "BA" indicated any teacher with a bachelors degree
• "Clear only" indicated teachers who had been teaching for 7 years or more, but had not pursued any continuing education beyond that necessary for their professional clear credential.
• "BA Plus" indicated teachers who listed college credits beyond the minimum required for certification
• "MA" indicated those with a masters, or doctorate (one case)
• "MA Plus" identified teachers with college credits beyond a master's degree.
In our sample of surveyed teachers (Figure 4), 58% had Bachelor degree, of which 12% had only a BA and had taught for 6 years or less, 12% were grouped in the Clear Only category, 34% were grouped in the Bachelor Plus category; 42% of the teachers reported having a Masters degree, of which 29% had just an MA, and 13% were grouped in the Masters Plus category,
Teacher Education
MA Plus 13%
MA 29%
BA Plus 34%
Clear Only 12%
BA 12%
Figure 4: Teacher Education Level
In addition to their qualifications, teachers also reported other credentials that identified if they have received any special certificates or honors. From this information we defined two other analysis categories:
w The Certificates category included teachers, who reported special certificates beyond those required for the CLEAR credential, such as a certificate in bilingual or gifted and talented education.
w The Honors category grouped together all teachers who reported special awards or honors, such as being named a mentor teacher or Teacher of the Year.
Figure 5 shows the proportion of surveyed teachers who were classified into these two categories.
HESCHONG MAHONE GROUP February 14, 200212

DAYLIGHTING IN SCHOOLS, RE-ANALYSIS REPORT TEACHER SURVEY
Teachers with Certificates
77%
Cetificates 23%
Teacher Recognition
60%
Recognition 40%
Figure 5: Teacher Certificates and Honors (Recognition)
2.2.3 Classroom Preferences
We pursued a number of different methodologies to understand if there was an intentional or unintentional bias in assigning some teachers to more daylit classrooms. In our original study we had interviewed administrators and principals in the district, who assured us that there was no obvious mechanism or practice of assigning "better" teachers to more daylit classrooms. Given the rapid growth of the district, frequent reassignment of classrooms to accommodate new school openings and added portable classrooms tended to randomize teacher classroom assignments on a fairly regular basis. In addition, it was reported that each school site follows its own administrative criteria in assigning teachers to classrooms, using criteria such as clustering of grade levels or special interest teaching teams.
From the Teacher Survey we found a slightly different story. Of the teachers surveyed, 32% felt that they may have had some influence on the selection of their classrooms within the past year (a yes answer to Question 14) and 41% answered yes or maybe. Similar percentages reported that they may have had past influence. Thus, the teachers seemed to feel that they could influence classroom selection.
When asked to indicate their top criteria for selection of a classroom, if they were to have a choice (Question 15), 8% of the sample ranked windows or natural light as their top criteria, and 27% mentioned windows, natural light or view within their top three choices. Lumped together, these three criteria would have placed fourth in importance as a classroom selection criteria, after classroom size (53%), convenient location (36%), and storage capacity (30%). (See Figure 6 and discussion in Section 2.2.4 below.) Thus, while windows and associated qualities light natural light and view are important to teachers, they are not the most important criteria that teachers claim drive their choices.
In addition to the structured questions, teachers were given the opportunity to write any comments they wished. Over two hundred, or 80%, took the opportunity to write informative comments, while three complained about not
HESCHONG MAHONE GROUP February 14, 200213

DAYLIGHTING IN SCHOOLS, RE-ANALYSIS REPORT TEACHER SURVEY
enough time to respond. (See Appendix 7.1.3 to read the un-edited comments) Their comments read as a loud plea for better physical conditions in the classroom. The reader should realize that many of the comments are referring to class-size reduction measures that were instituted in the District to increase the number of teaching spaces, but unfortunately have compromised physical comfort and control. The passion for control of physical conditions--lighting, acoustics, ventilation and thermal comfort--is also very evident in these comments. The list of comments should make compelling reading for anyone managing or designing school facilities.
2.2.4 Criteria for Classroom Selection
The survey, in an open-ended question, asked what were the three most important criteria that the teacher would use to select a classroom, if they were given the choice. We grouped the qualitative responses into the following categories, reported in the order of their frequency of mention within the top three criteria:
• Size indicated teachers’ preference for larger classrooms and was most frequently listed in the top three criteria, mentioned by 53% by respondents. It was also the most frequently listed as the top preference.
• Location of the classroom within the school layout was the second most common criteria in determining their classroom choice (36%), and was also second as the top criteria. The location preferences included close proximity to the school entrance, administrative offices, playground, library, or other elements of the school plan.
• Storage space inside the classroom in the form of closets or cupboards was the third most mentioned criteria.
• Water or the availability of a sink in the room was among the top four most mentioned criteria. Comments typically emphasized the primary importance of water in the classroom for student hygiene, and secondarily for class projects.
• Quiet captured criteria such as “lack of noise” and “being in a quiet zone.” It was the fifth most common criteria (23%) mentioned in any of the top three preferred classroom attributes by teachers, and third criteria in terms of teachers’ top preference (after classroom size and location).
• Windows were mentioned by 20% of the respondents.
• HVAC indicated a preference for air conditioning in the classroom, or control of temperature, or acceptable thermal comfort conditions.
• Door indicated a preference for full enclosure or the availability of a door to close off the classroom from other activity areas.
• Proximity indicated a preference for a classroom close to particular colleagues, either by grade level or shared teaching responsibilities.
HESCHONG MAHONE GROUP February 14, 200214

DAYLIGHTING IN SCHOOLS, RE-ANALYSIS REPORT TEACHER SURVEY
• Condition indicated a preference for better physical conditions, such as new paint, furniture or carpet, or good maintenance.
• Ventilation indicated a preference for fresh air or good air circulation.
• Lighting indicated preference for a good lighting quality in the classroom or control of the lighting levels.
• Natural light indicated a preference for natural light from windows or skylights.
• Walls indicated a preference for lots of wall surfaces for display.
• Bathroom indicated a preference for a bathroom close by.
• Views indicated a preference of a good view from the classroom.
• Whiteboards indicated a preference for lot of whiteboard surfaces.
• Phone indicated a preference for a telephone available in the classroom.
• Workroom indicated a preference for being adjacent to a teacher workroom.
Classroom Selection Criterea
0%
10%
20%
30%
40%
50%
60%
size
loca
tion
stor
age
wat
er
quie
t
win
dow
s
HV
AC
door
prox
imity
cond
ition
vent
ilatio
n
light
ing
natu
ral l
ight
wal
ls
bath
room
view
s
whi
tebo
ards
phon
e
wor
kroo
m
Per
cen
tag
e o
f R
esp
on
ses
Top 3 choices 1st preference
Figure 6: Most Preferred Attributes of Classrooms
It should be noted that the teachers' preferences for classroom features is largely a function of what options are, or are not, currently available to them. For example, a teacher in a school without windows but the option of moving to a portable with a window may rank windows very high, while a teacher in a
HESCHONG MAHONE GROUP February 14, 200215

DAYLIGHTING IN SCHOOLS, RE-ANALYSIS REPORT TEACHER SURVEY
classroom with large windows but no sink, may rank access to water highest. Thus, we interpret these results to be particular to the context of the Capistrano Unified School District and the status of current facilities.
2.2.5 Permanent vs. Portable Classroom Preference
The use of portable classrooms in California was mandated by the state for a number of years as a strategy to accommodate rapidly shifting population growth. As a consequence, every school site in our Capistrano study had a substantial number of portables. Portable classrooms have also come under recent scrutiny for possible poor indoor air quality or other health concerns such as mold growth. A number of state and national studies are currently trying to assess the health implications of portable classrooms. Our 1999 study did not find any negative student performance impacts associated with portables. Indeed, our models tended to find positive, but not statistically significant impacts, associated with being in a portable classroom, once we controlled for daylight, ventilation and all other variables in our equation. To learn more about teacher’s perceptions of portables we included a question about preference of portable or permanent classrooms in the survey (Question 16). The answers and associated comments are fully presented in Appendix 7.1.2.
Permanent vs. Portable Preference
portable 15%
no answer 2%
permanent 68%
no opinion 15%
Figure 7: Permanent vs. Portable Classroom Preference
Sixty eight percent of the teachers surveyed preferred to teach in a permanent classroom rather than a portable one. (Figure 7). Thirty percent of the respondents were divided equally between those who preferred portable classrooms or reported no preference for either type.
48% of the teachers that preferred portables mentioned that the closed walls of the portable solved the noise and distraction problems found in the permanent classrooms of their school created by an open classroom plan or poor acoustics. 24% preferred portables because they were larger than the permanent
HESCHONG MAHONE GROUP February 14, 200216

DAYLIGHTING IN SCHOOLS, RE-ANALYSIS REPORT TEACHER SURVEY
classrooms available at their school. Remaining comments mentioned the presence of air conditioning, better bulletin boards, and better physical condition.
Teachers who preferred permanent classrooms had a much wider range of reasons why. Larger size, better location, better amenities, less noise were frequently mentioned. One teacher summed up a preference for permanent classrooms in the comment: “Feels substantial and lets children know they are important and that things are not temporary.” 22% of teachers preferring permanent classrooms specifically mentioned indoor air quality concerns, such as moldy or musty smells and increased incidence of allergies or colds in portables.
2.2.6 Classroom Energy Management
In the survey, teachers were asked how they operated a number of energy using features in their classrooms. The data that we have for the Capistrano classrooms merely indicates the presence of a feature, such as operable windows, not whether or how it is used. This set of questions was intended to provide insight into how their might actually use these features, and provide some baseline data, admittedly self-reported, that might allow us to estimate the energy impacts of various features.
Figure 8 highlights the percentages of teachers’ responses for the ten energy statements surveyed. Positive percentages indicate actions taken, while negative percentages indicate inability to act, or no action.
Classroom Energy Management
25%
46% 54% 55%
6%
24%
5% 9% 12% 2%
-60%
-41%
-22% -10%
-42%
-11%-11%-9%-5%-9%
-60%
-40%
-20%
0%
20%
40%
60%
80%
100%
adju
st t
her
mo
stat
op
en d
oo
r (v
enti
lati
on
)
dar
ken
ro
om
(vi
deo
)
clo
se w
/d f
or
no
ise
som
e lig
hts
off
op
en w
ind
ow
(ve
nti
lati
on
)
all l
igh
ts o
ff
blo
ck s
un
fan
on
dra
w c
urt
ain
s
% o
f re
spo
nse
s
>10x/year >10x/week Never Do Can't Do
Figure 8: Teachers' Energy Management of Classrooms
HESCHONG MAHONE GROUP February 14, 200217

DAYLIGHTING IN SCHOOLS, RE-ANALYSIS REPORT TEACHER SURVEY
HVAC control: Over 50% of the teachers’ surveyed reported adjusting the classroom thermostat on a weekly basis, and almost 90% of them reported doing this more than 10 times/school year (about monthly).
Acoustic control: Over 80% of the teachers occasionally close the windows or doors (“close w/d for noise”) to avoid high noise levels from the outside, and 55% do this frequently.
Ventilation control: 46% open the outside door for ventilation purposes on a weekly basis and 84% do this at least 10 times every year. 25% of the teachers surveyed reported doing this on a daily basis. More than 40% of the teachers surveyed reported they can’t open a window for natural ventilation, while 42% of the total sample open a window at least 10-times/school year. 12% of the teachers report using a portable fan, which probably means they brought in their own personal fan that they purchased themselves to solve a perceived ventilation problem in their classroom.
In the comments section, one teacher summarized the teaching challenges faced with in small, poorly ventilated portable: “The students do not have enough space to move around. Most large projects are eliminated because of lack of space and no access to water. The room is so small that we use the ramp outside to set up centers. The door is always open because the poor circulation in the room gets us sick. We have no water to wash our hands after sneezing and coughing…we get sick more often and pass colds, flu to each other because of our close proximity.”
Lighting control: Darkening the room for TV or video is also very common, done by over 80% occasionally and 25% frequently. Turning some or all lights off is also a fairly common activity, while taking measures to block the sun, or close curtains is much less frequent.
Figure 9 shows further detail on teachers' management of the electric lighting in their classrooms. This graph shows 54% of the teachers turning some of the lights off, and 37% of the teachers turning all of the lights off, at various frequencies during the school year.
Teacher's Operation of Classroom Lights
0%
5%
10%
15%
20%
25%
30%
35%
40%
45%
50%
not p
ossib
le
neve
r do
occa
ssion
ally,
<10x
/yr
ofte
n, 1
0+/ye
ar
ofte
n, 1
0+/ye
ar, p
er w
eath
er
very
freq
uent
ly, 1
+x/w
k
cons
tant
ly, 1
+x/d
ay
all lights off
some lights off
Figure 9: Teachers' Lighting Management of Classrooms
HESCHONG MAHONE GROUP February 14, 200218

DAYLIGHTING IN SCHOOLS, RE-ANALYSIS REPORT TEACHER SURVEY
2.3 Conclusions
The results of the teacher survey on preferences and operation of classrooms suggest that daylighting and operable windows are indeed important to teachers, but tend to be secondary to their most pressing concerns, such as adequate size, location, and water (hygiene) availability in classrooms. Acoustic, thermal and visual comfort and adequate ventilation are all frequently listed as top priorities.
The optional comments response to the survey was overwhelming. 98% of the teachers surveyed took the time to write about what was good and bad in their classrooms. The passion put into the comments on physical comfort in classrooms makes it clear that teachers are very stressed by any type of poor physical condition in classrooms where they must work every day with 20-30 very active children. “Please help California get more square footage per child. It’s crazy!” pleaded one. “Teaching … without running water makes me feel like it’s the 1900’s. We carry pails of water!” exclaimed another. One teacher concluded about the need for cross ventilation: “I believe it is good for myself and students to breathe in some fresh air. It helps us all think.” While some teachers report being pleased and comfortable with their classrooms, a sizable group feel they have overwhelming physical challenges in their classrooms that routinely interfere with their ability to teach.
There are clearly some important energy use challenges revealed in the survey that should be carefully considered by school designers and facility managers. In Figure 8 it is clear that Capistrano teachers are actively trying to increase the ventilation of their classrooms by opening doors, opening windows, and adding portable fans. Furthermore, 54% claim to be adjusting the thermostat at least once a week and 55% also claim to be closing windows or doors at least once a week specifically to control noise in the classroom, implying that they had previously opened them, most likely for ventilation. This suggests that teachers’ driving desires for good ventilation, thermal comfort and acoustic comfort tend to be in conflict with the options allowed by their physical environment. Increasing ventilation is likely to also increase ambient noise in the classroom and/or reduce thermal comfort. One teacher summarized this problem with the comment: “I like being able to adjust the a/c, heat and ventilation. The down side of this is the a/c unit makes a lot of noise and makes hearing students and teacher more difficult, so you have to raise your voice, ask for repeats or be very stuffy and uncomfortable during oral readings and discussions.”
The Capistrano school district is in a relatively mild climate in Southern California, where ambient temperatures are often in the comfort zone, allowing natural ventilation without supplementary heating or cooling. However, even in Capistrano, it is highly probable that substantial energy is wasted running heating or cooling systems while classroom doors and windows are open. Simply improving the efficiency of the heating and cooling systems will not solve this problem. Rather, given teachers’ strong desire for more ventilation, classroom design should include systems that allow increased ventilation without increasing energy use for heating or cooling.
HESCHONG MAHONE GROUP February 14, 200219
DAYLIGHTING IN SCHOOLS, RE-ANALYSIS REPORT TEACHER SURVEY
Lighting energy use is also an important issue for schools, constituting a large percentage of overall energy use. The provision of daylighting in classrooms only saves energy if electric lights are turned off when not needed, either manually or automatically. The results in Figure 9 suggest that a manual lighting control scheme has an likelihood of being operated by about half of the teachers in a school. This behavioral element should be factored into any proposed lighting control scheme. While automatic systems may be effective more often, their cost-effectiveness should be compared to manual systems that are occasionally operated by 50% of the teachers.
The information in the Capistrano teacher survey is not comprehensive enough to draw any universal conclusions about teacher preferences or behaviors. However, it is strongly suggestive that the physical environment is a key factor in teaching effectiveness, and that teacher preferences for classroom operation need to be given high priority in the design of comfort systems and classroom controls.
HESCHONG MAHONE GROUP February 14, 200220
DAYLIGHTING IN SCHOOLS, RE-ANALYSIS REPORT TEACHER BIAS ANALYSIS
3. TEACHER BIAS ANALYSIS
Once the information in the teacher survey was categorized and compiled into a database, we were able to analyze the data for a potential bias in teacher assignment to more daylit classrooms. This task was pursued with a variety of analytic approaches.
3.1 Hypothesis
For this task we set out to test the hypothesis that the higher rates of learning in daylit classrooms might be attributable to "better" teachers being located in more daylit classrooms. For this discussion "better" teachers would be defined as those who are responsible for faster learning rates in their students, as reflected in the rate of progress measured by standardized math and reading tests. Daylit classrooms would be defined by the Daylight Code assigned to each classroom in the original study.
3.2 Methodology
In order to study this question we needed to 1.) find a way to identify potentially "better" teachers 2.) determine if the "better" teachers were being differentially assigned to more daylit classrooms and 3.) determine to what extent the magnitude or significance of the daylighting effect would change if information that could predict teacher quality could be included in the model.
Our first step was to define the specific teacher variables to be included in the models, based on the data we had collected in the early Teacher Survey task. In order to do this, we needed to understand the basic structure of educational requirements for a California Elementary School Teacher's credential, along with the hiring and promotional policies of the district. We collected this information from the Department of Education web site, the Capistrano District personnel office, and by interviewing various district administrators.
3.2.1 Teacher Credentials
In discussions with Capistrano administrators prior to the survey, we were told that the District was not hiring teachers with provisional or emergency credentials. Beyond requiring all of their teachers to be certified, the district highly values continuing education for all teachers. A sliding salary scale rewards additional college education. The District also provides opportunities for on-site training classes that are specifically tailored to the curriculum needs of the district.
In the teacher survey we asked teachers to report on their years of teaching in the current school, district, and total; their highest level of education; additional
HESCHONG MAHONE GROUP February 14, 200221

DAYLIGHTING IN SCHOOLS, RE-ANALYSIS REPORT TEACHER BIAS ANALYSIS
course work or certifications; and special awards or recognition. This information was all self-reported and described in the teacher's own words. We subsequently categorized this information into the eight variable codes described below.
Teaching Experience: We defined the variable of Log Yrs Teach as the natural log of the total number of years teaching. By using a natural log we attempted to account for the diminishing effect of additional years of experience reported in the research literature.
Level of Education:
BA indicated any teacher with a bachelors degree. Reported as Teacher 1.
Clear only indicated teachers who had been teaching for 7 years or more, but had not pursued any continuing education beyond that necessary for their professional clear credential. Reported as Teacher 5.
BA Plus indicated teachers who listed college credits beyond the minimum required for certification. Reported as Teacher 2.
MA indicated those with a masters, or doctorate (one case). Reported as Teacher 3.
MA Plus identified teachers with college credits beyond a master's degree. Reported as Teacher 4.
Certification: This variable was used to identify teachers who had received any special certificates or credentials, beyond the minimum required for a California elementary multi-subject credential. Special certificates for Bilingual Education, Gifted and Talented Education, Special Education, etc. were grouped together under one variable. Reported as Teacher 6.
Honors: Many teachers reported receiving special awards, such as Teacher of the Year, or being selected to be mentor teachers. Because responses varied, and because we had little way of measuring how prestigious the awards were, any teacher that reported receiving an award or being chosen to be a mentor teacher was indicated by the AwarMent variable. Reported as Teacher 7.
The teacher characteristics variables were added back into the master data set. The surveyed population of teachers represented about 1/2 of the original data set. Thus, for about 1/2 of the student records we added the information characterizing their teacher’s years of experience, education level, special certificates or honors. The remainder of the student records were given an indicator variable for no teacher information.
3.2.2 Assignment Bias
Once we had defined the teacher characteristic variables, we looked to see if there were any significant correlations between these teacher characteristics and the daylight conditions in the classrooms in our Capistrano data set. This was our
HESCHONG MAHONE GROUP February 14, 200222

DAYLIGHTING IN SCHOOLS, RE-ANALYSIS REPORT TEACHER BIAS ANALYSIS
first statistical test for a teacher assignment bias. If we found a strong pattern of correlation between a few teacher variables and a few daylight codes, then it was likely that some types of teachers were being differentially assigned to more daylit classrooms. In this first pass at the analysis we included all of the window related variables, including the daylight code, window code, skylight codes, and operable windows.
The analysis was based on the data collected in the teacher survey, described in the preceding section. We used the data from surveys of 206 teachers. These teachers taught 3,948 of the students included in the original study. To be consistent with the original study, the first pass statistical analysis was carried out at the student level. In other words, each student was been taken to be an observation. Since the number of students per teacher in our data set varied somewhat independently of the number of total students in a classroom, this approach has the effect of weighting the results according to the study population database. Because of the large number of student observations, it also tends to exaggerate the significance of the correlations.
Looking the student level, we found a statistically significant (2-tailed, p<.10), correlation among almost all of the variables (see Figure 10). We found no obvious pattern of any variables less likely to have correlations than others. Furthermore, the magnitude of correlation was minor throughout. The strongest correlation, at p=.01, was between Teacher 7 and Skylight Type B (a Pearson Correlation of .227), implying that 5% (.2272) of classroom assignments might be explained by this correlation. Nine other combinations had a Pearson Correlation between 0.1 and 0.2 and all others (61%) were below 0.11, indicating a very weak magnitude of correlation.
Variable Daylight Window AA Skylight A Skylight B Skylight C Skylight D Skylight Oper. Win.
Teacher 1 Pearson Correlation 0.089 0.068 -0.062 0.111 0.026 -0.001 0.015 -0.106 Sig. (2-tailed) 0.000 0.000 0.000 0.000 0.012 0.905 0.144 0.000
Teacher 2 Pearson Correlation 0.044 0.020 -0.076 0.048 0.085 -0.041 0.064 0.019 Sig. (2-tailed) 0.000 0.050 0.000 0.000 0.000 0.000 0.000 0.067
Teacher 3 Pearson Correlation 0.069 0.112 -0.001 -0.021 0.028 -0.018 0.020 0.004 Sig. (2-tailed) 0.000 0.000 0.914 0.039 0.007 0.082 0.058 0.718
Teacher 4 Pearson Correlation 0.083 0.080 0.109 0.013 0.077 -0.021 -0.025 0.018 Sig. (2-tailed) 0.000 0.000 0.000 0.218 0.000 0.048 0.015 0.081
Teacher 6 Pearson Correlation 0.066 0.051 -0.026 0.087 0.047 -0.039 -0.035 -0.034 Sig. (2-tailed) 0.000 0.000 0.011 0.000 0.000 0.000 0.001 0.001
Teacher 7 Pearson Correlation 0.150 0.147 0.056 -0.096 0.227 -0.067 -0.012 -0.030 Sig. (2-tailed) 0.000 0.000 0.000 0.000 0.000 0.000 0.246 0.003
Log yrs teach Pearson Correlation 0.138 0.171 -0.005 -0.007 0.097 -0.071 0.022 0.015 Sig. (2-tailed) 0.000 0.000 0.659 0.499 0.000 0.000 0.033 0.143
N= 3948 students
Figure 10- Correlation of Teacher Variables to Daylight Variables, Student level Analysis, Capistrano
1 The Teacher 5 variable had not been defined at this time, so was left out of this correlation table.
HESCHONG MAHONE GROUP February 14, 200223

DAYLIGHTING IN SCHOOLS, RE-ANALYSIS REPORT TEACHER BIAS ANALYSIS
In a second pass, we also re-calculated the correlations using the 206 teachers as independent observations. Using the smaller teacher population, un-weighted for student population in our data base, presented a more extreme test for significance. Out of the 56 correlations that are reported in Figure 9, ten were judged to be potentially significant with p-values of .10 or less at the teacher level. None of the correlations with the Daylight Code were significant. Skylight Type AA did show a pattern of correlations, but with only 5 surveyed teachers in this group, we discounted this as a random result. The most interesting finding was a slight indication that more senior teachers (Log yrs teach) had some influence being assigned to classrooms with larger window areas, operable windows, or skylight types A, and that Teacher 7 (honors) were more likely to be assigned to skylit classrooms type A or B. The magnitude of a possible effect is minimal, with only 1% to 5% of the variation in assignment to these classroom types potentially explained by either of these variables.
We concluded from this exercise that there was indeed some potential for an assignment bias relative to honors or years of experience, but that a two-dimensional correlation analysis was not a sufficient tool to determine its magnitude or influence on the results of the multi-variate regression models.
3.2.3 Decision to Focus on Daylight Code Only
For simplicity sake, we choose to work henceforth with just the Daylight Code. Tracking the change in performance for one variable, instead of eight, reduced the complexity of the task dramatically. We choose to focus on the Daylight Code since it was the holistic code that combined the effects of the window and skylight codes together. It had been very robust in the previous analysis, and described the classroom characteristic of greatest interest.
By focusing our attention on just the change in the Daylight Code across models, we were more likely to see patterns across models.
3.2.4 Daylight Code as a Dependant Variable
Next we ran a regression model with the Daylight Code as the dependant, or outcome, variable and the teacher characteristic variables as the independent, or explanatory variables. This model was run using only the surveyed teacher population. This model would tell us more precisely if there was indeed an "assignment bias," such that some teacher types were more likely to be assigned to daylit classrooms. It was a more precise test than the correlation tables, since it allowed the influence of each teacher characteristic variable to be assessed simultaneously.
From this regression model, we found that there were NO teacher characteristics, as defined by our variables from the survey data, that were significant in explaining assignment to more daylit classrooms. The variable that achieved the highest probability of influence was Teacher 7 (honors) at only 78% likelihood of significance (p=.22) that there might be a 5% higher assignment in
HESCHONG MAHONE GROUP February 14, 200224

DAYLIGHTING IN SCHOOLS, RE-ANALYSIS REPORT TEACHER BIAS ANALYSIS
Daylight Code (A teacher who had received an honor or award had a 78% probability of being assigned to a classroom rated 3.15 on the daylight scale instead of a 3.0). The other variables had a 50% probability or less.
The R2 for this model was only 0.014, indicating that all of the teacher characteristic variables could explain only 1% of the variation in assignment to daylight classrooms. When we ran a similar model at the student level, the level of explanation increased to 2%. Thus, from this exercise we conclude that the Capistrano Unified School District did not have any marked bias in the assignment of teachers to more daylit classrooms, based on the teacher characteristics that we studied.
3.2.5 Teacher Assignment Bias Models
Our final step in the Teacher Bias Analysis was to re-run the original Capistrano student performance models with the teacher characteristic variables added to the list of potential explanatory variables. Again, we choose to focus our reporting on the results of the Daylight Code for simplicity, although we did also run the separate models with the window and skylight variables. The original models were re-run for both change in reading and math scores at the student level. Teacher characteristic variables were added for 42% of the population.
It should be noted that the performance of the observed students within a given classroom may not be mutually independent. In the original research, we carried out a special analysis to assess the effect of correlation between students within a given classroom (See Appendix 6.2 to original report, dated 6/29/1998). This analysis indicated that the statistical significance of some of our results was somewhat overstated but the effects of interest were not substantially altered. However, carrying out the analysis at the student level made it easier to explore the relationship between characteristics of the student, teacher, room, and school.
3.3 Findings
Figure 12 and Figure 11 display the findings of these two models, compared to the original models without the teacher variables. The school site variables and outliers have been left off of the equations shown here for simplicity, but are included in the full model detail in the Appendix 7.2. A central column shows the change in the B coefficient for each variable and the model R2.
HESCHONG MAHONE GROUP February 14, 200225

DAYLIGHTING IN SCHOOLS, RE-ANALYSIS REPORT TEACHER BIAS ANALYSIS
New Model Capistrano, Teacher Analysis -28-2 (Original population) Model R^2 0.259
B
Math Daylight
Std. Error p (Signif)
Change new-old
R^2 0.003
B
Old Model Capistrano, Original Analysis C17-md Model R^2
Math Daylight
0.256 B Std. Error p (Signif)
(Constant) 9.045 Classroom characteristics
0.464 0.000 (Constant) Classroom characteristics
8.026 0.407 0.000
Daylight code 0.430 Teacher characteristics
Teacher 3 -0.933 Teacher 5 -0.688 Log yrs teaching 0.373
Student characteristics
0.072 0.000
0.248 0.000 0.335 0.040 0.077 0.000
-0.075 Daylight code
Student characteristics
0.504 0.067 0.000
Grade 2 9.624 0.216 0.000 -0.088 Grade 2 9.711 0.215 0.000 Grade 3 5.949 0.220 0.000 0.018 Grade 3 5.931 0.219 0.000 Grade 4 1.802 0.216 0.000 -0.011 Grade 4 1.813 0.216 0.000 Absences unverified -0.263 0.123 0.033 0.000 Absences unverified -0.263 0.123 0.032 Absences unexecused -0.029 0.014 0.043 -0.003 Absences unexecused -0.026 0.014 0.069 GATE program -1.191 0.222 0.000 0.045 GATE program -1.236 0.223 0.000 Language program 0.488
School characteristics 0.205 0.017 -0.001 Language program
School characteristics 0.490 0.205 0.017
School Pop-per 500 -0.995 0.000 0.000 -0.483 School Pop-per 500 -0.512 0.000 0.010
Figure 11 - Change in Capistrano Math Model with Addition of Teacher Variables
New Model Capistrano, Teacher Bias Analysis - Reading Daylight 28-2 (Original population) Model R^2 0.248
B Std. Error p (Signif)
Change new-old
R^2 0.002
B
Old Model Capistrano, Original Analysis Reading Daylight C17-rd Model R^2 0.246
B Std. Error p (Signif) (Constant) 3.009 0.303 0.000
Classroom characteristics (Constant) 3.025 0.298 0.000
Classroom characteristics Daylight code 0.475 0.086 0.000 0.011 Daylight code 0.464 0.085 0.000 Operable windows 0.650 0.212 0.002
Teacher Characteristics Teacher 3 -0.917 0.288 0.001 Teacher 5 -1.335 0.388 0.001 Log yrs teaching 0.221 0.090 0.014
Student characteristics
0.007 Operable windows 0.643 0.212 0.002
Student characteristics Grade 2 10.823 0.251 0.000 -0.037 Grade 2 10.860 0.251 0.000 Grade 3 4.368 0.255 0.000 0.069 Grade 3 4.298 0.254 0.000 Grade 4 0.944 0.252 0.000 0.008 Grade 4 0.937 0.252 0.000 GATE program -1.432 0.257 0.000 0.020 GATE program -1.452 0.257 0.000 LANG program 0.827 0.239 0.001 -0.011 LANG program 0.838 0.239 0.000
Figure 12 - Change in Capistrano Reading Model with Addition of Teacher Variables
Even with the addition of the teacher characteristic variables into the original models, the daylight variable stayed highly significant in both cases. For the math model, with the outcome variable as the change in fall to spring math scores, the magnitude of the daylight effect decreased slightly.
For the reading model, the magnitude of the daylight effect actually increased. In the case of the reading model, operable windows also remained a significant variable, and also increased slightly in magnitude.
Three of the eight teacher characteristic variables were found to be significant in both models. (While the significant teacher variables here were consistent, they
HESCHONG MAHONE GROUP February 14, 200226

DAYLIGHTING IN SCHOOLS, RE-ANALYSIS REPORT TEACHER BIAS ANALYSIS
were not consistent in the models using window codes and skylight types as explanatory variables, nor were they consistent in later models that we ran, discussed later.)
With the addition of information about the teachers, the R2 of the models increased, but only by a tiny amount, increasing their power of explanation by less than 1%.
3.4 Conclusion
Thus, we conclude that the strength of the daylight variable showed in the original analysis was not an inadvertent effect of a “teacher assignment bias.” We have shown in the regression model of the Daylight Code versus the teacher characteristic variables, that the teacher characteristics captured in our survey only explained 1% of the variation of teacher assignment to daylit classrooms. Furthermore, in the master student performance regression models adding information about teacher characteristics for 42% of the population did not reduce the significance of the daylight variables. As might be expected, the magnitude shifted slightly; in one case down, in one case up.
3.5 Discussion
One potential weakness in the findings above is that we only had teacher characteristic information for less than half of the study population. We decided it would be a good test to re-run the models for just the population of students represented by teachers who responded to the Teacher Survey. That way, we could look at a model where 100% of the population had information about the teachers. This “surveyed population” model included 206 teachers and 3948 students, or about 50% of the original population.
We were aware that if we shifted the sample population for a model, we ran the risk of getting different results. But we wanted to examine the stability of the daylighting coefficient in our models over different sample populations. We also wanted to explore the stability of including the information about the teachers. Thus, we decided to run similar models to the original Capistrano math-daylight and reading-daylight models, looking at the change in the daylight variable from one sample to another and with the addition of the teacher characteristic variables.
We also had one other complexity to account for. In coding the data from the Teacher Survey it was discovered that three schools had been inadvertently dropped from the original study population. Criteria for inclusion of a student’s record in the original analysis had included complete records for test scores, attendance and demographic data. We did not observe at the time that we had not been provided with attendance data for three entire schools. Thus, the data cleaning procedures resulted in inadvertently dropping all students (and all teachers) from those three schools from the analysis. We were particularly
HESCHONG MAHONE GROUP February 14, 200227

DAYLIGHTING IN SCHOOLS, RE-ANALYSIS REPORT TEACHER BIAS ANALYSIS
concerned since two of the dropped schools represented somewhat extreme daylight conditions, one with many classrooms of Daylight Code 0, and the other with many Classrooms of Daylight Code 4. Thus, we worried that the exclusion of these schools from the original analysis may have skewed our results.
We noted that any effect due the missing attendance data could be absorbed to some degree by the dummy variable that identified the school site that was missing the attendance information. Thus, we decided to create a new “expanded” population that included these three schools and provided a “missing” indicator in the attendance record fields. This “expanded population” model included 394 teachers and 9200 students, 13% larger than the original study population.
Expanded Population (9302)
Surveyed Population (3949)
Original 1999 Population (8100)
(number of students in population)
Figure 13: Surveyed, Original, and Expanded Populations
We were interested to see if the daylight variable would remain significant in models of student performance in these different populations, with and without the addition of the teacher characteristic variables. The teacher survey population would present the clearest test of the impact of the teacher characteristics, since for this population we would have information about teacher characteristics for 100% of the teachers. The expanded population was likely to have the truest daylight results, since it represented the full 2-5 grade district population in 1997/98 school year. For this population we had information on 50% of the teachers.
3.5.1 Findings of Different Study Population Models
Figure 14 and Figure 15 compare the results for the three sets of regression models; the original model, the expanded model, and the teacher surveyed model, for the reading and math models. Full detail of all models is included in the Appendix. In addition to comparing the B coefficient for the Daylight Code, the significance of the Daylight Code and the R2 of the model, we also report here on the effective rate of change in the learning rate, and the confidence interval for that rate.
HESCHONG MAHONE GROUP February 14, 200228

±10% ±10% ±9% ±9% ±12% ±12%
±5% ±6% ±5% ±5% ±8% ±8%
DAYLIGHTING IN SCHOOLS, RE-ANALYSIS REPORT TEACHER BIAS ANALYSIS
Teacher Capistrano Variables B Coefficient % Change in
Key Reading Model,
Study Population Included in
Model for Daylight
Code p (Signif)
of B Model R2 Learning
Rate confidence
interval
A original no 0.464 0.000 0.247 26%
B original yes 0.475 0.000 0.248 27%
Shift from Model A to B 0.011 no change 0.001 1% no change
C expanded no 0.416 0.000 0.238 24%
D expanded yes 0.418 0.000 0.240 24%
Shift from Model C to D 0.002 no change 0.002 0% no change
E surveyed no 0.434 0.000 0.239 23%
F surveyed yes 0.463 0.000 0.243 25%
Shift from Model E to F 0.029 no change 0.004 2% no change
Figure 14: Daylight Affect for Different Populations, with and without Teacher Variables, on Reading Tests in Capistrano
Teacher Capistrano Math Variables B Coefficient % Change in
Key Model, Study
Population Included in
Model for Daylight
Code p (Signif) of
B Model R2 Learning
Rate confidence
interval
A original no 0.504 0.000 0.257 20%
B original yes 0.430 0.000 0.259 17% Shift from Model A to B -0.074 no change 0.002 -3% 1%
C expanded no 0.351 0.000 0.250 14%
D expanded yes 0.301 0.000 0.252 12% Shift from Model C to D -0.050 no change 0.002 -2% no change
E surveyed no 0.544 0.000 0.274 21%
F surveyed yes 0.497 0.000 0.277 19% Shift from Model E to F -0.047 no change 0.003 -2% no change
Figure 15: Daylight Affect for Different Populations, with and without Teacher Variables, on Math Tests in Capistrano
For the reading model, the most conservative estimate of a daylight effect would be +11% for the surveyed population without teacher variables (23%-12%), while the most optimistic would be +37% for both the original and surveyed population with teacher variables (27%+10% and 25%+12% respectively). For the math model, the most conservative estimate of a daylight effect would be +7% for the expanded population with teacher variables (12%-5%), while the most optimistic would be +29% for the surveyed population without teacher variables (27%+10%). Thus, from worst to best case we can say with a high degree of confidence, that children with the most daylighting in Capistrano are learning somewhere from 7% to 37% faster on the District's math and reading curriculum.
HESCHONG MAHONE GROUP February 14, 200229

±10% ±9% ±10% ±12%
DAYLIGHTING IN SCHOOLS, RE-ANALYSIS REPORT TEACHER BIAS ANALYSIS
With the addition of teacher characteristics to the three sets of models, the following changes were observed:
• Daylight variables were still significant across all models
• R2 value increased by 0% to +2% indicating that the models with teacher characteristics had a slightly better explanatory power for the studied phenomena.
• Math models indicated a decrease in the effect of daylight on student performance by 2% to 3%.
• Reading models indicated an increase in the effect of daylight on student performance by 0% to 2%.
• In general the availability of daylight in classrooms was reliably associated with an increase in student performance and learning rate of somewhere within the bounds of 7% to 37%. The central tendency among all these models would seem to be a 25% improvement in reading and a 16% improvement in math, or a 21% general improvement between children in classrooms with the most daylight (code 5) compared to those in classrooms with the least (code 0). In summary, if the average student in the district were moved from an average classroom (code 2.5) to a classroom with maximum daylight (code 5), he or she would be expected to increase his or her learning rate by 11% (10.5).
• All these results were observed with 99.9% statistical certainty.
In addition, we were interested to understand the change in daylighting effect among the three populations, the original, expanded, and surveyed, before the addition of the teacher variables. Figure 16 and Figure 17 compare the changes when moving from the original population to the expanded population (13% larger), and from the original to the surveyed (50% smaller) for both reading and math. These changes were also very modest, with from a 3% to 6% shift in the net impact of the daylight variable on student learning rates.
Teacher Capistrano Variables B Coefficient % Change in
Key Reading Model,
Study Population Included in
Model for Daylight
Code p (Signif)
of B Model R2 Learning
Rate confidence
interval
A original no 0.464 0.000 0.247 26%
C expanded no 0.416 0.000 0.238 24% Shift from Model A to C -0.047 no change -0.009 -3% -1%
A original no 0.464 0.000 0.247 26%
E surveyed no 0.434 0.000 0.239 23% Shift from Model A to E -0.030 no change -0.008 -3% 2%
Figure 16: Teacher Variables and Daylight effect on Reading for the Three Populations Compared
HESCHONG MAHONE GROUP February 14, 200230

±6% ±5% ±6% ±8%
DAYLIGHTING IN SCHOOLS, RE-ANALYSIS REPORT TEACHER BIAS ANALYSIS
Capistrano Teacher Math Model, Variables B Coefficient % Change in
Key Study
Population Included in
Model for Daylight
Code p (Signif)
of B Model R2 Learning
Rate confidence
interval
A original no 0.504 0.000 0.257 20%
C expanded no 0.351 0.000 0.250 14% Shift from Model A to C -0.153 no change -0.007 -6% -1%
A original no 0.504 0.000 0.257 20%
E surveyed no 0.544 0.000 0.274 21% Shift from Model A to E 0.040 no change 0.017 1% 2%
Figure 17: Teacher Variables and Daylight effect on Math for the Three Populations Compared
Interestingly, the greatest variability between models, 6%, occurred from the original to expanded populations for the math model. Earlier, in the Classroom Level Analysis, included in the Appendix of the 1999 Detailed Report, we had found much greater variability in the success of math instruction attributable to individual teachers than reading instruction. Thus, we would also expect greater volatility in the math results between population samples.
The following findings were observed when comparing the three populations before adding the teacher variables to them:
• No change in significance of daylight variable
• The explanatory power of the statistical models (i.e., R2) in explaining the data varies by less than 2%.
3.5.2 Conclusions of Different Study Population Models
The shift in model study populations actually had a greater impact on the R2 of the models than the addition of the teacher characteristic variables. We also saw the largest shift in the magnitude of the B coefficient for the Daylight Code between study populations, rather than with the addition of information about the teachers. Thus, we conclude that the selection of the study population is more likely to impact findings about the effect of daylight than is the addition of information about teachers.
We continue to believe in the importance of the addition of the teachers' characteristics to the model, both to access the potential for a teacher bias and to further refine the accuracy of the model. However, it is clear from this exercise that the study population is likely to have an even greater effect on the results. This once again argues for the importance of replicating the study in other districts, and preferably in widely differing geographic regions and cultural environments.
HESCHONG MAHONE GROUP February 14, 200231
DAYLIGHTING IN SCHOOLS, RE-ANALYSIS REPORT GRADE LEVEL ANALYSIS
4. GRADE LEVEL ANALYSIS
The Grade Level Analysis task was intended to answer two of the questions that were raised from a previous peer review1 of the Daylighting in Schools study.
One question was whether it was might be more appropriate to analyze the data in single grade cohorts, rather than across grades. It was proposed that especially in Seattle, for the Iowa Test of Basic Skills (ITBS), results could not correctly be compared across grades. Creating separate models for each grade level would solve this problem.
A second question asked whether the daylighting effect might vary by grade level. The models used in the first analysis constrained the results to a simple linear expression. It was argued that there might be a progressive effect, again especially in Seattle, where children were exposed to fairly consistent daylighting conditions for the duration of their career at a given school. In Seattle, where we were looking at absolute test scores, exposure to good daylight conditions over more than one year might result in a cumulative effect. This would be evidenced by a progressively greater daylight effect in each higher grade. Again, separate grade level models would allow the daylight effect to change by grade level, allowing us to identify any patterns as children got older.
In Capistrano, we hypothesized that we would not find any progressive effects since children are likely to be shuffled back and forth between traditional classrooms and portable classrooms with each change in grade level. We confirmed with the District that the churn rate in the Capistrano district is reasonably low, with about 4% growth per year, and a similar number of students who relocate to other districts per year. Thus, we estimate about 90% of the students return to a given school each year. Typically, they would experience at least two, if not three or four daylight conditions throughout their career at a given school. Furthermore, since in Capistrano we were looking at the improvement in schools in one year, from fall to spring, cumulative effects would be less likely to show up.
4.1 Hypothesis
Given the main objective of this task, it was hypothesized that daylighting may have a cumulative effect on student scores. This hypothesis would be likely true if a pattern of progressively stronger effects by grade level was observed in Seattle, where children typically remain under one school-wide daylighting condition. A comparative analysis for the test scores in the Capistrano school district, where students may change between high and low daylighting conditions
1 Daylighting and Schools Peer Review Report, sent to PG&E, July 21, 1999. Not released.
HESCHONG MAHONE GROUP February 14, 200232

DAYLIGHTING IN SCHOOLS, RE-ANALYSIS REPORT GRADE LEVEL ANALYSIS
during their stay at an elementary school, would corroborate our hypothesis if a minor or no cumulative effect of daylight was observed in that district.
4.2 Methodology
We re-ran the student performance regression models for both Seattle and Capistrano, this time allowing the daylighting effect to vary by grade level. This was achieved by adding grade level interaction variables for each variable in the model. This is statistically equivalent to running separate models, but simplifies the reporting and interpretation.
Interaction variables between the grade level of the student and each explanatory variable were created and added to the original Capistrano and Seattle models. As in the original study, the Capistrano model used the difference between fall and spring scores while Seattle’s used the absolute value of the spring scores.
Since information regarding teacher characteristics was available for the Capistrano school district, the teacher variables were also included in the Capistrano math and reading models to strengthen their explanatory power.
4.3 Findings
The data from our interaction models did not show a significant effect for the interaction variables between daylight and separate grade levels. This indicates that, for our study populations, we could not support the hypothesis that daylight has a different or cumulative effect on student performance by each grade. The full model results are shown in the Appendix 7.3.
We also found that allowing the results to vary by grade did not improve the accuracy of the models. The R2 of the models increased only very slightly with the addition of the interaction variables, 4% for the Seattle reading model, and less than 1% for the other three. (See Figure 18 and Figure 19)
It is important to note, however, that the daylighting effects remained highly significant even after the addition of the interactive variables. This indicates that daylight still provides a robust explanation of student performance in math and reading tests across all grades. For the Capistrano reading model, the magnitude of the effect (B) declined by 14%, but not the significance.
For the Capistrano math model, we saw a greater impact on both the magnitude (45% decline) and significance (7% decline). This is the one incidence where the daylight variable would not pass our threshold criteria of 95% significance or greater for inclusion in the model. This decline in significance and magnitude were probably caused most by the addition to this model of the one daylight-grade level interaction variable that did prove significant: Daylight Code(2nd
grade). This interaction variable was found to increase the daylight effect considerably for second graders, by more than twice (216%). The interpretation here would be that second graders in more daylit classrooms were mastering the
HESCHONG MAHONE GROUP February 14, 200233

DAYLIGHTING IN SCHOOLS, RE-ANALYSIS REPORT GRADE LEVEL ANALYSIS
math curriculum dramatically faster then those who were not in daylit classrooms, and also comparatively faster than children in other grade levels in daylit classrooms.
While this finding about second graders learning math might seem potentially interesting, the fact that we did not find any other significant interaction effects in any of the other model tends to discount the validity of this finding. Out of twelve opportunities, the interaction between grade level and daylight was found to be significant in only one case. Thus, we tend to doubt that there is any differential sensitivity to daylight by grade level.
Key Test Interactive Variables B Model R^2 % impact error bound Signif.
A Reading N 0.464 0.247 26% +/-10% 100.0%
B Reading Y 0.396 0.239 22% +/-9% 100.0%
Shift from Model A to B -14% -0.008 -4% 0%
C Math N 0.504 0.257 20% +/-5% 100.0%
D Math Y 0.275 0.261 11% +/-12% 92.7%
Shift from Model C to D -45% 0.004 -9% -7%
Figure 18: Capistrano Grade Level Models with Interactive Variables Summary
In Seattle, when allowing for grade level interactions with all the other variables, we saw no declines in significance, and also saw substantial increases in the magnitude of the daylight effect. In the case of the Seattle reading model, the magnitude of the daylight effect increased 26%, while in the math model the magnitude of the daylight effect increased 12%. For the Seattle reading model, the accuracy of the model (R2 ) increased 4%. This would tend to argue for the validity of the increase in the magnitude of the daylight effect. Since some of the significant interaction variables have to do with the physical conditions of the classroom (school vintage, school size, classroom SF) it is possible that some of the daylight effect was previously being masked by the imprecision of those variables without the interaction effects.
Key Test Interactive Variables B
Model R^2
% impact error bound Signif.
A Reading N 1.883 0.297 16% +/- 8% 100.0%
B Reading Y 2.533 0.337 22% +/- 7% 100.0%
Shift from Model A to B 26% 0.040 6% 0%
C Math N 1.391 0.258 12% +/- 7% 99.9%
D Math Y 1.585 0.257 13% +/- 7% 100.0%
Shift from Model C to D 12% -0.001 2% 0%
Figure 19- Seattle Grade Level Models with Interactive Variables Summary
HESCHONG MAHONE GROUP February 14, 200234
DAYLIGHTING IN SCHOOLS, RE-ANALYSIS REPORT GRADE LEVEL ANALYSIS
4.4 Conclusions
The grade level analysis did not increase the accuracy of the models. Further more, while we did find interaction effects between grade level and other variables, most notably the demographic variables, we did not find a consistent interaction between grade level and a daylighting effect. This was true in both Seattle and Capistrano.
From this exercise, we conclude that our original modeling approach, grouping all of the data for grades 2-5, was sufficiently accurate. We also note that we did not find any progressive effect for the daylighting variable, as postulated for Seattle, nor any other pattern related to the age of the student.
HESCHONG MAHONE GROUP February 14, 200235

DAYLIGHTING IN SCHOOLS, RE-ANALYSIS REPORT ABSENTEEISM ANALYSIS
5. ABSENTEEISM ANALYSIS
The Capistrano data set includes information on absences and tardiness per student. Both of these parameters were included as explanatory variables in our original daylighting analysis, but not as dependant variables. We did not use them as dependant variables at the time for two reasons. First, we did not have this information for all three districts, and our original criteria included consistent analysis across districts. Second, the absenteeism and tardiness data is much thinner than student test performance data, since only about 10% of students had a significant number of absences. Thus, it provided a much less sensitive metric of performance.
However recent research findings by others, discussed below, suggested that we should re-examine the Capistrano data set for similar effects. In a number of studies increased ventilation rates have been found to reduce worker absenteeism. There has also been increased interest in the effect of classroom environments, particularly portable classrooms, on student health with a number of epidemiological studies initiated to look for these links. Finally, many daylighting proponents have been claiming the daylighting improves student attendance, and thereby will also increase funding to the schools through California’s system of ADA (average daily attendance) payments.
Milton et al of Harvard School of Public Health reported that increased ventilation rates were associated with reductions in sick leave in the Polaroid Company offices in Massachusetts1. They report: “Based on this latter analysis, 45% of the sick leave among workers in lower ventilation areas was attributable to lower outdoor air supply. Similarly, 41% of sick leave was [also] attributable to humidification, and 39.2% of sick leave…was attributable to the presence of (IAQ) complaints. This corresponded to 1.4 – 1.5 days of increased sick leave per person per year attributable to ventilation, and 1.2 – 1.3 days per person per year attributable to humidification, and 1.1 – 1.2 days per person per year attributable to IAQ complaints, depending on age and gender.”
Teculescu et al. 2 recently reported that occupants of an air-conditioned building were more likely to have multiple absences from work than were persons in a naturally ventilated building. This study was limited, however, by the use of only two buildings (in northeastern France), and by lack of control for ventilation rates and individual and group factors that may have confounded the relationship between building and sick leave.
1 Milton DK, Glencross PM,Walters MD. Risk of Sick Leave Associated with Outdoor Ventilation Level, Humidification, and Building Related Complaints, Harvard School of Public Health, August 1999
2 Teculescu DB, Sauleau EA, Massin N, Bohadana AB, Buhler O, Benamghar L, Mur JM. Sick-building symptoms in office workers in northeastern France: a pilot study. Int Arch Occup Environ Health 1998; 71:353-6.
HESCHONG MAHONE GROUP February 14, 200236

DAYLIGHTING IN SCHOOLS, RE-ANALYSIS REPORT ABSENTEEISM ANALYSIS
The interest in the effect of classroom construction and maintenance, particularly portable classrooms, on student health has peaked in recent years. Current projects in progress include: HP-Woods Institute is studying the relationships between indoor environment and occupant performance in two elementary schools, funded by Air Conditioning and Refrigeration Technology Institute’s 21-CR program; the California Department of Public Health is beginning a study of the environmental health conditions in portable classrooms, funded by Air Research Board; a pilot study of indoor air quality in portable classrooms is being done in Los Angles Count, funded by US EPA; another CEC PIER project is also looking at exposure to VOCs and thermal comfort in four new portable classrooms.
Given this level of interest, we concluded that it would be worthwhile to see if our original Capistrano data set would allow us to make any correlations between classroom physical conditions and student health. The absenteeism and tardiness data could be used as a proxy measure of student health, while daylighting, operable windows, air conditioning, age of classroom and type of classroom (portable, modular, open, semi-open, traditional) could be used as explanatory variables.
We choose to look at absences or tardies data as a reasonable potential proxy for student health. However, our study could not distinguish reasons for absences or tardies. There are many other powerful factors influencing elementary school attendance besides the health of the student, such as dentist or orthodontist appointments, outside activities, poor transportation, parental health, family obligations, etc. Thus, our absenteeism and tardiness variables cannot be interpreted as a strong metric of student health, but rather simply as the best proxy for student health that we had available in our data set.
5.1 Hypothesis
In our earlier Capistrano study, we found that daylight was consistently associated with enhanced learning rates, and operable windows were associated (>95% certainty) with enhanced learning rates in three of the four models. In that original analysis, neither portable classrooms nor the presence or type of air conditioning had a statistically significant effect.
Based on this finding we hypothesized that daylighting and operable windows might also be associated with a reduction in student absenteeism and tardiness in the Capistrano school district.
If this hypothesis were true, operable windows and daylight, as explanatory variables, would appear to be significant and negative in a regression analysis with student absenteeism and tardiness as dependant variables.
Since the models also included other descriptions of the physical conditions of classrooms, we could simultaneously test for the significance of those variables in relationship to absenteeism or tardiness. We were particularly interested in the portable classroom (port) and modular classroom (pport) variables. If
HESCHONG MAHONE GROUP February 14, 200237

DAYLIGHTING IN SCHOOLS, RE-ANALYSIS REPORT ABSENTEEISM ANALYSIS
portable or modular construction does indeed impact student health, then we would expect to see these variables show up as significant in the regression analysis.
5.2 Methodology
A multivariate regression model, using the original data from the 1999 study of the Capistrano school district with all the school data, including daylight, operable windows, as well as the addition of the new teacher and school variables, was run. The student characteristics, teacher characteristics, and school and classroom characteristics were run as independent exploratory variables against absenteeism data the dependant outcome variable. A similar model was run with the same variables against tardy data as an outcome variable.
The data set was redefined to include all those students who attended at least 40 days at the same school. The students, however, were not required to have test scores. As a result, the population shifted slightly, including more students who were not present for either the fall or spring tests, but excluding any records missing attendance data. Thus, the three schools from which we had never received attendance data were dropped from the population. The resulting analysis population was 8808 students.
41%
33%
15%
3% 1% 1% 0% 0%
71%
4% 2% 2% 1% 1% 1%
6% 12%
6%
0%
10%
20%
30%
40%
50%
60%
70%
80%
0-4 5-9 10-14 15-19 20-24 25-29 30-34 35-39 40+
Number of Absences and Tardies
% o
f St
uden
ts
Absences Tardies
Figure 20- Distribution of Absences and Tardies
The absence variable was defined as a function of the sum of three fields in our data set: unverified absences, excused absences, and unexcused absences.
HESCHONG MAHONE GROUP February 14, 200238

DAYLIGHTING IN SCHOOLS, RE-ANALYSIS REPORT ABSENTEEISM ANALYSIS
Absences due to school function were not included. Only the sum of absences per student was available. We did not have information on the distribution of absences over time.
Plotting the attendance data in Figure 20 we noted a very strong curve, where 74% of the population were found to have both fewer than 10 absences, and 83% fewer than 10 tardies. In order to properly model this data distribution we choose to use a natural log function, as expressed in the equation shown in Figure 21 below. We normalized the absenteeism and tardiness data across the whole population by adding a ratio of days enrolled to maximum possible days enrolled:
Ln_Abs = ln È 180 (maximum of enrolled days)
number of days enrolled (minimum = 40) ¥ number of Absences (or Tardies)
˘ ˙˚
ÍÎ
Figure 21- Equation for natural log of attendance data
5.3 Findings
The regression models with the log of absences or tardiness as dependant variables did NOT support the hypothesis that daylight variables, or any other physical characteristics of the classrooms, have a significant effect on student absenteeism or tardiness.
While these models included all of the same explanatory variables used in previous analysis, they proved to be comparatively weak models. The R2 of the absences model was only 0.05, and that of the tardiness model 0.10, indicating that only 5% and 10% respectively of the variance in the data was explained by all of the variables included in the models.
5.3.1 Absenteeism Findings
Physical classroom variables that were considered and found to have NO significance in the absenteeism model included: daylight code, operable window, type of classroom (portable, open, traditional), air conditioning, and size of classroom. In addition, none of the teacher characteristics were found to be significant.
Variables that were significant included: grade level, student socio-economic characteristics, special programs, school site, school vintage, and school population.
Thus, we conclude that student demographic characteristics and school level characteristics (which might include neighborhood effects, special programs, or size of school) have the greatest relationship to student absenteeism.
HESCHONG MAHONE GROUP February 14, 200239

DAYLIGHTING IN SCHOOLS, RE-ANALYSIS REPORT ABSENTEEISM ANALYSIS
5.3.2 Tardiness Findings
The Tardiness model did find that three physical characteristics of classrooms had a slight, significant effect on the pattern of tardiness:
• Daylighting had a modest, positive effect p=.000
• 5% reduction
• No Air Conditioning had a slight, negative effect p=.032
• 11% increase
• Portable classrooms had a slight, negative effect p=.037
• 5% increase
R2 = 0.097
These results could be interpreted to predict that the students in the most daylit classrooms would be likely to have one less tardy per year than those in the least daylight classrooms (5 daylight codes *.05 per code =25% reduction in norm of 5 tardies per year, or 4 tardies per year.) Likewise, no air conditioning was found to be associated with a slight increase in tardiness, 11% from the norm of 5 to 5.5 tardies per year, and portable classrooms were found to be associated with a slight increase in tardiness by 5%, up to 5.25 tardies per year. .
Since tardies are a somewhat subjective measure of student performance (not all teachers mark a student tardy at the same point of lateness) and since tardies do not have as a strong economic tie to the performance of the school as does absenteeism data, we chose to discount these results as not particularly interesting.
5.4 Conclusions
Student attendance, as measured by absences and tardies, was not predicted by with the daylight conditions of the classrooms in the Capistrano Unified School District. Likewise, other physical conditions of the classrooms were not found to be reliable predictors of student attendance.
From this exercise, we concluded that attendance data is a very difficult outcome metric to work in trying to understand the effects of the physical environment on the performance of students, or the productivity of people in general. There are two basic reasons for this difficulty. First, attendance data can only be a loose proxy for the health of the student, since so many other events can cause a student to be absent or tardy besides health effects caused by the physical environment. Secondly, it is not a very sensitive metric. There is not a very big range in attendance values among students, with only about 10% of the student population showing much variation in number of days absent or tardy.
A summary of the findings from the absenteeism analysis is as follows:
HESCHONG MAHONE GROUP February 14, 200240

DAYLIGHTING IN SCHOOLS, RE-ANALYSIS REPORT ABSENTEEISM ANALYSIS
• Daylighting variables were not significant indicators of Absenteeism. Similarly neither operable windows nor portable classrooms variables were significant.
• Student demographic variables were the only reliable predictors of absenteeism
• attendance
• Attendance data is not particularly useful as a performance metric, providing meaningful variation for only 10% of students in our fairly large samples (n= ~ 8800).
• A slight effect of daylight on student tardiness was observed, but not considered interesting.
5.5 Discussion
Our study could not distinguish reasons for absences or tardies. It was assumed that overall absence and tardy data might serve as a reasonable proxy for student health. However, there are many other powerful factors influencing elementary school attendance besides the health of the student, such as dentist or orthodontist appointments, outside activities, poor transportation, parental health, family obligations, etc. Thus, our absenteeism and tardiness variables cannot be interpreted as a strong metric of student health, but rather simply as the best proxy for student health that we had available in our data set.
Improved physical conditions in a workplace or school have been postulated by many to be associated with reduced absenteeism. Indeed, this is a fairly common assertion made in presentations advocating “green” or “sustainable” buildings—that an improvement in the quality of the physical environment will result in fewer absences and thus higher productivity. These claims are most frequently made for improvements in indoor air quality (IAQ)1, but also variously for natural ventilation, ventilation rates2, thermal comfort, ergonomic furniture, electric lighting quality and the presence of daylight.
Our study can only speak to a few of these issues: the potential link between poor indoor air quality in portable classrooms and increased absenteeism. It is important to note that this re-analysis study of the Capistrano data did not substantiate any of these claims.
1 Fisk WJ (2000). Health and productivity gains from better indoor environments and their relationship with
building energy efficiency. Annual Review of Energy and the Environment 25(1): pp. 537-566
2 Milton DK, Glencross PM, Walters MD (2000). Risk of sick leave associated with outdoor ventilation level,
humidification, and building related complaints. Indoor Air, 10(4): pp. 212-21
HESCHONG MAHONE GROUP February 14, 200241

DAYLIGHTING IN SCHOOLS, RE-ANALYSIS REPORT ABSENTEEISM ANALYSIS
• Portable classrooms are currently under investigation by a number of researchers for poor indoor air quality1, which might reduce overall student health.
• Our study did not find that there was any significant association between portable classrooms and increased absenteeism among students.
• Operable windows have been associated with a reduction in indoor air quality complaints2 .
• We did not find that operable windows were significantly associated with any improvement in attendance among elementary school students.
• Claims have been made that daylit schools are associated with improved attendance among students3 .
• We did not find that increased daylight in classrooms was associated with better attendance.
1 Per Jed Waldman, CA Department of Public Health
2 MP Callahan, DS Parker, WL Dutton, and JER McLlvaine, 1997. “Energy Efficiency for Florida Educational Facilities: the 1996 Energy Survey of Florida Schools.” FSEC-CR-951-97, Florida Solar Energy Center, Cocoa, Fl.
3 M Nicklas and G Bailey, “Analysis of the Performance of Students in Daylit Schools,” Proceedings of the American Solar Energy Society, 1997.
HESCHONG MAHONE GROUP February 14, 200242

DAYLIGHTING IN SCHOOLS, RE-ANALYSIS REPORT RE-ANALYSIS CONCLUSIONS
6. RE-ANALYSIS CONCLUSIONS
6.1 Grade Level Analysis
The data did not show a significant effect for the interaction variables between daylight and separate grade levels. Likewise, we did not observe any consistent patterns of an increase or decrease in daylight effects by grade level. Thus, we conclude that there do not seem to be progressive effects as children get older, nor do younger children seem to be more sensitive to daylight than older children.
Allowing the results to vary by grade did not improve the accuracy of the models; with one exception, the R2 of the models increased less than 1%. Therefore, we believe that the extra analysis did not add significantly to our understanding and future research can proceed looking at data across grade levels.
Furthermore, the daylighting effects remained highly significant even after the addition of the interactive variables. This indicates that the Daylight Code still provides a robust explanation of student performance in math and reading tests across all grades.
6.2 Absenteeism Analysis
The student attendance record regression models did not support the hypothesis that daylight variables or any other physical characteristics of the classrooms have a significant effect on student absenteeism or tardiness. Notably, daylighting conditions, operable windows, and air conditioning were not significant in predicting absences. The models were comparatively weak; the full set of 57 variables for the Capistrano data explained only 5% and 10% of the variance in absences and tardies, respectively.
We chose to look at absences and tardiness data as the best proxy for student health that we had available. Absenteeism and tardiness cannot be interpreted as a strong metric of student health, since many other powerful factors influence elementary school attendance. However, to the extent that attendance data does reflect student health, our study may indicate only a weak connection between physical classroom characteristics and student health.
6.3 Teacher Survey
Although the Teacher Survey task was primarily aimed at providing additional information for other Re-analysis tasks, we did learn some useful information about teacher preferences, attitudes and behaviors. For example, while the teachers we surveyed clearly had a preference for windows, daylight and views in their classrooms, these preferences were not likely to be driving classroom
HESCHONG MAHONE GROUP February 14, 200243

DAYLIGHTING IN SCHOOLS, RE-ANALYSIS REPORT RE-ANALYSIS CONCLUSIONS
selection. Far more important in classroom selection was an almost universal desire for large classrooms, lots of storage and water supply in the classroom.
Environmental control is also an important issue for teachers, especially when they find that they don't have it in their classroom. Teachers seemed to hold a basic expectation that they would be able to control light levels, sun penetration, acoustic conditions, temperature and ventilation in their classrooms. When control of one or more of these environmental conditions was not available to them in the classroom, they were passionate and outspoken in their outrage.
We also found that teachers reported using their optional control features frequently enough to make significant impacts on classroom energy use. Use of these features by a dedicated minority would seem to be sufficient to justify their cost effectiveness in terms of energy savings. Of course, their value should also be considered in terms of classroom comfort and productivity.
In their freely offered comments, the teachers were desperate to be heard about the need for better physical environments in their classrooms. It is worth taking the time to review these comments included in the Appendix. Class-size reduction, in particular, has been responsible for many of their current challenges. The teachers clearly resent the many inconveniences posed by sub-optimal classrooms. Capistrano is a well-managed school district with many beautiful new facilities, a mild climate and a world-class location on the Southern California coast. Imagine what kind of responses might come from a district facing far more extreme physical challenges!
6.4 Bias Analysis
We did find that a few types of teachers, those with more experience or honors, were slightly more likely (1% to 5%) to be assigned to classrooms with larger window areas, skylights or operable windows. However, a full multivariate regression of teacher characteristics against the Daylight Code found that none of the teacher characteristics that we identified were significant in explaining assignment to daylit classrooms. This model explained only 1% of the variation in assignment to daylit classroom. We concluded that this assignment bias, while it does exist, is extremely small.
Similarly, we found that the daylight variables remained highly significant in the student performance models, even after the addition of information about the teachers. While a few teacher characteristics did show up as significant variables in our models of student performance, the daylight variables remained extremely robust in all models.
Comparing across twelve different models of student performance in Capistrano, we conclude that the central tendency is for a 21% increase in learning rate between children in classrooms with minimal daylight compared to those with maximum daylight.
HESCHONG MAHONE GROUP February 14, 200244

DAYLIGHTING IN SCHOOLS, RE-ANALYSIS REPORT RE-ANALYSIS CONCLUSIONS
6.5 Re-Analysis Report
Overall, the strength of the daylight variable in predicting student performance stands out sharply across all of these re-analysis efforts. The addition of more information to the models did very little to change the predicted impact of the Daylight Code on student performance.
Only the exercise to link the Daylight Code to student attendance was unsuccessful. This is also an extremely important finding, since it contradicts so many claims have been made about the health effects of daylight or other indoor environmental conditions, as reflected in absenteeism rates of building occupants. In this study, in this school district, we did not find that any of the physical attributes that we had available to us to classify the classrooms could be linked significantly with student attendance.
It is also very clear from these efforts, as we re-analyzed the original data sets with additional information, that the findings of these models are much more strongly dependant upon the particular population studied in the analysis than upon the subtleties of all the variables included in the models. Thus, we conclude that it will be much more informative to try to replicate this study with a completely different population, at a different school district, such as we will attempt to do in Task 2.4 of this project, than it would be to continue to try to refine the models and with further detail in the explanatory variables. This process has been informative as a sensitivity analysis and methodological study. We look forward to applying these lessons in the next study.
HESCHONG MAHONE GROUP February 14, 200245

DAYLIGHTING IN SCHOOLS, RE-ANALYSIS REPORT APPENDICES
7. APPENDICES
7.1 Statistical Terminology
The following briefly describes key statistical terms in the report.
Table 1
Term Name Definition
r Correlation Coefficient
Or
Pearson correlation
Measures the strength of the linear relationship between two variables
It can take on the values from -1.0 to 1.0, where -1.0 is a perfect negative (inverse) correlation, 0.0 is no correlation, and 1.0 is a perfect positive correlation.
On page 6, r is the correlation between well-qualified teachers, and student performances. When .61<r<.80, a strong positive relationship is predicted.
p p-value A p-value is a measure of how much evidence you have against the null hypothesis, i.e. that the hypothesis is not true. (In the report on page 6, the null hypothesis could be interpreted as: r=0). The smaller the p-value, the more evidence you have. (On page 6, a very small p-value indicates that one has very high evidence that the given correlation is significantly different from 0). The probability of a false rejection of the null hypothesis in a statistical test is called the significance level.
A p-value can vary from >.00 to <1.0. The significance level is 1-p, expressed as a percentage. So if a p-value is .01, the significance level is 99%.
One may combine the p-value with the significance level to make a decision on a given test of hypothesis. In such a case, if the p-value is less than some threshold (usually .05, sometimes a bit larger like 0.1 or a bit smaller like .01) then you reject the null hypothesis.
HESCHONG MAHONE GROUP February 14, 200246

DAYLIGHTING IN SCHOOLS, RE-ANALYSIS REPORT APPENDICES
Term Name Definition
R2 Regression correlation coefficient
A value between 0 – 1.0 that indicates how well an X value (or the independent or explanatory variables in the regression) explains a Y value (the dependent variable). Technically, the regression equation is: Y= B0+B1X1+ B2X2+…+ BnXn+e
where B0= intercept, e=error,
so as Xs change, Y, the dependent variable, also changes., and variations in X values cause variations in Y.
R2 is defined as the percentage of total variation in Y explained by the independent variables.
If R2 is equal to 1, then entire variation in Y is explained by the independent variables, i.e. the model is very good, and the X variables have perfect explanatory power (for explaining Y). So, the higher the value of R2, the better the model is for that set of data. Models explaining data that have a high degree of inherent variation, such as individual behavior, will have a much lower R2 than models explaining more predictable events, such as group averages.
B B Coefficient Technically, the regression equation is:
Y= B0+B1X1+ B2X2+…+ BnXn+e
where B0 is the intercept (constant), and
B1 ,B2 ,…,Bn are the slopes of the regression equation, or the coefficients of the Xs, (or the independent variables), and e is error.
A particular Bi (i=1,2,…,n) shows how a particular Xi variable is related to Y. If a Bi
coefficient is a positive number, an increase in Xi
by one unit increases Y by the amount of the Bi
coefficient.
Please refer to Figure 11 for a list of the B coefficients for each independent variable.
HESCHONG MAHONE GROUP February 14, 200247

DAYLIGHTING IN SCHOOLS, RE-ANALYSIS REPORT APPENDICES
7.2 Teacher Survey
(format changed slightly to fit two pages in this appendix)
CLASSROOM SURVEY
Dear CUSD Teacher,
The Heschong Mahone Group, an architectural consulting firm, has been working with the Capistrano Unified School District on an innovative study of the relationship of the physical classroom environment and student performance. We have been funded by the California Energy Commission to do a follow up study to examine a few methodological questions. To do this, we need your assistance to collect information about CUSD teachers and their classrooms.
Please fill out this brief two-page questionnaire and return it today. All individual responses will remain strictly confidential, and will not be released to the District, or to anyone outside of our immediate research team. Only summary data will be reported.
Thank you for your help!
Lisa Heschong, Partner, Heschong Mahone Group
A. Please tell us about yourself:
1. Your Name: Grade Level:
2. Your current room number (location): 99/00 School:
3. How many years have you been in this classroom?
(answer questions 4 and 5 below if you have moved your classroom in the past three years)
4. Your room number from 2 years ago (97/98): Grade Level:
5. How many years in that (97/98) classroom? 97/98 School:
6. How many years have you been teaching at this school?
7. How many years have you been teaching in this district?
8. How many years have you been teaching total?
9. Your Gender: Male o Female o
10. Your Age: 20-39 o 40-59 o 60+ o
11. Your College Degrees:
12. Additional Coursework:
13. Teaching Awards:
HESCHONG MAHONE GROUP February 14, 200248
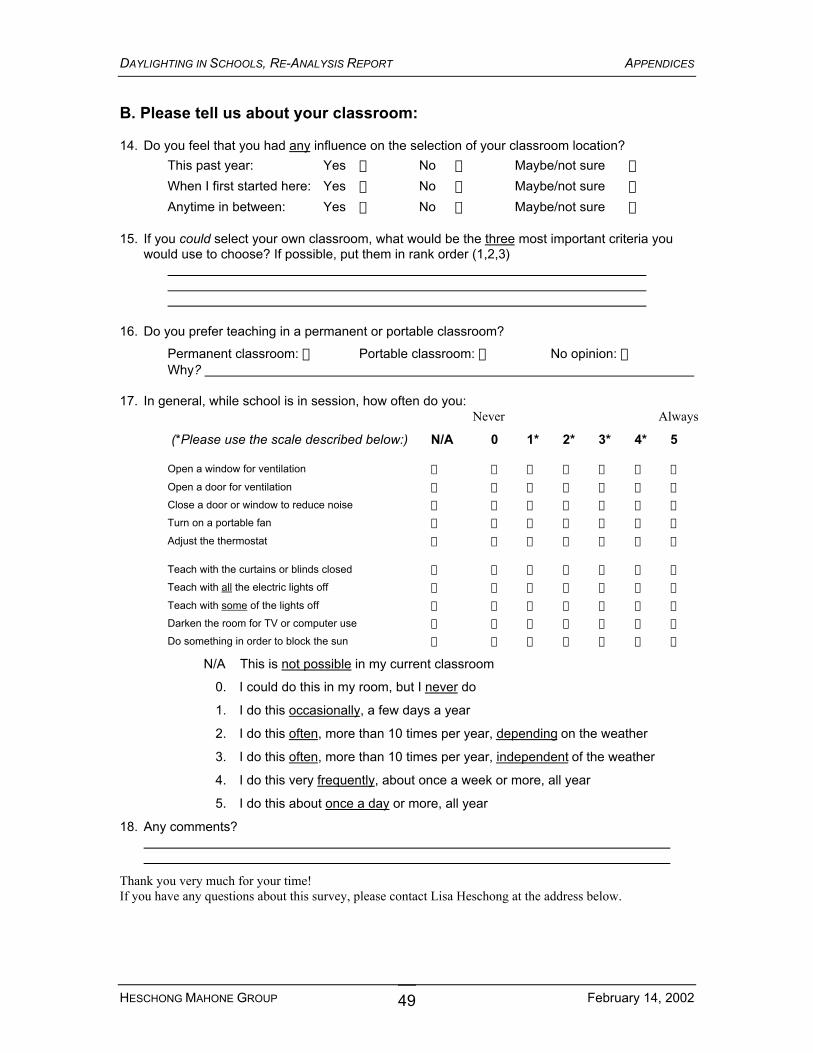
DAYLIGHTING IN SCHOOLS, RE-ANALYSIS REPORT APPENDICES
B. Please tell us about your classroom:
14. Do you feel that you had any influence on the selection of your classroom location?
This past year: Yes o No o Maybe/not sure o
When I first started here: Yes o No o Maybe/not sure o
Anytime in between: Yes o No o Maybe/not sure o
15. If you could select your own classroom, what would be the three most important criteria you would use to choose? If possible, put them in rank order (1,2,3)
16. Do you prefer teaching in a permanent or portable classroom?
Permanent classroom: o Portable classroom: o No opinion: o Why?
17. In general, while school is in session, how often do you: Never Always
(*Please use the scale described below:) N/A 0 1* 2* 3* 4* 5
Open a window for ventilation o o o o o o o
Open a door for ventilation o o o o o o o
Close a door or window to reduce noise o o o o o o o
Turn on a portable fan o o o o o o o
Adjust the thermostat o o o o o o o
Teach with the curtains or blinds closed o o o o o o o
Teach with all the electric lights off o o o o o o o
Teach with some of the lights off o o o o o o o
Darken the room for TV or computer use o o o o o o o
Do something in order to block the sun o o o o o o o
N/A This is not possible in my current classroom
0. I could do this in my room, but I never do
1. I do this occasionally, a few days a year
2. I do this often, more than 10 times per year, depending on the weather
3. I do this often, more than 10 times per year, independent of the weather
4. I do this very frequently, about once a week or more, all year
5. I do this about once a day or more, all year
18. Any comments?
Thank you very much for your time! If you have any questions about this survey, please contact Lisa Heschong at the address below.
HESCHONG MAHONE GROUP February 14, 200249

DAYLIGHTING IN SCHOOLS, RE-ANALYSIS REPORT APPENDICES
7.2.1 Three Most Important Criteria in Selection of Classroom
(Answers to Question 15) fresh paint location matching/appropriate furniture
my own 4 walls water in classroom more storage
Heating/ventilation/air conditioning natural light sound proofing
Quiet room and light storage space
walls to separate from other rooms air conditioning/heater noise level-
air conditioning clean air proximity to facilities (bathroom, cafeteria)
a door that closes full size walls equitable room size
brightness/airflow/lighting size available water
A good location, off the street and parking lot Enough room ventilation, temperature control (see notes)
In main building air conditioning that works quietly close proximity to restrooms
quiet your are in control of noise level limited distractions i.e. window
windows for natural ventilation and lighting. bulletin boards, access to water
Access to water a 2nd window for cross ventilation/light sufficient storage
Size sink windows
permanent classroom located near grade level team noise
size water in classroom storage for supplies
in the building light new
Inside school close to team close to playground access 4.away from noise
in the building away from the lunch area in the same pod as the grade level I'm teaching
quality health standards i.e. no asbestos safety close proximity to school sink
size location in school storage space
quiet spacious close to supplies
quiet environment not near the lunch area good lighting good ventilation, air circulation
enough space and storage inside where the main bldg. Provides water, sinks and center work area easier computer printer access and classrooms are better maintained
size storage boards and white boards/bulletin boards, 4 cleanliness
How large is the room Is it clean and safe Does it have communication to 911 or office staff
Proximity to MPR for music activities I do ventilation - airflow (catches prevailing breeze size and brightness (windows and skylights
larger in size keep playground noise to minimum storage
Adequate lighting ventilation of fresh air into classroom room size
sink-washing hands -science, art white boards to eliminate dust -
safe/noise size water
phone air conditioned sink
size air storage
close to office full view of street for safety during weekends near bathrooms
size, location who neighbor teachers are
HESCHONG MAHONE GROUP February 14, 200250

DAYLIGHTING IN SCHOOLS, RE-ANALYSIS REPORT APPENDICES
Working air conditioner Big room water
size location quality of ac
more, much more room. My current room has no room, it is a misnomer cupboards that opened more than a 30 degree acute angle built-in shelves attached to freestanding walls
location has windows size
size storage noise level
size location, proximity to same grade teachers, playground, office shape
square footage (storage, too) quiet access to water, elect. Etc. no water in my portable
quiet surroundings windows, yet not looking out onto playground sink with water
location size noise level
permanent classroom-completely enclosed permanent classroom with minimal noise from neighbors portable with adequate ventilation
Quietness space near bathroom
light-windows sink noise level quiet
size cupboards for storage location
size noise level window
Large room(space for desks, floor space & small group space single desks (not large tables or trapezoids sink and storage area
quiet sink larger size
cabinets sink room size
4 closed walls large windows
Balanced - behavior academic abilities and study skills - -
quiet (solid walls sink built-in shelves
light-natural outside door size/space
outside door sink built in cupboards
student friendly ample room location
large quiet good a/c
size window outdoor passage
self contained adequate space -
self contained classroom /4 walls doors and quiet an air conditioner that works larger room to allow for centers
space, present size windows tinted storage space closed off by moving white boards
open windows, light quiet, insulation from other rooms nearby work room/office
with grade level windows access to bathrooms
Windows that open (big windows) good storage space carpet
space-lighting storage clean carpeting and freshly painted room
size(permanent room with sink) location(away from playground noise) windows and natural lighting
away from playground noise size near grade level
space (usable) freshness (clean painted) location(proximity to playground, office
location size age
size cleanliness location(near office, restrooms
HESCHONG MAHONE GROUP February 14, 200251

DAYLIGHTING IN SCHOOLS, RE-ANALYSIS REPORT APPENDICES
Size, room to move & do centers location water, storage
Large enough for desks and room for center grouping sink ample cabinets and drawers for books and supplies
Lots of natural light, windows, skylights space for kids & materials grade levels clustered together
windows source of water view
close to other teachers at my grade level close to office/work room noise level
windows phone water
space light noise location
next to other second grades facing courtyard close to office
location - away from playgrounds and lunch tables exterior view- students need to work outside at times
-
Enclosed room room to move around/nice big space sound proof
location near someone I can team quiet location - grass, trees, etc full size-running water
size air and water storage
air conditioning and heating system that works windows-
available water outside door/window space
windows sink space
outside access space sink area
windows door to outside air conditioning
location size facilities (sink, etc)
size noise level close access to library, computer room, etc
air conditioning light spaciousness
size- and storage location in respect to playground bathrooms location in regards to other grade level classes for learning
climate control access to a bathroom water in room
location to playground restrooms office
single desks to lend for flexibility carpet for sound tackable wall space
natural light - windows openness- size lots of useable/tackable walls
quiet windows/light(natural) size
windows built in cupboard space sink/space for students to walk around
windows sinks space lots of it
Windows, natural light and a view self-contained and not in the traffic pattern so we're not interrupted frequently adequate air conditioning and heating
away from recess area close enough to workroom, office, library size though all are the same
Little outside noise, I am next to preschool special ed play yard fresh air room to move freely and for storage
quiet area close to team teacher black top and ramp area not in field
size proximity to front of school no paneled walls
Black/wipe boards sink storage
close to teammates away from playground privacy
enclosed (4 walls close to office or work areas away from playground
controlled air circulation windows and door access physical space
HESCHONG MAHONE GROUP February 14, 200252

DAYLIGHTING IN SCHOOLS, RE-ANALYSIS REPORT APPENDICES
closed in classroom newer facility location relative to team teachers
size doors location to office
self contained, no open walls roominess fully equipped, water, phones, etc
closed classroom air conditioner that doesn't leave dirt throughout room
wall that can be stapled into
closed - self-contained lots of bulletin boards and magnetic white boards control of heat/air
size location -
ability to isolate class and students from surrounding noises and other students and other instructions to control temperature and air flow proximity to team mates of same grade, if any choice was available more modern facilities including storage and water /sink
size lighting storage
quiet accessible well ventilated
Enough space for children & furniture ( not crammed together) cupboard space, built in drawers, sink in room, counters windows
noise (exterior) temperature lighting
two exits running water windows that open
size storage lighting
size location away from outside noise, i.e. freeway, lunch area storage space
space of students, desks, materials storage easy access to playground
space floor space wall space physical environment ventilation, lighting etc location, restrooms, drinking fountains
corner room with minimal 'traffic' flow storage space and inside sink white board space
windows storage/cupboards size/bright/clean/well ventilated
size natural light self-contained
away from playground near bathroom near office
lots of space lots of bulletin boards lots of storage room
size fits 30 windows to the outside self-contained
space size of classroom and storage space windows location
easy accessibility more built-in bookshelves and counter, cabbies larger wet area
space for children sink area storage space
not too close to a playground not too close to an eating area a room with windows that can be opened 4, better lighting
white boards storage space
distance from playground access to pod -
space storage layout
size technology wiring sink
clean new facility appropriate lighting nice size
windows. my classroom at Moulton had none space to move around the room sinks with clean running water
size ventilation sinks in classroom
sink, sunlight location
size lighting, windows
a classroom with much more light new carpet -
Inside bathroom and sink art area
enough closet space/cubbies for minimum # of children water windows
HESCHONG MAHONE GROUP February 14, 200253

DAYLIGHTING IN SCHOOLS, RE-ANALYSIS REPORT APPENDICES
away from playground noise have air conditioning plenty of room
windows that open built in storage space thermostat controlled inside temps
space window/walls storage
size location in relation to playground/office location in relation to others at same grade level
size storage ac/heat ventilation
windows running water built in storage
air conditioning size water
space for all students/desks/cupboards lighting in class soft walls to hang things
size running water/sink condition of classroom
size light locations
size windows location
student space storage location (away from playground etc)
size wall space proximity
Lots of space lots of natural light adjoins other rooms
windows space - bigger than a portable cabinet/storage areas
In the school building Water Connected to a pod
storage windows sink
location close to same grade level size storage space
permanent classroom quiet location convenient location
size location -
size clustered w/other 5 grades away from playground distractions
location space/cabinets room (sq. footage)
space light storage space
physical space storage light
Access to natural light (window thick walls so my students may work noisily at times cabinet space/technology
3 Pod-close to office teaming situation
student work space materials storage water
main building with grade level work room
storage location/workroom windows
Quiet (we have open classrooms windows to the outside to see out large enough for desks and centers
space doors windows
sink size windows
light compatible teaching style-neighbors easy accessibility in and out
windows and natural light good lighting (electrical ample size
natural light ventilation secluded location not central because of foot traffic
portable room with a window or outside lighting my own air conditioning controls
enclosed lots of space lots of storage space
walls and door windows water
centrally located storage furniture
HESCHONG MAHONE GROUP February 14, 200254

DAYLIGHTING IN SCHOOLS, RE-ANALYSIS REPORT APPENDICES
Built in sink close to bathroom close to the "going ons" with the school
Location away from playground noise inside main building near team (grade level)
close to bathroom size inside the building
large size good location-close to copiers, etc clean
close to another room incase I need another teacher to keep an eye on my class or vice versa work area in central pod and area for storage proximity to copiers
size noise factor location to main services
room size access to water pod area
size building vs. portable location
space per student technology environment (sink, water a/c etc
space windows(light) wallspace (allowing for displays and bulletins
Interior environment (cleanliness etc) location ( in the school near office, copiers, etc) storage
size location storage
location to office, bathrooms etc running water size of room
size location, front of school, avoid playground lighting
size location storage space
air conditioning more cupboards new carpet/paint
large enough desks in good condition natural light
location - near grade level air conditioning storage
Full size classroom air conditioning sink/water in classroom
permanent classroom - large bulletin board type walls to ceilings square room (unlike bowling alley I am in
air quality (windows, proper ventilation etc size not a bowling alley as it is now 2 portables divided into 3 not a portable
size air conditioning condition/cleanliness
size quality - carpet-paint air from window flow, very important
windows water in the classroom size
space available ventilation room environment/sink, painted walls in good condition etc
good ventilation quiet location lighting
Internet/electrical/av wiring windows-light size
size location condition
large room windows that open/close bulletin board space
away from the black top room overlooking courtyard or grass area carpeting to the door
size location storage space
space location light
appropriate space for the number of students and furniture that will occupy it. Adequate storage for student and teacher resources condition - everything clean and in working order
size for 33 students heating/ac sink & water to drink
sink air conditioner/heater spare cupboards
sink, access to water air conditioning location to playground (far enough to not be bothered by noise, close enough so it is not a 10 min hike
conveniently located size a/c and heating
HESCHONG MAHONE GROUP February 14, 200255

DAYLIGHTING IN SCHOOLS, RE-ANALYSIS REPORT APPENDICES
size - larger the better Location in school "noise factor" amount of storage and air conditioning
windows - open-ness light (not dark) designed - physical lay-out in harmony for centers/teaching
Storage, there needs to be some water windows, fresh air
windows non toxic air circulation
In the school building closer to restrooms, labs, workrooms running water for science, art, hygiene space and storage; less noise
Near teammates in the bldg. W/water, near office and restroom not used after school
Location surrounding noise appearance
Floor space outside noise level storage
Adequate floor space with super storage including book shelves quiet environment away from lunch and recess noise windows providing natural light
Quiet location bright storage
Size (30+ fifth graders need lots of room location (I'm in what we call cell block B) windows, (I have one small window makes me feel claustrophobic and lack of natural light is depressing
size being in main building -
location amount storage space # windows
easy access location to office and spots that will help w/my student council advisor position quietness window/door placement and room design
bulletin board space (sufficient) storage, ample sink in room, bathroom and work room closer
air conditioning size in main building ( not portable
proximity to office, restrooms, workrooms, lounge area, running water proximity to grade level team members area with maximum sunlight, minimum playground noise
cleanliness temperature classroom relationship to office
sink w/water fountain amount of space, at least 30' x 30' window or skylight, door to the outside
size storage running water
size location lay-out
space windows storage
size storage cleanliness/brightness
windows that open not near the playground noise more natural light
Size Windows for air clean
be closer to the office larger classroom fresh air flow, open window on one side and the door on the other
HESCHONG MAHONE GROUP February 14, 200256

DAYLIGHTING IN SCHOOLS, RE-ANALYSIS REPORT APPENDICES
7.2.2 Permanent v. Portable Classrooms
Answers to Question 16 Preference Why -depends depends on factors in question 19 depends it depends, if the perm classroom is large and quiet, I prefer perm. If not portable depends both have positives, permanent rooms have better equipment and sinks, portables seem more private
but are uglier on a campus
no opinion 17 times, no comments no opinion as long as it is large enough for centers no opinion both have +/- portable + air - no water and more wall space, permanent no air water more windows no opinion either is fine, as long as there are walls no opinion either is good with above options no opinion haven't tried a portable no opinion I don't care so long as top 3 choices are met no opinion I have had both and can adjust to either no opinion I have taught in both, and as long as they are new and nice esp. portables they are great no opinion I love portable walls, staple everything up no opinion If the portable had running water and was large it wouldn't matter no opinion I've done both they are both fine no opinion I've never been in a portable no opinion I've never taught in a portable classroom so I have nothing to compare no opinion I've only taught in portables no opinion never taught in permanent but I'd like water no opinion permanent have storage and feeling of permanence, portables have air - but old ones have mold no opinion permanent have windows, sinks, portables have great walls and flexibility no opinion portables are larger, but permanent rooms have water to wash hands, clean paint brushes, etc. no opinion pros and cons of both
permanent 17 times, no comments -permanent above reasons/ less adhesives, toxic materials used in construction, light natural air permanent access to office, library, others at grade level permanent access to school facilities 'i.e. library, bathroom, water, office permanent access to water, air quality, size, safety quieter, close to necessities permanent access to water, especially for younger children permanent accessibility, central location to services permanent after teaching in a portable for 12 years I feel the ventilation in a portable is unhealthy permanent air quality was better and I did not get sinus infections However it is quieter permanent air quality, allergy problems minimized, learning enhanced permanent at [my school] they are superior more natural light- more cabinet space and access to a work room permanent because I have a sink and wonderful storage cupboards permanent because they seem to get more perks. 'i.e. new carpet permanent better air circulation, although not sure at this site permanent cabinets/storage & work room permanent centrally located to lib, restrooms, water, office etc permanent classrooms have running water (usually) and the floors are solid and make less noise when walking etc. permanent cleaner, brighter, doesn't have musty or chemical portable odor permanent cleaner, more storage, less mildew permanent closer to copy machines and central pod location for easier access to other classes and work area space permanent closer to mail building, access to water in room permanent closer to office, supplies, library/computer lab and other teachers permanent closer to office/bathroom/workroom/multipurpose room etc. permanent closer to other rooms and the office permanent closer to the office, work room (but there is no fresh air flow permanent closer to things I need, bathrooms, office, copiers-also running water in the classroom permanent closer to water source, clean hands and room are important to overall health of teachers and students permanent easier access to office, workroom etc. water availability, noise, no clumping floors, safety when working on
weekends, nights, etc permanent feels substantial lets children know they are important and that things are not temporary permanent generally have better location permanent generally more cupboard space and windows, electrical and plumbing permanent has water permanent I am concerned about the health issues for myself and my students permanent I don't like the potential of mold and the space for re-circulated air. There are many leaks in the two
portables I have been in permanent I don't mind either on as long as they fit the criteria above
HESCHONG MAHONE GROUP February 14, 200257

DAYLIGHTING IN SCHOOLS, RE-ANALYSIS REPORT APPENDICES
permanent I feel like a part of the school building permanent I feel more connected to the rest of the school, and I like having running water. I feel safer. permanent I feel they are safer in the event of an earthquake permanent I firmly believe that portables contribute to poor health (colds etc) permanent I had bad experiences in my portable, allergies, also, I do not like the storage or too rectangular configuration permanent I have a drain under my portable, I have allergies to mold and mildew permanent I have had so many bad experiences with the air quality in portables I bought myself an air filter this year and
I have had parents come to me and say their children's health has improved permanent I haven't had opportunity because of storage permanent I just like having a sink, If portables had sinks I really wouldn't mind teaching in one permanent I like being a part of the main bldg. permanent I like the built in storage permanent I like the logistics and ability to team with others in a permanent classroom, but I also like the portables
because they are more self contained. I can be noisy and quiet when I choose permanent I like to keep things clean and orderly, much easier to do w/storage and water permanent I prefer being close tot he center of the school and portables are usually located out on the playground permanent I prefer closed classrooms permanent I teach K with 30 kids and I need a bathroom in my room permanent If I can open the windows and doors, [at three schools] there is nothing that opens permanent If I could have a permanent classroom with doors I would prefer that permanent I'm a male teacher. I like working in open portables because of misunderstandings that could happen permanent it has more windows, its larger, and it has a sink in the room permanent it has sinks permanent it is closer to facilities(office, copiers, restroom) and it is larger than portables permanent I've been in both and they both have positive and negative qualities. It; up to the teacher to make the
environment workable permanent larger permanent larger permanent larger, has windows, more storage space permanent larger, more storage space permanent larger, sink available permanent less echo sounding/better continuos ventilation and air flow (heat or cool permanent less mildew permanent less noise, more room, smell portables at our school have a bad smell permanent less noise, more built-in storage, sinks, safer in an earthquake, close to center of school permanent less odor more ventilation permanent less sterile looking more in the school mainstream permanent lots of cupboard space not matter what permanent more built-in storage sink more charm permanent more closets etc permanent more convenient, running water, centrally located , more attractive, more quiet permanent more light, wall space, open feeling of it permanent more solid, don't leak, don't smell like artificial-allergenic materials, larger plus cabinets and plumbing permanent more space sink and drinking fountain, students need to be able to wash their hands without running to the
restroom at all times permanent more storage and windows permanent more storage, but like portables because they are closed. permanent more windows, better view larger. Also there have been complaints about allergy problems in portables from
teachers and students permanent more windows, lighter permanent more windows, sink, more storage, wiring permanent newer portables are fine, but some older ones leak and have musty odors permanent no mildew, better HVAC, noise from walking on portable floor is annoying permanent noise and ventilation permanent noise level lower, more storage, sink in classroom, bulletin boards, nicer atmosphere permanent obvious permanent part of the building permanent permanent classrooms provide a sturdier, quieter more spacious environment - better insulated, no noisy
ramps or noise from neighboring portables, also the long hallway environment does not make efficient use of space and deal with real classroom needs.
permanent permanent for a sink, no mold or fungus that portables get, new portable great for hanging student work permanent portable - we only received Sparkletts recently - no sink - little coverage during rainy day, far from restroom permanent portable classrooms tend to give students with allergies more problems. Many do not have running water or
appropriate storage. permanent portable is far away from main facilities, no attached workroom, noises echo and air conditioning make it
difficult to hear, some are too small, not enough cabinets permanent portable lack storage, water, adequate natural light, often have stronger odors from industrial glues, easier to
break into, located on perimeter of the school permanent portable smell musty no sink & the floor makes too much noise when kids move around permanent portables are poorly constructed, floor and ramp noisy, no storage, no sinks (water
HESCHONG MAHONE GROUP February 14, 200258

DAYLIGHTING IN SCHOOLS, RE-ANALYSIS REPORT APPENDICES
permanent portables are too far away from facilities permanent portables don't provide running water, they're far away for emergencies, restrooms, copy machines, no
storage for supplies compared to building with pods permanent portables stink permanent portables tend to take on a musty smell, have few windows, they're cramped; no sinks permanent possible built in cabinets/solid foundation permanent provides a greater sense of stability and has tech and sink/water permanent quiet permanent quieter permanent quieter, usually larger, access to center workroom permanent ramps are too noisy for portables not enough windows permanent reasons in question 19 permanent right now I'm in 1/3 of a portable and it is very crowded. However, it looks like next year, I'll be in a larger
permanent classroom permanent roomier and aesthetically more appealing permanent running water, students aren't drenched on rainy days, better accessibility to other teachers permanent safer for 1st graders to be in the building, sink in classrooms close to bathrooms, two times larger than my
portable, available storage, cleaner air, printers nearby, more stable in an earthquake permanent seems safer, less allergy troubles permanent sink - water permanent sink and built in cabinets and drawers permanent sink and storage permanent sink, closer to supplies, closer to bathroom, closer to peers permanent sink/accessible to water for cleanup permanent size is larger and more natural light permanent size of room availability of a sink/water, and built in cabinets for storage of classroom materials, location to
office permanent size, accessibility, central location to services permanent size, smell , water permanent size, storage space, ventilation permanent size, ventilation permanent smell, dampness permanent solid, less noisy permanent sometimes portables have an unpleasant odor permanent space, availability of sink and fountain in class, storage, proximity to colleagues permanent space, not portables because of space, noise and air quality permanent space, sink, storage permanent storage and access to main bldg. permanent storage behind boards, sink area, wall of windows permanent storage, magnetic whiteboards, soundproof(floors, walls etc. permanent storage, sinks permanent storage, space, proximity to office permanent storage/building access- bathroom, teacher's lounge/pod access/cleaner and nicer rooms- our portables are
dirty and ugly dust causes allergies permanent the classroom should have running water, space in which to move for collaborative groups and fresh air or air
conditioning we have no drinking fountain or sink permanent the issues listed above permanent The older portables have a distinct odor, are rarely cleaned, carpets are dirty and swept about once per
week, no indoor water, no center work area, no small group area for parent helpers permanent The permanent classrooms have better build-in cabinets, pods, for working space and proximity to office,
restrooms, running water/sinks and team members. Also the permanent classrooms have better computers/ printer equipment.
permanent the portables now are not a full size portables long rectangular in shape that do not allow for flexible movement
permanent the room is brighter, storage space and cleaner permanent there is usually a lot more storage space and it is more secure, inside or attached to a building permanent they are larger and they have sinks w/air. Storage is much better permanent they are usually on the central part of the campus permanent they usually have two exits and running water as well as larger size permanent They're larger, have more storage and are usually closer to teacher workroom and restrooms permanent usually the size and shape of permanent, at least at the schools I've been permanent view permanent want a sink-water-windows that open (lots of windows) permanent water availability, proximity to office permanent less distractions, usually have a sink, closer to main school, not as dirty permanent water permanent water and phone available in the classroom permanent water supply, safety and health issues(portables have too many formaldehyde fumes and molds permanent water, built in storage permanent water, closeness to necessities for young children
HESCHONG MAHONE GROUP February 14, 200259
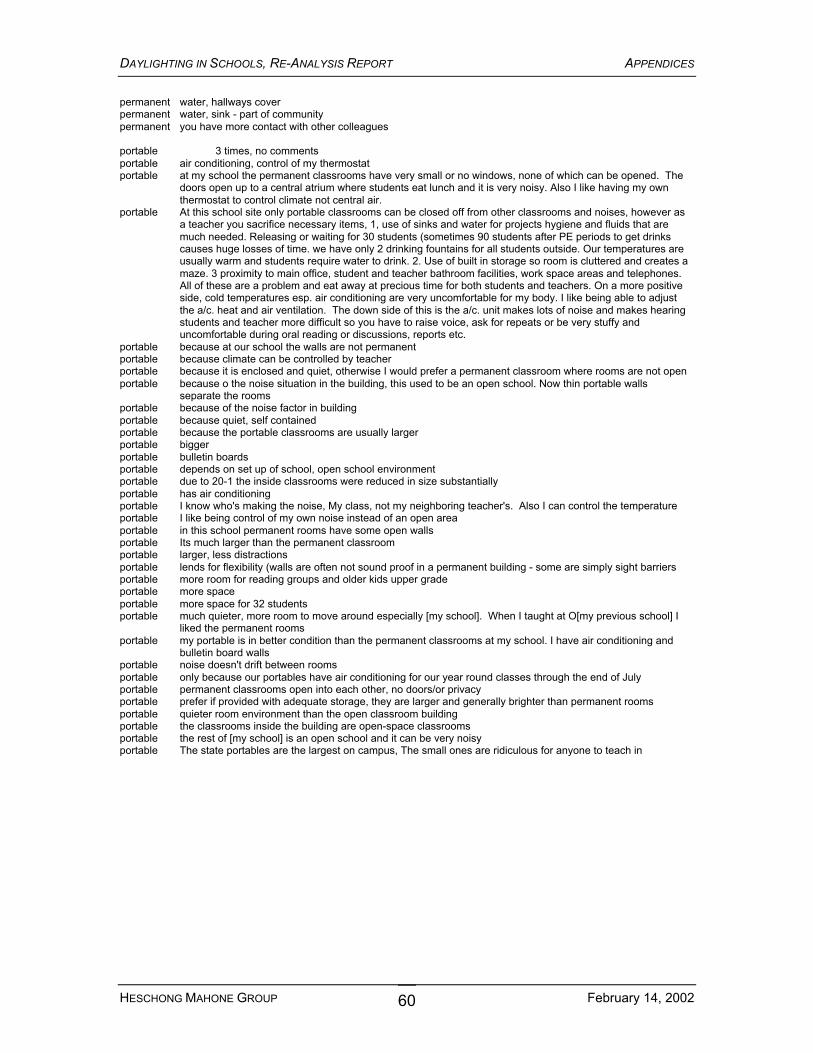
DAYLIGHTING IN SCHOOLS, RE-ANALYSIS REPORT APPENDICES
permanent water, hallways cover permanent water, sink - part of community permanent you have more contact with other colleagues
portable 3 times, no comments portable air conditioning, control of my thermostat portable at my school the permanent classrooms have very small or no windows, none of which can be opened. The
doors open up to a central atrium where students eat lunch and it is very noisy. Also I like having my own thermostat to control climate not central air.
portable At this school site only portable classrooms can be closed off from other classrooms and noises, however as a teacher you sacrifice necessary items, 1, use of sinks and water for projects hygiene and fluids that are much needed. Releasing or waiting for 30 students (sometimes 90 students after PE periods to get drinks causes huge losses of time. we have only 2 drinking fountains for all students outside. Our temperatures are usually warm and students require water to drink. 2. Use of built in storage so room is cluttered and creates a maze. 3 proximity to main office, student and teacher bathroom facilities, work space areas and telephones. All of these are a problem and eat away at precious time for both students and teachers. On a more positive side, cold temperatures esp. air conditioning are very uncomfortable for my body. I like being able to adjust the a/c. heat and air ventilation. The down side of this is the a/c. unit makes lots of noise and makes hearing students and teacher more difficult so you have to raise voice, ask for repeats or be very stuffy and uncomfortable during oral reading or discussions, reports etc.
portable because at our school the walls are not permanent portable because climate can be controlled by teacher portable because it is enclosed and quiet, otherwise I would prefer a permanent classroom where rooms are not open portable because o the noise situation in the building, this used to be an open school. Now thin portable walls
separate the rooms portable because of the noise factor in building portable because quiet, self contained portable because the portable classrooms are usually larger portable bigger portable bulletin boards portable depends on set up of school, open school environment portable due to 20-1 the inside classrooms were reduced in size substantially portable has air conditioning portable I know who's making the noise, My class, not my neighboring teacher's. Also I can control the temperature portable I like being control of my own noise instead of an open area portable in this school permanent rooms have some open walls portable Its much larger than the permanent classroom portable larger, less distractions portable lends for flexibility (walls are often not sound proof in a permanent building - some are simply sight barriers portable more room for reading groups and older kids upper grade portable more space portable more space for 32 students portable much quieter, more room to move around especially [my school]. When I taught at O[my previous school] I
liked the permanent rooms portable my portable is in better condition than the permanent classrooms at my school. I have air conditioning and
bulletin board walls portable noise doesn't drift between rooms portable only because our portables have air conditioning for our year round classes through the end of July portable permanent classrooms open into each other, no doors/or privacy portable prefer if provided with adequate storage, they are larger and generally brighter than permanent rooms portable quieter room environment than the open classroom building portable the classrooms inside the building are open-space classrooms portable the rest of [my school] is an open school and it can be very noisy portable The state portables are the largest on campus, The small ones are ridiculous for anyone to teach in
HESCHONG MAHONE GROUP February 14, 200260

DAYLIGHTING IN SCHOOLS, RE-ANALYSIS REPORT APPENDICES
7.2.3 Additional Comments Answers to Question 18 (a.k.a. Voices from the trenches)
I use an overhead projector everyday, I wish my ac was quieter
Does mold and other bacteria grow under portables? Air conditioner, which is necessary, is too noisy.
Noise is a huge problem, it sometimes seems louder in adjoining classrooms than in the room creating the noise. My classroom is in a pod adjoining 3 other open classes
We need walls & doors to function. Permanent classrooms are so poorly designed, noisy, with inability to turn off lights since they are also used by other classrooms.
My portable is right next to the playground. I can not open my door for fresh air between 9-12:45 then the afternoon PE begins. The blower on the AC is very loud making it hard to teach over. My window and door are on the same side so I get no cross ventilation
The best schools I've seen were old ones - with banks of windows to open ( on both sides of the room, for cross ventilation) and a sink with water. I know [my school] won architectural awards but its not a good building for a school. Note: 19 - Windows so we're not closed in
As long as the school as an open environment allowing noise to travel to other classrooms I vote for a portable. I believe I do a better teaching job
Note question 18, reduced class sizes in lower grades forced upper grades with higher class sizes into portables question 21, I tried using portable fans because they were quieter but they were not able to move the air around enough. Comments, I have read that natural lighting has made a significant difference in student achievement as well as starting times.
My air conditioning unit is very loud it interferes with teaching, also we face a busy street - street noise
Darken room only when we're watching an educational video (not every day but every time we watch a video.
I can only open the windows in the back of the portables. If I open the front windows it is too noisy. I face the playground and recess occurs all day long (each grade level is on a different recess schedule) The noise was problematic during testing from recess. curtains would be a good idea for the portables facing the playground like mine. The students get distracted with watching other students playing
Please do not give this to teachers and expect to get it back immediately. A little professional courtesy (especially at the end of the year) would be appreciated.
I close the skylight to darken the room when watching a video.
Having internet access is wonderful, but printing to printer in the bldg. Is very inconvenient. It is also very difficult not having water in the classroom.
Mold in portables under ground problem for allergies. Portables need 2 exit doors. Please help Calif. Get more square footage per child. It's crazy. Especially with computers taking more space. No phones in our portables, no link to office, no water.
Carpeting is not cleaned enough or rather not replaced often enough! It is disgusting Give me linoleum floors with an area rug any day.
My room is either too hot or too cold. Air circulation and proper temperature almost a impossible feat to obtain
Tremendous construction has been going on for the last two years, really bad during STAR testing this year. Jack hammer one day and ground pounder and earth movers
Lights will be out when I use the overhead projector
I have no door, I must leave through another teacher's classroom, I have no access tot he lights. We are a middle room. The circuits are in the outside rooms, it is unsafe residing in the middle room. We have enough land to build permanent wings on our school site. Please help us to improve instruction by increasing classroom size.
I have no secondary window to use for cross ventilation and the air conditioning unit has to be shut off for students to hear instruction. They tried to adjust it but it is still too loud. If I had a second window, I probably wouldn't need to use it at all which would save a lot of money and energy
I would love to be able to close off some of the noise around me
Our school is open space so its impossible to control the noise level around us.
Several of the lights that are controlled by the switch in my classroom are located in the classroom next door. I feel it is important to have a quiet working environment. Although we have an 'open' school environment, it would be helpful to install walls and doors between the classrooms
HESCHONG MAHONE GROUP February 14, 200261

DAYLIGHTING IN SCHOOLS, RE-ANALYSIS REPORT APPENDICES
I do not have any control of my lights in fact sometimes partial lights are turned off because of other classrooms. As of this month May my air conditioner has begun to work and has been broken since Sept. I would love to have a door and complete walls so sounds couldn't come in my class, which hinders learning when children can't hear.
Storage space in my school and room could easily be converted as described above. I have asked for a Formica countertop to replace the hardboard top for the past eight years with no success. Why were the same type drapes used for replacement when they have been very unsatisfactory all these years. Why not tinting or shatter proof windows (tinted) used for replacement
Orientation is important my room's wing runs NE to SW/ very little direct sun enters. Porch covers help
I use the overhead projector often with the lights off
Our heating systems it either is on full blast or it's off. It can't be adjusted. Rooms are very dirty, not cleaned until the end of year or I clean it all the time myself
I don't adjust the thermostat but I do turn on the heater in the morning to warm up the room. I close the door when children walk by who are coming back from upper grade recess
Very unhandy to close curtains- portable fan is mine, very hot in Sept/Oct. no air cond. Window provide no ventilation
I do like our cathedral ceiling and whiteboards, The drapes are horrible. They are almost impossible to close so we do without closing them sometimes even when darkness is desired. Irony; drapes were just replaced with the same difficult set. Vertical blinds would be nice. Fan blows papers around. Heater is extremely noisy.
Question 21 teacher also answered N/A to last 7 responses with memo: I share a large room with a wall that was built to divide it in half, we share lights, thermostat, etc.
In a shared classroom with a drywall separating the two our lights were the same, so we could not turn them off during teaching time. We also shared a phone and a sink
Note question 18, we did a drawing out of a hat, we agreed on that.
Lights work on 1 switch I turn them off for the overhead, computers, and TV screens. Note question 19, unnumbered answers, storage, bulletin boards
The classroom has an electrical problem and at times throughout the year a group of lights has been out
My classroom is about 18' wide and 30' long. Way too narrow to adequately teach 7-8 yr. Olds.
All classrooms should have windows that open. This school doesn't and kids (myself included) are always suffering congestion, headaches, sneezing. Our school is old and is in desperate need of the vents replaced and proper a/c. It's hard to learn when you're sneezing all day and suffering from headaches
Fresh air and ventilation are very important in keeping students alert and the classroom light and airy for maximum learning
This is an old school, the black soot coming out of the vents is frightening. Since we were built on an open structure basis, and then changed to open the a/c ventilation system is very substandard. I'm quite sure it contributes to germ infestation.
The best thing about my portable is the control over the heat and air conditioning. The permanent bldg. Doesn't have individual control. It's always a problem
I have no windows in my room and I must walk through another class to get to an outside door, I have no light switch, it is in another classroom
I have been in several rooms in different districts and feel that windows or lack of in my classroom has had a major impact on my teaching and the students learning
I consider the physical environment to be an extremely important factor in student parent and teacher attitudes and feeling about school
I'd love to open windows but noise is always a problem. The lights in the classroom seem insufficient, but we get use to them. The light is grayish.
I do not have blinds to block out light
If the permanent classroom had a door access to the adjoining classrooms, I would find this more ideal. I enjoy the open environment, but find it inconvenient when it comes to testing situations and quiet time
I have an open classroom in a pod situation. While it is conducive to team building and support from fellow teachers, it is noisier and distracting to my students, I would prefer doors
I think children perform better in a closed classroom with few interruptions
Temp. control is a major problem in my room which is colder than the others on my system. Noise level is high from male teacher next door (panels separate rooms) whose voice booms
HESCHONG MAHONE GROUP February 14, 200262

DAYLIGHTING IN SCHOOLS, RE-ANALYSIS REPORT APPENDICES
My windows won't open properly or I would open them regularly, My classroom has poor lighting. As a wearer of glasses this provides difficulty for me. I feel eye strain on overcast days. I also receive weekly complaints from students regarding poor lighting. I truly feel that this problem at [my school] has been made known yet nothing has been done about it.
Permanent classrooms tend to be bigger, The children need space to move around. I love my classroom and would not be happy in a portable.
Many portable classrooms are in need of repair or replacement, especially on older campus grounds
Although we have been told that our windows have been tinted for sun glare this proves to be ineffective. Teachers still have to construct devices that cover the windows to reduce glare and darken the room
Did CUSD hire you to do this survey?
I have also taught in an open classroom where students can hear and see what's going on in all classrooms. This is the most ill conceived structure for learning, note question 21 windows don't open
You can't give me a survey and expect that I drop everything I do so can fill it out and return it to the office the same day. Please respect my teaching responsibilities next time
I think upper graders should get priority on the bigger classrooms, It doesn't make sense that a class of 20 smaller students has a bigger room than a class of 29 bigger students
I currently enjoy my classroom very much. It is what I consider large: have sinks, air conditioning and storage. I am not against portables but against not been given a full size portable. I believe it is good for myself and students to breathe in some fresh air, helps us all think
I like a lot of white board room in front, back, and the sides
Because kindergarten is considered 20-1 but it's not considering we still have 34 bodies to accommodate I doubt the extra fixtures (, closet for back packs) will ever be addressed
Can improvement be made on the upkeep of our buildings? The floors that bounce when there's movement in our room or next door, record players skip and overhead projection jumps on the screen
We'd like more space! Tiny portables for tiny people don't offer room for the extra movement that happens ALL DAY
Teaching pre-school without running water makes me feel like it's the 1900s. We carry pails of water! Also we share inadequate bathroom facilities with the rest of the school, The floor is often wet and slippery
20-1 is great, but when classroom size is so greatly reduced stress is increased noise increased no room for centers
My class is part of a large classroom, I have no access to thermostat, intercoms are shared
Teachers need lots of storage space
I love my room but I would like to have more light (natural)
I loved my previous room because it had a large skylight with adjustable blinds. I wish my current room had more windows instead of narrow slits
I would love to have a window and door. If they put a door up we wouldn't get ventilation
After teaching [at my school] for five years I have come to really appreciate the effects of natural light and closed classrooms. The only thing I would change about my classroom is not having a glass slider between my room and room #15 and having direct access to the work room. With 30+ 4th graders it would also be nice to have extra square footage.
I turn off ac before propping door open, I miss having windows to open, I try hard to conserve energy by not using all lights all time
Our rooms are open, without windows, it can be distracting due to noise of other classes
I helped open the school, and we had choice of classroom since then I feel that being in a room gives me priority for it, unless I change grade levels. Teach w/all lights out only when doing projects requiring it(science) or when using an overhead. Wind and noise keep me from opening my door more often. Adjusting my thermostat doesn't do much good.
My classroom has very poor air circulation due to construction of walls to form additional classes. No windows open, open door is too noisy
I was happy with my location and still am
Lights in my room are also controlled by other rooms I can't turn off all the lights for a movie because it would effect surrounding classrooms
Wish I could open a window, very noisy only crack back window. Open door for ventilation except at others recess and lunch noise
The portable I am in is way too small for 21 bodies. The size absolutely affects learning in my classroom. It makes an already challenging job that much more difficult. Small rooms like mine are not shaped or equipped (heard of
HESCHONG MAHONE GROUP February 14, 200263
DAYLIGHTING IN SCHOOLS, RE-ANALYSIS REPORT APPENDICES
painting/cleaning/washing hands without water for 20 six year olds) for children this age. These tiny rooms are far from the best interest for a learning environment for young children.
I have a great room. We always keep our doors shut to keep it cool inside and it is noisy in the lunch area right outside our door, We darken the room to watch movies. As a ritual I turn out some lights when I read to the class.
The light provided by the skylight make teaching with an overhead projector excellent
A room with theatre-like wall for projection would be great if we had projection devices
My thermostat runs on extremes - My class gets way hot/stuffy or chilly w/quite a breeze depending on fluctuation between 1 or 2 degrees (i.e. 71 hot 70 cold
No window to open, Superintendent's instructions do not allow for open doors in air-conditioned rooms, I can and do close the louvers in the sky light at times
The so-called double wide portables are too small! I am in the middle room and the students do not have enough space to move around. Most large projects are eliminated because of lack of space and no access to water. The room is so small that we use the ramp outside to set up centers. The door is always open because the poor circulation in the room gets us sick, since we have no water to wash our hands after sneezing and coughing all over them, we get sick more often and pass colds, flu etc to each other because of our close proximity
Have custodian adjust heat/cool up or down. Sometimes lights off when I do a read aloud
My room is bright/clean/with air conditioning. If it were larger, it would be a perfect learning environment, P.S. I have a great view.
Magnet white boards portable classrooms don't have them
Note from section a question 6- not here anymore, it was a portable which was put on our campus in Nov. and removed during the summer. Before that I was in a very old portable that ended up being re-roofed, carpeted etc. I got very sick in that old portable. Our classroom portable numbers change yearly, depending on how many portables we have ---question 22 comments I'm so glad you are looking at this. I'd love to help you more. I've been at 5 schools in my district in the past 21 years feel free to contact me again
I hate my classroom this year! I am in a portable without a sink, removed from campus, and it takes us 10 min each way to the playground. To make matters worse I am next door to adult special ed ( they make a lot of noise) and next to a school that is operating out of a church (noise) Plus we face a busy street with construction going on all year. The noise and constant traffic drives me crazy. Oops almost forgot to mention the room is infested with mice. Although traps have been set, the mice no longer enter them, and because of the children, poison cannot be put out.
Student performance on tests is primarily based on 3 factors, educational level of parent, student work habits and the test itself and correlation to curriculum
I realize that 20-1 has created the need for portables, but they're highly inconvenient for both students and teachers. Could teachers and grade levels rotate in the building
AC comes on freezing - nice to be able to control ac but noisy and can hear recess if windows open we are treated as if not as important as those inside the main bldg. No restroom, no workroom. 98-99 we had to fight to get white boards that erased. ( additional comments from this teacher, question 19- My primary concern is having 40 kids in the room for a rainy day lunch w/1/2 noon supervisor. Also, no soap we would like Purell or wetwipes supplied for us. Question 20, have to push in TV up the ramp many of us share this TV. question 21-97-98 I was housed in the YMCA rm. I could not use the room after school and was treated very rudely. The Y presently uses our picnic tables and leaves much garbage daily
I'm really a long distance from bathrooms and the teacher's workroom It's frustrating to be crowded
Portable ventilation is poor, either it is freezing or stuffy. Students are encouraged to dress in layers for this situation. Proximity to restrooms and team members truly increases our ability to effective and efficient. Also we are concerned with hygiene due to lack of running water and sinks. Teachers are purchasing Purell or wetwipes with own money for students. Thank you for looking at this very important issue.
Door opens to lunch tables, we have 4 different lunch times and the noise makes it impossible to leave the door open, I have a skylight and keep it open (automatic shutters) all the time for the natural sunlight. A plus for portables is that the door and windows open up to the outside, natural light & fresh air, I work inside the building
I would add a window particularly with a view, to my choices in #19, I have a few slits for windows I find better than nothing. I would hate to teach inside a building with no natural light
Please do not disregard the cleaning, dust, mold, etc of the rooms. Also, portables need to have running water and sinks for drainage
I love my room, just not the location
HESCHONG MAHONE GROUP February 14, 200264

DAYLIGHTING IN SCHOOLS, RE-ANALYSIS REPORT APPENDICES
7.3 Bias Analysis Models
New Model Capistrano, Teacher Bias Analysis -28-2 (Original population) Model R^2 0.248
B
Reading Daylight
Std. Error p (Signif)
Change new-old
R^2 0.002
B
Old Model Capistrano, Original Analysis Reading Daylight C17-rd Model R^2 0.246
B Std. Error p (Signif) (Constant) 3.009
Classroom characteristics 0.303 0.000 (Constant) 3.025 0.298 0.000
Classroom characteristics Daylight code 0.475 0.086 0.000 0.011 Daylight code 0.464 0.085 0.000 Operable windows 0.650
Teacher Characteristics Teacher 3 -0.917 Teacher 5 -1.335 Log yrs teaching 0.221
Student characteristics
0.212
0.288 0.388 0.090
0.002
0.001 0.001 0.014
0.007 Operable windows 0.643 0.212 0.002
Student characteristics Grade 2 10.823 0.251 0.000 -0.037 Grade 2 10.860 0.251 0.000 Grade 3 4.368 0.255 0.000 0.069 Grade 3 4.298 0.254 0.000 Grade 4 0.944 0.252 0.000 0.008 Grade 4 0.937 0.252 0.000 GATE program -1.432 0.257 0.000 0.020 GATE program -1.452 0.257 0.000 LANG program 0.827
School sites 0.239 0.001 -0.011 LANG program 0.838 0.239 0.000
School sites Sch 61 2.173 0.371 0.000 -0.022 SCH 61 2.195 0.370 0.000 Sch 62 1.634 0.485 0.001 0.049 SCH 62 1.584 0.477 0.001 Sch 64 2.536 0.638 0.000 0.019 SCH 64 2.517 0.638 0.000 Sch 67 1.296 0.418 0.002 -0.062 SCH 67 1.359 0.416 0.001 Sch 72 -1.486 0.378 0.000 -0.027 SCH 72 -1.460 0.376 0.000 Sch 77 0.826 0.429 0.054 -0.036 SCH 77 0.863 0.428 0.044 Sch 81 0.822 0.433 0.058 -0.168 SCH 81 0.990 0.431 0.022 Sch 82 1.664 0.450 0.000 -0.004 SCH 82 1.668 0.449 0.000 Sch 85 -1.316 0.389 0.001 -0.062 SCH 85 -1.254 0.388 0.001 Sch 73 1.574
Outliers 0.515 0.002 0.047 SCH 73 1.528 0.516 0.003
Outliers O 82 39.693 7.910 0.000 0.043 O 82 39.650 7.916 0.000 O 71 40.741 7.918 0.000 0.061 O 71 40.680 7.925 0.000 O 17 42.271 7.921 0.000 0.923 O 17 41.348 7.922 0.000 O 58 35.509 7.916 0.000 -0.055 O 58 35.564 7.923 0.000 O 50 36.757 7.911 0.000 0.214 O 50 36.543 7.915 0.000 O 28 -37.307 Dependent Variable: Reading Delta
7.921 (sp98-fa97)
0.000 0.163 O 28 -37.470 7.926 0.000 Dependent Variable: Reading Delta (sp98-fa97)
Figure 22 - Capistrano Reading Models, Original Population, with and without Teacher Variables
HESCHONG MAHONE GROUP February 14, 200265

DAYLIGHTING IN SCHOOLS, RE-ANALYSIS REPORT APPENDICES
New Model Capistrano, Teacher Analysis -28-2 (Original population) Model R^2 0.259
B
Math Daylight
Std. Error p (Signif)
Change new-old
R^2 0.003
B
Old Model Capistrano, Original Analysis C17-md Model R^2 0.256
B
Math Daylight
Std. Error p (Signif) (Constant) 9.045
Classroom characteristics 0.464 0.000 (Constant) 8.026
Classroom characteristics 0.407 0.000
Daylight code 0.430 Teacher characteristics
Teacher 3 -0.933 Teacher 5 -0.688 Log yrs teaching 0.373
Student characteristics
0.072 0.000
0.248 0.000 0.335 0.040 0.077 0.000
-0.075 Daylight code 0.504
Student characteristics
0.067 0.000
Grade 2 9.624 0.216 0.000 -0.088 Grade 2 9.711 0.215 0.000 Grade 3 5.949 0.220 0.000 0.018 Grade 3 5.931 0.219 0.000 Grade 4 1.802 0.216 0.000 -0.011 Grade 4 1.813 0.216 0.000 Absences unverified -0.263 0.123 0.033 0.000 Absences unverified -0.263 0.123 0.032 Absences unexecused -0.029 0.014 0.043 -0.003 Absences unexecused -0.026 0.014 0.069 GATE program -1.191 0.222 0.000 0.045 GATE program -1.236 0.223 0.000 Language program 0.488
School characteristics 0.205 0.017 -0.001 Language program 0.490
School characteristics 0.205 0.017
School Pop-per 500 -0.995 School sites
0.000 0.000 -0.483 School Pop-per 500 -0.512 School sites
0.000 0.010
SCH 59 -1.356 SCH 60 -1.044
0.435 0.002 0.397 0.009
-0.267 SCH 59 -1.089 0.435 0.012
SCH 61 0.808 0.321 0.012 -0.091 SCH 61 0.898 0.313 0.004 SCH 62 0.992 SCH 66 1.172
0.403 0.014 0.514 0.023
-0.457 SCH 62 1.448
SCH 67 0.838 SCH 71 0.803
0.395 0.000
0.355 0.018 0.429 0.061
SCH 72 -1.538 SCH 74 -0.887
0.330 0.000 0.392 0.024
0.075 SCH 72 -1.613 0.321 0.000
SCH 77 0.963 SCH 81 -0.678
0.366 0.009 0.356 0.056
-0.204 SCH 77 1.167 0.365 0.001
SCH 82 1.046 Outliers
0.381 0.006 -0.152 SCH 82 1.198 Outliers
0.379 0.002
O 33 34.151 6.827 0.000 0.089 O 33 34.062 6.838 0.000 O 18 35.754 6.820 0.000 0.639 O 18 35.115 6.837 0.000 O 32 61.994 6.824 0.000 -0.461 O 32 62.456 6.835 0.000 O 48 -45.808 6.822 0.000 0.614 O 48 -46.422 6.831 0.000 O 45 -40.193 6.819 0.000 0.117 O 45 -40.310 6.830 0.000 O 02 -33.568 Dependent Variable: MATHDELT
6.828 0.000 0.898 O 02 -34.466 Dependent Variable: MATHDELT
6.830 0.000
Figure 23 - Capistrano Math Models, Original Population, with and without Teacher Variables
HESCHONG MAHONE GROUP February 14, 200266

DAYLIGHTING IN SCHOOLS, RE-ANALYSIS REPORT APPENDICES
With Teacher Info Capistrano, Teacher Bias Analysis
TS2 Teacher Survey Population
Model R^2 0.243 B
Reading Daylight
Std. Error p (Signif)
Change new-old
R^2 0.004
B
No Teacher Info Capistrano, Teacher Bias Analysis Reading Daylight
TS2 Teacher Survey Population
Model R^2 0.239 B Std. Error p (Signif)
(Constant) 3.277 Classroom characteristics
0.520 0.000 (Constant) 3.905 0.500 0.000 Classroom characteristics
Daylight code 0.463 0.107 0.000 0.030 Daylight code 0.434 0.107 0.000 Operable windows -0.599
Teacher characteristics Teacher 2 1.097 Teacher 6 0.741
Student characteristics
0.296 0.043
0.282 0.000 0.321 0.021
-0.066 Operable windows -0.533 0.296 0.072
Student characteristics Grade 2 10.710 0.395 0.000 0.077 Grade 2 10.634 0.394 0.000 Grade 3 4.083 0.398 0.000 0.160 Grade 3 3.924 0.397 0.000 Grade 4 0.881 0.403 0.029 0.092 Grade 4 0.789 0.400 0.049 GATE program -1.439 0.396 0.000 -0.006 GATE program -1.434 0.396 0.000 Ethnic 3 0.816
School characteristics 0.394 0.038 -0.008 Ethnic 3 0.824 0.395 0.037
School characteristics Vintage 0.034
School site 0.013 0.006 0.001 Vintage 0.034 0.012 0.007
Sch 61 2.269 0.606 0.000 -0.088 Sch 61 2.357 0.607 0.000 Sch 72 -2.225 0.656 0.001 0.007 Sch 72 -2.232 0.656 0.001 Sch 74 -1.568 0.634 0.013 -0.189 Sch 74 -1.379 0.634 0.030 Sch 82 1.916 0.796 0.016 -0.173 Sch 82 2.089 0.796 0.009 Sch 84 -1.417 0.826 0.086 -0.202 Sch 84 -1.216 0.823 0.140 Sch 85 -1.212
Outliers 0.614 0.048 -0.225 Sch 85 -0.987 0.609 0.105
Outliers O 28 -36.805 8.211 0.000 0.539 O28 -37.344 8.227 0.000 O 69 -32.407 8.217 0.000 0.365 O69 -32.772 8.235 0.000 O 17 41.258 8.222 0.000 0.628 O17 40.630 8.238 0.000
Figure 24 - Capistrano Reading Model, Teacher Survey Population, with and without Teacher Variables
HESCHONG MAHONE GROUP February 14, 200267

DAYLIGHTING IN SCHOOLS, RE-ANALYSIS REPORT APPENDICES
With Teacher Info
Capistrano, Teacher Bias Analysis TS2 Teacher Survey Population
Model R^2 0.277 B
Math Daylight
Std. Error p (Signif)
Change new-old
R^2 0.003
B
No Teacher Info
Capistrano, Teacher Bias Analysis Math Daylight TS2 Teacher Survey Population
Model R^2 0.274 B Std. Error p (Signif)
(Constant) 5.115 Classroom characteristics
0.661 0.000 (Constant) 6.302 0.481 0.000
Daylight code 0.497 0.105 0.000 -0.048 DAY_REV 0.544 0.104 0.000 OPERWIN 0.801
Teacher characteristics Teacher 3 -0.625 Teacher 7 0.430 Log yrs teaching 0.464
Student characteristics
0.301 0.008
0.236 0.008 0.256 0.092 0.197 0.019
-0.031 OPERWIN 0.831 0.297 0.005
Student characteristics Grade 2 10.409 0.332 0.000 0.148 Grade 2 10.261 0.328 0.000 Grade 3 6.165 0.343 0.000 0.223 Grade 3 5.941 0.338 0.000 Grade 4 1.942 0.338 0.000 0.041 Grade 4 1.901 0.338 0.000 GATE program -1.226 0.335 0.000 -0.026 GATE program -1.200 0.335 0.000 Ethnic 4 4.348 2.617 0.097 0.116 Ethnic 4 4.232 2.620 0.106 Ethnic 2 1.767
School Characteristics 1.049 0.092 -0.024 Ethnic 2 1.792 1.051 0.088
School Characteristics Vintage 0.020
School sites 0.012 0.084 0.006 Vintage 0.014 0.011 0.222
School sites Sch 59 -1.758 0.727 0.016 0.003 Sch 59 -1.760 0.725 0.015 Sch 60 -1.311 0.569 0.021 -0.152 Sch 60 -1.159 0.564 0.040 Sch 62 1.065 0.566 0.060 -0.241 Sch 62 1.306 0.551 0.018 Sch 67 0.887 0.530 0.095 -0.182 Sch 67 1.069 0.528 0.043 Sch 71 3.948 1.834 0.031 -0.182 Sch 71 4.130 1.830 0.024 Sch 72 -1.496 0.592 0.012 0.558 Sch 72 -2.054 0.575 0.000 Sch 77 1.424 0.684 0.038 0.190 Sch 77 1.235 0.678 0.069 Sch 82 2.577 0.692 0.000 0.146 Sch 82 2.431 0.690 0.000 Sch 83 0.986 0.526 0.061 0.112 Sch 83 0.874 0.525 0.096 Sch 84 -1.622 0.711 0.023 -0.044 Sch 84 -1.578 0.710 0.026 Sch 85 1.100 0.563 0.051 0.498 Sch 85 0.603 0.541 0.265 Sch 173 2.036
Outliers 0.659 0.002 0.109 Sch 173 1.927 0.657 0.003
Outliers O 48 -47.476 6.930 0.000 0.637 O 48 -48.114 6.939 0.000 O 32 62.531 6.927 0.000 -0.243 O 32 62.774 6.938 0.000
a. Dependent Variable: MATHDELT
Figure 25 - Capistrano Math Model, Teacher Survey Population, with and without Teacher Variables
HESCHONG MAHONE GROUP February 14, 200268

DAYLIGHTING IN SCHOOLS, RE-ANALYSIS REPORT APPENDICES
With Teacher Info Change No Teacher Info Capistrano Teacher Bias Analysis Reading Daylight new-old Capistrano, Original Analysis Reading Daylight 27-4 (expanded population) R^2 27-4 (expanded population) Model R^2 0.240 -0.006 Model R^2 0.246
B Std. Error p (Signif) B Std. Error p (Signif) (Constant) 3.083
Classroom characteristics 0.320 0.000 (Constant) 3.161 0.319 0.000
Classroom characteristics Daylight code 0.418
Teachers characteristics Teacher 1 -1.649 Teacher 3 -1.321 Teacher 2 1.210 Teacher 6 0.842 Log yrs teaching 0.398
Student characteristics
0.077 0.000
0.551 0.003 0.595 0.026 0.344 0.000 0.306 0.006 0.208 0.056
0.002 Daylight code 0.416 0.076 0.000
Student characteristics Grade 2 10.574 0.238 0.000 0.085 Grade 2 10.489 0.236 0.000 Grade 3 4.372 0.241 0.000 0.119 Grade 3 4.253 0.240 0.000 Grade 4 0.953 0.237 0.000 0.060 Grade 4 0.893 0.236 0.000 Gender -0.298 Ethnic 6 1.323
0.165 0.070 0.754 0.079
0.010 Gender -0.308 0.165 0.062 Ethnic 6 1.353 0.755 0.073
GATE program -1.539 0.242 0.000 -0.018 GATE program -1.521 0.242 0.000 Lang program 0.703 Econ 3 -3.060
Building characteristics Vintage 0.048
School site
0.252 0.005 0.996 0.002
0.010 0.000
0.005 Lang program 0.698 0.252 0.006 Econ 3 -2.798 0.990 0.005
Vintage 0.049 0.010 0.000 School site
SCH 61 2.328 0.461 0.000 0.007 SCH 61 2.321 0.460 0.000 SCH 62 1.229 0.470 0.009 -0.012 SCH 62 1.242 0.463 0.007 SCH 64 3.086 0.916 0.001 0.345 SCH 64 2.742 0.904 0.002 SCH 67 1.068 SCH 70 1.803 SCH 71 0.990
0.424 0.012 0.893 0.043 0.493 0.045
0.016 SCH 67 1.051 0.420 0.012 SCH70 1.615 0.883 0.067 SCH71 0.968 0.490 0.048
SCH 72 -1.089 0.387 0.005 0.078 SCH 72 -1.167 0.386 0.002 SCH 77 0.908 SCH 79 1.030
0.412 0.028 0.531 0.052
-0.083 SCH 77 0.991 0.412 0.016 SCH 79 0.921 0.529 0.082
SCH 81 2.202 0.475 0.000 0.124 SCH 81 2.078 0.464 0.000 SCH 82 2.370 0.481 0.000 0.044 SCH 82 2.325 0.480 0.000 SCH 93 1.388
Outliers 0.491 0.005 0.051 SCH 93 1.337 0.491 0.006
Outliers O 82 38.594 7.884 0.000 0.078 O 82 38.517 7.892 0.000 O 71 41.114 7.882 0.000 0.080 O 71 41.034 7.891 0.000 O 17 42.753 7.885 0.000 0.913 O 17 41.841 7.890 0.000 O 28 -37.450 O 80 -36.638 O 69 -32.099 Dependent Variable: READDELT
7.886 0.000 7.877 0.000 7.884 0.000
0.033 O 28 -37.483 7.892 0.000 O 58 -36.746 7.886 0.000 O 50 -32.825 7.889 0.000 Dependent Variable: Reading Delta (sp98-fa97)
Figure 26 - Capistrano Reading Model, Expanded Population, with and without Teacher Variables
HESCHONG MAHONE GROUP February 14, 200269

DAYLIGHTING IN SCHOOLS, RE-ANALYSIS REPORT APPENDICES
With Teacher Info Change No Teacher Info Capistrano Teacher Bias Analysis Math Daylight new-old Capistrano, Original Analysis Math Daylight 27-4 (expanded polulation) R^2 27-4 (expanded population) Model R^2 0.252 0.002 Model R^2 0.250
B Std. Error p (Signif) B Std. Error p (Signif) (Constant) 7.505
Classroom characteristics 0.291 0.000 (Constant) 7.558
Classroom characteristics 0.291 0.000
Daylight code 0.301 Teacher characteristics
Teacher 3 -0.834 Teacher 6 -0.846 Log yrs teaching 0.389
Student characteristics
0.066 0.000
0.244 0.001 0.357 0.018 0.076 0.000
-0.051 Daylight code 0.351 Teacher characteristics
Student characteristics
0.064 0.000
Grade 2 9.442 0.205 0.000 -0.053 Grade 2 9.495 0.205 0.000 Grade 3 5.806 0.209 0.000 0.022 Grade 3 5.784 0.209 0.000 Grade 4 1.754 0.206 0.000 -0.007 Grade 4 1.761 0.206 0.000 Abscences unverified -0.162 0.131 0.216 0.009 Abscences unverified -0.172 0.131 0.191 Abscences unexecused -0.029 0.014 0.037 -0.002 Abscences unexecused -0.027 0.014 0.049 Gender 0.258 0.144 0.072 0.002 Gender 0.256 0.144 0.075 GATE program -1.341 0.211 0.000 0.015 GATE program -1.356 0.211 0.000 Lang program 0.611 0.217 0.005 -0.004 Lang program 0.615 0.217 0.005 Econ 3 -2.236
School characteristics 0.538 0.000 -0.008 Econ 3 -2.228
School characteristics 0.536 0.000
Vintage 0.034 School site
0.008 0.000 -0.001 Vintage 0.035 School site
0.008 0.000
SCH 59 -1.607 0.391 0.000 0.018 SCH 59 -1.625 0.391 0.000 SCH 60 -1.434 0.408 0.000 -0.086 SCH 60 -1.348 0.408 0.001 SCH 62 0.670 0.389 0.085 -0.242 SCH 62 0.912 0.384 0.017 SCH 69 -0.886 0.336 0.008 -0.097 SCH 69 -0.788 0.336 0.019 SCH 72 -2.206 0.337 0.000 0.087 SCH 72 -2.293 0.337 0.000 SCH 74 -0.963 0.418 0.021 -0.268 SCH 74 -0.695 0.416 0.094 SCH 77 0.890 0.367 0.015 -0.024 SCH 77 0.914 0.367 0.013 SCH 78 -0.824 0.356 0.021 0.001 SCH 78 -0.825 0.353 0.020 SCH 79 0.848 0.470 0.071 0.049 SCH79 0.799 0.470 0.089 SCH 82 1.264 0.424 0.003 -0.006 SCH82 1.270 0.424 0.003 SCH 84 -0.663
Outliers 0.410 0.106 -0.001 SCH 84 -0.662
Outliers 0.410 0.107
O 33 34.133 6.868 0.000 0.102 O 33 34.031 6.877 0.000 O 18 34.905 6.861 0.000 0.061 O 18 34.844 6.870 0.000 O 32 62.516 6.866 0.000 -0.514 O 32 63.030 6.874 0.000 O 48 (46.018) 6.864 0.000 0.497 O 48 -46.516 6.870 0.000 O 45 (40.246) 6.860 0.000 0.275 O 45 -40.521 6.868 0.000 O 77 (36.783) 6.861 0.000 0.140 O 77 -36.924 6.870 0.000 O 02 (33.621) Dependent Variable: MATHDELT
6.869 0.000 0.287 O 02 -33.908 Dependent Variable: MATHDELT
6.877 0.000
Figure 27 - Capistrano Math Model, Expanded Population, with and without Teacher Variables
HESCHONG MAHONE GROUP February 14, 200270

DAYLIGHTING IN SCHOOLS, RE-ANALYSIS REPORT APPENDICES
Descriptive Statistics Capistrano Original Population N Minimum Maximum Mean Std. Dev.
Daylight Code 8268 0.000 5.000 2.029 1.241 Window Code 8268 0.000 5.000 1.364 1.093 Skylight Type A 8268 0.000 1.000 0.060 0.237 Skylight Type AA 8268 0.000 1.000 0.034 0.181 Skylight Type D 8268 0.000 1.000 0.013 0.113 Skylight Type C 8268 0.000 1.000 0.042 0.201 Skylight Type B 8268 0.000 1.000 0.041 0.197 Operable Windows 8268 0.000 1.000 0.607 0.488 Teacher 1 8268 0.000 1.000 0.295 0.456 Teacher 2 8268 0.000 1.000 0.175 0.380 Teacher 3 8268 0.000 1.000 0.182 0.386 Teacher 4 8268 0.000 1.000 0.054 0.226 Teacher 6 8268 0.000 1.000 0.101 0.301 Teacher 5 8268 0.000 1.000 0.067 0.251 Teacher 7 8268 0.000 1.000 0.179 0.384 Log yrs teaching 8268 0.000 42.000 6.641 9.190 School Pop-per 500 8268 404.000 1518.000 879.430 201.472 Classroom Pop 8268 5.000 44.000 23.896 5.886 Grade 2 8268 0.000 1.000 0.268 0.443 Grade 3 8268 0.000 1.000 0.245 0.430 Grade 4 8268 0.000 1.000 0.250 0.433 Vintage 8268 2.000 64.000 17.666 13.295 Absences Unverified - per 10 8268 0.000 12.000 0.107 0.622 Absences Unexcused -per 10 8268 0.000 60.000 5.325 5.361 Tardies 8268 0.000 105.000 4.740 8.540 Gender 8268 0.000 1.000 0.509 0.500 Ethnic 4 8268 0.000 1.000 0.003 0.050 Ethnic 1 8268 0.000 1.000 0.050 0.218 Ethnic 6 8268 0.000 1.000 0.013 0.111 Ethnic 3 8268 0.000 1.000 0.147 0.354 Ethnic 2 8268 0.000 1.000 0.015 0.121 Ethnic 7 8268 0.000 1.000 0.002 0.040 GATE program 8268 0.000 1.000 0.135 0.342 Lang program 8268 0.000 1.000 0.172 0.377 Econ 3 8268 0.000 1.000 0.147 0.203 Econ 8268 0.000 1.000 0.087 0.282 Sch 59 8268 0.000 1.000 0.032 0.176 Sch 60 8268 0.000 1.000 0.041 0.198 Sch 61 8268 0.000 1.000 0.067 0.251 Sch 62 8268 0.000 1.000 0.043 0.204 Sch 64 8268 0.000 1.000 0.020 0.142 Sch 66 8268 0.000 1.000 0.032 0.176 Sch 67 8268 0.000 1.000 0.053 0.224 Sch 69 8268 0.000 1.000 0.064 0.245 Sch 70 8268 0.000 1.000 0.035 0.185 Sch 71 8268 0.000 1.000 0.034 0.180 Sch 72 8268 0.000 1.000 0.066 0.248 Sch 74 8268 0.000 1.000 0.043 0.202 Sch 76 8268 0.000 1.000 0.046 0.210 Sch 77 8268 0.000 1.000 0.050 0.218 Sch 78 8268 0.000 1.000 0.043 0.203 Sch 79 8268 0.000 1.000 0.041 0.198 Sch 81 8268 0.000 1.000 0.056 0.229 Sch 82 8268 0.000 1.000 0.043 0.203 Sch 84 8268 0.000 1.000 0.029 0.169 Sch 85 8268 0.000 1.000 0.062 0.241 Sch 173 8268 0.000 1.000 0.031 0.172 Sch 273 8268 0.000 1.000 0.024 0.152 Valid N (listwise) 8268
Figure 28 - Descriptive Statistics, Capistrano Original Population
HESCHONG MAHONE GROUP February 14, 200271

DAYLIGHTING IN SCHOOLS, RE-ANALYSIS REPORT APPENDICES
Descriptive Statistics Capistrano Teacher Survey Population
N Minimum Maximum Mean Std.
Deviation
Math Delta 3889 -29.000 79.000 13.128 8.091 Reading Delta 3899 -22.000 59.000 9.251 9.399 Daylight code 3949 0.000 5.000 2.222 1.329 Operable windows 3949 0.000 1.000 0.551 0.498 School Pop-per 500 3949 404.000 1518.000 896.234 204.224 Classroom Pop 3949 11.000 34.000 23.838 5.766 Vintage 3949 2.000 64.000 18.112 13.796 Grade 2 3949 0.000 1.000 0.294 0.456 Grade 3 3949 0.000 1.000 0.243 0.429 Grade 4 3949 0.000 1.000 0.243 0.429 Absences Unverified 3949 0.000 11.000 0.070 0.517 Absences Unexcused 3949 0.000 60.000 5.043 5.502 Tardies 3949 0.000 73.000 4.707 8.503 Gender 3949 0.000 1.000 0.514 0.500 Ethnic 4 3949 0.000 1.000 0.002 0.042 Ethnic 1 3949 0.000 1.000 0.051 0.221 Ethnic 6 3949 0.000 1.000 0.011 0.106 Ethnic 3 3949 0.000 1.000 0.150 0.357 Ethnic 2 3949 0.000 1.000 0.011 0.106 Ethnic 7 3949 0.000 1.000 0.002 0.039 GATE program 3949 0.000 1.000 0.130 0.336 Lang program 3949 0.000 1.000 0.174 0.380 Econ 3 3949 0.000 0.960 0.165 0.212 Log yrs teaching 3949 0.693 3.738 2.462 0.663 Teacher 1 3949 0.000 1.000 0.241 0.428 Teacher 2 3949 0.000 1.000 0.343 0.475 Teacher 3 3949 0.000 1.000 0.290 0.454 Teacher 4 3949 0.000 1.000 0.126 0.332 Teacher 6 3949 0.000 1.000 0.232 0.422 Teacher 7 3949 0.000 1.000 0.399 0.490 Sch 59 3949 0.000 1.000 0.028 0.165 Sch 60 3949 0.000 1.000 0.047 0.211 Sch 61 3949 0.000 1.000 0.060 0.238 Sch 62 3949 0.000 1.000 0.064 0.244 Sch 64 3949 0.000 1.000 0.022 0.145 Sch 65 3949 0.000 1.000 0.046 0.209 Sch 66 3949 0.000 1.000 0.039 0.194 Sch 67 3949 0.000 1.000 0.058 0.234 Sch 68 3949 0.000 1.000 0.045 0.207 Sch 69 3949 0.000 1.000 0.041 0.197 Sch 70 3949 0.000 1.000 0.004 0.062 Sch 72 3949 0.000 1.000 0.049 0.215 Sch 74 3949 0.000 1.000 0.046 0.210 Sch 76 3949 0.000 1.000 0.033 0.178 Sch 77 3949 0.000 1.000 0.036 0.186 Sch 78 3949 0.000 1.000 0.059 0.236 Sch 79 3949 0.000 1.000 0.020 0.139 Sch 81 3949 0.000 1.000 0.065 0.247 Sch 82 3949 0.000 1.000 0.030 0.171 Sch 83 3949 0.000 1.000 0.063 0.244 Sch 84 3949 0.000 1.000 0.031 0.172 Sch 85 3949 0.000 1.000 0.059 0.236 Sch 93 3949 0.000 1.000 0.032 0.176 Sch 94 3949 0.000 1.000 0.025 0.155 Valid N (listwise) 3862
Figure 29 - Descriptive Statistics, Capistrano Teacher Survey Population
HESCHONG MAHONE GROUP February 14, 200272

DAYLIGHTING IN SCHOOLS, RE-ANALYSIS REPORT APPENDICES
Descriptive Statistics Capistrano Expanded Population
N Minimum Maximum Mean Std.
Deviation
Math Delta 9186 -29.000 79.000 12.565 7.914 Reading Delta 9195 -22.000 59.000 8.771 9.010 Daylight Code 9302 0.000 5.000 1.977 1.240 Operable Windows 9302 0.000 1.000 0.574 0.495 School Pop-per 500 9302 404.000 1518.000 886.693 190.423 Classroom Pop 9302 5.000 44.000 23.880 5.885 Grade 2 9302 0.000 1.000 0.273 0.446 Grade 3 9302 0.000 1.000 0.244 0.429 Grade 4 9302 0.000 1.000 0.248 0.432 Absences Unverified 9302 0.000 12.000 0.094 0.584 Absences Unexcused 9302 0.000 60.000 4.672 5.324 Tardies 9302 0.000 105.000 4.143 8.146 Gender 9302 0.000 1.000 0.508 0.500 Vintage 9302 2.000 64.000 16.844 13.157 Ethnic 4 9302 0.000 1.000 0.002 0.047 Ethnic 1 9302 0.000 1.000 0.052 0.222 Ethnic 6 9302 0.000 1.000 0.012 0.110 Ethnic 3 9302 0.000 1.000 0.139 0.346 Ethnic 2 9302 0.000 1.000 0.014 0.117 Ethnic 7 9302 0.000 1.000 0.002 0.041 GATE program 9302 0.000 1.000 0.138 0.345 Lang program 9302 0.000 1.000 0.164 0.371 Econ 3 9302 0.000 1.000 0.153 0.199 Teacher 1 9302 0.000 1.000 0.248 0.432 Teacher 3 9302 0.000 1.000 0.177 0.381 Teacher 2 9302 0.000 1.000 0.146 0.353 Teacher 4 9302 0.000 1.000 0.053 0.225 Teacher 5 9302 0.000 1.000 0.052 0.222 Teacher 6 9302 0.000 1.000 0.098 0.298 Teacher 7 9302 0.000 1.000 0.170 0.375 Log yrs teaching 9302 0.000 3.738 1.045 1.291 Sch 59 9302 0.000 1.000 0.038 0.191 Sch 60 9302 0.000 1.000 0.038 0.191 Sch 61 9302 0.000 1.000 0.048 0.213 Sch 62 9302 0.000 1.000 0.042 0.200 Sch 64 9302 0.000 1.000 0.018 0.134 Sch 66 9302 0.000 1.000 0.028 0.164 Sch 67 9302 0.000 1.000 0.046 0.209 Sch 68 9302 0.000 1.000 0.033 0.179 Sch 69 9302 0.000 1.000 0.055 0.228 Sch 70 9302 0.000 1.000 0.032 0.177 Sch 71 9302 0.000 1.000 0.031 0.172 Sch 72 9302 0.000 1.000 0.053 0.225 Sch 74 9302 0.000 1.000 0.033 0.179 Sch 76 9302 0.000 1.000 0.043 0.203 Sch 77 9302 0.000 1.000 0.047 0.211 Sch 78 9302 0.000 1.000 0.048 0.214 Sch 79 9302 0.000 1.000 0.026 0.159 Sch 80 9302 0.000 1.000 0.045 0.207 Sch 81 9302 0.000 1.000 0.043 0.203 Sch 82 9302 0.000 1.000 0.035 0.183 Sch 83 9302 0.000 1.000 0.045 0.207 Sch 84 9302 0.000 1.000 0.040 0.196 Sch 85 9302 0.000 1.000 0.051 0.219 Sch 93 9302 0.000 1.000 0.030 0.171 Sch 94 9302 0.000 1.000 0.021 0.142 Valid N (listwise) 9123
Figure 30 - Descriptive Statistics, Capistrano Expanded Population
HESCHONG MAHONE GROUP February 14, 200273

DAYLIGHTING IN SCHOOLS, RE-ANALYSIS REPORT APPENDICES
7.4 Grade Level Models New Model Capistrano Grade Level Interaction CGL6-rd Model R^2 0.239
B (Constant) 2.774
Classroom Characteristics Daylight Code 0.396
Teacher Characteristics Teacher 1 -1.148 Teacher 2 1.134 Teacher 6 0.625
Student Characteristics Grade 2 12.478 Grade 3 5.819
Ethnic 6 1.306 GATE Program 1.086 Lang Prog 0.441 Econ 3 -4.077
School Characteristics Vintage 0.054
School Site Sch 61 1.888 Sch 62 0.986 Sch 64 3.207 Sch 67 0.827 Sch 70 2.277 Sch 72 -1.262 Sch 77 0.792 Sch 79 1.078 Sch 81 2.261 Sch 82 2.179
Sch 73 1.518 Outliers
O82 37.789 O71 40.147 O17 40.288 O28 -36.386 O80 -38.527 O69 -31.246
Interaction Variables OPWIN_2 0.659 CLSPOP_4 0.122 ABUNVE_4 0.656 ABUNEX_2 0.061 Gender 2 -1.234 GATE_2 -6.856 GATE_3 -3.016 LANGPR_2 -1.296 LANGPR_3 1.350 Econ 3-2 3.411 Teach 1-2 1.722 Teach 3-2 -2.351 Dependent Variable: READDELT
Reading Daylight
Std. Error p (Signif) 0.399 0.000
0.080 0.000
0.493 0.020 0.344 0.001 0.308 0.043
1.041 0.000 1.432 0.000
0.746 0.080 0.485 0.025 0.525 0.400 1.307 0.002
0.011 0.000
0.472 0.000 0.478 0.039 0.933 0.001 0.436 0.058 0.923 0.014 0.402 0.002 0.423 0.061 0.542 0.047 0.477 0.000 0.492 0.000
0.490 0.002
7.800 0.000 7.798 0.000 7.803 0.000 7.807 0.000 7.798 0.000 7.806 0.000
0.341 0.053 0.060 0.041 0.305 0.031 0.031 0.048 0.460 0.007 0.691 0.000 0.671 0.000 0.719 0.072 0.715 0.059 1.622 0.036 0.567 0.002 0.650 0.000
Change new-old
R^2
Old Model Capistrano, Original Analysis Reading Daylight C17-rd Model R^2 0.246
B Std. Error p (Signif) (Constant) 3.025 0.298 0.000
Classroom Characteristics Daylight code 0.464 0.085 0.000 Operable Window 0.643 0.212 0.002
Student Characteristics Grade 2 10.860 0.251 0.000 Grade 3 4.298 0.254 0.000 Grade 4 0.937 0.252 0.000
GATE Program -1.452 0.257 0.000 Lang Prog 0.838 0.239 0.000
School Characteristics
School Site Sch 61 2.195 0.370 0.000 Sch 62 1.584 0.477 0.001 Sch 64 2.517 0.638 0.000 Sch 67 1.359 0.416 0.001
Sch 72 -1.460 0.376 0.000 Sch 77 0.863 0.428 0.044
Sch 81 0.990 0.431 0.022 Sch 82 1.668 0.449 0.000 Sch 85 -1.254 0.388 0.001 Sch 73 1.528 0.516 0.003
Outliers O82 39.650 7.916 0.000 O71 40.680 7.925 0.000 O17 41.348 7.922 0.000 O28 -37.470 7.926 0.000 O58 35.564 7.923 0.000 O50 36.543 7.915 0.000 Dependent Variable: Reading Delta (sp98-fa97)
-0.007 B
-0.068
1.618 1.521 -0.937
2.537 -0.397
-0.307 -0.598 0.690 -0.532
0.198 -0.070
1.271 0.511
-0.009
-3.559 -0.533 0.638 1.084
Figure 31- Capistrano Grade Level Interaction, Reading Daylight
HESCHONG MAHONE GROUP February 14, 200274

DAYLIGHTING IN SCHOOLS, RE-ANALYSIS REPORT APPENDICES
New Model Capistrano Grade Level Interaction CGL6-md Model R^2 0.261
B
Math Daylight
Std. Error p (Signif)
Change new-old
R^2
Old Model Capistrano, Original Analysis C17-md Model R^2 0.256
B
Math Daylight
Std. Error p (Signif) 0.005
B (Constant) 7.787
Classroom Characteristics Daylight Code 0.275 Daylight Code*2nd Grade 0.320
Teacher Characteristics none significant
Student Characteristics Grade 2 11.506 Grade 3 3.227 Grade 4 2.451 Gender 0.277 GATE program (1.352) LANG program 0.566 Econ 3 (2.390)
Absen Unexc (0.030) School Characteristics
Vintage 0.038 School Site
SCH59 (1.818) SCH60 (1.390)
SCH62 0.644
SCH69 (0.748)
SCH72 (2.815) SCH74 (0.936) SCH77 0.797 SCH78 (0.930) SCH82 0.944 SCH84 (0.932)
Outliers O33 34.480 O18 33.983 O32 61.652 O48 (46.429) O45 (40.698) O77 (35.628) O02 (32.938)
Interaction Variables Vintage 2 (0.046) Vintage 3 0.057 Vintage 4 (0.063) School Pop 2 (0.003) School Pop 3 0.002 Tardies 2 (0.030) Tardies 3 0.047 Econ 3-3 (3.135)
a Econ 3-4 3.387 Teach 1-2 2.140 Teach 4-4 2.914 Dependent Variable: MATHDELT
0.481 0.000
0.154 0.073 0.190 0.093
0.871 0.000 0.893 0.000 0.922 0.008 0.143 0.053 0.211 0.000 0.216 0.009 0.907 0.008
0.014 0.034
0.014 0.008
0.390 0.000 0.411 0.001
0.387 0.096
0.341 0.028
0.359 0.000 0.421 0.026 0.364 0.029 0.362 0.010 0.427 0.027 0.401 0.020
6.836 0.000 6.831 0.000 6.837 0.000 6.829 0.000 6.828 0.000 6.832 0.000 6.840 0.000
0.020 0.021 0.019 0.003 0.020 0.001 0.001 0.000 0.001 0.003 0.017 0.078 0.017 0.006 1.190 0.008 1.258 0.007 0.322 0.000 1.292 0.024
-0.229
1.794 -2.704 0.637
-0.115 0.077
-0.004
0.038
-0.728
-0.898 -0.804
-0.803 -1.201
-0.370
-0.255
0.418 -1.132 -0.803 -0.007 -0.388
1.529
(Constant) 8.026 Classroom Characteristics
Daylight Code 0.504
Teacher Characteristics
Student Characteristics SECOND 9.711 THIRD 5.931 FOURTH 1.813
GATE progam -1.236 LANG program 0.490
Absen Unver -0.263 Absen Unexc -0.026
School Site SCH59 -1.089
SCH61 0.898 SCH62 1.448 SCH67 0.838
SCH71 0.803 SCH72 -1.613
SCH77 1.167
SCH82 1.198
Outliers O33 34.062 O18 35.115 O32 62.456 O48 -46.422 O45 -40.310
O02 -34.466 Dependent Variable: MATHDELT
0.407 0.000
0.067 0.000
0.215 0.000 0.219 0.000 0.216 0.000
0.223 0.000 0.205 0.017
0.123 0.032 0.014 0.069
0.435 0.012
0.313 0.004 0.395 0.000 0.355 0.018
0.429 0.061 0.321 0.000
0.365 0.001
0.379 0.002
6.838 0.000 6.837 0.000 6.835 0.000 6.831 0.000 6.830 0.000
6.830 0.000
Figure 32- Capistrano Grade Level Interaction, Math Daylight
HESCHONG MAHONE GROUP February 14, 200275
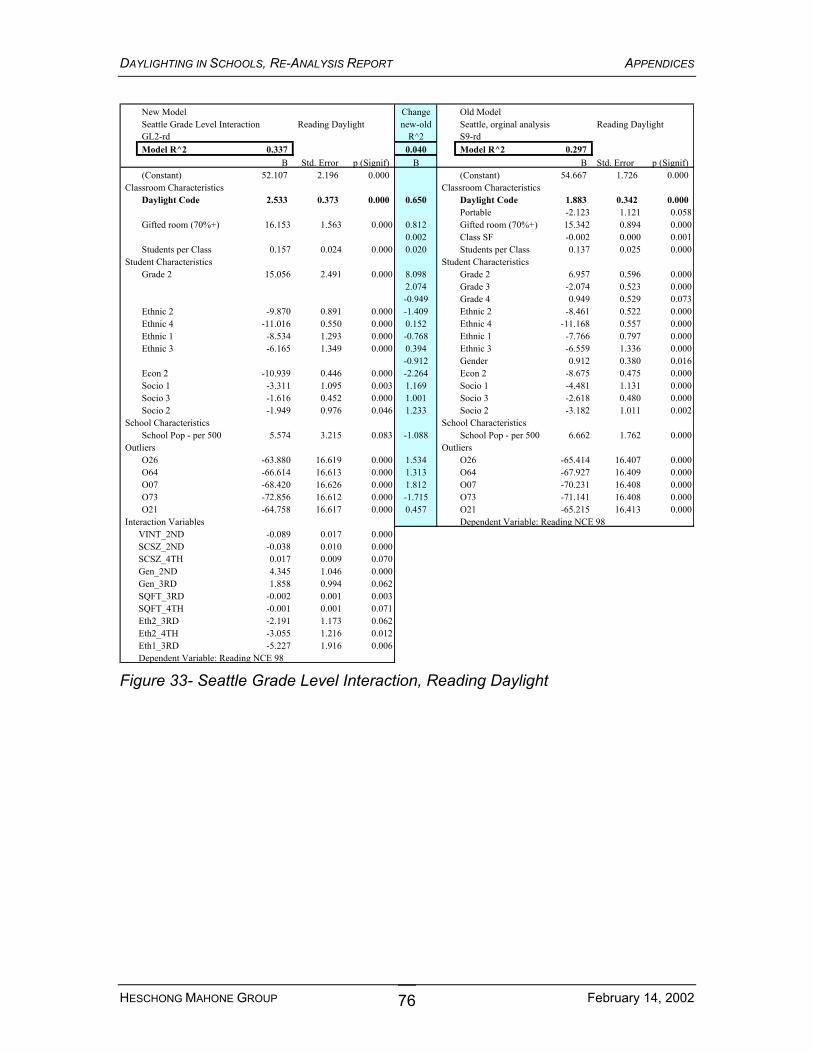
DAYLIGHTING IN SCHOOLS, RE-ANALYSIS REPORT APPENDICES
New Model Seattle Grade Level Interaction GL2-rd Model R^2 0.337
B
Reading Daylight
Std. Error p (Signif)
Change new-old
R^2
Old Model Seattle, orginal analysis Reading Daylight S9-rd Model R^2 0.297
B Std. Error p (Signif) 0.040
B (Constant) 52.107
Classroom Characteristics Daylight Code 2.533
Gifted room (70%+) 16.153
Students per Class 0.157 Student Characteristics
Grade 2 15.056
Ethnic 2 -9.870 Ethnic 4 -11.016 Ethnic 1 -8.534 Ethnic 3 -6.165
Econ 2 -10.939 Socio 1 -3.311 Socio 3 -1.616 Socio 2 -1.949
School Characteristics School Pop - per 500 5.574
Outliers O26 -63.880 O64 -66.614 O07 -68.420 O73 -72.856 O21 -64.758
Interaction Variables VINT_2ND -0.089 SCSZ_2ND -0.038 SCSZ_4TH 0.017 Gen_2ND 4.345 Gen_3RD 1.858 SQFT_3RD -0.002 SQFT_4TH -0.001 Eth2_3RD -2.191 Eth2_4TH -3.055 Eth1_3RD -5.227 Dependent Variable: Reading NCE 98
2.196 0.000
0.373 0.000
1.563 0.000
0.024 0.000
2.491 0.000
0.891 0.000 0.550 0.000 1.293 0.000 1.349 0.000
0.446 0.000 1.095 0.003 0.452 0.000 0.976 0.046
3.215 0.083
16.619 0.000 16.613 0.000 16.626 0.000 16.612 0.000 16.617 0.000
0.017 0.000 0.010 0.000 0.009 0.070 1.046 0.000 0.994 0.062 0.001 0.003 0.001 0.071 1.173 0.062 1.216 0.012 1.916 0.006
0.650
0.812 0.002 0.020
8.098 2.074 -0.949 -1.409 0.152 -0.768 0.394 -0.912 -2.264 1.169 1.001 1.233
-1.088
1.534 1.313 1.812 -1.715 0.457
(Constant) 54.667 1.726 0.000 Classroom Characteristics
Daylight Code 1.883 0.342 0.000 Portable -2.123 1.121 0.058 Gifted room (70%+) 15.342 0.894 0.000 Class SF -0.002 0.000 0.001 Students per Class 0.137 0.025 0.000
Student Characteristics Grade 2 6.957 0.596 0.000 Grade 3 -2.074 0.523 0.000 Grade 4 0.949 0.529 0.073 Ethnic 2 -8.461 0.522 0.000 Ethnic 4 -11.168 0.557 0.000 Ethnic 1 -7.766 0.797 0.000 Ethnic 3 -6.559 1.336 0.000 Gender 0.912 0.380 0.016 Econ 2 -8.675 0.475 0.000 Socio 1 -4.481 1.131 0.000 Socio 3 -2.618 0.480 0.000 Socio 2 -3.182 1.011 0.002
School Characteristics School Pop - per 500 6.662 1.762 0.000
Outliers O26 -65.414 16.407 0.000 O64 -67.927 16.409 0.000 O07 -70.231 16.408 0.000 O73 -71.141 16.408 0.000 O21 -65.215 16.413 0.000 Dependent Variable: Reading NCE 98
Figure 33- Seattle Grade Level Interaction, Reading Daylight
HESCHONG MAHONE GROUP February 14, 200276
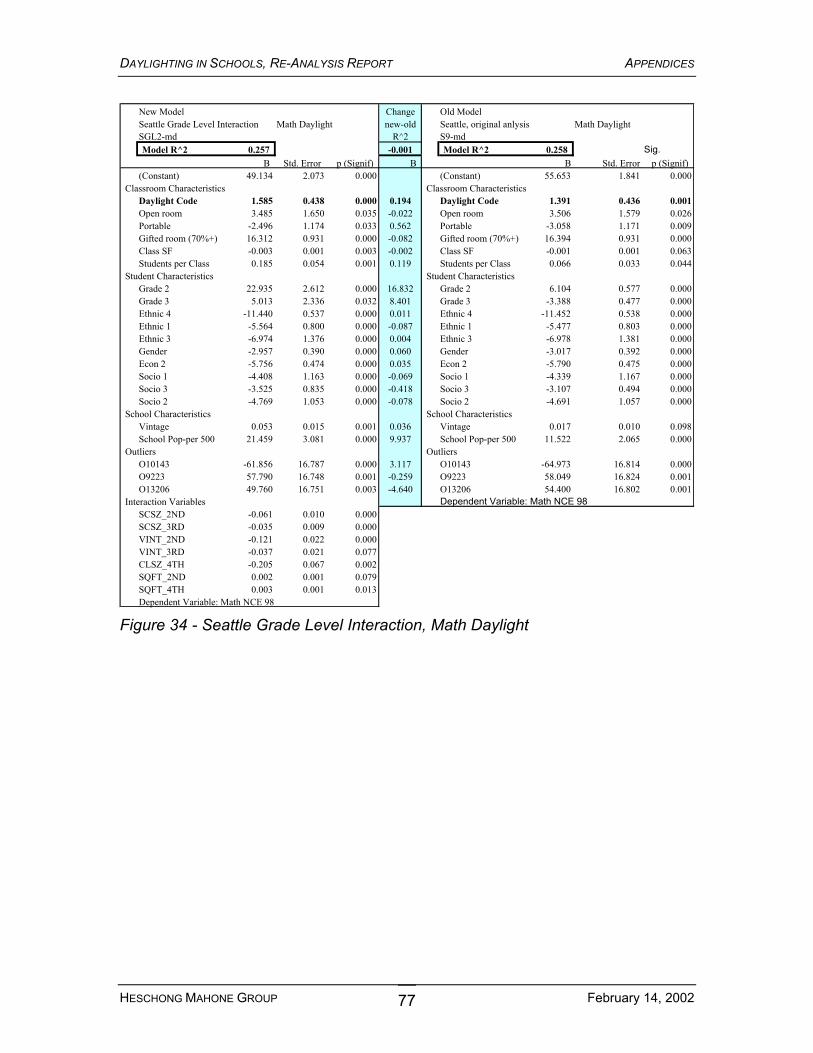
DAYLIGHTING IN SCHOOLS, RE-ANALYSIS REPORT APPENDICES
New Model Seattle Grade Level Interaction Math Daylight SGL2-md Model R^2 0.257
B Std. Error p (Signif)
Change new-old
R^2
Old Model Seattle, original anlysis Math Daylight S9-md Model R^2 0.258
B Std. Error
Sig.
p (Signif) -0.001
B (Constant) 49.134 2.073
Classroom Characteristics Daylight Code 1.585 0.438 Open room 3.485 1.650 Portable -2.496 1.174 Gifted room (70%+) 16.312 0.931 Class SF -0.003 0.001 Students per Class 0.185 0.054
Student Characteristics Grade 2 22.935 2.612 Grade 3 5.013 2.336 Ethnic 4 -11.440 0.537 Ethnic 1 -5.564 0.800 Ethnic 3 -6.974 1.376 Gender -2.957 0.390 Econ 2 -5.756 0.474 Socio 1 -4.408 1.163 Socio 3 -3.525 0.835 Socio 2 -4.769 1.053
School Characteristics Vintage 0.053 0.015 School Pop-per 500 21.459 3.081
Outliers O10143 -61.856 16.787 O9223 57.790 16.748 O13206 49.760 16.751
Interaction Variables SCSZ_2ND -0.061 0.010 SCSZ_3RD -0.035 0.009 VINT_2ND -0.121 0.022 VINT_3RD -0.037 0.021 CLSZ_4TH -0.205 0.067 SQFT_2ND 0.002 0.001 SQFT_4TH 0.003 0.001 Dependent Variable: Math NCE 98
0.000
0.000 0.035 0.033 0.000 0.003 0.001
0.000 0.032 0.000 0.000 0.000 0.000 0.000 0.000 0.000 0.000
0.001 0.000
0.000 0.001 0.003
0.000 0.000 0.000 0.077 0.002 0.079 0.013
0.194 -0.022 0.562 -0.082 -0.002 0.119
16.832 8.401 0.011 -0.087 0.004 0.060 0.035 -0.069 -0.418 -0.078
0.036 9.937
3.117 -0.259 -4.640
(Constant) 55.653 1.841 Classroom Characteristics
Daylight Code 1.391 0.436 Open room 3.506 1.579 Portable -3.058 1.171 Gifted room (70%+) 16.394 0.931 Class SF -0.001 0.001 Students per Class 0.066 0.033
Student Characteristics Grade 2 6.104 0.577 Grade 3 -3.388 0.477 Ethnic 4 -11.452 0.538 Ethnic 1 -5.477 0.803 Ethnic 3 -6.978 1.381 Gender -3.017 0.392 Econ 2 -5.790 0.475 Socio 1 -4.339 1.167 Socio 3 -3.107 0.494 Socio 2 -4.691 1.057
School Characteristics Vintage 0.017 0.010 School Pop-per 500 11.522 2.065
Outliers O10143 -64.973 16.814 O9223 58.049 16.824 O13206 54.400 16.802 Dependent Variable: Math NCE 98
0.000
0.001 0.026 0.009 0.000 0.063 0.044
0.000 0.000 0.000 0.000 0.000 0.000 0.000 0.000 0.000 0.000
0.098 0.000
0.000 0.001 0.001
Figure 34 - Seattle Grade Level Interaction, Math Daylight
HESCHONG MAHONE GROUP February 14, 200277

DAYLIGHTING IN SCHOOLS, RE-ANALYSIS REPORT APPENDICES
Descriptive Statistics Capistrano Grade Level, Reading and Math N Minimum Maximum Mean Std. Dev.
READDELT 9195 -22.000 59.000 8.771 9.010
MATHDELT 9186 -29.000 79.000 12.565 7.914
Daylight Code 9302 0.000 5.000 1.977 1.240
Teacher 1 9302 0.000 1.000 0.248 0.432
Teacher 3 9302 0.000 1.000 0.177 0.381
Teacher 2 9302 0.000 1.000 0.146 0.353
Teacher 6 9302 0.000 1.000 0.098 0.298
Log yrs teaching 9302 0.000 3.738 1.045 1.291
Grade 2 9302 0.000 1.000 0.273 0.446
Grade 3 9302 0.000 1.000 0.244 0.429
Grade 4 9302 0.000 1.000 0.248 0.432
Vintage 9302 2.000 64.000 16.844 13.157
Gender 9302 0.000 1.000 0.508 0.500
Ethnic 6 9302 0.000 1.000 0.012 0.110
GATE program 9302 0.000 1.000 0.138 0.345
Lang program 9302 0.000 1.000 0.164 0.371
Econ 3 9302 0.000 1.000 0.153 0.199
Sch 61 9302 0.000 1.000 0.048 0.213
Sch 62 9302 0.000 1.000 0.042 0.200
Sch 64 9302 0.000 1.000 0.018 0.134
Sch 67 9302 0.000 1.000 0.046 0.209
Sch 70 9302 0.000 1.000 0.032 0.177
Sch 71 9302 0.000 1.000 0.031 0.172
Sch 72 9302 0.000 1.000 0.053 0.225
Sch 77 9302 0.000 1.000 0.047 0.211
Sch 79 9302 0.000 1.000 0.026 0.159
Sch 81 9302 0.000 1.000 0.043 0.203
Sch 82 9302 0.000 1.000 0.035 0.183
Sch 173 9302 0.000 1.000 0.030 0.171
Valid N (listwise) 9123
Figure 35- Descriptive statistics, Capistrano Grade Level, Reading and Math
HESCHONG MAHONE GROUP February 14, 200278
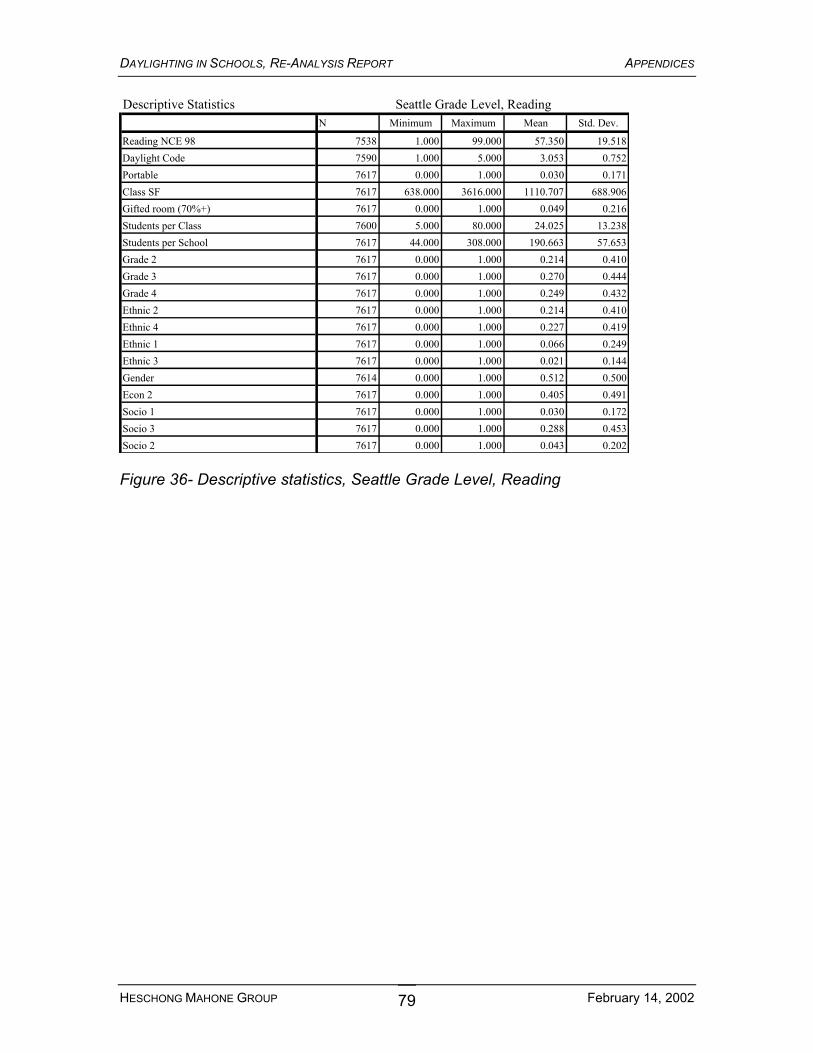
DAYLIGHTING IN SCHOOLS, RE-ANALYSIS REPORT APPENDICES
Descriptive Statistics Seattle Grade Level, Reading N Minimum Maximum Mean Std. Dev.
Reading NCE 98 7538 1.000 99.000 57.350 19.518
Daylight Code 7590 1.000 5.000 3.053 0.752
Portable 7617 0.000 1.000 0.030 0.171
Class SF 7617 638.000 3616.000 1110.707 688.906
Gifted room (70%+) 7617 0.000 1.000 0.049 0.216
Students per Class 7600 5.000 80.000 24.025 13.238
Students per School 7617 44.000 308.000 190.663 57.653
Grade 2 7617 0.000 1.000 0.214 0.410
Grade 3 7617 0.000 1.000 0.270 0.444
Grade 4 7617 0.000 1.000 0.249 0.432
Ethnic 2 7617 0.000 1.000 0.214 0.410
Ethnic 4 7617 0.000 1.000 0.227 0.419
Ethnic 1 7617 0.000 1.000 0.066 0.249
Ethnic 3 7617 0.000 1.000 0.021 0.144
Gender 7614 0.000 1.000 0.512 0.500
Econ 2 7617 0.000 1.000 0.405 0.491
Socio 1 7617 0.000 1.000 0.030 0.172
Socio 3 7617 0.000 1.000 0.288 0.453
Socio 2 7617 0.000 1.000 0.043 0.202
Figure 36- Descriptive statistics, Seattle Grade Level, Reading
HESCHONG MAHONE GROUP February 14, 200279

DAYLIGHTING IN SCHOOLS, RE-ANALYSIS REPORT APPENDICES
Descriptive Statistics Seattle Grade Level, Math
N Minimum Maximum Mean Std. Dev.
Math NCE 98 7422 1.000 99.000 58.820 19.467
Daylight code 7590 1.000 5.000 3.053 0.752
Open room 7617 0.000 1.000 0.104 0.306
Portable 7617 0.000 1.000 0.030 0.171
Gifted room (70%+) 7617 0.000 1.000 0.049 0.216
Vintage 7617 7.000 92.000 39.812 26.370
Class SF 7617 638.000 3616.000 1110.707 688.906
Students per Class 7600 5.000 80.000 24.025 13.238
Students per School 7617 44.000 308.000 190.663 57.653
Grade 2 7617 0.000 1.000 0.214 0.410
Grade 3 7617 0.000 1.000 0.270 0.444
Ethnic 4 7617 0.000 1.000 0.227 0.419
Ethnic 1 7617 0.000 1.000 0.066 0.249
Ethnic 3 7617 0.000 1.000 0.021 0.144
Gender 7614 0.000 1.000 0.512 0.500
Econ 2 7617 0.000 1.000 0.405 0.491
Socio 1 7617 0.000 1.000 0.030 0.172
Socio 3 7617 0.000 1.000 0.288 0.453
Socio 2 7617 0.000 1.000 0.043 0.202
Valid N (listwise) 7379
Figure 37- Descriptive statistics, Seattle Grade Level, Math
HESCHONG MAHONE GROUP February 14, 200280

DAYLIGHTING IN SCHOOLS, RE-ANALYSIS REPORT APPENDICES
7.5 Absenteeism Models
Capistrano Absenteeism Analysis ABS 3 LN Model R^2 0.049
Std. Error Beta t p (Signif) 1.651 0.061
1 (Constant) Classroom characteristics -0.059 0.029
Semi-open classroom Student characteristics -0.056 0.022
Grade 3 -0.042 0.021 Grade 4 0.035 0.017 Gender -0.470 0.042 Ethnic 1 -0.144 0.079 Ethnic 6 -0.223 0.073 Ethnic 2 -0.396 0.198 Ethnic 7 -0.100 0.027 GATE program -0.154 0.027 Lang program 0.213 0.105 Econ 3
School characteristics 0.006 0.001 Vintage 0.000 0.000 School Pop-per 500
School sites -0.105 0.047 Sch 59 -0.150 0.050 Sch 60 0.112 0.047 Sch 62 -0.454 0.081 Sch 64 -0.105 0.044 Sch 67 -0.256 0.085 Sch 70 -0.151 0.052 Sch 74 0.130 0.060 Sch 79 0.092 0.049 Sch 81 0.291 0.051 Sch 82 0.094 0.047 Sch 84 0.182 0.056 Sch 173
Outliers 2.528 0.815 O 49 Dependent Variable: Log of Absence days
-0.026
-0.029 -0.022 0.021
-0.122 -0.019 -0.032 -0.021 -0.040 -0.073 0.059
0.093 0.029
-0.025 -0.036 0.028
-0.094 -0.028 -0.066 -0.034 0.026 0.023 0.067 0.024 0.039
0.032
27.050
-2.025
-2.564 -1.975 2.038
-11.217 -1.823 -3.038 -1.997 -3.777 -5.676 2.026
4.377 2.004
-2.260 -3.017 2.386
-5.585 -2.414 -3.020 -2.909 2.173 1.867 5.703 1.991 3.244
3.102
0.000
0.043
0.010 0.048 0.042 0.000 0.068 0.002 0.046 0.000 0.000 0.043
0.000 0.045
0.024 0.003 0.017 0.000 0.016 0.003 0.004 0.030 0.062 0.000 0.047 0.001
0.002
Figure 38 - Capistrano Absenteeism Model
HESCHONG MAHONE GROUP February 14, 200281
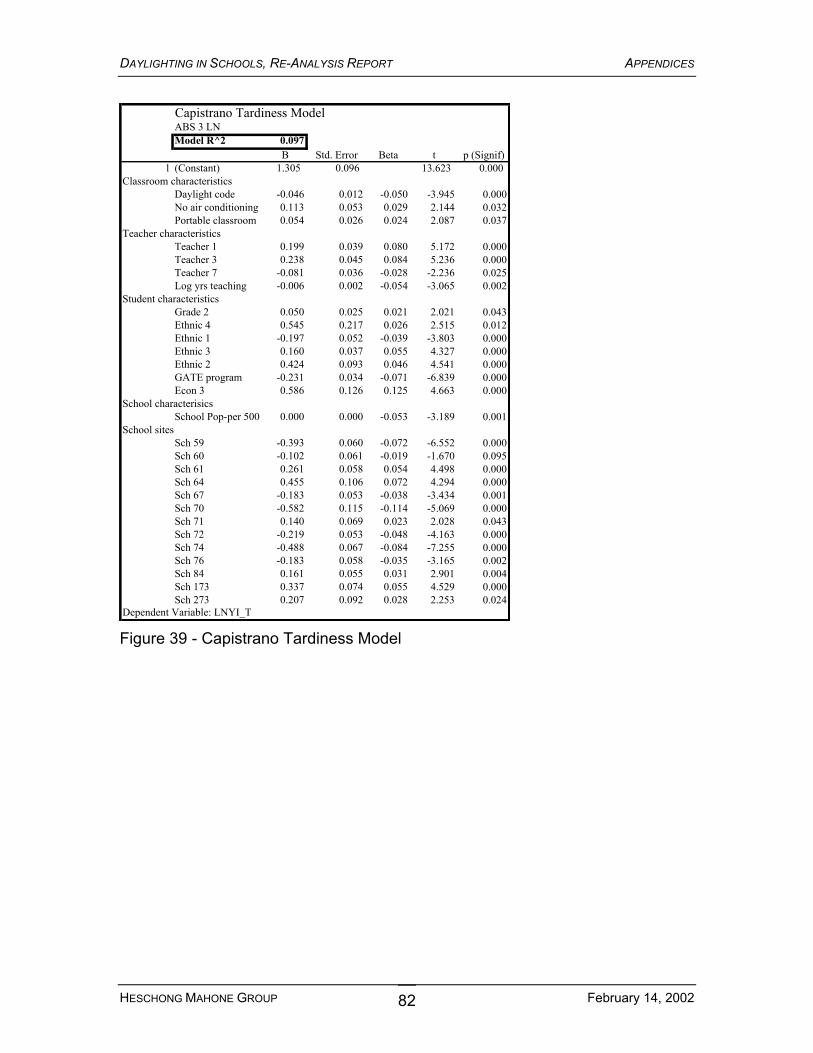
DAYLIGHTING IN SCHOOLS, RE-ANALYSIS REPORT APPENDICES
Capistrano Tardiness Model ABS 3 LN Model R^2 0.097
B Std. Error Beta t p (Signif) 1 (Constant) 1.305 0.096
Classroom characteristics Daylight code -0.046 0.012 No air conditioning 0.113 0.053 Portable classroom 0.054 0.026
Teacher characteristics Teacher 1 0.199 0.039 Teacher 3 0.238 0.045 Teacher 7 -0.081 0.036 Log yrs teaching -0.006 0.002
Student characteristics Grade 2 0.050 0.025 Ethnic 4 0.545 0.217 Ethnic 1 -0.197 0.052 Ethnic 3 0.160 0.037 Ethnic 2 0.424 0.093 GATE program -0.231 0.034 Econ 3 0.586 0.126
School characterisics School Pop-per 500 0.000 0.000
School sites Sch 59 -0.393 0.060 Sch 60 -0.102 0.061 Sch 61 0.261 0.058 Sch 64 0.455 0.106 Sch 67 -0.183 0.053 Sch 70 -0.582 0.115 Sch 71 0.140 0.069 Sch 72 -0.219 0.053 Sch 74 -0.488 0.067 Sch 76 -0.183 0.058 Sch 84 0.161 0.055 Sch 173 0.337 0.074 Sch 273 0.207 0.092
Dependent Variable: LNYI_T
-0.050 0.029 0.024
0.080 0.084
-0.028 -0.054
0.021 0.026
-0.039 0.055 0.046
-0.071 0.125
-0.053
-0.072 -0.019 0.054 0.072
-0.038 -0.114 0.023
-0.048 -0.084 -0.035 0.031 0.055 0.028
13.623
-3.945 2.144 2.087
5.172 5.236
-2.236 -3.065
2.021 2.515
-3.803 4.327 4.541
-6.839 4.663
-3.189
-6.552 -1.670 4.498 4.294
-3.434 -5.069 2.028
-4.163 -7.255 -3.165 2.901 4.529 2.253
0.000
0.000 0.032 0.037
0.000 0.000 0.025 0.002
0.043 0.012 0.000 0.000 0.000 0.000 0.000
0.001
0.000 0.095 0.000 0.000 0.001 0.000 0.043 0.000 0.000 0.002 0.004 0.000 0.024
Figure 39 - Capistrano Tardiness Model
HESCHONG MAHONE GROUP February 14, 200282

DAYLIGHTING IN SCHOOLS, RE-ANALYSIS REPORT APPENDICES
Absenteeism/Tardiness Descriptive Statistics N Minimum Maximum Mean Std. Deviation
Daylight code 8808 0.000 5.000 1.983 1.197 No Air conditioning 8808 0.000 1.000 0.087 0.282 Semi-open classroom 8808 0.000 1.000 0.162 0.369 Portable classroom 8808 0.000 1.000 0.403 0.491 Modular classroom 8808 0.000 1.000 0.101 0.302 Teacher 1 8808 0.000 1.000 0.260 0.439 Teacher 2 8808 0.000 1.000 0.152 0.359 Teacher 3 8808 0.000 1.000 0.180 0.384 Teacher 4 8808 0.000 1.000 0.052 0.222 Teacher 6 8808 0.000 1.000 0.099 0.299 Teacher 5 8808 0.000 1.000 0.057 0.232 Teacher 7 8808 0.000 1.000 0.165 0.371 Log yrs teaching 8808 0.000 42.000 6.315 9.219 School Pop-per 500 8808 404.000 1518.000 882.632 201.494 Classroom Pop 8808 6.000 34.000 23.422 5.934 Grade 2 8808 0.000 1.000 0.285 0.451 Grade 3 8808 0.000 1.000 0.237 0.425 Grade 4 8808 0.000 1.000 0.241 0.428 Vintage 8808 2.000 64.000 18.518 14.090 Gender 8808 0.000 1.000 0.509 0.500 Ethnic 4 8808 0.000 1.000 0.003 0.051 Ethnic 1 8808 0.000 1.000 0.049 0.216 Ethnic 6 8808 0.000 1.000 0.012 0.111 Ethnic 3 8808 0.000 1.000 0.168 0.374 Ethnic 2 8808 0.000 1.000 0.014 0.119 Ethnic 7 8808 0.000 1.000 0.002 0.044 GATE program 8808 0.000 1.000 0.130 0.336 Lang program 8808 0.000 1.000 0.190 0.392 Econ 3 8808 0.000 1.000 0.178 0.232 Sch 59 8808 0.000 1.000 0.041 0.199 Sch 60 8808 0.000 1.000 0.042 0.201 Sch 61 8808 0.000 1.000 0.054 0.226 Sch 62 8808 0.000 1.000 0.047 0.211 Sch 64 8808 0.000 1.000 0.031 0.173 Sch 67 8808 0.000 1.000 0.053 0.224 Sch 69 8808 0.000 1.000 0.061 0.240 Sch 70 8808 0.000 1.000 0.048 0.214 Sch 71 8808 0.000 1.000 0.034 0.181 Sch 72 8808 0.000 1.000 0.059 0.236 Sch 74 8808 0.000 1.000 0.036 0.187 Sch 85 8808 0.000 1.000 0.046 0.210 Sch 86 8808 0.000 1.000 0.052 0.221 Sch 87 8808 0.000 1.000 0.053 0.224 Sch 88 8808 0.000 1.000 0.028 0.166 Sch 81 8808 0.000 1.000 0.048 0.213 Sch 82 8808 0.000 1.000 0.038 0.191 Sch 84 8808 0.000 1.000 0.047 0.212 Sch 173 8808 0.000 1.000 0.033 0.179 Sch 273 8808 0.000 1.000 0.022 0.148 O 16 8808 0.000 1.000 0.000 0.011 O 17 8808 0.000 1.000 0.000 0.011 O 15 8808 0.000 1.000 0.000 0.011 O 50 8808 0.000 1.000 0.000 0.011 Valid N (listwise) 8808
Figure 40 - Capistrano Absenteeism/Tardiness Descriptive Statistics
HESCHONG MAHONE GROUP February 14, 200283