Embed Size (px)
Citation preview

06-59
Copyright © 2006 Francesca Gino, Gary Pisano, Michael R. Sorell, Mark Szigety
Working papers are in draft form. This working paper is distributed for purposes of comment and discussion only. It may not be reproduced without permission of the copyright holder. Copies of working papers are available from the author.
R&D Portfolio Strategy, Diversification And Performance: An Information Perspective Francesca Gino Gary Pisano Michael R. Sorell Mark Szigety


1
R&D PORTFOLIO STRATEGY, DIVERSIFICATION AND PERFORMANCE:
AN INFORMATION PERSPECTIVE
Francesca Gino Harvard Business School
Morgan Hall 412 Soldiers Field Road
Boston, MA [email protected]
Gary Pisano
Harvard Business School Morgan Hall 417
Soldiers Field Road Boston, MA
Michael R. Sorell Harvard Business School
Baker Library/Bloomberg Center, Suite 130 Soldiers Field Road
Boston, MA [email protected]
Mark Szigety Harvard Business School
Morgan Hall 442B Soldiers Field Road
Boston, MA [email protected]
Draft: 7 June 2006
The authors gratefully acknowledge the financial support from the Harvard Business School Division of
Faculty Research and Development. We are especially grateful to Lee Fleming, Robert Huckman, Dan
Snow and James Zeitler for their insightful feedback on earlier drafts. Please address correspondence by
email to [email protected].

2
ABSTRACT
A critical element of a firm’s technology strategy concerns the allocation of R&D resources across
distinct technologies and product markets. Yet, beyond the idea of economies of scope, there is little
predictive theory about how the extent and specific directions of R&D diversification may influence R&D
performance. In this paper, we take an information-based approach to the problem. Following others, we
view R&D as an information-processing activity geared toward technical problem-solving and R&D
capabilities as residing in the firm’s specific information-processing routines. We define relatedness of
R&D fields in terms of similarities or differences in information processing problems faced by decision-
makers in the firm. Projects with similar information processing problems are characterized as being
within the same “information regime.” Using project-level data from the pharmaceutical industry, we
explore two questions: 1) Do firms tend to focus their R&D activities within similar information
regimes? 2) Are there performance benefits of such focus? We find evidence that firms diversify their
R&D projects portfolios across different information regimes. We also find that there are performance
costs of such diversification.
Keywords: Information regimes; Technological Diversification; Focus; R&D; Project Portfolio Management

3
R&D PORTFOLIO STRATEGY, DIVERSIFICATION AND PERFORMANCE:
AN INFORMATION PERSPECTIVE
I. INTRODUCTION
Decisions about how much to diversify an R&D portfolio and the specific areas in which to
pursue projects are fundamental to a firm’s R&D strategy. There is some evidence that larger firms
diversify their R&D portfolios across a fairly broad range of technologies (Grandstrand, 1998). And, there
is evidence from a study of the pharmaceutical industry that such diversification can enhance research
productivity through economies of scope (Henderson and Cockburn, 1996).1 Firms are generally advised
to pursue projects within “related” fields in order to exploit spillovers and economies of scope in R&D.
Most previous theoretical and empirical work on this topic has focused on technological
relatedness as the driving mechanism behind scope economies. The concept of technological relatedness
raises three problems, however. First, relatedness is not a well defined construct theoretically. Two
technologies can be simultaneously related and unrelated in many ways. For instance, semiconductors and
software are related in the sense that they are both complementary inputs into the design of computer
systems; on the other hand, one requires deep understanding of solid state physics, materials science, and
electrical engineering while the other is entirely about software engineering. Should we classify these as
related or unrelated? Second, relatedness is only useful as a way to predict R&D portfolio performance if
we have some way to tie the definition back to organizational competences. We need some way to
characterize technologies in terms of the particular organizational competences they require. More
specifically, when we talk about “spillovers”, we need to be able to say what exactly spills over. Finally,
perhaps as a result of the above two issues, empirical work on relatedness is hampered by ambiguity in
measurement.
1 Economies of scope exist when the cost of joint production of two or more outputs is less than the cost of
producing each output separately (Teece, 1980).

4
In this paper, we explore the issue of R&D portfolio diversification and relatedness through the
lens of information-processing. Following others (e.g., Marquis, 1982; Allen, 1977; Freeman, 1982;
Clark and Fujimoto, 1991; Gino and Pisano, 2005; Krishnan et al., 1997), we view R&D as an
information-processing activity. Investments in R&D generate information about promising technical
solutions to given problems. From this perspective, individual R&D projects are repositories of
information that are updated through experimentation and learning. As information accumulates, the
uncertainty regarding the prospects of a given project recedes (Krishnan et al., 1997). While
experimentation “adds” information to projects (and thus reduces uncertainty), the rate at which this
process occurs varies across technologies due to differences in the underlying strength of scientific
knowledge, the availability of good causal models, and the accumulation of prior empirical experience
(Gino and Pisano, 2005). At one end of the spectrum are technologies in which uncertainty can be
reduced relatively rapidly through early experimentation. In these contexts, experiments are “highly
productive” in that they generate a significant amount of information that enables the accurate
anticipation of future problems and the prediction of project prospects. We refer to such technologies as
“informationally rich.” At the other end of the extreme, we can think of “informationally poor”
technologies in which experimentation generates noisy information. As a result, information accumulates
(and uncertainty recedes) slowly during the development process. Projects which have similar
informational characteristics are said to reside in the same “information regime.”
We posit that information regimes are important because they significantly shape the managerial
challenges of R&D portfolio and project management. Our hypothesis is that since organizational
capabilities in R&D are concerned heavily with the management of uncertainty and risk, they tend to be
specific to certain kinds of information regimes. If this is true, we would expect to see two possible
patterns of behavior. First, firms would presumably focus their R&D efforts on projects which reside in
similar information regimes. Second, we would expect significant performance benefits from such focus.
We examine these questions with project-level data from the pharmaceutical industry. Our
analysis reveals evidence that individual firms diversify their portfolios across different information

5
regimes. That is, information ‘relatedness’ appears to play no role in patterns of diversification.
However, we find evidence that such strategy is costly to performance. Indeed, our results show that
project performance is enhanced by undertaking projects in informationally similar or related areas.
The rest of the paper proceeds as follows. In section II we review the literature on R&D
diversification. Section III develops specific hypotheses relating project information content to firms’
R&D strategies. Section IV presents the data, method, and main econometric results. Concluding remarks
and implications for our main findings are offered in Section V.
II. DIVERSIFICATION IN R&D PROJECTS PORTFOLIO
There is an extensive body of research investigating the patterns of technological diversification
and the consequences of such diversification for performance. Despite the intuitive appeal of such
concepts as focus and core competences, the empirical evidence suggests a reasonably high degree of
R&D portfolio diversification across technologies at the firm level. One form of such technological
diversification involves companies pursuing R&D in a set of component technologies that constitute a
complementary set of inputs for a given end market. Evidence of such diversification has been
documented by Gambardella and Torrisi (1998) who found that in the electronics industry, firms’
technological diversification is broader than their product diversification. Similar finding are reported by
Patel and Pavitt (1997) in their study of large multinationals. A second form of technological
diversification is associated with a strategy of diversification across market segments. Prior research has
provided evidence of significant diversification across product technology classes. For instance,
Henderson and Cockburn (1996) found that large pharmaceutical firms typically have R&D programs in
10-15 therapeutic markets (e.g. cardiovascular, cancer, neurology, etc.).
The rationale for technology diversification is generally posed in terms of scope economies or
spillovers between technological categories. Theoretically, if technology A and technology B share some
common underlying knowledge base or technical skills, a firm pursuing projects in both A and B can reap
spillovers between the categories that a firm pursuing only one of these can not. Henderson and Cockburn

6
(1996) found that such economies of scope have a positive influence on research productivity in
pharmaceuticals. A related line of research has suggested that product market diversification based on
similarities or “relatedness” of R&D can have a positive influence on competitive performance
(Silverman, 1999). While not measured directly, economies of scope and technological spillovers are the
mechanisms presumed to be driving this competitive advantage.
One of the major challenges in this line of research is to measure technological diversification,
relatedness and spillovers that may exist in an R&D portfolio. The most common approach, empirically,
is to use some type of index based on patent data. For instance, in order to measure technological
diversification at the firm level, Gambardella and Torrisi (1998) utilize the number of firm patents in a
certain number of sectors.2 Zander (1997) measures technological diversification by an entropy measure
which considers the technologies in which a firm is active (through the share of US patents accounted for
by those technologies) and the technological activities across the technologies. Relatedness among
technological fields has been measured by the co-occurrence of International Patent Classification (IPC)
codes assigned to individual patents3 (Breschi et al. , 2003) or by looking at the proximity within the
Standard Industrial Classification (SIC) system (e.g., Montgomery and Wernerfelt, 1988). Finally, as in
Henderson and Cockburn (1996), patent classification has been also used to identify potential scope
economies between R&D categories.
2 In particular, they measure technological diversification in the electronic industry by the Herfindhal index of a
company’s total number of patents in five sectors (i.e., computers, telecommunications equipment, electronic
components, other electronics and non-electronic technologies) in the period 1984-1991.
3 The measure for a firm’s technological diversification thus depends on the links and distance among technological
fields. Patent application in the same field over the years indicates an accumulation of technological knowledge and
an advancement of the firm on the same technological trajectory. Whenever multiple codes exist in the same patent,
technological relatedness can be defined based on whether additional IPC codes are equal to or different from the
primary IPC code.

7
If one wants to make a spillover argument, it is important to identify exactly what spills over or
the nature of the common underlying assets that makes two categories related. The use of patents, or any
other indicator of technological relatedness for that matter, presumes that the critical underlying drivers of
scope economies and spillovers are, in fact, knowledge and competences about how to solve technical
problems. So, for instance, the presumption would be that R&D in cardiovascular drugs aids R&D in
inflammation drugs because the two categories share some common biology (that makes discovery in one
area applicable to the other). The existing evidence suggests that technological relatedness matters
(Henderson and Cockburn, 1996). Nevertheless, this does not preclude the possibility that other types of
organizational skills and capabilities may be at play in the process, and thus other forms of spillover may
be important.
In the context of R&D, the ability to manage projects—specifically embodied in such decisions
as project selection, resource allocation, project termination, and portfolio management—is a critical
driver of competitive performance (Clark and Wheelwright, 1995). Indeed, a poor ability to manage R&D
projects may likely result in projects’ failures which are often very costly to a firm. For instance, in the
pharmaceutical industry, a failure in Phase III drug development corresponds to an average decline in
firm value of $551.9 million (Girotra et al., 2006). Therefore, relatedness that drives performance may not
only depend on technological relatedness but also on the relatedness of the management problems faced
by the firm on other projects. Focusing purely on technological relatedness, we argue, obscures the
possibility that two projects can be related from a management capabilities point of view. Such
management capabilities, while utilizing technological capabilities, may hinge much more critically on a
generalized set of information processing routines. In the next section, we develop a framework for
considering relatedness in terms of the informational characteristics of R&D projects.
III. AN INFORMATION-BASED VIEW OF R&D AND R&D COMPETENCES
Research in the organization theory literature has long suggested that a key function of an
organization is to process information (Galbraith, 1973; 1977). Specifically, this literature has conjectured

8
that different sources of uncertainty drive different information processing requirements, and these
requirements in turn should influence organizational design (Tushman and Nadler, 1978). The
information processing lens has also been used in the literature on R&D management (see, for instance,
Marquis, 1982; Allen, 1977; Freeman, 1982; and Clark and Fujimoto, 1991). According to this
perspective: “[P]roduct development is a process by which an organization transforms data on market
opportunities and technical possibilities into information assets for commercial production. During the
development process, these information assets are created, screened, stored, combined, decomposed, and
transferred among various media, including human brains, paper, computer memory, software, and
physical materials. Ultimately, they are articulated as detailed product and process designs stored in blue-
prints and computer-aided design data bases and eventually deployed in production processes on the
factory floor” (Clark and Fujimoto, 1991: 21).
This perspective highlights two critical features of the R&D process upon which we base our
analysis. First, the successive steps of the R&D process can be viewed as “adding” information to
product or process in development. Each experiment or test, for instance, generates information which
becomes part of the information set of projects and reduces uncertainty about their potential prospects.
Second, R&D capabilities can be viewed specifically as those organizational routines for generating,
screening, interpreting, and ultimately acting upon information. Using these two features, we develop a
set of hypotheses regarding the patterns and performance impact of R&D diversification.
III.1 R&D AS “ADDING INFORMATION”
At any point in the process, we can think of an R&D project as containing a specific information
set. At the outset of a project, this information set may be relatively sparse. For instance, the firm may
have some crude information about the market and customer requirements, and it may have some basic
technical information (acquired from previous projects) about the feasibility of various known
technological options. R&D can indeed be viewed as a series of problem-solving cycles, which use
different methods such as computer simulations, laboratory experiments, prototype tests, and market

9
research to produce or acquire data. Data generated in each cycle are then transformed into information
via a process of interpretation, which, in turn, reduces the uncertainty about the prospects of the project in
development.4 Thus, from this perspective, individual R&D projects are repositories of information that
are updated through experimentation and learning.
By the time a product has reached the end of its development, the firm has relatively complete
information about the product’s design (Clark and Fujimoto, 1991). However, the relationship between
R&D effort (investment) and information content may vary across projects due to structural differences in
the underlying knowledge bases. Gino and Pisano (2005) use the term “information regime” to describe
the relationship between experimentation effort and the rate of decline in uncertainty over the
development cycle. While experimentation “adds” information to projects and reduces uncertainty, the
rate at which this process occurs varies across technologies due to differences in underlying scientific
knowledge, the availability of predictive heuristics, and the accumulation of prior empirical knowledge.
Technologies sharing a similar relationship between experimentation effort and uncertainty reduction are
said to be in the same information regime.
Consider the following illustrative example. In the design of a modern jetliner, an extensive
amount of design uncertainty can be reduced relatively early in the development process through
computer aided simulation. The construction and testing of “virtual prototypes” enables companies like
Boeing to explore a range of design alternatives (e.g., wing shapes, body profiles) and home-in on the
most promising approaches without the costs (and time) of building and testing physical prototypes.
These virtual experiments are productive (in an information sense) because of the availability of highly
reliable models (based on aerodynamic theory and heuristics accumulated over decades of design
experience) that enable a tight mapping between experimental observations and actual future
performance. At the other end of the extreme, we can think of contexts like movies where no such
4 We define information in entropic terms, following the literature on the theory of communications and information
(Shannon and Weaver, 1949): information is equivalent to a reduction in uncertainty.

10
predictive models exist. There is, for instance, no “formula” for deciding whether a script will lead to
blockbuster hit (DeVany, 2004). And, it is impossible to prototype a film in any meaningful way. As a
result, information enabling prediction and project sorting is not available.
Following their framework (Gino and Pisano, 2005), we distinguish between informationally rich
technologies (like aircraft), in which experimentation generates a significant amount of high quality
(predictive) information early in the development process, and informationally poor technologies (like
movies), in which information accumulates slowly. In essence, in informationally rich regimes, the
marginal rate of uncertainty reduction is high relatively early in the development process, while in
informationally poor regimes it is low in the earlier phases of the project. Projects characterized by
similar marginal rates of uncertainty reduction belong to the same “information regime.”
III.2 R&D CAPABILITIES AS INFORMATION PROCESSING
Much of the theorizing in strategy over the past decade has focused on the role of organizational
capabilities (see, for instance, Prahalad and Hamel, 1990; Teece and Pisano, 1994; Dosi, Nelson and
Winter, 2000) in shaping competitive strategies and performance. From a resource-based and capability-
based perspective, diversification of R&D leverages common organizational resources, skills, or
capabilities and it is likely to lead to better outcomes than “unrelated” diversification.
What exactly these capabilities are, and how they can be identified or characterized is still not
well understood. The information-based approach to R&D looks at a specific set of an organization’s
capabilities, R&D capabilities, and suggests a way to define them: R&D capabilities are embedded in an
organization’s routines for acquiring, generating, storing, retrieving, interpreting, and transmitting
information for the purposes of problem-solving. Based on this definition, we propose that common
information processing routines play a critical role in determining the performance implications of R&D
diversification. More specifically, projects that share information processing routines might be expected
to perform better than projects that do not.

11
Different organizational capabilities, we argue, are required to manage projects in different
information regimes. Managing projects in informationally poor regimes requires management
capabilities and skills to deal with high levels of persistent risk and uncertainty. Because uncertainty can
not be resolved early in the development process, organizations need capabilities and approaches to
manage and hedge “back-end” risks. They could conduct more parallel projects to hedge risks. They
could adopt, if possible, modular design strategies to facilitate design flexibility. Their development
processes themselves need to be flexible to enable significant mid-course corrections. Portfolio planning
needs to be fluid in order to quickly reallocate resources across projects, and to deal with unexpected
surprises (both positive and negative). And, the managers themselves need to be comfortable with a
relatively high level of ambiguity (uncertainty) and risk taking.
Managing projects in informationally rich regimes requires a very different set of organizational
capabilities. In an informationally rich regime, it is both feasible and desirable to make commitments to
projects relatively early in the development process in order to exploit the plethora of available
information. As a result, project management and portfolio management processes need to be structured
around the early selection of projects early in the development cycle. Management attention should be
focused on these early decision points, and on committing appropriate resources to “good prospects”
while ruthlessly terminating less attractive project opportunities. Here, management needs to be
comfortable in making hard decisions early, and management review processes need to be highly
disciplined. In essence, the important events happen early in the life of projects belonging to an
informationally rich regime, while they tend to happen late for projects belonging to an informationally
poor regime.
Information-processing capabilities are embodied in routines, expertise and skills (Nelson and
Winter, 1982). If organizations had infinite cognitive capacity and infinitely elastic organizational
capabilities, they could theoretically select optimal routines for each project based on that project’s
unique information requirements. Empirical evidence, however, suggests that such capacity and elasticity
is likely to be extremely rare. Previous studies of new product development processes reveal that firms

12
tend to have dominant approaches for executing and managing their projects (Clark and Fujimoto, 1991;
Iansiti, 1998; Pisano, 1997). That is, firms do not match each project to an optimal set of routines, but
tend to deploy similar routines across projects. These findings are highly consistent with behavioral and
evolutionary theories of the firm (Cyert and March, 1963; Nelson and Winter, 1982).
There are likely to be many reasons for such homogeneity in project management routines. Often,
within a firm there are organizational processes at work that lead to “inertia” (Hannan and Freeman,
1984) or “inflexibility” (Weiss and Ilgen, 1985; Gersick and Hackman, 1990). Thus, organizations tend to
do what they are already doing or what they have been doing in the past. In addition, a persistent process
of accumulation of competences may often generate lock-in effects and competence traps (Henderson and
Clark, 1990). We posit along these lines that organizations develop information processing routines
biased (favorably) toward specific information regimes. That is, organizations tend to have a dominant
way of dealing with project uncertainty and information processing that is specialized to a particular
information regime (e.g. poor or rich). To the extent that these processes are specialized, they may
influence decisions about R&D diversification and have important performance implications.
The above discussion leads us to the following two hypotheses:
• Hypothesis 1: Firms are more likely to diversify their R&D portfolios into product areas that occupy
similar information regimes.
• Hypothesis 2: The performance of projects in similar information regimes is likely to be higher than
the performance of projects that are in different information regimes.
We test these hypotheses using a large sample of detailed project-level data from the
pharmaceutical industry. We present our data and methodology next.
IV. METHODOLOGY
In order to test our hypotheses, we used data from the pharmaceutical industry. The
pharmaceutical industry is an ideal setting in which to investigate these issues for three reasons. First,
there is ample publicly available data on R&D projects entering and terminating clinical trials. Second,

13
because of the diversity of underlying biomedical and scientific knowledge for different diseases (e.g.
cancer, diabetes, etc.), we would expect the pharmaceutical industry to be characterized by a high degree
of variability in information regimes across product areas. Third, the clinical trial process is largely one
of generating information about the safety and efficacy of drug candidates. Moreover, this process occurs
through a relatively structured and standardized process due to regulatory reasons.
Clinical trials are required by the Food and Drug Administration (FDA) in order to obtain
marketing approval. There are three main phases of clinical trials. Phase I studies assess the drug’s safety.
The safety of the drug is further examined in Phase II, which also assesses the effectiveness of the drug in
the targeted patient population. Next, in Phase III, studies are conducted to confirm the efficacy of the
drug in a larger patient group. Finally, to obtain marketing approval, a company must compile all of the
drug’s results and information into a marketing application, which it submits to FDA for review and, with
any luck, approval. Based on information generated at various points in the development process,
managers of pharmaceutical companies make decisions about which projects to continue and which to
terminate. These decisions have a significant impact on overall R&D performance.
DATA
Our data, derived from PJB Publications’ PharmaProjects database, describe the clinical
development histories of several thousands pharmaceutical projects from May 1989 through January
2005. Each project observation includes, among other variables, the therapeutic category, the dates of
major events (such as the initiation of clinical trials, final governmental registration, or cessation of
activity), and the firm responsible for development. To restrict the technological heterogeneity of the data
set, we only considered projects involving the development of New Chemical Entities (NCEs).
Therefore, our sample does not include re-formulation projects or biotechnology drugs. Each project in
the sample belonged to one of 15 primary therapeutic categories indicating the medical purposes for
which the drug was being developed: alimentary (gastrointestinal), referred to in this paper as category
(A); blood disorders and clotting, (B); cancer, (K); cardiovascular, (C); dermatology, (D); genitourinary,

14
(G); hormonal, (H); immunology, (I); imaging, (V); anti-infective, (J); musculoskeletal, (M); neurology
(including psychiatry drugs), (N); anti-parasitic, (P); respiratory, (R); and sensory, (S). Since anti-
parasitic contained only two projects, we excluded that therapeutic category from further study.
Our analysis proceeded in three steps. First, we characterized the information content of the 14
remaining therapeutic categories. Second, we examined factors that influence our firms’ diversification
strategies (hypothesis 1). Finally, we examined the performance implications of undertaking projects
outside a firm’s dominant information regime (hypothesis 2).
ANALYSIS 1: Characterizing therapeutic categories by information regime
An information regime, as defined in Gino and Pisano (2005), describes the residual level of
uncertainty regarding technical or commercial prospects of a project at any given point in the
development cycle. The concept is comparative in the sense that the information “richness” (or
“poorness”) of a project can only be judged relative to other projects. In informationally rich regimes,
uncertainty is resolved relatively earlier in the development cycle than in informationally poor regimes. A
project’s information regime influences the likelihood of committing a Type II error late in the
development cycle. As commonly defined, a Type II error is accepting the null hypothesis when the null
hypothesis is false. In our context, a firm that moves a project from one development stage to the next is
hypothesizing that the project will result in an approved drug. If the project subsequently fails, then this
would be evidence of having made a Type II error. That is, later stage failure rates can be used as a
measure of Type II errors. Hence, higher (lower) levels of Type II errors are indicative of a poorer (richer)
information regime. Thus, higher (lower) levels of type II errors correspond to high (low) failures rates or,
equivalently, to low (high) success rates.
One way to identify information regimes is to compare either failure or success rates of projects
at comparable milestones in the development process. In our analyses, we use success rates. In
pharmaceuticals, we can take advantage of the fact that the clinical development process is structured
around reasonably well defined phases (described earlier), and that, before drugs can be marketed, they

15
must be approved by a government agency. By comparing project success probabilities at given phases,
we are able to make inferences about the information regimes of each therapeutic category. To
accomplish this information content identification, we grouped the drugs in our database by the 14
primary therapeutic categories and proceeded to analyze their relative success probabilities conditional on
having started Phase III clinical trials. We coded a drug as a success if it was registered in either the U.S.,
Canada, a European Union member (excluding the 2004 entrants), or Switzerland because of the
similarities in the approval criteria among those countries. We coded a drug as a failure if it had reported
one of the following events: discontinued product, suspended product, or no development.
Many projects were right-censored because they were still in process at the time of our sampling.
To handle this problem, we followed a similar procedure to that used by Danzon et al.’s (2005) study of
pharmaceutical R&D: we coded these observations as a failure only if the time a given drug had spent
since the initiation of Phase III trials exceeded the maximum time to registration in a favored market
among all successes in the same primary therapeutic category. The other right-censored observations were
discarded. The Phase III database, as constructed above, comprised 616 unique drugs.
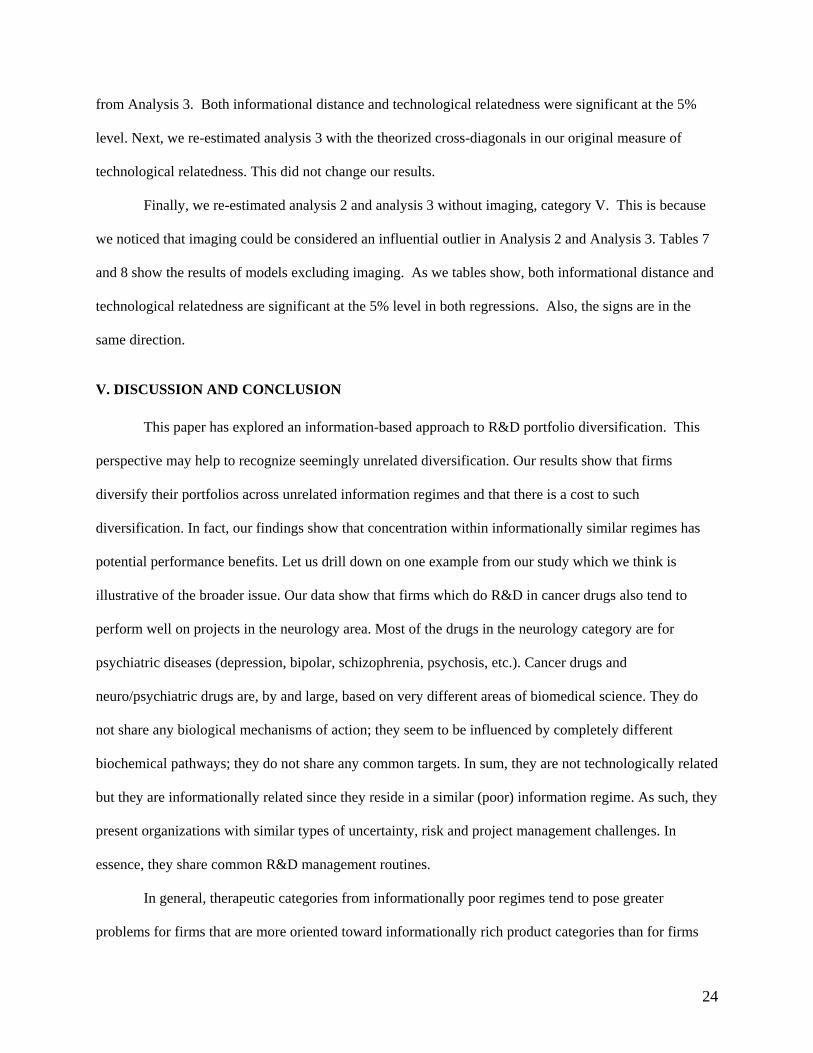
From these 616 drugs, we estimated the success probabilities for drugs entering Phase III clinical
trials (see Table 1). Figure 1 shows a chart of the estimated success probabilities across the 14 therapeutic
categories in our sample. The difference in Phase III success probabilities is noteworthy: at the extremes,
only 3 out of every 10 respiratory drugs entering Phase III trials eventually receive approval, compared to
approximately 8 out of every 10 imaging drugs.5 In our terminology, information rich categories are those
like imaging, sensory and anti-infective, while information poor categories are those like respiratory and
cancer. To test for differences among the success probabilities, we performed two chi square tests (Table
1).6 We first tested the hypothesis that the distribution of success was uniformly distributed across the 14
5 Our estimates of clinical success probabilities are consistent with similar estimates made by Danzon et al. (2005).
6 Category S was excluded because it had fewer than 5 expected successes. The chi-square test requires at least 5
expected successes.

16
categories, i.e. that there were no differences in success among the 14 categories. The results of the chi-
square test indicate that we can reject this hypothesis at the 1% level. We then tested the hypothesis that
the distribution of success was the same as the distribution of drugs. The results of the chi-square test
state that we can reject this at the 5% level. Thus, our results show that there are significant differences
among the therapeutic categories with respect to information regimes.
SUMMARY
Analysis 1 allowed us to differentiate among the information regimes of the 14 therapeutic
categories which are present in our sample. The estimates (i.e., probabilities of success) of the various
therapeutic categories appear to make sense from our information perspective. At one extreme, the
categories with the lowest success rates in Phase III, and thus considered “informationally poor” in our
framework, tend to contain drugs for chronic conditions (cancer, neurological diseases, cardiovascular
disease) where safety and efficacy “signals” can only be assessed over long periods. In addition, in the
case of cancer and neurological diseases, the underlying biology is generally considered relatively poorly
understood, thus limiting the predictive power of animal models. At the other end of the spectrum are
therapeutic categories like imaging drugs and anti-infective drugs where reasonably strong safety and
efficacy signals can be generated from both animal studies and shorter-term human clinical studies.
ANALYSIS 2: The relationship between information content and portfolio composition
We next explored how pharmaceutical firms’ R&D portfolio decisions are related to the
information content of the various therapeutic categories. Since strategic portfolio decisions influence
which projects an organization starts, we shifted our attention further back into the development cycle.
Our sample for analysis 2 consisted of 1,628 drugs candidates which started Phase II during the sample
period. These drugs were developed by 477 firms. We chose Phase II, as opposed to Phase I, initiation
decisions because of the qualitative differences between these two sets of trials. Phase I is concerned
largely with safety, while Phase II begins to shift emphasis to efficacy, under different dosing regimes. In

17
general, failures of drugs in Phase III are due to failures to demonstrate efficacy. Thus, we argue, the
prevalence of Type II errors associated with a given category results from incorrect null hypotheses about
the efficacy, not the safety, of drugs in that category. Therefore, if strategic decisions are made
considering a firm-specific competence for dealing with varying levels of uncertainties about efficacy,
these decisions should be manifested in the portfolio of drugs firms take into the beginning of efficacy
testing—that is, Phase II clinical trials.
Dependent variable. We are interested in the decision of a firm to undertake R&D in a given
therapeutic category. More formally, the dependent variable can be specified as the probability that firm i
will have undertaken R&D in therapeutic category j: Pr(ENTERij=1), where ENTERij=1 if firm i had
undertaken at least one Phase II trial of a drug in therapeutic category k.
Explanatory variables. Hypothesis 1 posits that the probability of a firm having undertaken a
specific therapeutic category is influenced by the information characteristics of the other projects in the
firm’s portfolio. More specifically, we hypothesized that the probability of a firm undertaking R&D in a
specific therapeutic category would be higher if that category were informationally related (i.e.,
informationally similar) to the other projects contained in its portfolio. We thus needed to construct a
measure of information relatedness. To simplify the interpretation of the results, we considered
informational distance instead of relatedness.
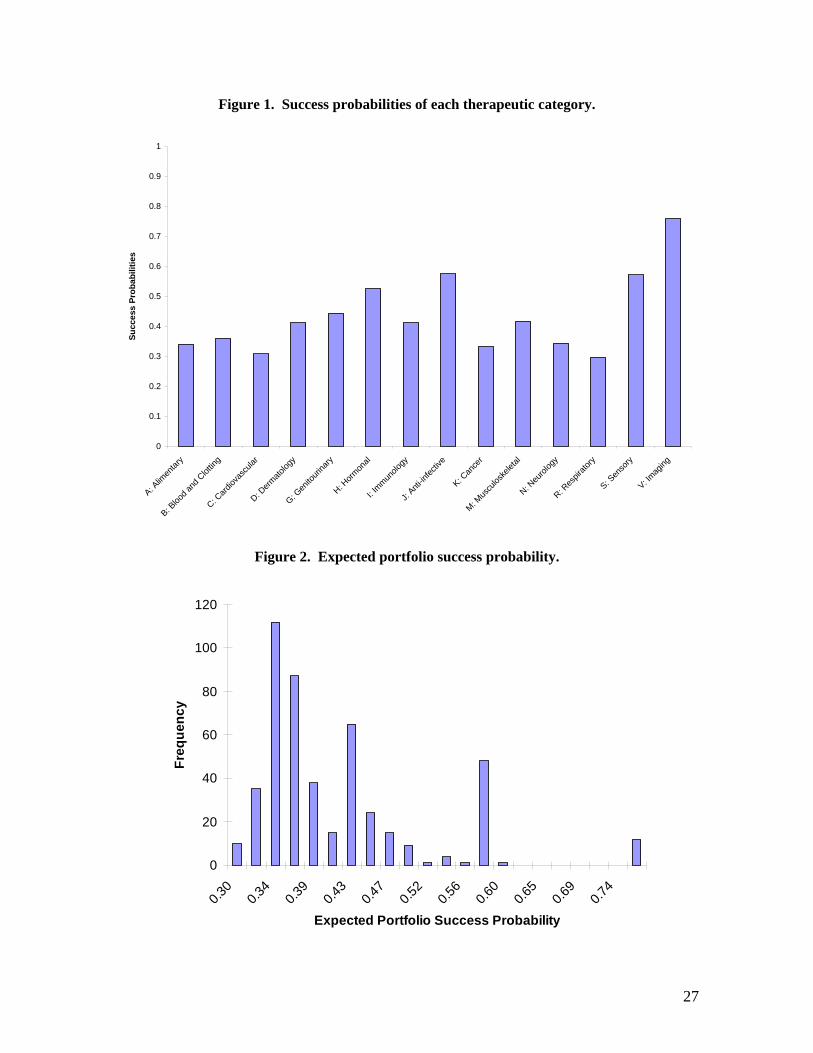
Informational Distance. We first calculated a measure of the firm’s tendency to undertake
projects in either informationally rich or informationally poor categories. Following Danzon et al. (2005),
we first calculated an expected portfolio success probability for each firm, using the estimates of the
success probabilities from our Phase III database.7 This expected portfolio success probability is simply
the weighted average probability of success across the firm’s whole portfolio. It was calculated by taking
the success probability of category j times the percentage of drugs in firm i’s portfolio whose primary
7 Phase III is primarily concerned with efficacy, while Phase I and II are concerned with safety. Because of this fact,
we use Phase III to avoid any confounding effects.

18
therapeutic category is j, summed over all 14 categories: ∑=
N
j iTOT
ijj project
projectp
1. A higher (lower) number
indicates a tendency toward informally rich (poor) categories. Figure 2 shows the distribution of this
statistic across firms in the sample. Note, the expected Phase III success probability for the entire industry
portfolio is .389. Figure 2 depicts a relatively high degree of variance around this industry mean,
suggesting that firms within the industry vary in terms of their R&D projects portfolios and in terms of
the information regimes their R&D projects belong to.
The second step was to measure the informational distance of any given therapeutic category to
the firm’s overall portfolio. To do this, we took the absolute value of the difference between a therapeutic
category’s Phase III success probability and the developing firm’s expected portfolio success probability,
excluding that therapeutic category.8 This measure is a continuous variable bounded between 0 and 1.
Values closer to 0 indicate a relatively close distance between the information regime of a specific
therapeutic category and the firm’s overall portfolio of projects in other categories. Values approaching 1
indicate larger informational distance.
Control variables. We expect that both therapeutic category and firm factors will affect the
decision of a firm to pursue R&D in a specific category. For this reason we included the following control
variables in our model: technological relatedness of the category to the firm’s other categories, and the
size of a firm’s research program. In addition, to control for unobservable differences across categories
(e.g. commercial desirability of the market, etc.), we included a set of category fixed effects.
Technological Relatedness. Previous literature suggests that technological relatedness will
shape firm’s decisions to participate in given areas of R&D (Henderson and Cockburn, 1996). Prior
studies have relied heavily on patents (and patent citations) as a way to infer technological relatedness
between fields of R&D. In this analysis, we take a different approach that enables us to exploit a unique
8 We exclude it since in analysis 2 we are interested in how the decision to enter a therapeutic category is related to
the rest of the firm’s R&D portfolio.

19
feature of our data and the nature of technological relatedness in drugs. In the drug industry, it is very
common for drugs developed in one therapeutic category (e.g. neurology) to find use in another (e.g.
cardiovascular). Previous work by Henderson and Cockburn (1996) empirically documents that
technological relatedness in drugs is manifested largely through such spillovers in the application of
drugs across therapeutic categories. Fortunately, the PharmaProjects database provides information on
the primary therapeutic applications and the other therapeutic applications under investigation for each
drug in the sample. We used this information to create a measure of technological relatedness similar to
that described in Breschi (2005).
Like Breschi (2005), we made no distinction between the primary, secondary or tertiary
categories because “nothing can be said about the direction of knowledge flows” (Breschi, 2005:78).
We first counted every possible joint occurrence (pairing) of therapeutic categories within the database
to get a 14*14 matrix. However, unlike Breschi (2005), we estimated an expected pairing count and
standard deviation based on the pairing data. We used the expected pairing and standard deviation
values to generate standardized z-scores as measures of the relatedness or un-relatedness of pairings (see
Table 2).9 If a particular therapeutic category pairing occurs more (less) often than expected, it is
thought to reflect a high (low) degree of technological relatedness and will have a high (low) z-score. A
score close to zero suggests average technological relatedness. For example, imaging (Category V),
which is informationally rich, appears to have a low technological relatedness to the other 13 categories.
This suggests that there are very few spillovers between imaging and the other therapeutic categories.
On the other hand, there appears to be a lot of spillover (high technological relatedness) between
alimentary and neurology. The high z-score suggests that companies are maximizing this spillover to
their benefit.
Using our estimates of technological relatedness, we calculated a measure similar to
informational distance. We estimated the weighted average of the technological related projects across
the firm’s whole portfolio, excluding the therapeutic category. In particular, the technological 9 Correlation analysis did not provide significant coefficients to determine technological relatedness.

20
relatedness measure was calculated by taking the technological relatedness of category j with category k
times the percentage of drugs in firm i’s portfolio whose primary therapeutic category is j and secondary
category is k, summed over all 13 categories: ∑≠
N
ij iTOT
ijj project
projectp .
Firm Size. Firm size has been found to play a role in R&D diversification (Henderson and
Cockburn, 1996). A measure of firm size is R&D spending. However, given that many of the firms in the
sample were not publicly held during the entire sample period, or did not report R&D (e.g. because they
were not publicly traded in the US), we used the total number of projects in the firm’s portfolio (Phase II
over the 16 years) as a proxy (Firm_Size).
Model Specification. We specified the following probit model to study firm diversification:
Pr(ENTER=1|X) = F(β1INFO_DIST + β2TECH_REL+ β3FIRM_SIZE + βA CAT_A + … + βV CAT_V)
Since we are studying firm diversification, and to get meaningful values for our independent
variables, we excluded from our dataset those firms which had projects in only one therapeutic category.
This left 170 firms in the sample.
RESULTS
The results of the probit model are presented in Table 3. The effect of firm size is in the
expected direction (positive) and is significant. The effect of technological relatedness is also positive
and significant, suggesting that firms tend to diversify their R&D portfolios into product areas that are
technologically related. However, contrary to hypothesis 1, we find a positive and significant effect for
informational distance, suggesting that pharmaceutical firms diversify across unrelated (i.e., distant)
information regimes. This pattern may reflect a deliberate strategy of risk diversification into
informationally unrelated areas. Many large therapeutic areas (like alimentary, neurology, and
cardiovascular) are in information poor regimes, and thus they involve greater uncertainty and risk.
However, despite the high risk, pharmaceutical companies may find it desirable to participate in these
areas either because they are technologically related or because they could lead to large profits. This

21
reasoning is consistent with Danzon’s analysis that “firms appear to be willing to develop drugs with a
lower probability of success with greater sales potential” (Danzon, 2005: 330).
Our hypothesis 2 posits that diversification across unrelated information regimes can harm
performance. We test this hypothesis in our third analysis.
ROBUSTNESS CHECK
To insure the validity of the measures used in Analysis 2, we ran correlation analyses using firm
size, technological relatedness and informational distance. The results of the correlation analyses
suggested that both technological relatedness and informational distance were not correlated with firm
size. However, technological relatedness and informational distance were negatively correlated at -0.55
(see Table 4).
To test for multicollinearity, we ran a regression with both technological relatedness and
informational distance and no other variables. We then estimated the variance inflation factor between the
two variables. The mean VIF was 1.16. Since the value was not significantly greater than 1, we were
sure of no multicollinearity between the variables. We also ran regressions with informational distance
and technological relatedness where one was the dependent variable and the other the independent
variable. The results suggested no instance of multicollinearity.
ANALYSIS 3: Information regime specific competences
In Analysis 3, we turned to the question of whether or not focus in informationally similar
categories confers any performance advantage. For this final analysis, we used our Phase III database of
616 drugs and fit a probit model. Our aim was to see whether increasing informational distance was
associated with decreasing success in Phase III, all other things equal.

22
Dependent Variable. Our measure of performance is the likelihood that a drug, once it enters
Phase III trials, will be approved. Our dependent variable (SUCCESS) is a dummy variable that takes the
value of 1 if the drug was approved and 0 otherwise.10
Independent Variables. Our model includes variables similar to those used in the earlier analysis
of portfolio decisions. However, in order to make correct inferences about the impact of informational
distance on the probability of success, some changes to the independent variables – except firm size –
were needed. First, informational distance now represents the distance from the candidate drug’s primary
category to the expected portfolio success probability of the developing firm, excluding no categories.11
Second, a similar adjustment was made to technological relatedness. To make this adjustment, we
measured the expected pairings based on each individual category. We then averaged the expected
pairings between categories. This gave us a technological relatedness measures based on both primary
categories. Therefore, our measure excluded no categories in the analysis.12
We also included a set of therapeutic category fixed effects to control for any unobservable
differences influencing the likelihood of success across therapeutic categories (e.g .different regulatory
requirements, etc.). The dummy variables in this model {CAT_A … CAT_V} have a different
interpretation. In this model, they represent the baseline likelihood of eventual success given that the drug
candidate is of a certain category.
10 We chose this variable since the success probability measure is the only accurate measure of performance in the
PharmaProjects data-set.
11 In analysis 3, we exclude no categories since we are interested in measuring how the overall informational
distance and technological relatedness of the portfolio impact firm performance.
12 For robustness check, analysis 2 was re-run with this new measure. Both informational distance and technological
relatedness were significant at the 5% level. One could also theorize that the cross diagonals in the first measure of
technological relatedness all have z-scores of 4 or higher. This theorized value was entered for analyses 2 and 3. The
results were the same. The only reason to create a new variable is because of the cross-diagonals. However, the
results of analysis 3 do not change if different values are put in the cross diagonals.

23
Model Specification. We estimated the following probit model:
Pr(SUCCESS=1|X) = F(β1INFO_DIST + β2TECH_REL+ β3FIRM_SIZE + βA CAT_A + … + βV CAT_V)
RESULTS
The results of this model are reported in Table 5. The coefficient for technological relatedness is
negative and significant, suggesting that there are performance costs of R&D diversification into
technologically related areas. In other words, firms are moving into technologically related areas (like
alimentary, neurology, and cardiovascular) at the expense of their overall success probability. As for
informational distance, we find support for hypothesis 2: an increase in informational distance (relative to
the rest of the firm’s portfolio) decreases the likelihood that a drug candidate in Phase III will eventually
be approved. Thus, although firms seem to diversify across informationally unrelated (i.e, distant)
therapeutic categories, such behavior may have a negative impact on their eventual performance
measured as likelihood of success.
ROBUSTNESS CHECK
To insure the validity of the new measures, we ran correlation analysis using firm size,
technological relatedness, and informational distance. The results of the correlation analysis suggested
that both technological relatedness and informational distance were not significantly correlated with firm
size. Technological relatedness and informational distance were negative correlated at of -0.43 (Table 6).
To test for multicollinearity, we ran a regression with both technological relatedness and
informational distance and no other variables. We then estimated the vector inflation factor between the
two variables. The mean VIF was 1.22. Since the value was not significantly greater than 1, we were
sure of no multicollinearity between the variables.
ADDITIONAL ANALYSES FOR ROBUSTNESS
As a robustness check, we ran several regressions with various measures of technological
relatedness and categories. First, we re-estimated analysis 2 with our technological relatedness measure
24
from Analysis 3. Both informational distance and technological relatedness were significant at the 5%
level. Next, we re-estimated analysis 3 with the theorized cross-diagonals in our original measure of
technological relatedness. This did not change our results.
Finally, we re-estimated analysis 2 and analysis 3 without imaging, category V. This is because
we noticed that imaging could be considered an influential outlier in Analysis 2 and Analysis 3. Tables 7
and 8 show the results of models excluding imaging. As we tables show, both informational distance and
technological relatedness are significant at the 5% level in both regressions. Also, the signs are in the
same direction.
V. DISCUSSION AND CONCLUSION
This paper has explored an information-based approach to R&D portfolio diversification. This
perspective may help to recognize seemingly unrelated diversification. Our results show that firms
diversify their portfolios across unrelated information regimes and that there is a cost to such
diversification. In fact, our findings show that concentration within informationally similar regimes has
potential performance benefits. Let us drill down on one example from our study which we think is
illustrative of the broader issue. Our data show that firms which do R&D in cancer drugs also tend to
perform well on projects in the neurology area. Most of the drugs in the neurology category are for
psychiatric diseases (depression, bipolar, schizophrenia, psychosis, etc.). Cancer drugs and
neuro/psychiatric drugs are, by and large, based on very different areas of biomedical science. They do
not share any biological mechanisms of action; they seem to be influenced by completely different
biochemical pathways; they do not share any common targets. In sum, they are not technologically related
but they are informationally related since they reside in a similar (poor) information regime. As such, they
present organizations with similar types of uncertainty, risk and project management challenges. In
essence, they share common R&D management routines.
In general, therapeutic categories from informationally poor regimes tend to pose greater
problems for firms that are more oriented toward informationally rich product categories than for firms

25
focusing on informationally poor categories. This suggest that the organizational routines for dealing with
limited information may be somewhat specialized. Our findings show that firms oriented toward products
in therapeutic categories belonging to a certain information regime (e.g., poor) appear to be at a
disadvantage in doing projects in informationally distant categories (compared to specialists in
informationally similar areas). These results suggest that firms that develop capabilities for dealing with
certain information (and thus a certain level of uncertainty and risk) are not able to “cope” with different
information. The implications of these findings for competitive advantage need to be explored in future
research.
The present study has been limited in many ways, and thus our findings need to be interpreted
with care. These limits, however, suggest fruitful avenues for future work. First, our analysis was limited
to the pharmaceutical industry. Exploration outside of pharmaceuticals, while difficult because of limited
data availability, is needed to more fully validate the generalizability of our findings. Second, our
analysis categorized projects into only 14 fairly broad therapeutic classes. There may be alternative
classification schemes (e.g. classifying projects by target, or more specific disease states). We
experimented with alternative approaches but found that below the level of the broad therapeutic
category, there were many categories with too few Phase III projects to achieve reasonable estimates of
success probabilities. Future research might need to create more customized classification schemes to
strike the right balance between over and under-aggregation. Finally, we used a fairly crude indicator of
information regimes (the Phase III probability of success). If the concept of information regimes is to
become more useful in both research and practice, better measures might be needed.
In this paper, we looked not only at the information side of the projects in question but also at
technological relatedness. There are likely to be many factors that influence real portfolio decisions and
the outcomes of such choices. Future work should explore these forces with both aggregate data and more
detailed organizational data. This is tall undertaking, but could lead to important insights about the
relationship between organizational competences and R&D strategies of firms.

26
Table 1. Number of drugs and success probabilities for each therapeutic category. Category Number of Drugs Success Prob. Success A: Alimentary 50 0.34 17
B: Blood and Clotting 25 0.36 9
C: Cardiovascular 78 0.308 24
D: Dermatology 17 0.412 7
G: Genitourinary 27 0.444 12
H: Hormonal 19 0.526 10
I: Immunology 17 0.412 7
J: Anti-infective 106 0.575 61
K: Cancer 72 0.333 24
M: Musculoskeletal 36 0.417 15
N: Neurology 96 0.344 33
R: Respiratory 37 0.297 11
S: Sensory 7 0.571 4
V: Imaging 29 0.759 22
Total 616
Chi-Square Goodness of Fit Test df=13 Ho: The distribution of success is uniformly distributed across categories p(chi sq=155)<0.000 Chi-Square Goodness of Fit Test df=12 Ho: The Distribution of success is the same as the distribution of drugs p(chi sq=22.1)<0.05
27
Figure 1. Success probabilities of each therapeutic category.
0
0.1
0.2
0.3
0.4
0.5
0.6
0.7
0.8
0.9
1
A: Alim
entar
y
B: Bloo
d and
Clot
ting
C: Card
iovas
cular
D: Derm
atolog
y
G: Gen
itouri
nary
H: Horm
onal
I: Immun
ology
J: Anti
-infec
tive
K: Can
cer
M: Mus
culos
kelet
al
N: Neu
rolog
y
R: Res
pirato
ry
S: Sen
sory
V: Imag
ing
Succ
ess
Prob
abili
ties
Figure 2. Expected portfolio success probability.
0
20
40
60
80
100
120
0.30
0.34
0.39
0.43
0.47
0.52
0.56
0.60
0.65
0.69
0.74
Expected Portfolio Success Probability
Freq
uenc
y

28
Table 2: Technological relatedness between therapeutic categories (Z-scores)
A B C D G H I J K M N R S A B -0.0120 C 1.7862 1.9425 D 1.0043 -0.6375 0.3007 G 0.2225 -0.8720 0.3007 -0.7157 H -0.5593 -0.9502 -0.8720 -0.8720 -0.7157 I 0.3789 -0.5593 -0.4811 0.3007 -0.8720 -0.7939 J -0.2466 -0.8720 -0.8720 0.0662 -0.7157 -1.0284 1.3171 K 0.9262 0.0662 0.2225 1.1607 0.8480 -0.4811 2.2553 1.6298 M 1.8644 -0.6375 -0.0902 1.4734 -0.0902 -0.6375 1.1607 -0.6375 0.8480 N 3.5062 1.0043 2.1771 0.0662 0.1443 -0.7157 0.1443 -0.4811 0.7698 2.5680 R 1.4734 0.2225 0.8480 1.0043 -0.6375 -0.9502 -0.2466 -0.7939 -0.6375 1.4734 1.1607 S -0.0902 -0.7939 -0.0120 -0.1684 -0.7939 -0.9502 -0.7157 -0.8720 -0.0902 -0.4029 -0.4029 -0.4029 V -0.8720 -0.8720 -0.7157 -1.0284 -0.9502 -0.9502 -1.0284 -0.4811 -0.7157 -1.0284 -0.7939 -0.8720 -0.9502 * Values represent standardized z-scores based on all project pairings in PharmaProjects dataset.

29
Table 3. Diversification model.13
Probit Marginal Effects Informational Distance 1.8694*** 0.5369*** (0.6343) (0.1824) Technological Relatedness 0.2109*** 0.0605*** (0.0558) (0.0160) Firm Size 0.0455*** 0.0130*** (0.0045) (0.0013) Category Fixed Effects Yes Yes Robust Standard Errors Yes Yes Observations 2380 2380 Categories 14 13 Wald chi2(17) &(16) 598.02 291.57 Prob > chi2 0 0 Psuedo R-Squared 0.1994
Note: Dependent variable represents the probability that firm I will have undertake R&D in therapeutic category J if firm I had undertaken at least one Phase II trial of a drug in therapeutic category J. Category fixed effects are not reported.
Table 4. Correlation analysis and variance inflation factor analysis.
Correlation Analysis
Informational Distance Technological Relatedness
Firm Size
Informational Distance 1
Technological Relatedness -0.5544 1
Firm Size -0.0299 0.0387 1
Variance Inflation Factor
Analysis Variable VIF 1/VIF
Informational distance 1.16 0.859073
Technological Relatedness 1.16 0.859073
Mean VIF 1.16
13 For all the models presented in the tables we have the following legend: * Significantly different from zero at the 10% level; ** Significantly different from zero at 5% level; *** Significantly different from zero at the 1% level.

30
Table 5. Phase III success model.
Probit Marginal Effects
Informational Distance -2.8347** -1.1085** (1.2628) (0.4938) Technological Relatedness -0.0456** -0.0178** (0.0222) (0.0087) Firm Size 0.0043*** 0.0017*** (0.0023) (0.0009) Category Fixed Effects Yes Yes Robust Standard Errors Yes Yes Observations 575 575 Categories 14 13 Wald chi2(17) & (16) 61.94 48.9 Prob > chi2 0 0 Psuedo R-Squared 0.067 Note: Dependent variable represents the probability that a drug, once it enters Phase III will be approved. Category fixed effects are not reported.
Table 6. Correlation analysis and variance inflation factor analysis.
Correlation Analysis
Informational Distance Technological Relatedness
Firm Size
Informational Distance 1
Technological Relatedness -0.4259 1
Firm Size 0.1621 -0.3347 1
Variance Inflation Factor
Analysis Variable VIF 1/VIF
Informational distance 1.22 0.818625
Technological Relatedness 1.22 0.818625
Mean VIF 1.22

31
Table 7. Diversification model excluding category V.
Probit Marginal Effects
Informational Distance 1.7681*** 0.5456*** (0.6464) (0.1992) Technological Relatedness 0.2056*** 0.0634*** (0.0563) (0.0173) Firm Size 0.0497*** 0.0153*** (0.0054) (0.0017) Category Fixed Effects Yes Yes Robust Standard Errors Yes Yes Observations 2210 2210 Categories 13 12 Wald chi2(16) &(15) 528.8 249.2 Prob > chi2 0 0 Psuedo R-Squared 0.2117
Note: Dependent variable represents the probability that firm I will have undertake R&D in therapeutic category J if firm I had undertaken at least one Phase II trial of a drug in therapeutic category J. Category fixed effects are not reported.
Table 8. Phase III model excluding category V.
Probit Marginal Effects Informational Distance -2.7623** -1.0688** (1.3564) (0.5249) Technological Relatedness -0.0460** -0.0178** (0.0226) (0.0087) Firm Size 0.0043* 0.0017* (0.0023) (0.0009) Category Fixed Effects Yes Yes Robust Standard Errors Yes Yes Observations 575 575 Categories 14 13 Wald chi2(16) &(15) 53.36 35.49 Prob > chi2 0 0.0021 Psuedo R-Squared 0.067
Note: Dependent variable represents the probability that a drug, once it enters Phase III will be approved. Category fixed effects are not reported.
32
REFERENCES
Allen Thomas J. 1977. Managing the flow of technology. MIT Press: Cambridge, MA.
Breschi S., Lissoni F., Malerba F. 2003. Knowledge-relatedness in the firm technological diversification.
Research Policy 32: 69-87.
Clark K., Wheelwright S. 1995. Leading Product Development. Free Press: New
York.
Clark K., Fujimoto T. 1991. Product Development Performance. Harvard Business School Press: Boston.
Cyert Richard M., March James G. 1963. A Behavioral Theory of the Firm. Englewood Cliffs, N J:
Prentice-Hall.
Danzon, Patricia M., Nicholson Sean, Pereira Nuno Sousa. 2005. Productivity in pharmaceutical—
biotechnology R&D: the role of experience and alliances. Journal of Health Economics 24: 317-
339.
DeVany A. 2004. Hollywood Economics. Routledge: New York.
Dosi G., Nelson R., Winter S. 2000. The Nature and Dynamics of Organizational Capabilities. Oxford
University Press: Oxford, UK.
Freeman C., 1982. The Economics of Industrial Innovation. MIT Press: Cambridge, MA.
Galbraith J. R. 1973. Designing complex organizations. Addison Wesley: Reading, MA.
Galbraith J. R. 1977. Organization design. Addison Wesley: Reading, MA.
Gambardella A., Torrisi S. 1998. Does technological convergence imply convergence in markets?
Evidence from the electronics industry. Research Policy 27: 445-463.
Granstrand O. 1998. Towards a theory of the technology-based firm. Research Policy 27: 465-489.
Gersick, C. J., J. R. Hackman. 1990. Habitual routines in task-performing groups. Organizational
Behavior and Human Decision Processes, 47 (1): 65-97.
Gino Francesca, Pisano Gary. 2005. Holding or Folding? R&D Portfolio Strategy Under Different
Information Regimes. Harvard Business School Working Paper, No. 05-072.

33
Girotra K., C. Terwiesch, K. T. Ulrich. 2006. Valuing R&D Projects in a Portfolio: Evidence from the
Pharmaceutical Industry. Wharton working paper.
Hannan M.T., Freeman J. 1984. Structural inertia and organizational change. American
Sociological Review 49: 149-164.
Henderson R., Clark K. 1990. Architectural Innovation: the reconfiguration of existing product
technologies and the failure of established firms. Administrative Science Quarterly 35: 9-30.
Henderson Rebecca, Cockburn Iain. 1996. Scale - Scope - and Spillovers: The Determinants of Research
Productivity in Drug Discovery. RAND Journal of Economics 27, Spring: 32-59.
Krishnan V., Eppinger S.D., Whitney D.E. 1997. A model-based framework to overlap product
development activities. Management Science 43 (4): 437-451.
Iansiti M. 1998. Technology Integration: Making critical choices in a dynamic world
Harvard Business School Press: Boston.
Marquis, Donald G. 1982. The Anatomy of Successful Innovations. In Readings in the Management of
Innovation, Tushman Micheal L., Moore William L. (eds). Ballinger: Cambridge, MA; 42-50.
Montgomery C. Wernerfelt B. 1988. Diversification, Ricardian rents, and Tobin’s q. Rand Journal of
Economics 19: 623-632.
Nelson R.R., Winter S.G. 1982. An Evolutionary Theory of the Economic Change. Belknap Press:
Cambridge, MA.
Patel P., Pavitt K. 1997. The Technological Competencies of the World’s Largest Firms: Complex and
Path-Dependent, but not much variety. Research Policy 26 (2), May: 141-156.
Pisano Gary. 1997. The Development Factory: Unlocking the Potential of Process Innovation. Harvard
Business School Press: Boston.
Prahalad C.K., Hamel, G. 1990. The core competence of the corporation. Harvard Business Review 68(3):
79-91.
Shannon C.E., Weaver W. 1949. The mathematical theory of communication, University of Illinois
Press: Urbana.

34
Silverman Brian S. 1999. Technological Resources and the Direction of Corporate Diversification:
Toward an Integration of the Resource-Based View and Transaction Cost Economics. Management
Science 45 (8): 1109-1124.
Teece David J. 1980. Economies of Scope and the Scope of the Enterprise. Journal of Economic Behavior
and Organization 1: 223-247.
Teece D.J., Pisano G. 1994. The dynamic capabilites of firms: an introduction. Industrial and Corporate
Change 3 (3): 537-556.
Tushman Michael, Nadler D. 1978. Information Processing as an Integrating Concept in Organization
Design. Academy of Management Review 3: 613-624.
Zander Ivo. 1997. Technological diversification in the multinational corporation – historical evolution and
future prospects. Research Policy 26: 209-227.
Weiss, HM, Ilgen, DR (1985). Routinized behavior in organizations. Journal of. Behavioral Economics,
14: 57-67.