Embed Size (px)
Citation preview

53rd Edison Electric Institute Financial Conference (November 11‒13, 2018)

1
Caution regarding forward-looking statements and Regulation G compliance In this presentation, and from time to time, Entergy Corporation makes certain “forward-looking statements” within the meaning of the Private Securities Litigation Reform Act of 1995. Such forward-looking statements include, among other things, Entergy’s 2018 earnings guidance, its current operational outlook, and other statements of Entergy’s plans, beliefs or expectations included in this presentation. Readers are cautioned not to place undue reliance on these forward-looking statements, which apply only as of the date of this presentation. Except to the extent required by the federal securities laws, Entergy undertakes no obligation to publicly update or revise any forward-looking statements, whether as a result of new information, future events or otherwise.
Forward-looking statements are subject to a number of risks, uncertainties and other factors that could cause actual results to differ materially from those expressed or implied in such forward-looking statements, including (a) those factors discussed elsewhere in this presentation and in Entergy’s most recent Annual Report on Form 10-K, any subsequent Quarterly Reports on Form 10-Q and Entergy’s other reports and filings made under the Securities Exchange Act of 1934; (b) uncertainties associated with (1) rate proceedings, formula rate plans and other cost recovery mechanisms, including the risk that costs may not be recoverable to the extent anticipated by the utilities and (2) implementation of the ratemaking effects of changes in law; (c) uncertainties associated with efforts to remediate the effects of major storms and recover related restoration costs; (d) nuclear plant relicensing, operating and regulatory costs and risks, including any changes resulting from the nuclear crisis in Japan following its catastrophic earthquake and tsunami; (e) changes in decommissioning trust fund values or earnings or in the timing or cost of decommissioning Entergy’s nuclear plant sites; (f) legislative and regulatory actions and risks and uncertainties associated with claims or litigation by or against Entergy and its subsidiaries; (g) risks and uncertainties associated with strategic transactions that Entergy or its subsidiaries may undertake, including the risk that any such transaction may not be completed as and when expected and the risk that the anticipated benefits of the transaction may not be realized; (h) effects of changes in federal, state or local laws and regulations and other governmental actions or policies, including changes in monetary, fiscal, tax, environmental or energy policies; and (i) the effects of technological changes and changes in commodity markets, capital markets or economic conditions, during the periods covered by the forward-looking statements.
This presentation includes the non-GAAP financial measures of UP&O Adjusted EPS; normalized ROE; parent debt to total debt, excluding securitization debt; operational FFO to debt, excluding securitization debt; and operational FFO to debt excluding securitization debt and return of unprotected excess ADIT when describing Entergy’s results of operations and financial performance. We have prepared reconciliations of these financial measures to the most directly comparable GAAP measure, which can be found in the appendix of this presentation. Further information can be found in Entergy’s investor earnings releases, which are posted on our website at www.entergy.com.

2
We Power Life
Customers Employees Communities Owners
Deliver top-quartile
returns
Achieve top-decile
corporate social responsibility performance
Deliver top-quartile customer
satisfaction
Earn top-quartile organizational health score
and top-decile safety
performance

3
Our financial objective
Steady, predictable growth at the Utility…
Earnings growth at our Utility, Parent & Other segment
Dividend growth
…while managing risk
Customer-centric capital plan Progressive regulatory
constructs Disciplined project
management Orderly wind-down of EWC

4
Strategic execution over the past few years
$13B capital investment over the last five years
Major generation projects approved
Transmission expansion Joined MISO Dec. 2013 MTEP 15, 16 and 17
completed AMI under way
Investing in the Utility
Arkansas legislation / E-AR forward test year FRP
E-LA FRP improvements
E-LA business combination
E-MS FRP with forward- looking features
E-TX DCRF and TCRF System Agreement
termination
Constructive regulation
Decisions to close or sell merchant nuclear plants • FitzPatrick sale • Agreements to sell
VY, Pilgrim and Palisades
IPEC license renewal Revenue price risk
reduction Focus on nuclear
operations Employee support
EWC wind-down

Finishing strong at EWC
Pilgrim
Planned shutdown
(2019)
Vermont Yankee
Shutdown (2014)
Planned shutdown
(2020 / 2021)
Indian Point
Planned shutdown
(2022)
Palisades FitzPatrick
Sold (2017)
IP2 in final operating
cycle
Agreement to sell
(targeted 2019)
Agreement to sell
(targeted 2022)
5
Agreement to sell
(targeted 2018)
6
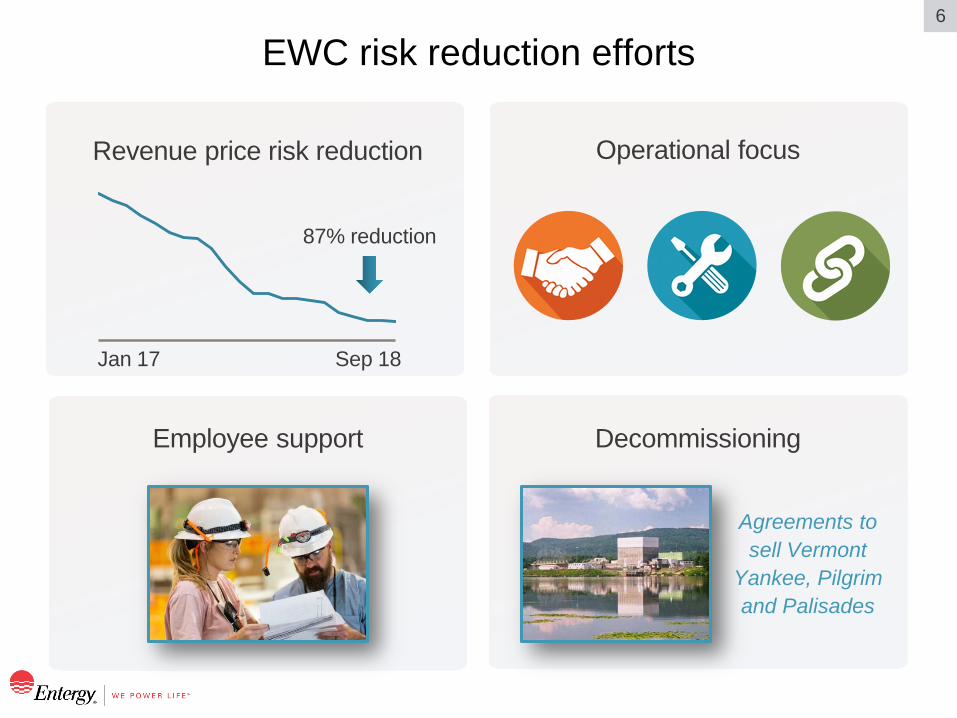
EWC risk reduction efforts
Operational focus
Employee support Decommissioning
Revenue price risk reduction
Agreements to sell Vermont
Yankee, Pilgrim and Palisades
Jan 17 Sep 18
87% reduction

7
Projected Utility rate base
1 Internal estimates based on last-approved rate base adjusted for assumed changes in the major rate base components and includes CWIP; deferred taxes are deducted from rate base for all OpCos, including E-AR
18E 19E 20E 21E
23–24 25–26 27–28 29–30
Projected rate base1; $B

8
~85% ready for execution from a regulatory approval standpoint A clear and robust Utility 2019E–2021E capital plan
Nuclear–$1.5B
Power generation–$3.0B
Transmission–$2.3B
Distribution and utility support–$4.3B
$11.1B
9
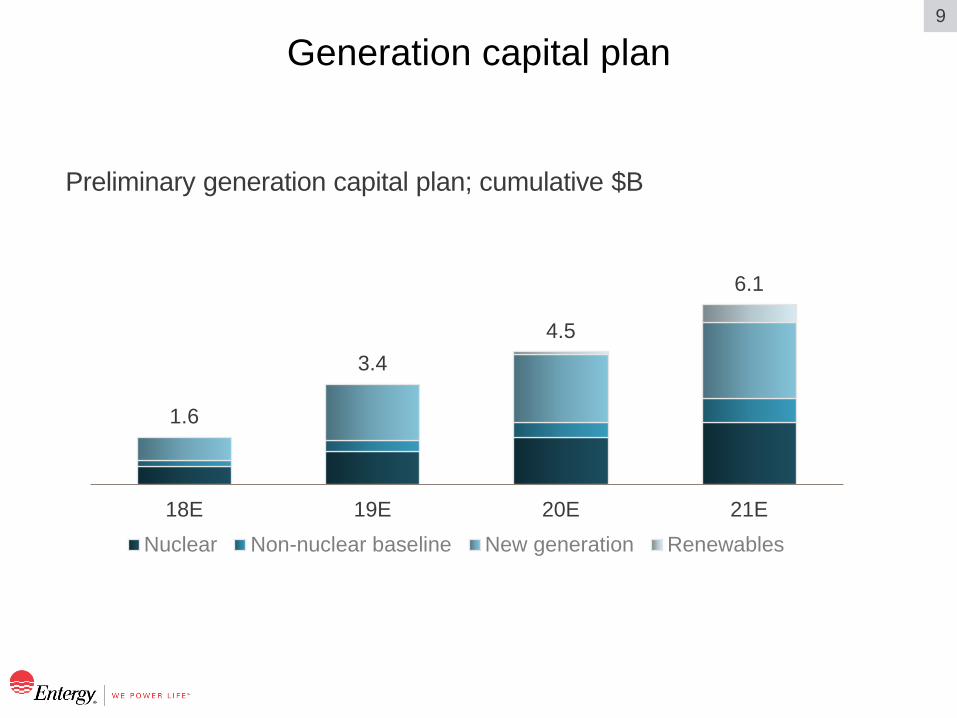
Generation capital plan
Preliminary generation capital plan; cumulative $B
1.6
3.4 4.5
6.1
18E 19E 20E 21ENuclear Non-nuclear baseline New generation Renewables
10
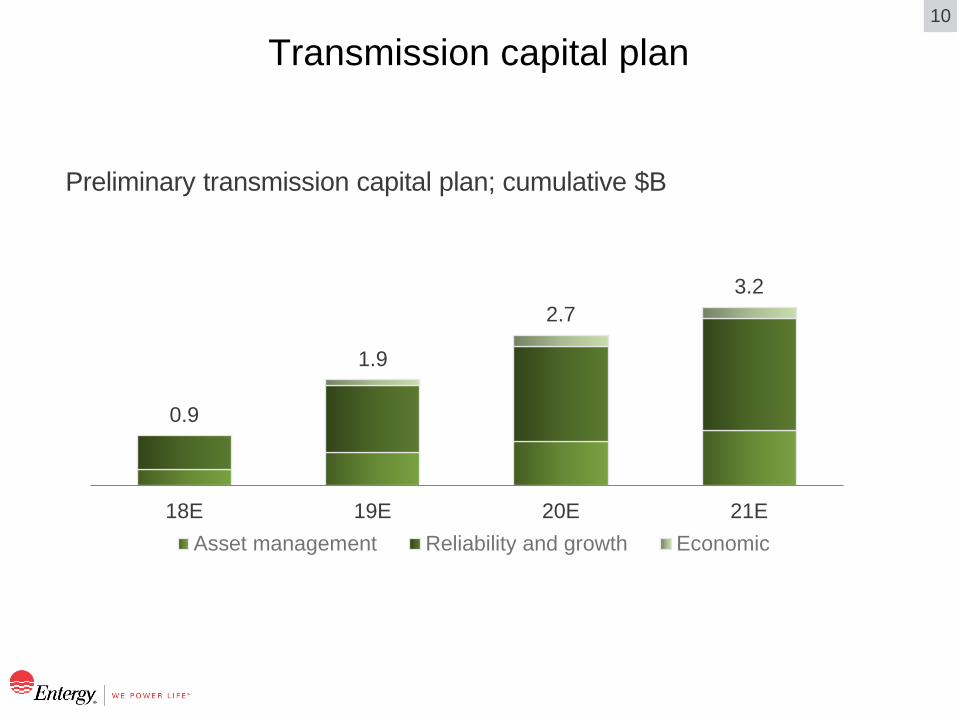
Transmission capital plan
Preliminary transmission capital plan; cumulative $B
0.9
1.9
2.7 3.2
18E 19E 20E 21EAsset management Reliability and growth Economic

11
Distribution and utility support capital plan
Preliminary distribution and utility support capital plan; cumulative $B
1.4
3.0
4.4
5.7
18E 19E 20E 21E
Distribution baseline Utility support Grid modernization

12
Grid modernization
Highlights of AMI
• Latest generation meters
• One of the fastest networks
• Enhanced information
• Tools for tailored customer solutions
• Improved operational efficiency
Next few years, primarily AMI

13
Goal to maintain rate advantage Low customer rates
Source: S&P Global Market Intelligence Regulated Retail Price of Electricity published 7/19/18
2017 average retail price by parent company; ₵ per kWh
ETR 7.58
14
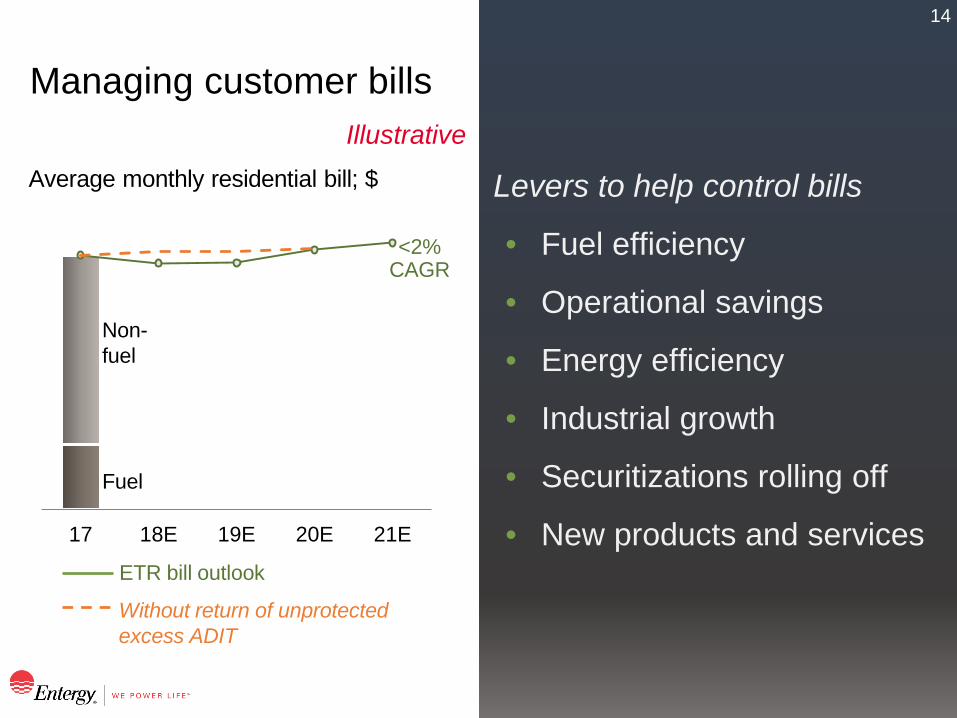
Managing customer bills Illustrative
<2% CAGR
Without return of unprotected excess ADIT
Non- fuel
Fuel
ETR bill outlook
Average monthly residential bill; $ Levers to help control bills
• Fuel efficiency
• Operational savings
• Energy efficiency
• Industrial growth
• Securitizations rolling off
• New products and services 17 18E 19E 20E 21E

15
Chart reflects preliminary 2019E–2021E capital investment, not rate base; capital projects will be reflected in rate base when they are closed to plant; for multi-year projects there will be a timing difference
~90% of capital plan recovered through timely mechanisms Progressive cost recovery mechanisms
Capital plan recovery by mechanism Illustrative
Rate cases
Forward-looking FRPs
Traditional FRPs
Riders
Rate case

16
Investment plan benefits our stakeholders
Enhanced reliability and resiliency
Good-paying jobs/ Workforce development
Catalyst for our region’s economic development
Production cost savings
Reduced environmental footprint at the Utility
Greater customer control and options over energy usage
Maintain reasonable rates
Enablers of tomorrow’s customer solutions

17
Positioned to operate in a carbon-constrained economy Supporting environmental stewardship
One of the cleanest large generating fleets in the U.S.
• Environment2020: Voluntary pledge to reduce CO2 emissions 20% below year 2000 levels through 2020
• ~1,000 MW of renewables in various stages of development
• Meeting objectives through ‒ Portfolio transformation ‒ Investment in nuclear fleet ‒ New technologies ‒ Renewables and distributed energy resources
• Planning to prepare and publish a “two-degree scenario analysis”
18
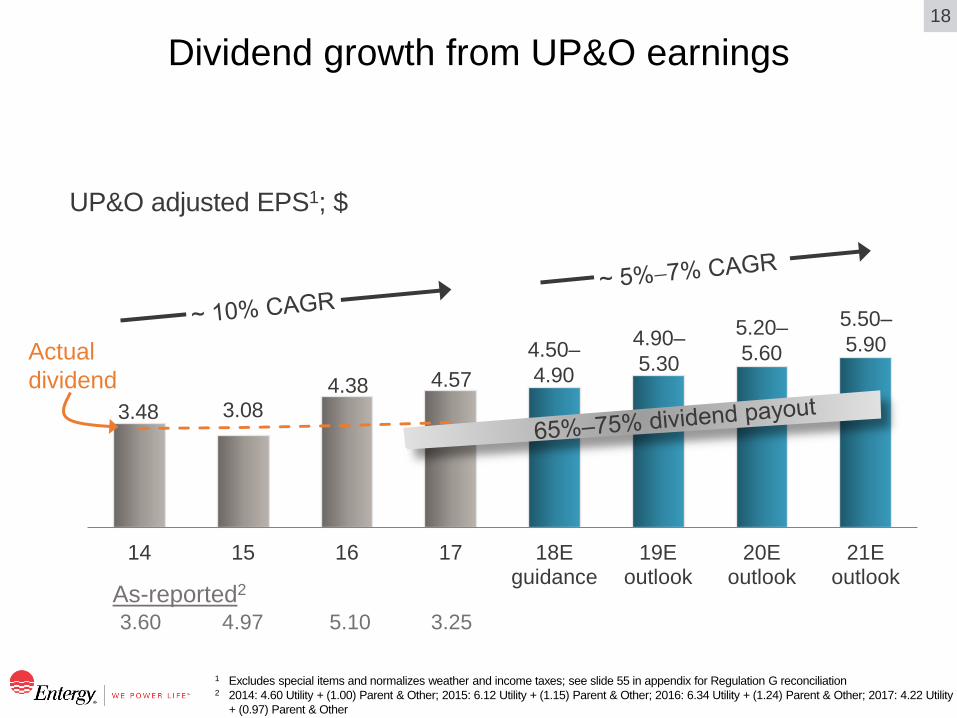
Dividend growth from UP&O earnings
1 Excludes special items and normalizes weather and income taxes; see slide 55 in appendix for Regulation G reconciliation 2 2014: 4.60 Utility + (1.00) Parent & Other; 2015: 6.12 Utility + (1.15) Parent & Other; 2016: 6.34 Utility + (1.24) Parent & Other; 2017: 4.22 Utility
+ (0.97) Parent & Other
14 15 16 17 18Eguidance
19Eoutlook
20Eoutlook
21Eoutlook
UP&O adjusted EPS1; $
4.50– 4.90
4.90– 5.30
5.20– 5.60
5.50– 5.90
4.57 4.38 3.08 3.48
3.60 4.97 5.10 3.25
Actual dividend
As-reported2

19
Credit profile
1 Excluding securitization debt; see appendix for Regulation G reconciliation 2 Excluding securitization debt and return of unprotected excess ADIT; see appendix for Regulation G reconciliation 3 Senior secured ratings for the OpCos and SERI; corporate credit rating for Entergy
13.1
3Q18 20E–22E
Credit ratings3 (outlook) E-AR E-LA E-MS E-NO E-TX SERI ETR
S&P A (stable)
A (stable)
A (stable)
A (stable)
A (stable)
A (stable)
BBB+ (stable)
Moody’s A2 (stable)
A2 (stable)
A2 (stable)
Baa2 (stable)
Baa1 (stable)
Baa1 (stable)
Baa2 (stable)
FFO to debt1; %
24.5
3Q18 18E–22E
Parent debt to total debt1; %
Target < 25%
Target ≥ 15%
Excluding return of unprotected excess ADIT 2

20
Evolving customer expectations
Outcomes not
inputs
Save money
New technology
Green Ease of use

21
Shifting from supplier to partner
From supplier To partner

22
Technology advances make it possible Delivering tailored customer solutions

23
A different mindset to deliver value Thinking of each customer as a segment of one
Industrial
Commercial
Residential
A segment of
ONE
24
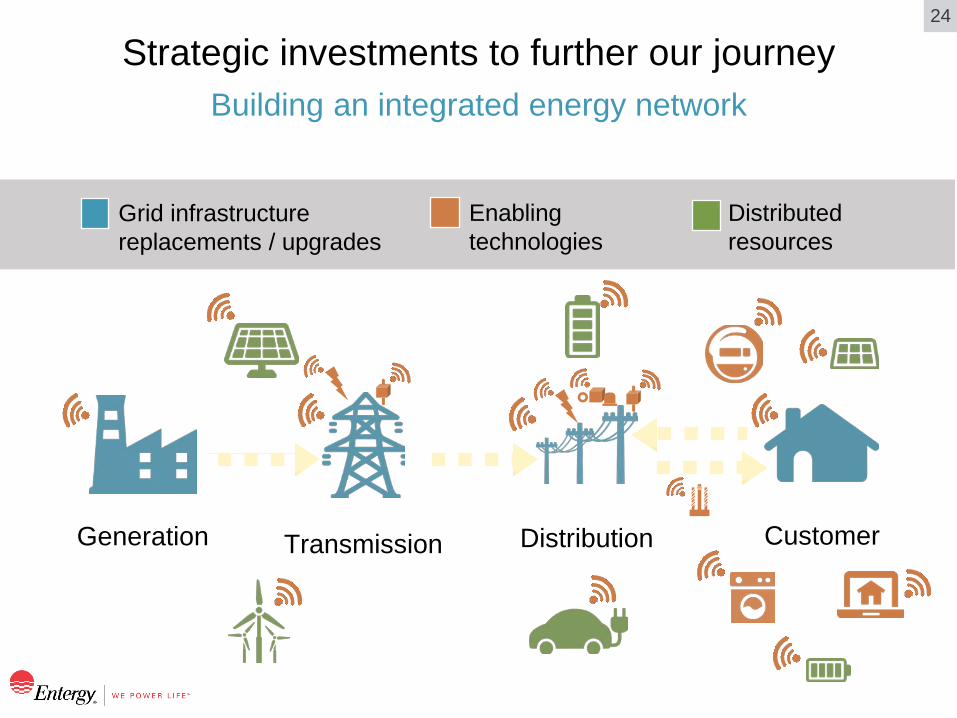
Building an integrated energy network Strategic investments to further our journey
Grid infrastructure replacements / upgrades
Distributed resources
Enabling technologies
Generation Distribution Customer Transmission

25
Uniquely positioned to seize growth opportunities
Efficient vertical integration Low rates
Efficient regulatory
frameworks
Clean generation
Environmental and social
responsibility Economic
development
Prepared for change
Track record of successful
execution
26
Appendix and Regulation G reconciliations

27
Utility overview
Note: Customer counts at the end of period 12/31/17 1 Percent of 2017 weather-adjusted GWh electric retail sales 2 Percent of owned and leased MW capability for generation portfolio as of 12/31/17
30
36
24
10
30
26
42
2 • Electric and gas utility
• Number of customers – Electric 1,078,000 – Gas 93,000
• Authorized ROE ranges: – Electric 9.95% (2017 test year); 9.2%–10.4% (2018−2019 test years) – Gas 9.45%–10.45%
• Electric FRP, gas RSP
• Electric utility
• 709,000 customers
• Authorized ROE range: 9.25%–10.25%
• Forward test year FRP
• Electric utility
• 448,000 customers
• Authorized ROE: 9.65%
• Rate case
• Electric and gas utility
• Number of customers – Electric 200,000 – Gas 106,000
• Authorized ROE ranges: – Electric 10.7%–11.5% – Gas 10.25%–11.25%
• Rate case
• Electric utility
• 449,000 customers
• Authorized ROE range: 9.28%–11.36%
• FRP with forward-looking features
2017 electric retail sales1; %
2017 generation portfolio2; %
Nuclear
Coal
Legacy gas/ oil
Residential
Commercial
Industrial
Governmental E-LA E-AR
E-TX E-NO E-MS CT/CCGT/ hydro/solar
28
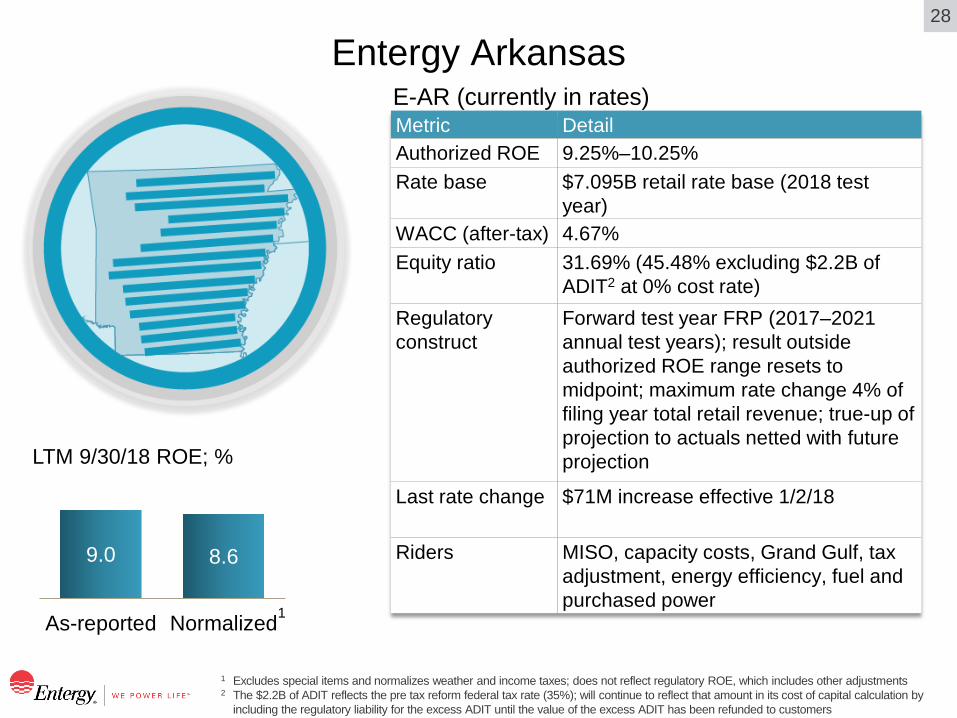
Entergy Arkansas
1 Excludes special items and normalizes weather and income taxes; does not reflect regulatory ROE, which includes other adjustments 2 The $2.2B of ADIT reflects the pre tax reform federal tax rate (35%); will continue to reflect that amount in its cost of capital calculation by
including the regulatory liability for the excess ADIT until the value of the excess ADIT has been refunded to customers
9.0 8.6
As-reported Normalized
LTM 9/30/18 ROE; %
1
Metric Detail Authorized ROE 9.25%–10.25%
Rate base $7.095B retail rate base (2018 test year)
WACC (after-tax) 4.67% Equity ratio 31.69% (45.48% excluding $2.2B of
ADIT2 at 0% cost rate) Regulatory construct
Forward test year FRP (2017–2021 annual test years); result outside authorized ROE range resets to midpoint; maximum rate change 4% of filing year total retail revenue; true-up of projection to actuals netted with future projection
Last rate change $71M increase effective 1/2/18
Riders MISO, capacity costs, Grand Gulf, tax adjustment, energy efficiency, fuel and purchased power
E-AR (currently in rates)

29
Annual FRP filing in process – partial settlement filed 10/30 Entergy Arkansas
Calculations may differ due to rounding
Settlement highlights/2018 evaluation report – (docket 16-036-FR) Filing highlights 2019 test year 2017 test year true-up Earned ROE 7.89% 4.93% Retail rate base (ADIT incl. in WACC, not rate base) $7.547B $6.621B WACC (after-tax) 5.25% 4.61% Equity ratio (traditional equity ratio) 36.55% (46.38% excl. $1.7B
ADIT at 0% cost rate) 31.46% (43.57% excl. $2.0B
ADIT at 0% cost rate) Revenue requirements to midpoint $69.2M $93.7M Rate change requested $66.7M (cap)
Category 2019 TY 2017 TY Cost of capital 27 6 Expense items (29) 30 Rate base 50 2 Revenue/sales shortfall 18 74 Other 3 (18) Total 69 94
Major components of revenue requirement; $M Date Event 12/13/18 Requested decision 1/2/19 Requested rate adjustment
Key dates

30
Entergy Louisiana
1 Pending finalization of the 2017 test year filing (docket U-34951) 2 2018 and 2019 test years will have an authorized ROE range of 9.2%–10.4% (9.8% midpoint) 3 50 bps dead band, 51 bps–200 bps 50% sharing, >200 bps adjust to 200 bps plus 75 bps sharing; for infrastructure costs, 100% sharing
above the band
4 Includes the following components: $60M cost of service, $37M MISO/capacity/other and $(115M) annualized tax reform mechanism
5 Excludes special items and normalizes weather and income taxes; does not reflect regulatory ROE, which includes other adjustments
E-LA (currently in rates) Metric Detail – electric1 Detail – gas Authorized ROE 9.95%2 9.45%–10.45%
Last filed rate base
$9.7B excl. $520M transmission plant through 8/31/18, included in the transmission rider (12/31/17 test year)
$0.0645B, filed on 4/16/18 (9/30/17 test year)
WACC 7.23% (after-tax) 7.25% (after-tax) Equity ratio 49.1% 49.53% Regulatory construct
FRP, 2017–2019 test years; 60/40 customer/company sharing outside bandwidth
RSP3
Last rate change Net base rate reduction $(18M)4
$0.85M decrease (largely tax)
Riders/specific recovery
Capacity, MISO, transmission, fuel
Gas infrastructure 7.6 9.3
As-reported Normalized5
LTM 9/30/18 ROE; %

31
Entergy Mississippi
1 Excludes special items and normalizes weather and income taxes; does not reflect regulatory ROE, which includes other adjustments 2 EMI is seeking a new rider for the cost of Choctaw Generating Station and other new owned capacity
10.5 10.4
As-reported Normalized1
LTM 9/30/18 ROE; %
Metric Detail Authorized ROE
10.32% performance-adjusted midpoint (9.69% + 0.63% performance factor); 9.28%–11.36% range (annual redetermination based on formula)
Rate base $2.413B (2018 forward test year)
WACC (after-tax)
7.13%
Equity ratio 48.05% Regulatory construct
FRP with forward-looking features; annual redetermination subject to performance-based bandwidth calculation and subject to annual “look-back” evaluation; maximum rate increase 4% of test year retail revenue (higher rate increase requires filing of a general rate case)
Rate change None requested in 2018 FRP filing Riders2 Power management rider, Grand Gulf, fuel,
MISO, unit power cost, storm damage, energy efficiency, ad valorem tax adjustment
E-MS (currently in rates)

32
Entergy New Orleans
1 Electric rate base does not include Algiers assets transferred to E-NO from E-LA on 9/1/15; net book value of the assets at the time of the transfer was ~$85M
2 Excludes special items and normalizes weather and income taxes; does not reflect regulatory ROE, which includes other adjustments
Metric Detail – electric Detail – gas Authorized ROE 10.7%–11.5% 10.25%–11.25%
Rate base (filed on 5/31/12)1
$0.299B (12/31/11 test year) – does not include $0.228B for Union (first year average rate base)
$0.089B (12/31/11 test year)
WACC (after-tax) 8.58% 8.40%
Equity ratio 50.08% 50.08%
Regulatory construct Rate case Rate case Riders/specific recovery
Fuel, capacity (e.g., Ninemile 6, Union)
Purchased gas
E-NO (currently in rates)
11.5 10.7
As-reported Normalized 2
Metric Detail – electric Detail – gas Authorized ROE 10.7%–11.5% 10.25%–11.25%
Rate base (filed on 5/31/12)1
$0.299B (12/31/11 test year) – does not include $0.228B for Union (first year average rate base)
$0.089B (12/31/11 test year)
WACC (after-tax) 8.58% 8.40%
Equity ratio 50.08% 50.08%
Regulatory construct Rate case Rate case Riders/specific recovery
Fuel, capacity (e.g., Ninemile 6, Union)
Purchased gas
E-NO (currently in rates)
LTM 9/30/18 ROE; %
33
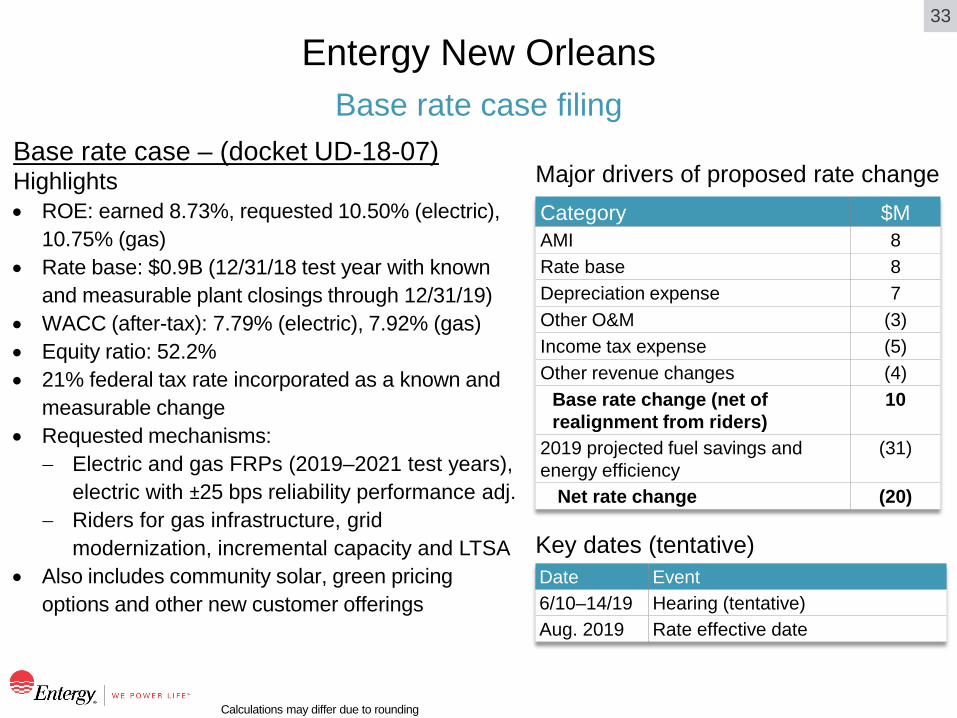
Base rate case filing Entergy New Orleans
Calculations may differ due to rounding
Base rate case – (docket UD-18-07) Highlights • ROE: earned 8.73%, requested 10.50% (electric),
10.75% (gas) • Rate base: $0.9B (12/31/18 test year with known
and measurable plant closings through 12/31/19) • WACC (after-tax): 7.79% (electric), 7.92% (gas) • Equity ratio: 52.2% • 21% federal tax rate incorporated as a known and
measurable change • Requested mechanisms:
− Electric and gas FRPs (2019–2021 test years), electric with ±25 bps reliability performance adj.
− Riders for gas infrastructure, grid modernization, incremental capacity and LTSA
• Also includes community solar, green pricing options and other new customer offerings
Key dates (tentative)
Category $M AMI 8 Rate base 8 Depreciation expense 7 Other O&M (3) Income tax expense (5) Other revenue changes (4)
Base rate change (net of realignment from riders)
10
2019 projected fuel savings and energy efficiency
(31)
Net rate change (20)
Major drivers of proposed rate change
Date Event 6/10–14/19 Hearing (tentative) Aug. 2019 Rate effective date
34
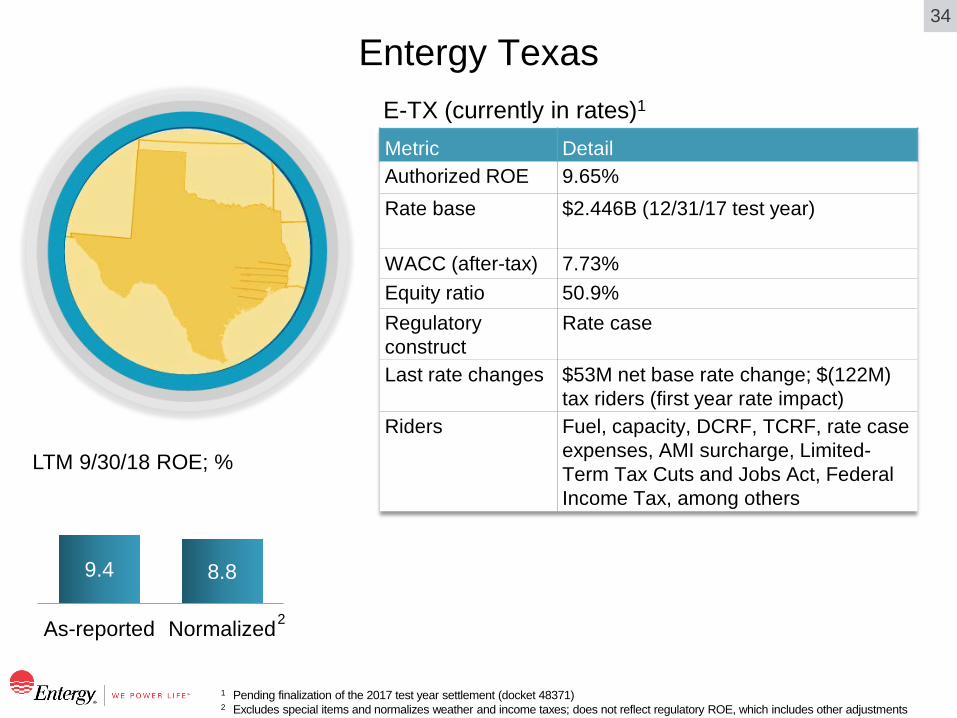
Entergy Texas
1 Pending finalization of the 2017 test year settlement (docket 48371)
2 Excludes special items and normalizes weather and income taxes; does not reflect regulatory ROE, which includes other adjustments
E-TX (currently in rates)1
9.4 8.8
As-reported Normalized
Metric Detail Authorized ROE 9.65%
Rate base $2.446B (12/31/17 test year)
WACC (after-tax) 7.73% Equity ratio 50.9% Regulatory construct
Rate case
Last rate changes $53M net base rate change; $(122M) tax riders (first year rate impact)
Riders Fuel, capacity, DCRF, TCRF, rate case expenses, AMI surcharge, Limited-Term Tax Cuts and Jobs Act, Federal Income Tax, among others
LTM 9/30/18 ROE; %
2

35
Base rate case filing Entergy Texas
1 Includes $19M carrying costs 2 First year rate impact
Base rate case – PUCT docket 48371 On 10/5/18, E-TX filed an unopposed settlement in its base rate case Highlights • Proposed ROE: 9.65% • Rate base: $2.446B (12/31/17 test year) • WACC (after-tax): 7.73% • Equity ratio: 50.9% • New rates to reflect 21% federal tax rate • Tax riders
− Return $204M1 of unprotected excess ADIT (over 12 months or four years depending on class)
− Return $25M for tax rate change benefits from 1/25/18 through rate effective date
Summary of settlement rate change
Key dates Date Event 12/7/18 Upcoming PUCT Open Meeting dates
(potential agenda item to consider settlement) 12/20/18
Category Annual
$M Base rate change 101 Roll riders into base rates (48) Net base rate change 53 Tax riders2 ~(122) Net rate change (69)

36
System Energy Resources, Inc.
1 Ongoing proceeding at FERC challenging SERI’s authorized ROE (see slide 37) 2 Sale leaseback obligation excluded from capital structure, treated as an operating lease and recovered as an O&M cost 3 Reflects percentages under SERI’s Unit Power Sales Agreement
Grand Gulf Nuclear Station
36
14 33
17
Metric Detail Principal asset An ownership and
leasehold interest in Grand Gulf
Authorized ROE 10.94%1
Last calculated rate base
$1.458B (9/30/18)
WACC (after-tax) 8.89% Equity ratio 65%2
Regulatory construct Monthly cost of service
SERI – generation company
E-NO E-AR
E-MS E-LA
Energy and capacity allocation3; %
37
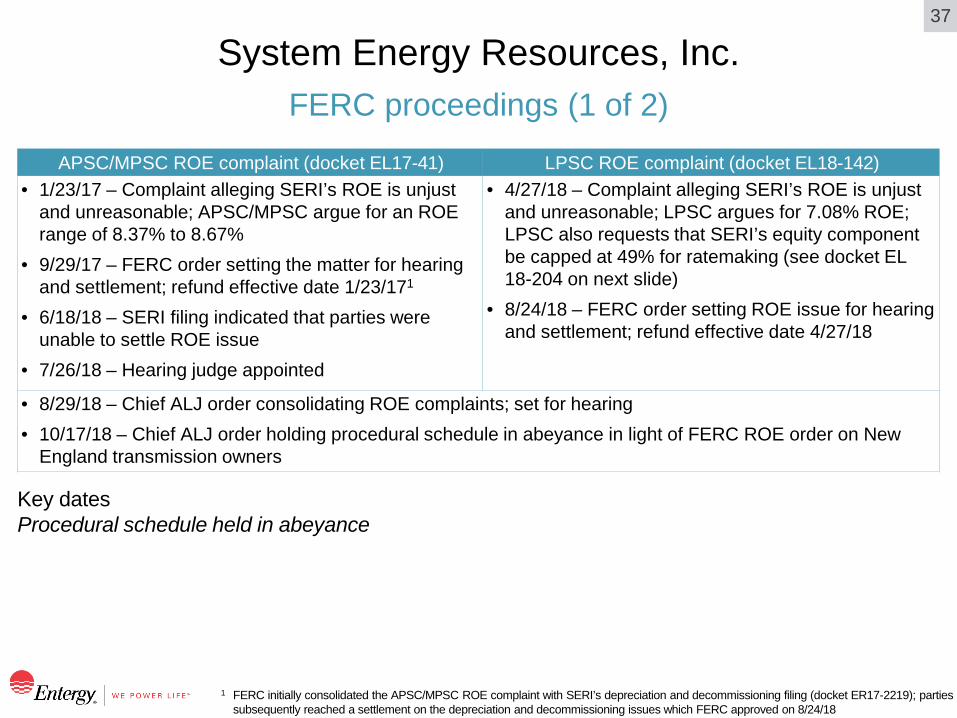
FERC proceedings (1 of 2) System Energy Resources, Inc.
1 FERC initially consolidated the APSC/MPSC ROE complaint with SERI’s depreciation and decommissioning filing (docket ER17-2219); parties subsequently reached a settlement on the depreciation and decommissioning issues which FERC approved on 8/24/18
Key dates Procedural schedule held in abeyance
APSC/MPSC ROE complaint (docket EL17-41) LPSC ROE complaint (docket EL18-142) • 1/23/17 – Complaint alleging SERI’s ROE is unjust
and unreasonable; APSC/MPSC argue for an ROE range of 8.37% to 8.67%
• 9/29/17 – FERC order setting the matter for hearing and settlement; refund effective date 1/23/171
• 6/18/18 – SERI filing indicated that parties were unable to settle ROE issue
• 7/26/18 – Hearing judge appointed
• 4/27/18 – Complaint alleging SERI’s ROE is unjust and unreasonable; LPSC argues for 7.08% ROE; LPSC also requests that SERI’s equity component be capped at 49% for ratemaking (see docket EL 18-204 on next slide)
• 8/24/18 – FERC order setting ROE issue for hearing and settlement; refund effective date 4/27/18
• 8/29/18 – Chief ALJ order consolidating ROE complaints; set for hearing • 10/17/18 – Chief ALJ order holding procedural schedule in abeyance in light of FERC ROE order on New
England transmission owners

38
FERC proceedings (2 of 2) System Energy Resources, Inc.
LPSC complaint regarding GGNS sale-leaseback renewal (docket EL18-152)
• 5/14/18 – Complaint alleging (1) SERI was imprudent in renewing the sale-leaseback, (2) SERI violated the filed rate when it included the cost of capital additions associated with the sale-leaseback interest in UPSA billings and (3) SERI is double-recovering costs by including both the lease payments and the capital additions in UPSA billings
• 6/28/18 – SERI motion to dismiss and answer in opposition to the LPSC’s claims • 9/20/18 – FERC order setting LPSC sale-leaseback complaint for hearing and settlement • 9/28/18 – Settlement judge assigned • Next steps – First settlement conference on 11/15/18
LPSC complaint regarding SERI equity component (docket EL18-204)
• In its 4/27/18 ROE complaint (docket EL 18-142), the LPSC also requested that SERI’s equity component be capped at 49% for ratemaking
• 8/24/18 – FERC order dismissing LPSC request for cap on equity component • 9/25/18 – LPSC request for rehearing regarding cap on equity component and amended LPSC complaint on
equity component • 10/15/18 – SERI answer and motion to dismiss amended complaint

39
Retail filings on tax reform
1 Represents grossed up amounts 2 See also APSC docket 18-006-U, the generic investigation docket for tax reform issues 3 Includes $19M carrying costs
Retail filings summary
Key milestones
OpCo Docket Lower federal tax rate in rates Return of unprotected excess ADIT1
E-AR 16-036-FR/ 18-014-TF
Tax rate change as part of the 2018 test year true-up2
$466M returned to customers ($360M in 2018, remainder in 2019)
E-LA U-34316 In base rates effective 9/1/18 including return of benefit for Jan–Aug 2018
$212M returned to customers (~half in 2018, remainder 2019–2022)
E-MS 2014-UN-132 Reflected in 2018 FRP $162M ($26M returned to customers in 3Q18, $135M to recover rate base items)
E-NO 18-38 Assume base rates effective Aug 2019; reg. liability for Jan 2018 – Aug 2019 benefit ($7M over high-bill months, $7M Energy Smart, $1M grid modernization)
$35M ($14M returned to customers, $12M grid modernization funding, $6M Energy Smart, $3M Smart City pilot)
E-TX 48371 $25M in total customer credits ($11M to large customers over ten months, remainder to other customers over four years)
$204M3 returned to customers ($75M to large customers over 12 months, remainder to other customers over four years)
Event E-AR
(16-036-FR) E-AR
(18-014-TF) E-LA E-MS E-NO E-TX Initial filing 3Q18 2/27/18 4/12/18 3/15/18 3/26/18 5/15/18
Decision/guidance 4Q18 Approved 3/27/18
Approved 4/18/18
Approved 6/5/18 6/21/18 4Q18

40
Jurisdictional rate filing guidelines
1 Not required to be filed per FERC order 2 May be suspended for an additional 150 days
E-AR E-LA E-MS E-NO E-TX SERI Latest filing FRP filed 7/6/18 FRP filed 6/30/18 FRP filed
3/15/18 Rate case
filed 9/21/18 2018 rate case filed 5/15/18
Monthly cost of service
calculation1
Next filing date
FRP: July 2019 FRP: by 5/31/19 FRP: by 3/15/19
FRP: in 2019 (proposed)
TBD Every month
Rate effective date
January following filing
September following filing
June
following filing
1 year + 15 days after
filing
35 days after filing2
Immediate
Evaluation period
Forward test year ended 12/31
Historical test year ended 12/31 except new generation and transmission closed
to plant above baseline through 8/31 of filing year
Historical test year
ended 12/31 plus certain items from forward test year ended
12/31
Historical and
forecasted test years
ended 12/31
12-month historical test
year with available updates
Actual current month
expense and prior month-end balance
sheet
FRP term/ post FRP framework
FRP: 5 years (2017–2021 test years); option to
request FRP extension, file rate case or do nothing
FRP: 3 years (2017−2019 test
years)
FRP: no stated term;
review scheduled in
2019
FRP: 3 years (2019–2021 test years) (proposed)
n/a Monthly cost of service continues
until terminated by mutual agreement
41
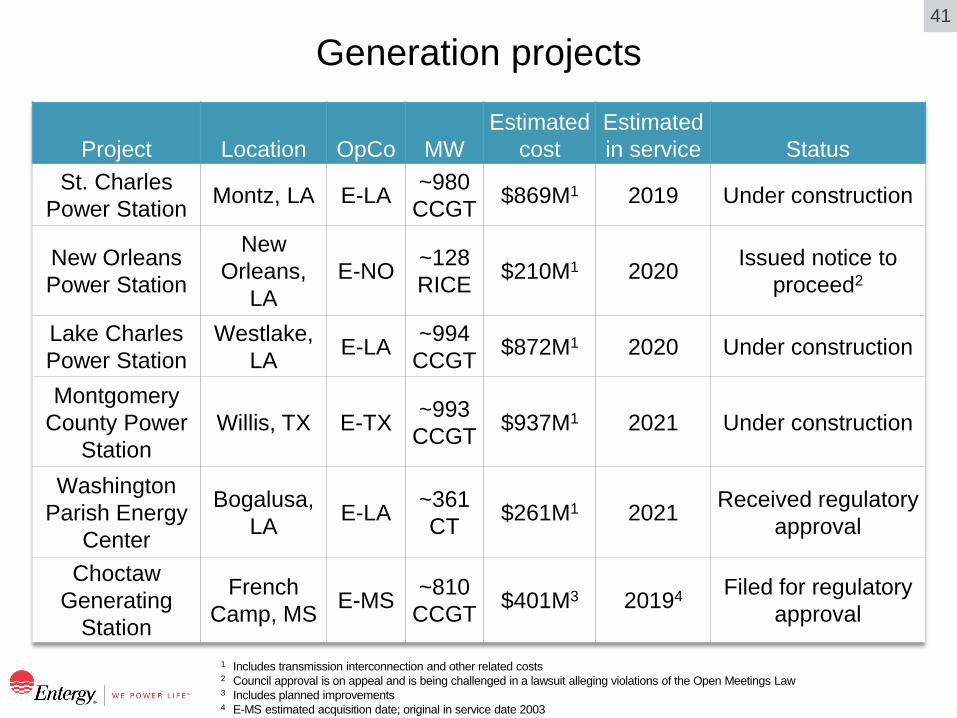
Generation projects
1 Includes transmission interconnection and other related costs 2 Council approval is on appeal and is being challenged in a lawsuit alleging violations of the Open Meetings Law 3 Includes planned improvements 4 E-MS estimated acquisition date; original in service date 2003
Project Location OpCo MW Estimated
cost Estimated in service Status
St. Charles Power Station Montz, LA E-LA ~980
CCGT $869M1 2019 Under construction
New Orleans Power Station
New Orleans,
LA E-NO ~128
RICE $210M1 2020 Issued notice to proceed2
Lake Charles Power Station
Westlake, LA E-LA ~994
CCGT $872M1 2020 Under construction
Montgomery County Power
Station Willis, TX E-TX ~993
CCGT $937M1 2021 Under construction
Washington Parish Energy
Center
Bogalusa, LA E-LA ~361
CT $261M1 2021 Received regulatory approval
Choctaw Generating
Station
French Camp, MS E-MS ~810
CCGT $401M3 20194 Filed for regulatory approval

42
E-MS – Choctaw Generating Station
1 Includes planned improvements
Project overview (docket 2018-UA-204) Item Details MW ~810 (summer rating) Estimated total investment $401M1
Plant type CCGT Location French Camp, MS In-service date 2003 (existing facility) Closing date Targeting 4Q19 Recovery mechanism Proposing FRP adjustment outside of sharing, to begin
contemporaneously with closing, and to be rolled into annual FRP reviews after a full calendar year of ownership
Status Filed for regulatory approval

43
EWC overview
1 ARO liability balances are based on most recent estimates and are subject to change 2 Includes $39M for Big Rock Point
Region breakdown; % MW as of 12/31/17
Generation portfolio; % MW as of 12/31/17
90
5 5
Nuclear
Gas and oil
Other
Indian Point 1
Indian Point 2
Indian Point 3 Palisades Pilgrim VY
Planned closing date
Shut down
4/30/20 4/30/21 5/31/22 5/31/19 Shut down
Net MW n/a 1,028 1,041 811 688 n/a Energy market (closest hubs)
n/a NYISO (Zone G)
NYISO (Zone G)
MISO (Indiana)
NEPOOL (Mass Hub)
n/a
Net book value of plant and related assets (9/30/18)
– $100M $131M $143M $18M –
NDT bal. (9/30/18) $509M $644M $835M $476M $1,081M $554M ARO liability bal. (9/30/18)1
$226M $753M $737M $538M2 $806M $289M
EWC non-nuclear plants ISES 2 Nelson 6 RS Cogen
COD 1983 1982 2002 Fuel / technology Coal Coal CCGT cogen Net MW owned 121 60 213 Market MISO MISO MISO
52
18
30
NYISO
NEPOOL
MISO
EWC nuclear plants

44
Vermont Yankee transaction
1 Timing of regulatory decisions could impact transaction closing
Transaction highlights Item Details Structure Equity sale of ENVY Purchaser NorthStar Decommissioning Holdings, LLC Transaction close Targeted by year-end 20181
Conditions to close include
• Regulatory approvals: VPUC certificate of public good; NRC license transfer approval • Minimum NDT balance • Spent fuel in independent spent fuel storage installation
Status • Transfer of all spent fuel to ISFSI completed on 8/1/18 • NRC approved license transfer application and NorthStar’s exemption request to use up to
$20M of NDT funds at any one time for spent fuel management activities on 10/11/18 • VPUC fully briefed, including settlement agreement addressing financial assurances and
site restoration standards; certificate of public good decision pending; parties agreed to further extend settlement agreement to 11/30/18
VPUC NRC Docket 8880 50-271-LT-2 Decision Targeted 4Q18 Approved October 2018
Next steps
45
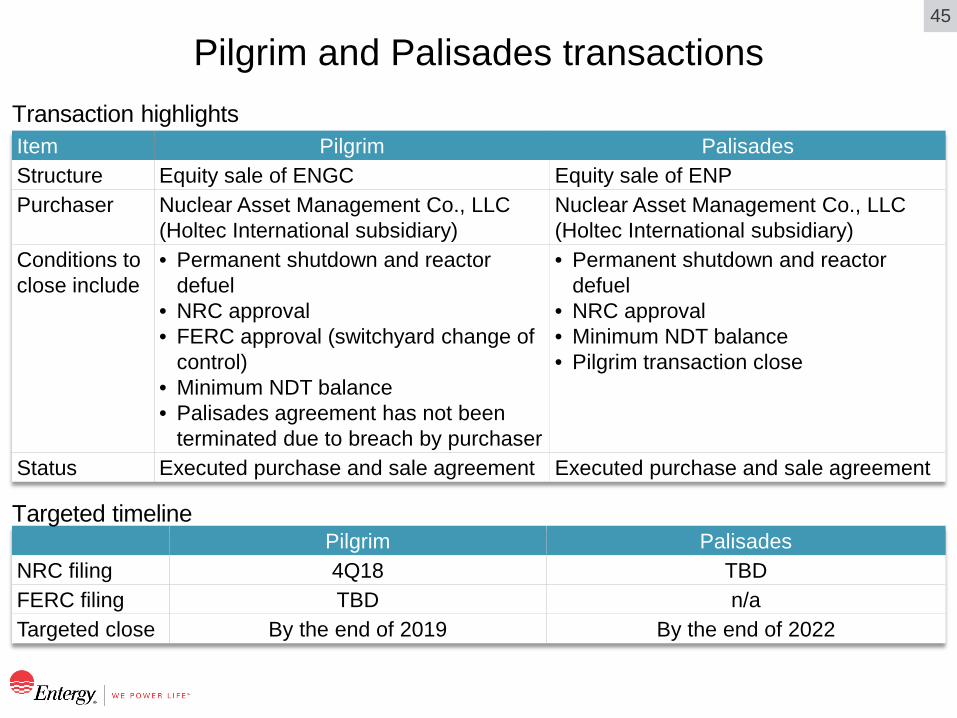
Pilgrim and Palisades transactions Transaction highlights Item Pilgrim Palisades Structure Equity sale of ENGC Equity sale of ENP Purchaser Nuclear Asset Management Co., LLC
(Holtec International subsidiary) Nuclear Asset Management Co., LLC (Holtec International subsidiary)
Conditions to close include
• Permanent shutdown and reactor defuel
• NRC approval • FERC approval (switchyard change of
control) • Minimum NDT balance • Palisades agreement has not been
terminated due to breach by purchaser
• Permanent shutdown and reactor defuel
• NRC approval • Minimum NDT balance • Pilgrim transaction close
Status Executed purchase and sale agreement Executed purchase and sale agreement
Pilgrim Palisades NRC filing 4Q18 TBD FERC filing TBD n/a Targeted close By the end of 2019 By the end of 2022
Targeted timeline

Entergy consolidated operational Utility, Parent & Other adjusted
46
2018 EPS guidance
1 The company has not provided a reconciliation of non-GAAP guidance to guidance presented on a GAAP basis because it cannot predict and quantify with a reasonable degree of confidence all of the special items that may occur during 2018. For those anticipated special items that the company can reasonably estimate at this time, see slide 53
2 Excludes special items and normalizes weather and income taxes
2018 EPS guidance1; $
Increased 10/31/18 to reflect weather and tax items better than plan, net of
NDT returns lower than plan
Current expectations around the midpoint
6.75–7.25 (7.00 midpoint)
4.50–4.90 (4.70 midpoint)
2

47
Utility, Parent & Other financial outlook
1 Excludes special items and normalizes weather and income taxes
18E guidance 19E outlook 20E outlook 21E outlook
4.90–5.30 4.50–4.90
UP&O adjusted EPS1; $
5.20–5.60 5.50–5.90
48
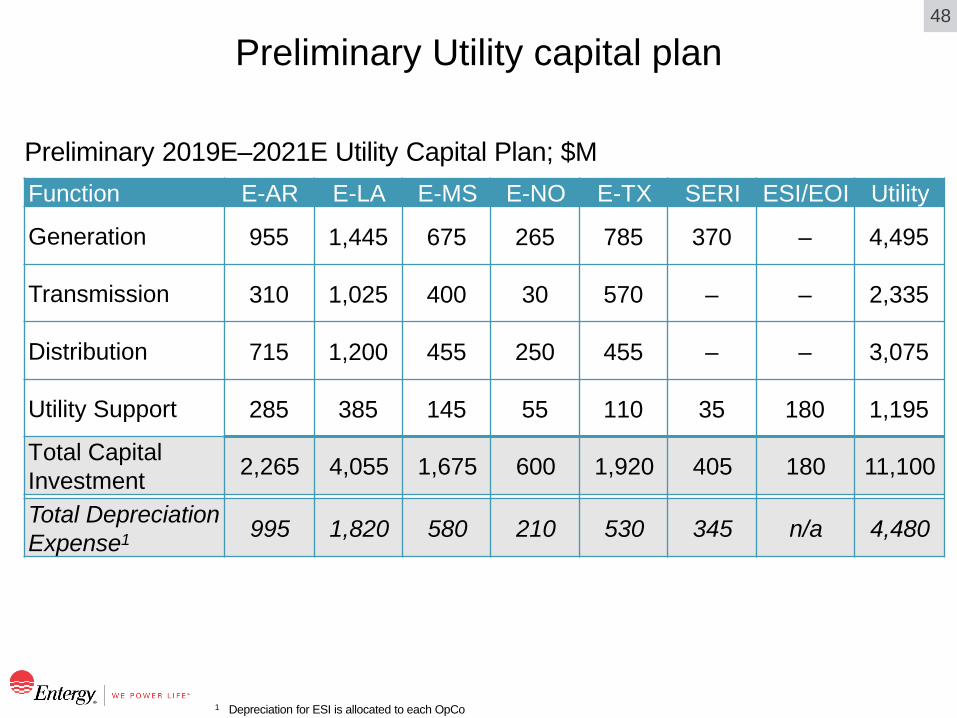
Preliminary Utility capital plan
1 Depreciation for ESI is allocated to each OpCo
Preliminary 2019E–2021E Utility Capital Plan; $M Function E-AR E-LA E-MS E-NO E-TX SERI ESI/EOI Utility
Generation 955 1,445 675 265 785 370 – 4,495
Transmission 310 1,025 400 30 570 – – 2,335
Distribution 715 1,200 455 250 455 – – 3,075
Utility Support 285 385 145 55 110 35 180 1,195
Total Capital Investment 2,265 4,055 1,675 600 1,920 405 180 11,100
Total Depreciation Expense1 995 1,820 580 210 530 345 n/a 4,480

49
Preliminary view of 2019 UP&O Adjusted EPS drivers
1 Excludes special items and normalizes weather and income taxes
UP&O Adjusted EPS1; $ Illustrative
4.70 5.10
2018 guidancemidpoint
Net revenue Capitalinvestment
Dilution Other 2019 outlookmidpoint
Depreciation Other tax
Net interest AFUDC
Regulatory actions
Settlement of equity
forwards
NFOM Other
50
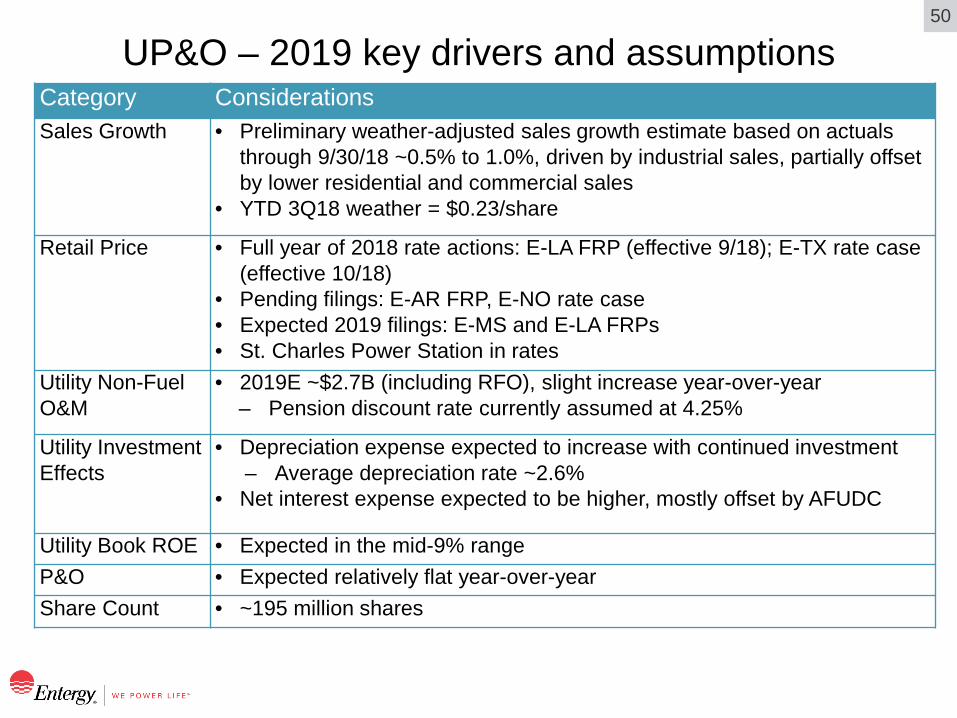
UP&O – 2019 key drivers and assumptions Category Considerations Sales Growth • Preliminary weather-adjusted sales growth estimate based on actuals
through 9/30/18 ~0.5% to 1.0%, driven by industrial sales, partially offset by lower residential and commercial sales
• YTD 3Q18 weather = $0.23/share
Retail Price • Full year of 2018 rate actions: E-LA FRP (effective 9/18); E-TX rate case (effective 10/18)
• Pending filings: E-AR FRP, E-NO rate case • Expected 2019 filings: E-MS and E-LA FRPs • St. Charles Power Station in rates
Utility Non-Fuel O&M
• 2019E ~$2.7B (including RFO), slight increase year-over-year – Pension discount rate currently assumed at 4.25%
Utility Investment Effects
• Depreciation expense expected to increase with continued investment – Average depreciation rate ~2.6%
• Net interest expense expected to be higher, mostly offset by AFUDC
Utility Book ROE • Expected in the mid-9% range P&O • Expected relatively flat year-over-year Share Count • ~195 million shares

51
Preliminary EWC capital plan
Preliminary EWC Capital Plan; $M
18E 19E 20E 21E 22E Pilgrim 35 5 - - - Indian Point 70 60 15 15 - Expected to be impaired as incurred and classified as a special item
105 65 15 15 -
Palisades/other 105 55 30 10 - Total EWC Capital 210 120 45 25 -
Estimated depreciation expense 155 160 125 85 35
52
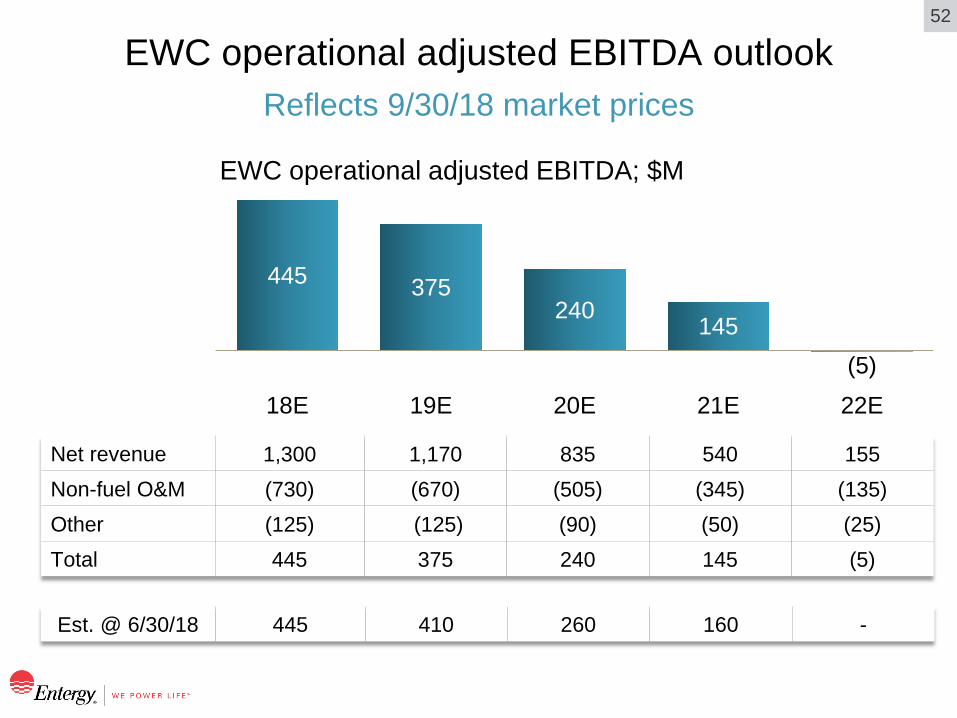
Reflects 9/30/18 market prices EWC operational adjusted EBITDA outlook
EWC operational adjusted EBITDA; $M
445 375 240
145 (5)
18E 19E 20E 21E 22E
Net revenue 1,300 1,170 835 540 155 Non-fuel O&M (730) (670) (505) (345) (135) Other (125) (125) (90) (50) (25) Total 445 375 240 145 (5)
Est. @ 6/30/18 445 410 260 160 -

53
Estimated special items
Note: The table above reflects estimates for expected special items resulting from decisions to close or sell EWC nuclear plants. Other special items may occur during the periods presented, the impact of which cannot reasonably be estimated at this time. 1 Net loss or gain on sale of assets represents our current estimates, which are subject to change. The primary variables in the ultimate loss or gain are the values of the NDTs and the asset retirement obligations, financial results from plant operations and the level of any deferred tax balances prior to the closing of the sale.
Estimated special items; pre-tax $M 18E 19E 20E 21E 22E
Asset impairments (capital) (105) (65) (15) (15) - Asset impairments (fuel, refuel/defuel, other) (255) (85) (25) (10) (10) Severance and retention (155) (110) (60) (30) (15) Net gain/(loss) on sale of assets1 (165) (120) - - 75 Total (680) (380) (100) (55) 50
Estimated special items, EPS (2.95)

54
Modeling framework – EWC operational earnings
1 Decommissioning liability balances increase through accretion and decrease when liabilities are satisfied / work is completed; decommissioning expense can also be affected by adjustments as decommissioning work is performed
2 Decommissioning trust balances increase with interest earned and decrease as funds are spent on decommissioning work 3 Pre-tax return; return would be reduced by ~20% for trust taxes
Line Item 19E 20E 21E 22E Planned plant closures Pilgrim (5/31) IP2 (4/30) IP3 (4/30) Palisades
(by 5/31) Nuclear net revenue
Price See EWC Nuclear Capacity and Generation Table (3Q18 webcast)
Non-RFO capacity factor 96% (expected to be slightly lower as plant approaches final shutdown)
Scheduled RFOs IP3 (spring)
Palisades (summer)
Nuclear fuel expense ($/MWh) ~2 ~2 ~3 ~5
Avg. operational nuclear non-fuel O&M, including RFO ($/MWh)
~23 ~23 ~27 ~22
Decommissioning expense1 ~8%–9.5% accretion of the decommissioning liability Depreciation expense See EWC Capital Plan (slide 51) NDT investment earnings2 Assuming 5.5%–6.5% blended return3
(equity investments marked to market) Other interest income, net of expense
Minimal (~$5–$10M/year)
Effective tax rate ~20%

55
Regulation G reconciliations
Calculations may differ due to rounding 1 Income tax effect is calculated by multiplying the pre-tax amount by the estimated income tax rates that are expected to apply to those
adjustments 2 Per share amounts are calculated by dividing the corresponding line item in the chart above by the diluted average number of common shares
outstanding for the period
Table 1: UP&O adjusted EPS Reconciliation of GAAP to Non-GAAP measures 2017, 2016, 2015 and 2014 ($ in millions) 2017 2016 2015 2014 Utility earnings (a) 761.6 1,134.2 1,096.9 829.1 Parent & Other earnings (loss) (b) (175.5) (222.5) (205.6) (180.8) UP&O earnings (loss) (c) = (a)+(b) 586.1 911.7 891.3 648.4 Less:
Special items (d) (128.5) - - (7.6)
Estimated weather (e) (127.8) 18.1 56.3 20.8 Tax effect of estimated weather1 (f) 49.2 (7.0) 21.7 8.0 Estimated weather (after-tax) (g) = (e)-(f) (78.6) 11.1 34.6 12.8
Customer sharing (h) - (16.1) (107.0) - Tax effect of customer sharing (i) - 6.2 41.2 - Other income tax items (j) (31.0) 126.9 370.0 15.8 Tax items, net of customer sharing (k) = (h)+(i)+(j) (31.0) 117.0 304.2 15.8
UP&O adjusted earnings (l) = (c)-(d)-(g)-(k) 824.2 783.6 552.5 627.4
(After-tax, per share in $)2 Utility earnings (m) 4.22 6.34 6.12 4.60 Parent & Other earnings (loss) (n) (0.97) (1.24) (1.15) (1.00) UP&O earnings (loss) (o) = (m)+(n) 3.25 5.10 4.97 3.60 Less:
Special items (p) (0.71) - - (0.04) Estimated weather (q) (0.44) 0.06 0.19 0.07 Other income tax items, net of customer sharing (r) (0.17) 0.66 1.70 0.09
UP&O adjusted earnings (s) = (o)-(p)-(q)-(r) 4.57 4.38 3.08 3.48

56
Regulation G reconciliations
Calculations may differ due to rounding 1 Utility does not equal the sum of the operating companies due primarily to SERI (as-reported income ~$87M, normalized income ~$91M and
average common equity ~$714M) and preferred dividend requirements of Entergy Utility Holding Co. 2 Represents a weighted average rate over last twelve months 3 Excludes special items and normalizes weather and income taxes; does not reflect regulatory ROE, which includes other adjustments
Table 2: Normalized ROE Reconciliation of GAAP to Non-GAAP measures LTM ending September 30, 2018 ($ in millions)
E-AR E-LA E-MS E-NO E-TX Utility1 As-reported earnings available to common stock (a) 240.6 425.5 128.9 50.6 118.6 1,048.0 Add back: Preferred dividend requirement (b) 1.4 - 1.0 0.1 - 11.5 Income taxes (c) (184.4) 261.1 (107.2) 11.9 41.1 9.5 As-reported income before income taxes (d) = (a)+(b)+(c) 57.7 686.6 22.7 62.6 159.7 1,069.0 Less certain items (pre-tax): Weather (e) 5.6 41.3 4.0 6.8 17.3 75.0 Special item (f) - 55.5 - - - 55.5 Unprotected excess ADIT (g) (260.4) (86.3) (159.3) (9.1) - (561.2) Normalized income taxes before taxes (h) = (d)-(e)-(f)-(g) 312.5 676.0 178.0 64.9 142.5 1,499.6 Affiliated preferred (i) - 127.6 - - - 127.6 Normalized income before income taxes, adjusted for affiliate preferred
(j) = (h)-(i) 312.5 548.4 178.0 64.9 142.5 1,372.0
State-specific standard income tax rate2 (k) 25.82% 28.47% 27.36% 27.34% 22.14% 27.25% Income tax at state-specific standard rate (l) = (j)*(k) 80.7 156.1 48.7 17.8 31.5 373.8 Normalized earnings (m) = (h)-(l)-(b) 230.4 519.9 128.4 47.1 110.9 1,114.2 Average common equity (n) 2,686 5,578 1,232 438 1,257 11,660 As-reported ROE (a)/(n) 9.0% 7.6% 10.5% 11.5% 9.4% 9.0% Normalized ROE3 (m)/(n) 8.6% 9.3% 10.4% 10.7% 8.8% 9.6%
57
Regulation G reconciliations
Calculations may differ due to rounding
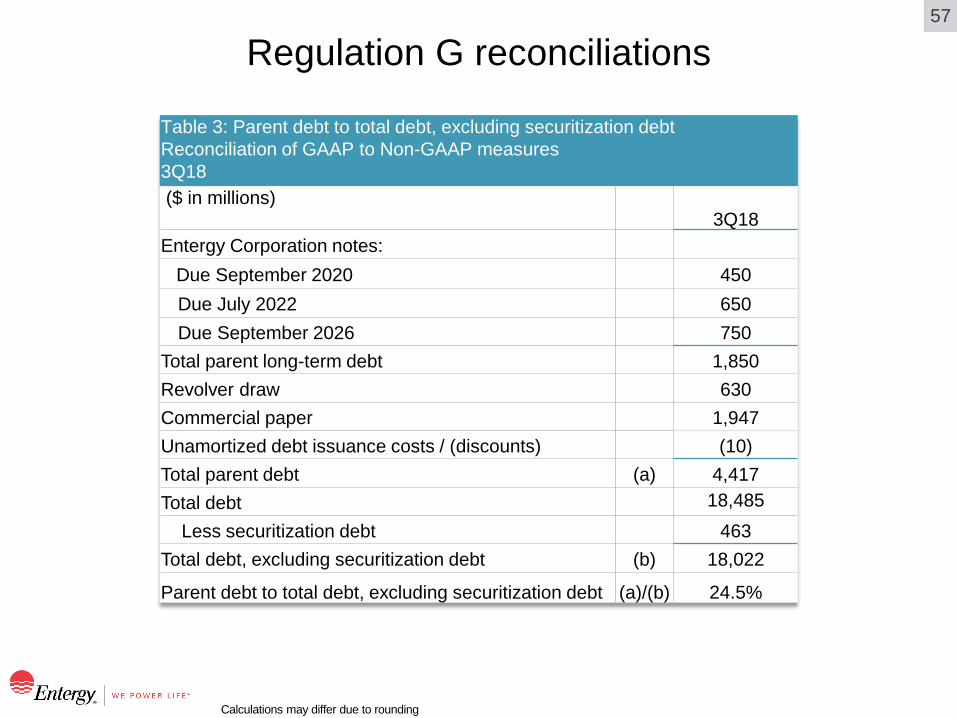
Table 3: Parent debt to total debt, excluding securitization debt
Reconciliation of GAAP to Non-GAAP measures 3Q18 ($ in millions)
3Q18 Entergy Corporation notes: Due September 2020 450
Due July 2022 650 Due September 2026 750
Total parent long-term debt 1,850 Revolver draw 630 Commercial paper 1,947 Unamortized debt issuance costs / (discounts) (10) Total parent debt (a) 4,417 Total debt 18,485 Less securitization debt 463 Total debt, excluding securitization debt (b) 18,022
Parent debt to total debt, excluding securitization debt (a)/(b) 24.5%

58
Regulation G reconciliations
Calculations may differ due to rounding
Table 4: Operational FFO to debt, excluding securitization debt Reconciliation of GAAP to Non-GAAP measures 3Q18
($ in millions) 3Q18 OCF (LTM) 2,770 AFUDC-borrowed funds (LTM) (57) Less working capital in OCF (LTM): Receivables (53) Fuel inventory 26 Accounts payable 258 Taxes accrued 10 Interest accrued (3) Other working capital accounts (9) Securitization regulatory charges 125
Total 354 FFO (LTM) 2,359 Add back FFO specials (LTM): Items associated with decisions to close or sell EWC nuclear plants (pre-tax) - Operational FFO (LTM) (a) 2,359 Total debt 18,485 Less securitization debt 463 Total debt, excluding securitization debt (b) 18,022 Operational FFO to debt, excluding securitization debt (a)/(b) 13.1% Estimated return of unprotected excess ADIT (rolling 12-months pre-tax) (c) 342 Operational FFO to debt ratio, excluding securitization debt and the return of unprotected excess ADIT ((a)+(c))/(b) 15.0%
59
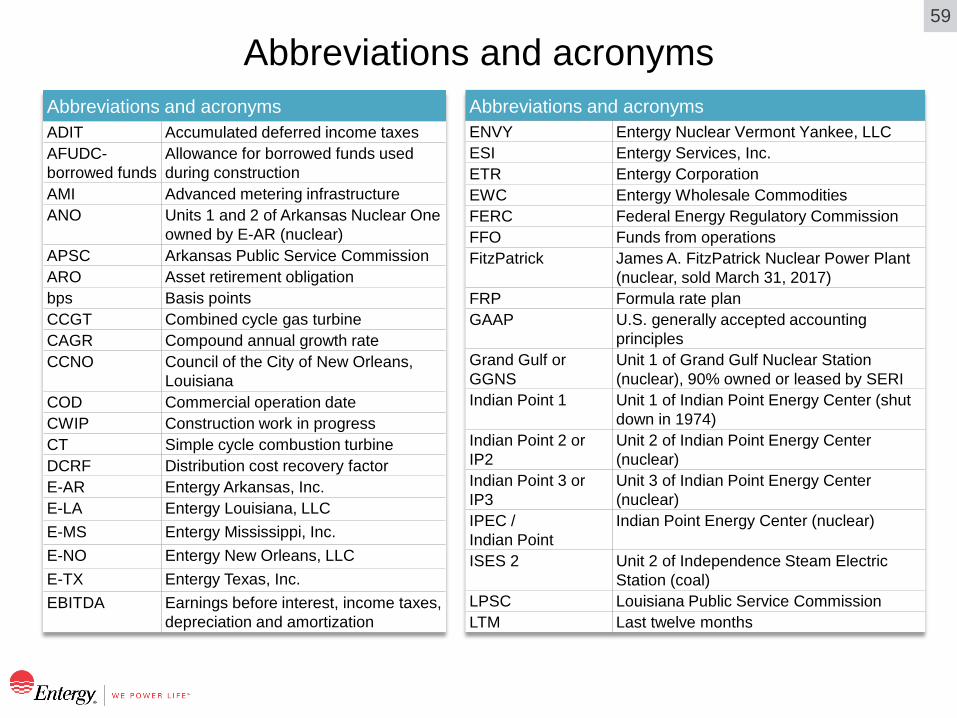
Abbreviations and acronyms Abbreviations and acronyms ADIT Accumulated deferred income taxes AFUDC-borrowed funds
Allowance for borrowed funds used during construction
AMI Advanced metering infrastructure ANO Units 1 and 2 of Arkansas Nuclear One
owned by E-AR (nuclear) APSC Arkansas Public Service Commission ARO Asset retirement obligation bps Basis points CCGT Combined cycle gas turbine CAGR Compound annual growth rate CCNO Council of the City of New Orleans,
Louisiana COD Commercial operation date CWIP Construction work in progress CT Simple cycle combustion turbine DCRF Distribution cost recovery factor E-AR Entergy Arkansas, Inc. E-LA Entergy Louisiana, LLC E-MS Entergy Mississippi, Inc. E-NO Entergy New Orleans, LLC E-TX Entergy Texas, Inc. EBITDA Earnings before interest, income taxes,
depreciation and amortization
Abbreviations and acronyms ENVY Entergy Nuclear Vermont Yankee, LLC ESI Entergy Services, Inc. ETR Entergy Corporation EWC Entergy Wholesale Commodities FERC Federal Energy Regulatory Commission FFO Funds from operations FitzPatrick James A. FitzPatrick Nuclear Power Plant
(nuclear, sold March 31, 2017) FRP Formula rate plan GAAP U.S. generally accepted accounting
principles Grand Gulf or GGNS
Unit 1 of Grand Gulf Nuclear Station (nuclear), 90% owned or leased by SERI
Indian Point 1 Unit 1 of Indian Point Energy Center (shut down in 1974)
Indian Point 2 or IP2
Unit 2 of Indian Point Energy Center (nuclear)
Indian Point 3 or IP3
Unit 3 of Indian Point Energy Center (nuclear)
IPEC / Indian Point
Indian Point Energy Center (nuclear)
ISES 2 Unit 2 of Independence Steam Electric Station (coal)
LPSC Louisiana Public Service Commission LTM Last twelve months
60
Abbreviations and acronyms (continued) Abbreviations and acronyms
RICE Reciprocating internal combustion engine ROE Return on equity River Bend River Bend Station (nuclear) RS Cogen RS Cogen facility (CCGT cogeneration) RSP Rate stabilization plan S&P S&P Global Ratings SERI System Energy Resources, Inc. TCRF Transmission cost recovery factor Union Union Power Station (CCGT) UPSA Unit power sales agreement VPUC Vermont Public Utility Commission VY / Vermont Yankee
Vermont Yankee Nuclear Power Station (nuclear)
Waterford Waterford Steam Electric Station, Unit No. 3 (nuclear)
WACC Weighted-average cost of capital
Abbreviations and acronyms MISO Midcontinent Independent System
Operator, Inc. Moody’s Moody’s Investors Service MPSC Mississippi Public Service Commission MTEP MISO Transmission Expansion Planning NDT Nuclear decommissioning trust Nelson 6 Unit 6 of Roy S. Nelson plant (coal) NEPOOL New England Power Pool Ninemile 6 Ninemile Point Unit 6 (CCGT) NOPS New Orleans Power Station (reciprocating
internal combustion engine/natural gas) NorthStar NorthStar Decommissioning Holdings, LLC NRC Nuclear Regulatory Commission NYISO New York Independent System Operator,
Inc. O&M Operation and maintenance expense OCF Net cash flow provided by operating
activities OpCo Utility operating company Palisades Palisades Power Plant (nuclear) Pilgrim Pilgrim Nuclear Power Station (nuclear) PUCT Public Utility Commission of Texas