Embed Size (px)
Citation preview

RCSA Web Survey
Round 28 – November 2008

Executive Summary
Summary Business confidence has dropped to the lowest since 2001, a drop of 21% while expectations
of growth have become negative for the first time with a drop of 5% to -0.8% There has been a strong increase in the number of applicants for positions and become
considerably easier to find appropriate applicants for positions. Conditions have improved back to those experienced in April 2004
o All locations are finding very similar labour market conditions except NZ is getting more applicants for positions
Staff turnover has remained stable at 36% pa organisations have contracted by 2.1% and become negative for the first time since December 2001
o Qld has 10% higher staff turnover and 7% greater staff loss There has been a substantial drop in permanent full-time placements while on-hire
employment and contractor placements have increased slightly. 12% of on-hired employees converted to permanent positions in the last six months while permanent employees converting to on-hired employment was 5%.
Permanent placements have dropped by 4% to 5% thus on-hired replacements have become proportionally more significant with a rise of 3% to 94% of the total number of placements
Accordingly, the proportion of revenue from on-hired employment has risen by 6% to 54% while that of recruitment services has dropped 3% to 42%
o SA and WA get a larger proportion of revenue from on-hired employees & contractorso NZ gets a larger proportion of from recruitment services
Note: If locational differences are not mentioned, the differences are insufficient for comment

Executive Summary
Summary – issues of most concern Concerns about the state of the economy have jumped again from 84% to 94%
while lack of suitable candidates has dropped to 3rd spot. Concerns about the lack of hiring intentions of clients has jumped again from 3rd place to 2nd with concerns increasing 21% to 88%. Concerns about maintaining profitability/fee levels have also increased 20% to 70% an along with it concerns about price undercutting
o NSW is more financing growth and least about employment legislationo VIC is not substantially different from averageo QLD is more worried industrial relationso SA is more concerned retaining suitable recruitment staff, workers compensation,
employment legislation, and unfair dismissal and less worried about finding suitable candidates, restructuring industries and the cost of advertising
o WA is more concerned legal issues about on-hired staff and immigration issues and less concerned about finding recruitment staff
o NZ is more worried about finding and retaining suitable recruitment staff and restructuring industries and less worried about the cost of advertising and industrial relations
Note: If locational differences are not mentioned, the differences are insufficient for comment

Executive Summary - Skills
The 2 skills with the biggest shortages are non-building professional engineers, associates and technician experiencing a 6% - 8% drop in demand.
The demand for health professionals and nurses remains static while rising to in place.
The demand for business professionals has slumped for the second survey in a row by a further15% to 21% from 4th to 14th place.
The demand for building professionals has also slumped 10% to 18%. Demand for other skills had generally dropped 3% - 8% and is consistent with a
general easing of the economy and labour market conditions The top 12 skills shortages being:
o Non-building professional engineers o Non-building engineering associates and technicians o Health professionals o Nurses o Medical technicians o Electrical trades (building) o Non-building electrical/electronic trades o Mobile plant operators o Building associates and technicians o Carpenters and joiners o Plumbers o Metal trades

Excutive summary cont’d
The majority of respondents (94%) source candidates by approaching passive candidates. A two thirds use niche or specialist internet job boards while nearly two thirds use refer a friend incentives
o NSW is more likely to use social networking sites
o VIC less likely to use internet job boards
o QLD is less likely to use refer a friend
o SA and WA are more likely to use refer a friend incentives
o NZ is more likely to use internet job boards
Nearly two thirds took action to address the market downturn in the last three months and nearly half addressed marketing expenses. The next priority is the number of recruiters per staff member followed by international revenue

Process
Web surveyo E-mail business heads in both NZ and Australia
o 177 responses
o Data collection began early October 2008 and completed 7 November 2008

Demographics of sampleThe number of sole traders in the sample remains stable at16%
Location differences:There are a higher proportion of sole traders in NZ
Sole trader16%
Other84%
Trader status

$1,674
$1,565
$1,346
$331
$577
$1,534
$312
$106
$268
$7,713
38%
34%
39%
13%
17%
21%
7%
8%
19%
0% 10% 20% 30% 40% 50%
NSW
Victoria
Queensland
ACT
South Australia
Western Australia
Tasmania
Northern Territory
New Zealand
(note multiple locations allowed sums to more than 100%)
Location company operates in
22%
20%
17%
4%
7%
20%
4%
1%
3%
0% 10% 20% 30% 40%
NSW
Victoria
Queensland
ACT
South Australia
Western Australia
Tasmania
Northern Territory
New Zealand
Proportion of revenue generated by location
Demographics of sampleThe total annual revenue of respondent companies is $7.7 billion up from $6.0 billion last round.
This large increase is due to an increase in large companies responding
Total
Ann
ual r
even
ue $
m
Total Australia=$7.45bApprox 97% of revenue

Demographics of sampleThe proportion of $100m+ companies increased by 2% from last round to 5%.
22
35
21
8
10
5
0 10 20 30 40
Under $1m
$1M to $5M
$5M to $10M
$10M to $20M
$20M to $100M
$100M and above
% of sample
Annual turnover of companies
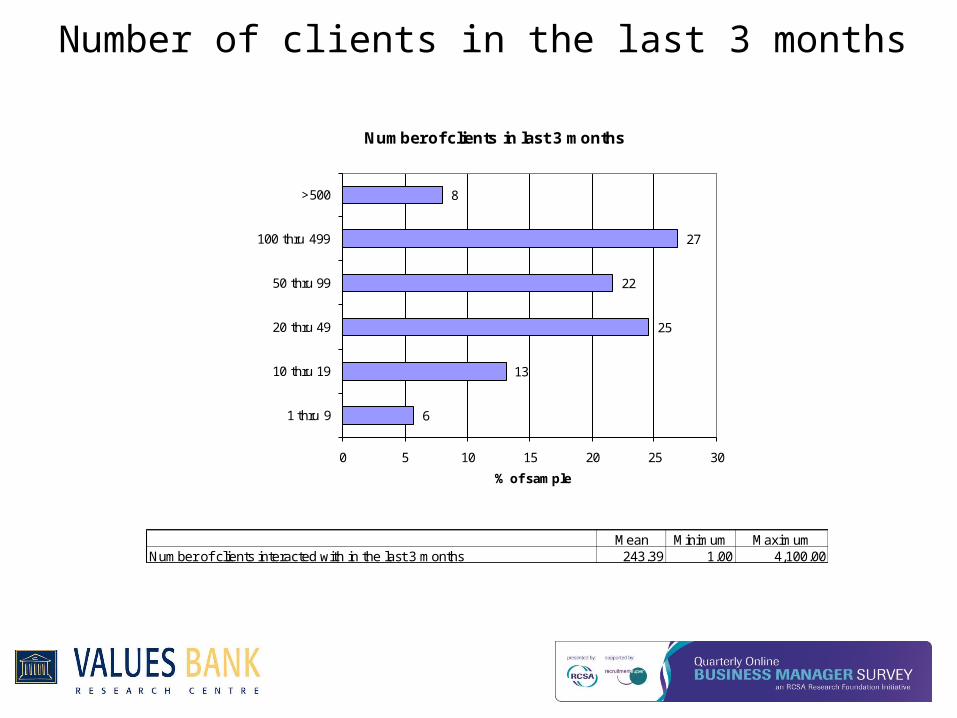
Number of clients in the last 3 months
6
13
25
22
27
8
0 5 10 15 20 25 30
1 thru 9
10 thru 19
20 thru 49
50 thru 99
100 thru 499
>500
% of sample
Number of clients in last 3 months
Mean Minimum MaximumNumber of clients interacted with in the last 3 months 243.39 1.00 4,100.00

Business confidence has dropped to the lowest since 2001, a drop of 21% while expectations of growth have become negative for the first time with a
drop of 5% to -0.8%.
Scale:0=strongly disagree50=neutral100=strongly agree
DifferencesNone Location differences:
NSW and WA are slightly less confident while SA is slightly more confident
40.0
50.0
60.0
70.0
80.0
Av
era
ge
I am confident that our business will improve over the next three months
-1%0%1%2%3%4%5%6%7%8%
Av
era
ge
Volume (%) your business will change next quarter

Staff turnover has remained stable at 36% pa organisations have contracted by 2.1% and become negative for the first time since December 2001
Differences•Qld has 10% higher staff turnover and 7% greater staff loss
10%
15%
20%
25%
30%
35%
40%
45%
50%
55%
60%
Sep
t (2001)
Dec (2001)
Feb
(2002)
July (2002)
Sep
t (2002)
Dec (2002)
Mar (2003)
Jun
(2003)
Sep
t (2003)
Dec (2003)
Ap
ril (2004)
Jun
e (2004)
Sep
t (2004)
Dec (2004)
Ap
ril (2005)
Au
g (2005)
No
v (2005)
Feb
(2006)
Jun
(2006)
Sep
t (2006)
Dec(2006)
March
(2007)
Jun
e(2007)
Sep
t(2007)
Dec(2007)
Ap
ril(2008)
Au
g(2008)
No
v(2008)
Ave
rag
e
Staff turnover (% annualised)
-15%
-10%
-5%
0%
5%
10%
15%
20%
25%
Sep
t (2001)
Dec (2001)
Feb
(2002)
July (2002)
Sep
t (2002)
Dec (2002)
Mar (2003)
Jun
(2003)
Sep
t (2003)
Dec (2003)
Ap
ril (2004)
Jun
e (2004)
Sep
t (2004)
Dec (2004)
Ap
ril (2005)
Au
g (2005)
No
v (2005)
Feb
(2006)
Jun
(2006)
Sep
t (2006)
Dec(2006)
March
(2007)
Jun
e(2007)
Sep
t(2007)
Dec(2007)
Ap
ril(2008)
Au
g(2008)
No
v(2008)
Ave
rag
e
Staff growth (% annualised)

There has been a strong increase in the number of applicants for positions and become considerably easier to find appropriate applicants for positions.
Conditions have improved back to those experienced in April 2004.
Scale:0=strongly disagree50=neutral100=strongly agree
Differences•All locations are finding very similar labour market conditions except NZ is getting more applicants for positions
20
30
40
50
60
70
80
Sep
t (2001)D
ec (2001)F
eb (2002)
July (2002)
Sep
t (2002)D
ec (2002)M
ar (2003)Ju
n (2003)
Sep
t (2003)D
ec (2003)A
pril (2004)
Jun
e (2004)S
ept (2004)
Dec (2004)
Ap
ril (2005)A
ug
(2005)N
ov (2005)
Feb
(2006)Ju
n (2006)
Sep
t (2006)D
ec(2006)M
arch(2007)
Jun
e(2007)S
ept(2007)
Dec(2007)
Ap
ril(2008)A
ug
(2008)N
ov(2008)
Av
era
ge
s
Labour market scoresIt is easy to find appropriate applicants for positions
Applicants generally have the appropriate work ready attitudes
Applicants generally have the right mix and level of skills
Applicants generally have the right capabilities
Irrespective of appropriateness there are at least as many applicants for positions as needed

0% 20% 40% 60% 80% 100%
It is easy to find appropriate applicants for positions
Applicants generally have the appropriate work ready attitudes
Applicants generally have the right mix and level of skills
Applicants generally have the right capabilities
Irrespective of appropriateness there are at least as many applicants for positions as there are positions
13%
42%
39%
65%
45%
15%
24%
24%
24%
9%
72%
34%
36%
11%
46%
Labour market
%Agree %Neutral %Disagree
There has been a lift in the capability, skills and attitudes of available applicants
-10%
-7%
+8%
-9%+12%
+12%
+9% -10%

Staff placed and on-hired workersThere has been a substantial drop in permanent full-time placements while on-hire employment and contractor placements have increased slightly. 12% of on-hired
employees converted to permanent positions in the last six months while permanent employees converting to on-hired employment was 5%.
August 2008
Note: variability may arise because of a few large numbers – this is a problem of small data sets
Mean Minimum MaximumPermanent full-time placements 115.23 0 5,406Permanent part-time placements 7.33 0 500On-hire employment & contractors 1,179.62 0 130,000
On-hired employees converting to permanent - last six months% 16.41 0.00 100.00Permanent employees converting to on-hired - last six months% 4.08 0.00 100.00
November 2008
Mean Minimum MaximumPermanent full-time placements 71.14 0 4,500Permanent part-time placements 12.56 0 800On-hire employment & contractors 1,211.54 0 100,000
On-hired employees converting to permanent - last six months% 11.74 0.00 70.00Permanent employees converting to on-hired - last six months% 4.92 0.00 100.00

Permanent placements have dropped by 4% to 5% thus on-hired replacements have become proportionally more significant with a rise of
3% to 94% of the total number of placements
12%4% 7% 4% 5%
9%
14% 11%5% 5%
13%5% 5%
10% 7% 6%13% 15%
9% 5%1% 1% 0% 0% 0% 1%
2% 2% 0% 1% 1% 0% 1% 1% 0% 0% 1% 1% 1% 1%
86%
95%93% 95%
94% 90%85% 87%
94% 95%85%
95% 95%90% 93% 94%
86% 84%91%94%
0%
20%
40%
60%
80%
100%
Ave
rag
ePlacement by type (%)
Permanent full-time placements Permanent part-time placements
On-hire employment & contractor

Accordingly, the proportion of revenue from on-hired employment has risen by 6% to 54% while that of recruitment services has dropped 3% to 42%
Difference from average•SA and WA get a larger proportion of revenue from on-hired employees & contractors•NZ gets a larger proportion of from recruitment services
44%
47%52%57%
48%51%
51%47% 47%
51% 52% 50%45% 43%
47% 48%45%
50%45%
54%
38% 37% 37% 35%
43%
37%
44% 43% 43%45% 45%
42% 43%47%
43% 43%48%
45%49%
42%
0%
10%
20%
30%
40%
50%
60%
70%
Ave
rag
eService revenue (%)
On-hired employee & contractor services Recruitment services

A substantial proportion of companies have neither contractors nor on-hire employees.
19
14
7
9
11
13
17
10
0 5 10 15 20
None
1 thru 19
20 thru 49
50 thru 99
100 thru 199
200 thru 499
500 thru 1999
>2000
% of sample
On-hire & contactor numbers on books
33
24
12
16
19
23
30
17
0 10 20 30 40
None
1 thru 19
20 thru 49
50 thru 99
100 thru 199
200 thru 499
500 thru 1999
>2000
Number
On-hire & contractor numbers on books

4
27
51
63
66
94
0 20 40 60 80 100
Second Life or other virtual worlds
Other
Social networking sites (e.g Facebook LinkedIn
MySpace)
Refer a f riend incentives
Increasing the use of niche/specialist internet
job boards
Approaching passive candidates
% of sample
Media used to source candidates
The majority of respondents (94%) source candidates by approaching passive candidates. A two thirds use niche or
specialist internet job boards while nearly two thirds use refer a friend incentives
Differences•NSW is more likely to use social networking sites•VIC less likely to use internet job boards•QLD is less likely to use refer a friend•SA and WA are more likely to use refer a friend incentives •NZ is more likely to use internet job boards

0% 10% 20% 30% 40% 50% 60% 70% 80% 90% 100%
Industrial relations
Difficultly in retaining suitable recruitment staff
Financing growth
Restructuring industries
Cost of advertising
Difficultly in finding suitable recruitment staff
Price undercutting in our industry
Maintaining profitability/fee levels
Lack of suitable candidates
Lack of hiring intentions by clients
State of the economy
24%
27%
39%
43%
43%
44%
67%
70%
75%
88%
94%
76%
73%
61%
57%
57%
56%
33%
30%
25%
12%
6%
%Agree %Disagree
Concerns for the present and near future (all respondents)
Concerns about the state of the economy have jumped again from 84% to 94% while lack of suitable candidates has dropped to 3rd spot. Concerns about the lack of hiring intentions of clients has jumped again from 3 rd place to 2nd with
concerns increasing 21% to 88%. Concerns about maintaining profitability/fee levels have also increased 20% to 70% an along with it concerns about price undercutting.

0% 20% 40% 60% 80% 100%
OH&S Issues (Australia)
Workers' compensation legislation (Australia)
Employment legislation (Australia)
Immigration issues (Australia)
Legal issues about on-hired staf f (Australia)
New Zealand
Workers' compensation legislation (Australia)
Unfair dismissal and casuals (Australia)
OH&S Issues (Australia)
Immigration issues (Australia)
Employment legislation (Australia)
Legal issues about on-hired staf f (Australia)
Australia
39%
39%
42%
44%
55%
28%
31%
33%
40%
42%
44%
61%
61%
58%
56%
45%
72%
69%
67%
60%
58%
56%
%Agree %Disagree
Concerns for the present and near future (National issues)
Concerns about national issues remain stable and of relatively low concern compared with the economy. Local concerns range from 44% to 30%.

Location differences have reduced this round
Note: <50=less than neutral50=neutral>50 = greater than neutral
Compared to average•NSW is more financing growth and least about employment legislation•VIC is not substantially different from average•QLD is more worried industrial relations•SA is more concerned retaining suitable recruitment staff, workers compensation, employment legislation, and unfair dismissal and less worried about finding suitable candidates, restructuring industries and the cost of advertising •WA is more concerned legal issues about on-hired staff and immigration issues and less concerned about finding recruitment staff•NZ is more worried about finding and retaining suitable recruitment staff and restructuring industries and less worried about the cost of advertising and industrial relations
Variable NSW VIC Qld SA WA NZWeighted
aveSubstantially less than averageSubstantially more than average
State of the economy 96.00 93.00 95.00 100.00 94.00 100.00 95.81Lack of suitable candidates 67.00 68.00 75.00 61.00 70.00 66.00 68.52Lack of hiring intentions by clients 91.00 92.00 89.00 93.00 92.00 95.00 91.60Difficultly in finding suitable recruitment staff 42.00 43.00 31.00 32.00 28.00 51.00 37.79Difficultly in retaining suitable recruitment staff 34.00 37.00 33.00 51.00 35.00 52.00 38.52Financing growth 45.00 38.00 33.00 31.00 38.00 34.00 37.21Maintaining profitability/fee levels 74.00 71.00 71.00 70.00 78.00 68.00 72.18Price undercutting in our industry 71.00 65.00 65.00 62.00 62.00 67.00 65.77Restructuring industries 39.00 34.00 35.00 29.00 32.00 53.00 36.62Cost of advertising 27.00 31.00 36.00 17.00 27.00 20.00 27.78Industrial relations 27.00 31.00 30.00 35.00 34.00 22.00 29.77Workers' compensation legislation (Australia) 42.00 44.00 43.00 53.00 49.00 45.22Employment legislation (Australia) 42.00 48.00 47.00 61.00 58.00 49.54Legal issues about on-hired staff (Australia) 59.00 65.00 61.00 73.00 76.00 65.33Immigration issues (Australia) 51.00 44.00 52.00 58.00 63.00 52.44OH&S Issues (Australia) 37.00 38.00 39.00 43.00 38.00 38.64Unfair dismissal and casuals (Australia) 26.00 33.00 30.00 38.00 30.00 30.73

Skills shortages by occupation

27%
19%
25%
23%
21%
13%
13%
8%
10%
11%
10%
13%
12%
10%
8%
3%
4%
4%
3%
6%
11%
18%
11%
7%
6%
13%
11%
15%
12%
11%
12%
8%
10%
11%
10%
14%
13%
13%
13%
10%
21%
17%
20%
19%
23%
19%
21%
24%
24%
22%
23%
22%
22%
31%
28%
29%
35%
34%
31%
32%
2%
4%
0%
1%
0%
3%
3%
1%
4%
6%
3%
3%
4%
22%
10%
2%
7%
10%
8%
6%
1%
1%
1%
1%
1%
1%
1%
0%
1%
1%
1%
1%
0%
2%
2%
0%
2%
1%
2%
1%
0% 10% 20% 30% 40% 50% 60% 70% 80% 90% 100%
Non-building professional engineers
Non-building engineering associates and technicians
Health professionals
Nurses
Medical technicians
Electrical trades (building)
Non-building electrical/electronic trades
Mobile plant operators
Building associates and technicians
Carpenters and joiners
Plumbers
Metal trades
Drivers
Business professionals
Building professionals
Machine and stationary plant operators
IT and telecommunications professionals
Receptionists and telephonists
IT and telecommunications technicians
IT and telecommunications trades
Supply of skills by occupation in order of total shortage
Shortage long term
Shortage short term
Neutral
Over supply short term
Over supply long term
Skills shortages by occupation – top 20 The 2 skills with the biggest shortages are non-building professional engineers, associates and technician experiencing a 6% - 8% drop in demand. The demand for health professionals and nurses remains static while rising to in place. The demand for business professionals has slumped for the second survey in a row by a further15% to 21% from 4 th to 14th place. The demand for building
professionals has also slumped 10% to 18%. Demand for other skills had generally dropped 3% - 8% and is consistent with a general easing of the economy and labour market conditions.
To
tal
sho
rtag
e
38%37%35%30%27%26%24%24%22%22%22%22%22%21%18%17%16%16%16%15%

11%
8%
4%
10%
8%
10%
8%
8%
3%
3%
3%
8%
7%
4%
3%
6%
2%
3%
3%
3%
3%
4%
7%
11%
5%
6%
4%
6%
5%
10%
10%
9%
3%
3%
6%
7%
4%
7%
6%
5%
2%
0%
29%
26%
31%
28%
26%
34%
27%
34%
39%
30%
27%
28%
33%
29%
32%
28%
28%
33%
30%
29%
41%
1%
3%
12%
1%
4%
1%
4%
1%
9%
5%
7%
4%
4%
5%
21%
7%
10%
8%
9%
7%
1%
0%
1%
1%
0%
1%
1%
1%
1%
2%
1%
0%
1%
0%
1%
11%
1%
0%
0%
1%
0%
1%
0% 10% 20% 30% 40% 50% 60% 70% 80% 90% 100%
School teachers
Bricklayers
Sales staf f (not professionals)
Rail drivers
Wall tilers
Scientists
Roofers
Scientif ic technicians
Other clerks
Mining labourers
Trades assistants and factory hands
Agricultural labourers
Social professionals
Food trades
General managers
Vehicle trades
Waiters and restaurant staf f
Other personal service workers
Building & construction labourers
Cleaners
Farm managers
Supply of skills by occupation in order of total shortage
Shortage long term
Shortage short term
Neutral
Over supply short term
Over supply long term
Skills shortages by occupation – bottom 20
To
tal
sho
rtag
e

Top 10 skill shortages by location
NSW1. Non-building professional engineers
2. Non-building engineering associates and technicians
3. Health professionals
4. Nurses
5. Medical technicians
6. Electrical trades (building)
7. Mobile plant operators
8. Non-building electrical/electronic trades
9. Drivers
10. IT and telecommunications technicians
VIC1. Non-building professional engineers
2. Non-building engineering associates and technicians
3. Health professionals
4. Nurses
5. Medical technicians
6. Electrical trades (building)
7. Non-building electrical/electronic trades
8. Metal trades
9. Mobile plant operators
10. Drivers

Top 10 skill shortages by location
Queensland1. Non-building engineering associates and
technicians
2. Non-building professional engineers
3. Health professionals
4. Nurses
5. Medical technicians
6. Electrical trades (building)
7. Non-building electrical/electronic trades
8. Mobile plant operators
9. Plumbers
10. Metal trades
South Australia1. Non-building engineering associates and
technicians
2. Health professionals
3. Non-building professional engineers
4. Mobile plant operators
5. Nurses
6. Electrical trades (building)
7. Medical technicians
8. Non-building electrical/electronic trades
9. Metal trades
10. Machine and stationary plant operators

Top 10 skill shortages by location
Western Australia
1. Non-building engineering associates and technicians
2. Health professionals
3. Non-building professional engineers
4. Nurses
5. Medical technicians
6. Mobile plant operators
7. Electrical trades (building)
8. Non-building electrical/electronic trades
9. Machine and stationary plant operators
10. Metal trades
New Zealand
1. Non-building engineering associates and technicians
2. Health professionals
3. Medical technicians
4. Drivers
5. Non-building professional engineers
6. Nurses
7. Mobile plant operators
8. IT and telecommunications trades
9. IT and telecommunications technicians
10. Electrical trades (building)

Special section
Recruitment and the global economy

Nearly two thirds took action to address the market downturn in the last three months and nearly half addressed marketing expenses. The next
priority is the number of recruiters per staff member followed by international revenue.
MeansLast three
monthsNext three months Difference
Action to address the market downturn 73.25 73.75 -0.50Marketing expenses 55.25 51.25 4.00Number of recruiters per support staff member 52.75 52.00 0.75International revenue 48.25 48.75 -0.50Number of blue collar appointments 47.00 46.25 0.75Total revenue 45.25 43.75 1.50Number of white collar appointments 44.50 47.00 -2.50

0% 20% 40% 60% 80% 100%
Action to address the market downturn
Marketing expenses
Total revenue
Number of white collar appointments
Number of recruiters per support staff member
Number of blue collar appointments
International revenue
71
46
36
22
21
13
12
28
30
14
37
69
64
70
2
25
49
41
10
23
18
Action last three months
%Increase %Neutral %Decrease

0% 20% 40% 60% 80% 100%
Action to address the market downturn
Total revenue
Marketing expenses
Number of white collar appointments
Number of recruiters per support staff member
International revenue
Number of blue collar appointments
74
32
32
27
18
17
16
23
14
40
37
71
61
57
3
53
28
36
11
22
27
Action next three months
%Increase %Neutral %Decrease