Embed Size (px)
Citation preview
SUSTAINABLE RECYCLED MATERIALS FOR CONCRETE PAVEMENTS
Prepared By: Applied Pavement Technology, Inc.
115 West Main Street, Suite 400 Urbana, IL 61801
217-398-3977 www.appliedpavement.com
March 2011
p r o v i d i n g e n g i n e e r i n g s o l u t i o n s t o i m p r o v e p a v e m e n t p e r f o r m a n c e

Michigan Department Of Transportation
1959 (10/08)
TECHNICAL REPORT
DOCUMENTATION PAGE
1. REPORT NO. 2. GOVERNMENT ACCESSION NO. 3. MDOT PROJECT MANAGER
5. REPORT DATE 4. TITLE AND SUBTITLE
6. PERFORMING ORGANIZATION CODE
7. AUTHOR(S) 8. PERFORMING ORG. REPORT NO.
10. WORK UNIT NO. (TRAIS)
11. CONTRACT NO.
9. PERFORMING ORGANIZATION NAME AND ADDRESS
11a. AUTHORIZATION NO.
13. TYPE OF REPORT & PERIOD COVERED12. SPONSORING AGENCY NAME AND ADDRESS
14. SPONSORING AGENCY CODE
15. SUPPLEMENTARY NOTES
16. ABSTRACT
17. KEY WORDS 18. DISTRIBUTION STATEMENT No restrictions. This document is available to the public through the Michigan Department of Transportation.
19. SECURITY CLASSIFICATION - report 20. SECURITY CLASSIFICATION - page 21. NO. OF PAGES 22. PRICE
John Belcher
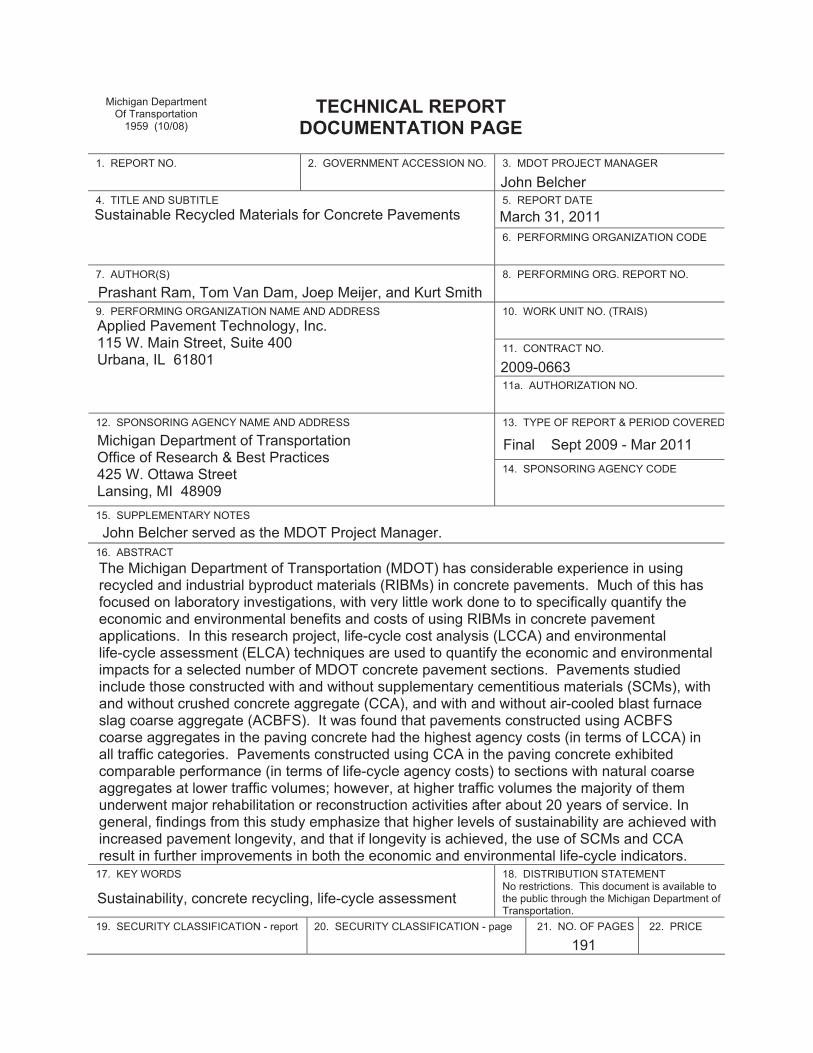
Sustainable Recycled Materials for Concrete Pavements March 31, 2011
Prashant Ram, Tom Van Dam, Joep Meijer, and Kurt Smith
Applied Pavement Technology, Inc.115 W. Main Street, Suite 400Urbana, IL 61801
2009-0663
Michigan Department of TransportationOffice of Research & Best Practices425 W. Ottawa StreetLansing, MI 48909
Final Sept 2009 - Mar 2011
John Belcher served as the MDOT Project Manager.
The Michigan Department of Transportation (MDOT) has considerable experience in usingrecycled and industrial byproduct materials (RIBMs) in concrete pavements. Much of this hasfocused on laboratory investigations, with very little work done to to specifically quantify theeconomic and environmental benefits and costs of using RIBMs in concrete pavementapplications. In this research project, life-cycle cost analysis (LCCA) and environmentallife-cycle assessment (ELCA) techniques are used to quantify the economic and environmentalimpacts for a selected number of MDOT concrete pavement sections. Pavements studiedinclude those constructed with and without supplementary cementitious materials (SCMs), withand without crushed concrete aggregate (CCA), and with and without air-cooled blast furnaceslag coarse aggregate (ACBFS). It was found that pavements constructed using ACBFScoarse aggregates in the paving concrete had the highest agency costs (in terms of LCCA) inall traffic categories. Pavements constructed using CCA in the paving concrete exhibitedcomparable performance (in terms of life-cycle agency costs) to sections with natural coarseaggregates at lower traffic volumes; however, at higher traffic volumes the majority of themunderwent major rehabilitation or reconstruction activities after about 20 years of service. Ingeneral, findings from this study emphasize that higher levels of sustainability are achieved withincreased pavement longevity, and that if longevity is achieved, the use of SCMs and CCAresult in further improvements in both the economic and environmental life-cycle indicators.
Sustainability, concrete recycling, life-cycle assessment
191
March 2011 Sustainable Recycled Materials for Concrete Pavements – Final Report
ii Applied Pavement Technology, Inc.
Sustainable Recycled Materials for Concrete Pavements – Final Report March 2011
Applied Pavement Technology, Inc. iii
ACKNOWLEDGMENTS
This project could not have been conducted without the assistance and guidance provided by numerous MDOT employees. Their tireless efforts in digging up old records, in reviewing and critiquing the research team’s work approach, and in helping to establish values for use in the data analysis strongly contributed to a refined final product. The research team specifically acknowledges the contributions of the following MDOT staff:
• Joy Angel • John Belcher • Andrew Bennett • Steve Hawker • Benjamin Krom • Ruth Proctor • Alan Robords • Tim Stallard • John Staton • Tom Woodhouse
The authors are also grateful to a number of cement manufacturers for their cooperation and contributions to the study. The contents of this document reflect the views of the authors, who are responsible for the facts and the accuracy of the data presented within. The contents do not necessarily reflect the official views and policies of the Michigan Department of Transportation. This report does not constitute a standard, specification, or regulation.

March 2011 Sustainable Recycled Materials for Concrete Pavements – Final Report
iv Applied Pavement Technology, Inc.
Sustainable Recycled Materials for Concrete Pavements – Final Report March 2011
Applied Pavement Technology, Inc. v
EXECUTIVE SUMMARY
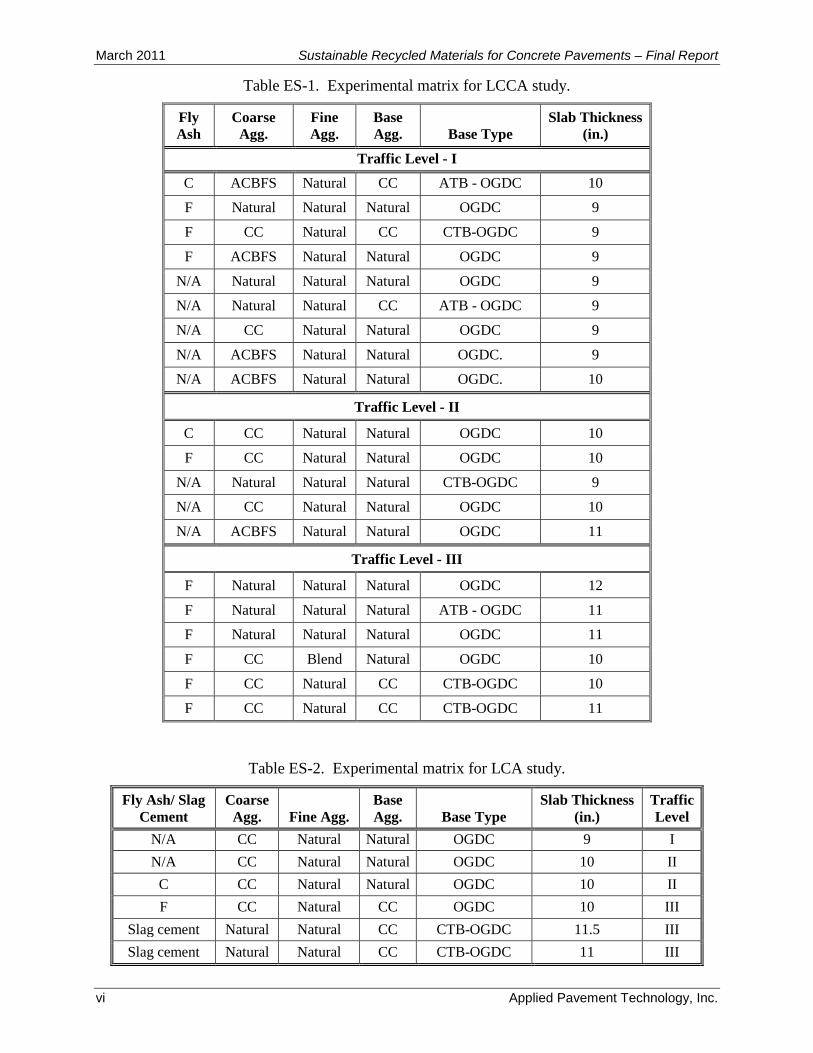
For many decades, the Michigan Department of Transportation (MDOT) has conducted a considerable amount of work on the specific use of recycled and industrial byproduct materials (RIBMs) in concrete pavements. As is true with most of the work done nationally and internationally on this topic, laboratory investigations of the materials and their use in concrete dominates the literature, with considerably less information provided on constructability and actual field performance. At the same time, little research has been done in Michigan (or elsewhere) to specifically quantify the economic and environmental benefits or the associated costs of using RIBMs in concrete pavement applications. MDOT enlisted the services of Applied Pavement Technology, Inc. (APTech) and theRightenvironment Ltd. to conduct an assessment of the economic and environmental benefits and costs associated with the use of RIBMs in concrete pavement construction. The details of this assessment and the interpretation of sustainability indicators based on life-cycle cost analysis (LCCA) and life-cycle assessment (LCA) techniques are documented in this report. Background Life-cycle cost analysis (LCCA) is an engineering economic analysis tool used to assess the total cost of constructing, operating, and maintaining an asset or a system of assets over an extended period of time. LCCA can help pavement engineers evaluate various design strategies based on costs incurred by both the agency and by the users over the life of the facility. Life cycle assessment (LCA) is a powerful tool used to measure environmental performance in terms of impact categories. It is based on material, energy, emission, and waste data for every phase of every material that is part of the life-cycle of a product, service, or policy. In combination, these two tools provide a good measure of economic and environmental impacts over the entire life cycle of the project. Under this study, LCCA and LCA were performed on a selected number of MDOT concrete pavement sections where good maintenance and performance data were available. The selection included a range of pavements with and without supplementary cementitious materials (SCMs) in the paving concrete, with and without crushed concrete aggregate in the paving concrete or in the base course, and with and without air-cooled blast furnace slag (ACBFS) in the paving concrete. The selected pavement sections were grouped into three different traffic intensity categories based on present year commercial vehicle AADT (vehicles per day) categories: Level I: < 6000; Level II: 6000-10000; and Level III: > 10000, with predicted annual growth rates of 2-3 percent. The majority of the pavement sections considered for the LCCA were constructed in the 1980s. A subset of the LCCA sections was selected for the LCA modeling. Additionally, two new pavement sections that were constructed in 2010 on I-96 (Lansing) and I-94 (Jackson) were considered in the LCA modeling to capture the implications of some recent MDOT innovative design and construction practices. The experimental matrix for the LCCA and LCA studies are shown in tables ES-1 and ES-2, respectively. These tables highlight all the independent variables used in the LCCA and the LCA models.
March 2011 Sustainable Recycled Materials for Concrete Pavements – Final Report
vi Applied Pavement Technology, Inc.
Table ES-1. Experimental matrix for LCCA study.
Fly Ash
Coarse Agg.
Fine Agg.
Base Agg. Base Type
Slab Thickness (in.)
Traffic Level - I C ACBFS Natural CC ATB - OGDC 10 F Natural Natural Natural OGDC 9 F CC Natural CC CTB-OGDC 9 F ACBFS Natural Natural OGDC 9
N/A Natural Natural Natural OGDC 9 N/A Natural Natural CC ATB - OGDC 9 N/A CC Natural Natural OGDC 9 N/A ACBFS Natural Natural OGDC. 9 N/A ACBFS Natural Natural OGDC. 10
Traffic Level - II C CC Natural Natural OGDC 10 F CC Natural Natural OGDC 10
N/A Natural Natural Natural CTB-OGDC 9 N/A CC Natural Natural OGDC 10 N/A ACBFS Natural Natural OGDC 11
Traffic Level - III F Natural Natural Natural OGDC 12 F Natural Natural Natural ATB - OGDC 11 F Natural Natural Natural OGDC 11 F CC Blend Natural OGDC 10 F CC Natural CC CTB-OGDC 10 F CC Natural CC CTB-OGDC 11
Table ES-2. Experimental matrix for LCA study.
Fly Ash/ Slag Cement
Coarse Agg. Fine Agg.
Base Agg. Base Type
Slab Thickness (in.)
Traffic Level
N/A CC Natural Natural OGDC 9 I N/A CC Natural Natural OGDC 10 II
C CC Natural Natural OGDC 10 II F CC Natural CC OGDC 10 III
Slag cement Natural Natural CC CTB-OGDC 11.5 III Slag cement Natural Natural CC CTB-OGDC 11 III
Sustainable Recycled Materials for Concrete Pavements – Final Report March 2011
Applied Pavement Technology, Inc. vii
Sustainability Indicators The LCCA was the tool used to evaluate the economic costs and the LCA technique was adopted to assess the environmental impacts and benefits. The following indicators were used in each analysis: Economic Indicators
• Agency Costs – Up to present age and over a 50-year analysis period.
• User Costs – Up to present age and over a 50-year analysis period. Environmental Indicators
• Energy use, expressed in Mega Joules (MJ).
• Carbon (CO2)-footprint based on carbon footprint equivalents.
• Eutrophication and acidification to measure the environmental impact on water quality. Eutrophication refers to the level to which the emissions (nitric and phosphorous substances) impact the environment and acidification refers to the level to which the emissions (ammonia, NOx and SOx) contribute to the acidification of soil or water.
• Volume of secondary (recycled) material as compared to the volume of primary (natural or virgin) material.
• Transportation intensity in terms of ton-miles. Transportation intensity refers to the impact of fuel usage involved in transporting the various raw materials and other products that are involved in the pavement construction process.
Summary of Research Findings Based on the results of the study, the following findings are presented:
• Pavements constructed using ACBFS coarse aggregate in the paving concrete had the highest agency costs (in the LCCA) in all traffic categories. The majority of these sections underwent complete reconstruction or received jointed plain concrete pavement (JPCP) inlays after approximately 20 years of service.
• Pavement sections constructed using crushed concrete (CC) coarse aggregates in the paving concrete exhibited comparable performance (in terms of life-cycle agency costs) to sections with natural coarse aggregates at lower levels of commercial traffic. At higher traffic levels, sections with CC in the concrete mixture underwent complete reconstruction or received JPCP inlays after about 20 years of service.
• It is noted that all the ACBFS and the CC sections considered in this study are jointed reinforced concrete pavement (JRCP) designs, which MDOT discontinued as their standard pavement type in the early to mid 2000s when they moved to JPCP designs. Poor performance of ACBFS and CC sections in Michigan’s JRCP designs has been partially attributed to long joint spacing, leading to poor aggregate interlock at mid-panel cracks in conjunction with less than ideal slab support from the underlying aggregate base for paving concrete made with these coarse aggregates.
• The increased use of SCMs results in a significantly lower carbon footprint because of the reduction in the amount of portland cement clinker usage.
March 2011 Sustainable Recycled Materials for Concrete Pavements – Final Report
viii Applied Pavement Technology, Inc.
• Class F fly ash (as specified under ASTM C618) used as a replacement for portland cement in the paving concrete did not have any appreciable effect on the LCCA, even though it can significantly improve the long-term durability of concrete. Two pavement sections studied had Class C fly ash in the mixture, and both performed poorly. Because none of the sections in the LCCA study incorporated the use of slag cement, its life-cycle economic impact could not be assessed.
• Although there were seven sections that included CC in the base course, the effect of CC in the base course could not be evaluated for traffic levels II and III because there were no sections in traffic level II category and the four sections in the traffic level III category were all under concrete constructed using CC in the paving concrete. In traffic level I, two sections containing CC base course performed exceptionally well, suggesting that if done correctly, CC can serve as effective base material. The use of ACBFS coarse aggregate as a base material was not evaluated.
• In general, the findings from this study emphasize that longevity (which minimizes the need for maintenance/rehabilitation) is the most important factor in achieving a concrete pavement system with minimal environmental impact. Hence, increasing the service life of concrete pavement while minimizing future rehabilitation activities is the most important factor in reducing the environmental impact over the life cycle.
• HMA overlays should be applied only when the full lifespan of the overlay can be utilized. Placing HMA overlays on existing concrete pavement to correct functional deficiencies (e.g. roughness, skid, noise, and so on) is not necessarily a sustainable strategy. The use of diamond grinding as an alternative to placing an HMA overlay may be a viable option under such circumstances, but was not considered in this study. Further, if the concrete pavement exhibits a significant amount of distress that results in premature failure of the HMA overlay, other options including unbonded concrete overlays (not evaluated in this study) or reconstruction likely will be more a more sustainable solution.
• The thickness of the HMA overlay has a significant influence on the environmental impacts. For example, a two-course 3.5-inch HMA overlay results in a reduction of approximately 70 percent in the energy usage and also about a 15 percent reduction in all other sustainability categories when compared to a three course 6.5-inch HMA overlay. The same applies to the use of on-site recycling as opposed to regional recycling of the concrete pavement. Note that similar performance is assumed for the two overlay thicknesses, an assumption that is likely not borne out in practice. Policy governing the thickness of any HMA overlay placed on concrete should be revisited to ensure that the minimum HMA thickness is applied to address the functional and structural requirements of the pavement.
Recommendations The following general recommendations are made on the use of RIBMs and on the consideration of environmental effects:
• For a given cementitious content, decreasing the portland cement clinker content through the increased use of SCMs, to the degree practical, is encouraged. It will reduce the amount of portland cement used per volume of concrete and thereby significantly reduce the carbon footprint of the paving concrete.
Sustainable Recycled Materials for Concrete Pavements – Final Report March 2011
Applied Pavement Technology, Inc. ix
• In addition to the above recommendation, reducing the overall cementitious materials content by optimizing other concrete mixture parameters (such as through the use of an optimized aggregate gradation) is a complementary strategy that can result in increased sustainability for concrete pavements. MDOT has already taken significant steps in this direction, but additional exploitation of this strategy can further enhance the sustainability of concrete pavements as long as performance is not compromised.
• For a given transportation mode, locally available materials (cement, SCMs and aggregates) should be considered to the extent possible provided they are of acceptable quality level to produce pavements that will achieve the expected design life. This will drastically reduce the transportation-related costs and environmental impacts associated with the shipping of the materials. Alternatively, materials shipped using lower impact modes of transportation (i.e., ship, rail) can also result in significant economic and environmental savings.
• Re-use of local materials (on-site recycling) should be encouraged. This will reduce the economic and environmental impact due to mining and transportation of new materials. These materials can potentially be used in a number of pavement-related applications (e.g., concrete or HMA surface course, cement or asphalt stabilized base course, fill, riprap, and so on).
• An HMA overlay should be applied only if the full potential lifespan of the overlay can be utilized before the underlying concrete pavement fails, necessitating the application of another HMA overlay or complete reconstruction.
• Since valid data are important for any study, and since LCA is an emerging field in the evaluation of concrete pavements in the U.S., it is recommend that MDOT work internally and with its market partners to collect, maintain, and utilize current environmental process data. Specifically, MDOT should look to collect data that relates to material and energy consumption, emissions to water, air and soil, and waste related to processes and materials applied by, or on behalf of, MDOT.
• The results of the LCA conducted for this study can be used to develop a simple strategic tool to evaluate how material choices affect certain environmental impact categories.
Future Research Directions Based on the results of this work, recommendations for future work and activities are summarized below:
• The LCA model can be improved by refining definitions and inventory for the various maintenance processes.
• The use of CC in the concrete mixture has been used in the past for high traffic volume mainline pavements by MDOT with mixed results and is not currently permitted. There are a quite a few CC pavement sections considered in this study that exhibit comparable performance to sections constructed using natural aggregates under lower truck traffic volumes. Further, CC has not been used in the paving concrete designed and constructed to MDOT’s current design standards so it is recommended that test sections be constructed with CC in the paving concrete and their performance monitored to better establish the actual economic and environmental benefits and costs of increased use of CC.

March 2011 Sustainable Recycled Materials for Concrete Pavements – Final Report
x Applied Pavement Technology, Inc.
• Based on the results, it is of interest to evaluate a scenario where long-life concrete pavements are designed with a slightly thicker surface in anticipation of future diamond grinding used to maintain serviceability over the entire analysis period in lieu of converting the pavement to a composite section via HMA overlays. This is a strategy that some other DOT’s have applied but was not considered in the analysis conducted as part of this study because it is not part of MDOT’s current standard practice.
Sustainable Recycled Materials for Concrete Pavements – Final Report March 2011
Applied Pavement Technology, Inc. xi
TABLE OF CONTENTS
EXECUTIVE SUMMARY .......................................................................................... V Background ................................................................................................................ v Sustainability Indicators .......................................................................................... vii
Economic Indicators ................................................................................................ vii Environmental Indicators ......................................................................................... vii
Summary of Research Findings .............................................................................. vii Recommendations ................................................................................................... viii Future Research Directions ......................................................................................ix
1. INTRODUCTION.................................................................................................... 1 Background ................................................................................................................ 1
RIBMs as Cementitious Materials ............................................................................ 1 RIBMs as Aggregates .............................................................................................. 2 Economic Impact of using RIBMs ............................................................................ 3 Environmental Impact of using RIBMs ..................................................................... 4 Special Construction Considerations When Using RIBMs ....................................... 5
Project Objectives ..................................................................................................... 5 Report Organization .................................................................................................. 6
2. DATA COLLECTION AND DATA ASSEMBLY ............................................ 7 Introduction ................................................................................................................ 7 Data Collection........................................................................................................... 7
Project Location Information .................................................................................... 7 Pavement Design and Concrete Mix Design Data ................................................... 8 Traffic Data .............................................................................................................. 8 Construction and Maintenance Costs ...................................................................... 8 Environmental Data .................................................................................................. 9
Data Assembly ........................................................................................................... 9 LCCA Data Assembly .............................................................................................. 9
Establish Project Identification Number ................................................................ 9 Convert Data into a Common Electronic Format .................................................. 9 Predict Pavement Performance and Estimate Future Maintenance/ Rehabilitation Activities ......................................................................................... 9 Traffic Projections and Grouping ........................................................................ 13
LCA Data Assembly ............................................................................................... 15 Cement and Energy Data Collection .................................................................. 15 Other Concrete Constituents .............................................................................. 16 Additional Material Inputs ................................................................................... 16 Construction, Maintenance and End-of-life Processes ....................................... 16
Final Data Assembly .............................................................................................. 16 LCCA Data Summary ......................................................................................... 16 LCA Data Summary ............................................................................................ 18
Summary .................................................................................................................. 18 3. LIFE CYCLE COST ANALYSIS ...................................................................... 21
Introduction .............................................................................................................. 21 MDOT LCCA Practices ............................................................................................ 22
Background and Development ............................................................................... 22 The MDOT LCCA Model ........................................................................................ 22
March 2011 Sustainable Recycled Materials for Concrete Pavements – Final Report
xii Applied Pavement Technology, Inc.
LCCA Program Selection ........................................................................................ 22 LCCA Inputs ............................................................................................................. 23
Analysis Options .................................................................................................... 23 Analysis Period ................................................................................................... 24 Discount Rate ..................................................................................................... 24
Traffic Data Input .................................................................................................... 25 Value of User Time ................................................................................................ 26 Traffic Hourly Distribution ....................................................................................... 26 Construction Costs and Service Life ...................................................................... 27
LCCA Results ........................................................................................................... 28 Traffic Level I Deterministic LCCA Results ............................................................ 28
Up-to-Present-Age Analysis ............................................................................... 28 50-Year Analysis Period ..................................................................................... 30
Traffic Level II Deterministic LCCA Results ........................................................... 32 Up-to-Present-Age Analysis ............................................................................... 32 50-Year Analysis Period ..................................................................................... 34
Traffic Level III Deterministic LCCA Results .......................................................... 35 Up-to-Present-Age Analysis ............................................................................... 35 50-Year Analysis Period ..................................................................................... 37
Summary .................................................................................................................. 39 4. LIFE CYCLE ASSESSMENT ........................................................................... 41
Introduction .............................................................................................................. 41 Impact Categories and Environmental Indicators ................................................ 42
Selection for this Project ........................................................................................ 44 Pavement System Boundaries ............................................................................... 44
Life-Cycle Phases .................................................................................................. 44 Pavement Design ................................................................................................... 45 Sections ................................................................................................................. 46 Concrete Mix Design .............................................................................................. 46
Additional Material Inputs ................................................................................... 47 Base Course .......................................................................................................... 47 Maintenance/Rehabilitation .................................................................................... 47 End-of-Life ............................................................................................................. 49
Allocation ................................................................................................................. 49 Recycling ............................................................................................................... 49 Landfill .................................................................................................................... 49
Calculations Rules ................................................................................................... 49 Data Quality .............................................................................................................. 50 Limitations ............................................................................................................... 50 LCA Results ............................................................................................................. 50
Impact Assessment ................................................................................................ 51 Impact of HMA Overlay Thickness ......................................................................... 53
Summary .................................................................................................................. 54 5. CONCLUSIONS, RECOMMENDATIONS, AND IMPLEMENTATION ... 55
Summary .................................................................................................................. 55 Economic and Environmental Performance ........................................................... 55 Results ................................................................................................................... 55
LCCA Results ..................................................................................................... 56 LCA Results........................................................................................................ 56
Sustainable Recycled Materials for Concrete Pavements – Final Report March 2011
Applied Pavement Technology, Inc. xiii
Limitations .............................................................................................................. 57 Recommendations ................................................................................................... 57 Future Research Directions .................................................................................... 58 Recommended Implementation Plan ..................................................................... 59
Work Plan – Investigator Portion ............................................................................ 59 Work Plan – MDOT Portion .................................................................................... 60
Concluding Remarks ............................................................................................... 60 REFERENCES .......................................................................................................... 61 APPENDIX A – SECTIONS SELECTED FOR LCCA STUDY ....................A-1 APPENDIX B – DISTRESS INDEX CURVES ..................................................B-1 APPENDIX C – MAINTENANCE CYCLES AND COSTS ........................... C-1 APPENDIX D – PROBABILISTIC LCCA CURVES ...................................... D-1 APPENDIX E – TORNADO PLOTS ...................................................................E-1 APPENDIX F – LCA-BASED SUSTAINABILITY EVALUATION ............... F-1 APPENDIX G – IMPLEMENTATION PLAN .................................................... G-1
March 2011 Sustainable Recycled Materials for Concrete Pavements – Final Report
xiv Applied Pavement Technology, Inc.
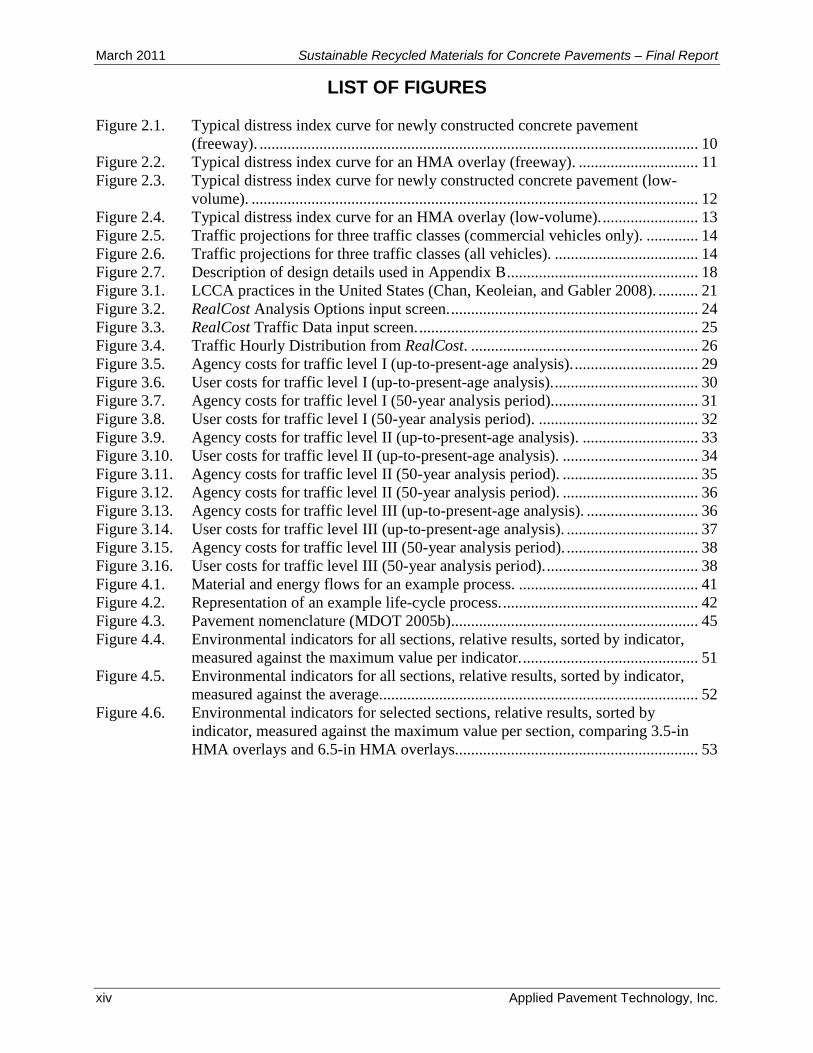
LIST OF FIGURES Figure 2.1. Typical distress index curve for newly constructed concrete pavement
(freeway). .............................................................................................................. 10 Figure 2.2. Typical distress index curve for an HMA overlay (freeway). .............................. 11 Figure 2.3. Typical distress index curve for newly constructed concrete pavement (low-
volume). ................................................................................................................ 12 Figure 2.4. Typical distress index curve for an HMA overlay (low-volume). ........................ 13 Figure 2.5. Traffic projections for three traffic classes (commercial vehicles only). ............. 14 Figure 2.6. Traffic projections for three traffic classes (all vehicles). .................................... 14 Figure 2.7. Description of design details used in Appendix B ................................................ 18 Figure 3.1. LCCA practices in the United States (Chan, Keoleian, and Gabler 2008). .......... 21 Figure 3.2. RealCost Analysis Options input screen. .............................................................. 24 Figure 3.3. RealCost Traffic Data input screen. ...................................................................... 25 Figure 3.4. Traffic Hourly Distribution from RealCost. ......................................................... 26 Figure 3.5. Agency costs for traffic level I (up-to-present-age analysis). ............................... 29 Figure 3.6. User costs for traffic level I (up-to-present-age analysis). .................................... 30 Figure 3.7. Agency costs for traffic level I (50-year analysis period)..................................... 31 Figure 3.8. User costs for traffic level I (50-year analysis period). ........................................ 32 Figure 3.9. Agency costs for traffic level II (up-to-present-age analysis). ............................. 33 Figure 3.10. User costs for traffic level II (up-to-present-age analysis). .................................. 34 Figure 3.11. Agency costs for traffic level II (50-year analysis period). .................................. 35 Figure 3.12. Agency costs for traffic level II (50-year analysis period). .................................. 36 Figure 3.13. Agency costs for traffic level III (up-to-present-age analysis). ............................ 36 Figure 3.14. User costs for traffic level III (up-to-present-age analysis). ................................. 37 Figure 3.15. Agency costs for traffic level III (50-year analysis period). ................................. 38 Figure 3.16. User costs for traffic level III (50-year analysis period). ...................................... 38 Figure 4.1. Material and energy flows for an example process. ............................................. 41 Figure 4.2. Representation of an example life-cycle process. ................................................. 42 Figure 4.3. Pavement nomenclature (MDOT 2005b).............................................................. 45 Figure 4.4. Environmental indicators for all sections, relative results, sorted by indicator,
measured against the maximum value per indicator. ............................................ 51 Figure 4.5. Environmental indicators for all sections, relative results, sorted by indicator,
measured against the average. ............................................................................... 52 Figure 4.6. Environmental indicators for selected sections, relative results, sorted by
indicator, measured against the maximum value per section, comparing 3.5-in HMA overlays and 6.5-in HMA overlays............................................................. 53
Sustainable Recycled Materials for Concrete Pavements – Final Report March 2011
Applied Pavement Technology, Inc. xv
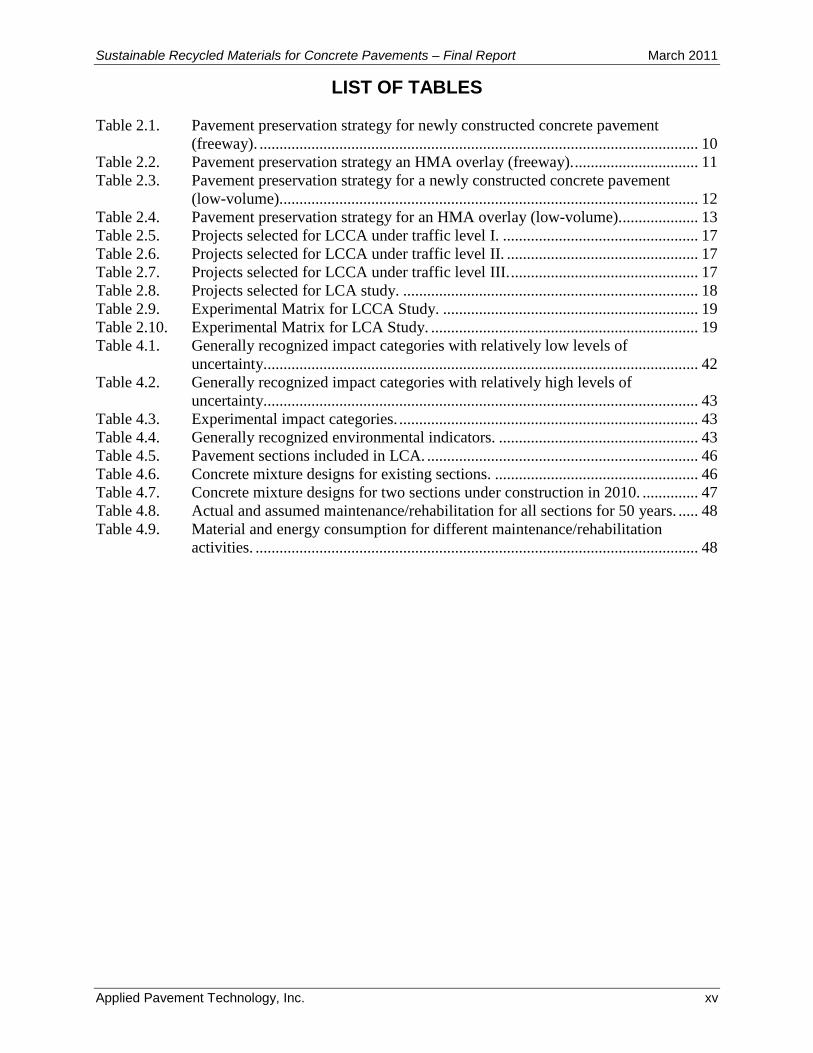
LIST OF TABLES Table 2.1. Pavement preservation strategy for newly constructed concrete pavement
(freeway). .............................................................................................................. 10 Table 2.2. Pavement preservation strategy an HMA overlay (freeway). ............................... 11 Table 2.3. Pavement preservation strategy for a newly constructed concrete pavement
(low-volume)......................................................................................................... 12 Table 2.4. Pavement preservation strategy for an HMA overlay (low-volume). ................... 13 Table 2.5. Projects selected for LCCA under traffic level I. ................................................. 17 Table 2.6. Projects selected for LCCA under traffic level II. ................................................ 17 Table 2.7. Projects selected for LCCA under traffic level III. ............................................... 17 Table 2.8. Projects selected for LCA study. .......................................................................... 18 Table 2.9. Experimental Matrix for LCCA Study. ................................................................ 19 Table 2.10. Experimental Matrix for LCA Study. ................................................................... 19 Table 4.1. Generally recognized impact categories with relatively low levels of
uncertainty............................................................................................................. 42 Table 4.2. Generally recognized impact categories with relatively high levels of
uncertainty............................................................................................................. 43 Table 4.3. Experimental impact categories. ........................................................................... 43 Table 4.4. Generally recognized environmental indicators. .................................................. 43 Table 4.5. Pavement sections included in LCA. .................................................................... 46 Table 4.6. Concrete mixture designs for existing sections. ................................................... 46 Table 4.7. Concrete mixture designs for two sections under construction in 2010. .............. 47 Table 4.8. Actual and assumed maintenance/rehabilitation for all sections for 50 years. ..... 48 Table 4.9. Material and energy consumption for different maintenance/rehabilitation
activities. ............................................................................................................... 48

March 2011 Sustainable Recycled Materials for Concrete Pavements – Final Report
xvi Applied Pavement Technology, Inc.
Sustainable Recycled Materials for Concrete Pavements – Final Report March 2011
Applied Pavement Technology, Inc. 1
1. INTRODUCTION
Background The Michigan Department of Transportation (MDOT) has successfully been using a number of recycled and industrial byproduct materials (RIBMs) in the construction of portland cement concrete (PCC) pavements (hereafter simply referred to as concrete pavements) for many years. These RIBMs have been incorporated into both the concrete and the base/subbase layers, as well as in other applications (such as fill or rip-rap). MDOT has also evaluated the potential use of industrial byproducts as subgrade modifiers/stabilizers in several studies conducted at Michigan Technological University. Although it is recognized that the proper use of RIBMs can enhance the sustainability of the pavement by improving the economic, environmental, and social attributes of the project, the inappropriate use or a poorly designed application can actually reduce the overall sustainability of the project if it results in poor or reduced performance. A pavement that suffers premature distress not only carries an increased economic burden, but also has significant adverse environmental and social impacts due to the production of the repair and replacement materials and the increased traffic delays and disruption to the users of the facility associated with the rehabilitation. A number of notable concrete pavement failures have occurred in Michigan where the presence of RIBMs in the paving concrete were at least partially implicated in the development of premature distress. This experience clearly demonstrates the need to systematically examine how RIBMs can be properly used to enhance concrete pavement sustainability in Michigan. The specific RIBMs that are or have been used by MDOT in concrete pavements in recent years include supplementary cementitious materials (SCMs, such as fly ash and slag cement), which are used as a partial replacement of portland cement in concrete, and aggregate materials (such as air-cooled blast furnace slag [ACBFS] and crushed concrete [CC] coarse aggregate) used in concrete or in granular base/subbase applications. These materials are of primary interest in this study. Other materials that have been used or investigated by MDOT (such as reverberatory furnace slag, steel furnace slag, foundry sands, and cement kiln dust [CKD], among others) are either no longer approved or are currently used to a much lesser degree and, therefore, are not investigated as a part of this study. RIBMs as Cementitious Materials In Michigan, fly ash has historically been the most commonly used SCM, usually added at the concrete plant as a supplement to or partial replacement of portland cement. Fly ash is a byproduct of the burning of pulverized coal in power plants, collected from the hot flue gases through various means. The ability of fly ash to supplement or replace portland cement has been recognized since the early 1900s, but it wasn’t until the 1960s that fly ash use in concrete started to be investigated on a more widespread basis. The first recorded use of fly ash by the Michigan State Highway Department (now MDOT) was an experimental concrete road constructed in 1955 featuring a control section (no added fly ash) and four test sections with varying combinations of cement and fly ash quantities (Legg 1965). The nominal pavement design was an 8-inch jointed reinforced pavement with transverse joints spaced at approximately 99-foot intervals and containing 1-inch diameter dowel bars. Although the fly ash used in this study had an exceptionally high loss on ignition (LOI) value of 13 to 14 percent, requiring heavy dosing of the vinsol resin air entraining admixture, after 8 years of service the four test sections were
March 2011 Sustainable Recycled Materials for Concrete Pavements – Final Report
2 Applied Pavement Technology, Inc.
performing similarly to the control section, which reflected the Highway Department’s then current mix design standard (5.5 sacks Type I cement, 3 to 6 percent air, 2-inch crushed dolomite coarse aggregate, local natural sand). Since that time, the inclusion of fly ash has become routine in Michigan, as it has elsewhere in the country where fly ash is available. Current MDOT standard specifications for construction (Section 601.03.G.3) permit fly ash to be used as a supplement/replacement of portland cement for both the paving concrete grades P1 and P2 as specified in Table 601-2 (MDOT 2003). Higher quantities of fly ash are permitted, up to a maximum of 25 percent, when substituted 1:1 for cement on a weight basis, if approved by the Engineer. Most of the fly ash used in Michigan is ASTM C618 Class C, which is typically cementitious in nature due to a relatively high free lime (CaO) content. Some of the Class C fly ash sources available in Michigan also exhibit a high alkali content (based on Na2O and K2O content). It is well documented in work conducted for MDOT, as well as in the national literature, that Class C fly ash can pose a problem when used in concrete containing aggregate susceptible to alkali-silica reactivity (ASR) (Van Dam et al. 2002; Malvar et al. 2002). Class C fly ash generally requires a higher rate of substitution to mitigate ASR than would a Class F fly ash, and at relatively low substitution rates of 10 to 20 percent, can actually exacerbate ASR (this is known as having a pessimum effect) (Malvar et al. 2002). In a study conducted by the National Concrete Pavement Technology Center (CP Tech Center) for the Michigan Concrete Pavement Association (Grove, Bektas, and Geiselman 2006), it was concluded that concrete mixtures in the Southeastern part of Michigan should make more use of Class F fly ash or slag cement to mitigate ASR, essentially supporting the findings drawn earlier by Van Dam et al. (2002). This is also a requirement for cementitious materials in MDOT’s Special Provision for High-Performance Portland Cement Concrete Grade P1 (Modified) dated August 5, 2005 (MDOT 2005a). Unfortunately, Class F fly ash suitable for use in concrete is not always readily available in much of Michigan, but slag cement has increasingly become available in recent years to meet the need. Slag cement (specified under ASTM C989, and previously referred to as ground granulated blast furnace slag) is produced from molten iron blast furnace slag which is rapidly quenched in water and then ground to a fineness comparable to portland cement. MDOT specifications (Section 601.03.G.3) allow up to 40 percent slag cement substitution of portland cement, although a lower replacement level is often used. Most difficulties surrounding the use of slag cement are a result of the slower rate of hydration. This is advantageous for construction during the summer, but can lead to delayed set and reduced rate of initial strength gain during cooler ambient temperatures typical of early and late season placements. The current specification also allows for the use of ternary cementitious blends consisting of portland cement, fly ash, and slag cement. MDOT specifications (Section 601.03.G.3) for ternary blends allow up to a 40 percent reduction in portland cement, of which the maximum fly ash quantity must not exceed 15 percent. These can be created by mixing portland cement and SCMs at the concrete plant or through the use of blended cements specified under ASTM C595. RIBMs as Aggregates Michigan also has a long history of using RIBMs as aggregate, including early use of CC in unbound base courses in the 1970s (Epps and O’Neal 1975), the well-publicized use of CC as coarse aggregate in concrete in the 1980s (Better Roads 1984; McCarthy 1985; McCarthy and
Sustainable Recycled Materials for Concrete Pavements – Final Report March 2011
Applied Pavement Technology, Inc. 3
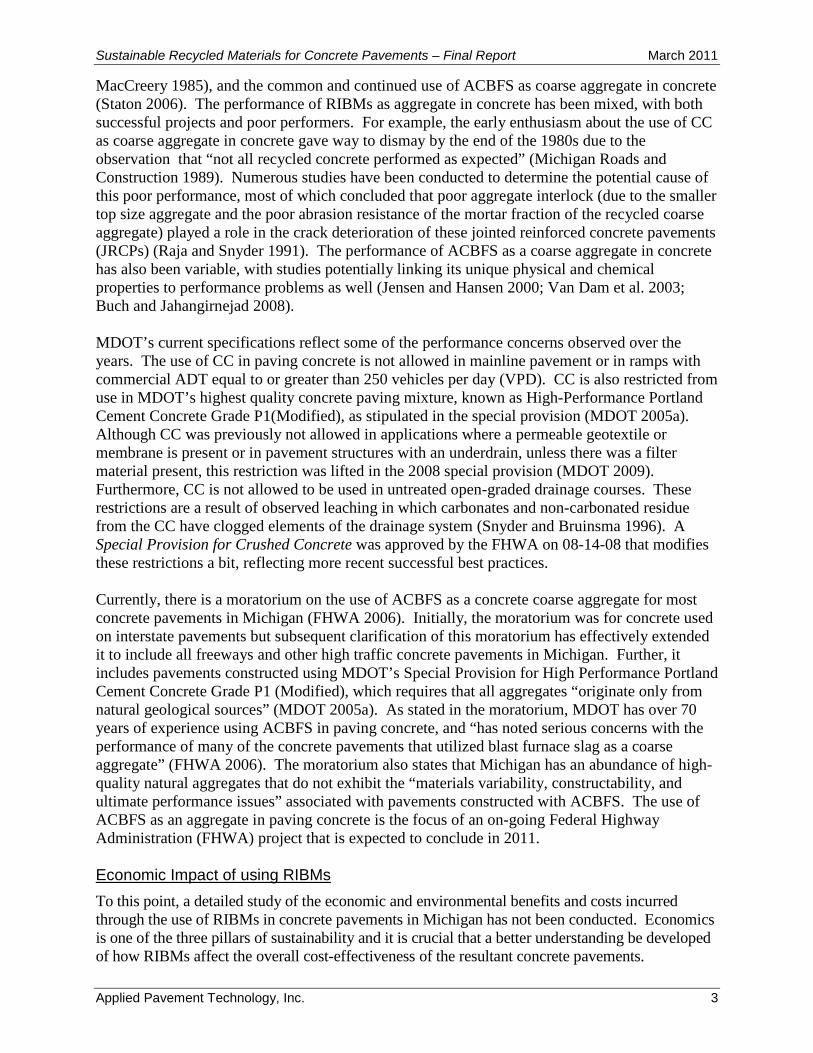
MacCreery 1985), and the common and continued use of ACBFS as coarse aggregate in concrete (Staton 2006). The performance of RIBMs as aggregate in concrete has been mixed, with both successful projects and poor performers. For example, the early enthusiasm about the use of CC as coarse aggregate in concrete gave way to dismay by the end of the 1980s due to the observation that “not all recycled concrete performed as expected” (Michigan Roads and Construction 1989). Numerous studies have been conducted to determine the potential cause of this poor performance, most of which concluded that poor aggregate interlock (due to the smaller top size aggregate and the poor abrasion resistance of the mortar fraction of the recycled coarse aggregate) played a role in the crack deterioration of these jointed reinforced concrete pavements (JRCPs) (Raja and Snyder 1991). The performance of ACBFS as a coarse aggregate in concrete has also been variable, with studies potentially linking its unique physical and chemical properties to performance problems as well (Jensen and Hansen 2000; Van Dam et al. 2003; Buch and Jahangirnejad 2008). MDOT’s current specifications reflect some of the performance concerns observed over the years. The use of CC in paving concrete is not allowed in mainline pavement or in ramps with commercial ADT equal to or greater than 250 vehicles per day (VPD). CC is also restricted from use in MDOT’s highest quality concrete paving mixture, known as High-Performance Portland Cement Concrete Grade P1(Modified), as stipulated in the special provision (MDOT 2005a). Although CC was previously not allowed in applications where a permeable geotextile or membrane is present or in pavement structures with an underdrain, unless there was a filter material present, this restriction was lifted in the 2008 special provision (MDOT 2009). Furthermore, CC is not allowed to be used in untreated open-graded drainage courses. These restrictions are a result of observed leaching in which carbonates and non-carbonated residue from the CC have clogged elements of the drainage system (Snyder and Bruinsma 1996). A Special Provision for Crushed Concrete was approved by the FHWA on 08-14-08 that modifies these restrictions a bit, reflecting more recent successful best practices. Currently, there is a moratorium on the use of ACBFS as a concrete coarse aggregate for most concrete pavements in Michigan (FHWA 2006). Initially, the moratorium was for concrete used on interstate pavements but subsequent clarification of this moratorium has effectively extended it to include all freeways and other high traffic concrete pavements in Michigan. Further, it includes pavements constructed using MDOT’s Special Provision for High Performance Portland Cement Concrete Grade P1 (Modified), which requires that all aggregates “originate only from natural geological sources” (MDOT 2005a). As stated in the moratorium, MDOT has over 70 years of experience using ACBFS in paving concrete, and “has noted serious concerns with the performance of many of the concrete pavements that utilized blast furnace slag as a coarse aggregate” (FHWA 2006). The moratorium also states that Michigan has an abundance of high-quality natural aggregates that do not exhibit the “materials variability, constructability, and ultimate performance issues” associated with pavements constructed with ACBFS. The use of ACBFS as an aggregate in paving concrete is the focus of an on-going Federal Highway Administration (FHWA) project that is expected to conclude in 2011. Economic Impact of using RIBMs To this point, a detailed study of the economic and environmental benefits and costs incurred through the use of RIBMs in concrete pavements in Michigan has not been conducted. Economics is one of the three pillars of sustainability and it is crucial that a better understanding be developed of how RIBMs affect the overall cost-effectiveness of the resultant concrete pavements.
March 2011 Sustainable Recycled Materials for Concrete Pavements – Final Report
4 Applied Pavement Technology, Inc.
Life-cycle cost analysis (LCCA), which is a valuable tool that has been utilized by the highway community for a number of years, is used in this study to establish the economic impact of RIBM utilization in concrete pavements. MDOT has long employed a basic LCCA approach, but the assumptions made in the MDOT approach are too broad to be of use for this project (Chan, Keoleian, and Gabler 2008). Instead, project specific cost and performance data obtained from MDOT records have been employed to calculate normalized (based on lane-mile and level of service) equivalent uniform annual costs (EUAC) for each project considered. The results of this economic analysis are used to evaluate the performance of designs, materials, and processes to determine those that are most cost effective, thereby helping MDOT determine which policies should be implemented to facilitate adoption of innovative sustainable practices. Environmental Impact of using RIBMs In addition to considering economic factors, one of the more critical challenges in this study was how environmental benefits and impacts were quantified and subsequently used to compare projects that were constructed with various types and quantities of RIBMs. A robust and unbiased quantification process based on life cycle assessment (LCA) was adopted, allowing the identification and promotion of effective solutions. The quantification process allowed the consideration of a broad number of alternatives so that comparisons could be made over a range of environmental considerations. In contrast to an LCCA, which is an economic analysis, an LCA evaluates the environmental impact over the life of a “product” (in this case, a concrete pavement) and considers all factors over that life span, including resource extraction, production/construction, maintenance and rehabilitation, and ultimately demolition/recycling. Environmental impacts that are common in an LCA include, among others, energy consumed, emissions of CO2 and other gases that contribute to an increased carbon footprint, ecosystem destruction, hazardous waste production, and human and ecosystem toxicity. An LCA is a powerful tool used to understand the broad environmental implications of decisions regarding concrete pavement materials selection, design, maintenance and rehabilitation strategies, and end-of-life decisions (e.g., recycling or disposal in a landfill). Therefore, a detailed LCA model was developed as a part of this study to evaluate the impact of RIBMs on the environmental impact of concrete pavements. For this study, a concrete pavement-specific life cycle inventory (LCI) was created using local/regional Michigan data combined with data from national averages. The LCI includes the flow of energy and materials entering into and out of the process under consideration, in this case the construction and operation of a concrete pavement. Conceptually, the LCI will track the amount of energy and raw materials needed to make cement; extract and transport aggregates; make concrete; construct, maintain, and rehabilitate a concrete pavement; and ultimately recycle or dispose of the pavement at the end of its life. It will also calculate the emissions and wastes associated with each operation and can use models to assess impact. The model used did not consider the operation of vehicles using the pavement (e.g., fuel consumption, emissions generated, and so on), nor the interaction of the pavement with the surrounding communities and environment (e.g., urban heat island effect, tire noise, and so on). Models capable of addressing those items are in the development stage and were not considered in this study.
Sustainable Recycled Materials for Concrete Pavements – Final Report March 2011
Applied Pavement Technology, Inc. 5
Of greatest interest to this study are values assigned to materials and processes for impact categories such as embodied energy1 (both primary and feedstock) and carbon footprint2. Also included were those associated with water (use, reuse, and treatment), noise, airborne particulate, emissions and human toxicity. The LCI was employed to assign ranking of the significance of the impact categories for all the materials and processes used in the design, initial construction, preservation, rehabilitation, and recycling of the pavements under study. Special Construction Considerations When Using RIBMs The use of RIBMs in concrete often requires special considerations during the construction process. For example, the use of SCMs such as fly ash and slag cement has significant effects on both the fresh and hardened properties of concrete, necessitating specialized care throughout the construction process (Taylor et al. 2007). For example, bleed water will be diminished and set times delayed when using most SCMs, increasing the potential for plastic shrinkage cracking. The tendency of experienced concrete construction workers accustomed to more conventional portland cement mixtures is to add water and/or overfinish the concrete surface, which can result in concrete containing an SCM being more susceptible to scaling under harsh winter conditions. In addition, SCMs can contribute to unexpected interactions that can significantly impact early set (leading to flash set) or prevent the formation of an effective air-void system. Similarly, RIBMs aggregates pose their own special considerations. Whether ACBFS or CC, the increased aggregate porosity and the inconsistent characteristics of particles will increase water demand. In the case of ACBFS, its dark color can contribute to increasing the temperature of fresh concrete during hot summer months. This makes managing the aggregate stockpiles and monitoring the water content that much more critical when using RIBMs aggregate in concrete. The higher level of angularity and variable surface porosity also results in mix water being drawn from fresh concrete if the aggregates are batched dry of saturated surface dry, thereby reducing the workability and increasing the potential for uncontrolled plastic and drying shrinkage cracking. This requires that extra care must be exercised throughout the construction process. Project Objectives The primary objective of this study is to assess the comparative economic and environmental benefits and costs of RIBMs and determine how these materials can be effectively used to increase the sustainability of concrete pavements in Michigan. This primary objective was accomplished by completion of the following activities:
1. Summarize MDOT’s current specifications for, and actual use of, fly ash, slag cement, CC, and ACBFS in the construction of concrete pavements.
2. Formulate an approach for quantifying economic and environmental costs and benefits over the entire life cycle for comparison of concrete pavements constructed using various recycled and industrial byproduct and traditional materials.
1 Embodied energy may be considered to be the total amount of energy used during the entire life cycle of a product including the energy used for manufacturing, transporting, and disposing of the product. Primary energy refers to the energy in its raw form (e.g., petroleum, coal, uranium). Feed stock energy refers to the chemical energy stored in a material when not used as a fuel. 2 Carbon Footprint = CO2 + 25CH4 + 298NO2
March 2011 Sustainable Recycled Materials for Concrete Pavements – Final Report
6 Applied Pavement Technology, Inc.
3. Employ the approach to evaluate a significant number of concrete pavements constructed with and without RIBMs using actual MDOT construction and performance data.
4. Document the results of the study in a final report for use by MDOT to assist in improving policy and specification decisions.
5. Develop an implementation plan that includes construction considerations for successful utilization of RIBMs in concrete pavements.
Report Organization This report consists of four chapters (in addition to this one) and seven appendices, as summarized below:
• Chapter 2: Data Collection and Data Assembly. • Chapter 3: Life-Cycle Cost Analysis. • Chapter 4: Life Cycle Assessment. • Chapter 5: Conclusions, Recommendations, and Implementation. • Appendix A: Sections Selected for LCCA Study. • Appendix B: Distress Index Curves. • Appendix C: Maintenance Cycle and Costs. • Appendix D: Probabilistic LCCA Curves. • Appendix E: LCCA Tornado Plots. • Appendix F: LCA-based Sustainability Evaluation. • Appendix G: Implementation Plan.
Chapter 1 summarized the background and the use of RIBMs as cementitious materials and as aggregates in the concrete mixture and the base course. The following chapter discusses details on the data collection and data assembly efforts performed under the study.
Sustainable Recycled Materials for Concrete Pavements – Final Report March 2011
Applied Pavement Technology, Inc. 7
2. DATA COLLECTION AND DATA ASSEMBLY
Introduction This chapter presents the details on the data collection and the data assembly efforts undertaken in this study. As a part of this project, a comprehensive database on concrete pavement construction and performance was compiled from hard-copy and electronic documents retrieved from MDOT Construction and Technology (C&T) Records Division, from the data set compiled by Al Robords at MDOT C&T, and through surveys of selected materials suppliers. The data set required for the LCCA analysis included the following:
• Project location information – control section and job number, route, beginning and ending mile points, directions and number of lanes.
• Pavement design and concrete mix design data.
• Sources of various materials used.
• Traffic information – construction year and historical annual average daily traffic (AADT) and percentage of trucks and commercial vehicles and traffic growth rates.
• Initial construction and maintenance costs. In addition to the LCCA data, the following data were required for the LCA modeling:
• Energy inputs.
• Material inputs.
• Emissions to air, water and soil.
• Production of waste and treatment.
• Produced products. All the information pertinent to this study was assembled into a common electronic format (Microsoft Excel® and Microsoft Access®). The assembled data sets were then merged to develop the project database for use in the analyses. Unfortunately, for most pavement sections examined, significant gaps or inconsistencies were identified in the data, and thus they were not included in this study. From the compiled database, 31 sections were identified for detailed analysis, chosen primarily because sufficient information was available in the pavement design, construction, maintenance, and traffic history. A separate database was then created to store the pertinent information. Specific details on the data collection and data assembly efforts are described in the following sections. Data Collection This section provides specifics on the data collected in order to develop the project database. Project Location Information The key data fields used to compile the project location dataset are:

March 2011 Sustainable Recycled Materials for Concrete Pavements – Final Report
8 Applied Pavement Technology, Inc.
• Control Section and Job Number for the various projects selected for this study. • Beginning and ending mile points. • Geographic location of the pavement section. • Date of opening the pavement to traffic loading.
These were provided in an electronic format by MDOT C&T. Pavement Design and Concrete Mix Design Data The typical pavement design and data collected for this study included:
• Pavement type (jointed reinforced or jointed plain concrete). • Pavement layer thicknesses. • Base type (untreated, treated-asphalt, treated-cement, or treated RIBMs). • Base coarse aggregate. • Base permeability. • MDOT Region. • Concrete binder (cement type, fly ash type, slag cement). • Concrete coarse aggregate. • Chemical admixtures. • Concrete fine aggregate. • Aggregate gradation.
In addition, specific information on the sources of the various materials was also collected from the individual project records retrieved from the MDOT Records Division in Lansing. Traffic Data The construction year traffic was obtained from the individual project records retrieved from the MDOT Records Center. Historic traffic data were obtained from the MDOT pavement management database provided electronically by MDOT. The traffic data collected had information on both commercial and passenger traffic. Construction and Maintenance Costs The initial construction costs were obtained from the original project contract documents retrieved from the MDOT Records Center. The initial construction costs include the cost of the concrete surface and the base course. It is noted that the shoulder construction and maintenance costs were not included as a part of this study. Also, the costs used in this study do not include profits and other overhead costs that may have been applied by the contractor. The cost data used in this study are purely for comparison purposes between the various projects selected for evaluation. When the data were available, actual maintenance costs provided by MDOT were used in the analysis. In cases where the maintenance cost data were not available, assumptions were made using the MDOT Pavement Design and Selection Manual (MDOT 2005b).

Sustainable Recycled Materials for Concrete Pavements – Final Report March 2011
Applied Pavement Technology, Inc. 9
Environmental Data The cement data used in the study were based on published information from the Portland Cement Association (PCA) (Marceau, Nisbet, and VanGeem 2006), as well as other market sources. The data were customized to reflect the cement production processes that are representative of the practices of cement companies supplying the Michigan market. The LCA data for the various concrete constituents are sourced from available literature, mostly from EcoInvent (http://www.ecoinvent.org, Swiss Centre for Life Cycle Inventories), and was adjusted using U.S. background data. Data Assembly The steps involved in the LCCA and LCA data assembly are discussed in this section. LCCA Data Assembly The LCCA data assembly consisted of the following key steps:
1. Establishing an identification number for each project selected for the analysis.
2. Converting data from all sources into a common electronic database.
3. Predicting pavement performance for future years and estimating future maintenance and rehabilitation activities.
4. Grouping projects based upon level of truck traffic loading and then by mix design.
5. Assembling the final database for use in analysis. Establish Project Identification Number Each project selected for this study is identified throughout the report using the following convention: “Control Section Number – Job Number.” This is consistent with the methodology adopted by MDOT. Convert Data into a Common Electronic Format The data for each of the projects selected for this study were obtained in various formats (hard copies, Microsoft® Excel and Access® files, and so on.). To facilitate easy access to the data, the data from the various sources were stored in a Microsoft® Excel spreadsheet format. Predict Pavement Performance and Estimate Future Maintenance/Rehabilitation Activities The pavement performance and maintenance/rehabilitation activities were estimated using the guidelines outlined in the MDOT Pavement Design and Selection Manual (MDOT 2005b). Although it is a generalized approach for estimating future maintenance costs and performance, it was adopted in this project to stay consistent with MDOT’s current practices. The pavement preservation strategies from Chapter 7 of the MDOT Pavement Design and Selection Manual (MDOT 2005b) were the only strategies considered in this analysis. All costs were adjusted to 2009 dollars. User costs were computed using RealCost Version 2.5 (FHWA 2010).
March 2011 Sustainable Recycled Materials for Concrete Pavements – Final Report
10 Applied Pavement Technology, Inc.
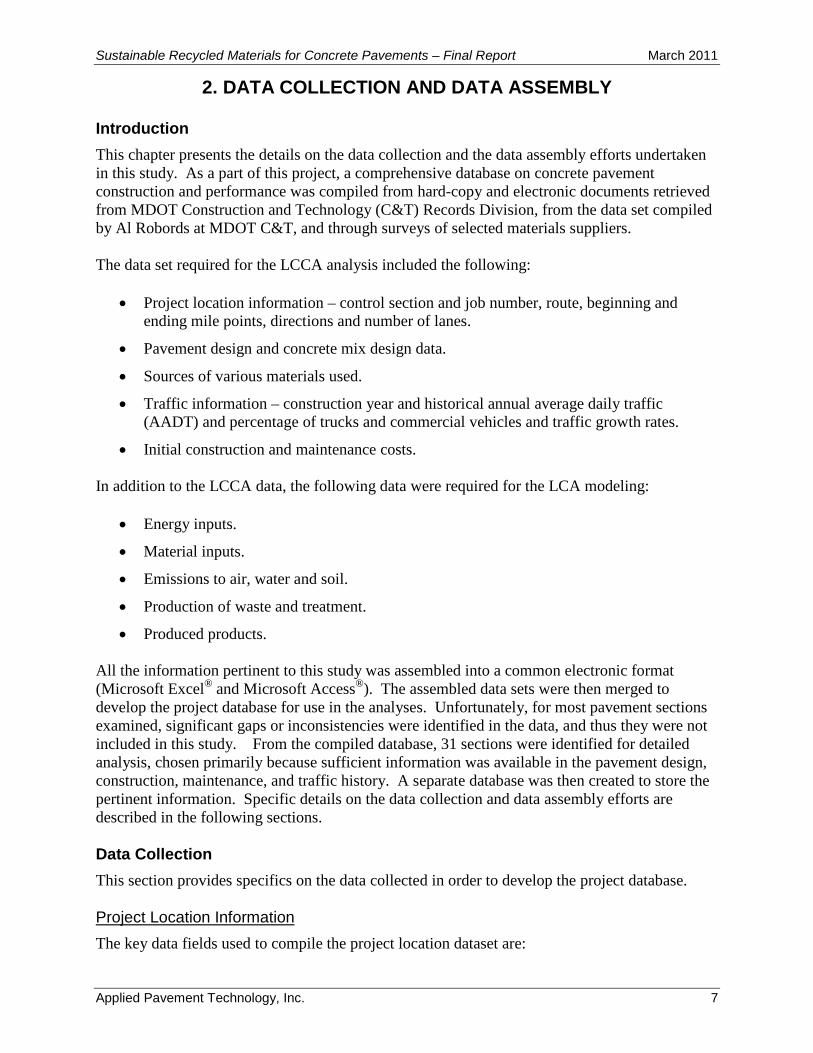
Table 2.1 and figure 2.1 show the pavement preservation strategy and the distress index curve for a newly constructed freeway concrete pavement, respectively. The distress index (DI) is MDOT’s method of condition monitoring; it is based on a scale that starts at 0 (distress free pavement) and numerically increases as the pavement condition deteriorates and includes major distresses such as transverse cracking, longitudinal cracking, and shattered areas. Based on historic trends, the first maintenance activity (includes joint resealing, full depth repairs, crack sealing, and so on) is expected to occur 9 years after initial construction and the second maintenance cycle is expected to occur 15 years after initial construction. A major rehabilitation activity, such as a structural HMA overlay or an unbonded concrete overlay, is expected to be typically applied at about year 26. Based upon historic trends a threshold DI of 25 was adopted as a trigger value for HMA overlays and a threshold DI of 50 was used as a trigger a complete reconstruction. Table 2.1. Pavement preservation strategy for newly constructed concrete pavement (freeway).
ActivityDI1
(Before)DI
(After)
Approx. Age
(years)
RSL2
Before Fix (years)
Life Extension
(years)
RSL after fix (years)
Cost / lane mile
Initial Construction 0 0 22 ComputedPreventive Maintenance 6 5 9 13 1 14 $16,636Preventive Maintenance 18 10 15 8 3 11 $51,490Rehabilitation / Reconstruction 26 Computed
1 DI – Distress Index is an index that quantifies the level of distress that exists on a pavement section based on 0.1 mile increments. The scale starts at zero and increases numerically as the pavement condition worsens. 2 RSL – Remaining Service Life based is the estimated number of years, from a specific date in time, until a pavement section reaches the threshold distress index. RSL is a function of the distress level and rate of deterioration.
Figure 2.1. Typical distress index curve for newly constructed concrete pavement (freeway).
Sustainable Recycled Materials for Concrete Pavements – Final Report March 2011
Applied Pavement Technology, Inc. 11
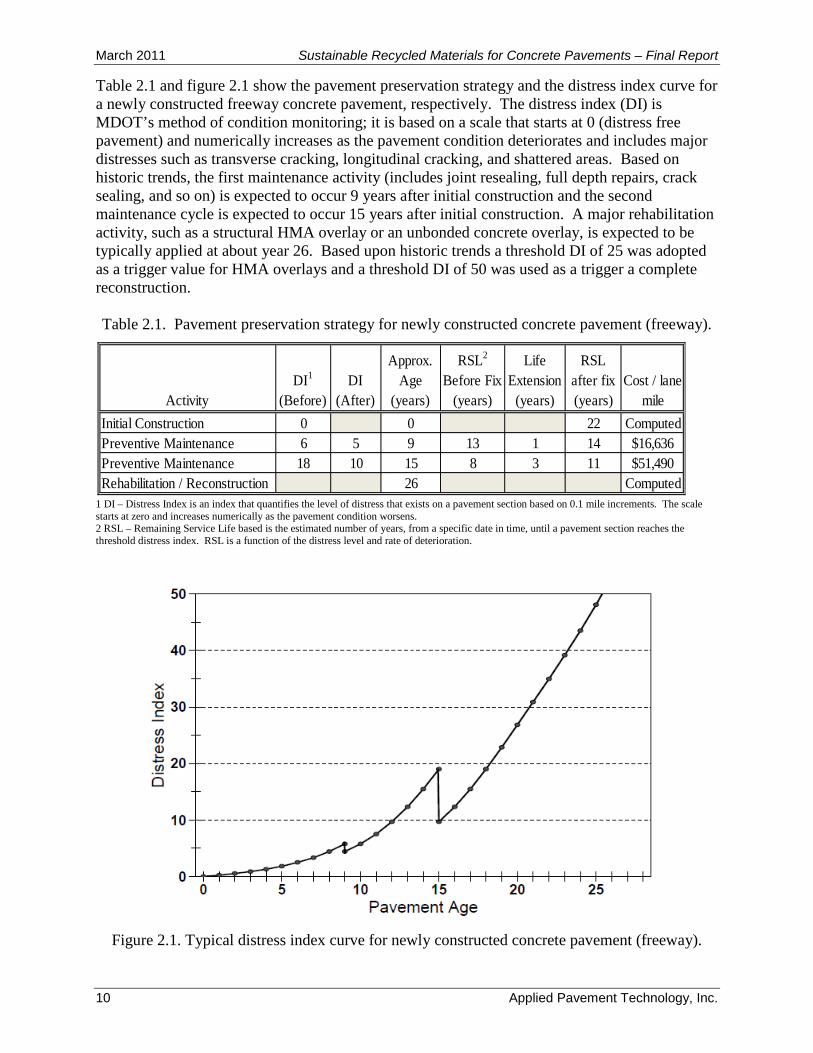
Table 2.2 and figure 2.2 show the pavement preservation strategy and the distress index curve for an HMA overlay for freeway pavement. Based on historical trends, the first maintenance cycle is expected to occur approximately 6 years after the placement of the HMA overlay. Approximately 8 years after the HMA overlay is placed, it is expected to receive a surface treatment (such as microsurfacing or thin HMA overlays) that will reset the distress index value to zero. Another maintenance activity is expected 4 years after the placement of the surface treatment and complete reconstruction is expected 20 years after the placement of the HMA overlay.
Table 2.2. Pavement preservation strategy an HMA overlay (freeway).
ActivityDI1
(Before)DI
(After)
Approx. Age
(years)
RSL2
Before Fix (years)
Life Extension
(years)
RSL after fix (years)
Cost / lane mile
Initial Construction 0 0 10 ComputedPreventive Maintenance 17 15 6 4 1 5 $16,636Preventive Maintenance 23 0 8 3 7 10 $51,490Preventive Maintenance 7 2 12 6 2 8 $51,490Rehabilitation / Reconstruction 20 Computed
Figure 2.2. Typical distress index curve for an HMA overlay (freeway).
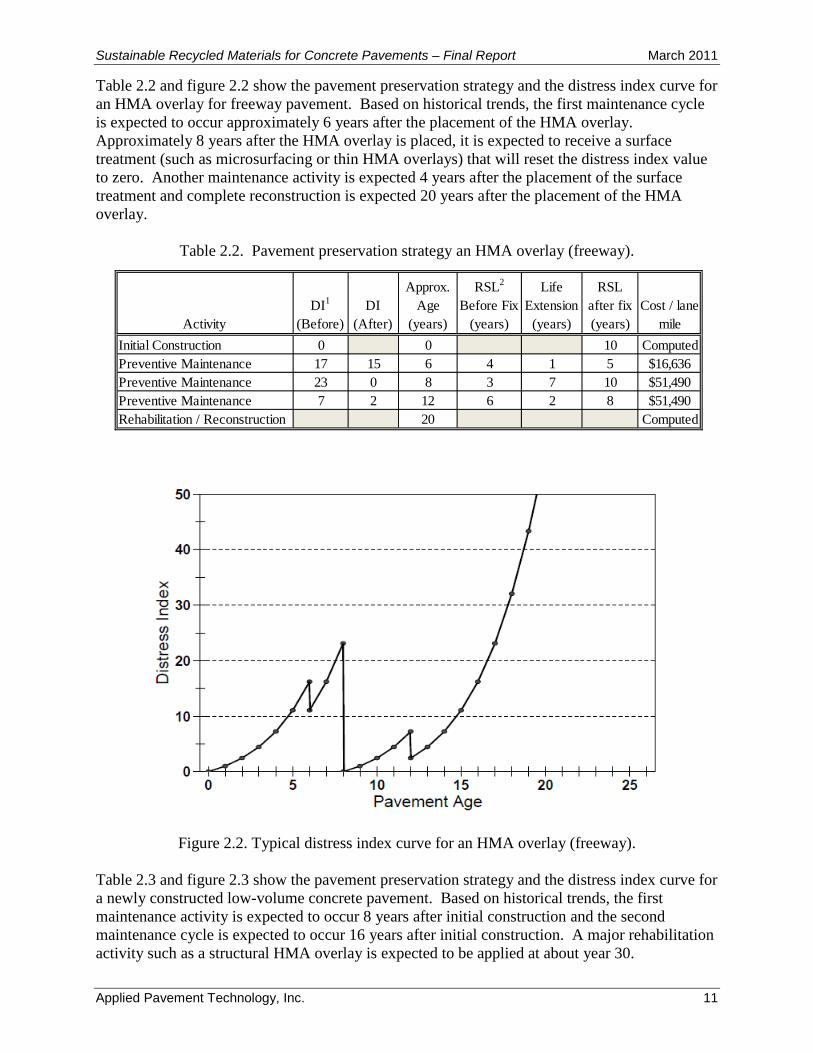
Table 2.3 and figure 2.3 show the pavement preservation strategy and the distress index curve for a newly constructed low-volume concrete pavement. Based on historical trends, the first maintenance activity is expected to occur 8 years after initial construction and the second maintenance cycle is expected to occur 16 years after initial construction. A major rehabilitation activity such as a structural HMA overlay is expected to be applied at about year 30.
March 2011 Sustainable Recycled Materials for Concrete Pavements – Final Report
12 Applied Pavement Technology, Inc.
Table 2.3. Pavement preservation strategy for a newly constructed concrete pavement (low-volume).
ActivityDI1
(Before)DI
(After)
Approx. Age
(years)
RSL2
Before Fix (years)
Life Extension
(years)
RSL after fix (years)
Cost / lane mile
Initial Construction 0 0 21 ComputedPreventive Maintenance 6 5 8 16 1 14 $16,636Preventive Maintenance 20 5 16 6 8 14 $69,599Rehabilitation / Reconstruction 30 Computed
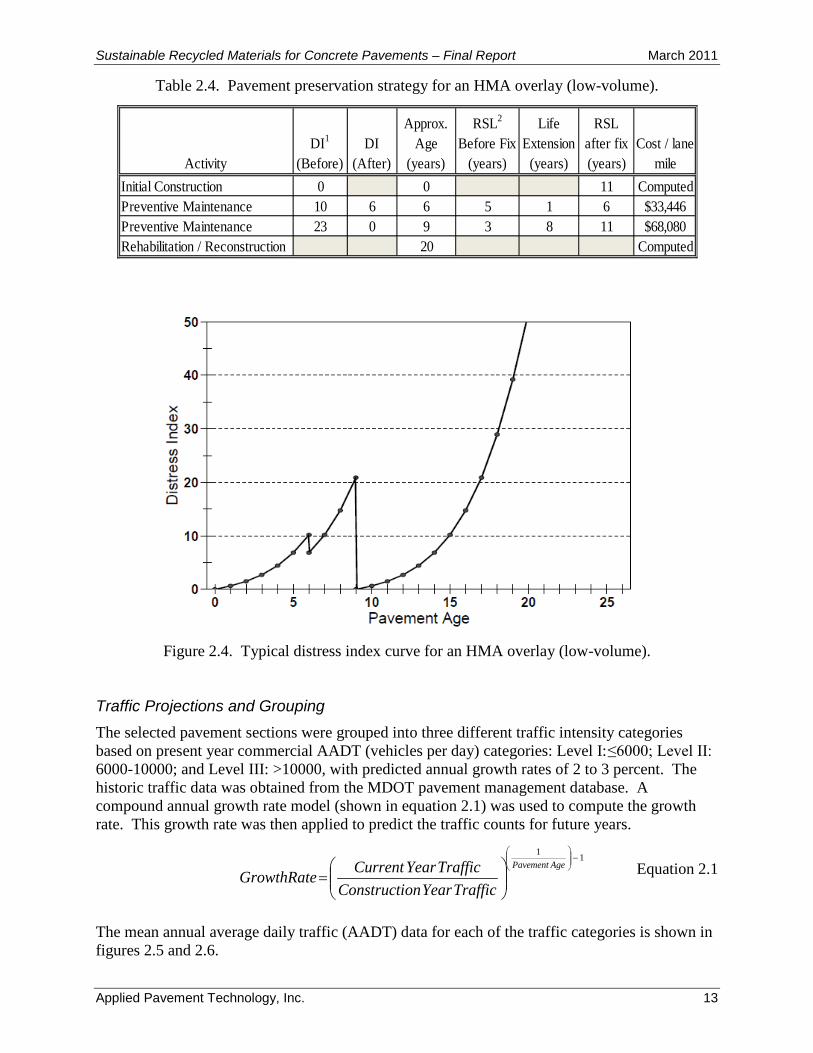
Figure 2.3. Typical distress index curve for newly constructed concrete pavement (low-volume). Table 2.4 and figure 2.4 show the pavement preservation strategy and the distress index curve for an HMA overlay over concrete for a low-volume pavement. Based on historical trends, the first maintenance cycle is expected to occur approximately 6 years after the placement of the HMA overlay. Approximately 9 years after the HMA overlay is placed, it is expected to receive a surface treatment that will reset the distress index value to zero. Complete reconstruction is expected 20 years after the placement of the HMA overlay.
Sustainable Recycled Materials for Concrete Pavements – Final Report March 2011
Applied Pavement Technology, Inc. 13
11−
=
AgePavement
TrafficYearonConstructiTrafficYearCurrentGrowthRate
Table 2.4. Pavement preservation strategy for an HMA overlay (low-volume).
ActivityDI1
(Before)DI
(After)
Approx. Age
(years)
RSL2
Before Fix (years)
Life Extension
(years)
RSL after fix (years)
Cost / lane mile
Initial Construction 0 0 11 ComputedPreventive Maintenance 10 6 6 5 1 6 $33,446Preventive Maintenance 23 0 9 3 8 11 $68,080Rehabilitation / Reconstruction 20 Computed
Figure 2.4. Typical distress index curve for an HMA overlay (low-volume).
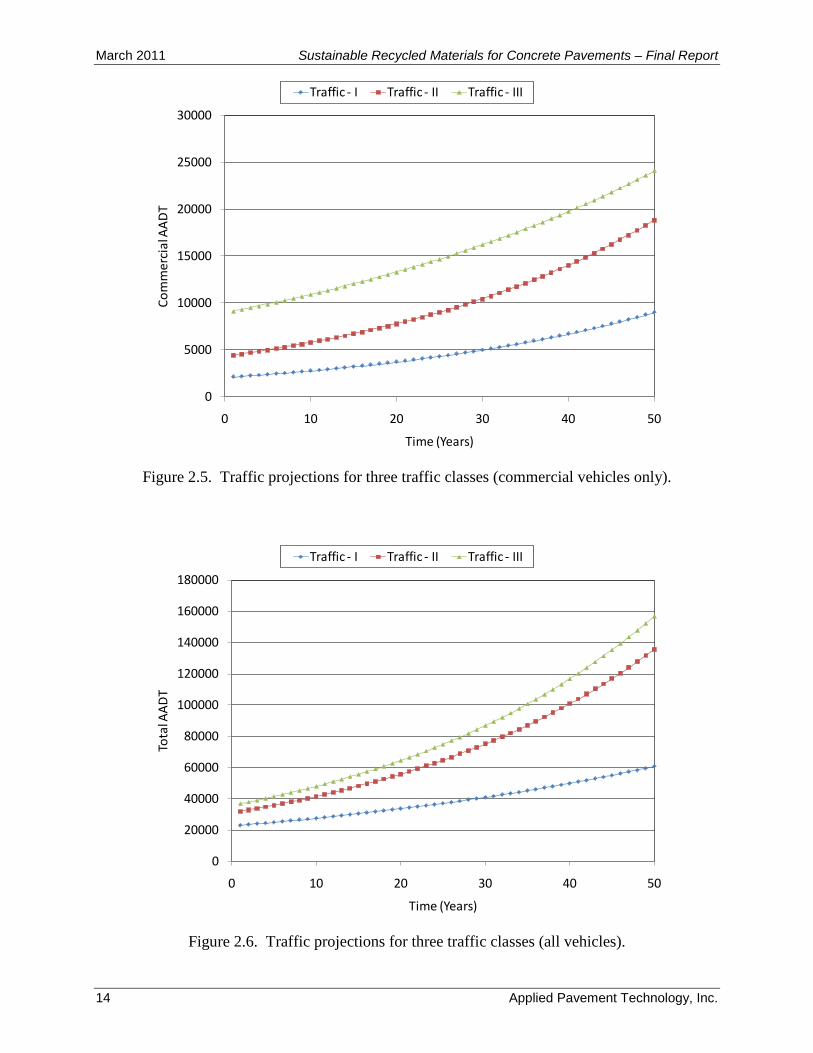
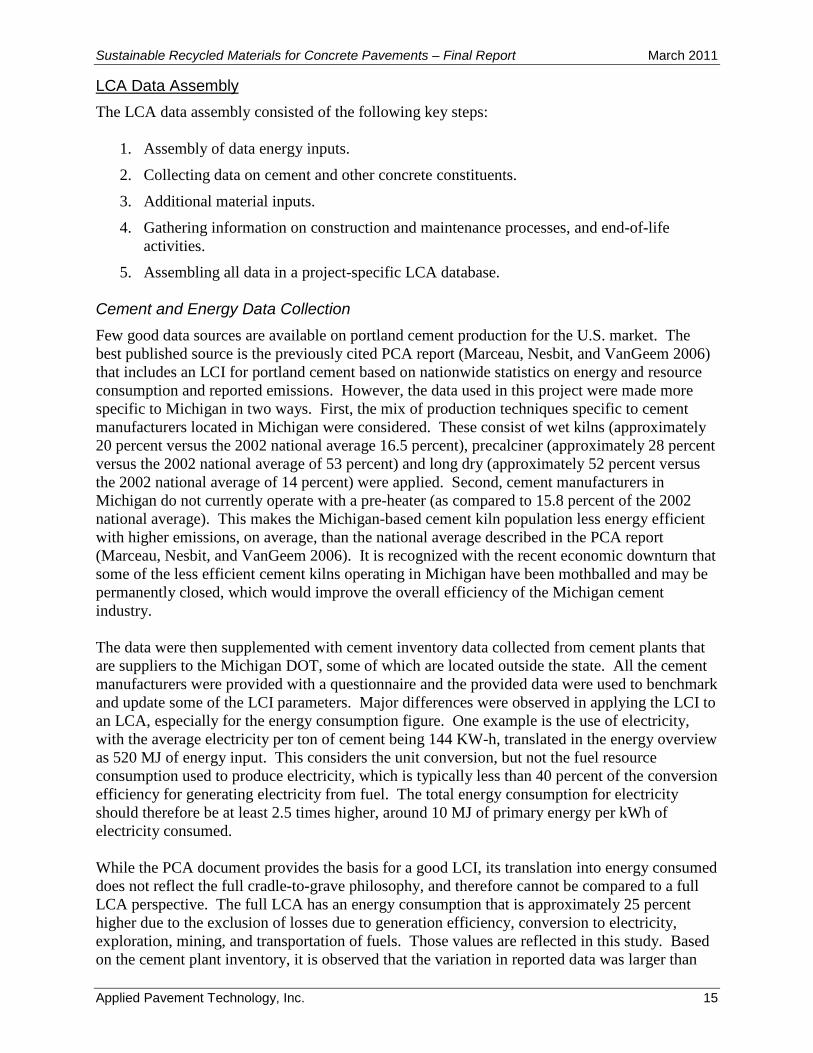
Traffic Projections and Grouping The selected pavement sections were grouped into three different traffic intensity categories based on present year commercial AADT (vehicles per day) categories: Level I: ≤6000; Level II: 6000-10000; and Level III: >10000, with predicted annual growth rates of 2 to 3 percent. The historic traffic data was obtained from the MDOT pavement management database. A compound annual growth rate model (shown in equation 2.1) was used to compute the growth rate. This growth rate was then applied to predict the traffic counts for future years.
Equation 2.1
The mean annual average daily traffic (AADT) data for each of the traffic categories is shown in figures 2.5 and 2.6.
March 2011 Sustainable Recycled Materials for Concrete Pavements – Final Report
14 Applied Pavement Technology, Inc.
0
5000
10000
15000
20000
25000
30000
0 10 20 30 40 50
Com
mer
cial
AAD
T
Time (Years)
Traffic - I Traffic - II Traffic - III
Figure 2.5. Traffic projections for three traffic classes (commercial vehicles only).
0
20000
40000
60000
80000
100000
120000
140000
160000
180000
0 10 20 30 40 50
Tota
l AAD
T
Time (Years)
Traffic - I Traffic - II Traffic - III
Figure 2.6. Traffic projections for three traffic classes (all vehicles).
Sustainable Recycled Materials for Concrete Pavements – Final Report March 2011
Applied Pavement Technology, Inc. 15
LCA Data Assembly The LCA data assembly consisted of the following key steps:
1. Assembly of data energy inputs.
2. Collecting data on cement and other concrete constituents.
3. Additional material inputs.
4. Gathering information on construction and maintenance processes, and end-of-life activities.
5. Assembling all data in a project-specific LCA database. Cement and Energy Data Collection Few good data sources are available on portland cement production for the U.S. market. The best published source is the previously cited PCA report (Marceau, Nesbit, and VanGeem 2006) that includes an LCI for portland cement based on nationwide statistics on energy and resource consumption and reported emissions. However, the data used in this project were made more specific to Michigan in two ways. First, the mix of production techniques specific to cement manufacturers located in Michigan were considered. These consist of wet kilns (approximately 20 percent versus the 2002 national average 16.5 percent), precalciner (approximately 28 percent versus the 2002 national average of 53 percent) and long dry (approximately 52 percent versus the 2002 national average of 14 percent) were applied. Second, cement manufacturers in Michigan do not currently operate with a pre-heater (as compared to 15.8 percent of the 2002 national average). This makes the Michigan-based cement kiln population less energy efficient with higher emissions, on average, than the national average described in the PCA report (Marceau, Nesbit, and VanGeem 2006). It is recognized with the recent economic downturn that some of the less efficient cement kilns operating in Michigan have been mothballed and may be permanently closed, which would improve the overall efficiency of the Michigan cement industry. The data were then supplemented with cement inventory data collected from cement plants that are suppliers to the Michigan DOT, some of which are located outside the state. All the cement manufacturers were provided with a questionnaire and the provided data were used to benchmark and update some of the LCI parameters. Major differences were observed in applying the LCI to an LCA, especially for the energy consumption figure. One example is the use of electricity, with the average electricity per ton of cement being 144 KW-h, translated in the energy overview as 520 MJ of energy input. This considers the unit conversion, but not the fuel resource consumption used to produce electricity, which is typically less than 40 percent of the conversion efficiency for generating electricity from fuel. The total energy consumption for electricity should therefore be at least 2.5 times higher, around 10 MJ of primary energy per kWh of electricity consumed. While the PCA document provides the basis for a good LCI, its translation into energy consumed does not reflect the full cradle-to-grave philosophy, and therefore cannot be compared to a full LCA perspective. The full LCA has an energy consumption that is approximately 25 percent higher due to the exclusion of losses due to generation efficiency, conversion to electricity, exploration, mining, and transportation of fuels. Those values are reflected in this study. Based on the cement plant inventory, it is observed that the variation in reported data was larger than
March 2011 Sustainable Recycled Materials for Concrete Pavements – Final Report
16 Applied Pavement Technology, Inc.
expected. In addition, most plants that reported data use petcoke and bituminous coal as fuel. These findings stress the need for a well-defined inventory that reflects current practices and the need to ultimately establish a fixed set of rules for reporting. Other Concrete Constituents The mix design for the concrete is based on four typical types of paving concrete, using natural and crushed concrete aggregates and with varying levels of portland cement and SCMs. Straight portland cement mixes and mixes with 20, 30, and 40 percent replacement of SCMs such as slag cement or fly ash were modeled in this study. Specific details on the mix designs are provided in Chapter 4. The LCA data for the different ingredients are sourced from literature, mostly from EcoInvent that has been adjusted using U.S. background data. One notable data point that was assumed is the drying for the slag cement with natural gas. Additional Material Inputs Amounts for epoxy-coated dowel bars and epoxy-coated tie bars are estimated based on the 41-ft JRCP designs formerly used by MDOT and for the 14-ft JPCP designs currently employed by the agency. Preformed neoprene joint sealants were assumed, although this has a very small impact on the calculated environmental impact. The consumption of curing compound during the paving process is also considered at two coatings of 200 ft2 per gallon (225 maximum). Construction, Maintenance and End-of-life Processes Based on data collected from a recent construction project on I-96 just west of Lansing, diesel consumption patterns have been assumed for the on-site central mixing and paving for both the base course and the pavement. These are rough estimates. All maintenance and end-of life processes were estimated in relation to the construction process data. Final Data Assembly The final database containing all available information related to the site location, construction and design information, traffic data, maintenance and rehabilitation information, and performance data were compiled into a unified project database. A separate database was created for the LCA data. A summary of the sections selected for the LCCA and the LCA studies are discussed in this section. LCCA Data Summary A summary of the pavement sections selected for this study are shown in tables 2.5 through 2.7. The average concrete thicknesses in traffic level I, II and III were 9, 10 and 11 inches, respectively. Detailed information on the projects selected in this study is given in Appendix A. Appendix B provides the distress index curves for all the projects selected for this study. In Appendix B, a three-line description has been provided to describe the pavement design details, an example of which is illustrated in figure 2.7. Appendix C provides information on the maintenance and rehabilitation cycles and costs.
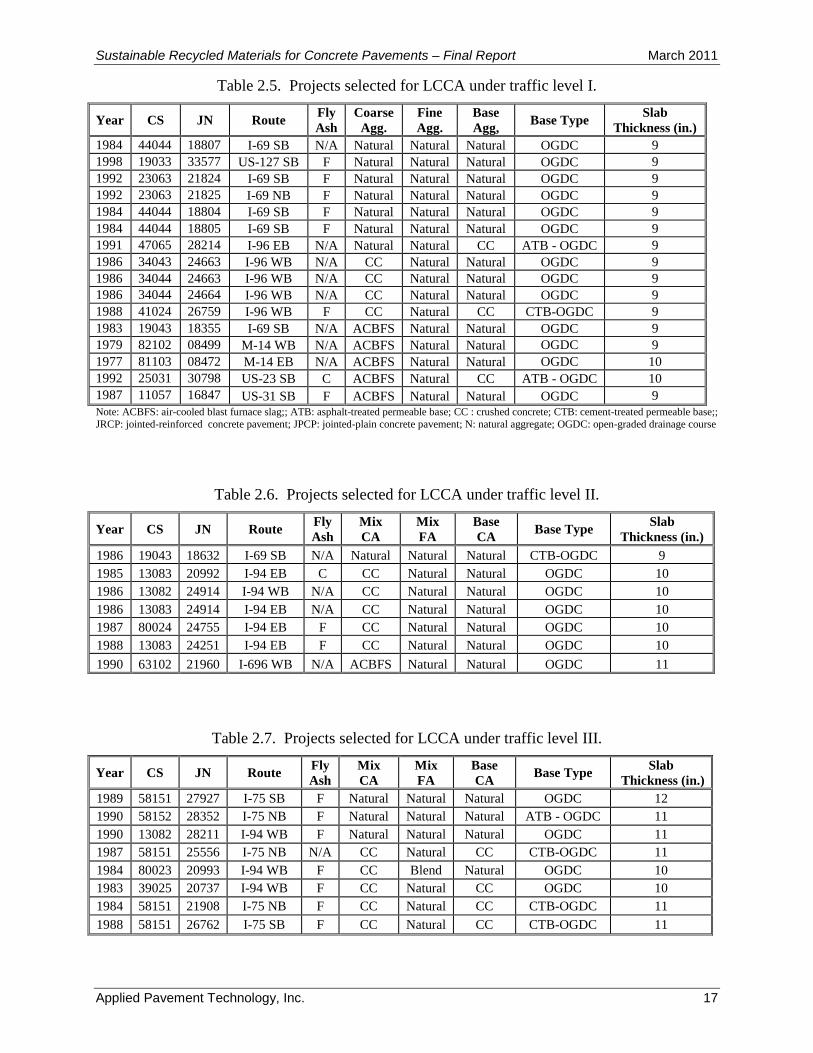
Sustainable Recycled Materials for Concrete Pavements – Final Report March 2011
Applied Pavement Technology, Inc. 17
Table 2.5. Projects selected for LCCA under traffic level I.
Year CS JN Route Fly Ash
Coarse Agg.
Fine Agg.
Base Agg, Base Type Slab
Thickness (in.) 1984 44044 18807 I-69 SB N/A Natural Natural Natural OGDC 9 1998 19033 33577 US-127 SB F Natural Natural Natural OGDC 9 1992 23063 21824 I-69 SB F Natural Natural Natural OGDC 9 1992 23063 21825 I-69 NB F Natural Natural Natural OGDC 9 1984 44044 18804 I-69 SB F Natural Natural Natural OGDC 9 1984 44044 18805 I-69 SB F Natural Natural Natural OGDC 9 1991 47065 28214 I-96 EB N/A Natural Natural CC ATB - OGDC 9 1986 34043 24663 I-96 WB N/A CC Natural Natural OGDC 9 1986 34044 24663 I-96 WB N/A CC Natural Natural OGDC 9 1986 34044 24664 I-96 WB N/A CC Natural Natural OGDC 9 1988 41024 26759 I-96 WB F CC Natural CC CTB-OGDC 9 1983 19043 18355 I-69 SB N/A ACBFS Natural Natural OGDC 9 1979 82102 08499 M-14 WB N/A ACBFS Natural Natural OGDC 9 1977 81103 08472 M-14 EB N/A ACBFS Natural Natural OGDC 10 1992 25031 30798 US-23 SB C ACBFS Natural CC ATB - OGDC 10 1987 11057 16847 US-31 SB F ACBFS Natural Natural OGDC 9 Note: ACBFS: air-cooled blast furnace slag;; ATB: asphalt-treated permeable base; CC : crushed concrete; CTB: cement-treated permeable base;; JRCP: jointed-reinforced concrete pavement; JPCP: jointed-plain concrete pavement; N: natural aggregate; OGDC: open-graded drainage course
Table 2.6. Projects selected for LCCA under traffic level II.
Year CS JN Route Fly Ash
Mix CA
Mix FA
Base CA Base Type Slab
Thickness (in.) 1986 19043 18632 I-69 SB N/A Natural Natural Natural CTB-OGDC 9 1985 13083 20992 I-94 EB C CC Natural Natural OGDC 10 1986 13082 24914 I-94 WB N/A CC Natural Natural OGDC 10 1986 13083 24914 I-94 EB N/A CC Natural Natural OGDC 10 1987 80024 24755 I-94 EB F CC Natural Natural OGDC 10 1988 13083 24251 I-94 EB F CC Natural Natural OGDC 10 1990 63102 21960 I-696 WB N/A ACBFS Natural Natural OGDC 11
Table 2.7. Projects selected for LCCA under traffic level III.
Year CS JN Route Fly Ash
Mix CA
Mix FA
Base CA Base Type Slab
Thickness (in.) 1989 58151 27927 I-75 SB F Natural Natural Natural OGDC 12 1990 58152 28352 I-75 NB F Natural Natural Natural ATB - OGDC 11 1990 13082 28211 I-94 WB F Natural Natural Natural OGDC 11 1987 58151 25556 I-75 NB N/A CC Natural CC CTB-OGDC 11 1984 80023 20993 I-94 WB F CC Blend Natural OGDC 10 1983 39025 20737 I-94 WB F CC Natural CC OGDC 10 1984 58151 21908 I-75 NB F CC Natural CC CTB-OGDC 11 1988 58151 26762 I-75 SB F CC Natural CC CTB-OGDC 11
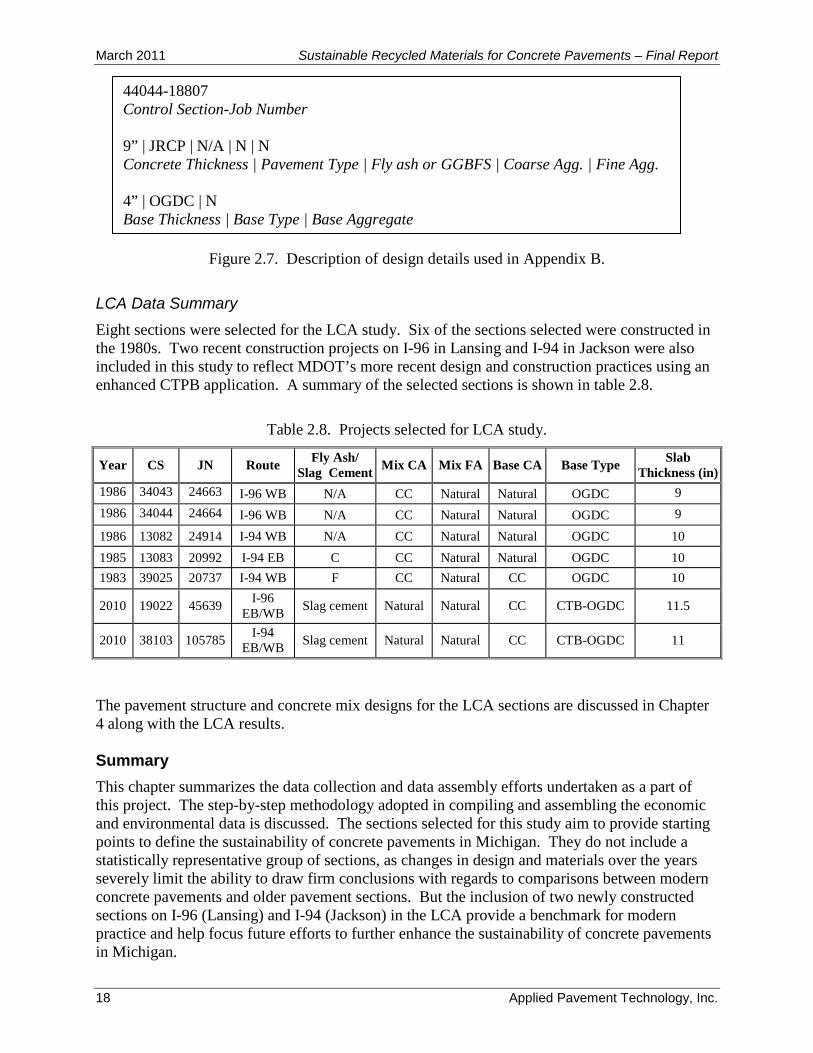
March 2011 Sustainable Recycled Materials for Concrete Pavements – Final Report
18 Applied Pavement Technology, Inc.
Figure 2.7. Description of design details used in Appendix B.
LCA Data Summary Eight sections were selected for the LCA study. Six of the sections selected were constructed in the 1980s. Two recent construction projects on I-96 in Lansing and I-94 in Jackson were also included in this study to reflect MDOT’s more recent design and construction practices using an enhanced CTPB application. A summary of the selected sections is shown in table 2.8.
Table 2.8. Projects selected for LCA study.
Year CS JN Route Fly Ash/ Slag Cement Mix CA Mix FA Base CA Base Type Slab
Thickness (in) 1986 34043 24663 I-96 WB N/A CC Natural Natural OGDC 9 1986 34044 24664 I-96 WB N/A CC Natural Natural OGDC 9
1986 13082 24914 I-94 WB N/A CC Natural Natural OGDC 10 1985 13083 20992 I-94 EB C CC Natural Natural OGDC 10 1983 39025 20737 I-94 WB F CC Natural CC OGDC 10
2010 19022 45639 I-96 EB/WB Slag cement Natural Natural CC CTB-OGDC 11.5
2010 38103 105785 I-94 EB/WB Slag cement Natural Natural CC CTB-OGDC 11
The pavement structure and concrete mix designs for the LCA sections are discussed in Chapter 4 along with the LCA results. Summary This chapter summarizes the data collection and data assembly efforts undertaken as a part of this project. The step-by-step methodology adopted in compiling and assembling the economic and environmental data is discussed. The sections selected for this study aim to provide starting points to define the sustainability of concrete pavements in Michigan. They do not include a statistically representative group of sections, as changes in design and materials over the years severely limit the ability to draw firm conclusions with regards to comparisons between modern concrete pavements and older pavement sections. But the inclusion of two newly constructed sections on I-96 (Lansing) and I-94 (Jackson) in the LCA provide a benchmark for modern practice and help focus future efforts to further enhance the sustainability of concrete pavements in Michigan.
44044-18807 Control Section-Job Number 9” | JRCP | N/A | N | N Concrete Thickness | Pavement Type | Fly ash or GGBFS | Coarse Agg. | Fine Agg. 4” | OGDC | N Base Thickness | Base Type | Base Aggregate
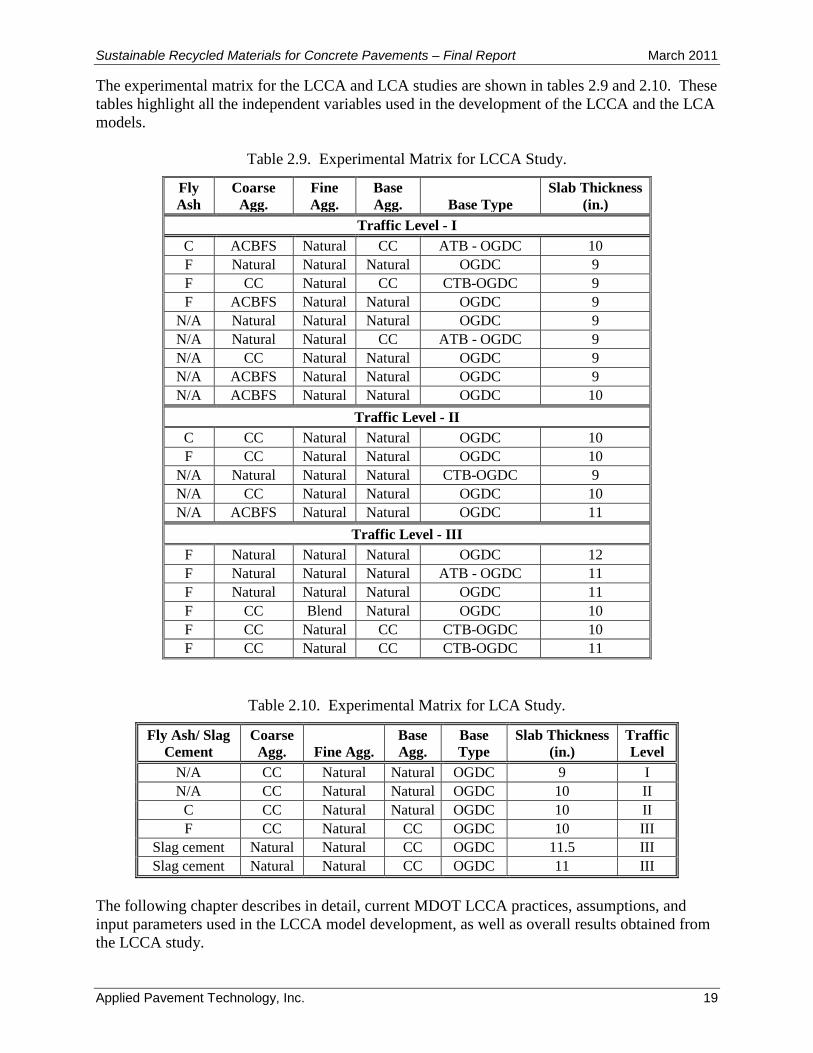
Sustainable Recycled Materials for Concrete Pavements – Final Report March 2011
Applied Pavement Technology, Inc. 19
The experimental matrix for the LCCA and LCA studies are shown in tables 2.9 and 2.10. These tables highlight all the independent variables used in the development of the LCCA and the LCA models.
Table 2.9. Experimental Matrix for LCCA Study.
Fly Ash
Coarse Agg.
Fine Agg.
Base Agg. Base Type
Slab Thickness (in.)
Traffic Level - I C ACBFS Natural CC ATB - OGDC 10 F Natural Natural Natural OGDC 9 F CC Natural CC CTB-OGDC 9 F ACBFS Natural Natural OGDC 9
N/A Natural Natural Natural OGDC 9 N/A Natural Natural CC ATB - OGDC 9 N/A CC Natural Natural OGDC 9 N/A ACBFS Natural Natural OGDC 9 N/A ACBFS Natural Natural OGDC 10
Traffic Level - II C CC Natural Natural OGDC 10 F CC Natural Natural OGDC 10
N/A Natural Natural Natural CTB-OGDC 9 N/A CC Natural Natural OGDC 10 N/A ACBFS Natural Natural OGDC 11
Traffic Level - III F Natural Natural Natural OGDC 12 F Natural Natural Natural ATB - OGDC 11 F Natural Natural Natural OGDC 11 F CC Blend Natural OGDC 10 F CC Natural CC CTB-OGDC 10 F CC Natural CC CTB-OGDC 11
Table 2.10. Experimental Matrix for LCA Study.
Fly Ash/ Slag Cement
Coarse Agg. Fine Agg.
Base Agg.
Base Type
Slab Thickness (in.)
Traffic Level
N/A CC Natural Natural OGDC 9 I N/A CC Natural Natural OGDC 10 II
C CC Natural Natural OGDC 10 II F CC Natural CC OGDC 10 III
Slag cement Natural Natural CC OGDC 11.5 III Slag cement Natural Natural CC OGDC 11 III
The following chapter describes in detail, current MDOT LCCA practices, assumptions, and input parameters used in the LCCA model development, as well as overall results obtained from the LCCA study.

March 2011 Sustainable Recycled Materials for Concrete Pavements – Final Report
20 Applied Pavement Technology, Inc.
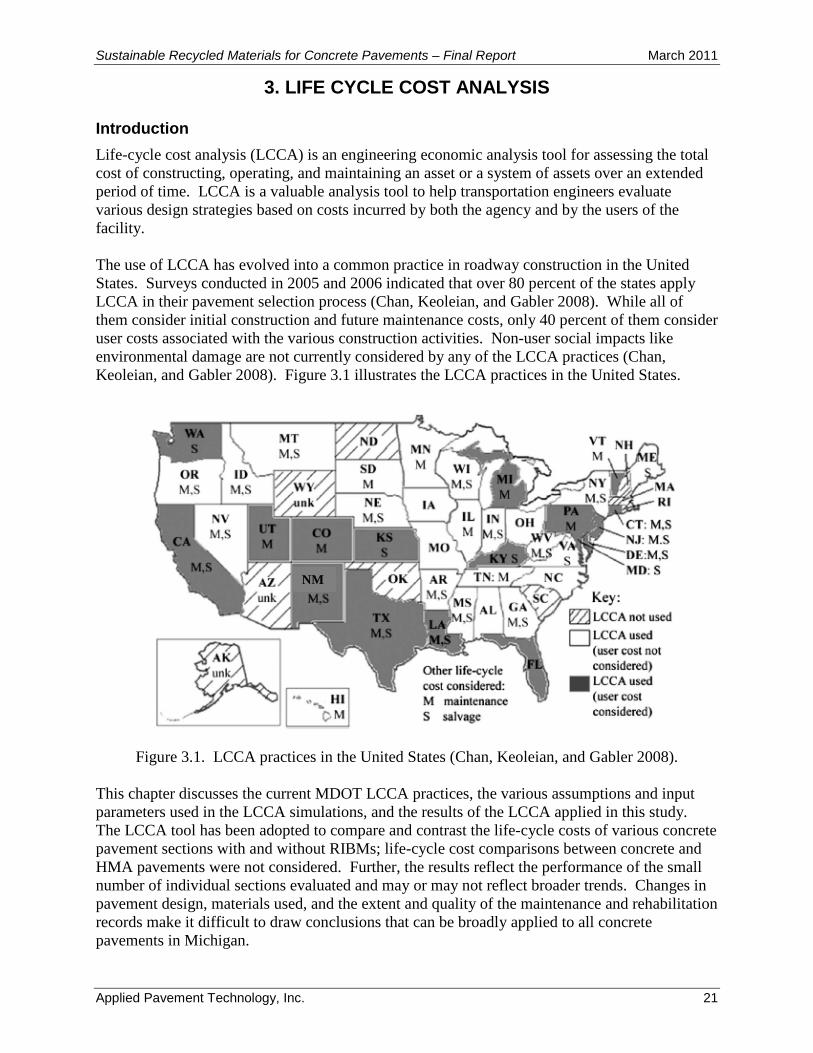
Sustainable Recycled Materials for Concrete Pavements – Final Report March 2011
Applied Pavement Technology, Inc. 21
3. LIFE CYCLE COST ANALYSIS
Introduction Life-cycle cost analysis (LCCA) is an engineering economic analysis tool for assessing the total cost of constructing, operating, and maintaining an asset or a system of assets over an extended period of time. LCCA is a valuable analysis tool to help transportation engineers evaluate various design strategies based on costs incurred by both the agency and by the users of the facility. The use of LCCA has evolved into a common practice in roadway construction in the United States. Surveys conducted in 2005 and 2006 indicated that over 80 percent of the states apply LCCA in their pavement selection process (Chan, Keoleian, and Gabler 2008). While all of them consider initial construction and future maintenance costs, only 40 percent of them consider user costs associated with the various construction activities. Non-user social impacts like environmental damage are not currently considered by any of the LCCA practices (Chan, Keoleian, and Gabler 2008). Figure 3.1 illustrates the LCCA practices in the United States.
Figure 3.1. LCCA practices in the United States (Chan, Keoleian, and Gabler 2008).
This chapter discusses the current MDOT LCCA practices, the various assumptions and input parameters used in the LCCA simulations, and the results of the LCCA applied in this study. The LCCA tool has been adopted to compare and contrast the life-cycle costs of various concrete pavement sections with and without RIBMs; life-cycle cost comparisons between concrete and HMA pavements were not considered. Further, the results reflect the performance of the small number of individual sections evaluated and may or may not reflect broader trends. Changes in pavement design, materials used, and the extent and quality of the maintenance and rehabilitation records make it difficult to draw conclusions that can be broadly applied to all concrete pavements in Michigan.
NM
March 2011 Sustainable Recycled Materials for Concrete Pavements – Final Report
22 Applied Pavement Technology, Inc.
MDOT LCCA Practices A general overview of the LCCA practices adopted by MDOT is described in this section. Background and Development Over the years, the Michigan Department of Transportation has used various pavement selection procedures. Since 1985, MDOT has adopted the LCCA method to compare the cost of various pavement types and design alternatives. In 1997, state legislation PA 79 states that “the department shall develop and implement a life cycle cost analysis for each project for which total pavement costs exceed one million dollars funded in whole, or in part, with state funds. The department shall design and award paving projects utilizing materials having the lowest life cycle costs. All pavement design life shall ensure that state funds are utilized as efficiently as possible.” As a result, MDOT revised its pavement selection policy in 1998, making LCCA a mandatory requirement in the design stage for all projects with paving costs greater than 1 million dollars. Therefore, new construction, reconstruction, and rehabilitation events on major Michigan roadways generally require LCCA. However, LCCA is not required for roads under the jurisdiction of the city and county governments (MDOT 2005b). The MDOT LCCA Model MDOT uses a deterministic LCCA approach, with pavement selection requiring the evaluation of the life-cycle costs of both concrete and HMA alternatives. MDOT includes both initial and future agency and user costs in its analysis. The analysis unit is equivalent uniform annual costs (EUAC) per lane-mile (directional lane-mile for freeways) of a pavement section. The agency costs include the initial construction, rehabilitation, and future maintenance costs. Only the work items varying between the alternatives are considered in the analysis. The future maintenance costs are based on the pavement preservation strategies described in Chapter 2 of this report that were obtained from the MDOT Pavement Design and Selection Manual (MDOT 2005b). These strategies were developed by MDOT using historical pavement performance data and costs. The user costs include the travel delay costs incurred due to the construction activities. Construction Congestion Costs (CO3) is the software tool used by MDOT to estimate the user delay costs during the initial construction phase, while the user costs for the future maintenance activities are obtained from a table in the MDOT Pavement Design and Selection Manual (MDOT 2005b). The analysis period depends on the type of project being considered. For new construction or reconstruction, the analysis period is typically 26 to 30 years (adjusted periodically based on actual in-service performance), whereas a 20-year analysis period is typically used for major rehabilitation activities. LCCA Program Selection For this study, LCCA was performed using both deterministic and probabilistic methods. In a deterministic approach, a single life-cycle cost value is computed based on the set of selected, fixed inputs (e.g., construction costs, performance periods, discount rate, and so on). In a probabilistic approach, the uncertainty associated with each of those inputs is considered by assigning a distribution of expected values; the result is a probability distribution illustrating the range of probable or expected costs.
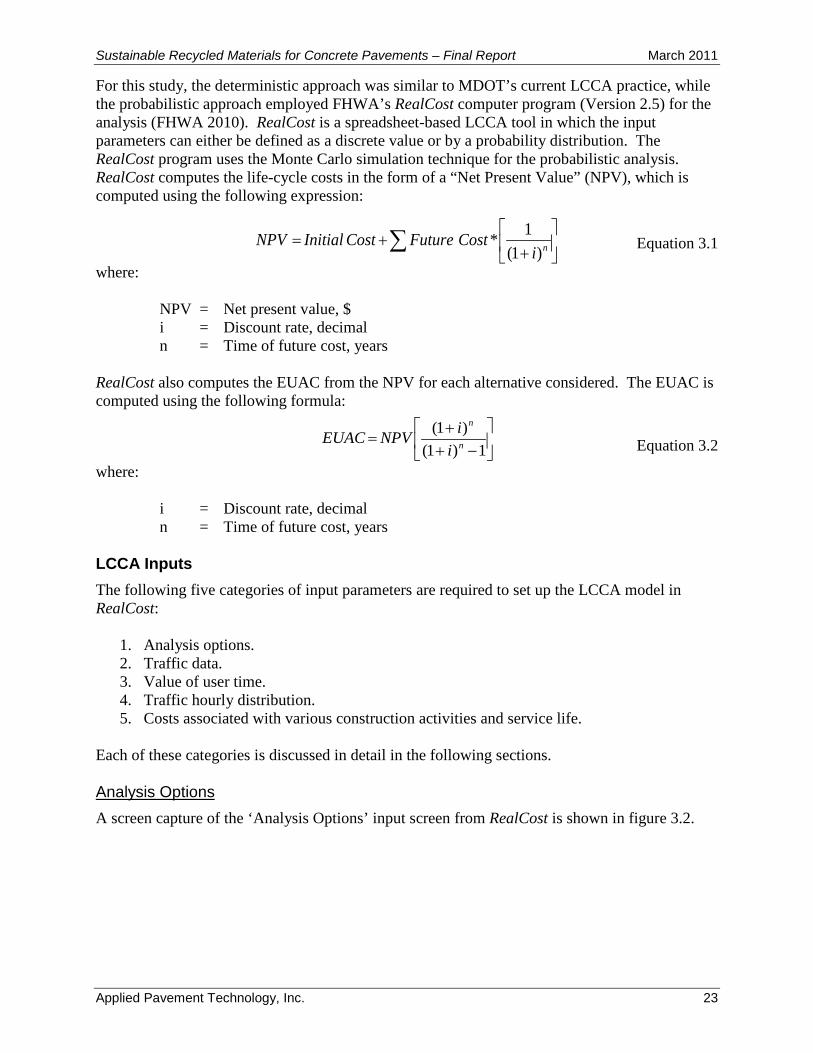
Sustainable Recycled Materials for Concrete Pavements – Final Report March 2011
Applied Pavement Technology, Inc. 23
For this study, the deterministic approach was similar to MDOT’s current LCCA practice, while the probabilistic approach employed FHWA’s RealCost computer program (Version 2.5) for the analysis (FHWA 2010). RealCost is a spreadsheet-based LCCA tool in which the input parameters can either be defined as a discrete value or by a probability distribution. The RealCost program uses the Monte Carlo simulation technique for the probabilistic analysis. RealCost computes the life-cycle costs in the form of a “Net Present Value” (NPV), which is computed using the following expression:
Equation 3.1
where: NPV = Net present value, $ i = Discount rate, decimal n = Time of future cost, years RealCost also computes the EUAC from the NPV for each alternative considered. The EUAC is computed using the following formula:
Equation 3.2
where: i = Discount rate, decimal n = Time of future cost, years LCCA Inputs The following five categories of input parameters are required to set up the LCCA model in RealCost:
1. Analysis options. 2. Traffic data. 3. Value of user time. 4. Traffic hourly distribution. 5. Costs associated with various construction activities and service life.
Each of these categories is discussed in detail in the following sections. Analysis Options A screen capture of the ‘Analysis Options’ input screen from RealCost is shown in figure 3.2.
∑
+
+= niCostFutureCostInitialNPV
)1(1*
−+
+=
1)1()1(
n
n
iiNPVEUAC
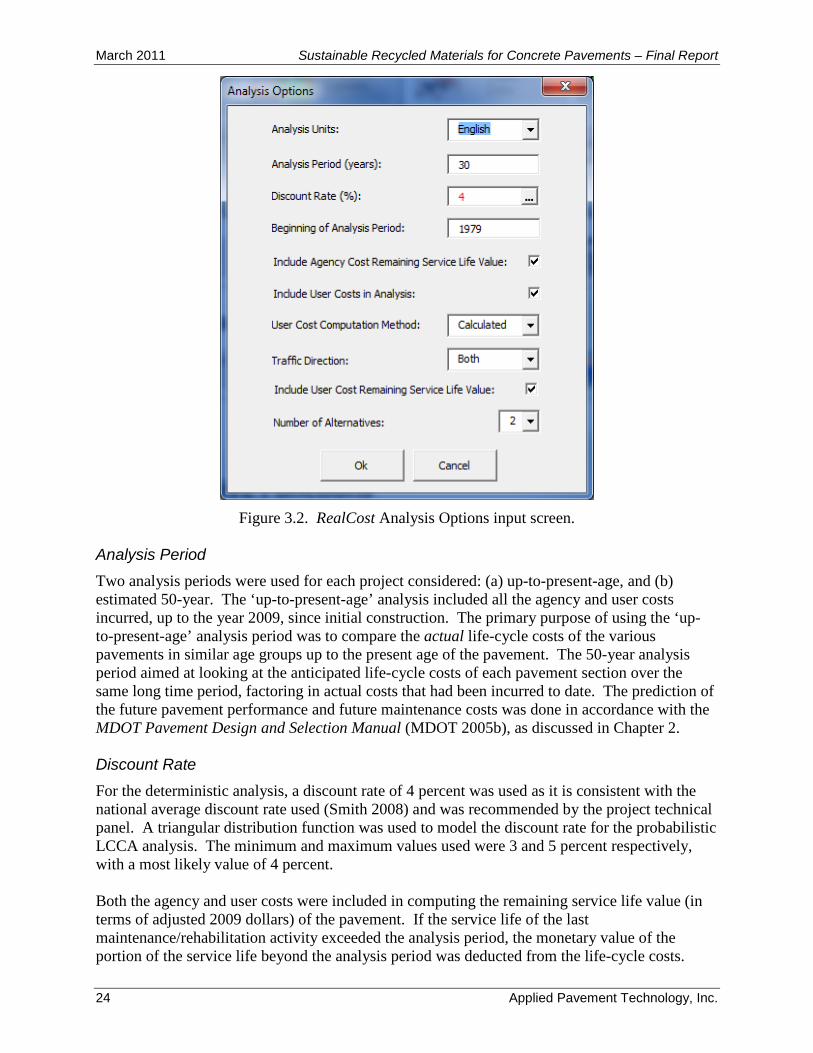
March 2011 Sustainable Recycled Materials for Concrete Pavements – Final Report
24 Applied Pavement Technology, Inc.
Figure 3.2. RealCost Analysis Options input screen.
Analysis Period Two analysis periods were used for each project considered: (a) up-to-present-age, and (b) estimated 50-year. The ‘up-to-present-age’ analysis included all the agency and user costs incurred, up to the year 2009, since initial construction. The primary purpose of using the ‘up-to-present-age’ analysis period was to compare the actual life-cycle costs of the various pavements in similar age groups up to the present age of the pavement. The 50-year analysis period aimed at looking at the anticipated life-cycle costs of each pavement section over the same long time period, factoring in actual costs that had been incurred to date. The prediction of the future pavement performance and future maintenance costs was done in accordance with the MDOT Pavement Design and Selection Manual (MDOT 2005b), as discussed in Chapter 2. Discount Rate For the deterministic analysis, a discount rate of 4 percent was used as it is consistent with the national average discount rate used (Smith 2008) and was recommended by the project technical panel. A triangular distribution function was used to model the discount rate for the probabilistic LCCA analysis. The minimum and maximum values used were 3 and 5 percent respectively, with a most likely value of 4 percent. Both the agency and user costs were included in computing the remaining service life value (in terms of adjusted 2009 dollars) of the pavement. If the service life of the last maintenance/rehabilitation activity exceeded the analysis period, the monetary value of the portion of the service life beyond the analysis period was deducted from the life-cycle costs.
Sustainable Recycled Materials for Concrete Pavements – Final Report March 2011
Applied Pavement Technology, Inc. 25
Traffic Data Input A screen capture showing the ‘Traffic Data’ input window from RealCost is shown in figure 3.3.
Figure 3.3. RealCost Traffic Data input screen.
As discussed in Chapter 2, the construction year traffic data were obtained from MDOT construction records and the growth rate was computed using a compound annual growth rate model. For the probabilistic analysis, the growth rate was modeled as a normally distributed variable. If the growth rate was less than 5 percent, then the a standard deviation of 1 percent was assumed and for growth rates greater than 5 percent, a standard deviation of 2 percent was assumed. Approximately 25 percent of the total truck traffic volume was assumed to be single unit trucks while the remaining 75 percent were combination trucks. The Free Flow Capacity was automatically computed by RealCost and the Queue Dissipation Capacity was assumed to be approximately 60 percent of the Free Flow Capacity. The Maximum AADT was set to the projected traffic volume at the end of the analysis period. A default value of 1.5 miles was assumed for the Maximum Queue Length. These assumptions are based largely on values used by others in computing users costs associated with work zones, but obviously could vary depending on specific project conditions. The Free Flow Capacity is defined as the capacity of each traffic lane under normal operating capacity and the Queue Dissipation Capacity is the capacity of each traffic lane during queue dissipation operating conditions in a work zone. These parameters are used to compute the user costs incurred due to traffic delays in a work zone.
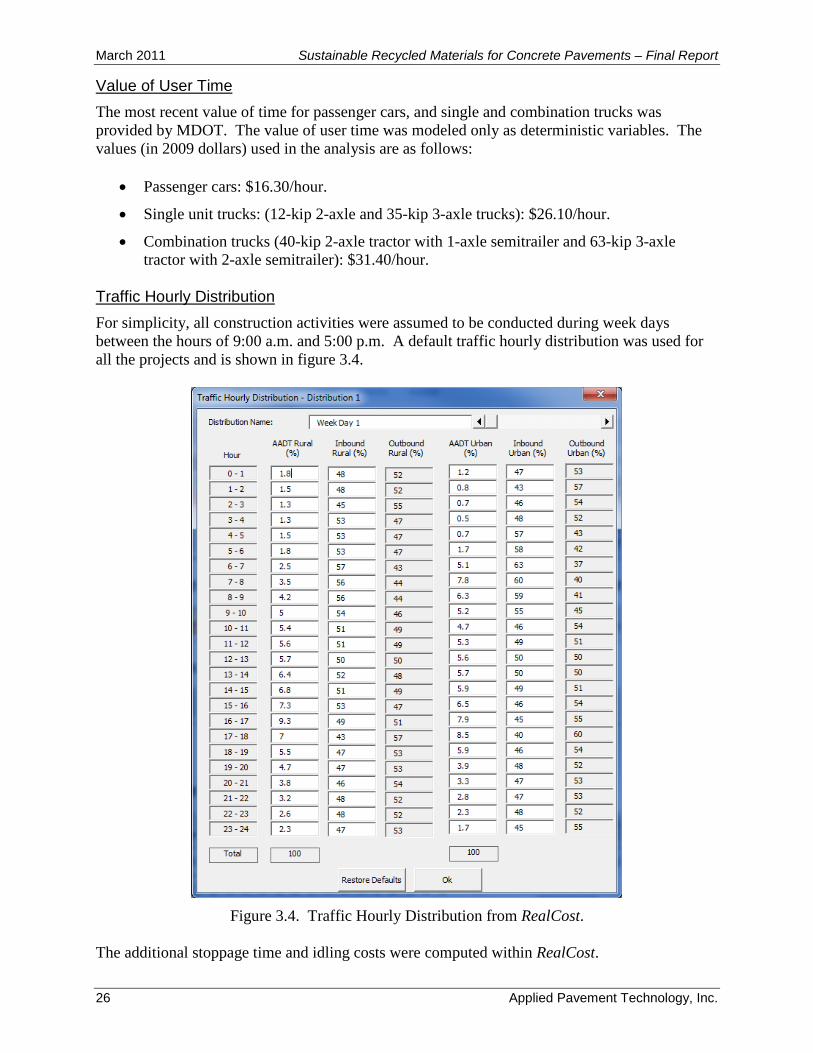
March 2011 Sustainable Recycled Materials for Concrete Pavements – Final Report
26 Applied Pavement Technology, Inc.
Value of User Time The most recent value of time for passenger cars, and single and combination trucks was provided by MDOT. The value of user time was modeled only as deterministic variables. The values (in 2009 dollars) used in the analysis are as follows:
• Passenger cars: $16.30/hour.
• Single unit trucks: (12-kip 2-axle and 35-kip 3-axle trucks): $26.10/hour.
• Combination trucks (40-kip 2-axle tractor with 1-axle semitrailer and 63-kip 3-axle tractor with 2-axle semitrailer): $31.40/hour.
Traffic Hourly Distribution For simplicity, all construction activities were assumed to be conducted during week days between the hours of 9:00 a.m. and 5:00 p.m. A default traffic hourly distribution was used for all the projects and is shown in figure 3.4.
Figure 3.4. Traffic Hourly Distribution from RealCost.
The additional stoppage time and idling costs were computed within RealCost.
Sustainable Recycled Materials for Concrete Pavements – Final Report March 2011
Applied Pavement Technology, Inc. 27
Construction Costs and Service Life The initial construction costs include the cost of the concrete surface and the base course. Unit costs retrieved from the project contract documents were used to compute the initial construction costs. It should be noted that engineering costs, cost of shoulders, subbase, subgrade preparation, traffic control, and overhead costs were not included since these costs would be a common factor all the projects considered this study. The working unit for all the construction costs is 2009 dollars per directional lane-mile. Information on the maintenance costs and cycles and pavement performance data (distress index) were provided by MDOT in the form of an electronic spreadsheet. The progression of the distress index values over time was used to identify potential maintenance cycles that were not identified in the pavement maintenance spreadsheet. Default values used by MDOT as specified in the MDOT Pavement Design and Selection Manual (MDOT 2005b) were used to estimate future maintenance costs. The future HMA overlay and JPCP reconstruction costs were modeled as probabilistic variables and were assumed to be normally distributed. A mean value of $200,000 with a standard deviation of $30,000 was assumed for the HMA overlay, and a mean value of $300,000 with a standard deviation of $50,000 was assumed for the JPCP reconstruction activity. For the deterministic analysis, the mean values were used. The costs were based on average costs from the projects selected for this study. Since this is a trend-based comparative study, the costs were not varied from project to project. The estimated cost for an HMA overlay are average numbers for a two-course 3.5 inch HMA overlay, while the costs for concrete reconstruction are average values for a 9- to 11-inch concrete pavement with a 4-inch aggregate base course. For the LCCA, it was assumed that any reconstruction activity was carried out in accordance with current MDOT design and construction specifications. The service life of all future maintenance activities was estimated using the MDOT Pavement Design and Selection Manual (MDOT 2005b). The service life of all future maintenance activities were also modeled as probabilistic variables following a normal distribution. If the service life was less that 5 years, a standard deviation of 1 year was assumed, and if the service life was 5 years or greater, then a standard deviation of 2 years was assumed. The mean values were used in the deterministic analysis. The value of the potential service life remaining at the end of the analysis period has been considered in this analysis. This accounts for the end-of analysis period differences between alternatives and removes the economic bias that may arise between alternatives. RealCost computes the remaining value as an accumulated depreciation of the structural and functional activities occurring over the analysis period. The user costs were also considered in computing the remaining value. It is noted that MDOT does not assign a salvage value in their current LCCA procedures. Detailed information on the maintenance cycles and costs for each project is available in Appendix C.
March 2011 Sustainable Recycled Materials for Concrete Pavements – Final Report
28 Applied Pavement Technology, Inc.
LCCA Results The LCCA results are grouped by traffic category. Within each traffic level, results of the following two LCCA approaches are presented:
(a) Up-to-present-age analysis period – As discussed previously, this analysis presents the life-cycle costs of the selected projects up to the present age since construction. The actual maintenance history on these projects was used to compute the life-cycle costs. In cases where the maintenance costs were not available, maintenance costs were estimated using the MDOT Pavement Design and Selection Manual (MDOT 2005b). Note: If a section has already undergone a reconstruction or a JPCP inlay before 2009, the activity was treated just like another maintenance event resulting from the poor performance of the original pavement. This assumption was made to capture the economic impact of a poor performing pavement section, although it is understood that a reconstruction/inlay would normally be treated as a separate section altogether for LCCA purposes.
(b) 50-year analysis period – In this analysis, all future maintenance activities were estimated using the MDOT Pavement Design and Selection Manual (MDOT 2005b) and included in the life-cycle costs.
Only the results of the deterministic analyses are discussed in this chapter as the mean life-cycle costs from the probabilistic analysis were within ±10 percent of the values obtained from the deterministic analysis. The results of the probabilistic LCCA are presented in Appendix D and the tornado plots generated by the probabilistic analysis, which show the relative impact of each probabilistic input parameter on the life-cycle costs, are provided in Appendix E. Traffic Level I Deterministic LCCA Results The deterministic LCCA results for traffic level I projects are discussed in this section. Up-to-Present-Age Analysis The projects have been split into four categories based upon the age of the pavement:
(a) Less than 20 years. (b) 20 – 24 years. (c) 25 – 29 years. (d) 30 years or greater.
The agency costs for traffic level I projects up-to-the-present age are shown in figure 3.5. The “R” indicated on the figure signifies that the corresponding section has undergone either a JPCP reconstruction or a JPCP inlay prior to 2009. The same nomenclature has been adopted in the remainder of this chapter.
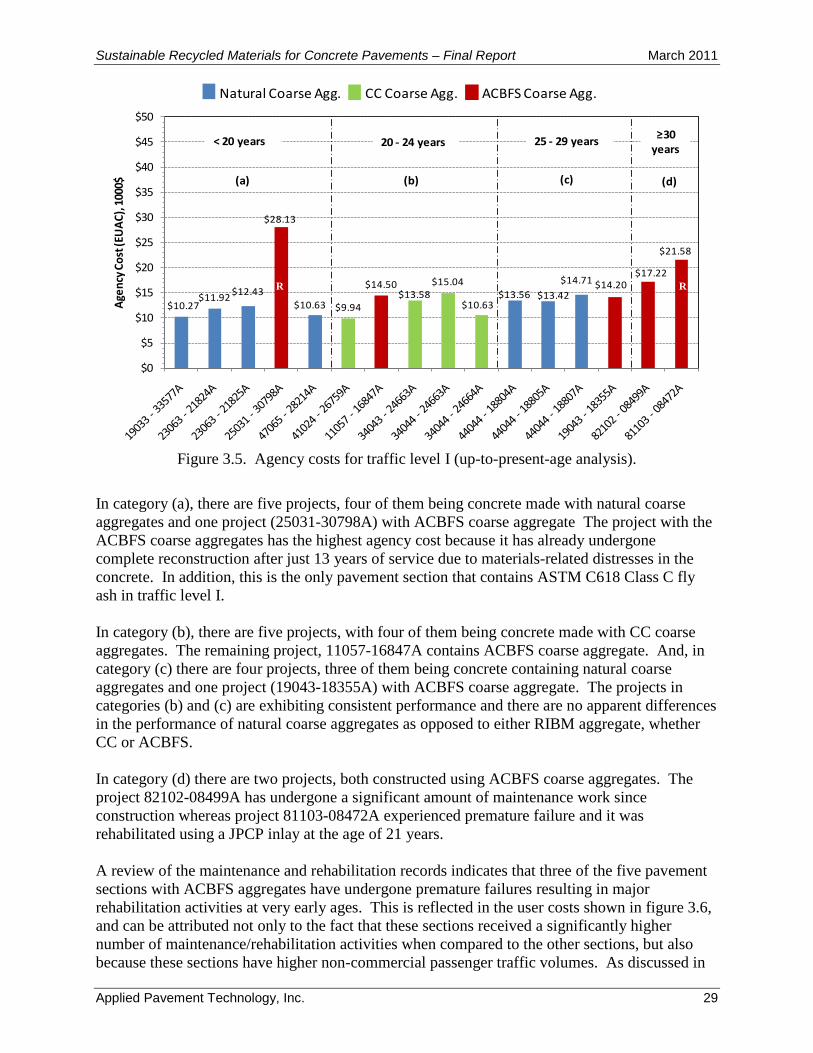
Sustainable Recycled Materials for Concrete Pavements – Final Report March 2011
Applied Pavement Technology, Inc. 29
$10.27$11.92 $12.43
$28.13
$10.63 $9.94
$14.50$13.58
$15.04
$10.63$13.56 $13.42
$14.71 $14.20$17.22
$21.58
$0
$5
$10
$15
$20
$25
$30
$35
$40
$45
$50Ag
ency
Cos
t (EU
AC),
1000
$
Natural Coarse Agg. CC Coarse Agg. ACBFS Coarse Agg.
< 20 years 20 - 24 years 25 - 29 years ≥30 years
(a) (b) (c) (d)
Figure 3.5. Agency costs for traffic level I (up-to-present-age analysis).
In category (a), there are five projects, four of them being concrete made with natural coarse aggregates and one project (25031-30798A) with ACBFS coarse aggregate The project with the ACBFS coarse aggregates has the highest agency cost because it has already undergone complete reconstruction after just 13 years of service due to materials-related distresses in the concrete. In addition, this is the only pavement section that contains ASTM C618 Class C fly ash in traffic level I. In category (b), there are five projects, with four of them being concrete made with CC coarse aggregates. The remaining project, 11057-16847A contains ACBFS coarse aggregate. And, in category (c) there are four projects, three of them being concrete containing natural coarse aggregates and one project (19043-18355A) with ACBFS coarse aggregate. The projects in categories (b) and (c) are exhibiting consistent performance and there are no apparent differences in the performance of natural coarse aggregates as opposed to either RIBM aggregate, whether CC or ACBFS. In category (d) there are two projects, both constructed using ACBFS coarse aggregates. The project 82102-08499A has undergone a significant amount of maintenance work since construction whereas project 81103-08472A experienced premature failure and it was rehabilitated using a JPCP inlay at the age of 21 years. A review of the maintenance and rehabilitation records indicates that three of the five pavement sections with ACBFS aggregates have undergone premature failures resulting in major rehabilitation activities at very early ages. This is reflected in the user costs shown in figure 3.6, and can be attributed not only to the fact that these sections received a significantly higher number of maintenance/rehabilitation activities when compared to the other sections, but also because these sections have higher non-commercial passenger traffic volumes. As discussed in
R R
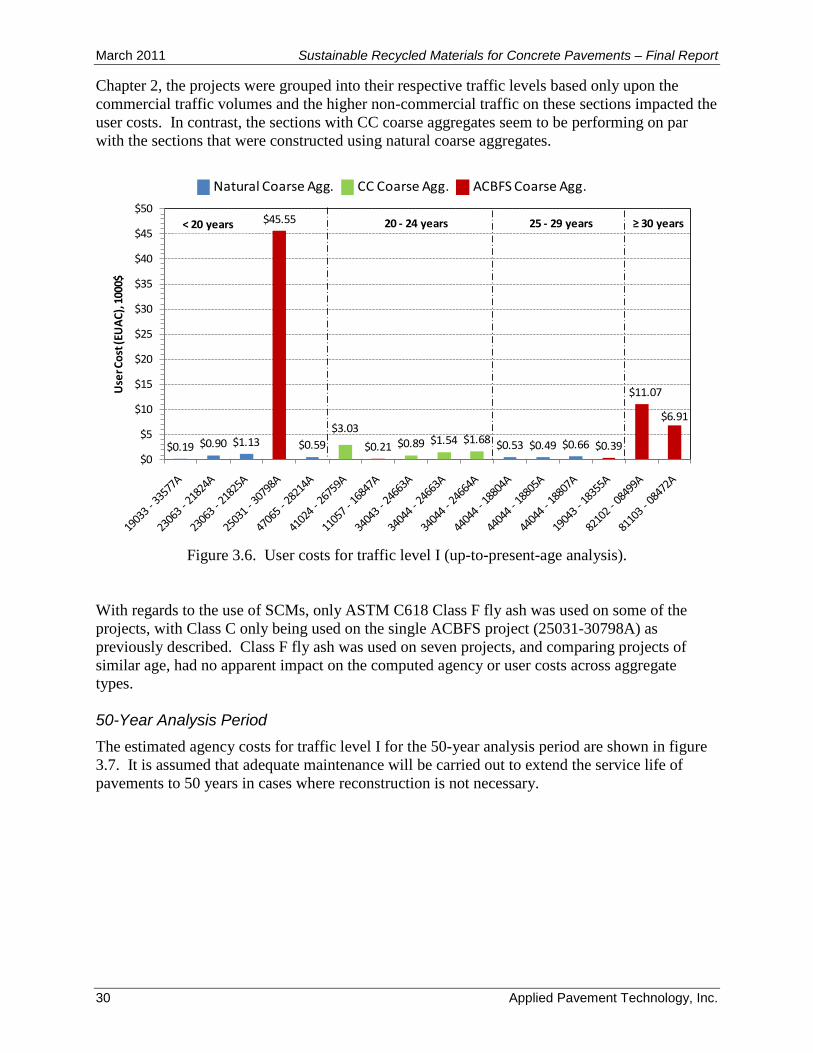
March 2011 Sustainable Recycled Materials for Concrete Pavements – Final Report
30 Applied Pavement Technology, Inc.
Chapter 2, the projects were grouped into their respective traffic levels based only upon the commercial traffic volumes and the higher non-commercial traffic on these sections impacted the user costs. In contrast, the sections with CC coarse aggregates seem to be performing on par with the sections that were constructed using natural coarse aggregates.
$0.19 $0.90 $1.13
$45.55
$0.59$3.03
$0.21 $0.89 $1.54 $1.68 $0.53 $0.49 $0.66 $0.39
$11.07
$6.91
$0
$5
$10
$15
$20
$25
$30
$35
$40
$45
$50
Use
r Cos
t (EU
AC),
1000
$
Natural Coarse Agg. CC Coarse Agg. ACBFS Coarse Agg.
< 20 years 20 - 24 years 25 - 29 years ≥ 30 years
Figure 3.6. User costs for traffic level I (up-to-present-age analysis).
With regards to the use of SCMs, only ASTM C618 Class F fly ash was used on some of the projects, with Class C only being used on the single ACBFS project (25031-30798A) as previously described. Class F fly ash was used on seven projects, and comparing projects of similar age, had no apparent impact on the computed agency or user costs across aggregate types. 50-Year Analysis Period The estimated agency costs for traffic level I for the 50-year analysis period are shown in figure 3.7. It is assumed that adequate maintenance will be carried out to extend the service life of pavements to 50 years in cases where reconstruction is not necessary.
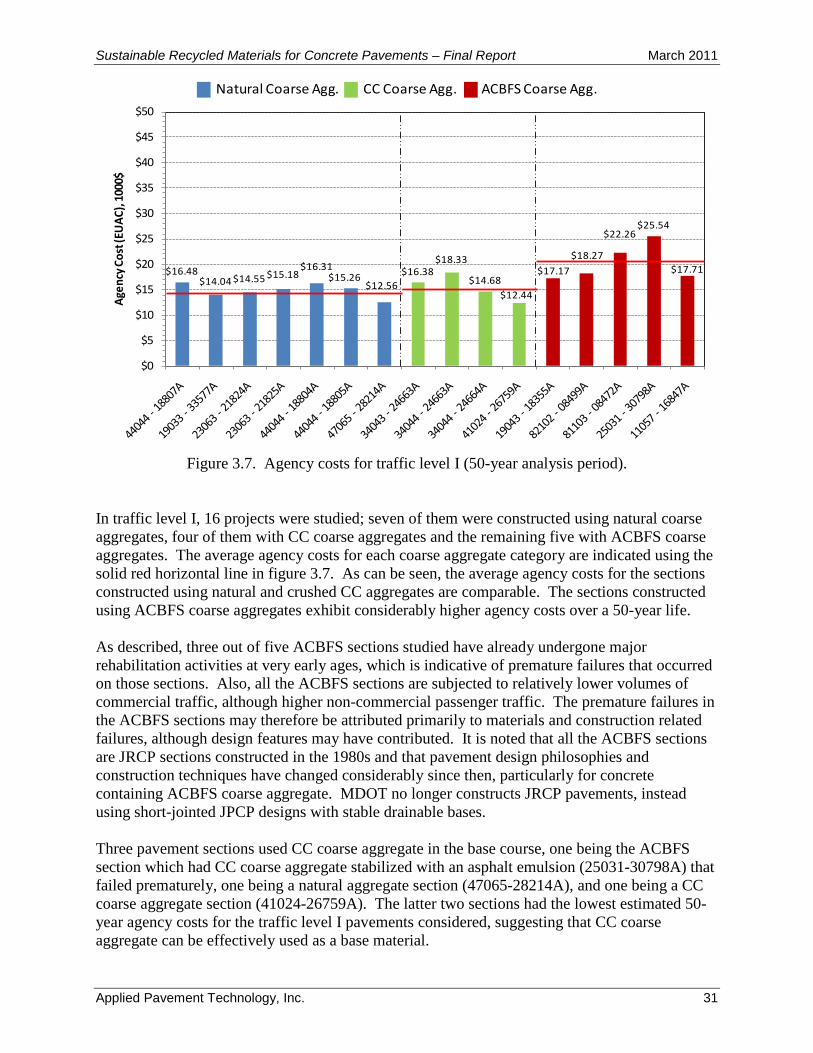
Sustainable Recycled Materials for Concrete Pavements – Final Report March 2011
Applied Pavement Technology, Inc. 31
$16.48$14.04 $14.55 $15.18
$16.31$15.26
$12.56$16.38
$18.33
$14.68$12.44
$17.17$18.27
$22.26$25.54
$17.71
$0
$5
$10
$15
$20
$25
$30
$35
$40
$45
$50Ag
ency
Cos
t (EU
AC),
1000
$
Natural Coarse Agg. CC Coarse Agg. ACBFS Coarse Agg.
Figure 3.7. Agency costs for traffic level I (50-year analysis period).
In traffic level I, 16 projects were studied; seven of them were constructed using natural coarse aggregates, four of them with CC coarse aggregates and the remaining five with ACBFS coarse aggregates. The average agency costs for each coarse aggregate category are indicated using the solid red horizontal line in figure 3.7. As can be seen, the average agency costs for the sections constructed using natural and crushed CC aggregates are comparable. The sections constructed using ACBFS coarse aggregates exhibit considerably higher agency costs over a 50-year life. As described, three out of five ACBFS sections studied have already undergone major rehabilitation activities at very early ages, which is indicative of premature failures that occurred on those sections. Also, all the ACBFS sections are subjected to relatively lower volumes of commercial traffic, although higher non-commercial passenger traffic. The premature failures in the ACBFS sections may therefore be attributed primarily to materials and construction related failures, although design features may have contributed. It is noted that all the ACBFS sections are JRCP sections constructed in the 1980s and that pavement design philosophies and construction techniques have changed considerably since then, particularly for concrete containing ACBFS coarse aggregate. MDOT no longer constructs JRCP pavements, instead using short-jointed JPCP designs with stable drainable bases. Three pavement sections used CC coarse aggregate in the base course, one being the ACBFS section which had CC coarse aggregate stabilized with an asphalt emulsion (25031-30798A) that failed prematurely, one being a natural aggregate section (47065-28214A), and one being a CC coarse aggregate section (41024-26759A). The latter two sections had the lowest estimated 50-year agency costs for the traffic level I pavements considered, suggesting that CC coarse aggregate can be effectively used as a base material.
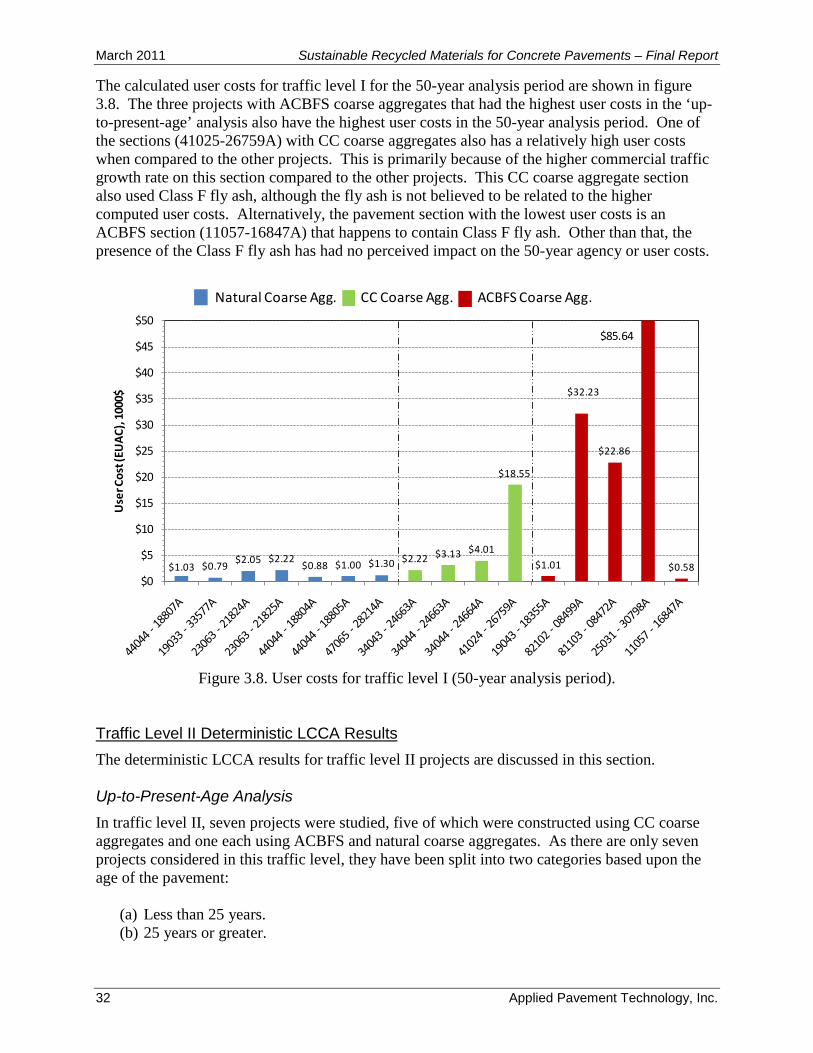
March 2011 Sustainable Recycled Materials for Concrete Pavements – Final Report
32 Applied Pavement Technology, Inc.
The calculated user costs for traffic level I for the 50-year analysis period are shown in figure 3.8. The three projects with ACBFS coarse aggregates that had the highest user costs in the ‘up-to-present-age’ analysis also have the highest user costs in the 50-year analysis period. One of the sections (41025-26759A) with CC coarse aggregates also has a relatively high user costs when compared to the other projects. This is primarily because of the higher commercial traffic growth rate on this section compared to the other projects. This CC coarse aggregate section also used Class F fly ash, although the fly ash is not believed to be related to the higher computed user costs. Alternatively, the pavement section with the lowest user costs is an ACBFS section (11057-16847A) that happens to contain Class F fly ash. Other than that, the presence of the Class F fly ash has had no perceived impact on the 50-year agency or user costs.
$1.03 $0.79 $2.05 $2.22 $0.88 $1.00 $1.30 $2.22 $3.13 $4.01
$18.55
$1.01
$32.23
$22.86
$0.58$0
$5
$10
$15
$20
$25
$30
$35
$40
$45
$50
Use
r Cos
t (EU
AC),
1000
$
Natural Coarse Agg. CC Coarse Agg. ACBFS Coarse Agg.
$85.64
Figure 3.8. User costs for traffic level I (50-year analysis period).
Traffic Level II Deterministic LCCA Results The deterministic LCCA results for traffic level II projects are discussed in this section. Up-to-Present-Age Analysis In traffic level II, seven projects were studied, five of which were constructed using CC coarse aggregates and one each using ACBFS and natural coarse aggregates. As there are only seven projects considered in this traffic level, they have been split into two categories based upon the age of the pavement:
(a) Less than 25 years. (b) 25 years or greater.
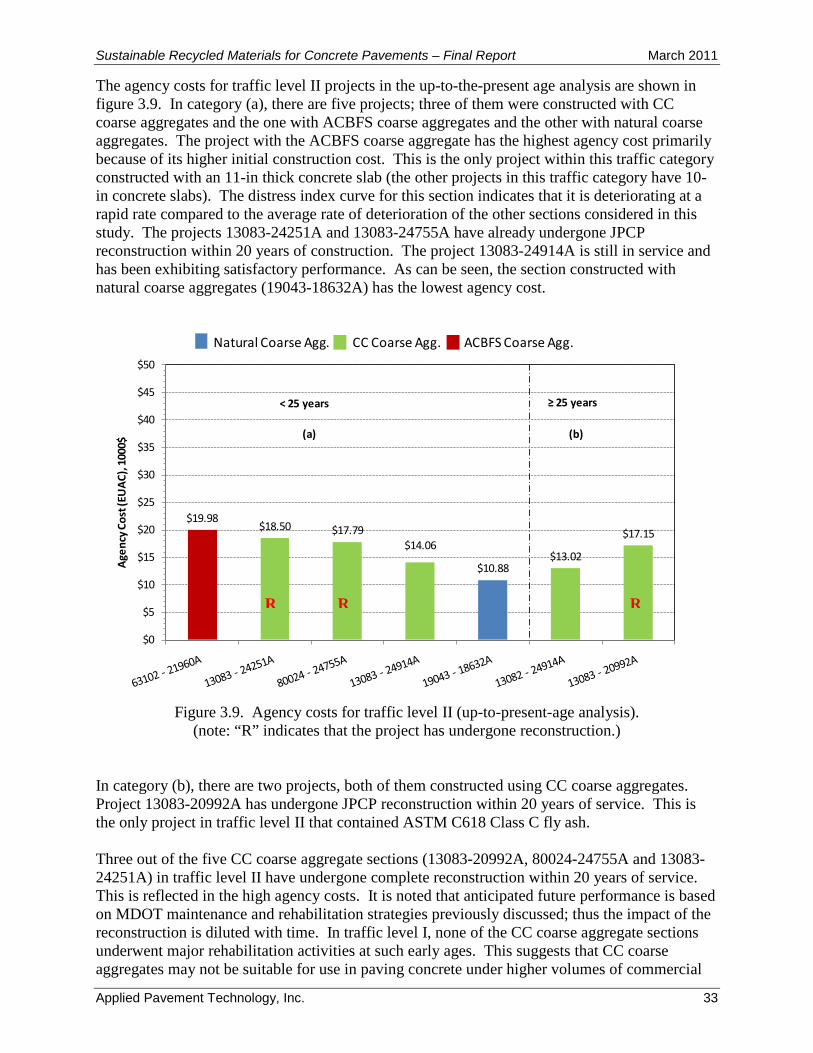
Sustainable Recycled Materials for Concrete Pavements – Final Report March 2011
Applied Pavement Technology, Inc. 33
The agency costs for traffic level II projects in the up-to-the-present age analysis are shown in figure 3.9. In category (a), there are five projects; three of them were constructed with CC coarse aggregates and the one with ACBFS coarse aggregates and the other with natural coarse aggregates. The project with the ACBFS coarse aggregate has the highest agency cost primarily because of its higher initial construction cost. This is the only project within this traffic category constructed with an 11-in thick concrete slab (the other projects in this traffic category have 10-in concrete slabs). The distress index curve for this section indicates that it is deteriorating at a rapid rate compared to the average rate of deterioration of the other sections considered in this study. The projects 13083-24251A and 13083-24755A have already undergone JPCP reconstruction within 20 years of construction. The project 13083-24914A is still in service and has been exhibiting satisfactory performance. As can be seen, the section constructed with natural coarse aggregates (19043-18632A) has the lowest agency cost.
$19.98$18.50 $17.79
$14.06
$10.88$13.02
$17.15
$0
$5
$10
$15
$20
$25
$30
$35
$40
$45
$50
Agen
cy C
ost (
EUAC
), 10
00$
Natural Coarse Agg. CC Coarse Agg. ACBFS Coarse Agg.
< 25 years ≥ 25 years
(a) (b)
Figure 3.9. Agency costs for traffic level II (up-to-present-age analysis).
(note: “R” indicates that the project has undergone reconstruction.) In category (b), there are two projects, both of them constructed using CC coarse aggregates. Project 13083-20992A has undergone JPCP reconstruction within 20 years of service. This is the only project in traffic level II that contained ASTM C618 Class C fly ash. Three out of the five CC coarse aggregate sections (13083-20992A, 80024-24755A and 13083-24251A) in traffic level II have undergone complete reconstruction within 20 years of service. This is reflected in the high agency costs. It is noted that anticipated future performance is based on MDOT maintenance and rehabilitation strategies previously discussed; thus the impact of the reconstruction is diluted with time. In traffic level I, none of the CC coarse aggregate sections underwent major rehabilitation activities at such early ages. This suggests that CC coarse aggregates may not be suitable for use in paving concrete under higher volumes of commercial
R R R
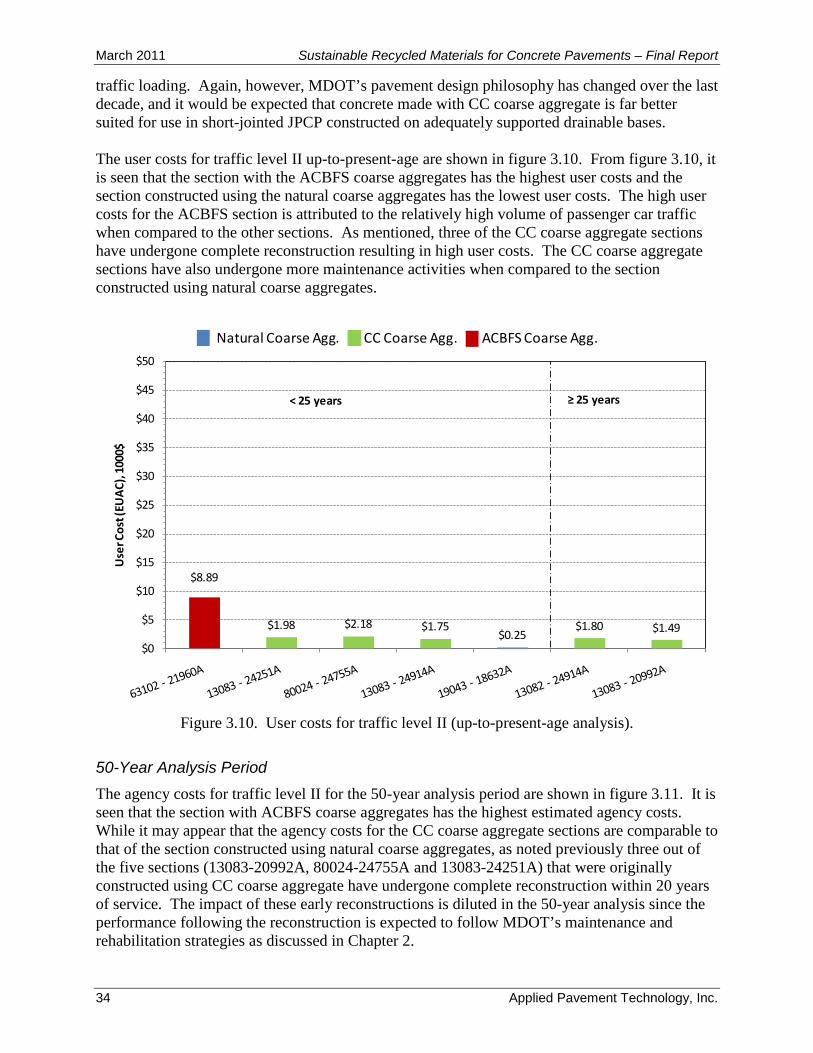
March 2011 Sustainable Recycled Materials for Concrete Pavements – Final Report
34 Applied Pavement Technology, Inc.
traffic loading. Again, however, MDOT’s pavement design philosophy has changed over the last decade, and it would be expected that concrete made with CC coarse aggregate is far better suited for use in short-jointed JPCP constructed on adequately supported drainable bases. The user costs for traffic level II up-to-present-age are shown in figure 3.10. From figure 3.10, it is seen that the section with the ACBFS coarse aggregates has the highest user costs and the section constructed using the natural coarse aggregates has the lowest user costs. The high user costs for the ACBFS section is attributed to the relatively high volume of passenger car traffic when compared to the other sections. As mentioned, three of the CC coarse aggregate sections have undergone complete reconstruction resulting in high user costs. The CC coarse aggregate sections have also undergone more maintenance activities when compared to the section constructed using natural coarse aggregates.
$8.89
$1.98 $2.18 $1.75$0.25
$1.80 $1.49
$0
$5
$10
$15
$20
$25
$30
$35
$40
$45
$50
Use
r Cos
t (EU
AC),
1000
$
Natural Coarse Agg. CC Coarse Agg. ACBFS Coarse Agg.
< 25 years ≥ 25 years
Figure 3.10. User costs for traffic level II (up-to-present-age analysis).
50-Year Analysis Period The agency costs for traffic level II for the 50-year analysis period are shown in figure 3.11. It is seen that the section with ACBFS coarse aggregates has the highest estimated agency costs. While it may appear that the agency costs for the CC coarse aggregate sections are comparable to that of the section constructed using natural coarse aggregates, as noted previously three out of the five sections (13083-20992A, 80024-24755A and 13083-24251A) that were originally constructed using CC coarse aggregate have undergone complete reconstruction within 20 years of service. The impact of these early reconstructions is diluted in the 50-year analysis since the performance following the reconstruction is expected to follow MDOT’s maintenance and rehabilitation strategies as discussed in Chapter 2.
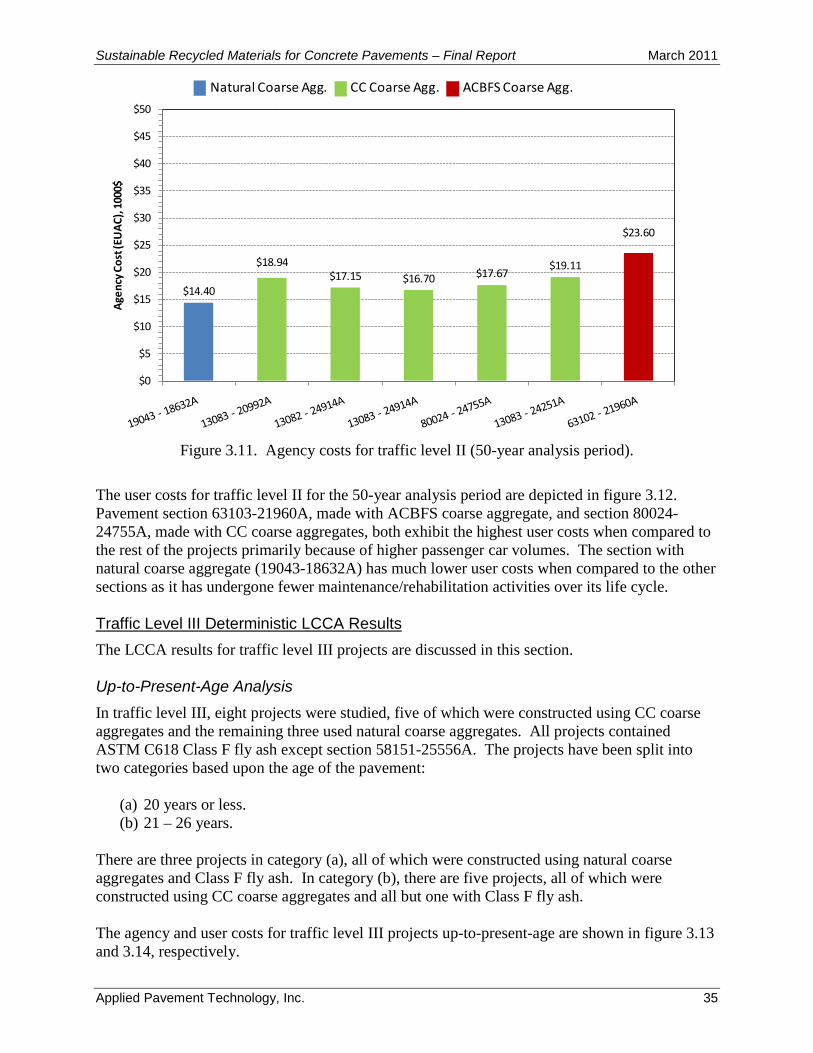
Sustainable Recycled Materials for Concrete Pavements – Final Report March 2011
Applied Pavement Technology, Inc. 35
$14.40
$18.94$17.15 $16.70 $17.67
$19.11
$23.60
$0
$5
$10
$15
$20
$25
$30
$35
$40
$45
$50Ag
ency
Cos
t (EU
AC),
1000
$
Natural Coarse Agg. CC Coarse Agg. ACBFS Coarse Agg.
Figure 3.11. Agency costs for traffic level II (50-year analysis period).
The user costs for traffic level II for the 50-year analysis period are depicted in figure 3.12. Pavement section 63103-21960A, made with ACBFS coarse aggregate, and section 80024-24755A, made with CC coarse aggregates, both exhibit the highest user costs when compared to the rest of the projects primarily because of higher passenger car volumes. The section with natural coarse aggregate (19043-18632A) has much lower user costs when compared to the other sections as it has undergone fewer maintenance/rehabilitation activities over its life cycle. Traffic Level III Deterministic LCCA Results The LCCA results for traffic level III projects are discussed in this section. Up-to-Present-Age Analysis In traffic level III, eight projects were studied, five of which were constructed using CC coarse aggregates and the remaining three used natural coarse aggregates. All projects contained ASTM C618 Class F fly ash except section 58151-25556A. The projects have been split into two categories based upon the age of the pavement:
(a) 20 years or less. (b) 21 – 26 years.
There are three projects in category (a), all of which were constructed using natural coarse aggregates and Class F fly ash. In category (b), there are five projects, all of which were constructed using CC coarse aggregates and all but one with Class F fly ash. The agency and user costs for traffic level III projects up-to-present-age are shown in figure 3.13 and 3.14, respectively.
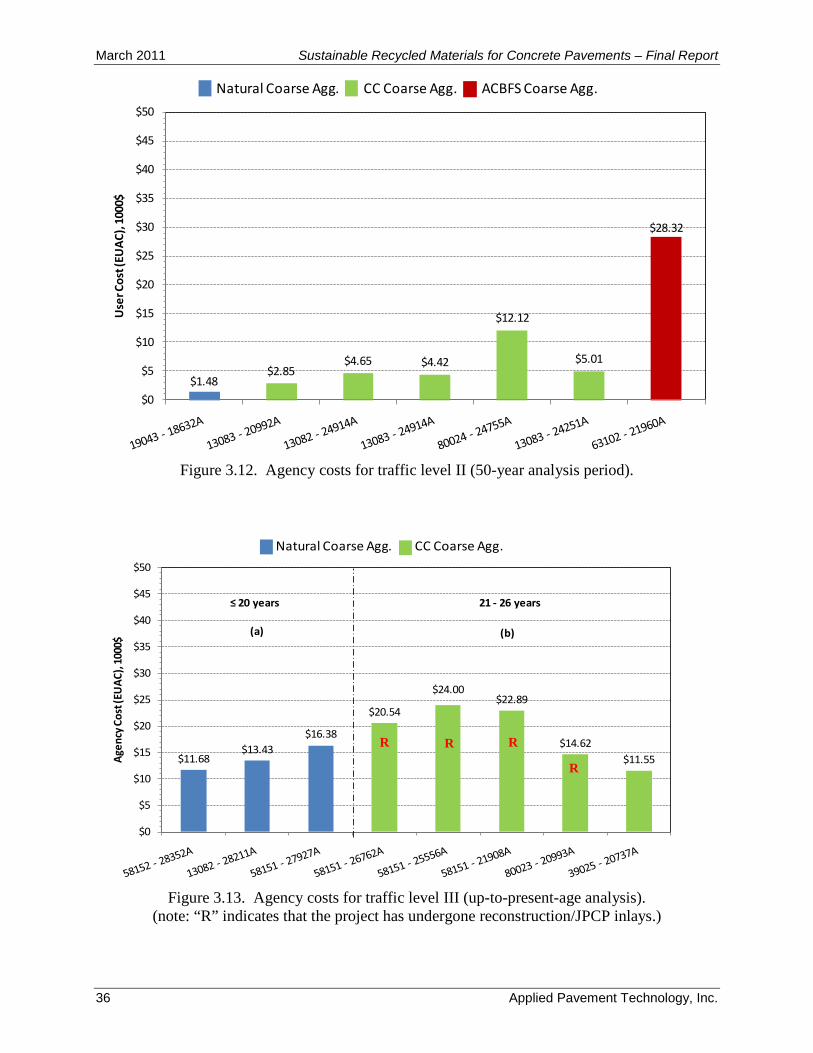
March 2011 Sustainable Recycled Materials for Concrete Pavements – Final Report
36 Applied Pavement Technology, Inc.
$1.48$2.85
$4.65 $4.42
$12.12
$5.01
$28.32
$0
$5
$10
$15
$20
$25
$30
$35
$40
$45
$50U
ser C
ost (
EUAC
), 10
00$
Natural Coarse Agg. CC Coarse Agg. ACBFS Coarse Agg.
Figure 3.12. Agency costs for traffic level II (50-year analysis period).
$11.68$13.43
$16.38
$20.54
$24.00$22.89
$14.62$11.55
$0
$5
$10
$15
$20
$25
$30
$35
$40
$45
$50
Agen
cy C
ost (
EUAC
), 10
00$
Natural Coarse Agg. CC Coarse Agg.
≤ 20 years 21 - 26 years
(a) (b)
Figure 3.13. Agency costs for traffic level III (up-to-present-age analysis).
(note: “R” indicates that the project has undergone reconstruction/JPCP inlays.)
R R
R
R
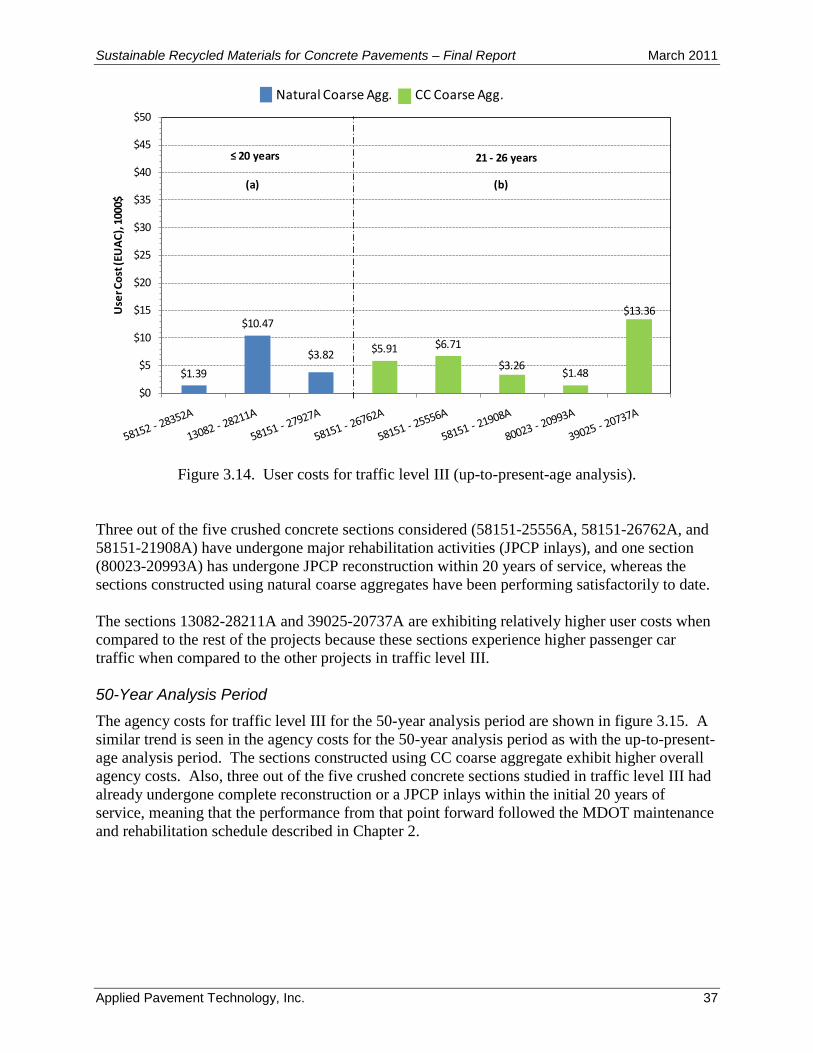
Sustainable Recycled Materials for Concrete Pavements – Final Report March 2011
Applied Pavement Technology, Inc. 37
$1.39
$10.47
$3.82 $5.91 $6.71
$3.26 $1.48
$13.36
$0
$5
$10
$15
$20
$25
$30
$35
$40
$45
$50U
ser C
ost (
EUAC
), 10
00$
Natural Coarse Agg. CC Coarse Agg.
≤ 20 years 21 - 26 years
(a) (b)
Figure 3.14. User costs for traffic level III (up-to-present-age analysis).
Three out of the five crushed concrete sections considered (58151-25556A, 58151-26762A, and 58151-21908A) have undergone major rehabilitation activities (JPCP inlays), and one section (80023-20993A) has undergone JPCP reconstruction within 20 years of service, whereas the sections constructed using natural coarse aggregates have been performing satisfactorily to date. The sections 13082-28211A and 39025-20737A are exhibiting relatively higher user costs when compared to the rest of the projects because these sections experience higher passenger car traffic when compared to the other projects in traffic level III. 50-Year Analysis Period The agency costs for traffic level III for the 50-year analysis period are shown in figure 3.15. A similar trend is seen in the agency costs for the 50-year analysis period as with the up-to-present-age analysis period. The sections constructed using CC coarse aggregate exhibit higher overall agency costs. Also, three out of the five crushed concrete sections studied in traffic level III had already undergone complete reconstruction or a JPCP inlays within the initial 20 years of service, meaning that the performance from that point forward followed the MDOT maintenance and rehabilitation schedule described in Chapter 2.
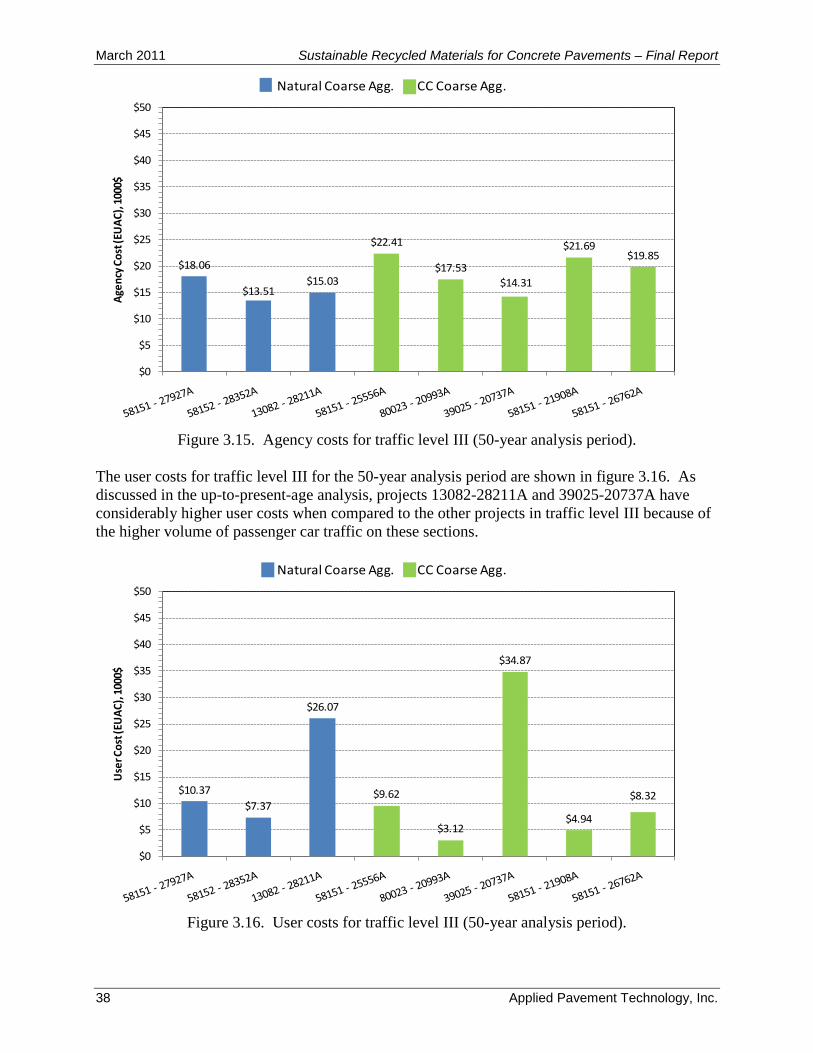
March 2011 Sustainable Recycled Materials for Concrete Pavements – Final Report
38 Applied Pavement Technology, Inc.
$18.06
$13.51$15.03
$22.41
$17.53$14.31
$21.69$19.85
$0
$5
$10
$15
$20
$25
$30
$35
$40
$45
$50Ag
ency
Cos
t (EU
AC),
1000
$
Natural Coarse Agg. CC Coarse Agg.
Figure 3.15. Agency costs for traffic level III (50-year analysis period).
The user costs for traffic level III for the 50-year analysis period are shown in figure 3.16. As discussed in the up-to-present-age analysis, projects 13082-28211A and 39025-20737A have considerably higher user costs when compared to the other projects in traffic level III because of the higher volume of passenger car traffic on these sections.
$10.37$7.37
$26.07
$9.62
$3.12
$34.87
$4.94
$8.32
$0
$5
$10
$15
$20
$25
$30
$35
$40
$45
$50
Use
r Cos
t (EU
AC),
1000
$
Natural Coarse Agg. CC Coarse Agg.
Figure 3.16. User costs for traffic level III (50-year analysis period).
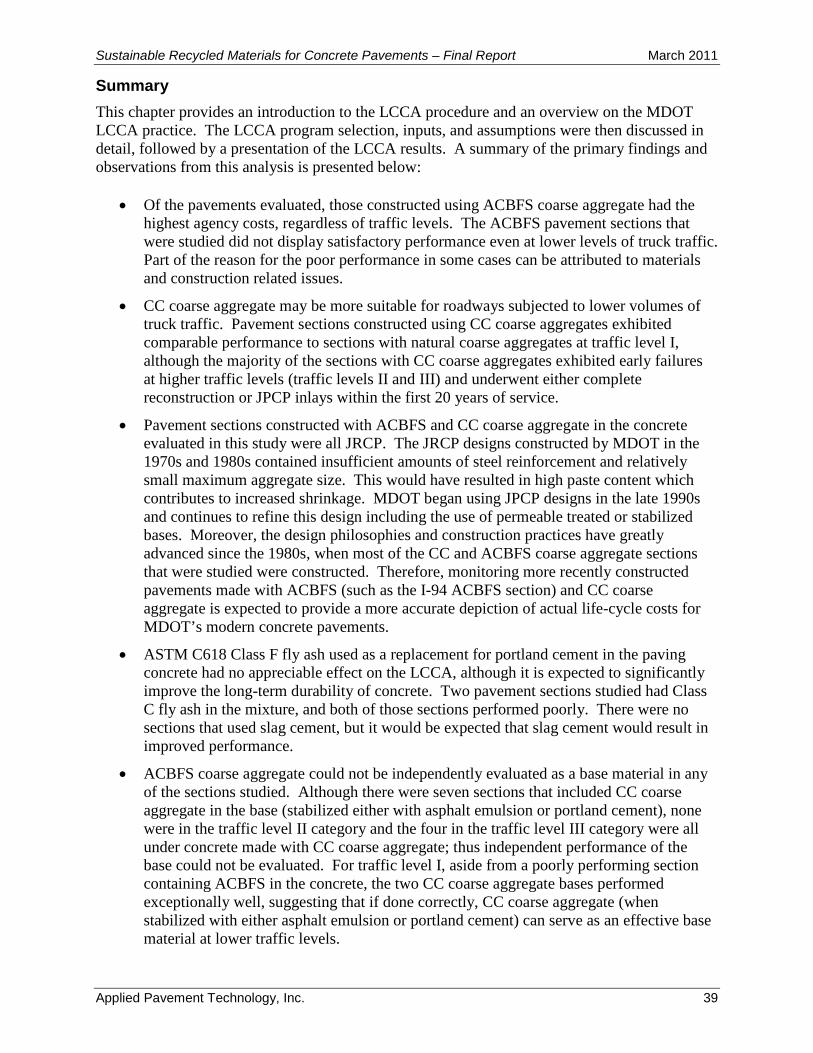
Sustainable Recycled Materials for Concrete Pavements – Final Report March 2011
Applied Pavement Technology, Inc. 39
Summary This chapter provides an introduction to the LCCA procedure and an overview on the MDOT LCCA practice. The LCCA program selection, inputs, and assumptions were then discussed in detail, followed by a presentation of the LCCA results. A summary of the primary findings and observations from this analysis is presented below:
• Of the pavements evaluated, those constructed using ACBFS coarse aggregate had the highest agency costs, regardless of traffic levels. The ACBFS pavement sections that were studied did not display satisfactory performance even at lower levels of truck traffic. Part of the reason for the poor performance in some cases can be attributed to materials and construction related issues.
• CC coarse aggregate may be more suitable for roadways subjected to lower volumes of truck traffic. Pavement sections constructed using CC coarse aggregates exhibited comparable performance to sections with natural coarse aggregates at traffic level I, although the majority of the sections with CC coarse aggregates exhibited early failures at higher traffic levels (traffic levels II and III) and underwent either complete reconstruction or JPCP inlays within the first 20 years of service.
• Pavement sections constructed with ACBFS and CC coarse aggregate in the concrete evaluated in this study were all JRCP. The JRCP designs constructed by MDOT in the 1970s and 1980s contained insufficient amounts of steel reinforcement and relatively small maximum aggregate size. This would have resulted in high paste content which contributes to increased shrinkage. MDOT began using JPCP designs in the late 1990s and continues to refine this design including the use of permeable treated or stabilized bases. Moreover, the design philosophies and construction practices have greatly advanced since the 1980s, when most of the CC and ACBFS coarse aggregate sections that were studied were constructed. Therefore, monitoring more recently constructed pavements made with ACBFS (such as the I-94 ACBFS section) and CC coarse aggregate is expected to provide a more accurate depiction of actual life-cycle costs for MDOT’s modern concrete pavements.
• ASTM C618 Class F fly ash used as a replacement for portland cement in the paving concrete had no appreciable effect on the LCCA, although it is expected to significantly improve the long-term durability of concrete. Two pavement sections studied had Class C fly ash in the mixture, and both of those sections performed poorly. There were no sections that used slag cement, but it would be expected that slag cement would result in improved performance.
• ACBFS coarse aggregate could not be independently evaluated as a base material in any of the sections studied. Although there were seven sections that included CC coarse aggregate in the base (stabilized either with asphalt emulsion or portland cement), none were in the traffic level II category and the four in the traffic level III category were all under concrete made with CC coarse aggregate; thus independent performance of the base could not be evaluated. For traffic level I, aside from a poorly performing section containing ACBFS in the concrete, the two CC coarse aggregate bases performed exceptionally well, suggesting that if done correctly, CC coarse aggregate (when stabilized with either asphalt emulsion or portland cement) can serve as an effective base material at lower traffic levels.

March 2011 Sustainable Recycled Materials for Concrete Pavements – Final Report
40 Applied Pavement Technology, Inc.
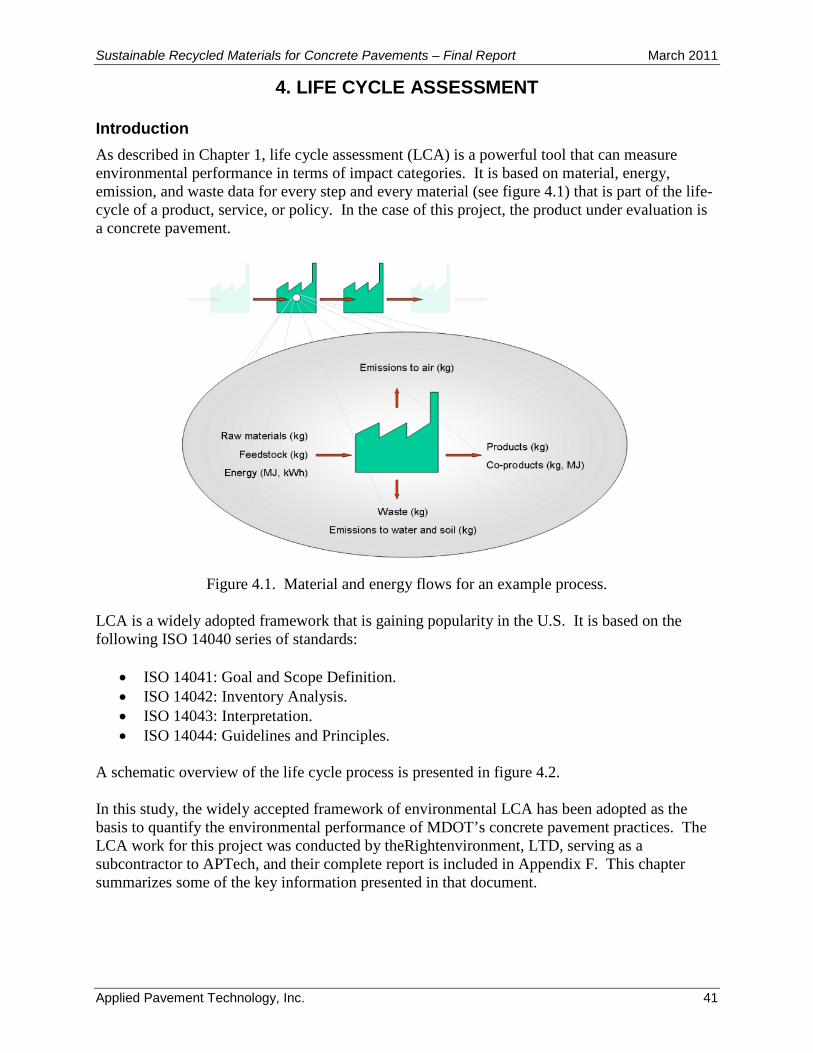
Sustainable Recycled Materials for Concrete Pavements – Final Report March 2011
Applied Pavement Technology, Inc. 41
4. LIFE CYCLE ASSESSMENT
Introduction As described in Chapter 1, life cycle assessment (LCA) is a powerful tool that can measure environmental performance in terms of impact categories. It is based on material, energy, emission, and waste data for every step and every material (see figure 4.1) that is part of the life-cycle of a product, service, or policy. In the case of this project, the product under evaluation is a concrete pavement.
Figure 4.1. Material and energy flows for an example process.
LCA is a widely adopted framework that is gaining popularity in the U.S. It is based on the following ISO 14040 series of standards:
• ISO 14041: Goal and Scope Definition. • ISO 14042: Inventory Analysis. • ISO 14043: Interpretation. • ISO 14044: Guidelines and Principles.
A schematic overview of the life cycle process is presented in figure 4.2. In this study, the widely accepted framework of environmental LCA has been adopted as the basis to quantify the environmental performance of MDOT’s concrete pavement practices. The LCA work for this project was conducted by theRightenvironment, LTD, serving as a subcontractor to APTech, and their complete report is included in Appendix F. This chapter summarizes some of the key information presented in that document.
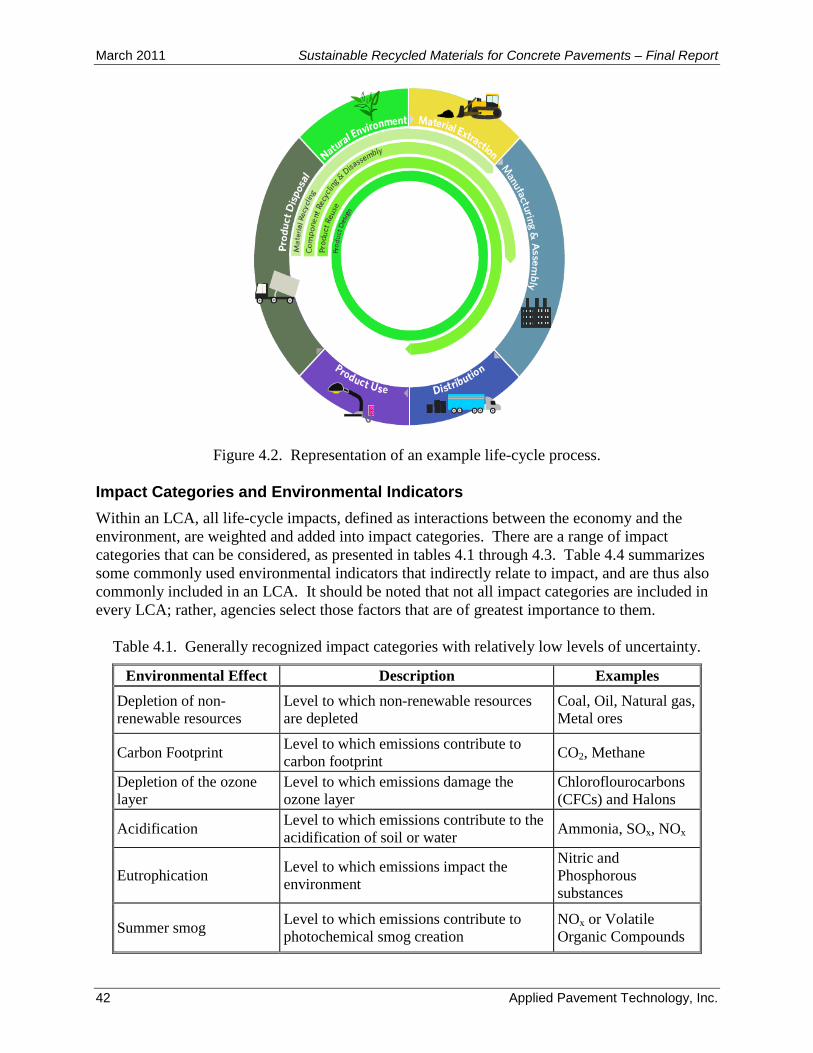
March 2011 Sustainable Recycled Materials for Concrete Pavements – Final Report
42 Applied Pavement Technology, Inc.
Figure 4.2. Representation of an example life-cycle process.
Impact Categories and Environmental Indicators Within an LCA, all life-cycle impacts, defined as interactions between the economy and the environment, are weighted and added into impact categories. There are a range of impact categories that can be considered, as presented in tables 4.1 through 4.3. Table 4.4 summarizes some commonly used environmental indicators that indirectly relate to impact, and are thus also commonly included in an LCA. It should be noted that not all impact categories are included in every LCA; rather, agencies select those factors that are of greatest importance to them.
Table 4.1. Generally recognized impact categories with relatively low levels of uncertainty.
Environmental Effect Description Examples Depletion of non-renewable resources
Level to which non-renewable resources are depleted
Coal, Oil, Natural gas, Metal ores
Carbon Footprint Level to which emissions contribute to carbon footprint CO2, Methane
Depletion of the ozone layer
Level to which emissions damage the ozone layer
Chloroflourocarbons (CFCs) and Halons
Acidification Level to which emissions contribute to the acidification of soil or water Ammonia, SOx, NOx
Eutrophication Level to which emissions impact the environment
Nitric and Phosphorous substances
Summer smog Level to which emissions contribute to photochemical smog creation
NOx or Volatile Organic Compounds
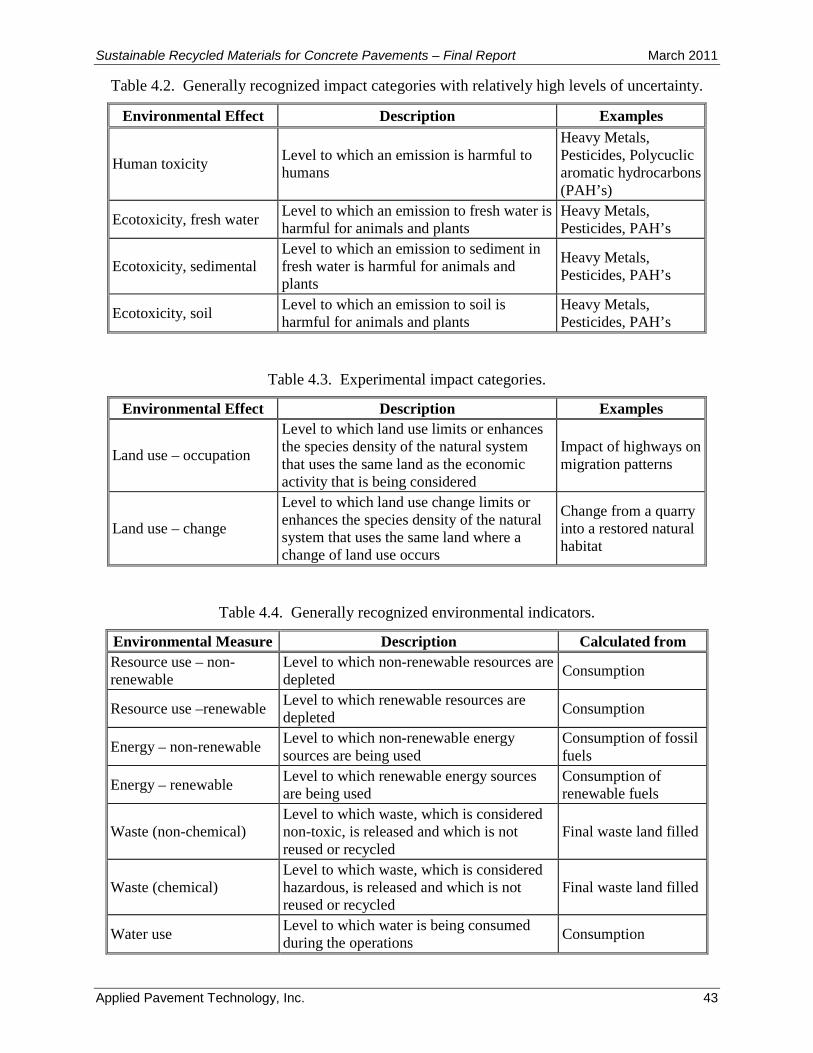
Sustainable Recycled Materials for Concrete Pavements – Final Report March 2011
Applied Pavement Technology, Inc. 43
Table 4.2. Generally recognized impact categories with relatively high levels of uncertainty.
Environmental Effect Description Examples
Human toxicity Level to which an emission is harmful to humans
Heavy Metals, Pesticides, Polycuclic aromatic hydrocarbons (PAH’s)
Ecotoxicity, fresh water Level to which an emission to fresh water is harmful for animals and plants
Heavy Metals, Pesticides, PAH’s
Ecotoxicity, sedimental Level to which an emission to sediment in fresh water is harmful for animals and plants
Heavy Metals, Pesticides, PAH’s
Ecotoxicity, soil Level to which an emission to soil is harmful for animals and plants
Heavy Metals, Pesticides, PAH’s
Table 4.3. Experimental impact categories.
Environmental Effect Description Examples
Land use – occupation
Level to which land use limits or enhances the species density of the natural system that uses the same land as the economic activity that is being considered
Impact of highways on migration patterns
Land use – change
Level to which land use change limits or enhances the species density of the natural system that uses the same land where a change of land use occurs
Change from a quarry into a restored natural habitat
Table 4.4. Generally recognized environmental indicators.
Environmental Measure Description Calculated from Resource use – non-renewable
Level to which non-renewable resources are depleted Consumption
Resource use –renewable Level to which renewable resources are depleted Consumption
Energy – non-renewable Level to which non-renewable energy sources are being used
Consumption of fossil fuels
Energy – renewable Level to which renewable energy sources are being used
Consumption of renewable fuels
Waste (non-chemical) Level to which waste, which is considered non-toxic, is released and which is not reused or recycled
Final waste land filled
Waste (chemical) Level to which waste, which is considered hazardous, is released and which is not reused or recycled
Final waste land filled
Water use Level to which water is being consumed during the operations Consumption
March 2011 Sustainable Recycled Materials for Concrete Pavements – Final Report
44 Applied Pavement Technology, Inc.
Selection for this Project For this study, the following considerations were taken into account when determining the most suitable approach for conducting an LCA:
• As an initial effort, this study quantified concrete pavement sustainability using a simplified LCA-based approach. Thus a “screening” LCA was performed based on a limited set of environmental indicators.
• Since this study involves the assessment of infrastructure projects, specific relevant environmental indicators were incorporated into the development of the LCA model.
• Since this study is specific to Michigan, environmental indicators that reflect impact on water quality were included.
Relevant indicators for infrastructure projects include:
• Use of secondary material (RIBMs) as a material flow.
• Use of local materials.
• Overall energy and CO2 intensity of various strategies. Accounting for the considerations discussed above, the following environmental indicators and impact categories were used in developing the LCA model for this project:
• Energy use, expressed in megajoules (MJ).
• CO2-footprint based on carbon footprint equivalents (CO2 eq).
• Eutrophication and acidification to measure the impact on water quality.
• Volume of secondary (recycled) material as compared to the volume of primary (natural or virgin) material.
• Transportation intensity in terms of ton-miles. Pavement System Boundaries Every LCA has system “boundaries” that define what is included in the assessment and what is not. In this project, attempts have been made to follow the best LCA practices while also establishing several project specific boundaries. Special attention was given to exclusions and the potential effect on the result, as well as when system boundaries are defined when different systems cross; in those situations, a decision on what belongs to each system was made. In LCA terminology this is referred to as allocation. The pavement system boundaries and other assumptions are discussed in this section. Life-Cycle Phases Included in this study are material flows associated with life-cycle considerations related to:
• Acquisition of materials. • Construction. • Maintenance.
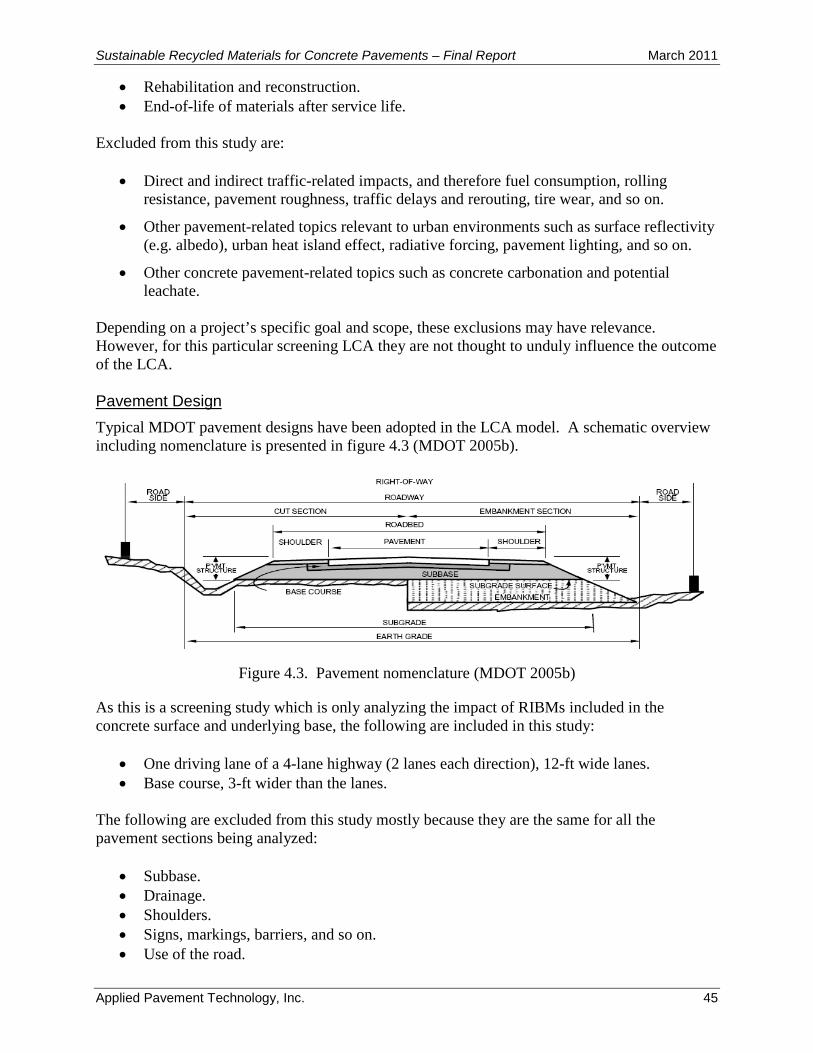
Sustainable Recycled Materials for Concrete Pavements – Final Report March 2011
Applied Pavement Technology, Inc. 45
• Rehabilitation and reconstruction. • End-of-life of materials after service life.
Excluded from this study are:
• Direct and indirect traffic-related impacts, and therefore fuel consumption, rolling resistance, pavement roughness, traffic delays and rerouting, tire wear, and so on.
• Other pavement-related topics relevant to urban environments such as surface reflectivity (e.g. albedo), urban heat island effect, radiative forcing, pavement lighting, and so on.
• Other concrete pavement-related topics such as concrete carbonation and potential leachate.
Depending on a project’s specific goal and scope, these exclusions may have relevance. However, for this particular screening LCA they are not thought to unduly influence the outcome of the LCA. Pavement Design Typical MDOT pavement designs have been adopted in the LCA model. A schematic overview including nomenclature is presented in figure 4.3 (MDOT 2005b).
Figure 4.3. Pavement nomenclature (MDOT 2005b)
As this is a screening study which is only analyzing the impact of RIBMs included in the concrete surface and underlying base, the following are included in this study:
• One driving lane of a 4-lane highway (2 lanes each direction), 12-ft wide lanes. • Base course, 3-ft wider than the lanes.
The following are excluded from this study mostly because they are the same for all the pavement sections being analyzed:
• Subbase. • Drainage. • Shoulders. • Signs, markings, barriers, and so on. • Use of the road.
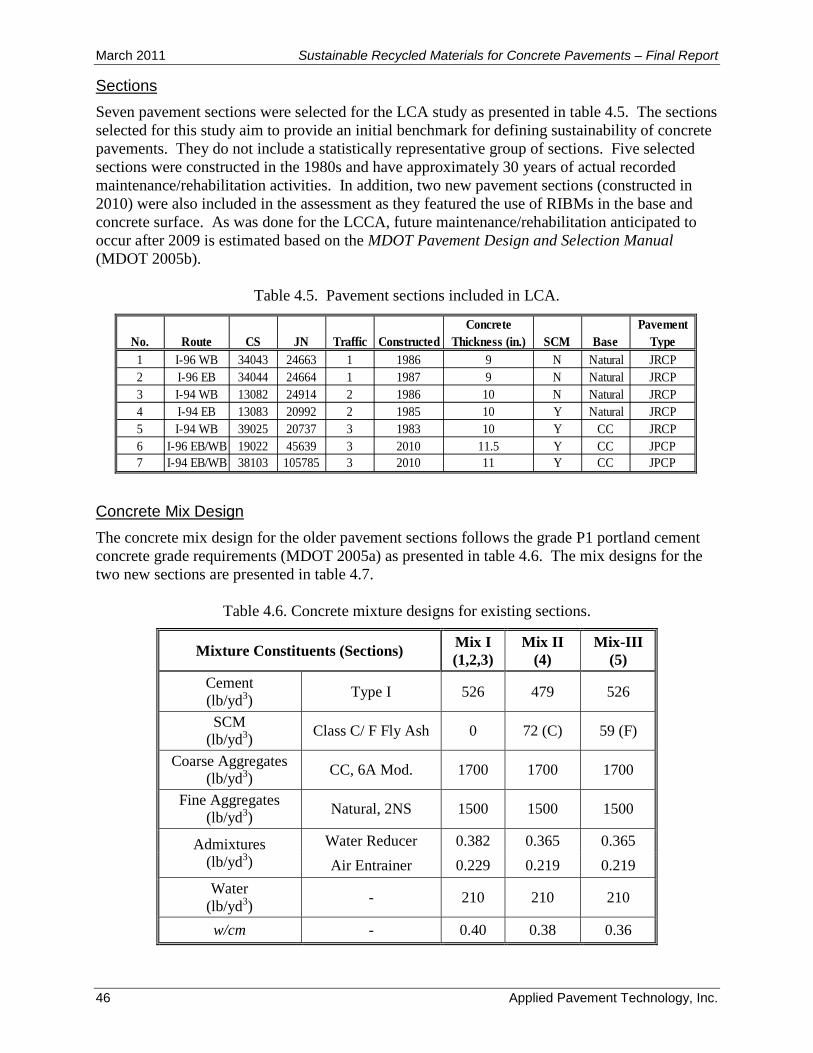
March 2011 Sustainable Recycled Materials for Concrete Pavements – Final Report
46 Applied Pavement Technology, Inc.
Sections Seven pavement sections were selected for the LCA study as presented in table 4.5. The sections selected for this study aim to provide an initial benchmark for defining sustainability of concrete pavements. They do not include a statistically representative group of sections. Five selected sections were constructed in the 1980s and have approximately 30 years of actual recorded maintenance/rehabilitation activities. In addition, two new pavement sections (constructed in 2010) were also included in the assessment as they featured the use of RIBMs in the base and concrete surface. As was done for the LCCA, future maintenance/rehabilitation anticipated to occur after 2009 is estimated based on the MDOT Pavement Design and Selection Manual (MDOT 2005b).
Table 4.5. Pavement sections included in LCA.
1 I-96 WB 34043 24663 1 1986 9 N Natural JRCP2 I-96 EB 34044 24664 1 1987 9 N Natural JRCP3 I-94 WB 13082 24914 2 1986 10 N Natural JRCP4 I-94 EB 13083 20992 2 1985 10 Y Natural JRCP5 I-94 WB 39025 20737 3 1983 10 Y CC JRCP6 I-96 EB/WB 19022 45639 3 2010 11.5 Y CC JPCP7 I-94 EB/WB 38103 105785 3 2010 11 Y CC JPCP
BasePavement
TypeTrafficConcrete
Thickness (in.)No. Route CS JN Constructed SCM
Concrete Mix Design The concrete mix design for the older pavement sections follows the grade P1 portland cement concrete grade requirements (MDOT 2005a) as presented in table 4.6. The mix designs for the two new sections are presented in table 4.7.
Table 4.6. Concrete mixture designs for existing sections.
Mixture Constituents (Sections) Mix I (1,2,3)
Mix II (4)
Mix-III (5)
Cement (lb/yd3) Type I 526 479 526
SCM (lb/yd3) Class C/ F Fly Ash 0 72 (C) 59 (F)
Coarse Aggregates (lb/yd3) CC, 6A Mod. 1700 1700 1700
Fine Aggregates (lb/yd3) Natural, 2NS 1500 1500 1500
Admixtures (lb/yd3)
Water Reducer 0.382 0.365 0.365 Air Entrainer 0.229 0.219 0.219
Water (lb/yd3) - 210 210 210
w/cm - 0.40 0.38 0.36
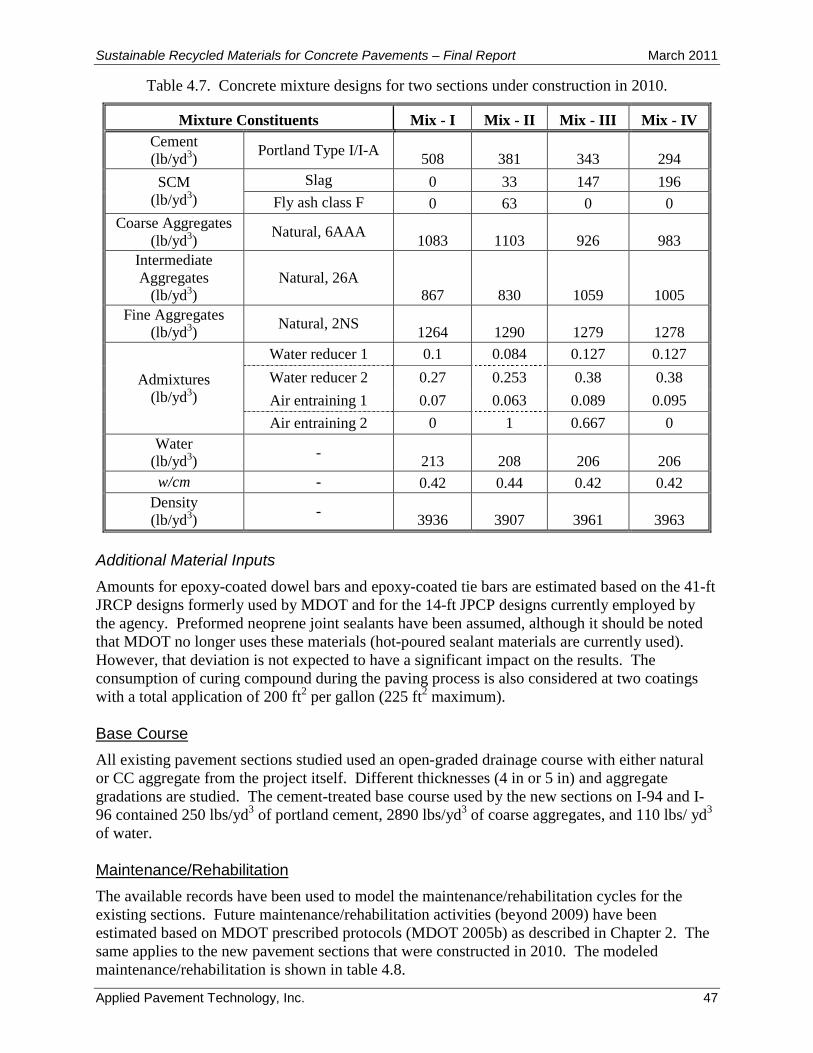
Sustainable Recycled Materials for Concrete Pavements – Final Report March 2011
Applied Pavement Technology, Inc. 47
Table 4.7. Concrete mixture designs for two sections under construction in 2010.
Mixture Constituents Mix - I Mix - II Mix - III Mix - IV Cement (lb/yd3) Portland Type I/I-A 508 381 343 294 SCM
(lb/yd3) Slag 0 33 147 196
Fly ash class F 0 63 0 0 Coarse Aggregates
(lb/yd3) Natural, 6AAA 1083 1103 926 983 Intermediate Aggregates
(lb/yd3) Natural, 26A
867 830 1059 1005 Fine Aggregates
(lb/yd3) Natural, 2NS 1264 1290 1279 1278
Admixtures (lb/yd3)
Water reducer 1 0.1 0.084 0.127 0.127 Water reducer 2 0.27 0.253 0.38 0.38 Air entraining 1 0.07 0.063 0.089 0.095 Air entraining 2 0 1 0.667 0
Water (lb/yd3) - 213 208 206 206 w/cm - 0.42 0.44 0.42 0.42
Density (lb/yd3) - 3936 3907 3961 3963
Additional Material Inputs Amounts for epoxy-coated dowel bars and epoxy-coated tie bars are estimated based on the 41-ft JRCP designs formerly used by MDOT and for the 14-ft JPCP designs currently employed by the agency. Preformed neoprene joint sealants have been assumed, although it should be noted that MDOT no longer uses these materials (hot-poured sealant materials are currently used). However, that deviation is not expected to have a significant impact on the results. The consumption of curing compound during the paving process is also considered at two coatings with a total application of 200 ft2 per gallon (225 ft2 maximum). Base Course All existing pavement sections studied used an open-graded drainage course with either natural or CC aggregate from the project itself. Different thicknesses (4 in or 5 in) and aggregate gradations are studied. The cement-treated base course used by the new sections on I-94 and I-96 contained 250 lbs/yd3 of portland cement, 2890 lbs/yd3 of coarse aggregates, and 110 lbs/ yd3 of water. Maintenance/Rehabilitation The available records have been used to model the maintenance/rehabilitation cycles for the existing sections. Future maintenance/rehabilitation activities (beyond 2009) have been estimated based on MDOT prescribed protocols (MDOT 2005b) as described in Chapter 2. The same applies to the new pavement sections that were constructed in 2010. The modeled maintenance/rehabilitation is shown in table 4.8.
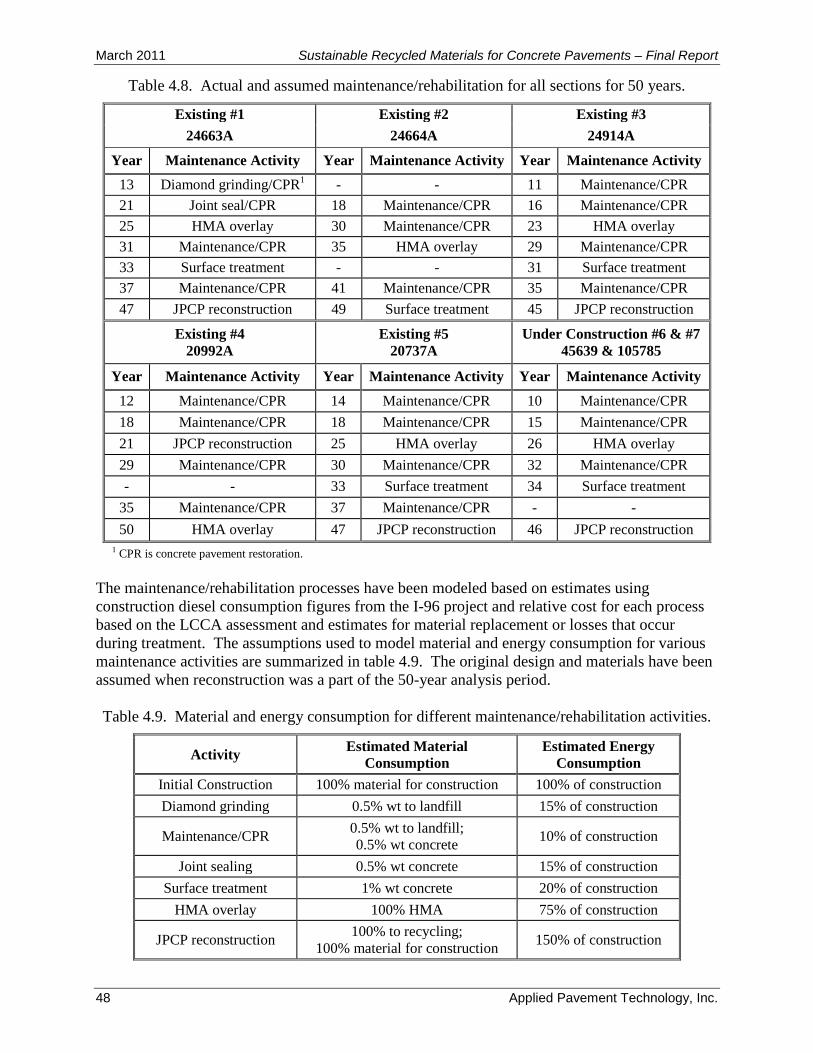
March 2011 Sustainable Recycled Materials for Concrete Pavements – Final Report
48 Applied Pavement Technology, Inc.
Table 4.8. Actual and assumed maintenance/rehabilitation for all sections for 50 years.
Existing #1 Existing #2 Existing #3 24663A 24664A 24914A
Year Maintenance Activity Year Maintenance Activity Year Maintenance Activity 13 Diamond grinding/CPR1 - - 11 Maintenance/CPR 21 Joint seal/CPR 18 Maintenance/CPR 16 Maintenance/CPR 25 HMA overlay 30 Maintenance/CPR 23 HMA overlay 31 Maintenance/CPR 35 HMA overlay 29 Maintenance/CPR 33 Surface treatment - - 31 Surface treatment 37 Maintenance/CPR 41 Maintenance/CPR 35 Maintenance/CPR 47 JPCP reconstruction 49 Surface treatment 45 JPCP reconstruction
Existing #4 20992A
Existing #5 20737A
Under Construction #6 & #7 45639 & 105785
Year Maintenance Activity Year Maintenance Activity Year Maintenance Activity
12 Maintenance/CPR 14 Maintenance/CPR 10 Maintenance/CPR 18 Maintenance/CPR 18 Maintenance/CPR 15 Maintenance/CPR 21 JPCP reconstruction 25 HMA overlay 26 HMA overlay 29 Maintenance/CPR 30 Maintenance/CPR 32 Maintenance/CPR - - 33 Surface treatment 34 Surface treatment
35 Maintenance/CPR 37 Maintenance/CPR - - 50 HMA overlay 47 JPCP reconstruction 46 JPCP reconstruction
1 CPR is concrete pavement restoration. The maintenance/rehabilitation processes have been modeled based on estimates using construction diesel consumption figures from the I-96 project and relative cost for each process based on the LCCA assessment and estimates for material replacement or losses that occur during treatment. The assumptions used to model material and energy consumption for various maintenance activities are summarized in table 4.9. The original design and materials have been assumed when reconstruction was a part of the 50-year analysis period. Table 4.9. Material and energy consumption for different maintenance/rehabilitation activities.
Activity Estimated Material Consumption
Estimated Energy Consumption
Initial Construction 100% material for construction 100% of construction Diamond grinding 0.5% wt to landfill 15% of construction
Maintenance/CPR 0.5% wt to landfill; 0.5% wt concrete 10% of construction
Joint sealing 0.5% wt concrete 15% of construction Surface treatment 1% wt concrete 20% of construction
HMA overlay 100% HMA 75% of construction
JPCP reconstruction 100% to recycling; 100% material for construction 150% of construction
Sustainable Recycled Materials for Concrete Pavements – Final Report March 2011
Applied Pavement Technology, Inc. 49
For the HMA overlay, a layer of 3.5-in (applied in two lifts) was assumed. It was also assumed that the asphalt mixture used non-modified bitumen at 8 percent weight and that the asphalt plant consumed fuel oil. Feedstock energy in bitumen has been included in the calculations. End-of-Life All material waste that is generated for waste treatment during the 50-year period of the pavement life has been modeled using default end-of-life scenarios that reflect current practices. The most important assumptions regarding end-of-life are:
• Concrete: 100 percent recycling on-site or regionally. • Steel: 100 percent recycling in North America. • HMA: 100 percent recycling regionally.
Allocation Whenever a system boundary is crossed, environmental inputs and outputs have to be assigned to the different products. Furthermore, where multiple inputs and/or multiple outputs are considered, the same applies. The ISO Standards prescribe where and how allocation occurs in the modelling of the LCA. The preferred way to avoid allocation when a system boundary is crossed is to expand the system boundaries to include all of the parts. This is not always possible. In this LCA, system boundaries are crossed for the manufacturing processes and re-use or reclaiming components after use. The relevant allocations for this study are described below. Recycling Allocation for the on-site recycling of concrete is not necessary as all processes are related to the project. For the use of recycled material, or the production of recycled material after the functional lifespan of the pavement is over, allocation needs to be applied. In this study, an economic allocation of the transportation activities involved in the crushing process was assumed. This means that for the recycling of concrete outside the project, all transportation to the concrete recycling plant is assigned for about 50 percent of the crushing process. For projects where off-site recycled content is used, the other 50 percent is assigned and transportation to the site is included. The same logic is applied to HMA from the overlay. For the recycling of embedded steel (dowel bars, tie bars), a substitution of world market average recycled content for new products was applied, which is approximately 35 percent. Landfill Waste treatment is typically a multiple input process. The preferred way to deal with assigning impacts to multiple inputs is to reflect the physical properties of the incoming flows. If a relationship can be established that is more suitable than mass, it should be used. Where specific data are available, the composition of the waste flows has been used to model the contribution to the impacts from the waste treatment. This includes substitution benefits for energy utilization for combustion processes where relevant. Where no specific data were available, average values were used. Calculations Rules The following calculation rules were applied:
March 2011 Sustainable Recycled Materials for Concrete Pavements – Final Report
50 Applied Pavement Technology, Inc.
• Replacements were calculated relating replacement rates in years to the 50-year time period of the functional unit by using fractions, and thereby expressing the environmental impact on a per year basis.
• The input of secondary materials and fuels during cement manufacturing have been considered “free of burdens” in accordance with the practice documented by the PCA (Marceau, Nisbet, and VanGeem 2006).
Data Quality In general terms, the following information can be stated regarding the quality of the data used in this study:
• The pavement design, concrete mixture, and transportation data are based on actual, as-built designs.
• Maintenance/rehabilitation frequencies are based, to the degree possible, on actual activities applied through 2009. This is the case for the existing pavement sections with a history of about 30 years. For future years (or when maintenance/rehabilitation data were not available), and for the sections that were constructed in 2010, estimates have been made based on prescribed MDOT-maintenance/rehabilitation protocols (MDOT 2005b).
• The LCI/LCA data for cement are based on national data from the PCA (Marceau, Nisbet, and VanGeem) and benchmarked with data collected as part of this project from MDOT cement suppliers. The quality of this data can be considered the best practical.
• The LCI/LCA data for construction is based on one current project, while the maintenance/rehabilitation processes are estimates.
• The other data are based on EcoInvent 2.0 data that have been adapted to reflect the U.S. background data.
Limitations The LCA conducted for this project is limited in the following ways:
1. Data: Limited data are available for the processes of construction and maintenance/rehabilitation. Limited LCI/LCA data exist that is based on industry-owned U.S. data for materials and other consumables except for cement. The PCA cement data is from 2002, so an update is clearly desirable.
2. System boundaries: Only the concrete pavement surface and the base are considered in
this study. This fits well within the proposed goals for this LCA screening study, but limits the use of the conclusions in relation to other pavement aspects that were not considered.
LCA Results This section presents the results from the screening LCA conducted in this project. The results of the environmental indicators and a sensitivity analysis of the most important points where variations were observed or anticipated are presented in this section.
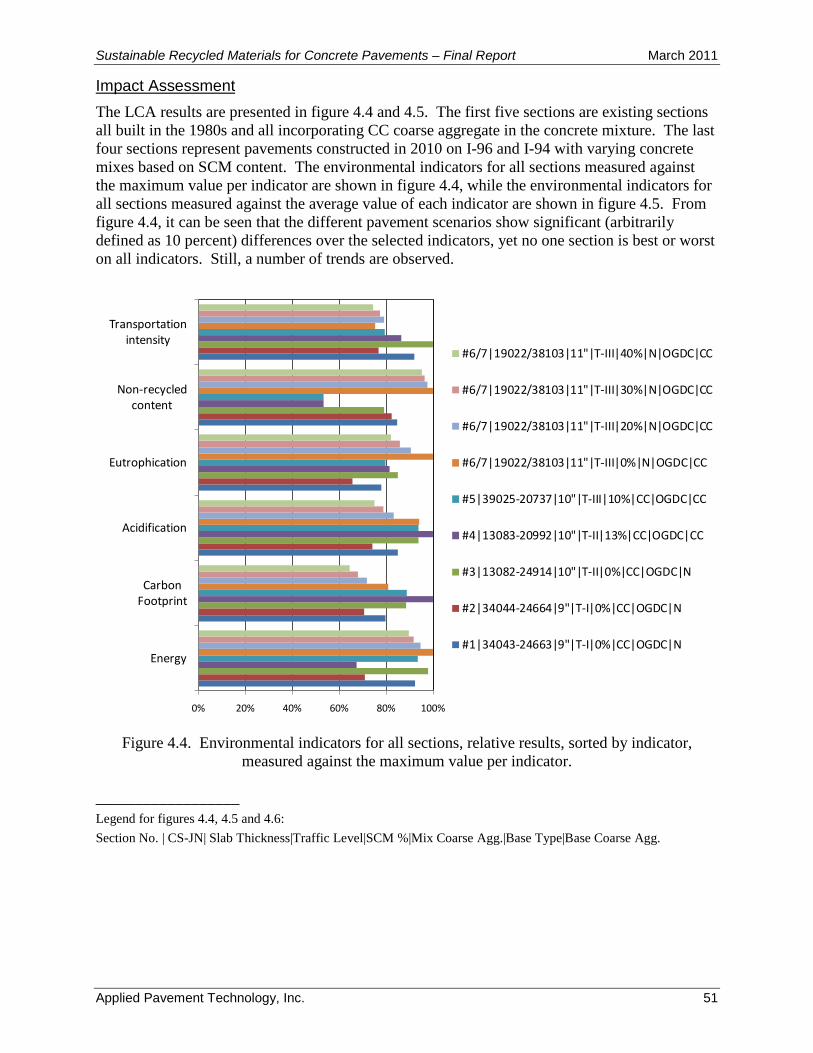
Sustainable Recycled Materials for Concrete Pavements – Final Report March 2011
Applied Pavement Technology, Inc. 51
Impact Assessment The LCA results are presented in figure 4.4 and 4.5. The first five sections are existing sections all built in the 1980s and all incorporating CC coarse aggregate in the concrete mixture. The last four sections represent pavements constructed in 2010 on I-96 and I-94 with varying concrete mixes based on SCM content. The environmental indicators for all sections measured against the maximum value per indicator are shown in figure 4.4, while the environmental indicators for all sections measured against the average value of each indicator are shown in figure 4.5. From figure 4.4, it can be seen that the different pavement scenarios show significant (arbitrarily defined as 10 percent) differences over the selected indicators, yet no one section is best or worst on all indicators. Still, a number of trends are observed.
0% 20% 40% 60% 80% 100%
Energy
Carbon Footprint
Acidification
Eutrophication
Non-recycled content
Transportation intensity
#6/7|19022/38103|11"|T-III|40%|N|OGDC|CC
#6/7|19022/38103|11"|T-III|30%|N|OGDC|CC
#6/7|19022/38103|11"|T-III|20%|N|OGDC|CC
#6/7|19022/38103|11"|T-III|0%|N|OGDC|CC
#5|39025-20737|10"|T-III|10%|CC|OGDC|CC
#4|13083-20992|10"|T-II|13%|CC|OGDC|CC
#3|13082-24914|10"|T-II|0%|CC|OGDC|N
#2|34044-24664|9"|T-I|0%|CC|OGDC|N
#1|34043-24663|9"|T-I|0%|CC|OGDC|N
Figure 4.4. Environmental indicators for all sections, relative results, sorted by indicator,
measured against the maximum value per indicator. __________________ Legend for figures 4.4, 4.5 and 4.6: Section No. | CS-JN| Slab Thickness|Traffic Level|SCM %|Mix Coarse Agg.|Base Type|Base Coarse Agg.
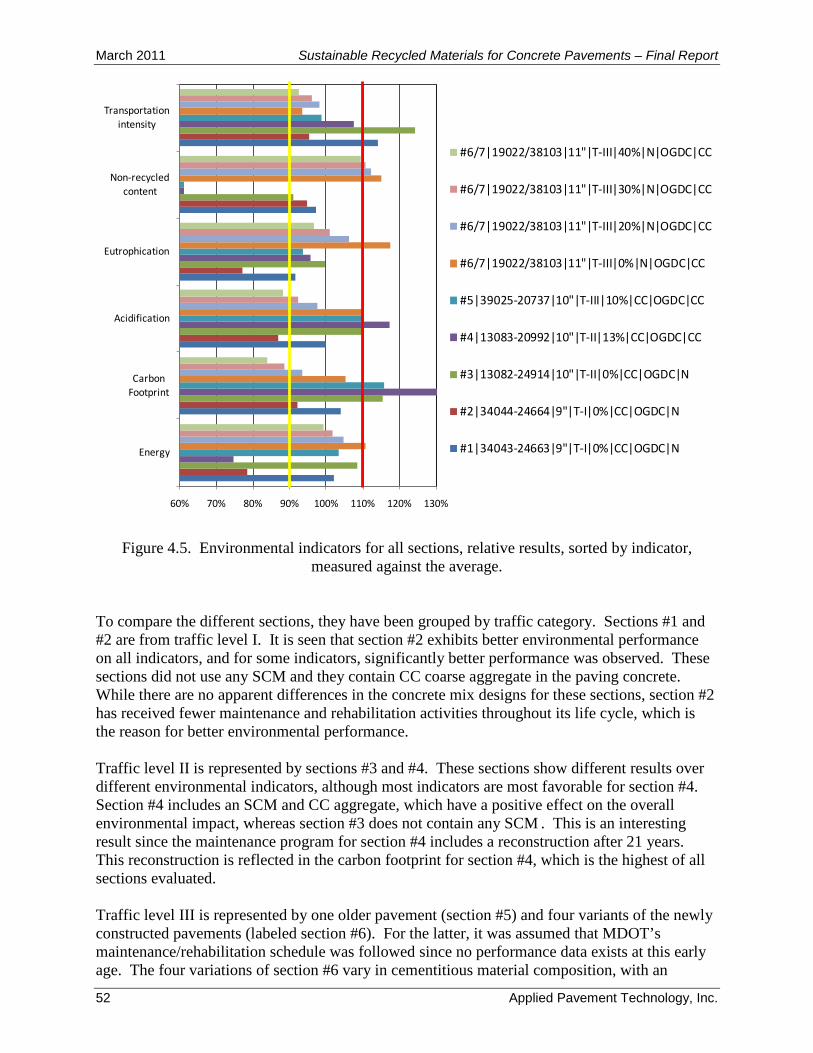
March 2011 Sustainable Recycled Materials for Concrete Pavements – Final Report
52 Applied Pavement Technology, Inc.
60% 70% 80% 90% 100% 110% 120% 130%
Energy
Carbon Footprint
Acidification
Eutrophication
Non-recycled content
Transportation intensity
#6/7|19022/38103|11"|T-III|40%|N|OGDC|CC
#6/7|19022/38103|11"|T-III|30%|N|OGDC|CC
#6/7|19022/38103|11"|T-III|20%|N|OGDC|CC
#6/7|19022/38103|11"|T-III|0%|N|OGDC|CC
#5|39025-20737|10"|T-III|10%|CC|OGDC|CC
#4|13083-20992|10"|T-II|13%|CC|OGDC|CC
#3|13082-24914|10"|T-II|0%|CC|OGDC|N
#2|34044-24664|9"|T-I|0%|CC|OGDC|N
#1|34043-24663|9"|T-I|0%|CC|OGDC|N
Figure 4.5. Environmental indicators for all sections, relative results, sorted by indicator,
measured against the average. To compare the different sections, they have been grouped by traffic category. Sections #1 and #2 are from traffic level I. It is seen that section #2 exhibits better environmental performance on all indicators, and for some indicators, significantly better performance was observed. These sections did not use any SCM and they contain CC coarse aggregate in the paving concrete. While there are no apparent differences in the concrete mix designs for these sections, section #2 has received fewer maintenance and rehabilitation activities throughout its life cycle, which is the reason for better environmental performance. Traffic level II is represented by sections #3 and #4. These sections show different results over different environmental indicators, although most indicators are most favorable for section #4. Section #4 includes an SCM and CC aggregate, which have a positive effect on the overall environmental impact, whereas section #3 does not contain any SCM . This is an interesting result since the maintenance program for section #4 includes a reconstruction after 21 years. This reconstruction is reflected in the carbon footprint for section #4, which is the highest of all sections evaluated. Traffic level III is represented by one older pavement (section #5) and four variants of the newly constructed pavements (labeled section #6). For the latter, it was assumed that MDOT’s maintenance/rehabilitation schedule was followed since no performance data exists at this early age. The four variations of section #6 vary in cementitious material composition, with an
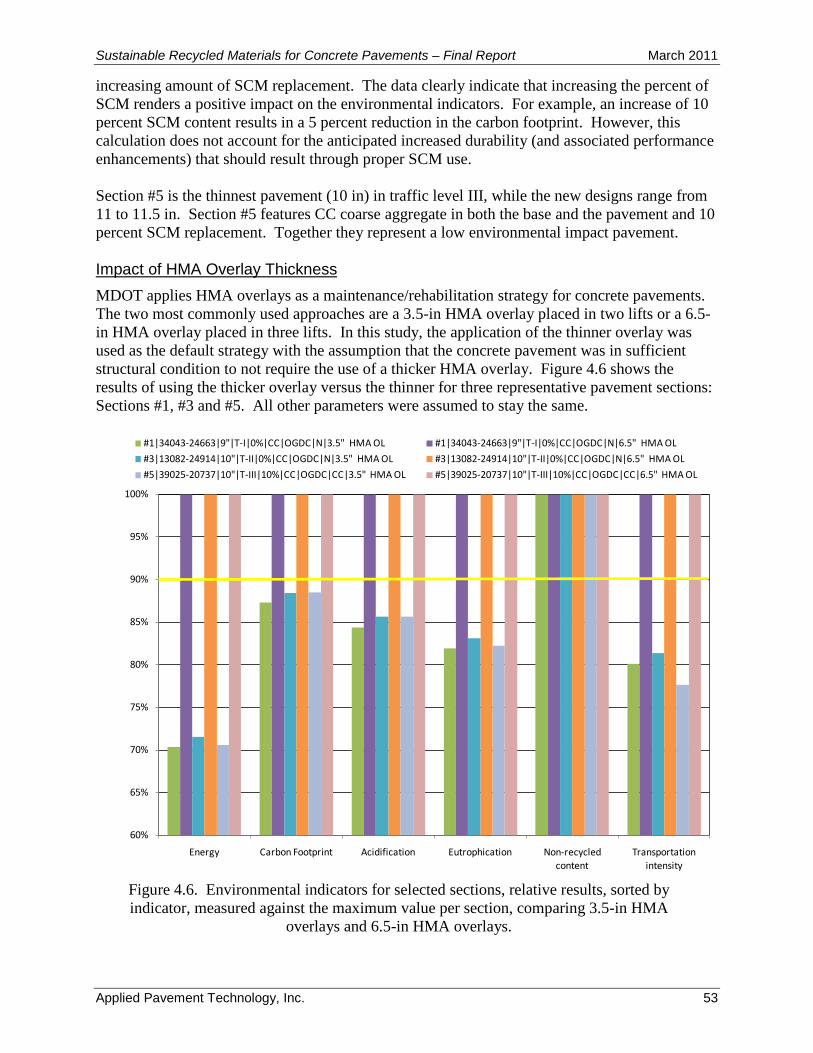
Sustainable Recycled Materials for Concrete Pavements – Final Report March 2011
Applied Pavement Technology, Inc. 53
increasing amount of SCM replacement. The data clearly indicate that increasing the percent of SCM renders a positive impact on the environmental indicators. For example, an increase of 10 percent SCM content results in a 5 percent reduction in the carbon footprint. However, this calculation does not account for the anticipated increased durability (and associated performance enhancements) that should result through proper SCM use. Section #5 is the thinnest pavement (10 in) in traffic level III, while the new designs range from 11 to 11.5 in. Section #5 features CC coarse aggregate in both the base and the pavement and 10 percent SCM replacement. Together they represent a low environmental impact pavement. Impact of HMA Overlay Thickness MDOT applies HMA overlays as a maintenance/rehabilitation strategy for concrete pavements. The two most commonly used approaches are a 3.5-in HMA overlay placed in two lifts or a 6.5-in HMA overlay placed in three lifts. In this study, the application of the thinner overlay was used as the default strategy with the assumption that the concrete pavement was in sufficient structural condition to not require the use of a thicker HMA overlay. Figure 4.6 shows the results of using the thicker overlay versus the thinner for three representative pavement sections: Sections #1, #3 and #5. All other parameters were assumed to stay the same.
60%
65%
70%
75%
80%
85%
90%
95%
100%
Energy Carbon Footprint Acidification Eutrophication Non-recycled content
Transportation intensity
#1|34043-24663|9"|T-I|0%|CC|OGDC|N|3.5" HMA OL #1|34043-24663|9"|T-I|0%|CC|OGDC|N|6.5" HMA OL#3|13082-24914|10"|T-II|0%|CC|OGDC|N|3.5" HMA OL #3|13082-24914|10"|T-II|0%|CC|OGDC|N|6.5" HMA OL#5|39025-20737|10"|T-III|10%|CC|OGDC|CC|3.5" HMA OL #5|39025-20737|10"|T-III|10%|CC|OGDC|CC|6.5" HMA OL
Figure 4.6. Environmental indicators for selected sections, relative results, sorted by indicator, measured against the maximum value per section, comparing 3.5-in HMA
overlays and 6.5-in HMA overlays.
March 2011 Sustainable Recycled Materials for Concrete Pavements – Final Report
54 Applied Pavement Technology, Inc.
Figure 4.6 shows that they overlay thickness has a significant impact on the environmental indicators, with the 3.5-in HMA overlay showing significantly better performance on all environmental indicators compared to the 6.5-in HMA overlay. This result reinforces the importance of long-term durability and structural capacity of the concrete pavement, because such pavements would need minimal rehabilitation through the use of an HMA overlay (or reconstruction), and would require thinner HMA overlays if one were to be used. It also encourages the use of pavement preservation strategies that extend pavement life with little environmental cost. For example, diamond grinding with concrete pavement restoration (CPR) is one strategy that can often be used in lieu of HMA overlays, but it was not evaluated in this study. Further, if an HMA overlay is used, its life should be fully utilized (i.e. it should not have remaining life that is wasted due to poor performance of the underlying concrete pavement) prior to another cycle of pavement rehabilitation or reconstruction to minimize. Summary This chapter provides an overview of LCA principles and presents the inputs and assumptions used in the LCA model applied in this study. The most important considerations contributing to the results of the LCA include:
• The SCM content in the cementitious materials used in the paving concrete.
• The total amount of cementitious materials used.
• The service life of the concrete pavement prior to needing a major rehabilitation (HMA overlay) or reconstruction.
• Full utilization of the HMA overlay before an additional application of an HMA overlay or reconstruction.
The use of CC coarse aggregate in the paving concrete has been applied with mixed results, and is currently not an MDOT standard practice. Although there were pavement sections that performed well that used CC coarse aggregate in the paving concrete, several others performed very poorly. As CC coarse aggregate has been successfully used in paving concrete in a number of states, revisiting its use in Michigan by studying those conditions where it performed well might be of value. The impact of HMA overlay thickness was also examined and the results show that sections that could be treated effectively with thinner overlays will benefit environmentally on all environmental indicators, with the key being that the HMA overlay performed to its full potential. Thinner overlays can only perform well if placed on structurally sound concrete that is not suffering durability problems. These results reinforce the fact that a durable pavement structure with minimum maintenance needs is critical to achieve a sustainable system. However, if thinner HMA overlays are applied inappropriately to concrete pavements in poor condition, particularly under high traffic levels, the premature failure and early replacement of the overlay would result in significant environmental impact. Alternatively, concrete pavements designed and maintained so that an overlay is not required within the evaluation period may have a significantly reduced environmental footprint if the initial environmental impact is not too high.
Sustainable Recycled Materials for Concrete Pavements – Final Report March 2011
Applied Pavement Technology, Inc. 55
5. CONCLUSIONS, RECOMMENDATIONS, AND IMPLEMENTATION
Summary Under this project, the sustainability aspects of concrete pavements are evaluated from both economic and environmental perspectives. This report includes the definition, assessment, and interpretation of the economic and environmental parameters that should be considered when evaluating concrete pavements constructed with and without the use of RIBMs. In this study, the RIBMs evaluated were SCMs used as a partial replacement of portland cement in the cementitious binder and ACBFS and CC coarse aggregates used in concrete and bases. LCCA was performed on 31 existing pavement sections where good construction and maintenance/rehabilitation data were available. The selection of pavements included a range of pavements with and without SCMs in the cementitious materials, with and without ACBFS and CC coarse aggregate in the paving concrete, and with or without CC coarse aggregate in the base course. The selected pavement sections were grouped into three different traffic levels based primarily on the volume of commercial traffic. The majority of the pavement sections considered for the LCCA were constructed in the 1980s, which results in some limitations to the applicability of the results to today’s concrete pavements as MDOT’s materials specifications and design practices have changed in the ensuing decades. LCA was performed on five of the pavement sections evaluated using LCCA. In addition, two pavement sections constructed in 2010 on I-96 (Lansing) and I-94 (Jackson) were also evaluated using LCA modeling. Economic and Environmental Performance LCCA was the tool used to evaluate the economic performance of the pavement sections under study. The two primary economic indicators used were:
• Agency Costs – Up-to-present-age and over a 50-year analysis period.
• User Costs – Up-to-present-age and over a 50-year analysis period. The LCA was used to assess environmental performance. The following environmental indicators, based on a 50-year analysis period, were used in this study:
• Energy use, expressed in Mega Joules (MJ).
• CO2 eq or carbon footprint.
• Eutrophication and acidification to assess the impact on water quality.
• Volume of secondary material (recycled) as compared to the volume of primary (natural or virgin) material.
• Transportation intensity in terms of ton-miles. Results A summary of the LCCA and the LCA results are discussed below.
March 2011 Sustainable Recycled Materials for Concrete Pavements – Final Report
56 Applied Pavement Technology, Inc.
LCCA Results
• Pavements constructed using ACBFS coarse aggregate had the highest agency costs in all traffic categories. Three of the five ACBFS sections studied did not achieve the intended design life, undergoing complete reconstruction or receiving JPCP inlays at or before 20 years of service. The ACBFS sections did not exhibit good economic performance in any of the traffic categories. This suggests that the potential reasons for the premature failures may be attributed to materials- or construction-related factors.
• The pavement sections constructed using CC coarse aggregates in the paving concrete exhibited comparable performance to sections with natural coarse aggregates at lower levels of commercial traffic. At higher traffic levels, sections with CC coarse aggregate in the paving concrete did not achieve the intended design life and a majority of them underwent complete reconstruction or received JPCP inlays at about 20 years of service.
• All of the ACBFS and the CC coarse aggregate pavement sections considered in this study are long-jointed JRCP designs, some constructed on untreated permeable base layers. In the last decade, MDOT has predominantly constructed JPCP designs in combination with permeable bases. In Michigan, poor structural performance of ACBFS and CC coarse aggregate concrete pavements sections has been at least partially attributed to poor aggregate interlock across mid-panel cracks that form in long-jointed JRCP. In combination with poor support provided by untreated permeable bases, the poor aggregate interlock characteristic in concrete made with CC or ACBFS coarse aggregate results in poor pavement performance compared to equivalent pavements constructed using natural aggregates. Although not current MDOT practice, the designs adopted on two recent projects on I-94 (Jackson) and I-96 (Jackson) that featured the use of short-jointed JPCP on a stiff stabilized base is expected to help the structural performance of concrete pavements made with CC or ACBFS coarse aggregates in the paving concrete.
• Class F fly ash (as specified under ASTM C618), when used as a replacement for portland cement in the paving concrete, had no appreciable effect on the LCCA results even though it is known that it can significantly improve the long-term durability of concrete. Two pavement sections studied had Class C fly ash in the mixture, and both performed poorly. No pavement sections were studied that used slag cement, so its effect could not be evaluated.
• Although there were seven sections that included CC coarse aggregate in the base, none were in the traffic level II category and the four in the traffic level III category were all supporting paving concrete made with CC coarse aggregate, so the performance of the CC coarse aggregate in the base could not be independently evaluated. For traffic level I, aside from a poorly performing section containing ACBFS in the paving concrete, the two CC coarse aggregate bases performed exceptionally well, suggesting that if done correctly, CC coarse aggregate can make an effective base material at lower traffic levels. ACBFS coarse aggregate was not evaluated as a base material in any of the sections.
LCA Results
• In general, the findings from this study emphasize that longevity (which minimizes the need for maintenance/rehabilitation) is the most important factor in achieving a concrete pavement system with minimal environmental impact. Hence, increasing the service life of concrete pavement while minimizing future rehabilitation activities is the most important factor in reducing the environmental impact over the life cycle.
Sustainable Recycled Materials for Concrete Pavements – Final Report March 2011
Applied Pavement Technology, Inc. 57
• For the concrete surface, the increased use of SCMs in the concrete mixture results in a significantly lower carbon footprint. Further, the use of CC coarse aggregate and reducing the cementitious materials content through an effective mixture design can also have significant positive environmental impacts.
• HMA overlays should be applied only when the full lifespan of the overlay can be utilized. The thickness of the HMA overlay influences the environmental impacts in a significant manner. For example, a two-course 3.5 inch HMA overlay results in a reduction of approximately 70 percent in the energy usage and also, about a 15 percent reduction in all other sustainability categories when compared to a three-course 6.5-inch HMA overlay. Thinner HMA overlays will only perform satisfactorily if the underlying concrete is durable and structurally sound, thus emphasizing the need to design the concrete pavement to have long-term structural capacity and durability.
• Alternatively, using HMA overlays to correct functional deficiencies (e.g., roughness, skid, noise, and so on) might not be the most sustainable strategy. The use of diamond grinding as an alternative to placing an HMA overlay may be a viable option under some circumstances, but this alternative was not considered in this study. Further, if the concrete pavement exhibits a significant amounts of structural distresses that results in premature failure of the HMA overlay, other options including unbonded concrete overlays (which were not evaluated in this study) or reconstruction may offer a more sustainable solution.
• The use of on-site recycling as opposed to regional recycling of the concrete pavement has significant environmental benefit due to reduced impact from transportation.
Limitations This study represents a trend-based assessment with a focus given to the relative differences between the different pavement sections. It has value for framing internal discussion at MDOT, but because it is based on a relatively low number of selected pavement sections, the results are not statistically representative nor broadly applicable. Further, results are based partly on actual data, partly on data obtained from the literature, and partly on MDOT’s own policies regarding the type and timing of maintenance/rehabilitation activities. There was considerable variability within the data obtained from MDOT records adding uncertainty to the analysis. Apart from primary data obtained from MDOT, the cement manufacturers that supply MDOT have provided process data that supported the analysis. However, other stakeholders have not been involved. It is also important to note that this study has not been subjected to an ISO 14044 critical review and thus should not be construed as being in compliance with the ISO standards. Nevertheless, MDOT can use the results to select, prioritize, and promote good practices to enhance the sustainability of concrete pavements in Michigan. Recommendations Based on the results of this study, the following recommendations are made:
• Reducing the amount of portland cement in the cementitious materials will directly and significantly reduce the overall environmental impact of the concrete pavement as long as performance is not compromised. This can be accomplished through the increased use of SCMs (Class F fly ash, slag cement, and blends thereof) and ASTM C595 blended cements. Adoption of specifications that allow the use of portland-limestone cement
March 2011 Sustainable Recycled Materials for Concrete Pavements – Final Report
58 Applied Pavement Technology, Inc.
(e.g., ASTM C1157) will further reduce portland cement usage. Although the recommendation is to increase usage of SCMs, MDOT should move forward cautiously, first considering the construction of demonstration projects that have higher than normal amounts of SCMs and portland-limestone cement.
• Reducing the overall cementitious content in the concrete is another, complementary approach that can result in more sustainable concrete pavements as long as pavement performance is not compromised. MDOT has already reduced the cementitious content in many of their paving mixtures over the last decade, but further exploitation of this strategy can yield additional economic and environmental benefits. However, this reduction must be achieved without compromising the performance of the pavement.
• Locally available materials should be considered to the extent possible provided they are of acceptable quality to produce pavements that will achieve or exceed the expected design life. This will drastically reduce the transportation-related economic and environmental costs associated with shipping materials if the mode of transportation is by truck. Alternative modes of transportation including rail and water have significantly lower economic and environmental costs and should be used whenever feasible.
• Re-use of local materials (on-site recycling) should be encouraged. This will reduce the amount of economic and environmental impact due to mining and transportation. These materials can potentially be used in a number of pavement-related applications (e.g., concrete or HMA surface course, cement or asphalt stabilized base course, fill, or riprap).
• HMA overlays should be applied only when the full lifespan of the original concrete pavement and the overlay can be fully utilized. Placing HMA overlays on existing concrete pavement to correct functional deficiencies (e.g. roughness, skid, noise, and so on) is not necessarily a sustainable strategy. The use of diamond grinding as an alternative to placing an HMA might be a viable option under such circumstances, but was not evaluated in this study. Further, if the concrete pavement exhibits a significant amounts of structural distresses that results in premature failure of the HMA overlay, other options including unbonded concrete overlays (also not evaluated in this study) or reconstruction likely will be a more sustainable solution.
• Since valid data are important for any study, and since LCA is an emerging field in the evaluation of concrete pavements in the U.S., it is recommended that MDOT work to stimulate and promote initiatives within the agency and in cooperation with industry partners to collect and utilize current and actual process data.
• The results of the LCA conducted for this study can be used to develop a simple Microsoft Excel® tool to evaluate material choices and its economic and environmental impacts. It is recommended that this tool be developed and used by MDOT to assist in developing a simple understanding of environmental impacts to help create more sustainable concrete pavements.
Future Research Directions Based on the results of this work, recommendations for future research include:
• The LCA model can be improved by adding refined definitions and inventory for the various maintenance and rehabilitation processes. Further LCA work should be initiated to develop a broader understanding of the environmental performance of concrete pavements in general. Part of this work can evaluate design and
Sustainable Recycled Materials for Concrete Pavements – Final Report March 2011
Applied Pavement Technology, Inc. 59
maintenance/rehabilitation (e.g., diamond grinding, unbonded concrete overlays, and so on) options that are currently used by MDOT but were not considered in this study. Another area of work can be to build a broader database including pavement sections that were studied in this project to establish a statistically significant data set. Further, additional work can be conducted to supplement parts of the life cycle where data was obtain from the literature data by collecting and using actual data. The work can initiate using prioritization based on the parameters that were shown to be most important to enhancing sustainability throughout the life of the concrete pavement in the current study.
• CC coarse aggregate has been permitted in paving concrete in the past for high traffic volume mainline pavements in Michigan, but performance was mixed and thus it is not currently being used in paving concrete. There are quite a few pavement sections made with CC coarse aggregates considered in this study that exhibit comparable performance to sections constructed using natural aggregates under lower truck traffic volumes. It is also known that a contributing factor to the premature failures that were reported in the CC coarse aggregate sections constructed in the 1980s was the early deterioration of mid-panel cracking in the JRCP. This may have been due to the long joint spacing characteristic of JRCP and poor aggregate interlock at mid-panel cracks. MDOT’s design philosophy and construction practices have changed significantly over the past two decades and a better understanding of the fundamental behavior of concrete containing CC coarse aggregate has been developed. Based on this improved level of knowledge, it is recommended that MDOT explore the possibility of constructing demonstration projects using current design and construction practices to establish better estimates of economic and environmental costs involved in the use of CC coarse aggregate in paving concrete.
• A study should be conducted to evaluate MDOT’s current maintenance/rehabilitation strategies reflecting the use of additional treatments, such as diamond grinding, concrete overlays, and so on. Additionally, alternative designs should be evaluated that feature the use of highly durable concrete that is designed to maintain serviceability through multiple diamond grindings over the entire 50-year analysis period in lieu of the use of HMA overlays. This is a strategy that some other DOT’s have applied but was not considered in the analysis conducted as part of this study as it is not part of MDOT’s current standard practice.
Recommended Implementation Plan An overview of the implementation plan is presented in this section. Additional details on the implementation plan are available in Appendix G of this report. The successful implementation of the results of this project requires that MDOT make policy changes that are reflected in future design and construction specifications used for concrete pavements. This long-term goal may take a decade or more to be fully realized, but can be broken down into a series of small manageable steps to help achieve success. Work Plan – Investigator Portion
• Development of recommendations for altering or modifying existing MDOT policies and specifications.
• Development of a framework for a systematic approach that considers the costs and benefits of using recycled and industrial byproduct materials in concrete pavements for

March 2011 Sustainable Recycled Materials for Concrete Pavements – Final Report
60 Applied Pavement Technology, Inc.
further developments and adoption by MDOT for planning, design, construction, and preservation activities.
• Development of guidelines for conducting life-cycle assessment.
• Development of training/workshop materials for use by MDOT in disseminating project findings/recommendations
Work Plan – MDOT Portion
• Adopt and incorporate a systematic approach for considering the costs and benefits of using RIBMs in concrete pavements throughout MDOT’s planning, design, construction, and preservation activities. The starting point can be to collect environmental process data that relates to material and energy consumption, emission to water, air and soil, and waste related to process and materials used by or on behalf of MDOT.
• Consider adopting new cements (portland-limestone, ternary blends) to improve sustainability.
• Consider demonstration projects on a low-volume roadway featuring recycled concrete aggregate in the paving concrete on a 4G permeable base constructed to present-day standards.
• Promote on-site recycling.
• Conduct training workshops on techniques and strategies for improving the sustainability of concrete pavements without sacrificing performance.
• Continue research to further quantify environmental performance and to develop life cycle assessment tool.
Concluding Remarks This research study involved the evaluation of economic and environmental impacts of concrete pavements constructed with and without the use of RIBMs. The following items are discussed in this report:
• Current MDOT practices with regards to use of RIBMs in concrete and supporting layers.
• Study approach including assumptions made regarding the chosen methodology, the life cycle cost analysis, and the life-cycle assessment from which the economic and environmental impacts were assessed.
• Description of data analyzed to support conclusions, including where they were obtained and a subjective assessment of their quality and completeness.
• Results of the economic and environmental assessments.
• Conclusions and recommendations for MDOT to assist in policy implementation and specification decision to effectively increase the use of RIBMs to enhance sustainability of concrete pavements.
• Implementation plan that includes short-term and long-term objectives.
Sustainable Recycled Materials for Concrete Pavements – Final Report March 2011
Applied Pavement Technology, Inc. 61
REFERENCES
Better Roads. 1984. “Concrete Pavement Recycling Tested in Michigan, Wisconsin.” Better Roads, Vol. 54, No. 1. James Information Media, Inc., Des Plaines, IL.
Buch, N. and S. Jahangirnead. 2008. Quantifying Coefficients of Thermal Expansion Values of Typical Hydraulic Cement Concrete Paving Mixtures. RC-1503. Michigan Department of Transportation, Lansing, MI.
Chan, A., G. Keoleian, and E. Gabler. 2008. “Evaluation of Life-Cycle Cost Analysis Practices Used by the Michigan Department of Transportation.” Journal of Transportation Engineering, Vol. 134, No. 6. American Society of Civil Engineering, Reston, VA.
Epps, J, and R. O’Neal. 1975. Engineering Economy and Energy Considerations in Recycling Pavement Materials. Report No. RR 214-12. Texas State Department of Highways and Public Transportation, Austin, TX.
Federal Highway Administration (FHWA). 2006. March 24 Memorandum from Mr. James Steele, FHWA Division Administrator, Lansing, MI to Mr. Tommy L. Beatty, Director, FHWA Office of Pavement Technology in Washington, DC. Federal Highway Administration (FHWA). 2010. Life-Cycle Cost Analysis Software. http://www.fhwa.dot.gov/infrastructure/asstmgmt/lccasoft.cfm. Accessed December 14, 2010. Grove, J., F. Bektas, and H. Geiselman. 2006. Southeast Michigan Local Road Concrete Pavement Durability Study – Final Report. National Concrete Pavement Technology Center, Iowa State University, Ames, IA.
Jensen, E. and W. Hansen. 2000. “Fracture Energy Test for Highway Concrete: Determining the Effect of Coarse Aggregate on Crack Propagation Resistance.” Transportation Research Record 1730. Transportation Research Board, Washington DC.
Legg, F. E. 1965. “Experimental Fly Ash Concrete Pavement in Michigan.” Highway Research Record 73. Highway Research Board, Washington DC.
Malvar, L. J., G. D. Cline, D. F. Burke, R. Rollings, T. W. Sherman, and J. Greene. 2002. “Alkali Silica Reaction Mitigation: State-of-the-Art and Recommendations.” ACI Materials Journal, Vol. 99, No. 5. American Concrete Institute, Farmington Hills, MI.
Marceau, M., M. Nisbet, and M. VanGeem. 2007. Life Cycle Inventory of Portland Cement Concrete. PCA R&D Serial No. 3011. Portland Cement Association, Skokie, IL.
McCarthy, G. J. 1985. “Recycling of Concrete Freeways by Michigan Department of Transportation.” Transportation Research Record 1040. Transportation Research Board, Washington DC.
McCarthy, G. J. and W. J. MacCreery. 1985. “Michigan Department of Transportation Recycles Concrete Freeways.” Proceedings, Third International Conference on Concrete Pavement Design and Rehabilitation. Purdue University, West Lafayette, IN.
March 2011 Sustainable Recycled Materials for Concrete Pavements – Final Report
62 Applied Pavement Technology, Inc.
Michigan Department of Transportation (MDOT). 2003. “Standard Specifications for Construction.” Michigan Department of Transportation, Lansing, MI.. Michigan Department of Transportation (MDOT). 2005a. “Special Provision for High Performance Portland Cement Concrete Grade P1 (Modified).” Michigan Department of Transportation, Lansing, MI. August 5. Michigan Department of Transportation (MDOT). 2005b. Pavement Design and Selection Manual. Michigan Department of Transportation, Lansing, MI. Michigan Department of Transportation (MDOT). 2009. “Special Provision for Crushed Concrete.” Michigan Department of Transportation, Lansing, MI. August 24. Michigan Roads and Construction. 1989. “Recycling Era Nearing End.” Michigan Roads and Construction, Vol. 86, No. 5. Baker Publishing Company, Lansing, MI.
Raja, Z. and M. Snyder. 1991. “Factors Affecting Deterioration of Transverse Cracks in Jointed Reinforced Concrete Pavements.” Transportation Research Record 1307. Transportation Research Board, Washington DC.
Snyder, M. and J. Bruinsma. 1996. “Review of Studies Concerning Effects of Unbound Crushed Concrete Bases on PCC Pavement Drainage.” Transportation Research Record 1519. Transportation Research Board, Washington DC.
Smith, M. 2008. “Life-Cycle Cost Analysis in Pavement Type Selection.” Proceedings, 2008 Wisconsin Asphalt Pavement Association Conference. Madison, WI.
Staton, J. F. 2006. Absorption Capacity of Coarse Aggregated for Portland Cement Concrete. Research Report R-1482. Michigan Department of Transportation, Lansing, MI.
Taylor, P. C., S. H. Kosmatka, G. F. Voigt, et al. 2006. Intergrated Materials and Construction Practices for Concrete Pavements: A State-of-the-Practice Manual. HIF-07-004. Federal Highway Administration, Washington, DC.
Van Dam, T. J., K. R. Peterson, L. L. Sutter, and N. Buch. 2002. A Study of Materials-Related Distress (MRD) in Michigan’s PCC Pavements – Phase 2: Final Report. MDOT Research Report RC-1425. Michigan Department of Transportation, Lansing, MI.
Van Dam, T. J., K. R. Peterson, L. L. Sutter, and M. E. Housewright. 2003. “Deterioration in Concrete Pavements Constructed with Slag Coarse Aggregate.” Transportation Research Record 1834. Transportation Research Board, Washington DC.
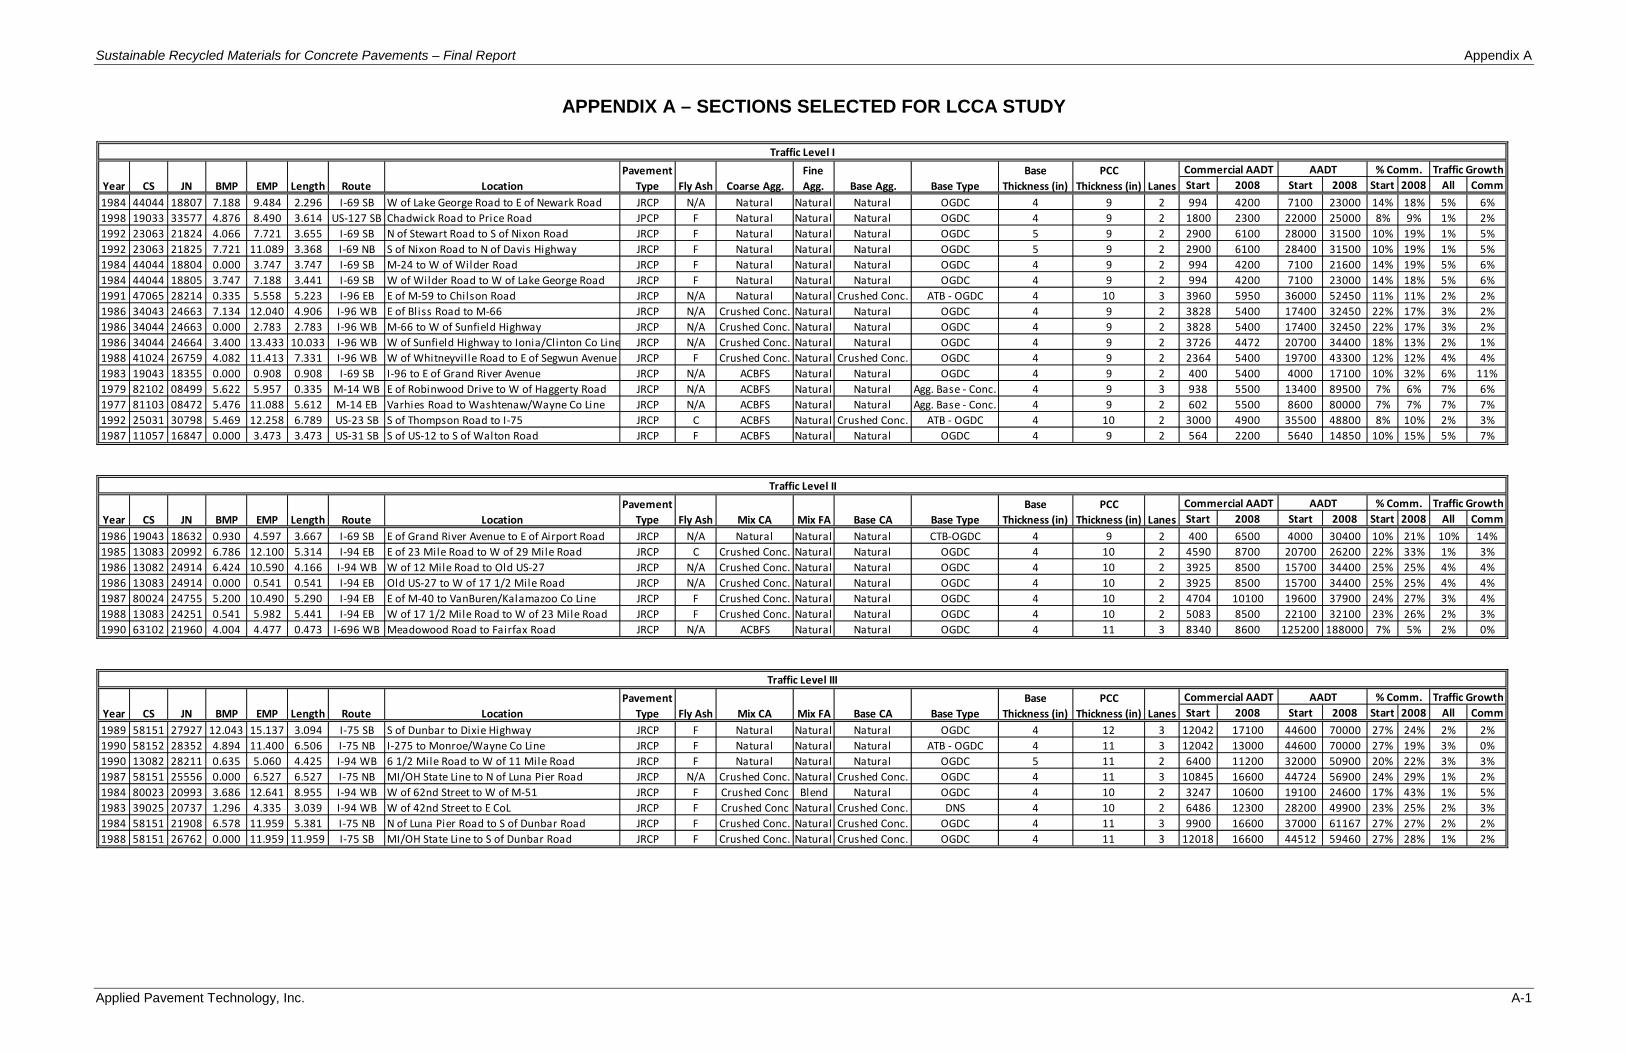
Sustainable Recycled Materials for Concrete Pavements – Final Report Appendix A
Applied Pavement Technology, Inc. A-1
APPENDIX A – SECTIONS SELECTED FOR LCCA STUDY
Start 2008 Start 2008 Start 2008 All Comm1984 44044 18807 7.188 9.484 2.296 I-69 SB W of Lake George Road to E of Newark Road JRCP N/A Natural Natural Natural OGDC 4 9 2 994 4200 7100 23000 14% 18% 5% 6%1998 19033 33577 4.876 8.490 3.614 US-127 SB Chadwick Road to Price Road JPCP F Natural Natural Natural OGDC 4 9 2 1800 2300 22000 25000 8% 9% 1% 2%1992 23063 21824 4.066 7.721 3.655 I-69 SB N of Stewart Road to S of Nixon Road JRCP F Natural Natural Natural OGDC 5 9 2 2900 6100 28000 31500 10% 19% 1% 5%1992 23063 21825 7.721 11.089 3.368 I-69 NB S of Nixon Road to N of Davis Highway JRCP F Natural Natural Natural OGDC 5 9 2 2900 6100 28400 31500 10% 19% 1% 5%1984 44044 18804 0.000 3.747 3.747 I-69 SB M-24 to W of Wilder Road JRCP F Natural Natural Natural OGDC 4 9 2 994 4200 7100 21600 14% 19% 5% 6%1984 44044 18805 3.747 7.188 3.441 I-69 SB W of Wilder Road to W of Lake George Road JRCP F Natural Natural Natural OGDC 4 9 2 994 4200 7100 23000 14% 18% 5% 6%1991 47065 28214 0.335 5.558 5.223 I-96 EB E of M-59 to Chilson Road JRCP N/A Natural Natural Crushed Conc. ATB - OGDC 4 10 3 3960 5950 36000 52450 11% 11% 2% 2%1986 34043 24663 7.134 12.040 4.906 I-96 WB E of Bliss Road to M-66 JRCP N/A Crushed Conc. Natural Natural OGDC 4 9 2 3828 5400 17400 32450 22% 17% 3% 2%1986 34044 24663 0.000 2.783 2.783 I-96 WB M-66 to W of Sunfield Highway JRCP N/A Crushed Conc. Natural Natural OGDC 4 9 2 3828 5400 17400 32450 22% 17% 3% 2%1986 34044 24664 3.400 13.433 10.033 I-96 WB W of Sunfield Highway to Ionia/Clinton Co Line JRCP N/A Crushed Conc. Natural Natural OGDC 4 9 2 3726 4472 20700 34400 18% 13% 2% 1%1988 41024 26759 4.082 11.413 7.331 I-96 WB W of Whitneyvil le Road to E of Segwun Avenue JRCP F Crushed Conc. Natural Crushed Conc. OGDC 4 9 2 2364 5400 19700 43300 12% 12% 4% 4%1983 19043 18355 0.000 0.908 0.908 I-69 SB I-96 to E of Grand River Avenue JRCP N/A ACBFS Natural Natural OGDC 4 9 2 400 5400 4000 17100 10% 32% 6% 11%1979 82102 08499 5.622 5.957 0.335 M-14 WB E of Robinwood Drive to W of Haggerty Road JRCP N/A ACBFS Natural Natural Agg. Base - Conc. 4 9 3 938 5500 13400 89500 7% 6% 7% 6%1977 81103 08472 5.476 11.088 5.612 M-14 EB Varhies Road to Washtenaw/Wayne Co Line JRCP N/A ACBFS Natural Natural Agg. Base - Conc. 4 9 2 602 5500 8600 80000 7% 7% 7% 7%1992 25031 30798 5.469 12.258 6.789 US-23 SB S of Thompson Road to I-75 JRCP C ACBFS Natural Crushed Conc. ATB - OGDC 4 10 2 3000 4900 35500 48800 8% 10% 2% 3%1987 11057 16847 0.000 3.473 3.473 US-31 SB S of US-12 to S of Walton Road JRCP F ACBFS Natural Natural OGDC 4 9 2 564 2200 5640 14850 10% 15% 5% 7%
Start 2008 Start 2008 Start 2008 All Comm1986 19043 18632 0.930 4.597 3.667 I-69 SB E of Grand River Avenue to E of Airport Road JRCP N/A Natural Natural Natural CTB-OGDC 4 9 2 400 6500 4000 30400 10% 21% 10% 14%1985 13083 20992 6.786 12.100 5.314 I-94 EB E of 23 Mile Road to W of 29 Mile Road JRCP C Crushed Conc. Natural Natural OGDC 4 10 2 4590 8700 20700 26200 22% 33% 1% 3%1986 13082 24914 6.424 10.590 4.166 I-94 WB W of 12 Mile Road to Old US-27 JRCP N/A Crushed Conc. Natural Natural OGDC 4 10 2 3925 8500 15700 34400 25% 25% 4% 4%1986 13083 24914 0.000 0.541 0.541 I-94 EB Old US-27 to W of 17 1/2 Mile Road JRCP N/A Crushed Conc. Natural Natural OGDC 4 10 2 3925 8500 15700 34400 25% 25% 4% 4%1987 80024 24755 5.200 10.490 5.290 I-94 EB E of M-40 to VanBuren/Kalamazoo Co Line JRCP F Crushed Conc. Natural Natural OGDC 4 10 2 4704 10100 19600 37900 24% 27% 3% 4%1988 13083 24251 0.541 5.982 5.441 I-94 EB W of 17 1/2 Mile Road to W of 23 Mile Road JRCP F Crushed Conc. Natural Natural OGDC 4 10 2 5083 8500 22100 32100 23% 26% 2% 3%1990 63102 21960 4.004 4.477 0.473 I-696 WB Meadowood Road to Fairfax Road JRCP N/A ACBFS Natural Natural OGDC 4 11 3 8340 8600 125200 188000 7% 5% 2% 0%
Start 2008 Start 2008 Start 2008 All Comm1989 58151 27927 12.043 15.137 3.094 I-75 SB S of Dunbar to Dixie Highway JRCP F Natural Natural Natural OGDC 4 12 3 12042 17100 44600 70000 27% 24% 2% 2%1990 58152 28352 4.894 11.400 6.506 I-75 NB I-275 to Monroe/Wayne Co Line JRCP F Natural Natural Natural ATB - OGDC 4 11 3 12042 13000 44600 70000 27% 19% 3% 0%1990 13082 28211 0.635 5.060 4.425 I-94 WB 6 1/2 Mile Road to W of 11 Mile Road JRCP F Natural Natural Natural OGDC 5 11 2 6400 11200 32000 50900 20% 22% 3% 3%1987 58151 25556 0.000 6.527 6.527 I-75 NB MI/OH State Line to N of Luna Pier Road JRCP N/A Crushed Conc. Natural Crushed Conc. OGDC 4 11 3 10845 16600 44724 56900 24% 29% 1% 2%1984 80023 20993 3.686 12.641 8.955 I-94 WB W of 62nd Street to W of M-51 JRCP F Crushed Conc Blend Natural OGDC 4 10 2 3247 10600 19100 24600 17% 43% 1% 5%1983 39025 20737 1.296 4.335 3.039 I-94 WB W of 42nd Street to E CoL JRCP F Crushed Conc Natural Crushed Conc. DNS 4 10 2 6486 12300 28200 49900 23% 25% 2% 3%1984 58151 21908 6.578 11.959 5.381 I-75 NB N of Luna Pier Road to S of Dunbar Road JRCP F Crushed Conc. Natural Crushed Conc. OGDC 4 11 3 9900 16600 37000 61167 27% 27% 2% 2%1988 58151 26762 0.000 11.959 11.959 I-75 SB MI/OH State Line to S of Dunbar Road JRCP F Crushed Conc. Natural Crushed Conc. OGDC 4 11 3 12018 16600 44512 59460 27% 28% 1% 2%
Pavement Type
Pavement Type
Pavement Type
Commercial AADT AADT % Comm.
Base TypePCC
Thickness (in) Lanes
Base Thickness (in)
Traffic GrowthBase Agg. Base Type
PCC Thickness (in) Lanes
Base Thickness (in)
Commercial AADT AADT % Comm. Traffic Growth
Commercial AADT AADT % Comm. Traffic Growth
Traffic Level I
Year CS JN Route Location Fly Ash Coarse Agg.Fine Agg.BMP EMP Length
Traffic Level II
Year CS JN BMP EMP Length Route Location Fly Ash Mix CA Mix FA Base CA
Base CAYear CS JN BMP EMP LengthBase
Thickness (in)
Base TypePCC
Thickness (in) Lanes
Traffic Level III
Route Location Fly Ash Mix CA Mix FA

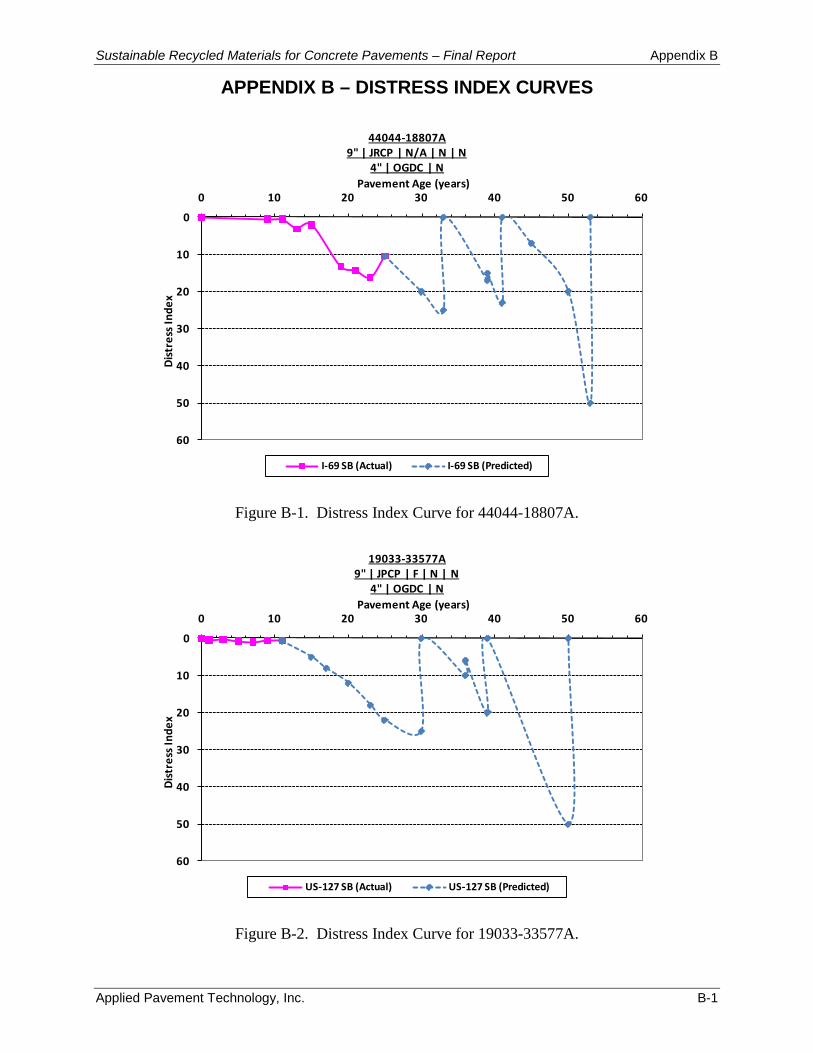
Sustainable Recycled Materials for Concrete Pavements – Final Report Appendix B
Applied Pavement Technology, Inc. B-1
APPENDIX B – DISTRESS INDEX CURVES
0
10
20
30
40
50
60
0 10 20 30 40 50 60
Dist
ress
Inde
xPavement Age (years)
44044-18807A9" | JRCP | N/A | N | N
4" | OGDC | N
I-69 SB (Actual) I-69 SB (Predicted)
Figure B-1. Distress Index Curve for 44044-18807A.
0
10
20
30
40
50
60
0 10 20 30 40 50 60
Dist
ress
Inde
x
Pavement Age (years)
19033-33577A9" | JPCP | F | N | N
4" | OGDC | N
US-127 SB (Actual) US-127 SB (Predicted)
Figure B-2. Distress Index Curve for 19033-33577A.
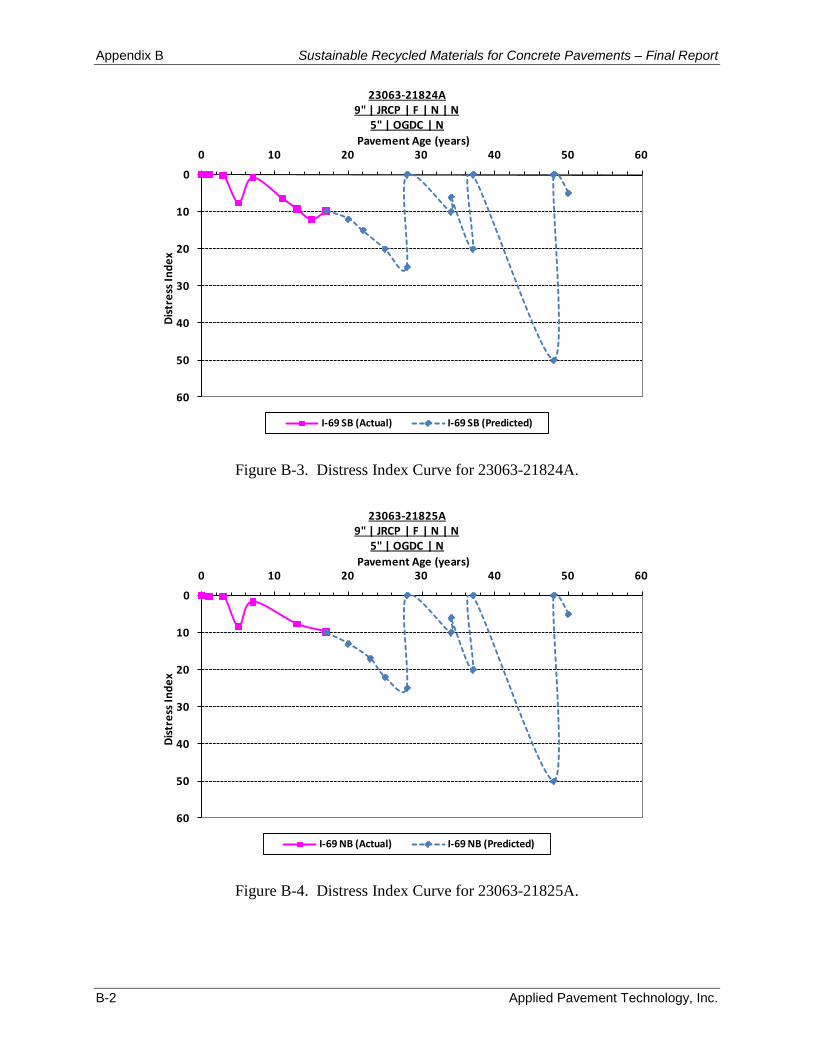
Appendix B Sustainable Recycled Materials for Concrete Pavements – Final Report
B-2 Applied Pavement Technology, Inc.
0
10
20
30
40
50
60
0 10 20 30 40 50 60Di
stre
ss In
dex
Pavement Age (years)
23063-21824A9" | JRCP | F | N | N
5" | OGDC | N
I-69 SB (Actual) I-69 SB (Predicted)
Figure B-3. Distress Index Curve for 23063-21824A.
0
10
20
30
40
50
60
0 10 20 30 40 50 60
Dist
ress
Inde
x
Pavement Age (years)
23063-21825A9" | JRCP | F | N | N
5" | OGDC | N
I-69 NB (Actual) I-69 NB (Predicted)
Figure B-4. Distress Index Curve for 23063-21825A.
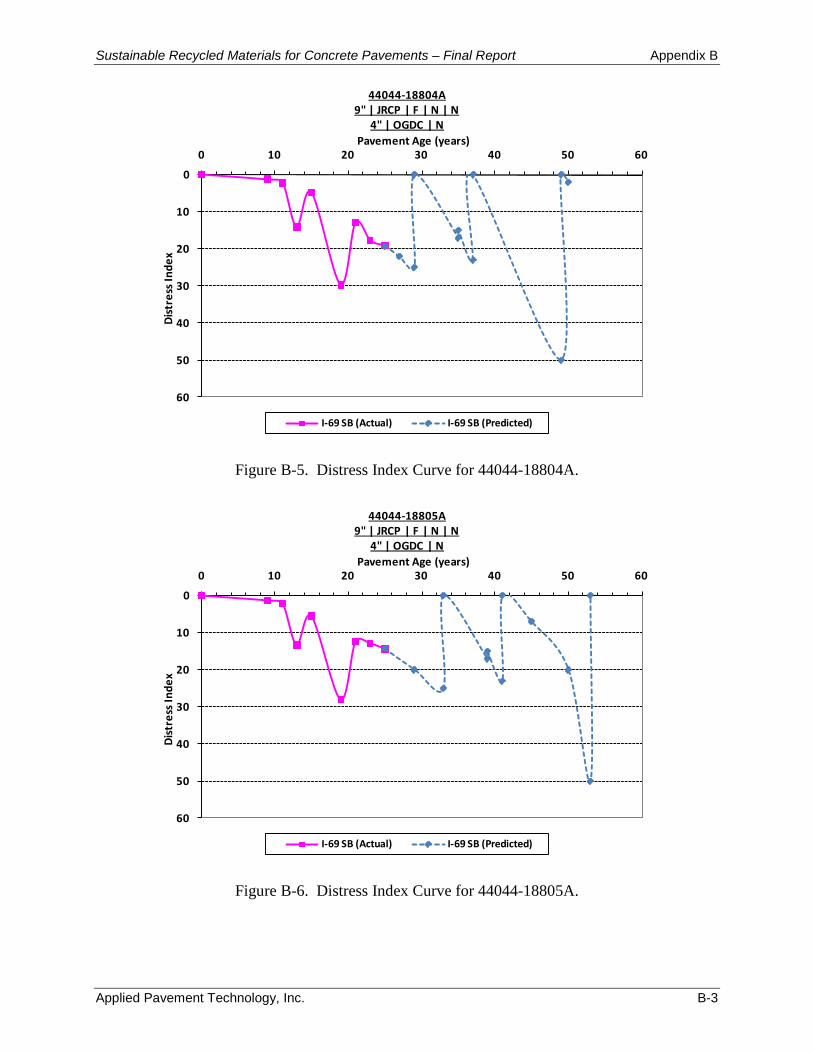
Sustainable Recycled Materials for Concrete Pavements – Final Report Appendix B
Applied Pavement Technology, Inc. B-3
0
10
20
30
40
50
60
0 10 20 30 40 50 60Di
stre
ss In
dex
Pavement Age (years)
44044-18804A9" | JRCP | F | N | N
4" | OGDC | N
I-69 SB (Actual) I-69 SB (Predicted)
Figure B-5. Distress Index Curve for 44044-18804A.
0
10
20
30
40
50
60
0 10 20 30 40 50 60
Dist
ress
Inde
x
Pavement Age (years)
44044-18805A9" | JRCP | F | N | N
4" | OGDC | N
I-69 SB (Actual) I-69 SB (Predicted)
Figure B-6. Distress Index Curve for 44044-18805A.
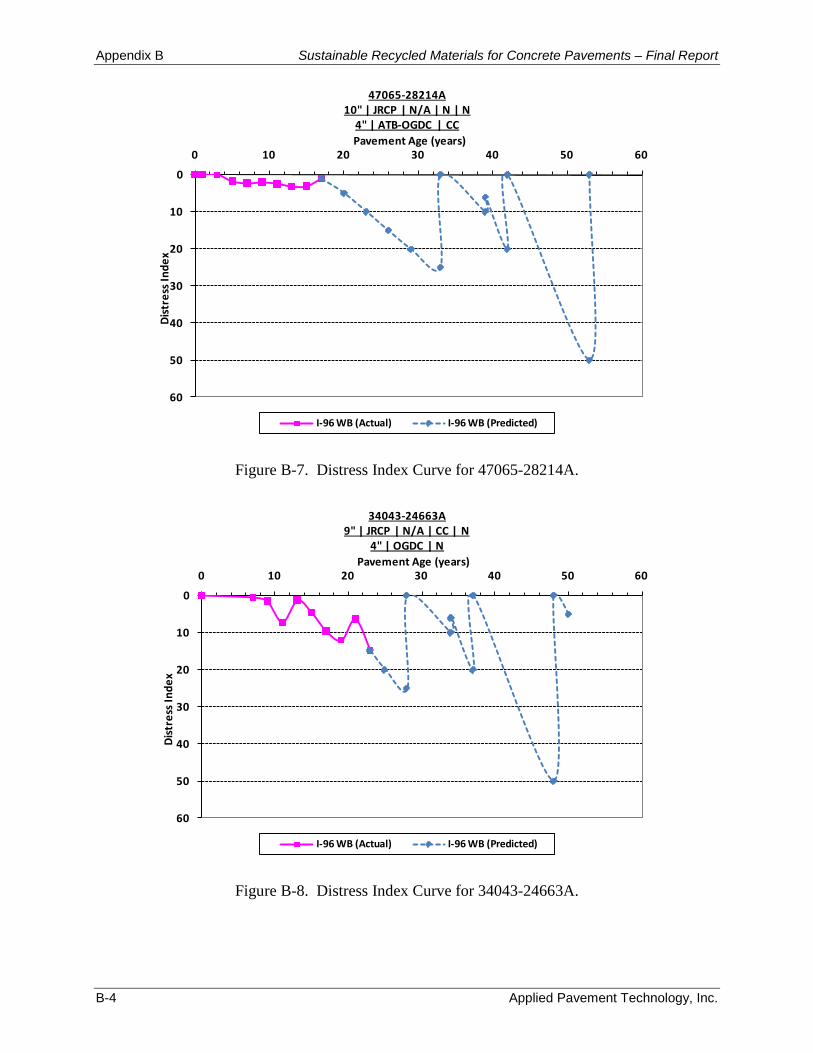
Appendix B Sustainable Recycled Materials for Concrete Pavements – Final Report
B-4 Applied Pavement Technology, Inc.
0
10
20
30
40
50
60
0 10 20 30 40 50 60Di
stre
ss In
dex
Pavement Age (years)
47065-28214A10" | JRCP | N/A | N | N
4" | ATB-OGDC | CC
I-96 WB (Actual) I-96 WB (Predicted)
Figure B-7. Distress Index Curve for 47065-28214A.
0
10
20
30
40
50
60
0 10 20 30 40 50 60
Dist
ress
Inde
x
Pavement Age (years)
34043-24663A9" | JRCP | N/A | CC | N
4" | OGDC | N
I-96 WB (Actual) I-96 WB (Predicted)
Figure B-8. Distress Index Curve for 34043-24663A.
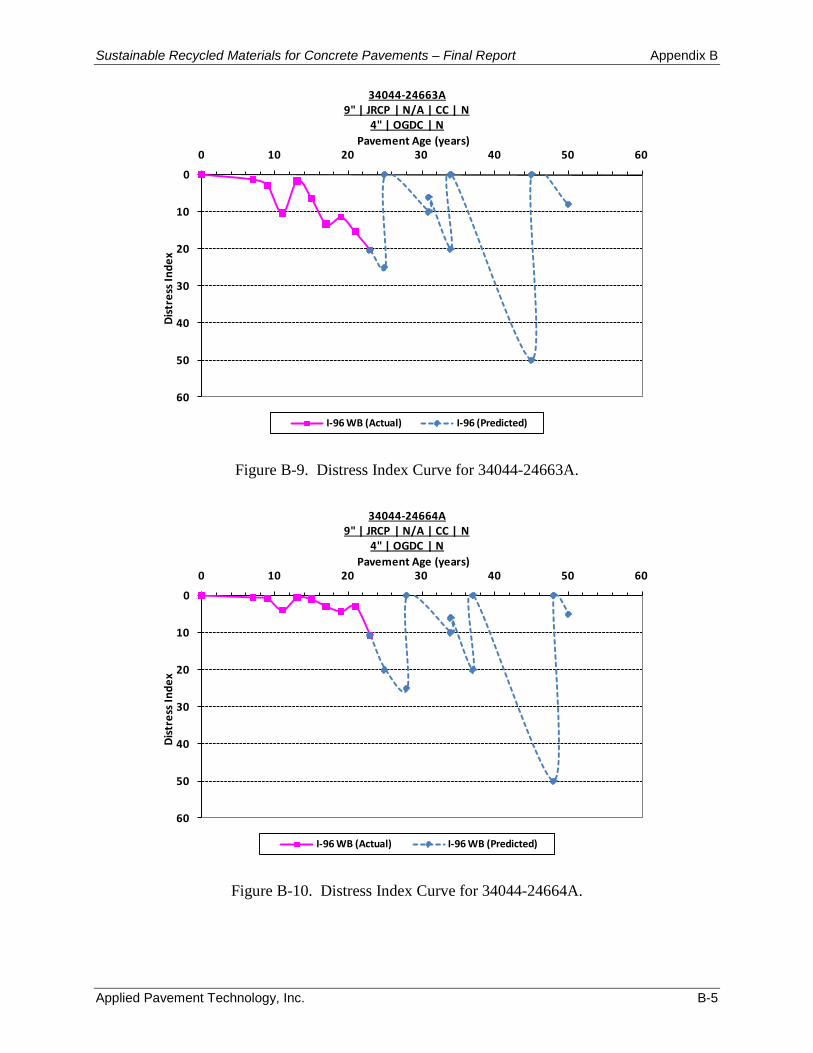
Sustainable Recycled Materials for Concrete Pavements – Final Report Appendix B
Applied Pavement Technology, Inc. B-5
0
10
20
30
40
50
60
0 10 20 30 40 50 60Di
stre
ss In
dex
Pavement Age (years)
34044-24663A9" | JRCP | N/A | CC | N
4" | OGDC | N
I-96 WB (Actual) I-96 (Predicted)
Figure B-9. Distress Index Curve for 34044-24663A.
0
10
20
30
40
50
60
0 10 20 30 40 50 60
Dist
ress
Inde
x
Pavement Age (years)
34044-24664A9" | JRCP | N/A | CC | N
4" | OGDC | N
I-96 WB (Actual) I-96 WB (Predicted)
Figure B-10. Distress Index Curve for 34044-24664A.
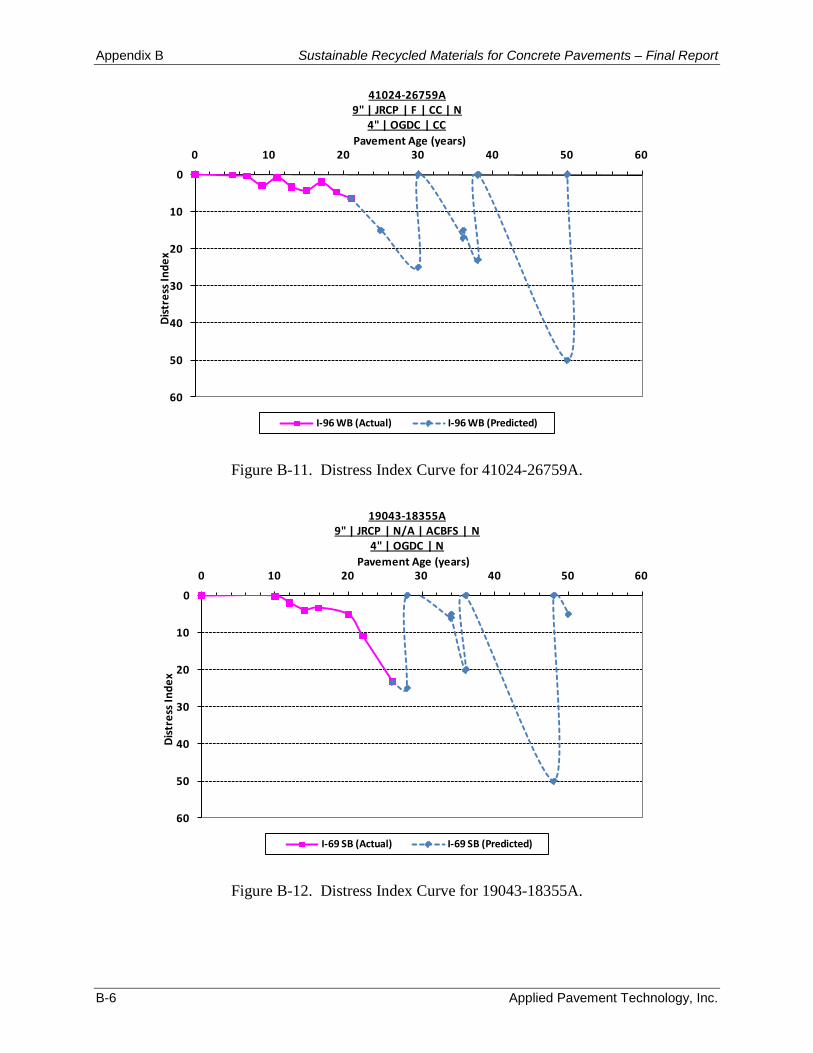
Appendix B Sustainable Recycled Materials for Concrete Pavements – Final Report
B-6 Applied Pavement Technology, Inc.
0
10
20
30
40
50
60
0 10 20 30 40 50 60Di
stre
ss In
dex
Pavement Age (years)
41024-26759A9" | JRCP | F | CC | N
4" | OGDC | CC
I-96 WB (Actual) I-96 WB (Predicted)
Figure B-11. Distress Index Curve for 41024-26759A.
0
10
20
30
40
50
60
0 10 20 30 40 50 60
Dist
ress
Inde
x
Pavement Age (years)
19043-18355A9" | JRCP | N/A | ACBFS | N
4" | OGDC | N
I-69 SB (Actual) I-69 SB (Predicted)
Figure B-12. Distress Index Curve for 19043-18355A.
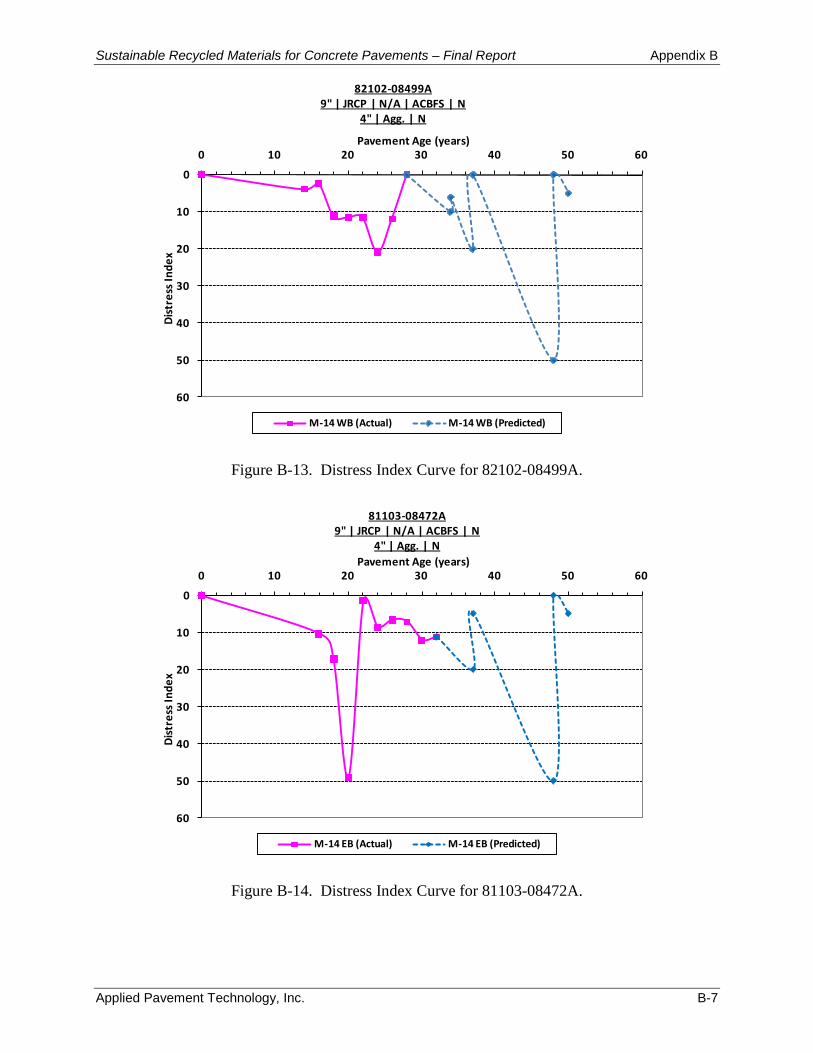
Sustainable Recycled Materials for Concrete Pavements – Final Report Appendix B
Applied Pavement Technology, Inc. B-7
0
10
20
30
40
50
60
0 10 20 30 40 50 60Di
stre
ss In
dex
Pavement Age (years)
82102-08499A9" | JRCP | N/A | ACBFS | N
4" | Agg. | N
M-14 WB (Actual) M-14 WB (Predicted)
Figure B-13. Distress Index Curve for 82102-08499A.
0
10
20
30
40
50
60
0 10 20 30 40 50 60
Dist
ress
Inde
x
Pavement Age (years)
81103-08472A9" | JRCP | N/A | ACBFS | N
4" | Agg. | N
M-14 EB (Actual) M-14 EB (Predicted)
Figure B-14. Distress Index Curve for 81103-08472A.
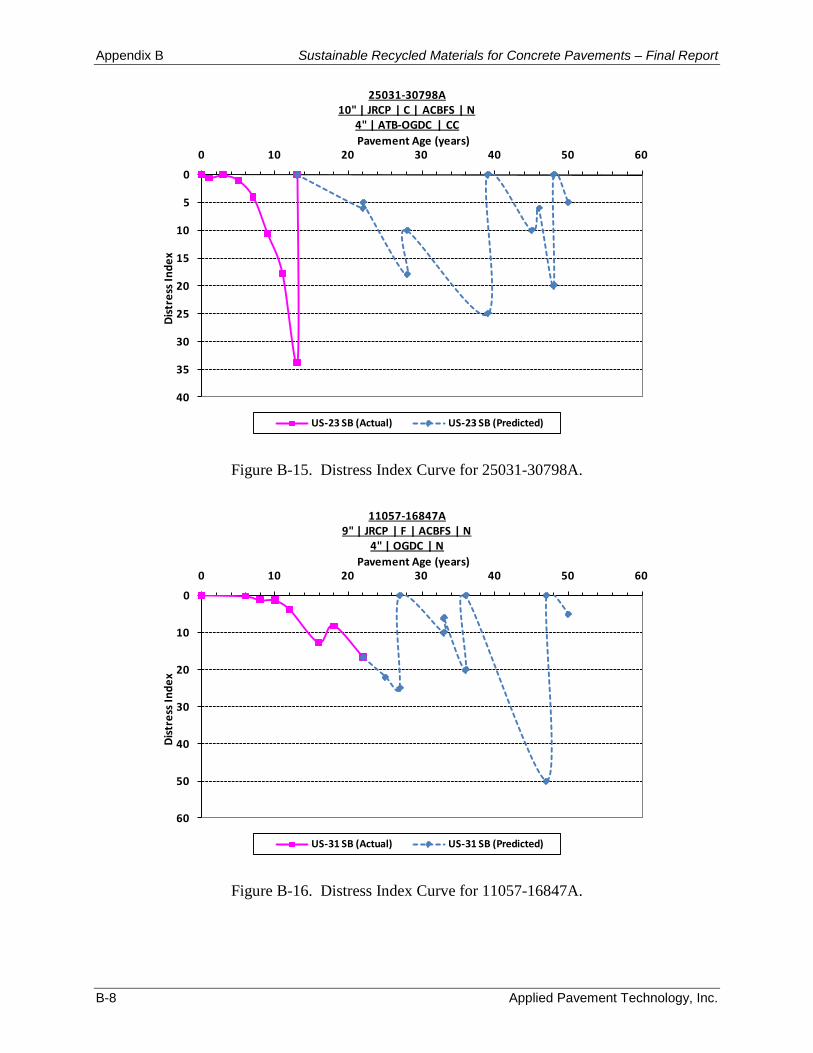
Appendix B Sustainable Recycled Materials for Concrete Pavements – Final Report
B-8 Applied Pavement Technology, Inc.
0
5
10
15
20
25
30
35
40
0 10 20 30 40 50 60Di
stre
ss In
dex
Pavement Age (years)
25031-30798A10" | JRCP | C | ACBFS | N
4" | ATB-OGDC | CC
US-23 SB (Actual) US-23 SB (Predicted)
Figure B-15. Distress Index Curve for 25031-30798A.
0
10
20
30
40
50
60
0 10 20 30 40 50 60
Dist
ress
Inde
x
Pavement Age (years)
11057-16847A9" | JRCP | F | ACBFS | N
4" | OGDC | N
US-31 SB (Actual) US-31 SB (Predicted)
Figure B-16. Distress Index Curve for 11057-16847A.
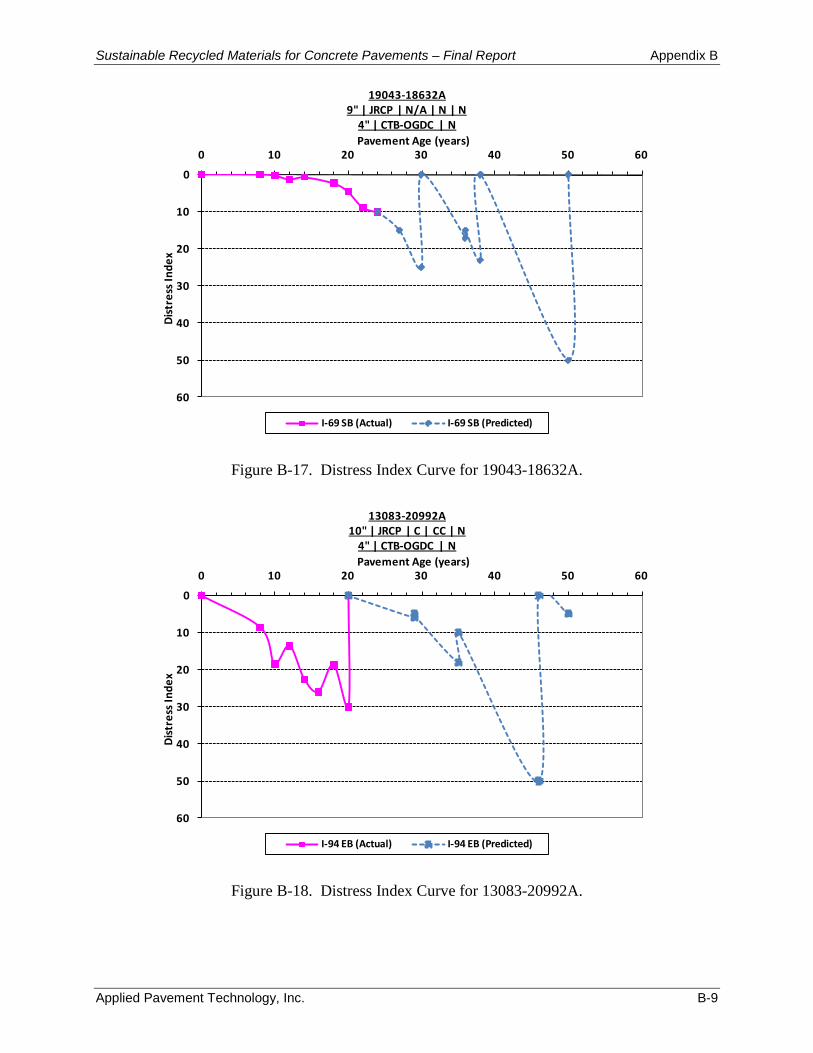
Sustainable Recycled Materials for Concrete Pavements – Final Report Appendix B
Applied Pavement Technology, Inc. B-9
0
10
20
30
40
50
60
0 10 20 30 40 50 60Di
stre
ss In
dex
Pavement Age (years)
19043-18632A9" | JRCP | N/A | N | N
4" | CTB-OGDC | N
I-69 SB (Actual) I-69 SB (Predicted)
Figure B-17. Distress Index Curve for 19043-18632A.
0
10
20
30
40
50
60
0 10 20 30 40 50 60
Dist
ress
Inde
x
Pavement Age (years)
13083-20992A10" | JRCP | C | CC | N
4" | CTB-OGDC | N
I-94 EB (Actual) I-94 EB (Predicted)
Figure B-18. Distress Index Curve for 13083-20992A.
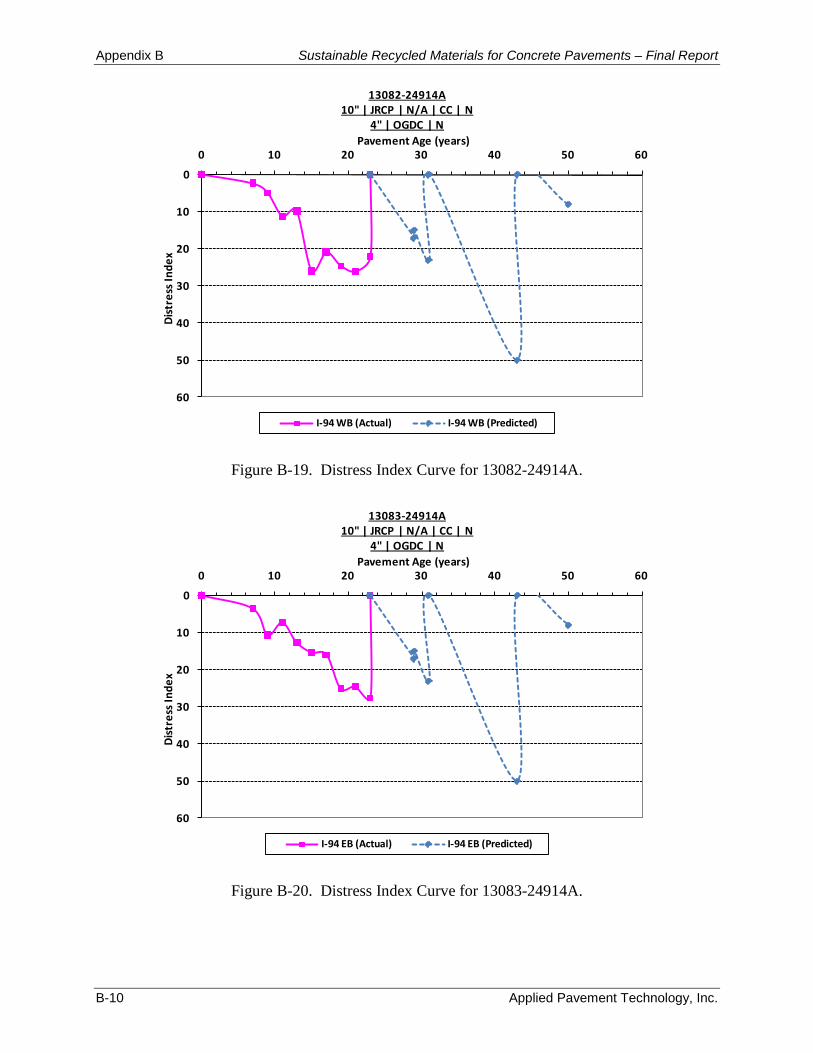
Appendix B Sustainable Recycled Materials for Concrete Pavements – Final Report
B-10 Applied Pavement Technology, Inc.
0
10
20
30
40
50
60
0 10 20 30 40 50 60Di
stre
ss In
dex
Pavement Age (years)
13082-24914A10" | JRCP | N/A | CC | N
4" | OGDC | N
I-94 WB (Actual) I-94 WB (Predicted)
Figure B-19. Distress Index Curve for 13082-24914A.
0
10
20
30
40
50
60
0 10 20 30 40 50 60
Dist
ress
Inde
x
Pavement Age (years)
13083-24914A10" | JRCP | N/A | CC | N
4" | OGDC | N
I-94 EB (Actual) I-94 EB (Predicted)
Figure B-20. Distress Index Curve for 13083-24914A.
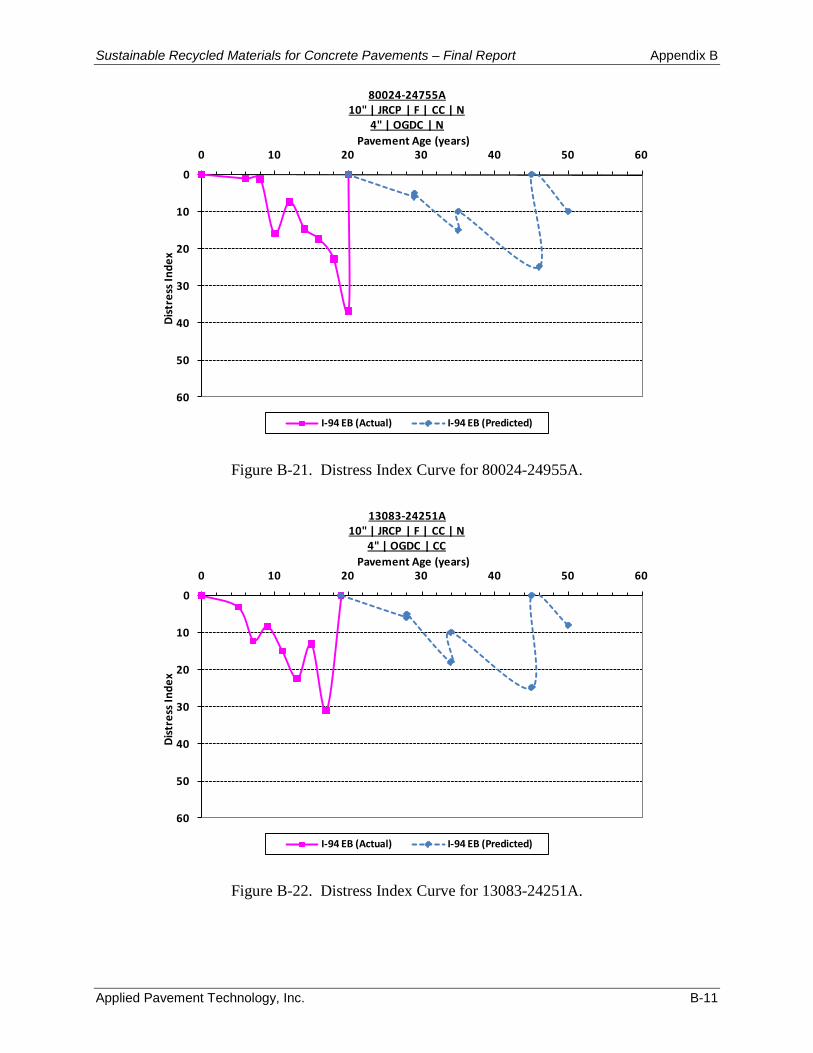
Sustainable Recycled Materials for Concrete Pavements – Final Report Appendix B
Applied Pavement Technology, Inc. B-11
0
10
20
30
40
50
60
0 10 20 30 40 50 60Di
stre
ss In
dex
Pavement Age (years)
80024-24755A10" | JRCP | F | CC | N
4" | OGDC | N
I-94 EB (Actual) I-94 EB (Predicted)
Figure B-21. Distress Index Curve for 80024-24955A.
0
10
20
30
40
50
60
0 10 20 30 40 50 60
Dist
ress
Inde
x
Pavement Age (years)
13083-24251A10" | JRCP | F | CC | N
4" | OGDC | CC
I-94 EB (Actual) I-94 EB (Predicted)
Figure B-22. Distress Index Curve for 13083-24251A.
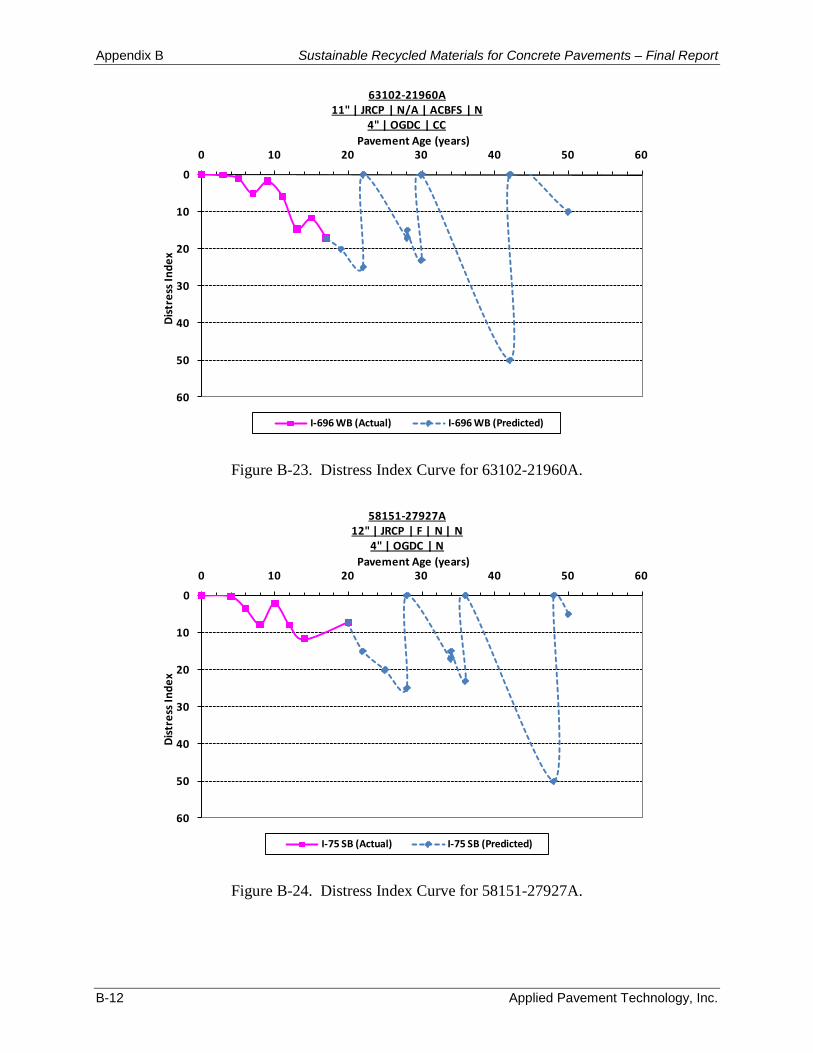
Appendix B Sustainable Recycled Materials for Concrete Pavements – Final Report
B-12 Applied Pavement Technology, Inc.
0
10
20
30
40
50
60
0 10 20 30 40 50 60Di
stre
ss In
dex
Pavement Age (years)
63102-21960A11" | JRCP | N/A | ACBFS | N
4" | OGDC | CC
I-696 WB (Actual) I-696 WB (Predicted)
Figure B-23. Distress Index Curve for 63102-21960A.
0
10
20
30
40
50
60
0 10 20 30 40 50 60
Dist
ress
Inde
x
Pavement Age (years)
58151-27927A12" | JRCP | F | N | N
4" | OGDC | N
I-75 SB (Actual) I-75 SB (Predicted)
Figure B-24. Distress Index Curve for 58151-27927A.
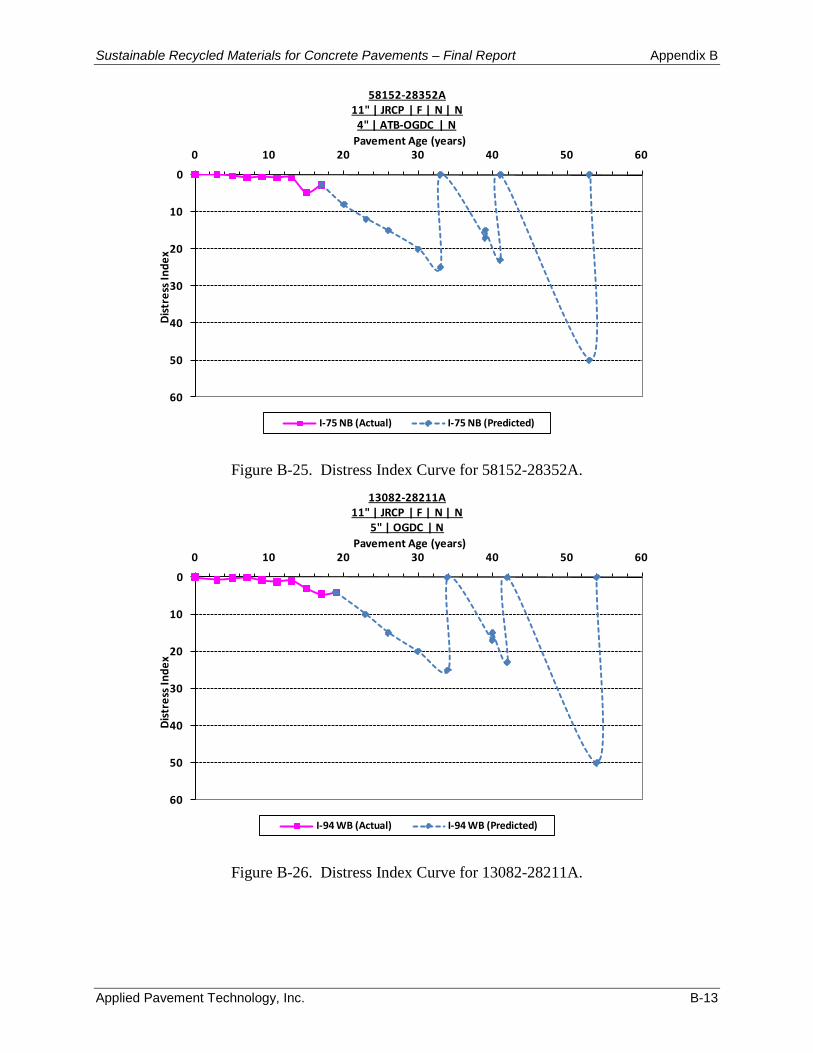
Sustainable Recycled Materials for Concrete Pavements – Final Report Appendix B
Applied Pavement Technology, Inc. B-13
0
10
20
30
40
50
60
0 10 20 30 40 50 60Di
stre
ss In
dex
Pavement Age (years)
58152-28352A11" | JRCP | F | N | N
4" | ATB-OGDC | N
I-75 NB (Actual) I-75 NB (Predicted)
Figure B-25. Distress Index Curve for 58152-28352A.
0
10
20
30
40
50
60
0 10 20 30 40 50 60
Dist
ress
Inde
x
Pavement Age (years)
13082-28211A11" | JRCP | F | N | N
5" | OGDC | N
I-94 WB (Actual) I-94 WB (Predicted)
Figure B-26. Distress Index Curve for 13082-28211A.
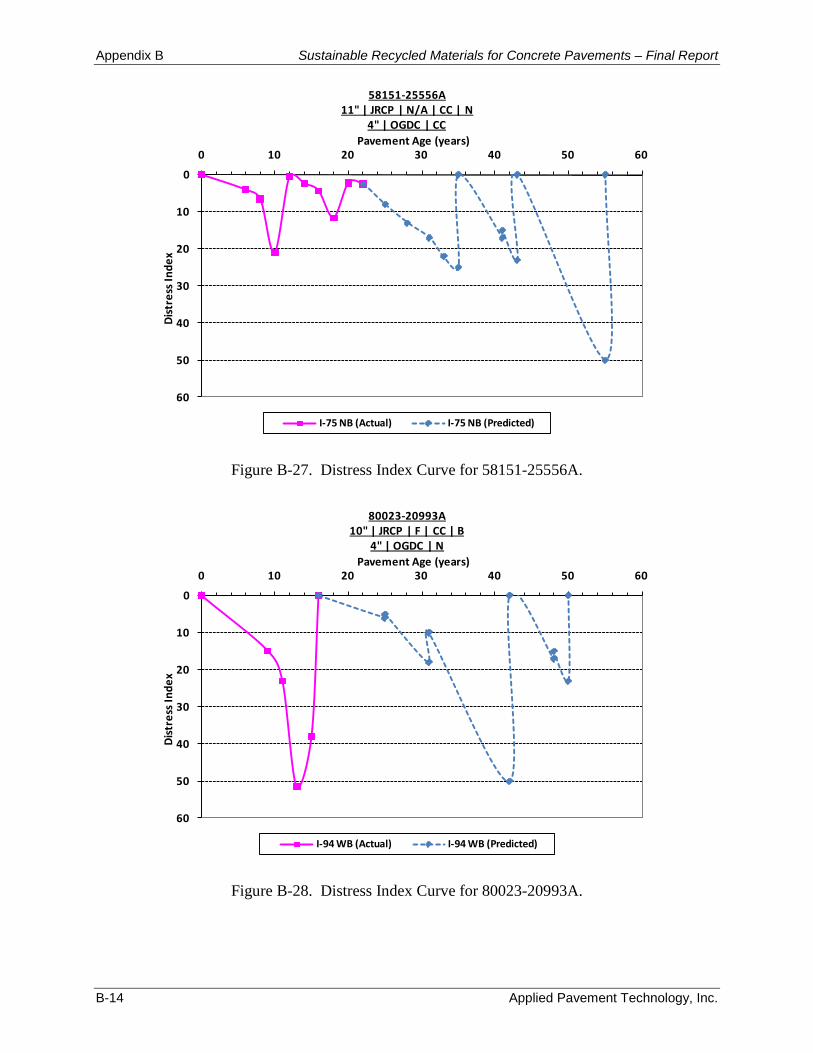
Appendix B Sustainable Recycled Materials for Concrete Pavements – Final Report
B-14 Applied Pavement Technology, Inc.
0
10
20
30
40
50
60
0 10 20 30 40 50 60Di
stre
ss In
dex
Pavement Age (years)
58151-25556A11" | JRCP | N/A | CC | N
4" | OGDC | CC
I-75 NB (Actual) I-75 NB (Predicted)
Figure B-27. Distress Index Curve for 58151-25556A.
0
10
20
30
40
50
60
0 10 20 30 40 50 60
Dist
ress
Inde
x
Pavement Age (years)
80023-20993A10" | JRCP | F | CC | B
4" | OGDC | N
I-94 WB (Actual) I-94 WB (Predicted)
Figure B-28. Distress Index Curve for 80023-20993A.
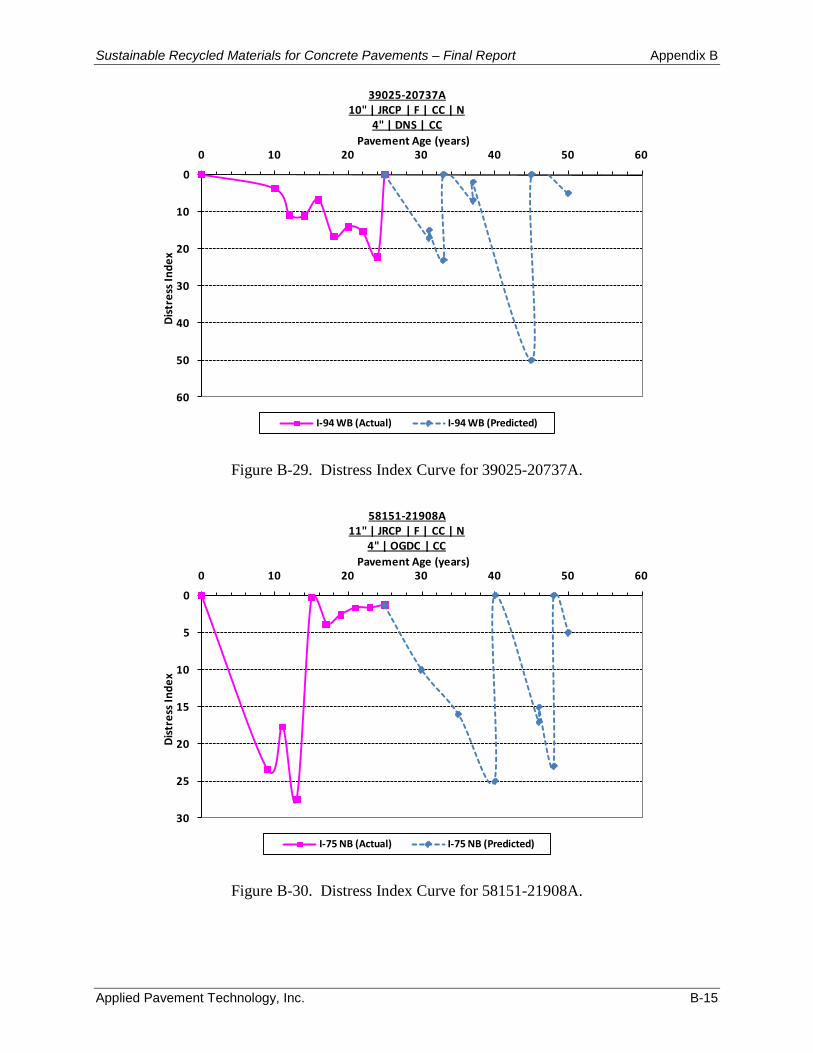
Sustainable Recycled Materials for Concrete Pavements – Final Report Appendix B
Applied Pavement Technology, Inc. B-15
0
10
20
30
40
50
60
0 10 20 30 40 50 60Di
stre
ss In
dex
Pavement Age (years)
39025-20737A10" | JRCP | F | CC | N
4" | DNS | CC
I-94 WB (Actual) I-94 WB (Predicted)
Figure B-29. Distress Index Curve for 39025-20737A.
0
5
10
15
20
25
30
0 10 20 30 40 50 60
Dist
ress
Inde
x
Pavement Age (years)
58151-21908A11" | JRCP | F | CC | N
4" | OGDC | CC
I-75 NB (Actual) I-75 NB (Predicted)
Figure B-30. Distress Index Curve for 58151-21908A.
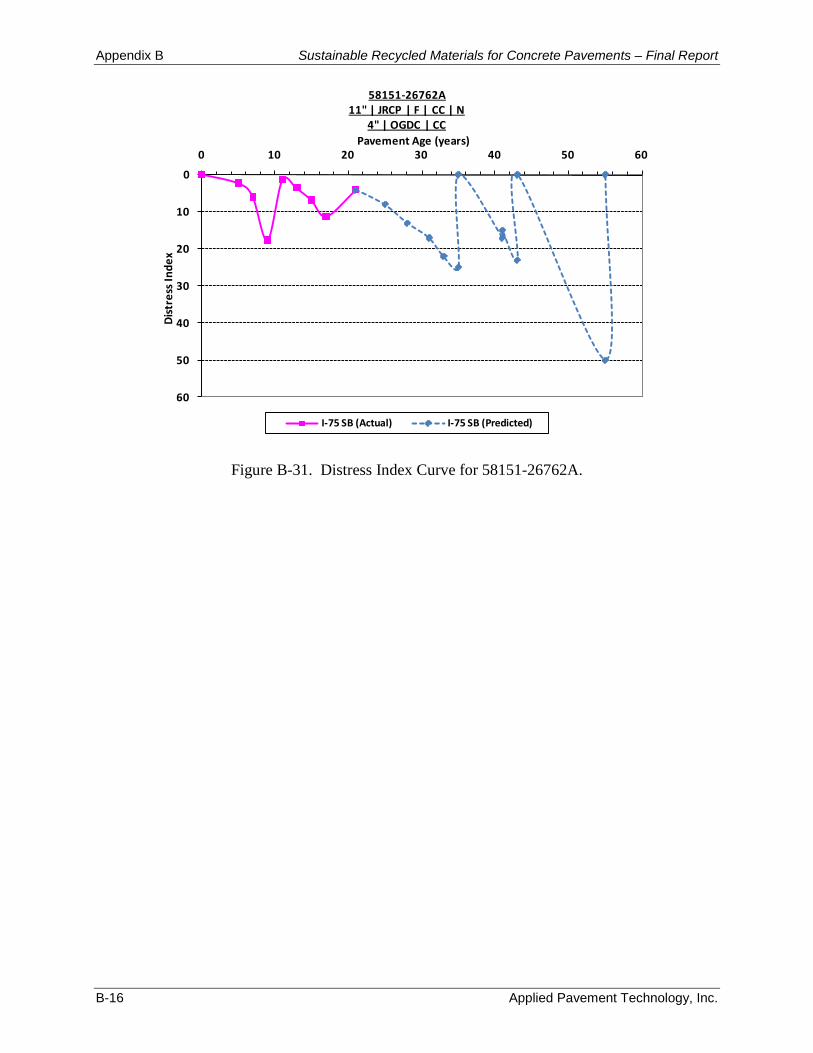
Appendix B Sustainable Recycled Materials for Concrete Pavements – Final Report
B-16 Applied Pavement Technology, Inc.
0
10
20
30
40
50
60
0 10 20 30 40 50 60Di
stre
ss In
dex
Pavement Age (years)
58151-26762A11" | JRCP | F | CC | N
4" | OGDC | CC
I-75 SB (Actual) I-75 SB (Predicted)
Figure B-31. Distress Index Curve for 58151-26762A.
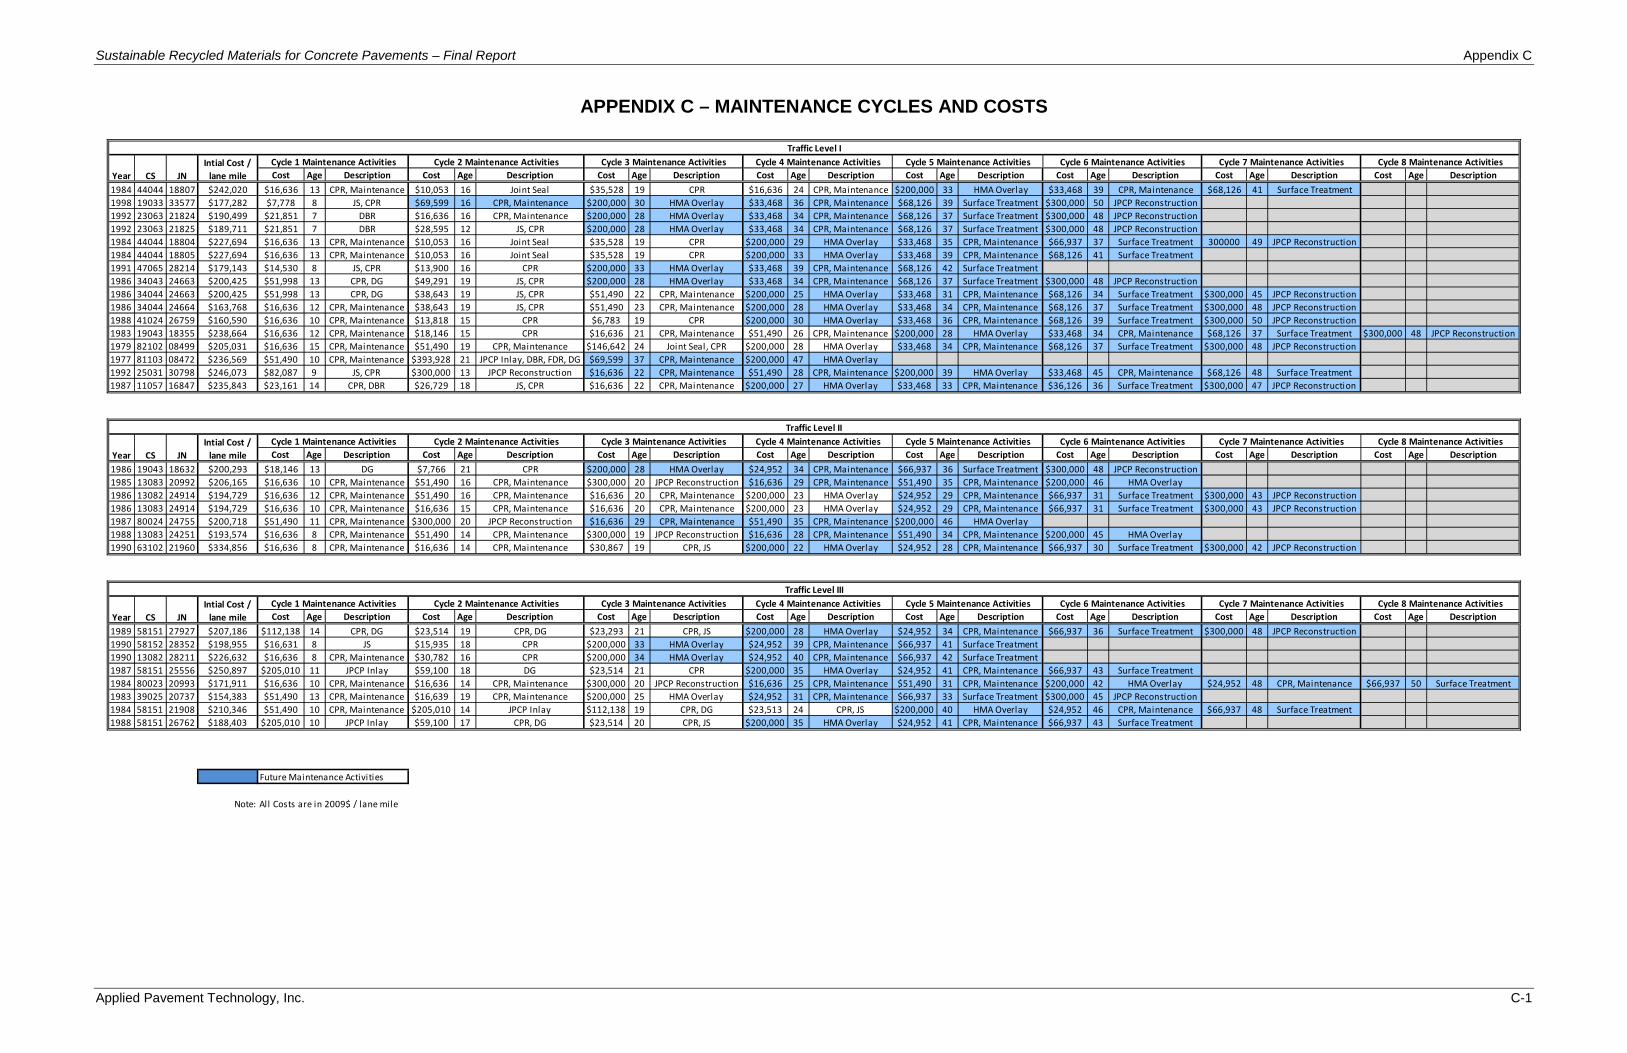
Sustainable Recycled Materials for Concrete Pavements – Final Report Appendix C
Applied Pavement Technology, Inc. C-1
APPENDIX C – MAINTENANCE CYCLES AND COSTS
Cost Age Description Cost Age Description Cost Age Description Cost Age Description Cost Age Description Cost Age Description Cost Age Description Cost Age Description1984 44044 18807 $242,020 $16,636 13 CPR, Maintenance $10,053 16 Joint Seal $35,528 19 CPR $16,636 24 CPR, Maintenance $200,000 33 HMA Overlay $33,468 39 CPR, Maintenance $68,126 41 Surface Treatment1998 19033 33577 $177,282 $7,778 8 JS, CPR $69,599 16 CPR, Maintenance $200,000 30 HMA Overlay $33,468 36 CPR, Maintenance $68,126 39 Surface Treatment $300,000 50 JPCP Reconstruction1992 23063 21824 $190,499 $21,851 7 DBR $16,636 16 CPR, Maintenance $200,000 28 HMA Overlay $33,468 34 CPR, Maintenance $68,126 37 Surface Treatment $300,000 48 JPCP Reconstruction1992 23063 21825 $189,711 $21,851 7 DBR $28,595 12 JS, CPR $200,000 28 HMA Overlay $33,468 34 CPR, Maintenance $68,126 37 Surface Treatment $300,000 48 JPCP Reconstruction1984 44044 18804 $227,694 $16,636 13 CPR, Maintenance $10,053 16 Joint Seal $35,528 19 CPR $200,000 29 HMA Overlay $33,468 35 CPR, Maintenance $66,937 37 Surface Treatment 300000 49 JPCP Reconstruction1984 44044 18805 $227,694 $16,636 13 CPR, Maintenance $10,053 16 Joint Seal $35,528 19 CPR $200,000 33 HMA Overlay $33,468 39 CPR, Maintenance $68,126 41 Surface Treatment1991 47065 28214 $179,143 $14,530 8 JS, CPR $13,900 16 CPR $200,000 33 HMA Overlay $33,468 39 CPR, Maintenance $68,126 42 Surface Treatment1986 34043 24663 $200,425 $51,998 13 CPR, DG $49,291 19 JS, CPR $200,000 28 HMA Overlay $33,468 34 CPR, Maintenance $68,126 37 Surface Treatment $300,000 48 JPCP Reconstruction1986 34044 24663 $200,425 $51,998 13 CPR, DG $38,643 19 JS, CPR $51,490 22 CPR, Maintenance $200,000 25 HMA Overlay $33,468 31 CPR, Maintenance $68,126 34 Surface Treatment $300,000 45 JPCP Reconstruction1986 34044 24664 $163,768 $16,636 12 CPR, Maintenance $38,643 19 JS, CPR $51,490 23 CPR, Maintenance $200,000 28 HMA Overlay $33,468 34 CPR, Maintenance $68,126 37 Surface Treatment $300,000 48 JPCP Reconstruction1988 41024 26759 $160,590 $16,636 10 CPR, Maintenance $13,818 15 CPR $6,783 19 CPR $200,000 30 HMA Overlay $33,468 36 CPR, Maintenance $68,126 39 Surface Treatment $300,000 50 JPCP Reconstruction1983 19043 18355 $238,664 $16,636 12 CPR, Maintenance $18,146 15 CPR $16,636 21 CPR, Maintenance $51,490 26 CPR, Maintenance $200,000 28 HMA Overlay $33,468 34 CPR, Maintenance $68,126 37 Surface Treatment $300,000 48 JPCP Reconstruction1979 82102 08499 $205,031 $16,636 15 CPR, Maintenance $51,490 19 CPR, Maintenance $146,642 24 Joint Seal, CPR $200,000 28 HMA Overlay $33,468 34 CPR, Maintenance $68,126 37 Surface Treatment $300,000 48 JPCP Reconstruction1977 81103 08472 $236,569 $51,490 10 CPR, Maintenance $393,928 21 JPCP Inlay, DBR, FDR, DG $69,599 37 CPR, Maintenance $200,000 47 HMA Overlay1992 25031 30798 $246,073 $82,087 9 JS, CPR $300,000 13 JPCP Reconstruction $16,636 22 CPR, Maintenance $51,490 28 CPR, Maintenance $200,000 39 HMA Overlay $33,468 45 CPR, Maintenance $68,126 48 Surface Treatment1987 11057 16847 $235,843 $23,161 14 CPR, DBR $26,729 18 JS, CPR $16,636 22 CPR, Maintenance $200,000 27 HMA Overlay $33,468 33 CPR, Maintenance $36,126 36 Surface Treatment $300,000 47 JPCP Reconstruction
Cost Age Description Cost Age Description Cost Age Description Cost Age Description Cost Age Description Cost Age Description Cost Age Description Cost Age Description1986 19043 18632 $200,293 $18,146 13 DG $7,766 21 CPR $200,000 28 HMA Overlay $24,952 34 CPR, Maintenance $66,937 36 Surface Treatment $300,000 48 JPCP Reconstruction1985 13083 20992 $206,165 $16,636 10 CPR, Maintenance $51,490 16 CPR, Maintenance $300,000 20 JPCP Reconstruction $16,636 29 CPR, Maintenance $51,490 35 CPR, Maintenance $200,000 46 HMA Overlay1986 13082 24914 $194,729 $16,636 12 CPR, Maintenance $51,490 16 CPR, Maintenance $16,636 20 CPR, Maintenance $200,000 23 HMA Overlay $24,952 29 CPR, Maintenance $66,937 31 Surface Treatment $300,000 43 JPCP Reconstruction1986 13083 24914 $194,729 $16,636 10 CPR, Maintenance $16,636 15 CPR, Maintenance $16,636 20 CPR, Maintenance $200,000 23 HMA Overlay $24,952 29 CPR, Maintenance $66,937 31 Surface Treatment $300,000 43 JPCP Reconstruction1987 80024 24755 $200,718 $51,490 11 CPR, Maintenance $300,000 20 JPCP Reconstruction $16,636 29 CPR, Maintenance $51,490 35 CPR, Maintenance $200,000 46 HMA Overlay1988 13083 24251 $193,574 $16,636 8 CPR, Maintenance $51,490 14 CPR, Maintenance $300,000 19 JPCP Reconstruction $16,636 28 CPR, Maintenance $51,490 34 CPR, Maintenance $200,000 45 HMA Overlay1990 63102 21960 $334,856 $16,636 8 CPR, Maintenance $16,636 14 CPR, Maintenance $30,867 19 CPR, JS $200,000 22 HMA Overlay $24,952 28 CPR, Maintenance $66,937 30 Surface Treatment $300,000 42 JPCP Reconstruction
Cost Age Description Cost Age Description Cost Age Description Cost Age Description Cost Age Description Cost Age Description Cost Age Description Cost Age Description1989 58151 27927 $207,186 $112,138 14 CPR, DG $23,514 19 CPR, DG $23,293 21 CPR, JS $200,000 28 HMA Overlay $24,952 34 CPR, Maintenance $66,937 36 Surface Treatment $300,000 48 JPCP Reconstruction1990 58152 28352 $198,955 $16,631 8 JS $15,935 18 CPR $200,000 33 HMA Overlay $24,952 39 CPR, Maintenance $66,937 41 Surface Treatment1990 13082 28211 $226,632 $16,636 8 CPR, Maintenance $30,782 16 CPR $200,000 34 HMA Overlay $24,952 40 CPR, Maintenance $66,937 42 Surface Treatment1987 58151 25556 $250,897 $205,010 11 JPCP Inlay $59,100 18 DG $23,514 21 CPR $200,000 35 HMA Overlay $24,952 41 CPR, Maintenance $66,937 43 Surface Treatment1984 80023 20993 $171,911 $16,636 10 CPR, Maintenance $16,636 14 CPR, Maintenance $300,000 20 JPCP Reconstruction $16,636 25 CPR, Maintenance $51,490 31 CPR, Maintenance $200,000 42 HMA Overlay $24,952 48 CPR, Maintenance $66,937 50 Surface Treatment1983 39025 20737 $154,383 $51,490 13 CPR, Maintenance $16,639 19 CPR, Maintenance $200,000 25 HMA Overlay $24,952 31 CPR, Maintenance $66,937 33 Surface Treatment $300,000 45 JPCP Reconstruction1984 58151 21908 $210,346 $51,490 10 CPR, Maintenance $205,010 14 JPCP Inlay $112,138 19 CPR, DG $23,513 24 CPR, JS $200,000 40 HMA Overlay $24,952 46 CPR, Maintenance $66,937 48 Surface Treatment1988 58151 26762 $188,403 $205,010 10 JPCP Inlay $59,100 17 CPR, DG $23,514 20 CPR, JS $200,000 35 HMA Overlay $24,952 41 CPR, Maintenance $66,937 43 Surface Treatment
Note: All Costs are in 2009$ / lane mile
Year CS JNCycle 1 Maintenance ActivitiesIntial Cost /
lane mileCycle 3 Maintenance Activities Cycle 4 Maintenance Activities Cycle 5 Maintenance Activities Cycle 6 Maintenance Activities Cycle 7 Maintenance Activities Cycle 8 Maintenance Activities
Year CS JN
Cycle 2 Maintenance Activities
Cycle 8 Maintenance ActivitiesCycle 1 Maintenance Activities Cycle 2 Maintenance Activities Cycle 3 Maintenance Activities Cycle 4 Maintenance ActivitiesIntial Cost / lane mile
Cycle 5 Maintenance Activities Cycle 6 Maintenance Activities Cycle 7 Maintenance Activities
Year CS JNCycle 5 Maintenance Activities Cycle 6 Maintenance Activities Cycle 7 Maintenance ActivitiesCycle 1 Maintenance ActivitiesIntial Cost /
lane mile
Future Maintenance Activities
Cycle 8 Maintenance Activities
Traffic Level I
Traffic Level II
Traffic Level IIICycle 2 Maintenance Activities Cycle 3 Maintenance Activities Cycle 4 Maintenance Activities

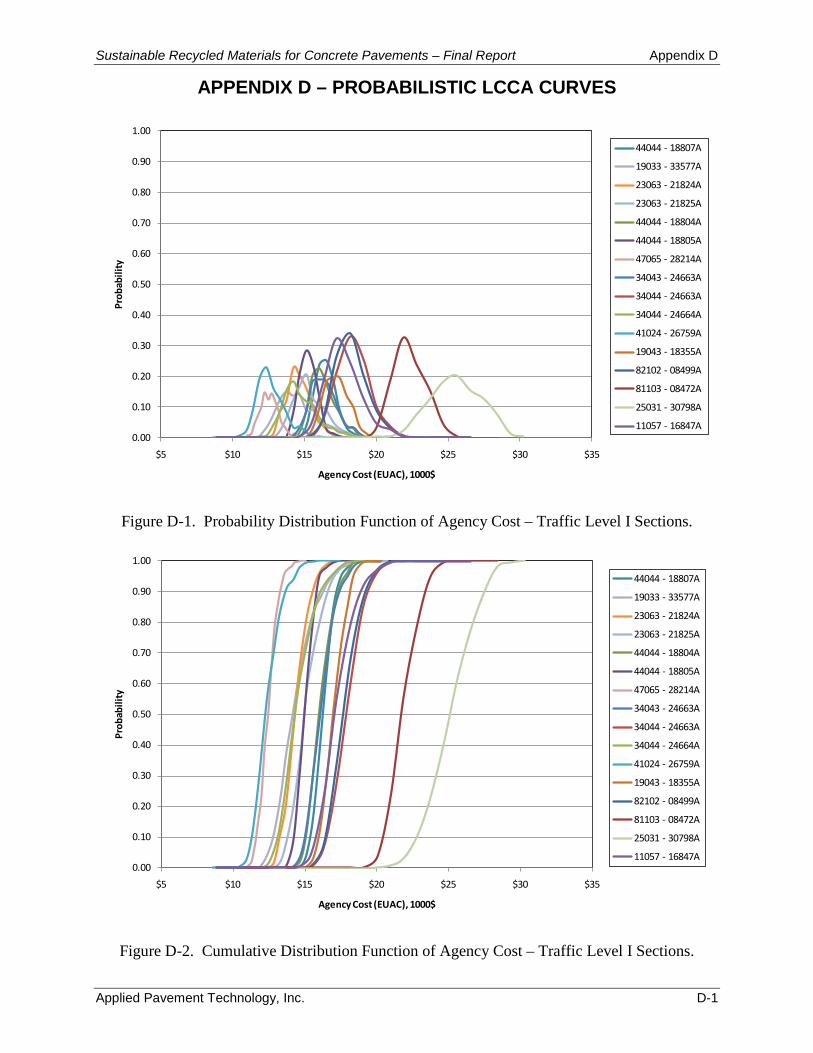
Sustainable Recycled Materials for Concrete Pavements – Final Report Appendix D
Applied Pavement Technology, Inc. D-1
APPENDIX D – PROBABILISTIC LCCA CURVES
0.00
0.10
0.20
0.30
0.40
0.50
0.60
0.70
0.80
0.90
1.00
$5 $10 $15 $20 $25 $30 $35
Prob
abili
ty
Agency Cost (EUAC), 1000$
44044 - 18807A
19033 - 33577A
23063 - 21824A
23063 - 21825A
44044 - 18804A
44044 - 18805A
47065 - 28214A
34043 - 24663A
34044 - 24663A
34044 - 24664A
41024 - 26759A
19043 - 18355A
82102 - 08499A
81103 - 08472A
25031 - 30798A
11057 - 16847A
Figure D-1. Probability Distribution Function of Agency Cost – Traffic Level I Sections.
0.00
0.10
0.20
0.30
0.40
0.50
0.60
0.70
0.80
0.90
1.00
$5 $10 $15 $20 $25 $30 $35
Prob
abili
ty
Agency Cost (EUAC), 1000$
44044 - 18807A
19033 - 33577A
23063 - 21824A
23063 - 21825A
44044 - 18804A
44044 - 18805A
47065 - 28214A
34043 - 24663A
34044 - 24663A
34044 - 24664A
41024 - 26759A
19043 - 18355A
82102 - 08499A
81103 - 08472A
25031 - 30798A
11057 - 16847A
Figure D-2. Cumulative Distribution Function of Agency Cost – Traffic Level I Sections.
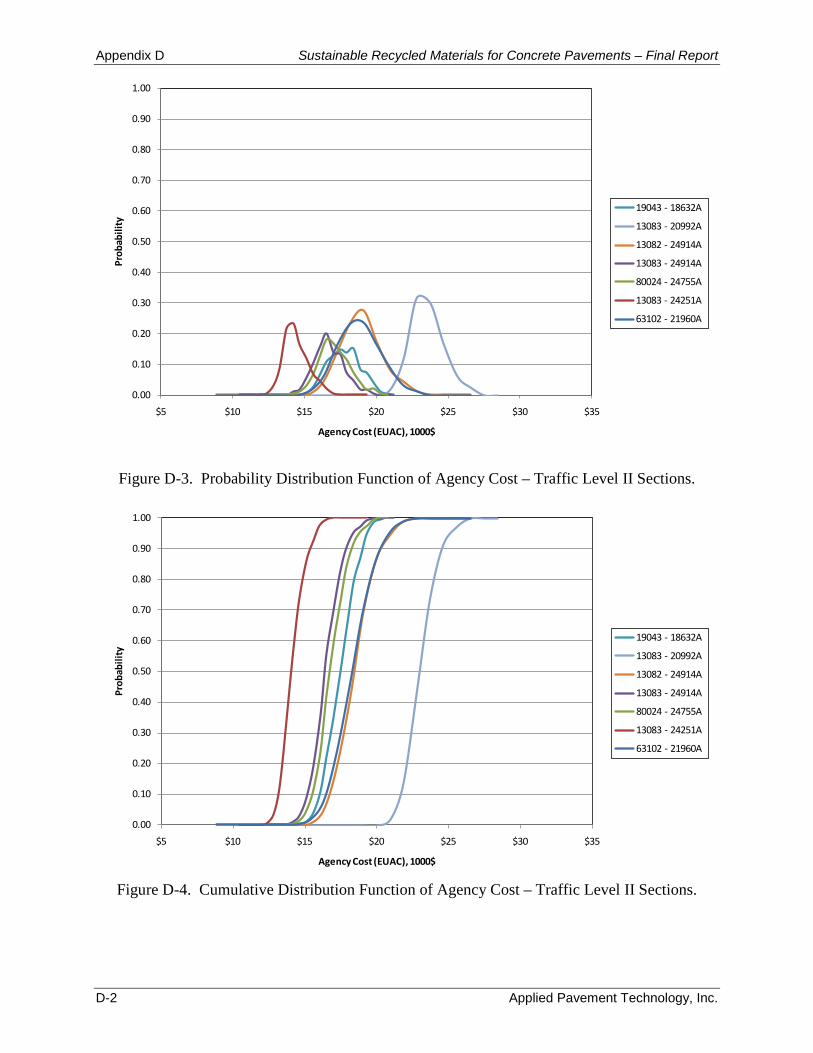
Appendix D Sustainable Recycled Materials for Concrete Pavements – Final Report
D-2 Applied Pavement Technology, Inc.
0.00
0.10
0.20
0.30
0.40
0.50
0.60
0.70
0.80
0.90
1.00
$5 $10 $15 $20 $25 $30 $35
Prob
abili
ty
Agency Cost (EUAC), 1000$
19043 - 18632A
13083 - 20992A
13082 - 24914A
13083 - 24914A
80024 - 24755A
13083 - 24251A
63102 - 21960A
Figure D-3. Probability Distribution Function of Agency Cost – Traffic Level II Sections.
0.00
0.10
0.20
0.30
0.40
0.50
0.60
0.70
0.80
0.90
1.00
$5 $10 $15 $20 $25 $30 $35
Prob
abili
ty
Agency Cost (EUAC), 1000$
19043 - 18632A
13083 - 20992A
13082 - 24914A
13083 - 24914A
80024 - 24755A
13083 - 24251A
63102 - 21960A
Figure D-4. Cumulative Distribution Function of Agency Cost – Traffic Level II Sections.
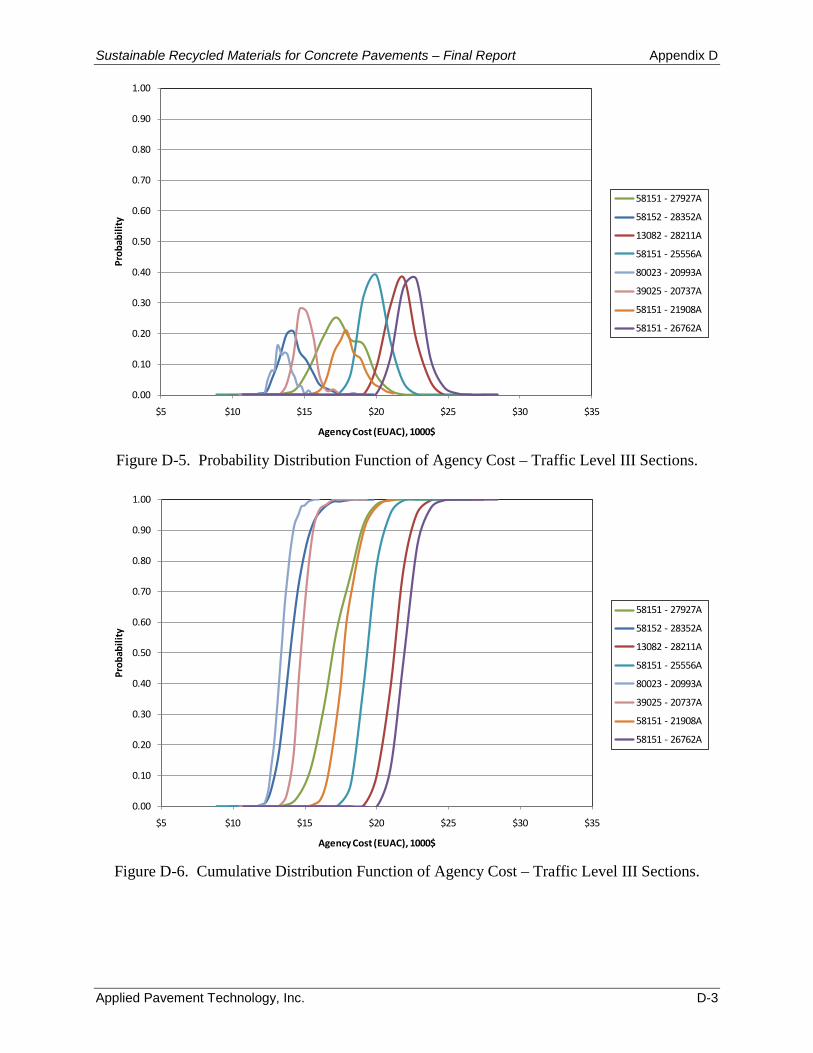
Sustainable Recycled Materials for Concrete Pavements – Final Report Appendix D
Applied Pavement Technology, Inc. D-3
0.00
0.10
0.20
0.30
0.40
0.50
0.60
0.70
0.80
0.90
1.00
$5 $10 $15 $20 $25 $30 $35
Prob
abili
ty
Agency Cost (EUAC), 1000$
58151 - 27927A
58152 - 28352A
13082 - 28211A
58151 - 25556A
80023 - 20993A
39025 - 20737A
58151 - 21908A
58151 - 26762A
Figure D-5. Probability Distribution Function of Agency Cost – Traffic Level III Sections.
0.00
0.10
0.20
0.30
0.40
0.50
0.60
0.70
0.80
0.90
1.00
$5 $10 $15 $20 $25 $30 $35
Prob
abili
ty
Agency Cost (EUAC), 1000$
58151 - 27927A
58152 - 28352A
13082 - 28211A
58151 - 25556A
80023 - 20993A
39025 - 20737A
58151 - 21908A
58151 - 26762A
Figure D-6. Cumulative Distribution Function of Agency Cost – Traffic Level III Sections.

Appendix D Sustainable Recycled Materials for Concrete Pavements – Final Report
D-4 Applied Pavement Technology, Inc.
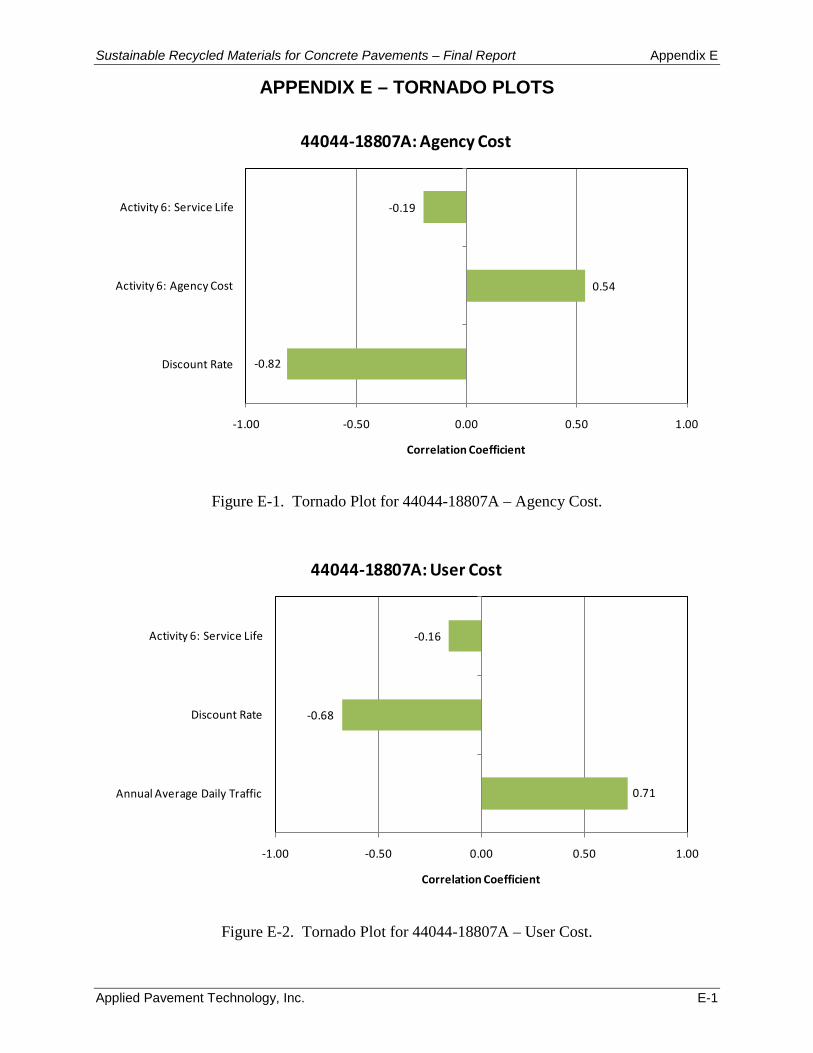
Sustainable Recycled Materials for Concrete Pavements – Final Report Appendix E
Applied Pavement Technology, Inc. E-1
APPENDIX E – TORNADO PLOTS
-0.82
0.54
-0.19
-1.00 -0.50 0.00 0.50 1.00
Discount Rate
Activity 6: Agency Cost
Activity 6: Service Life
Correlation Coefficient
44044-18807A: Agency Cost
Figure E-1. Tornado Plot for 44044-18807A – Agency Cost.
0.71
-0.68
-0.16
-1.00 -0.50 0.00 0.50 1.00
Annual Average Daily Traffic
Discount Rate
Activity 6: Service Life
Correlation Coefficient
44044-18807A: User Cost
Figure E-2. Tornado Plot for 44044-18807A – User Cost.
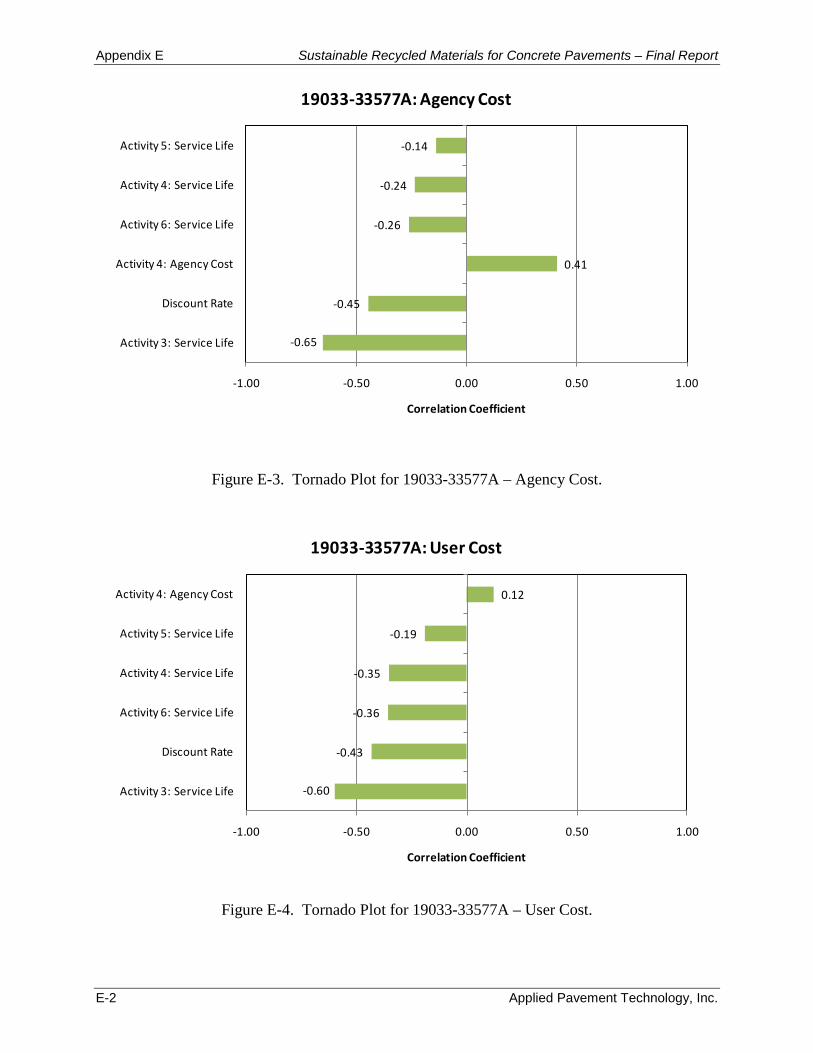
Appendix E Sustainable Recycled Materials for Concrete Pavements – Final Report
E-2 Applied Pavement Technology, Inc.
-0.65
-0.45
0.41
-0.26
-0.24
-0.14
-1.00 -0.50 0.00 0.50 1.00
Activity 3: Service Life
Discount Rate
Activity 4: Agency Cost
Activity 6: Service Life
Activity 4: Service Life
Activity 5: Service Life
Correlation Coefficient
19033-33577A: Agency Cost
Figure E-3. Tornado Plot for 19033-33577A – Agency Cost.
-0.60
-0.43
-0.36
-0.35
-0.19
0.12
-1.00 -0.50 0.00 0.50 1.00
Activity 3: Service Life
Discount Rate
Activity 6: Service Life
Activity 4: Service Life
Activity 5: Service Life
Activity 4: Agency Cost
Correlation Coefficient
19033-33577A: User Cost
Figure E-4. Tornado Plot for 19033-33577A – User Cost.
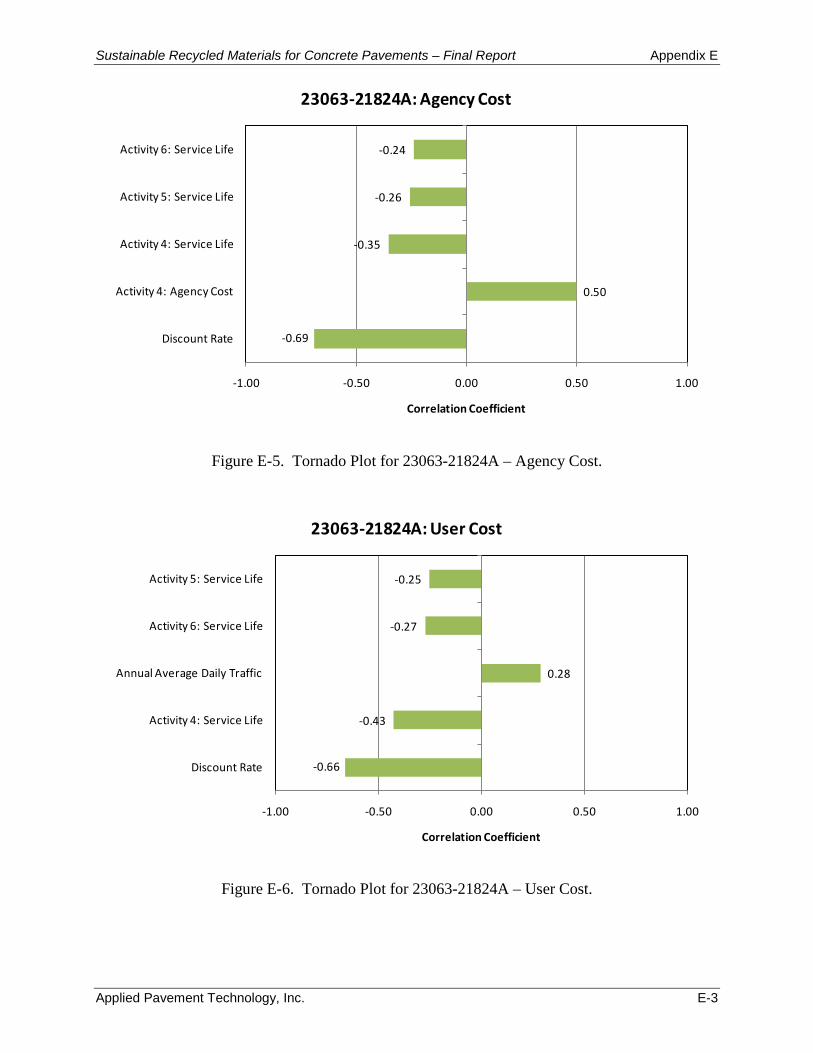
Sustainable Recycled Materials for Concrete Pavements – Final Report Appendix E
Applied Pavement Technology, Inc. E-3
-0.69
0.50
-0.35
-0.26
-0.24
-1.00 -0.50 0.00 0.50 1.00
Discount Rate
Activity 4: Agency Cost
Activity 4: Service Life
Activity 5: Service Life
Activity 6: Service Life
Correlation Coefficient
23063-21824A: Agency Cost
Figure E-5. Tornado Plot for 23063-21824A – Agency Cost.
-0.66
-0.43
0.28
-0.27
-0.25
-1.00 -0.50 0.00 0.50 1.00
Discount Rate
Activity 4: Service Life
Annual Average Daily Traffic
Activity 6: Service Life
Activity 5: Service Life
Correlation Coefficient
23063-21824A: User Cost
Figure E-6. Tornado Plot for 23063-21824A – User Cost.
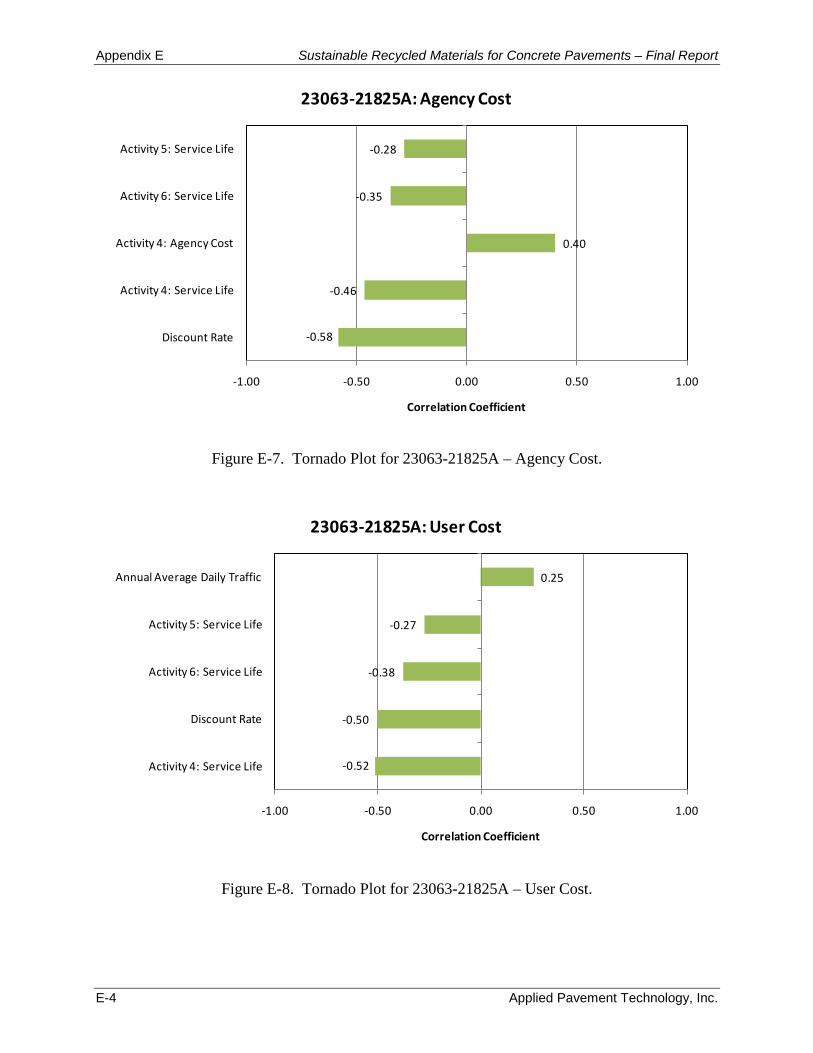
Appendix E Sustainable Recycled Materials for Concrete Pavements – Final Report
E-4 Applied Pavement Technology, Inc.
-0.58
-0.46
0.40
-0.35
-0.28
-1.00 -0.50 0.00 0.50 1.00
Discount Rate
Activity 4: Service Life
Activity 4: Agency Cost
Activity 6: Service Life
Activity 5: Service Life
Correlation Coefficient
23063-21825A: Agency Cost
Figure E-7. Tornado Plot for 23063-21825A – Agency Cost.
-0.52
-0.50
-0.38
-0.27
0.25
-1.00 -0.50 0.00 0.50 1.00
Activity 4: Service Life
Discount Rate
Activity 6: Service Life
Activity 5: Service Life
Annual Average Daily Traffic
Correlation Coefficient
23063-21825A: User Cost
Figure E-8. Tornado Plot for 23063-21825A – User Cost.
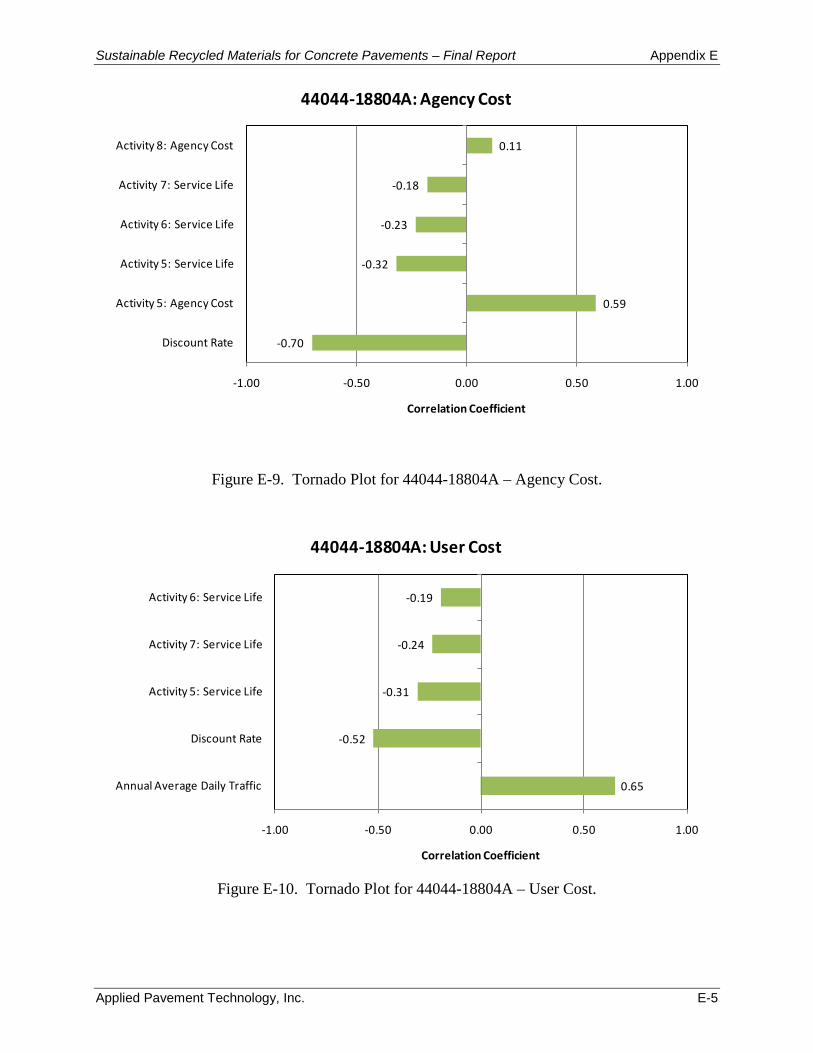
Sustainable Recycled Materials for Concrete Pavements – Final Report Appendix E
Applied Pavement Technology, Inc. E-5
-0.70
0.59
-0.32
-0.23
-0.18
0.11
-1.00 -0.50 0.00 0.50 1.00
Discount Rate
Activity 5: Agency Cost
Activity 5: Service Life
Activity 6: Service Life
Activity 7: Service Life
Activity 8: Agency Cost
Correlation Coefficient
44044-18804A: Agency Cost
Figure E-9. Tornado Plot for 44044-18804A – Agency Cost.
0.65
-0.52
-0.31
-0.24
-0.19
-1.00 -0.50 0.00 0.50 1.00
Annual Average Daily Traffic
Discount Rate
Activity 5: Service Life
Activity 7: Service Life
Activity 6: Service Life
Correlation Coefficient
44044-18804A: User Cost
Figure E-10. Tornado Plot for 44044-18804A – User Cost.
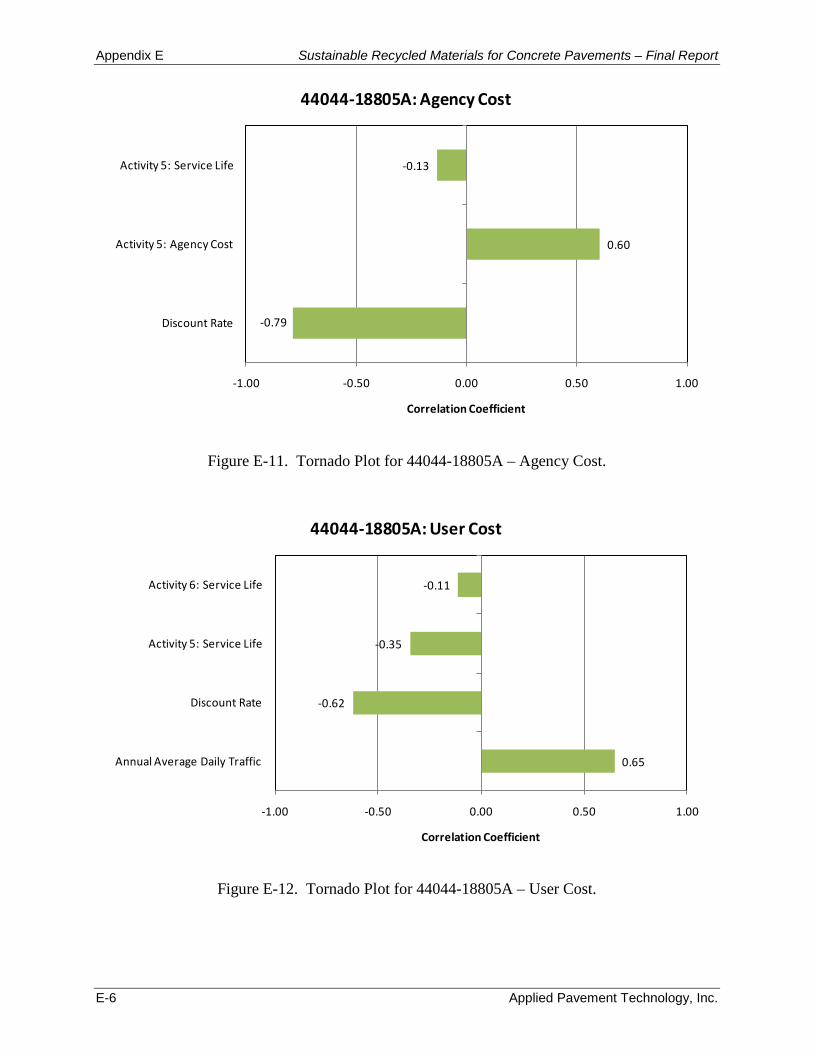
Appendix E Sustainable Recycled Materials for Concrete Pavements – Final Report
E-6 Applied Pavement Technology, Inc.
-0.79
0.60
-0.13
-1.00 -0.50 0.00 0.50 1.00
Discount Rate
Activity 5: Agency Cost
Activity 5: Service Life
Correlation Coefficient
44044-18805A: Agency Cost
Figure E-11. Tornado Plot for 44044-18805A – Agency Cost.
0.65
-0.62
-0.35
-0.11
-1.00 -0.50 0.00 0.50 1.00
Annual Average Daily Traffic
Discount Rate
Activity 5: Service Life
Activity 6: Service Life
Correlation Coefficient
44044-18805A: User Cost
Figure E-12. Tornado Plot for 44044-18805A – User Cost.
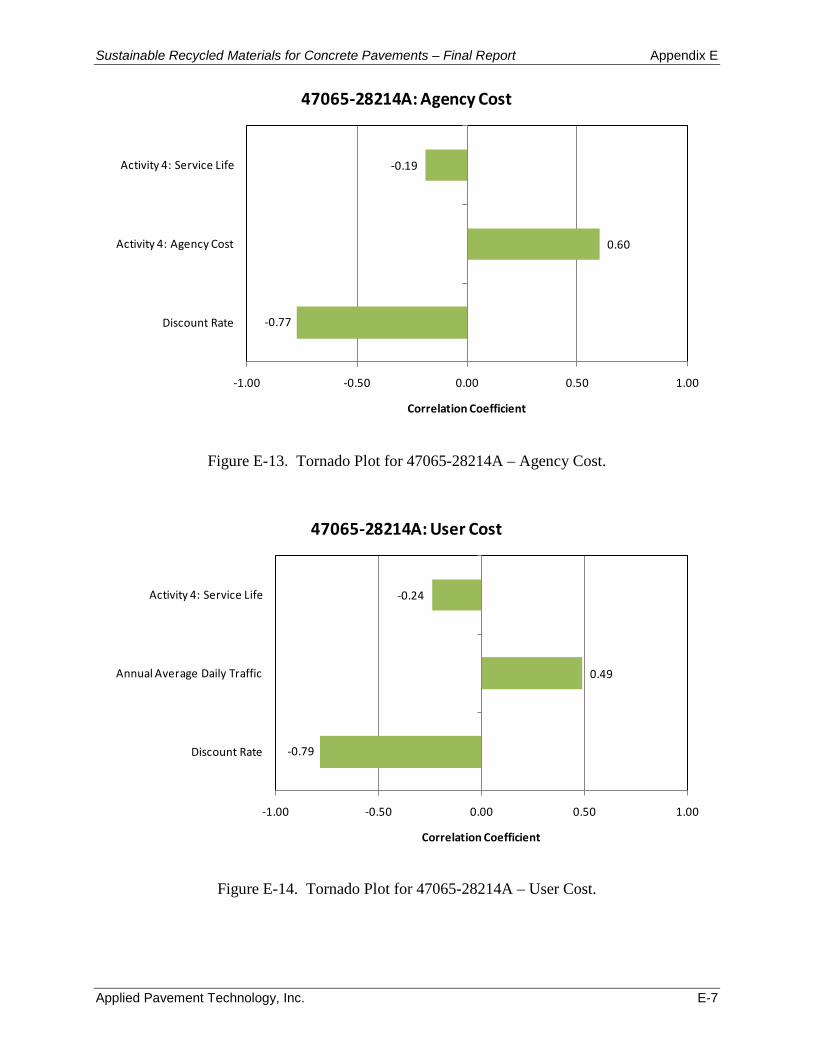
Sustainable Recycled Materials for Concrete Pavements – Final Report Appendix E
Applied Pavement Technology, Inc. E-7
-0.77
0.60
-0.19
-1.00 -0.50 0.00 0.50 1.00
Discount Rate
Activity 4: Agency Cost
Activity 4: Service Life
Correlation Coefficient
47065-28214A: Agency Cost
Figure E-13. Tornado Plot for 47065-28214A – Agency Cost.
-0.79
0.49
-0.24
-1.00 -0.50 0.00 0.50 1.00
Discount Rate
Annual Average Daily Traffic
Activity 4: Service Life
Correlation Coefficient
47065-28214A: User Cost
Figure E-14. Tornado Plot for 47065-28214A – User Cost.
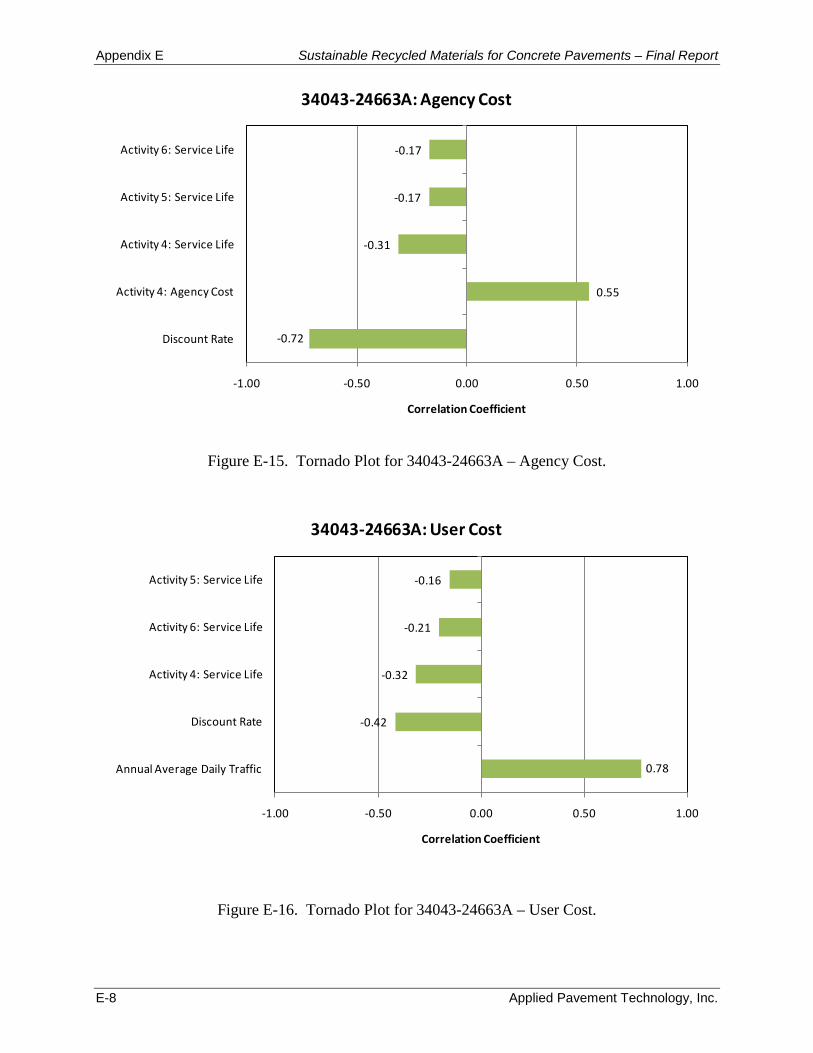
Appendix E Sustainable Recycled Materials for Concrete Pavements – Final Report
E-8 Applied Pavement Technology, Inc.
-0.72
0.55
-0.31
-0.17
-0.17
-1.00 -0.50 0.00 0.50 1.00
Discount Rate
Activity 4: Agency Cost
Activity 4: Service Life
Activity 5: Service Life
Activity 6: Service Life
Correlation Coefficient
34043-24663A: Agency Cost
Figure E-15. Tornado Plot for 34043-24663A – Agency Cost.
0.78
-0.42
-0.32
-0.21
-0.16
-1.00 -0.50 0.00 0.50 1.00
Annual Average Daily Traffic
Discount Rate
Activity 4: Service Life
Activity 6: Service Life
Activity 5: Service Life
Correlation Coefficient
34043-24663A: User Cost
Figure E-16. Tornado Plot for 34043-24663A – User Cost.
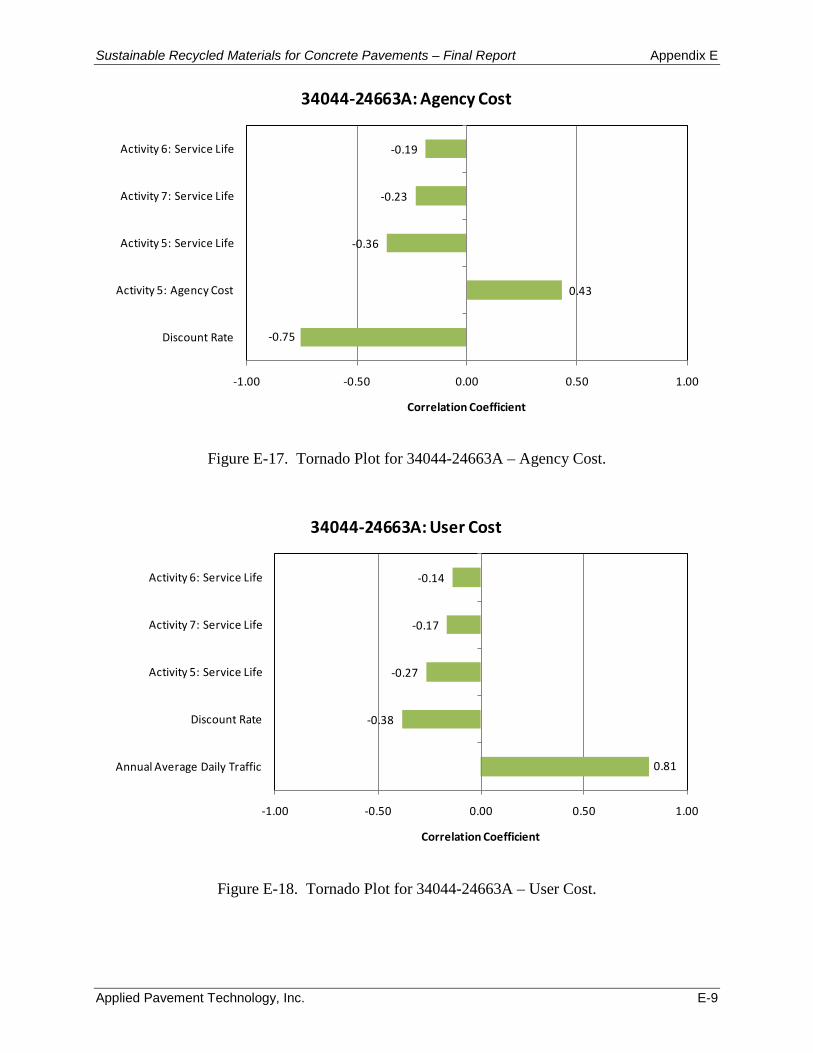
Sustainable Recycled Materials for Concrete Pavements – Final Report Appendix E
Applied Pavement Technology, Inc. E-9
-0.75
0.43
-0.36
-0.23
-0.19
-1.00 -0.50 0.00 0.50 1.00
Discount Rate
Activity 5: Agency Cost
Activity 5: Service Life
Activity 7: Service Life
Activity 6: Service Life
Correlation Coefficient
34044-24663A: Agency Cost
Figure E-17. Tornado Plot for 34044-24663A – Agency Cost.
0.81
-0.38
-0.27
-0.17
-0.14
-1.00 -0.50 0.00 0.50 1.00
Annual Average Daily Traffic
Discount Rate
Activity 5: Service Life
Activity 7: Service Life
Activity 6: Service Life
Correlation Coefficient
34044-24663A: User Cost
Figure E-18. Tornado Plot for 34044-24663A – User Cost.
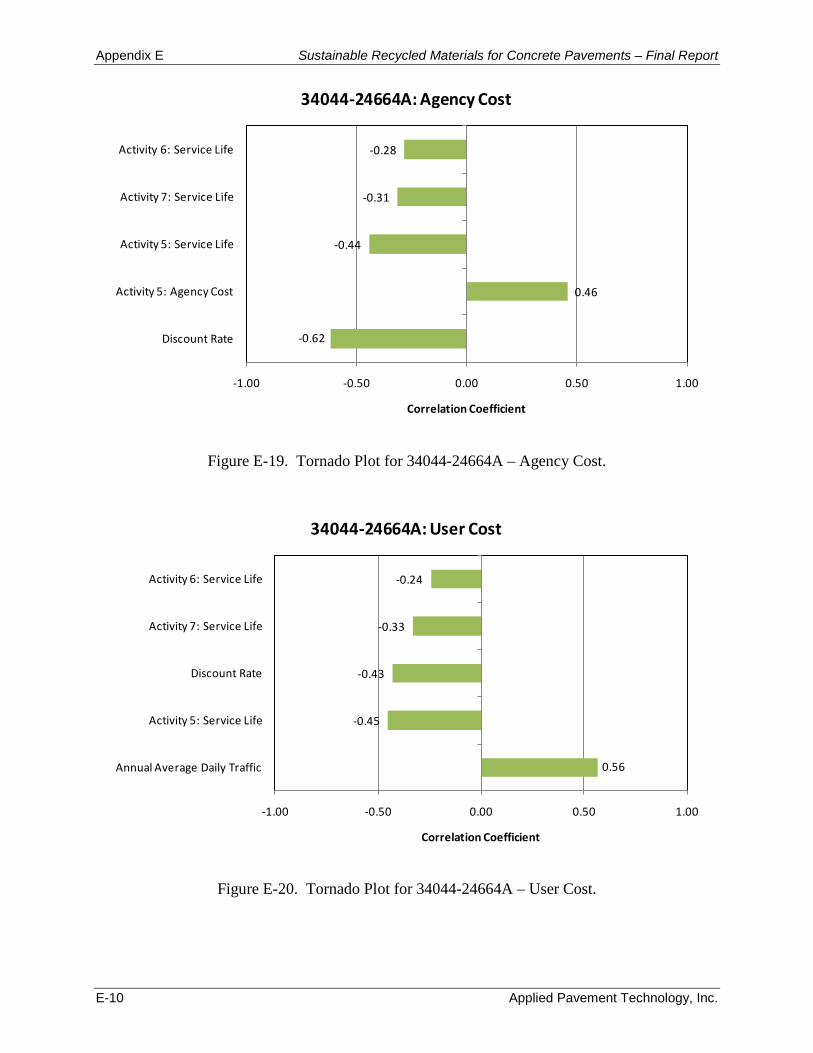
Appendix E Sustainable Recycled Materials for Concrete Pavements – Final Report
E-10 Applied Pavement Technology, Inc.
-0.62
0.46
-0.44
-0.31
-0.28
-1.00 -0.50 0.00 0.50 1.00
Discount Rate
Activity 5: Agency Cost
Activity 5: Service Life
Activity 7: Service Life
Activity 6: Service Life
Correlation Coefficient
34044-24664A: Agency Cost
Figure E-19. Tornado Plot for 34044-24664A – Agency Cost.
0.56
-0.45
-0.43
-0.33
-0.24
-1.00 -0.50 0.00 0.50 1.00
Annual Average Daily Traffic
Activity 5: Service Life
Discount Rate
Activity 7: Service Life
Activity 6: Service Life
Correlation Coefficient
34044-24664A: User Cost
Figure E-20. Tornado Plot for 34044-24664A – User Cost.
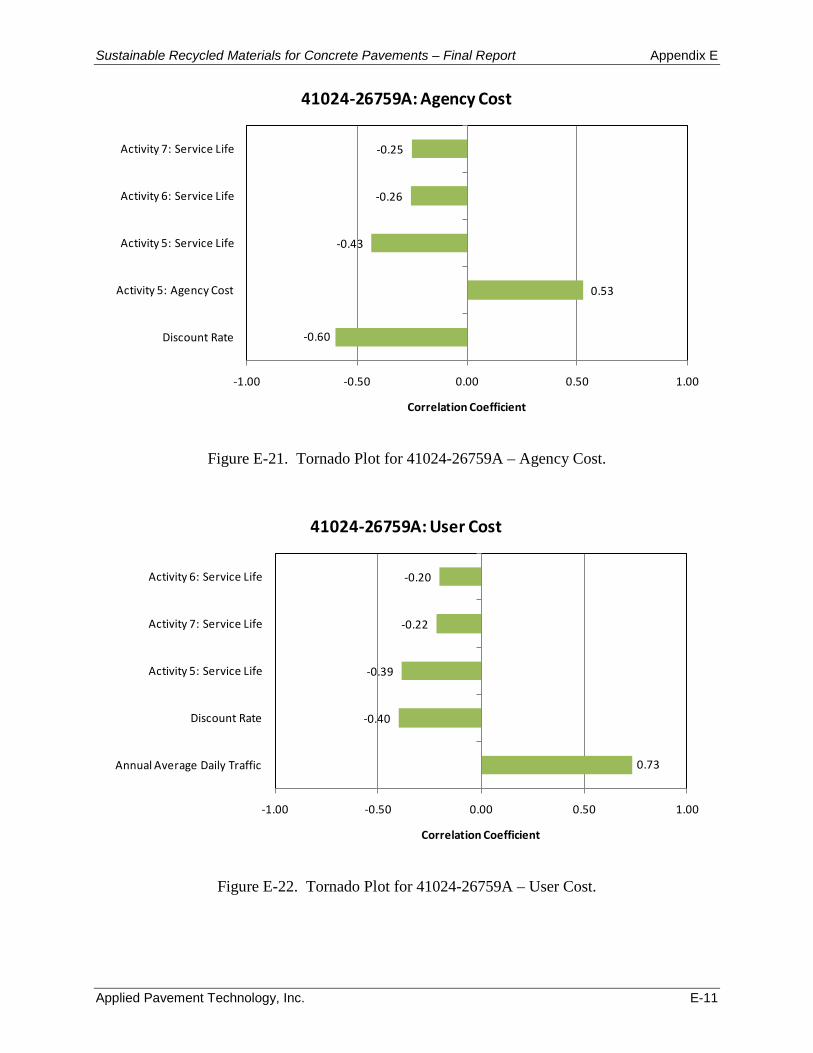
Sustainable Recycled Materials for Concrete Pavements – Final Report Appendix E
Applied Pavement Technology, Inc. E-11
-0.60
0.53
-0.43
-0.26
-0.25
-1.00 -0.50 0.00 0.50 1.00
Discount Rate
Activity 5: Agency Cost
Activity 5: Service Life
Activity 6: Service Life
Activity 7: Service Life
Correlation Coefficient
41024-26759A: Agency Cost
Figure E-21. Tornado Plot for 41024-26759A – Agency Cost.
0.73
-0.40
-0.39
-0.22
-0.20
-1.00 -0.50 0.00 0.50 1.00
Annual Average Daily Traffic
Discount Rate
Activity 5: Service Life
Activity 7: Service Life
Activity 6: Service Life
Correlation Coefficient
41024-26759A: User Cost
Figure E-22. Tornado Plot for 41024-26759A – User Cost.
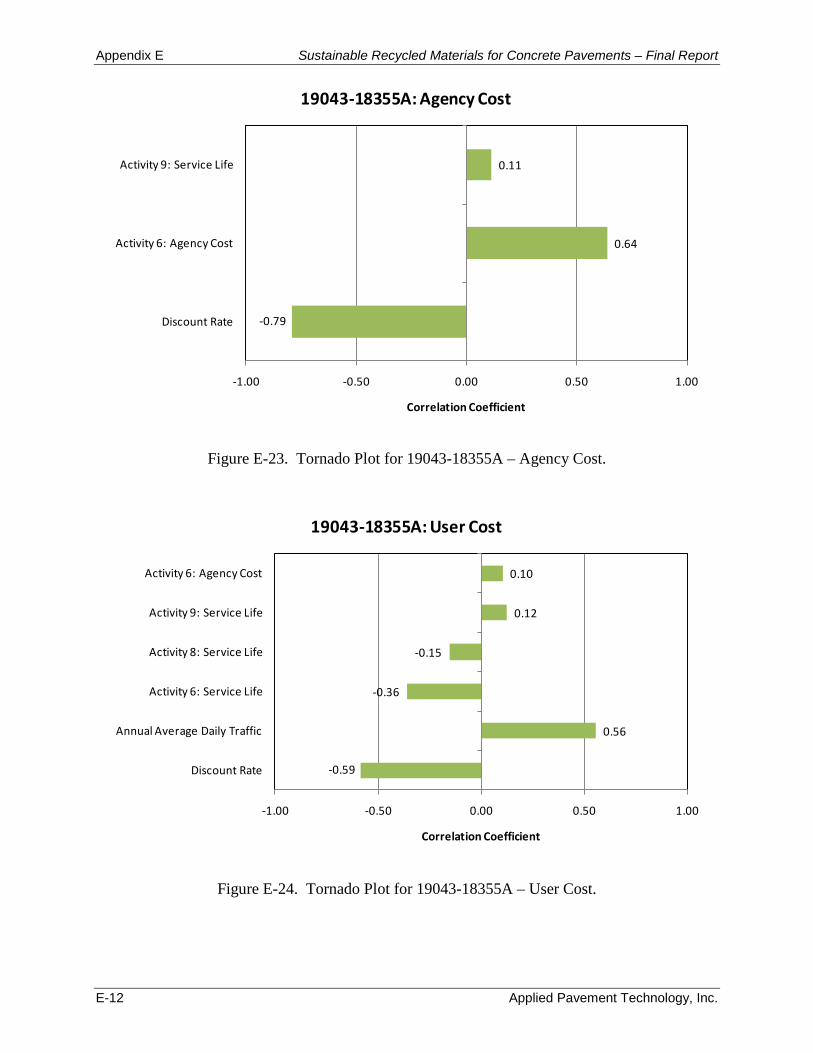
Appendix E Sustainable Recycled Materials for Concrete Pavements – Final Report
E-12 Applied Pavement Technology, Inc.
-0.79
0.64
0.11
-1.00 -0.50 0.00 0.50 1.00
Discount Rate
Activity 6: Agency Cost
Activity 9: Service Life
Correlation Coefficient
19043-18355A: Agency Cost
Figure E-23. Tornado Plot for 19043-18355A – Agency Cost.
-0.59
0.56
-0.36
-0.15
0.12
0.10
-1.00 -0.50 0.00 0.50 1.00
Discount Rate
Annual Average Daily Traffic
Activity 6: Service Life
Activity 8: Service Life
Activity 9: Service Life
Activity 6: Agency Cost
Correlation Coefficient
19043-18355A: User Cost
Figure E-24. Tornado Plot for 19043-18355A – User Cost.
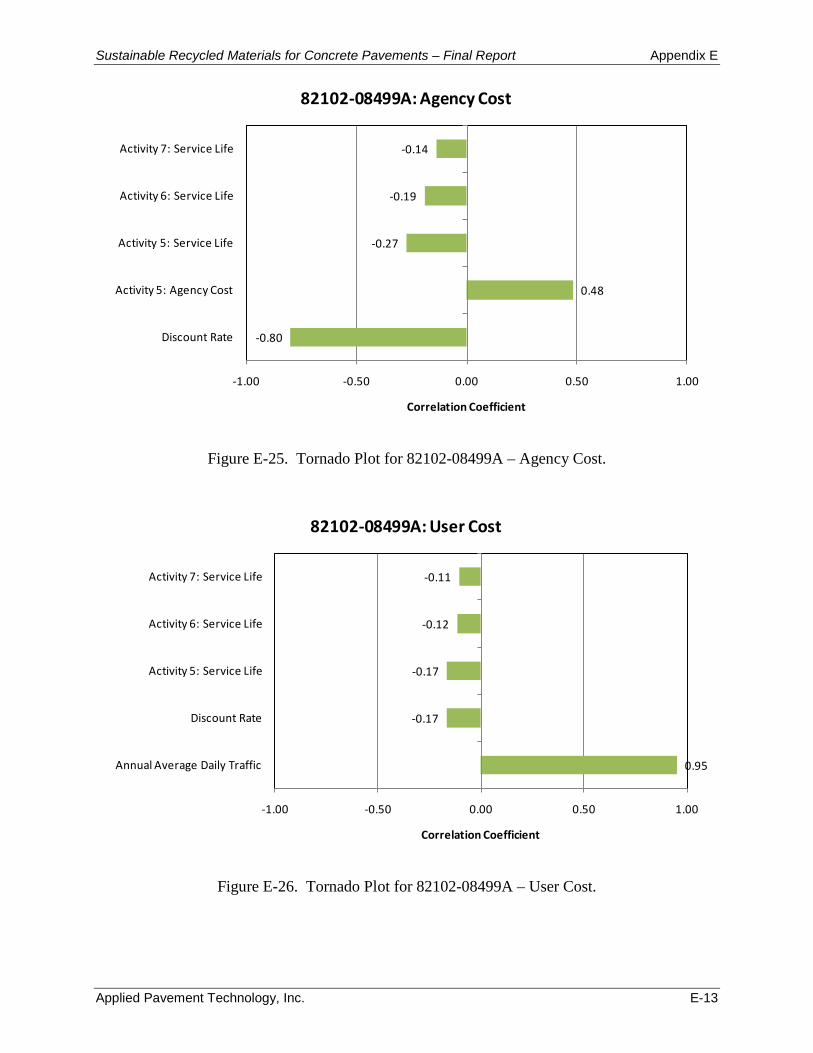
Sustainable Recycled Materials for Concrete Pavements – Final Report Appendix E
Applied Pavement Technology, Inc. E-13
-0.80
0.48
-0.27
-0.19
-0.14
-1.00 -0.50 0.00 0.50 1.00
Discount Rate
Activity 5: Agency Cost
Activity 5: Service Life
Activity 6: Service Life
Activity 7: Service Life
Correlation Coefficient
82102-08499A: Agency Cost
Figure E-25. Tornado Plot for 82102-08499A – Agency Cost.
0.95
-0.17
-0.17
-0.12
-0.11
-1.00 -0.50 0.00 0.50 1.00
Annual Average Daily Traffic
Discount Rate
Activity 5: Service Life
Activity 6: Service Life
Activity 7: Service Life
Correlation Coefficient
82102-08499A: User Cost
Figure E-26. Tornado Plot for 82102-08499A – User Cost.
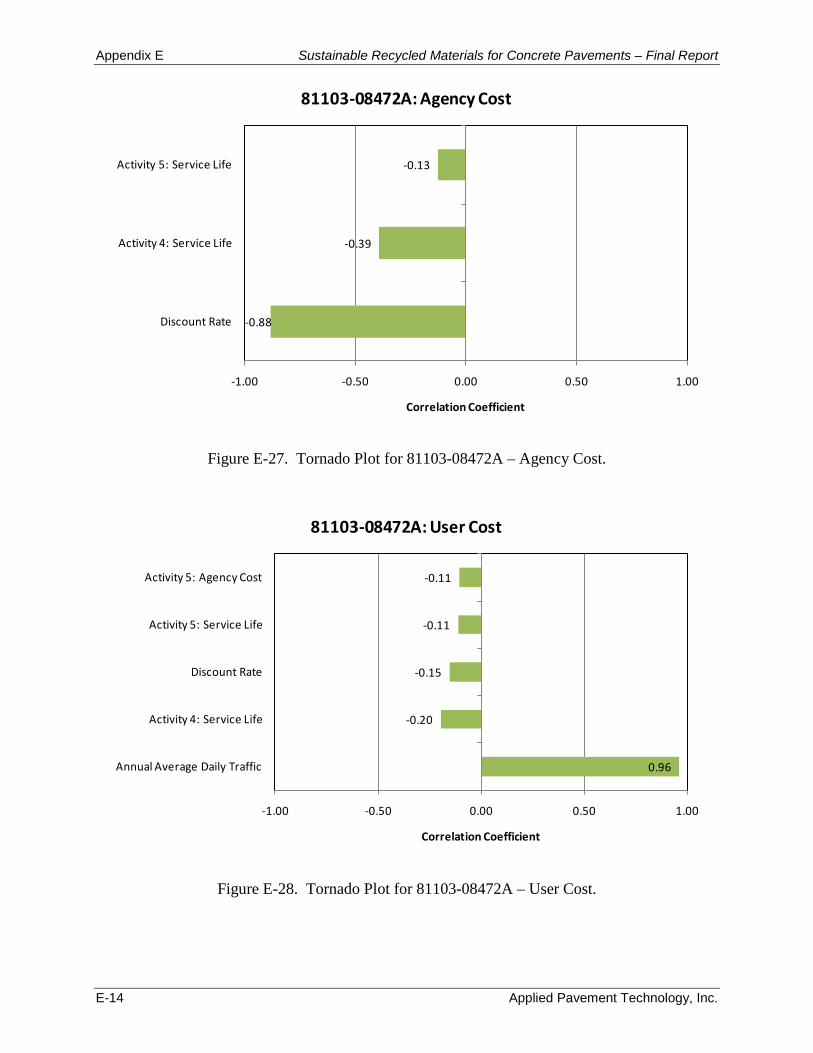
Appendix E Sustainable Recycled Materials for Concrete Pavements – Final Report
E-14 Applied Pavement Technology, Inc.
-0.88
-0.39
-0.13
-1.00 -0.50 0.00 0.50 1.00
Discount Rate
Activity 4: Service Life
Activity 5: Service Life
Correlation Coefficient
81103-08472A: Agency Cost
Figure E-27. Tornado Plot for 81103-08472A – Agency Cost.
0.96
-0.20
-0.15
-0.11
-0.11
-1.00 -0.50 0.00 0.50 1.00
Annual Average Daily Traffic
Activity 4: Service Life
Discount Rate
Activity 5: Service Life
Activity 5: Agency Cost
Correlation Coefficient
81103-08472A: User Cost
Figure E-28. Tornado Plot for 81103-08472A – User Cost.
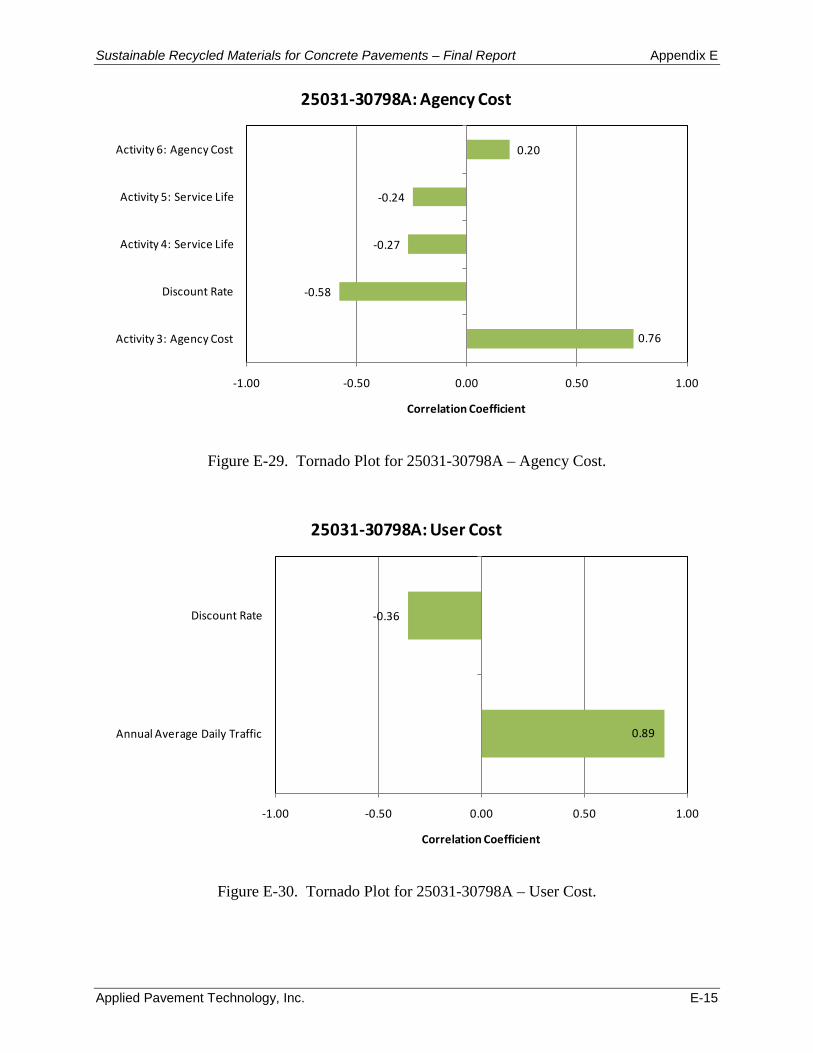
Sustainable Recycled Materials for Concrete Pavements – Final Report Appendix E
Applied Pavement Technology, Inc. E-15
0.76
-0.58
-0.27
-0.24
0.20
-1.00 -0.50 0.00 0.50 1.00
Activity 3: Agency Cost
Discount Rate
Activity 4: Service Life
Activity 5: Service Life
Activity 6: Agency Cost
Correlation Coefficient
25031-30798A: Agency Cost
Figure E-29. Tornado Plot for 25031-30798A – Agency Cost.
0.89
-0.36
-1.00 -0.50 0.00 0.50 1.00
Annual Average Daily Traffic
Discount Rate
Correlation Coefficient
25031-30798A: User Cost
Figure E-30. Tornado Plot for 25031-30798A – User Cost.
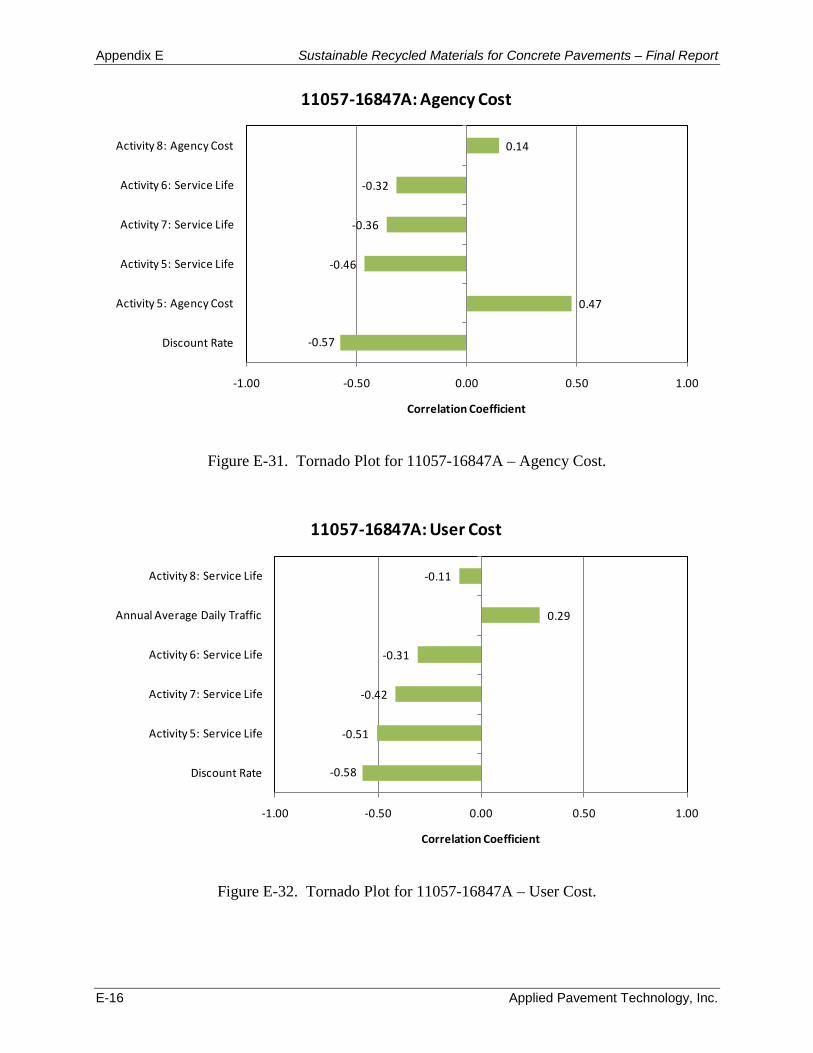
Appendix E Sustainable Recycled Materials for Concrete Pavements – Final Report
E-16 Applied Pavement Technology, Inc.
-0.57
0.47
-0.46
-0.36
-0.32
0.14
-1.00 -0.50 0.00 0.50 1.00
Discount Rate
Activity 5: Agency Cost
Activity 5: Service Life
Activity 7: Service Life
Activity 6: Service Life
Activity 8: Agency Cost
Correlation Coefficient
11057-16847A: Agency Cost
Figure E-31. Tornado Plot for 11057-16847A – Agency Cost.
-0.58
-0.51
-0.42
-0.31
0.29
-0.11
-1.00 -0.50 0.00 0.50 1.00
Discount Rate
Activity 5: Service Life
Activity 7: Service Life
Activity 6: Service Life
Annual Average Daily Traffic
Activity 8: Service Life
Correlation Coefficient
11057-16847A: User Cost
Figure E-32. Tornado Plot for 11057-16847A – User Cost.
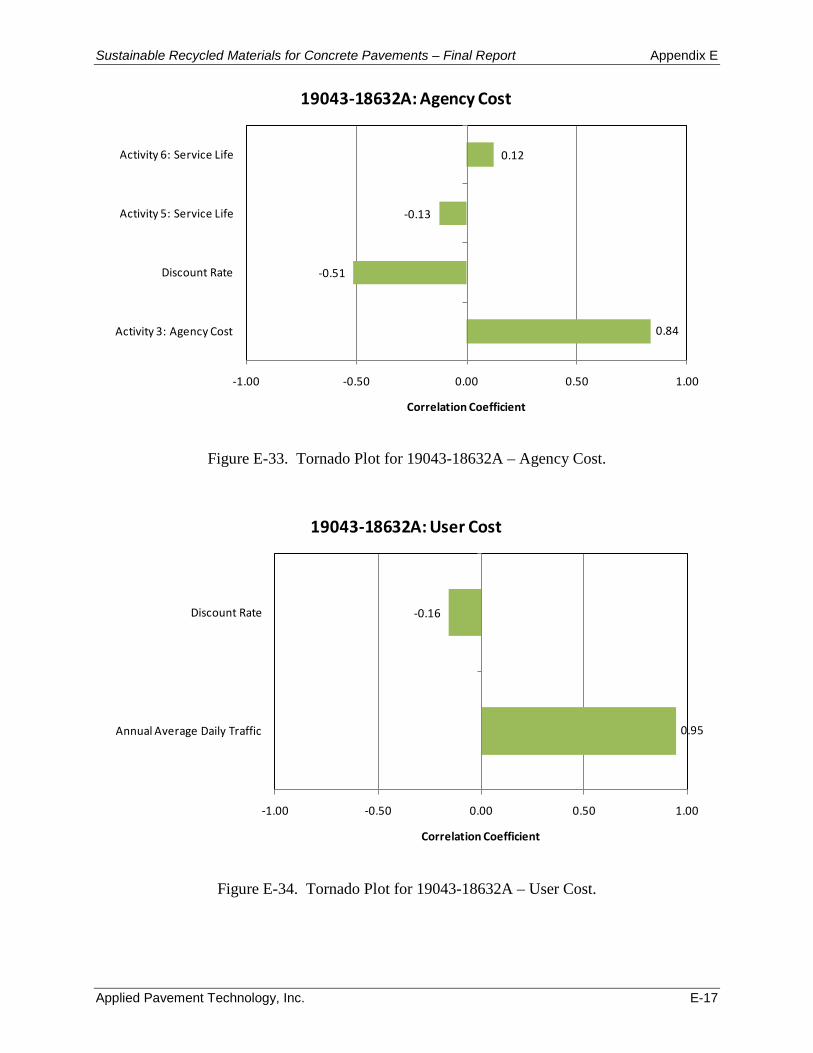
Sustainable Recycled Materials for Concrete Pavements – Final Report Appendix E
Applied Pavement Technology, Inc. E-17
0.84
-0.51
-0.13
0.12
-1.00 -0.50 0.00 0.50 1.00
Activity 3: Agency Cost
Discount Rate
Activity 5: Service Life
Activity 6: Service Life
Correlation Coefficient
19043-18632A: Agency Cost
Figure E-33. Tornado Plot for 19043-18632A – Agency Cost.
0.95
-0.16
-1.00 -0.50 0.00 0.50 1.00
Annual Average Daily Traffic
Discount Rate
Correlation Coefficient
19043-18632A: User Cost
Figure E-34. Tornado Plot for 19043-18632A – User Cost.
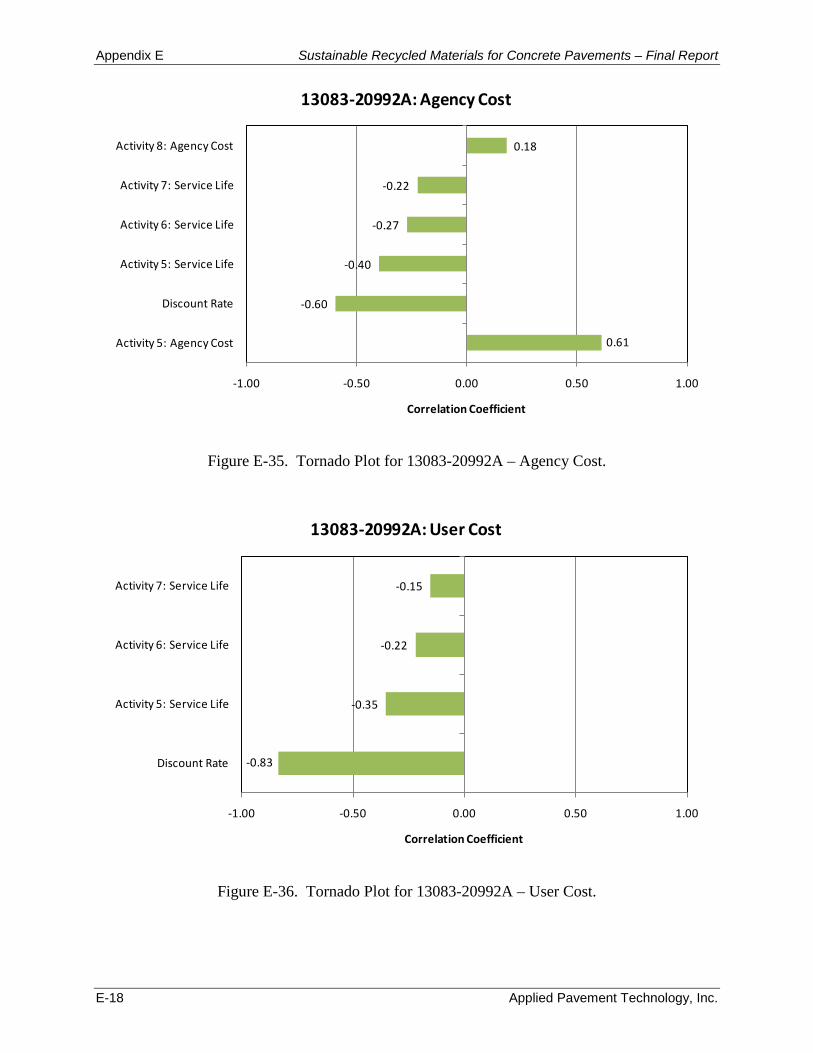
Appendix E Sustainable Recycled Materials for Concrete Pavements – Final Report
E-18 Applied Pavement Technology, Inc.
0.61
-0.60
-0.40
-0.27
-0.22
0.18
-1.00 -0.50 0.00 0.50 1.00
Activity 5: Agency Cost
Discount Rate
Activity 5: Service Life
Activity 6: Service Life
Activity 7: Service Life
Activity 8: Agency Cost
Correlation Coefficient
13083-20992A: Agency Cost
Figure E-35. Tornado Plot for 13083-20992A – Agency Cost.
-0.83
-0.35
-0.22
-0.15
-1.00 -0.50 0.00 0.50 1.00
Discount Rate
Activity 5: Service Life
Activity 6: Service Life
Activity 7: Service Life
Correlation Coefficient
13083-20992A: User Cost
Figure E-36. Tornado Plot for 13083-20992A – User Cost.
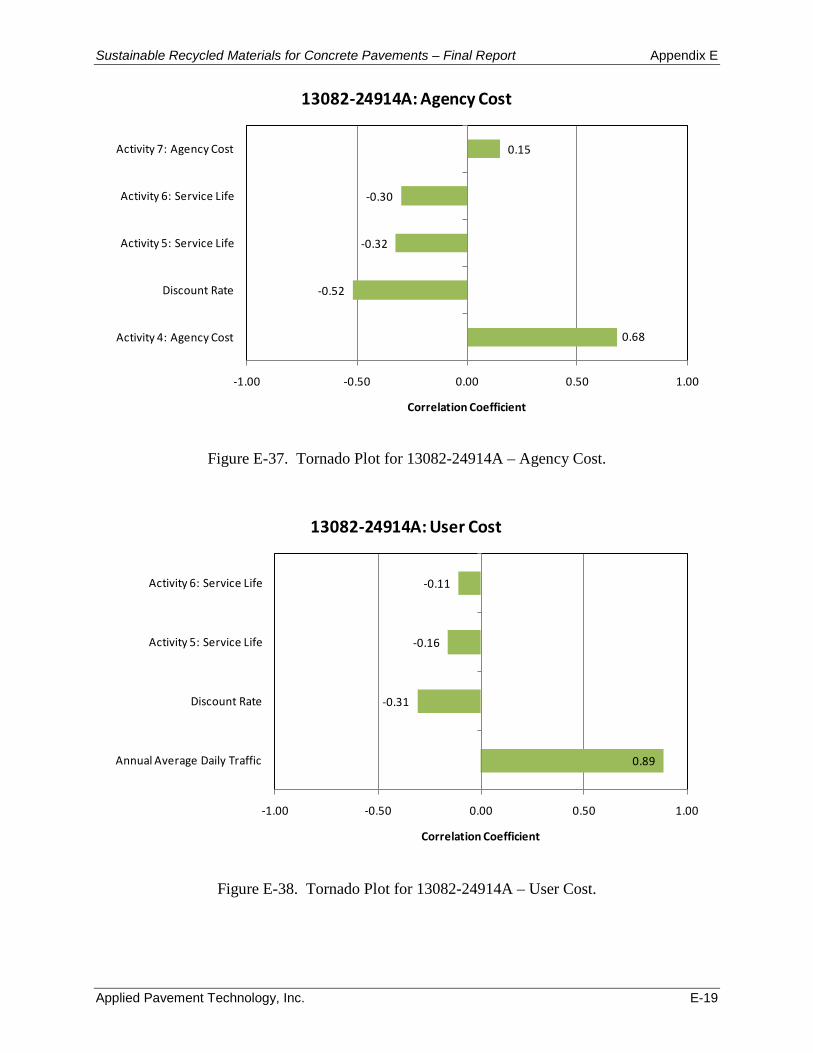
Sustainable Recycled Materials for Concrete Pavements – Final Report Appendix E
Applied Pavement Technology, Inc. E-19
0.68
-0.52
-0.32
-0.30
0.15
-1.00 -0.50 0.00 0.50 1.00
Activity 4: Agency Cost
Discount Rate
Activity 5: Service Life
Activity 6: Service Life
Activity 7: Agency Cost
Correlation Coefficient
13082-24914A: Agency Cost
Figure E-37. Tornado Plot for 13082-24914A – Agency Cost.
0.89
-0.31
-0.16
-0.11
-1.00 -0.50 0.00 0.50 1.00
Annual Average Daily Traffic
Discount Rate
Activity 5: Service Life
Activity 6: Service Life
Correlation Coefficient
13082-24914A: User Cost
Figure E-38. Tornado Plot for 13082-24914A – User Cost.
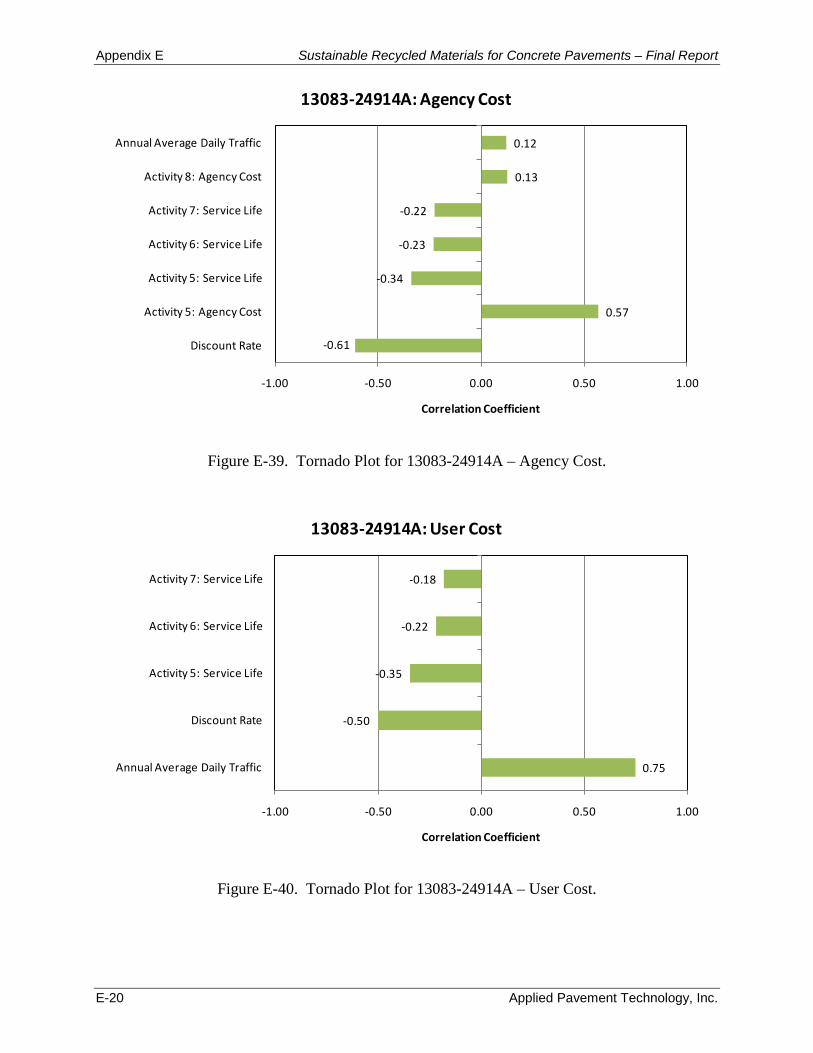
Appendix E Sustainable Recycled Materials for Concrete Pavements – Final Report
E-20 Applied Pavement Technology, Inc.
-0.61
0.57
-0.34
-0.23
-0.22
0.13
0.12
-1.00 -0.50 0.00 0.50 1.00
Discount Rate
Activity 5: Agency Cost
Activity 5: Service Life
Activity 6: Service Life
Activity 7: Service Life
Activity 8: Agency Cost
Annual Average Daily Traffic
Correlation Coefficient
13083-24914A: Agency Cost
Figure E-39. Tornado Plot for 13083-24914A – Agency Cost.
0.75
-0.50
-0.35
-0.22
-0.18
-1.00 -0.50 0.00 0.50 1.00
Annual Average Daily Traffic
Discount Rate
Activity 5: Service Life
Activity 6: Service Life
Activity 7: Service Life
Correlation Coefficient
13083-24914A: User Cost
Figure E-40. Tornado Plot for 13083-24914A – User Cost.
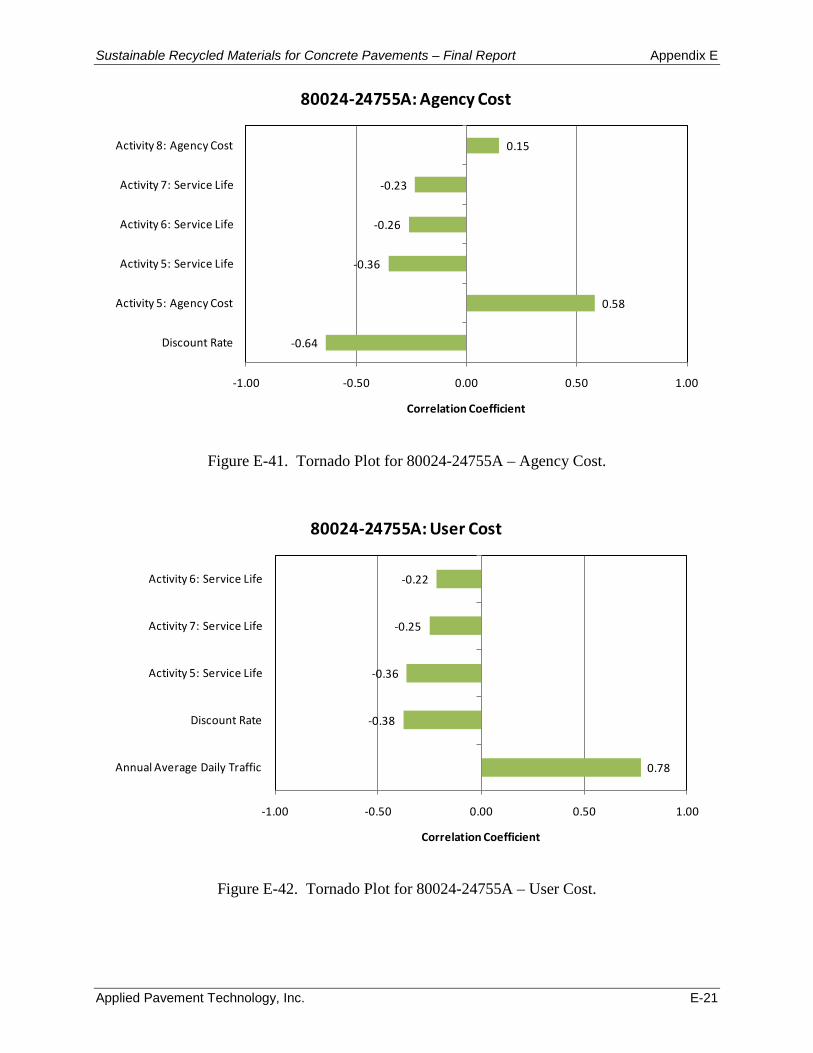
Sustainable Recycled Materials for Concrete Pavements – Final Report Appendix E
Applied Pavement Technology, Inc. E-21
-0.64
0.58
-0.36
-0.26
-0.23
0.15
-1.00 -0.50 0.00 0.50 1.00
Discount Rate
Activity 5: Agency Cost
Activity 5: Service Life
Activity 6: Service Life
Activity 7: Service Life
Activity 8: Agency Cost
Correlation Coefficient
80024-24755A: Agency Cost
Figure E-41. Tornado Plot for 80024-24755A – Agency Cost.
0.78
-0.38
-0.36
-0.25
-0.22
-1.00 -0.50 0.00 0.50 1.00
Annual Average Daily Traffic
Discount Rate
Activity 5: Service Life
Activity 7: Service Life
Activity 6: Service Life
Correlation Coefficient
80024-24755A: User Cost
Figure E-42. Tornado Plot for 80024-24755A – User Cost.
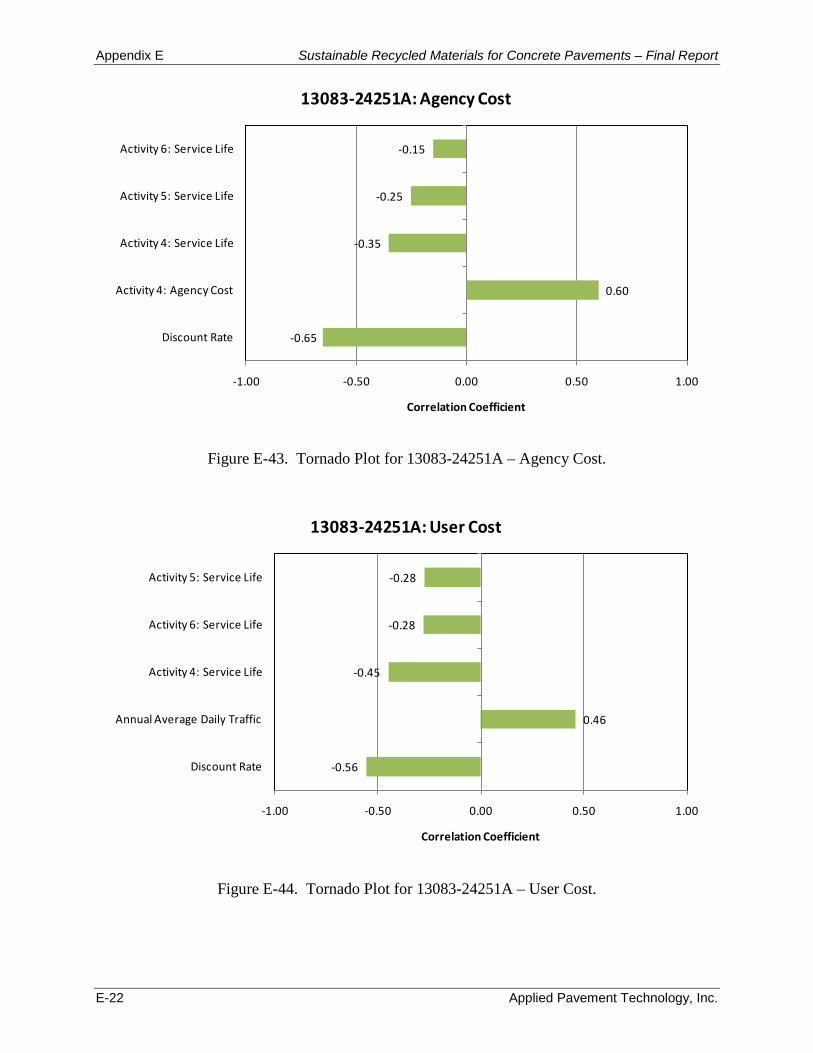
Appendix E Sustainable Recycled Materials for Concrete Pavements – Final Report
E-22 Applied Pavement Technology, Inc.
-0.65
0.60
-0.35
-0.25
-0.15
-1.00 -0.50 0.00 0.50 1.00
Discount Rate
Activity 4: Agency Cost
Activity 4: Service Life
Activity 5: Service Life
Activity 6: Service Life
Correlation Coefficient
13083-24251A: Agency Cost
Figure E-43. Tornado Plot for 13083-24251A – Agency Cost.
-0.56
0.46
-0.45
-0.28
-0.28
-1.00 -0.50 0.00 0.50 1.00
Discount Rate
Annual Average Daily Traffic
Activity 4: Service Life
Activity 6: Service Life
Activity 5: Service Life
Correlation Coefficient
13083-24251A: User Cost
Figure E-44. Tornado Plot for 13083-24251A – User Cost.
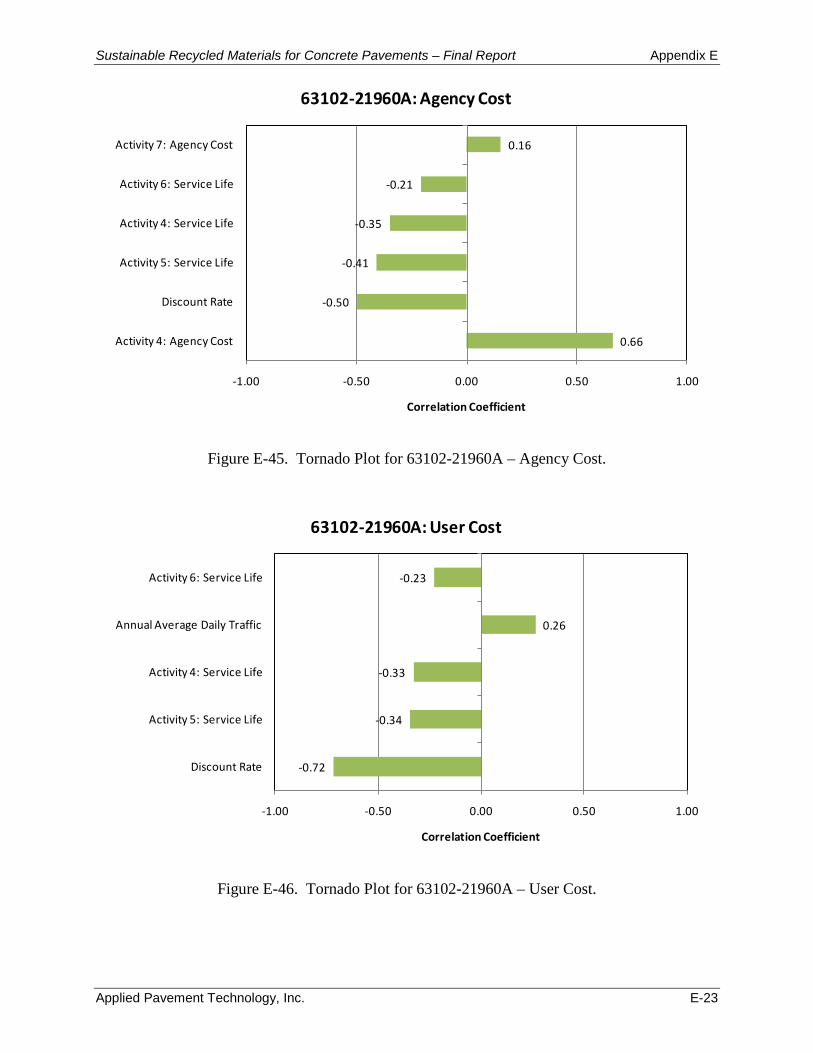
Sustainable Recycled Materials for Concrete Pavements – Final Report Appendix E
Applied Pavement Technology, Inc. E-23
0.66
-0.50
-0.41
-0.35
-0.21
0.16
-1.00 -0.50 0.00 0.50 1.00
Activity 4: Agency Cost
Discount Rate
Activity 5: Service Life
Activity 4: Service Life
Activity 6: Service Life
Activity 7: Agency Cost
Correlation Coefficient
63102-21960A: Agency Cost
Figure E-45. Tornado Plot for 63102-21960A – Agency Cost.
-0.72
-0.34
-0.33
0.26
-0.23
-1.00 -0.50 0.00 0.50 1.00
Discount Rate
Activity 5: Service Life
Activity 4: Service Life
Annual Average Daily Traffic
Activity 6: Service Life
Correlation Coefficient
63102-21960A: User Cost
Figure E-46. Tornado Plot for 63102-21960A – User Cost.
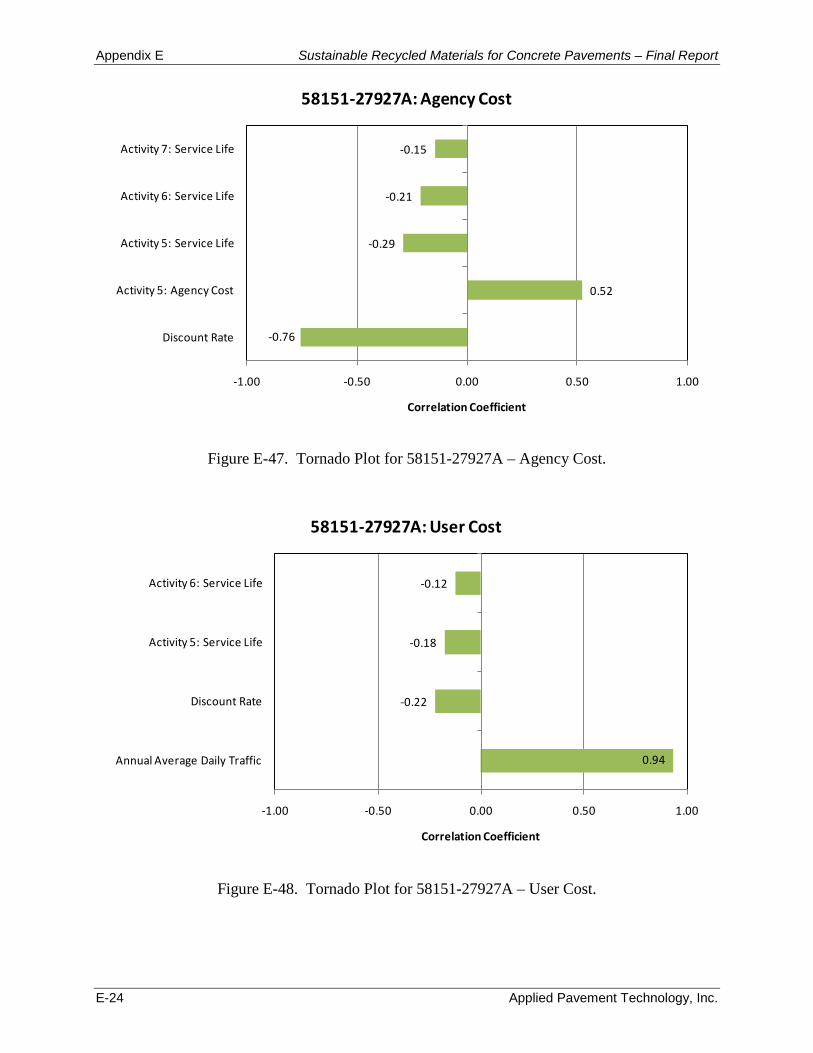
Appendix E Sustainable Recycled Materials for Concrete Pavements – Final Report
E-24 Applied Pavement Technology, Inc.
-0.76
0.52
-0.29
-0.21
-0.15
-1.00 -0.50 0.00 0.50 1.00
Discount Rate
Activity 5: Agency Cost
Activity 5: Service Life
Activity 6: Service Life
Activity 7: Service Life
Correlation Coefficient
58151-27927A: Agency Cost
Figure E-47. Tornado Plot for 58151-27927A – Agency Cost.
0.94
-0.22
-0.18
-0.12
-1.00 -0.50 0.00 0.50 1.00
Annual Average Daily Traffic
Discount Rate
Activity 5: Service Life
Activity 6: Service Life
Correlation Coefficient
58151-27927A: User Cost
Figure E-48. Tornado Plot for 58151-27927A – User Cost.
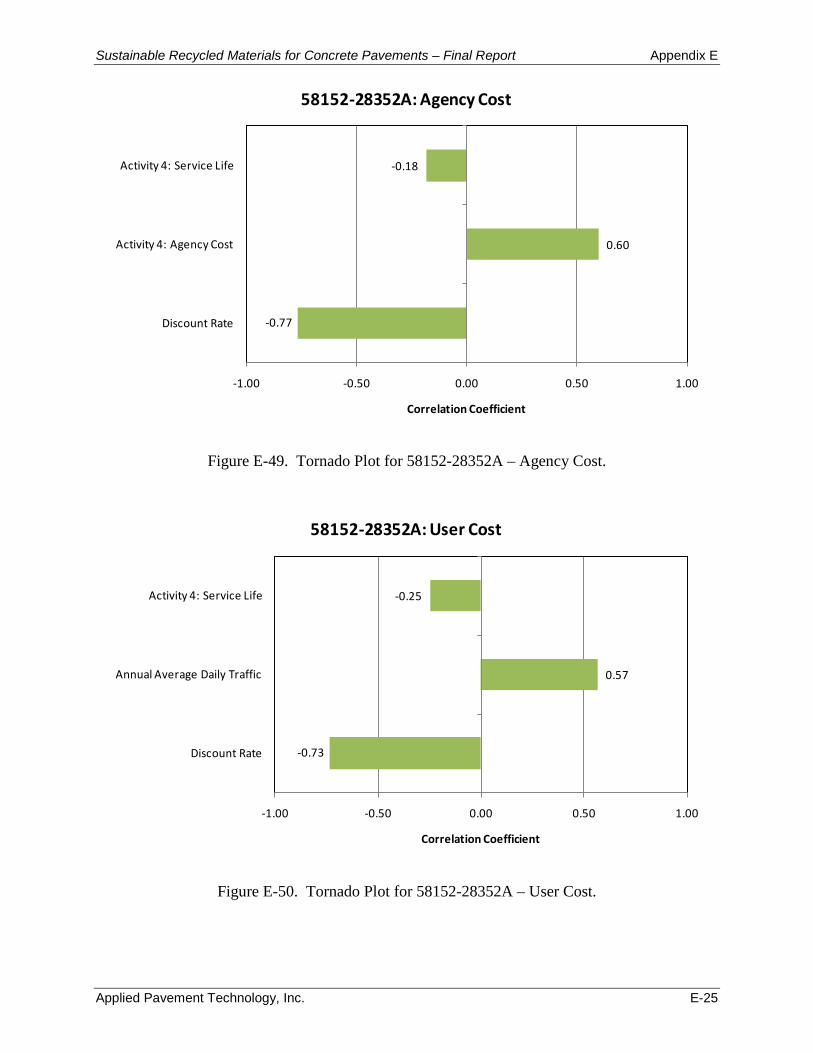
Sustainable Recycled Materials for Concrete Pavements – Final Report Appendix E
Applied Pavement Technology, Inc. E-25
-0.77
0.60
-0.18
-1.00 -0.50 0.00 0.50 1.00
Discount Rate
Activity 4: Agency Cost
Activity 4: Service Life
Correlation Coefficient
58152-28352A: Agency Cost
Figure E-49. Tornado Plot for 58152-28352A – Agency Cost.
-0.73
0.57
-0.25
-1.00 -0.50 0.00 0.50 1.00
Discount Rate
Annual Average Daily Traffic
Activity 4: Service Life
Correlation Coefficient
58152-28352A: User Cost
Figure E-50. Tornado Plot for 58152-28352A – User Cost.
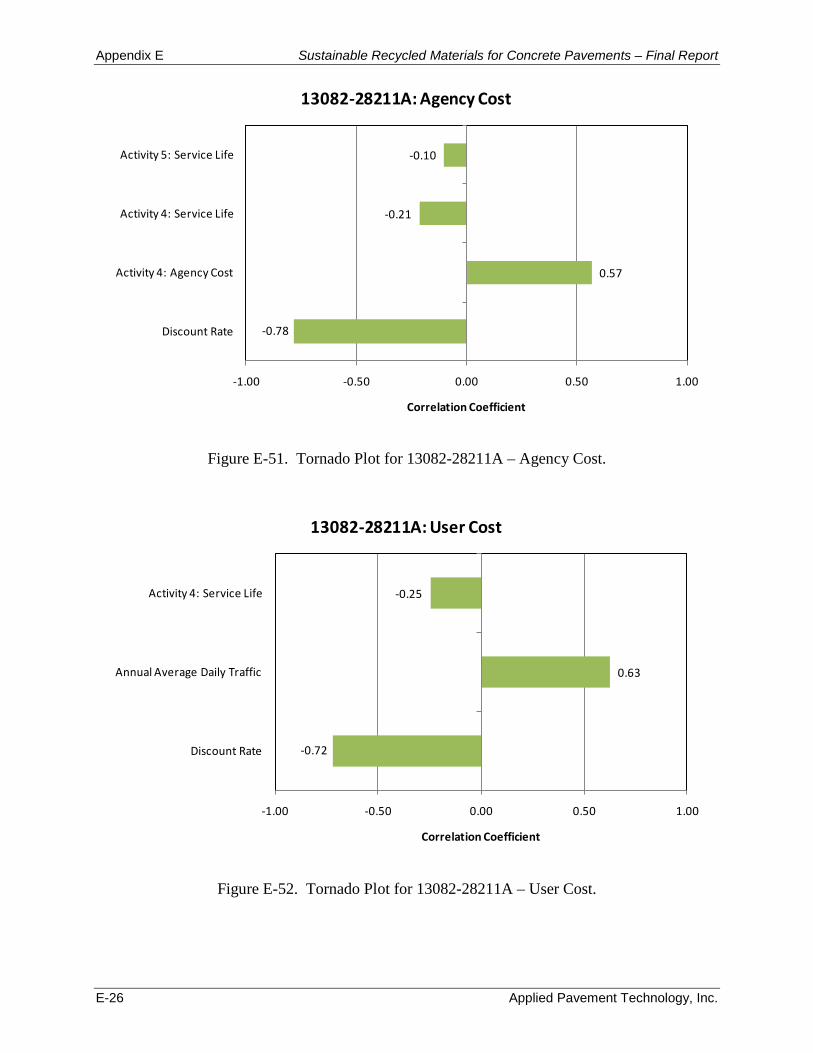
Appendix E Sustainable Recycled Materials for Concrete Pavements – Final Report
E-26 Applied Pavement Technology, Inc.
-0.78
0.57
-0.21
-0.10
-1.00 -0.50 0.00 0.50 1.00
Discount Rate
Activity 4: Agency Cost
Activity 4: Service Life
Activity 5: Service Life
Correlation Coefficient
13082-28211A: Agency Cost
Figure E-51. Tornado Plot for 13082-28211A – Agency Cost.
-0.72
0.63
-0.25
-1.00 -0.50 0.00 0.50 1.00
Discount Rate
Annual Average Daily Traffic
Activity 4: Service Life
Correlation Coefficient
13082-28211A: User Cost
Figure E-52. Tornado Plot for 13082-28211A – User Cost.
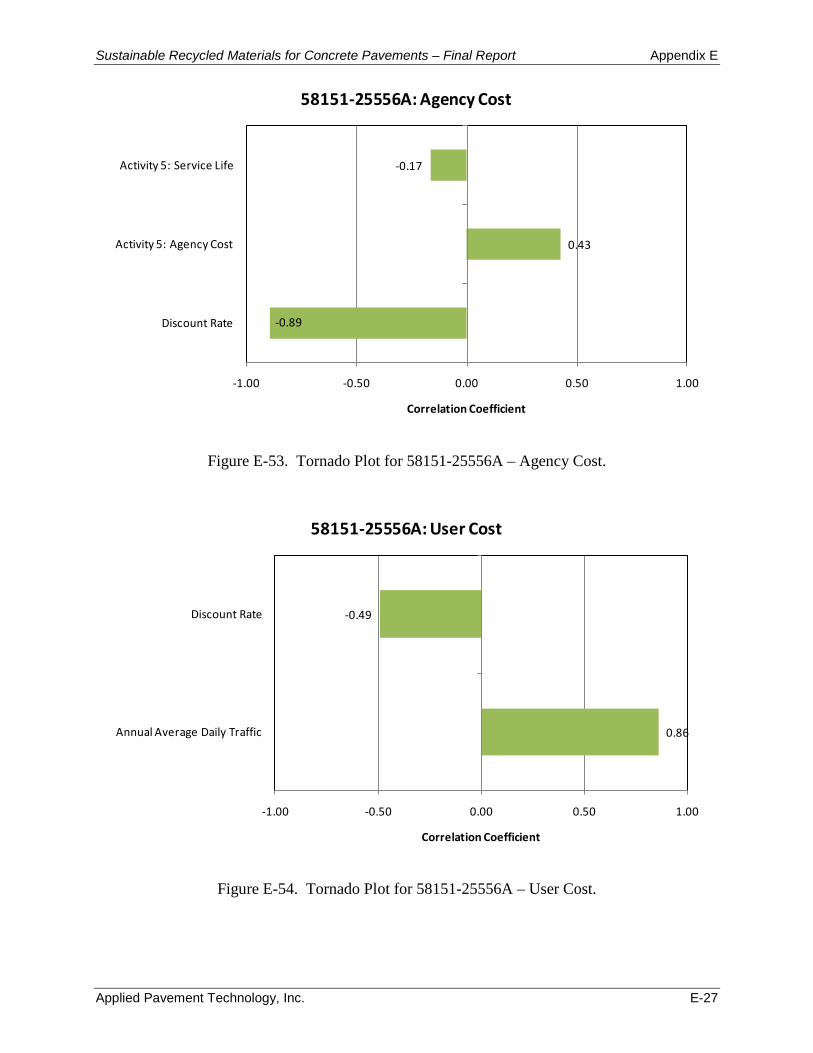
Sustainable Recycled Materials for Concrete Pavements – Final Report Appendix E
Applied Pavement Technology, Inc. E-27
-0.89
0.43
-0.17
-1.00 -0.50 0.00 0.50 1.00
Discount Rate
Activity 5: Agency Cost
Activity 5: Service Life
Correlation Coefficient
58151-25556A: Agency Cost
Figure E-53. Tornado Plot for 58151-25556A – Agency Cost.
0.86
-0.49
-1.00 -0.50 0.00 0.50 1.00
Annual Average Daily Traffic
Discount Rate
Correlation Coefficient
58151-25556A: User Cost
Figure E-54. Tornado Plot for 58151-25556A – User Cost.
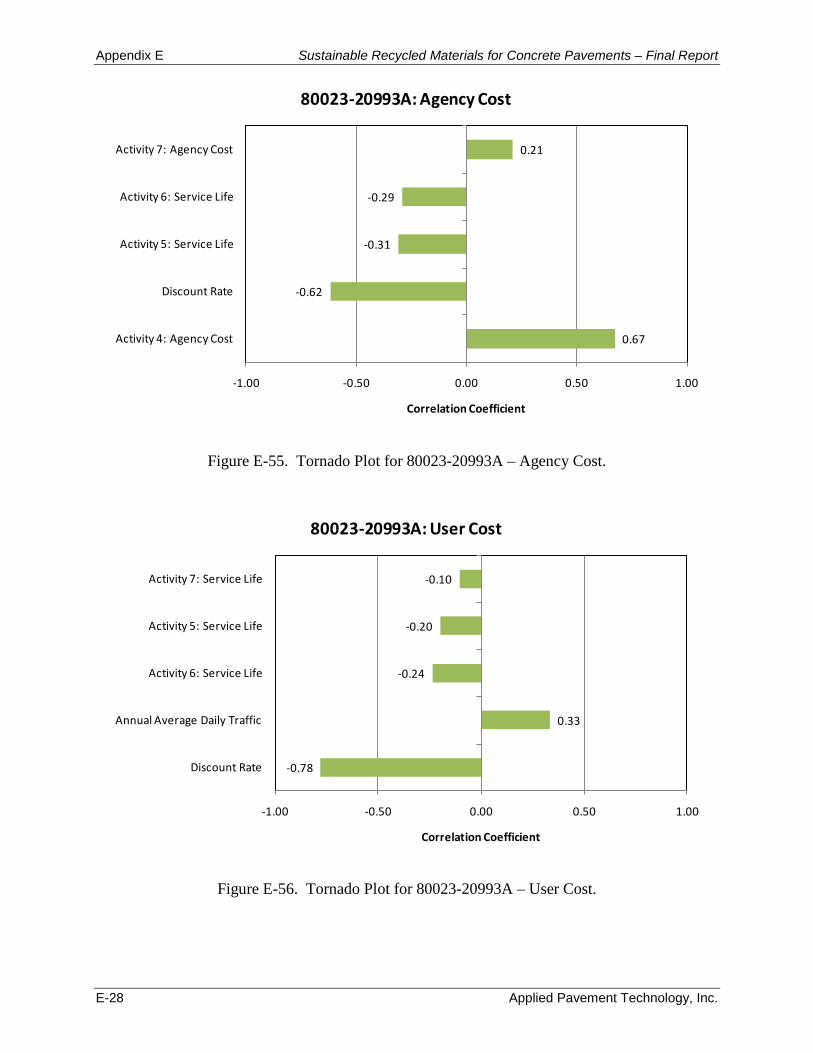
Appendix E Sustainable Recycled Materials for Concrete Pavements – Final Report
E-28 Applied Pavement Technology, Inc.
0.67
-0.62
-0.31
-0.29
0.21
-1.00 -0.50 0.00 0.50 1.00
Activity 4: Agency Cost
Discount Rate
Activity 5: Service Life
Activity 6: Service Life
Activity 7: Agency Cost
Correlation Coefficient
80023-20993A: Agency Cost
Figure E-55. Tornado Plot for 80023-20993A – Agency Cost.
-0.78
0.33
-0.24
-0.20
-0.10
-1.00 -0.50 0.00 0.50 1.00
Discount Rate
Annual Average Daily Traffic
Activity 6: Service Life
Activity 5: Service Life
Activity 7: Service Life
Correlation Coefficient
80023-20993A: User Cost
Figure E-56. Tornado Plot for 80023-20993A – User Cost.
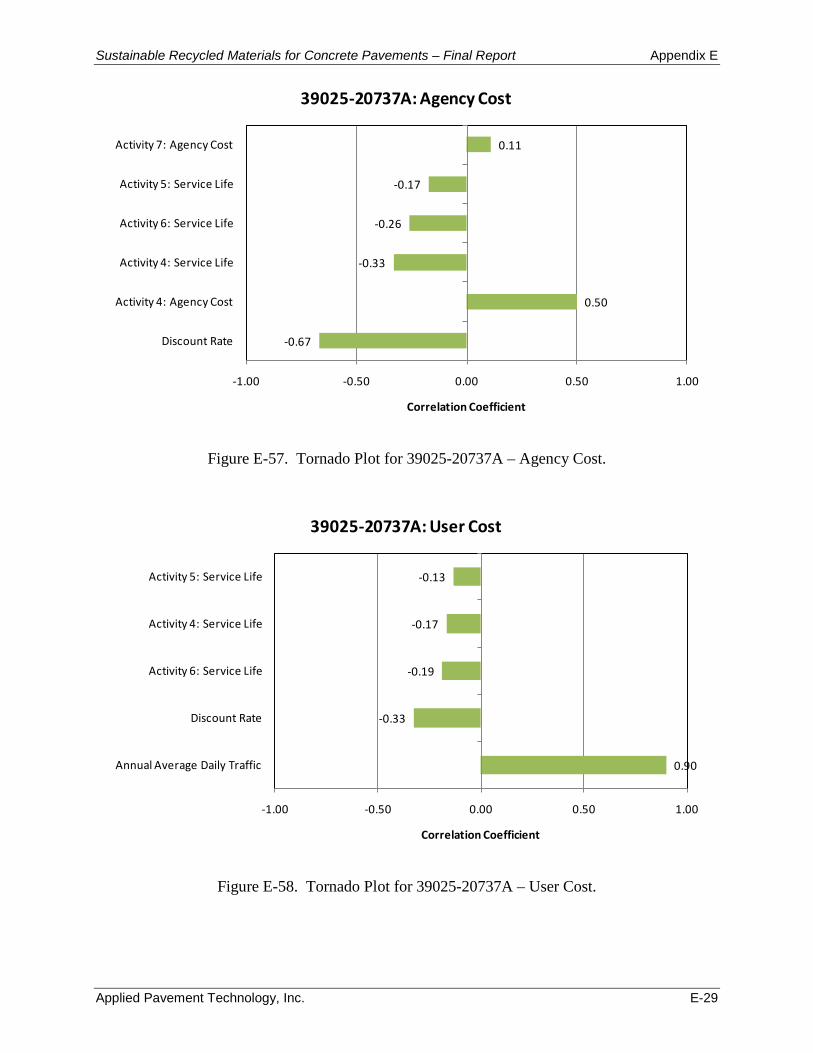
Sustainable Recycled Materials for Concrete Pavements – Final Report Appendix E
Applied Pavement Technology, Inc. E-29
-0.67
0.50
-0.33
-0.26
-0.17
0.11
-1.00 -0.50 0.00 0.50 1.00
Discount Rate
Activity 4: Agency Cost
Activity 4: Service Life
Activity 6: Service Life
Activity 5: Service Life
Activity 7: Agency Cost
Correlation Coefficient
39025-20737A: Agency Cost
Figure E-57. Tornado Plot for 39025-20737A – Agency Cost.
0.90
-0.33
-0.19
-0.17
-0.13
-1.00 -0.50 0.00 0.50 1.00
Annual Average Daily Traffic
Discount Rate
Activity 6: Service Life
Activity 4: Service Life
Activity 5: Service Life
Correlation Coefficient
39025-20737A: User Cost
Figure E-58. Tornado Plot for 39025-20737A – User Cost.
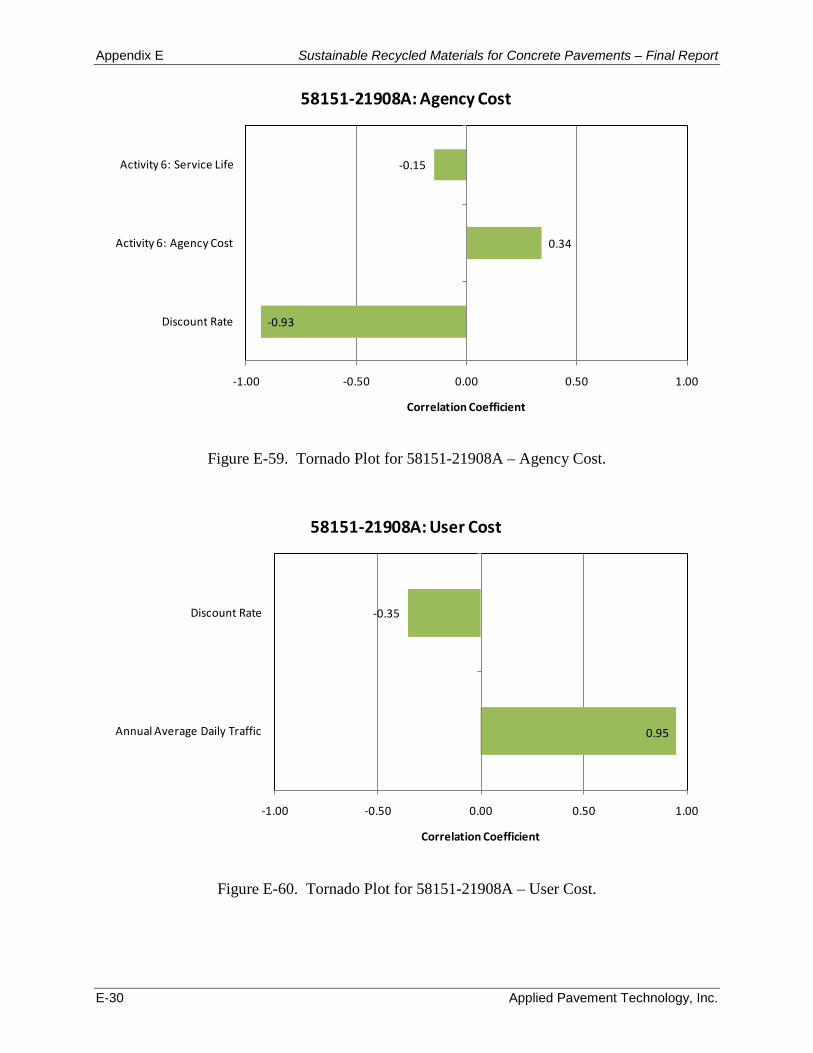
Appendix E Sustainable Recycled Materials for Concrete Pavements – Final Report
E-30 Applied Pavement Technology, Inc.
-0.93
0.34
-0.15
-1.00 -0.50 0.00 0.50 1.00
Discount Rate
Activity 6: Agency Cost
Activity 6: Service Life
Correlation Coefficient
58151-21908A: Agency Cost
Figure E-59. Tornado Plot for 58151-21908A – Agency Cost.
0.95
-0.35
-1.00 -0.50 0.00 0.50 1.00
Annual Average Daily Traffic
Discount Rate
Correlation Coefficient
58151-21908A: User Cost
Figure E-60. Tornado Plot for 58151-21908A – User Cost.
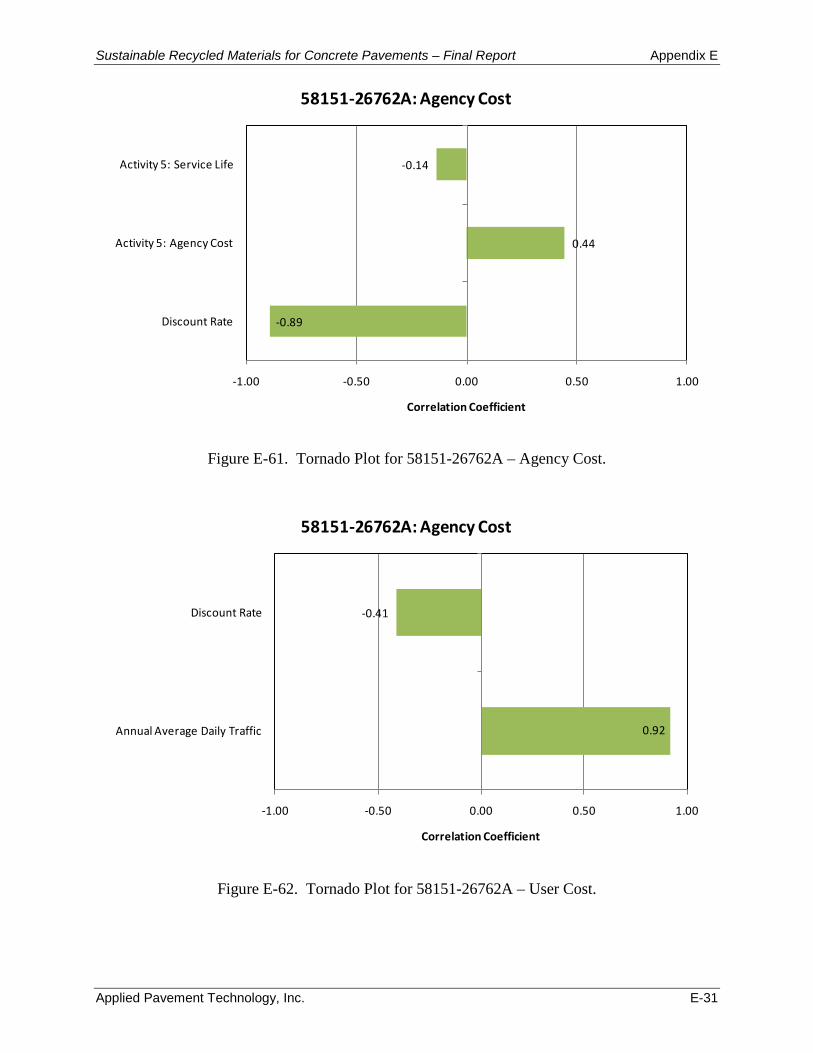
Sustainable Recycled Materials for Concrete Pavements – Final Report Appendix E
Applied Pavement Technology, Inc. E-31
-0.89
0.44
-0.14
-1.00 -0.50 0.00 0.50 1.00
Discount Rate
Activity 5: Agency Cost
Activity 5: Service Life
Correlation Coefficient
58151-26762A: Agency Cost
Figure E-61. Tornado Plot for 58151-26762A – Agency Cost.
0.92
-0.41
-1.00 -0.50 0.00 0.50 1.00
Annual Average Daily Traffic
Discount Rate
Correlation Coefficient
58151-26762A: Agency Cost
Figure E-62. Tornado Plot for 58151-26762A – User Cost.

Appendix E Sustainable Recycled Materials for Concrete Pavements – Final Report
E-32 Applied Pavement Technology, Inc.

Sustainable Recycled Materials for Concrete Pavements – Final Report Appendix F
Applied Pavement Technology, Inc. F-1
APPENDIX F – LCA-BASED SUSTAINABILITY EVALUATION

SUSTAINABLE RECYCLED MATERIALS FOR CONCRETE PAVEMENTS - ORE0904B LCA-based sustainability evaluation
Status
Final report
Client Michigan Department of Transportation Office of Research and Best Practices 425 West Ottawa Lansing, Michigan 48933
Our reference 09.0070-R10.0120
Date February 8, 2011
Author Joep P Meijer, MSc, theRightenvironment
Reviewer Tom Van Dam, Ph.D., P.E., LEED AP
MDOT ORE0904B Sustainability evaluation – LCA based indicators
page 2 of 55 09.0070-R09.0097
CONTENTS
SUMMARY ....................................................................................................................... 4
1 INTRODUCTION ...................................................................................................... 6 1.1 MDOT’s wish ................................................................................................... 6 1.2 Four steps in LCA ........................................................................................... 7 1.3 Status .............................................................................................................. 8 1.4 Team ............................................................................................................... 9 1.5 Structure .......................................................................................................... 9
2 MEASURING SUSTAINABILITY ........................................................................... 10 2.1 Goal ............................................................................................................... 10 2.2 Framework .................................................................................................... 10 2.3 Impact categories.......................................................................................... 12
2.3.1.Introduction .......................................................................................... 12 2.3.2.Selection for this project ...................................................................... 13
3 GOAL AND SCOPE ............................................................................................... 15 3.1 Intended application ...................................................................................... 15 3.2 Functional unit ............................................................................................... 15 3.3 Pavement (system boundaries) .................................................................... 15 3.4 Allocation ....................................................................................................... 20 3.5 Calculations rules.......................................................................................... 21 3.6 Data quality ................................................................................................... 21 3.7 Limitations ..................................................................................................... 22 3.8 Critical review ................................................................................................ 22
4 INVENTORY .......................................................................................................... 23 4.1 Data categories ............................................................................................. 23 4.2 Data quality ................................................................................................... 23 4.3 Data collection .............................................................................................. 23
5 IMPACT ASSESSMENT ........................................................................................ 25 5.1 Impact assessment ....................................................................................... 25 5.2 Normalization and weighting ........................................................................ 25
6 INTERPRETATION ................................................................................................ 26 6.1 Impact assessment ....................................................................................... 26
6.1.1.Result per section ................................................................................ 26 6.1.2.Major contributions .............................................................................. 28
6.2 Sensitivity analyses ...................................................................................... 31 6.2.1.HMA overlay thickness ........................................................................ 31 6.2.2.Accounting rules for bitumen feedstock .............................................. 32
MDOT ORE0904B Sustainability evaluation – LCA based indicators
page 3 of 55 09.0070-R09.0097
6.2.3.End of life - On-site vs. regional recycling ........................................... 33 6.2.4.Other impact categories ...................................................................... 33
7 SOURCES.............................................................................................................. 34
ACRONYMS ................................................................................................................... 35
DEFINITIONS................................................................................................................. 35
APPENDIX A. PAVEMENT DEFINITION ...................................................................... 40 A.1. Pavement ........................................................................................................ 40
APPENDIX B. IMPACT CATEGORIES ......................................................................... 41
APPENDIX B. MAJOR CONTRIBUTIONS .................................................................... 45
APPENDIX C. IMPACT ASSESSMENT FACTORS ..................................................... 50
MDOT ORE0904B Sustainability evaluation – LCA based indicators
page 4 of 55 09.0070-R09.0097
SUMMARY
As part of this project, MDOT has invited APTech and theRightenvironment to assist in the creation of an environmental perspective on the sustainability of different pavement options using Life Cycle Assessment (LCA). This report includes the definition, assessment and interpretation for the environmental parts of the overall project objectives. Starting points An LCA has been performed for a selection of pavement sections where a good set of maintenance data is available. The selection of pavements includes a range of pavements with or without supplementary cementitious materials (SCMs), with or without crushed concrete aggregate in the concrete pavement, with or without crushed concrete aggregate in the subbase, in three different traffic intensity categories. LCA was conducted on older pavement sections dating from the 1980s and two new section from I-94 and I-96 that feature on-site recycling of pavement into the subbase. Based on actual design data, cement mixes and maintenance data the life cycle was modeled. Limitations This study represents a trend-based assessment where the focus during the interpretation has been given to the relative differences between the different section results. It can be used for internal discussion purposes. It is based on a selection of pavement sections and does not aim to be complete, nor statistically representative. It is based partly on actual and partly on data obtained from literature. Apart from primary data from MDOT, the cement manufacturers have been contacted to provide process data and we thank the participating companies for their efforts and contribution. However, other stakeholders have not been involved. This study has not been subjected to an ISO 14044 critical review. MDOT can use the results to select, prioritize and promote good practices for more sustainable concrete pavements. Sustainability indicators A selection of indicators was used to evaluate the pavement sections with the different design strategies. For this study the following indicators have been assessed:
Energy use, expressed in MJ
CO2-footprint based on carbon dioxide equivalents
Eutrophication and acidification to measure the impact on water
Volume of secondary material as compared to the volume of primary material
Transportation intensity in terms of ton-miles Results The results show that a sustainable pavement starts with good design and construction. Failing pavements are not sustainable. When looking at construction and maintenance, MDOT should aim to only use an HMA overlay when the full lifespan of
MDOT ORE0904B Sustainability evaluation – LCA based indicators
page 5 of 55 09.0070-R09.0097
the overlay can be utilized as premature removal is not a sustainable strategy. Within the concrete pavement itself the results show that it makes sense to use more SCMs in the cement mix, use more recycled content and to optimize the logistics involved in making and recycling concrete pavement where local or even on-site recycling is preferred. The different sections all have specific stories to tell and we invite the reader to read through the report for more details. Sensitivity analysis Although the range of sections by itself includes the most important range of possible variations, a number of additional sensitivity analyses have been performed. Lessons drawn from these analyses show that the thickness of an HMA overlay influences the results in a significant manner, the same applies to a preference for on-site recycling versus more regional recycling, that accounting rules for the energy content of bitumen result in significant different results for the energy indicator but not the others and that a practical recommendation would be to prescribe non-solvent based curing compounds when available. Recommendations Our recommendations for future research would be the following:
The LCA model can be improved by adding a better definition and inventory for maintenance/rehabilitation processes;
The use of crushed concrete in the concrete pavement itself has been applied with mixed results, and is currently not applied anymore. There are pavement sections in this study that include crushed concrete that seem to perform well. It is recommended to study well performing pavements made with crushed concrete to define what works and evaluate how that success can be repeated;
Based on the results it would be of interest to evaluate a scenario where a thicker pavement is used that includes diamond grinding and grooving for maintenance but no HMA overlay. This is a strategy that some other DOT’s have applied but was not present in the current selection of sections that are studied. Adding a variation including an concrete overlay could add to a better understanding of the use of overlays and the environmental impact;
Since good data is important for any study, and since LCA is an emerging field in evaluating concrete pavements in the U.S., we recommend to MDOT to stimulate and promote initiatives within MDOT itself and with market parties to collect and utilize current and actual process data.
MDOT ORE0904B Sustainability evaluation – LCA based indicators
page 6 of 55 09.0070-R09.0097
1 INTRODUCTION
1.1 MDOT’s wish
Project introduction
The Michigan Department of Transportation (MDOT) has successfully used a number of recycled and industrial byproduct materials (RIBMs) in the construction of portland cement concrete (PCC) pavements for many years. These RIBMs have been incorporated into the concrete and base/subbase layers, as well as in other applications (such as fill or rip-rap). MDOT has also evaluated the potential use of industrial byproducts as subgrade modifiers/stabilizers in several studies conducted at Michigan Tech. Although it is recognized that the proper use of RIBMs can enhance the sustainability of the pavement by improving the economic, environmental, and social attributes of the project, the inappropriate use or a poorly designed application can actually reduce the overall sustainability of the project if poor or reduced performance is obtained. A pavement that suffers premature distress is not only an economic burden, it also has significant environmental and social impacts due to the need for the production of the repair and replacement materials and the increased traffic delays and disruption to the users of the facility associated with the rehabilitation. Beginning in the late 1990s, a number of notable concrete pavement failures have been studied, where the presence of industrial byproducts in the concrete were at least partially implicated in the development of premature distress. That previous work, as well as that conducted by other university and MDOT researchers, demonstrates the need to systematically examine how RIBMs can be properly used to enhance concrete pavement sustainability in Michigan. This will require the application of a rigorous and robust approach to compare economic and environmental benefits and costs through the consideration of objective data, providing the foundation for future policy and specification decisions. Specifically, the RIBMs that are or have been used by MDOT in concrete pavements in recent years include cementitious materials added to supplement or replace portland cement in concrete (e.g. fly ash and ground granulated blast furnace slag [GGBFS]) and those used as aggregate in concrete and crushed concrete aggregate [CC]). These materials will thus be of primary interest in this study. Other materials that have been used or investigated by MDOT (such as reverberatory furnace slag, steel furnace slag, foundry sands, and cement kiln dust [CKD], among others) are either no longer approved or are currently used to a much lesser degree, and, while considered under this project, will not be the primary focus.
MDOT ORE0904B Sustainability evaluation – LCA based indicators
page 7 of 55 09.0070-R09.0097
MDOT recognizes the economic and environmental benefits associated with the appropriate use of RIBMs in concrete pavements, yet realizes that inappropriate use can result in significant economic and environmental costs. We have collected data that form the basis for quantifying costs and benefits over a broad spectrum of economic (e.g. initial costs, life cycle costs, and so on) and environmental (e.g. embodied energy, carbon footprint, acidification, and so on) factors. Comparisons will be made between projects constructed using various RIBMs and those constructed using natural materials with the purpose of maximizing the economic and environmental benefits to the citizens of Michigan. The primary objective for MDOT is to assess the comparative benefits and costs of RIBMs and determine how these materials can be effectively used to increase the sustainability of concrete pavements in Michigan. This primary objective will be accomplished by successfully completing the following:
1. Summarize all of MDOT’s current specifications for, and actual use of, fly ash, GGBFS and CCA in the construction of concrete pavements.
2. Formulate an approach for quantifying economic and environmental costs and benefits over the entire life cycle for comparison of concrete pavements constructed using various recycled and industrial byproduct and traditional materials.
3. Employ the approach to evaluate a significant number of concrete pavements constructed with and without RIBMs using actual MDOT construction and performance data.
4. Document the results of the study in a final report for use by MDOT to assist in improving policy and specification decisions.
5. Develop an implementation plan that includes construction considerations for successful utilization of RIBMs in concrete pavements.
Focus of this report As part of this project MDOT has invited AP Tech and theRightenvironment to assist in the creation of an environmental perspective on the sustainability of different pavement options using Life Cycle Assessment (LCA). This report includes the definition, assessment and interpretation for the environmental parts of the overall project objectives.
1.2 Four steps in LCA
While performing a life cycle assessment (LCA) the ISO 14040 standards are followed and typically include the following phases:
Goal and Scope
Inventory
Impact Assessment
Interpretation
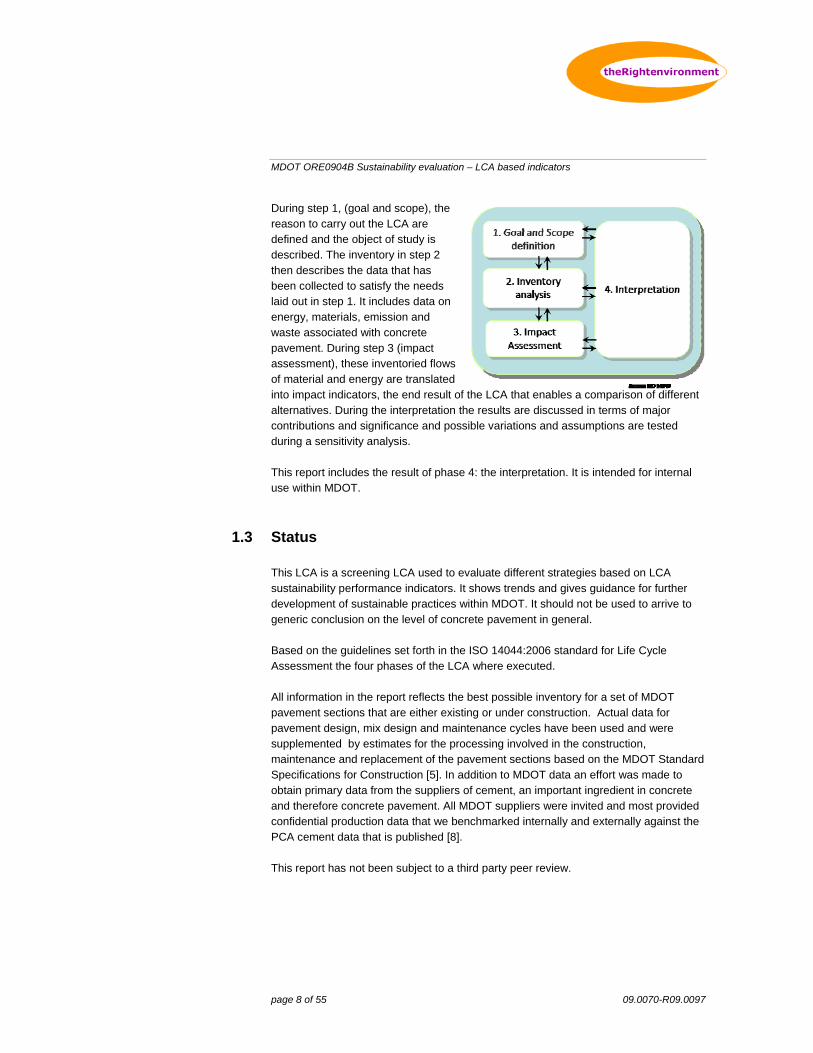
MDOT ORE0904B Sustainability evaluation – LCA based indicators
page 8 of 55 09.0070-R09.0097
During step 1, (goal and scope), the reason to carry out the LCA are defined and the object of study is described. The inventory in step 2 then describes the data that has been collected to satisfy the needs laid out in step 1. It includes data on energy, materials, emission and waste associated with concrete pavement. During step 3 (impact assessment), these inventoried flows of material and energy are translated into impact indicators, the end result of the LCA that enables a comparison of different alternatives. During the interpretation the results are discussed in terms of major contributions and significance and possible variations and assumptions are tested during a sensitivity analysis. This report includes the result of phase 4: the interpretation. It is intended for internal use within MDOT.
1.3 Status
This LCA is a screening LCA used to evaluate different strategies based on LCA sustainability performance indicators. It shows trends and gives guidance for further development of sustainable practices within MDOT. It should not be used to arrive to generic conclusion on the level of concrete pavement in general. Based on the guidelines set forth in the ISO 14044:2006 standard for Life Cycle Assessment the four phases of the LCA where executed. All information in the report reflects the best possible inventory for a set of MDOT pavement sections that are either existing or under construction. Actual data for pavement design, mix design and maintenance cycles have been used and were supplemented by estimates for the processing involved in the construction, maintenance and replacement of the pavement sections based on the MDOT Standard Specifications for Construction [5]. In addition to MDOT data an effort was made to obtain primary data from the suppliers of cement, an important ingredient in concrete and therefore concrete pavement. All MDOT suppliers were invited and most provided confidential production data that we benchmarked internally and externally against the PCA cement data that is published [8]. This report has not been subject to a third party peer review.
MDOT ORE0904B Sustainability evaluation – LCA based indicators
page 9 of 55 09.0070-R09.0097
1.4 Team
This report is based on the work of the following team members on behalf AP Tech and theRightenvironment:
- Kurt Smith, APTech - Tom Van Dam, APTech - Prashant V. Ram, APTech - Joep Meijer, theRightenvironment
We could not have executed this project without the guidance and input from numerous MDOT employees. We would like to take this opportunity to thank all members of the project team that enabled us to discuss and improve the work described in this report:
- John Belcher - Andre Clover - Steve Hawcker - Ben Krom - Alan Robords - Judy Ruszkowski - Tim Stallard - John Staton - Tom Woodhouse
John Belcher was the MDOT project manager.
1.5 Structure
This report follows the structure of the life cycle assessment methodology defined in ISO 14040:2006 after an introduction to LCA-based sustainability indicators in chapter 2. The goal and scope is laid down in chapter 3. Chapter 4 includes the inventory and the impact assessment can be found in chapter 5. Chapter 6 details the interpretation phase. This report includes jargon for LCA and refineries. To assist the reader, special attention has been given to a list of definitions of important terms used.
MDOT ORE0904B Sustainability evaluation – LCA based indicators
page 10 of 55 09.0070-R09.0097
2 MEASURING SUSTAINABILITY
2.1 Goal
One of the goals for the project ‘sustainable recycled materials for concrete pavements’ is to:
Formulate an approach for quantifying economic and environmental costs
and benefits over the entire life cycle for comparison of concrete pavements
constructed using various recycled and industrial byproduct and traditional
materials.
The focus of this report is to propose a framework and definition of the environmental costs and benefits in terms of sustainability indicators.
2.2 Framework
We have proposed to follow the widely accepted framework of environmental life cycle assessment (LCA) as the basis to quantify the environmental performance of MDOT practices in concrete pavements. LCA is a widely adopted framework that is gaining traction in the United States. It is based on the ISO 14040 series of standards: - ISO 14041 Goal and Scope Definition - ISO 14042 Inventory Analysis - ISO 14043 Interpretation - ISO 14044 Guidelines and principles LCA is a powerful tool that can measure environmental performance in terms of impacts categories. It is based on material, energy, emission and waste data for every step and every material (see figure 1) that is part of the life cycle of a product, service or policy, and in this project, concrete pavement. LCA follows the life cycle; a schematic overview of life cycle thinking is presented in figure 2.
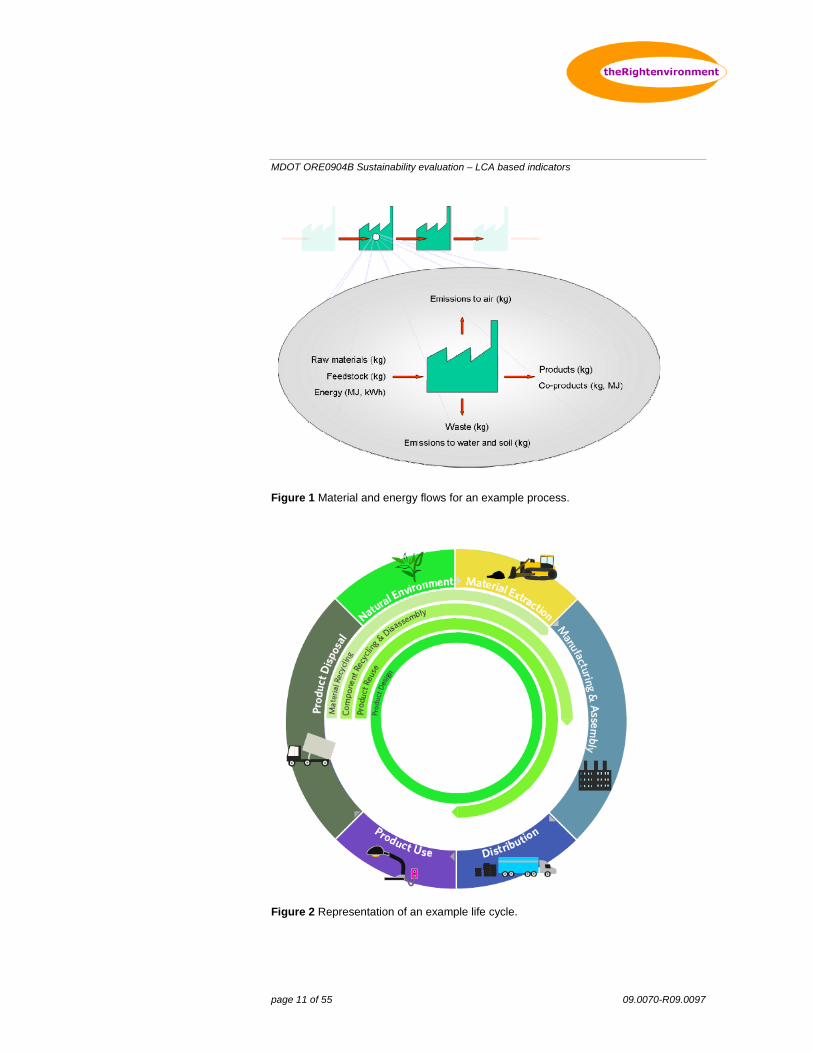
MDOT ORE0904B Sustainability evaluation – LCA based indicators
page 11 of 55 09.0070-R09.0097
Figure 1 Material and energy flows for an example process.
Figure 2 Representation of an example life cycle.
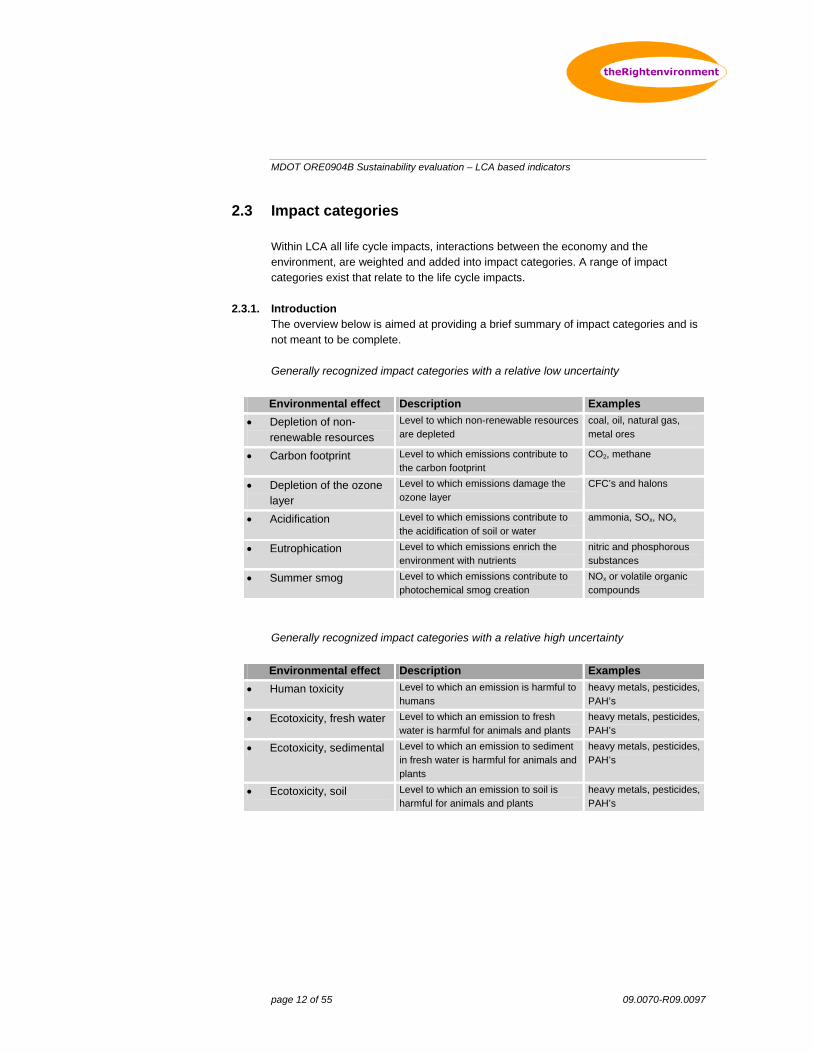
MDOT ORE0904B Sustainability evaluation – LCA based indicators
page 12 of 55 09.0070-R09.0097
2.3 Impact categories
Within LCA all life cycle impacts, interactions between the economy and the environment, are weighted and added into impact categories. A range of impact categories exist that relate to the life cycle impacts.
2.3.1. Introduction The overview below is aimed at providing a brief summary of impact categories and is not meant to be complete. Generally recognized impact categories with a relative low uncertainty
Environmental effect Description Examples
Depletion of non-renewable resources
Level to which non-renewable resources are depleted
coal, oil, natural gas, metal ores
Carbon footprint Level to which emissions contribute to the carbon footprint
CO2, methane
Depletion of the ozone layer
Level to which emissions damage the ozone layer
CFC’s and halons
Acidification Level to which emissions contribute to the acidification of soil or water
ammonia, SOx, NOx
Eutrophication Level to which emissions enrich the environment with nutrients
nitric and phosphorous substances
Summer smog Level to which emissions contribute to photochemical smog creation
NOx or volatile organic compounds
Generally recognized impact categories with a relative high uncertainty
Environmental effect Description Examples
Human toxicity Level to which an emission is harmful to humans
heavy metals, pesticides, PAH’s
Ecotoxicity, fresh water Level to which an emission to fresh water is harmful for animals and plants
heavy metals, pesticides, PAH’s
Ecotoxicity, sedimental Level to which an emission to sediment in fresh water is harmful for animals and plants
heavy metals, pesticides, PAH’s
Ecotoxicity, soil Level to which an emission to soil is harmful for animals and plants
heavy metals, pesticides, PAH’s
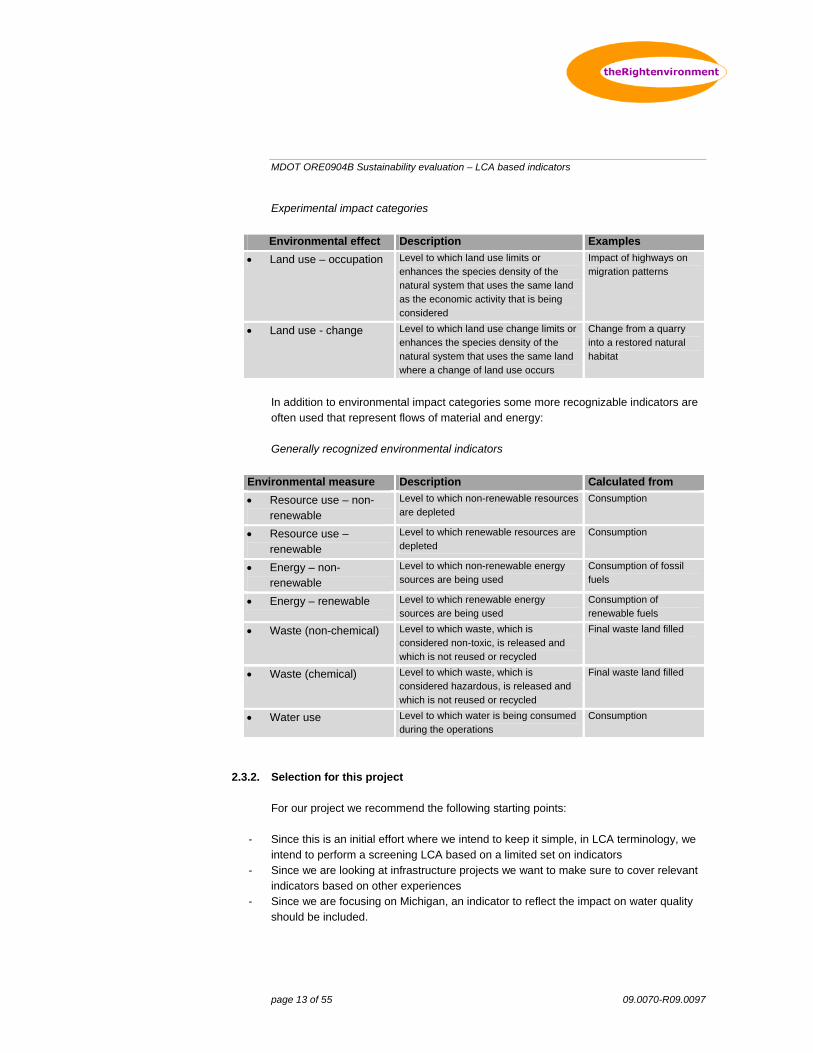
MDOT ORE0904B Sustainability evaluation – LCA based indicators
page 13 of 55 09.0070-R09.0097
Experimental impact categories
Environmental effect Description Examples
Land use – occupation Level to which land use limits or enhances the species density of the natural system that uses the same land as the economic activity that is being considered
Impact of highways on migration patterns
Land use - change Level to which land use change limits or enhances the species density of the natural system that uses the same land where a change of land use occurs
Change from a quarry into a restored natural habitat
In addition to environmental impact categories some more recognizable indicators are often used that represent flows of material and energy: Generally recognized environmental indicators
Environmental measure Description Calculated from
Resource use – non-renewable
Level to which non-renewable resources are depleted
Consumption
Resource use –renewable
Level to which renewable resources are depleted
Consumption
Energy – non-renewable
Level to which non-renewable energy sources are being used
Consumption of fossil fuels
Energy – renewable Level to which renewable energy sources are being used
Consumption of renewable fuels
Waste (non-chemical) Level to which waste, which is considered non-toxic, is released and which is not reused or recycled
Final waste land filled
Waste (chemical) Level to which waste, which is considered hazardous, is released and which is not reused or recycled
Final waste land filled
Water use Level to which water is being consumed during the operations
Consumption
2.3.2. Selection for this project For our project we recommend the following starting points:
- Since this is an initial effort where we intend to keep it simple, in LCA terminology, we intend to perform a screening LCA based on a limited set on indicators
- Since we are looking at infrastructure projects we want to make sure to cover relevant indicators based on other experiences
- Since we are focusing on Michigan, an indicator to reflect the impact on water quality should be included.

MDOT ORE0904B Sustainability evaluation – LCA based indicators
page 14 of 55 09.0070-R09.0097
Relevant indicators for infrastructure projects are:
- Use of secondary material as a flow - Use of local materials - Overall energy and CO2 intensity of sustainability strategies
Therefore we propose to use the following indicators:
- Energy use, expressed in MJ - CO2-footprint based on carbon dioxide equivalents - Eutrophication and acidification to measure the impact on water - Volume of secondary material as compared to the volume of primary material - Transportation intensity in terms of ton-miles
MDOT ORE0904B Sustainability evaluation – LCA based indicators
page 15 of 55 09.0070-R09.0097
3 GOAL AND SCOPE
This chapter lays down the starting points for the screening LCA.
3.1 Intended application
The intended audience of this study is MDOT itself. The goal is to assess and learn from looking at currently applied road design and material use through the lens of an LCA and to conclude on strategies that work best.
3.2 Functional unit
The basis to compare results in this study is defined as follows: 1 mile and 1 lane of a 2 lane highway pavement that performs over a period of 50 years that fulfills all MDOT-specifications and requirements This includes all maintenance and replacements.
3.3 Pavement (system boundaries)
Every LCA has so-called system boundaries that define what is included in the assessment and what is not. We aim to follow the best LCA practices and some project specific boundaries. Below all system boundaries are defined. Special attention needs to be given to exclusions and the potential effect on the result, and when system boundaries are to be defined when different systems cross; in those situations a decision on what belongs to each system needs to be made. In LCA jargon this is called allocation. The allocation rules are also defined below. Life cycle phases Included in this study are material flow related life cycle considerations related to:
- Acquisition of materials - Construction - Maintenance - Replacements - End-of-life of materials after service life
Excluded from this study are:
- Direct and indirect traffic related impacts, and therefore fuel consumption, rolling resistance, pavement roughness, traffic delays and rerouting, tire wear
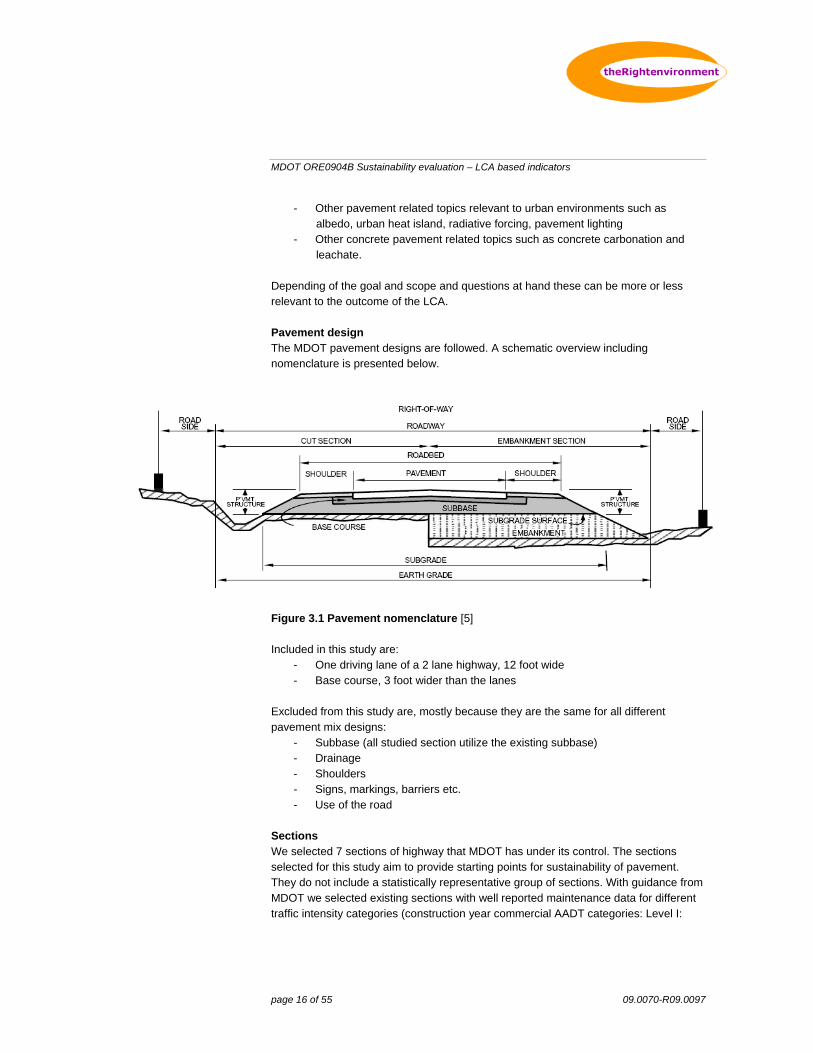
MDOT ORE0904B Sustainability evaluation – LCA based indicators
page 16 of 55 09.0070-R09.0097
- Other pavement related topics relevant to urban environments such as albedo, urban heat island, radiative forcing, pavement lighting
- Other concrete pavement related topics such as concrete carbonation and leachate.
Depending of the goal and scope and questions at hand these can be more or less relevant to the outcome of the LCA. Pavement design The MDOT pavement designs are followed. A schematic overview including nomenclature is presented below.
Figure 3.1 Pavement nomenclature [5] Included in this study are:
- One driving lane of a 2 lane highway, 12 foot wide - Base course, 3 foot wider than the lanes
Excluded from this study are, mostly because they are the same for all different pavement mix designs:
- Subbase (all studied section utilize the existing subbase) - Drainage - Shoulders - Signs, markings, barriers etc. - Use of the road
Sections We selected 7 sections of highway that MDOT has under its control. The sections selected for this study aim to provide starting points for sustainability of pavement. They do not include a statistically representative group of sections. With guidance from MDOT we selected existing sections with well reported maintenance data for different traffic intensity categories (construction year commercial AADT categories: Level I:
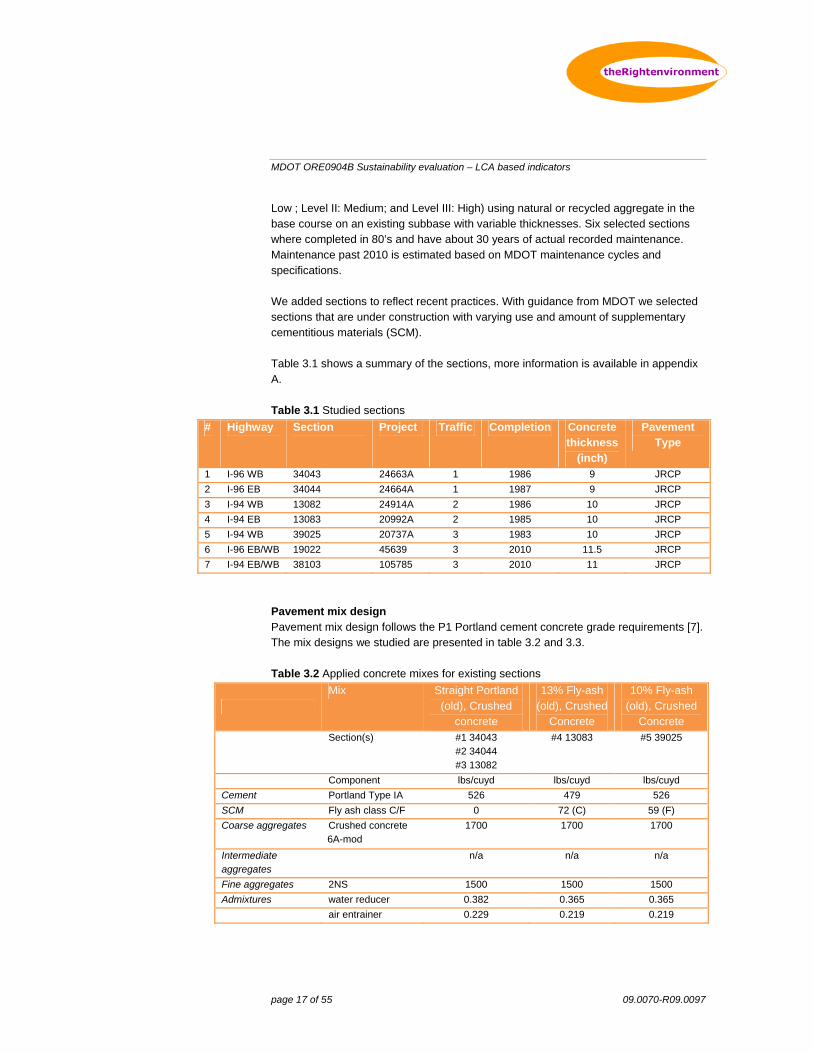
MDOT ORE0904B Sustainability evaluation – LCA based indicators
page 17 of 55 09.0070-R09.0097
Low ; Level II: Medium; and Level III: High) using natural or recycled aggregate in the base course on an existing subbase with variable thicknesses. Six selected sections where completed in 80’s and have about 30 years of actual recorded maintenance. Maintenance past 2010 is estimated based on MDOT maintenance cycles and specifications. We added sections to reflect recent practices. With guidance from MDOT we selected sections that are under construction with varying use and amount of supplementary cementitious materials (SCM). Table 3.1 shows a summary of the sections, more information is available in appendix A. Table 3.1 Studied sections
# Highway Section Project Traffic Completion Concrete thickness
(inch)
Pavement Type
1 I-96 WB 34043 24663A 1 1986 9 JRCP
2 I-96 EB 34044 24664A 1 1987 9 JRCP
3 I-94 WB 13082 24914A 2 1986 10 JRCP
4 I-94 EB 13083 20992A 2 1985 10 JRCP
5 I-94 WB 39025 20737A 3 1983 10 JRCP
6 I-96 EB/WB 19022 45639 3 2010 11.5 JRCP
7 I-94 EB/WB 38103 105785 3 2010 11 JRCP
Pavement mix design Pavement mix design follows the P1 Portland cement concrete grade requirements [7]. The mix designs we studied are presented in table 3.2 and 3.3. Table 3.2 Applied concrete mixes for existing sections
Mix Straight Portland
(old), Crushed concrete
13% Fly-ash (old), Crushed
Concrete
10% Fly-ash (old), Crushed
Concrete Section(s) #1 34043
#2 34044 #3 13082
#4 13083
#5 39025
Component lbs/cuyd lbs/cuyd lbs/cuyd
Cement Portland Type IA 526 479 526
SCM Fly ash class C/F 0 72 (C) 59 (F)
Coarse aggregates Crushed concrete 6A-mod
1700 1700 1700
Intermediate aggregates
n/a n/a n/a
Fine aggregates 2NS 1500 1500 1500
Admixtures water reducer 0.382 0.365 0.365
air entrainer 0.229 0.219 0.219
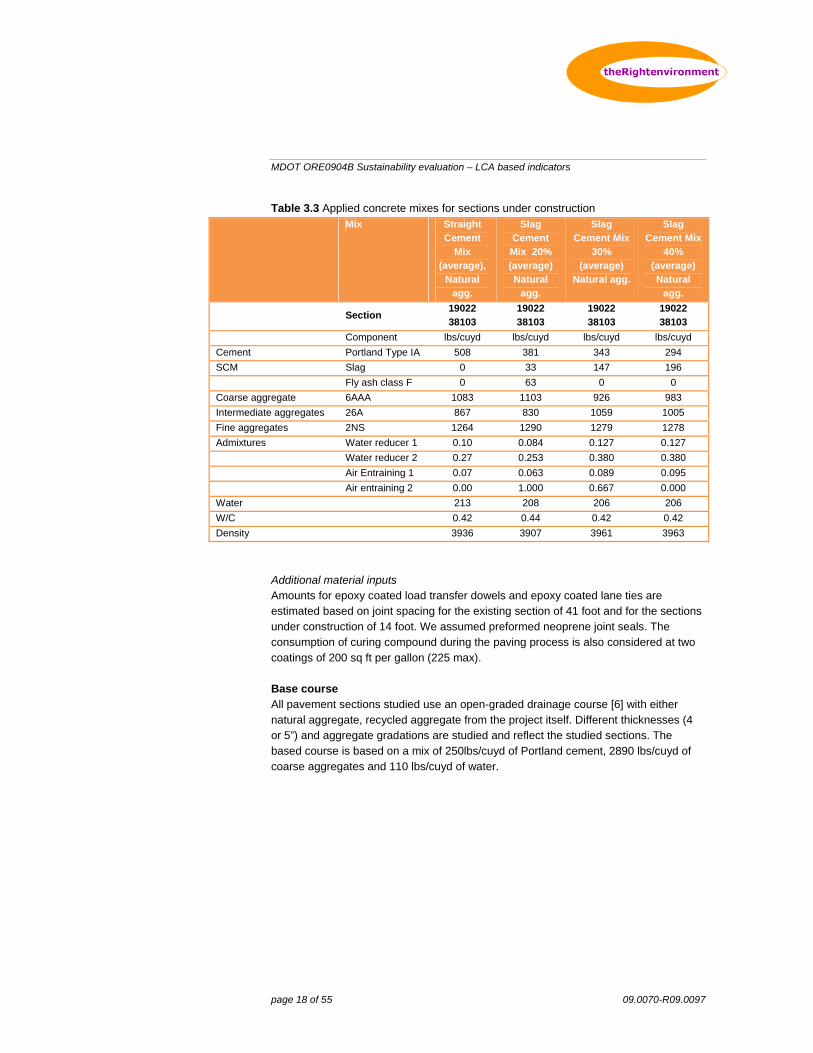
MDOT ORE0904B Sustainability evaluation – LCA based indicators
page 18 of 55 09.0070-R09.0097
Table 3.3 Applied concrete mixes for sections under construction Mix Straight
Cement Mix
(average), Natural
agg.
Slag Cement Mix 20% (average) Natural
agg.
Slag Cement Mix
30% (average)
Natural agg.
Slag Cement Mix
40% (average) Natural
agg.
Section
1902238103
1902238103
19022 38103
1902238103
Component lbs/cuyd lbs/cuyd lbs/cuyd lbs/cuyd
Cement Portland Type IA 508 381 343 294
SCM Slag 0 33 147 196
Fly ash class F 0 63 0 0
Coarse aggregate 6AAA 1083 1103 926 983
Intermediate aggregates 26A 867 830 1059 1005
Fine aggregates 2NS 1264 1290 1279 1278
Admixtures Water reducer 1 0.10 0.084 0.127 0.127
Water reducer 2 0.27 0.253 0.380 0.380
Air Entraining 1 0.07 0.063 0.089 0.095
Air entraining 2 0.00 1.000 0.667 0.000
Water 213 208 206 206
W/C 0.42 0.44 0.42 0.42
Density 3936 3907 3961 3963
Additional material inputs Amounts for epoxy coated load transfer dowels and epoxy coated lane ties are estimated based on joint spacing for the existing section of 41 foot and for the sections under construction of 14 foot. We assumed preformed neoprene joint seals. The consumption of curing compound during the paving process is also considered at two coatings of 200 sq ft per gallon (225 max). Base course All pavement sections studied use an open-graded drainage course [6] with either natural aggregate, recycled aggregate from the project itself. Different thicknesses (4 or 5”) and aggregate gradations are studied and reflect the studied sections. The based course is based on a mix of 250lbs/cuyd of Portland cement, 2890 lbs/cuyd of coarse aggregates and 110 lbs/cuyd of water.
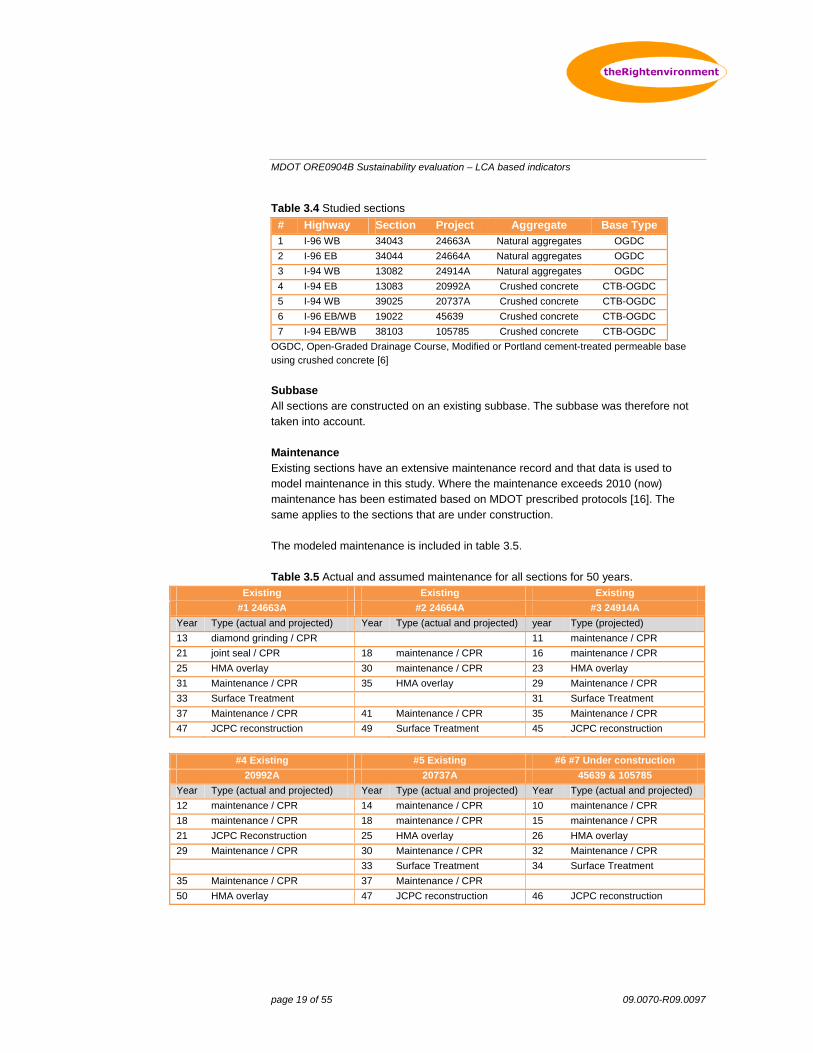
MDOT ORE0904B Sustainability evaluation – LCA based indicators
page 19 of 55 09.0070-R09.0097
Table 3.4 Studied sections
# Highway Section Project Aggregate Base Type 1 I-96 WB 34043 24663A Natural aggregates OGDC 2 I-96 EB 34044 24664A Natural aggregates OGDC 3 I-94 WB 13082 24914A Natural aggregates OGDC 4 I-94 EB 13083 20992A Crushed concrete CTB-OGDC
5 I-94 WB 39025 20737A Crushed concrete CTB-OGDC
6 I-96 EB/WB 19022 45639 Crushed concrete CTB-OGDC
7 I-94 EB/WB 38103 105785 Crushed concrete CTB-OGDC
OGDC, Open-Graded Drainage Course, Modified or Portland cement-treated permeable base using crushed concrete [6]
Subbase All sections are constructed on an existing subbase. The subbase was therefore not taken into account. Maintenance Existing sections have an extensive maintenance record and that data is used to model maintenance in this study. Where the maintenance exceeds 2010 (now) maintenance has been estimated based on MDOT prescribed protocols [16]. The same applies to the sections that are under construction. The modeled maintenance is included in table 3.5. Table 3.5 Actual and assumed maintenance for all sections for 50 years.
Existing Existing Existing
#1 24663A #2 24664A #3 24914A
Year Type (actual and projected) Year Type (actual and projected) year Type (projected)
13 diamond grinding / CPR 11 maintenance / CPR
21 joint seal / CPR 18 maintenance / CPR 16 maintenance / CPR
25 HMA overlay 30 maintenance / CPR 23 HMA overlay
31 Maintenance / CPR 35 HMA overlay 29 Maintenance / CPR
33 Surface Treatment 31 Surface Treatment
37 Maintenance / CPR 41 Maintenance / CPR 35 Maintenance / CPR
47 JCPC reconstruction 49 Surface Treatment 45 JCPC reconstruction
#4 Existing #5 Existing #6 #7 Under construction
20992A 20737A 45639 & 105785
Year Type (actual and projected) Year Type (actual and projected) Year Type (actual and projected)
12 maintenance / CPR 14 maintenance / CPR 10 maintenance / CPR
18 maintenance / CPR 18 maintenance / CPR 15 maintenance / CPR
21 JCPC Reconstruction 25 HMA overlay 26 HMA overlay
29 Maintenance / CPR 30 Maintenance / CPR 32 Maintenance / CPR
33 Surface Treatment 34 Surface Treatment
35 Maintenance / CPR 37 Maintenance / CPR
50 HMA overlay 47 JCPC reconstruction 46 JCPC reconstruction
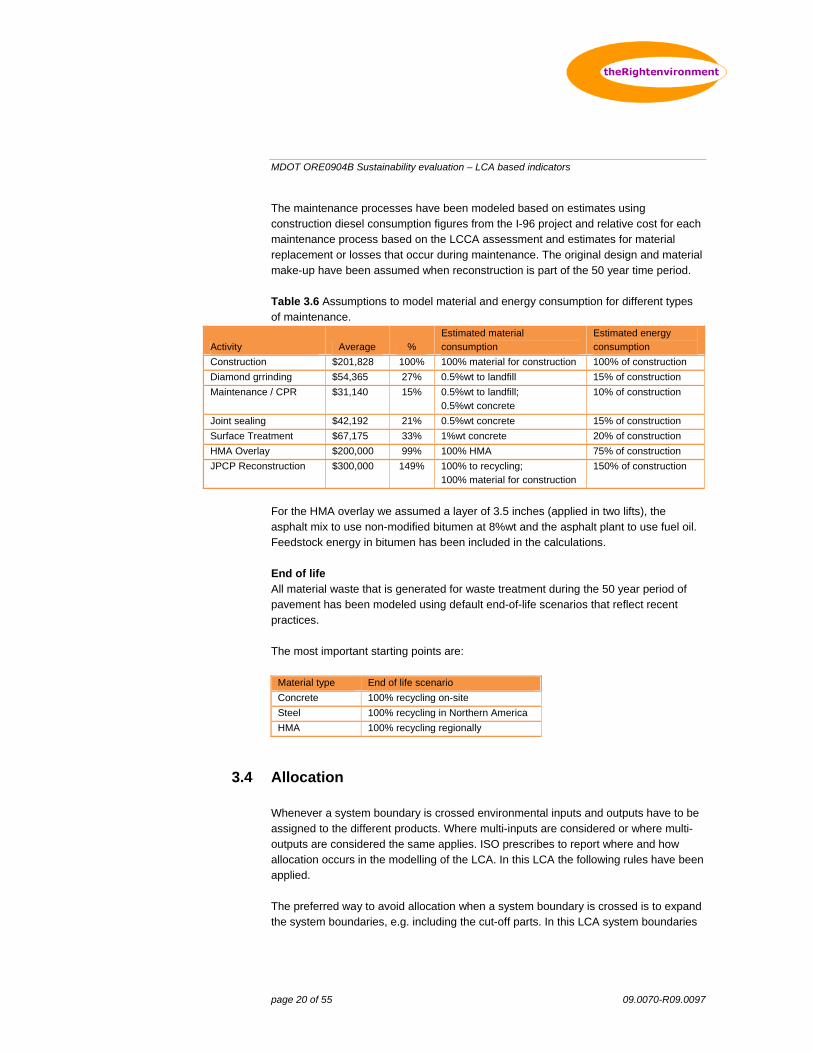
MDOT ORE0904B Sustainability evaluation – LCA based indicators
page 20 of 55 09.0070-R09.0097
The maintenance processes have been modeled based on estimates using construction diesel consumption figures from the I-96 project and relative cost for each maintenance process based on the LCCA assessment and estimates for material replacement or losses that occur during maintenance. The original design and material make-up have been assumed when reconstruction is part of the 50 year time period. Table 3.6 Assumptions to model material and energy consumption for different types of maintenance.
Activity Average % Estimated material consumption
Estimated energy consumption
Construction $201,828 100% 100% material for construction 100% of construction
Diamond grrinding $54,365 27% 0.5%wt to landfill 15% of construction
Maintenance / CPR $31,140 15% 0.5%wt to landfill; 0.5%wt concrete
10% of construction
Joint sealing $42,192 21% 0.5%wt concrete 15% of construction
Surface Treatment $67,175 33% 1%wt concrete 20% of construction
HMA Overlay $200,000 99% 100% HMA 75% of construction
JPCP Reconstruction $300,000 149% 100% to recycling; 100% material for construction
150% of construction
For the HMA overlay we assumed a layer of 3.5 inches (applied in two lifts), the asphalt mix to use non-modified bitumen at 8%wt and the asphalt plant to use fuel oil. Feedstock energy in bitumen has been included in the calculations. End of life All material waste that is generated for waste treatment during the 50 year period of pavement has been modeled using default end-of-life scenarios that reflect recent practices. The most important starting points are:
Material type End of life scenario
Concrete 100% recycling on-site
Steel 100% recycling in Northern America
HMA 100% recycling regionally
3.4 Allocation
Whenever a system boundary is crossed environmental inputs and outputs have to be assigned to the different products. Where multi-inputs are considered or where multi-outputs are considered the same applies. ISO prescribes to report where and how allocation occurs in the modelling of the LCA. In this LCA the following rules have been applied. The preferred way to avoid allocation when a system boundary is crossed is to expand the system boundaries, e.g. including the cut-off parts. In this LCA system boundaries
MDOT ORE0904B Sustainability evaluation – LCA based indicators
page 21 of 55 09.0070-R09.0097
are crossed for the manufacturing processes and reuse or reclaiming components after use. The relevant allocations for this study are described below. Recycling Allocation for the on-site recycling of concrete is not necessary; all processes are related to the project. For the use of recycled material, or the production of recycled material after the functional lifespan of the pavement is over allocation needs to be applied. In this study we assumed an economic allocation of the crushing process and assigned transportation. This means that for the recycling of concrete outside a project all transportation to the concrete recycling plant is assigned and about 50% of the crushing process. For projects where off-site recycled content is used the other 50% is assigned and transportation to site is included. The same logic is applied to HMA from the overlay. For the recycling of steel from the dowel bars and lane ties we applied a substitution of world market average recycled content for new products which is approximately 35%. Landfill Waste treatment is typically a multi-input process. The preferred way to deal with assigning impacts to multi-inputs is to reflect the physical properties of the incoming flows. If a relationship can be established that is more suitable than mass, it should be used. Several waste streams come together and are processed. Where specific data are available the composition of the waste flows has been used to model the contribution to the impacts from the waste treatment, this includes substitution benefits for energy utilization for combustion processes where relevant. Where no specific data are at hand average values are used.
3.5 Calculations rules
We applied the following calculation rules: - Replacements are calculated relating replacement rates in years to the 50
years time period of the functional unit by using fractions, and thereby expressing the environmental impact on a per year basis.
- The input of secondary materials and fuels during the cement manufacturing have been considered “free of burdens” in accordance with the PCA [8].
3.6 Data quality
In general terms we can state the following about data quality:
The pavement design data, cement mixes and transportation data are based on actual designs.
MDOT ORE0904B Sustainability evaluation – LCA based indicators
page 22 of 55 09.0070-R09.0097
Maintenance frequencies are based on actual applied maintenance where available. This is the case for the existing pavement sections with a history of about 30 years. For the coming years, and for the section that is under construction, estimates have been made based on prescribed MDOT-maintenance protocols.
The LCI/LCA data for cement are based on national data from the PCA and benchmarked with data from MDOT cement suppliers, they can be considered as best practical means.
The LCI/LCA data for the construction is based on a recent project ; maintenance processes are estimates.
The literature data for other data are based on EcoInvent 2.0 data that are adapted to reflect the US background data best.
3.7 Limitations
The LCA is limited in the following ways: Data Limited data is available for the processes of construction and maintenance. Limited LCI/LCA data exist that is based on industry owned U.S. data for materials and other consumables except cement. The PCA cement data date back to 2002, an update is desirable. System boundaries Only the pavement and the base are considered in this study. This fits well within the proposed goals for this study, but it limits the use of the conclusions in relation to other pavement aspects that we have not considered.
3.8 Critical review
The ISO standards are strict in defining when a critical review is necessary and what the depth of the review should be. A stakeholder procedure and third party critical review is required for external use of comparisons where parties, other than just the commissioner, are stakeholders. This is a screening LCA for MDOT to reflect on possible trends on the use of sustainable recycled content. This goal does not require a critical review procedure.
MDOT ORE0904B Sustainability evaluation – LCA based indicators
page 23 of 55 09.0070-R09.0097
4 INVENTORY
This chapter lays down the starting points for the inventory stage of the LCA.
4.1 Data categories
Impacts have been inventoried for the following data categories; - energy inputs - material inputs - emissions to air, water and soil - production of waste and treatment - produced products
The above mentioned flows are called data categories. They define the scope of the inventory.
4.2 Data quality
This is a screening LCA. We aim to have sufficient data quality for trend based conclusion on the use of recycled material in MDOT highway pavement design. We think we achieved a good enough data quality to be able to assess these trends. We recognize that we can improve on the current data quality, both in the supply chain and the construction and maintenance processes.
4.3 Data collection
Cement For the American market few good data sources for cement exist. The best published source is the PCA report [8] that includes an LCI for Portland cement based on nationwide statistics on energy and resource consumption and reported emissions. We used this study in two ways to make it more specific to Michigan. We applied the Michigan mix of manufacturing techniques consisting of wet kilns (+/-20% vs. 2002 national average 16.5%), precalciner (+/-28% vs. 2002 national average 53.3%) and long dry (+/-52% vs. 2002 national average 14.4%). Michigan does not operate with a preheater (15.8% 2002 national average). This makes the Michigan cement kiln population worse than the PCA average. The second way we used the data is that we manipulated it using cement inventory data that we collected from cement plants that supply to Michigan DOT. We contacted all of them with a questionnaire and have used the provided data to benchmark and update some of the LCI parameters. We came up with some major differences in applying the LCI to an LCA, especially for the energy
MDOT ORE0904B Sustainability evaluation – LCA based indicators
page 24 of 55 09.0070-R09.0097
consumption figure. The PCA data do not cover a full cradle-to-gate perspective. One example is the use of electricity. The average electricity per ton is 144 kWh, this is translated in the energy overview into 520 MJ of energy input. This features the unit conversion, but not the fuel resource consumption in producing electricity, which is typically less than 40%. The total energy consumption from electricity should therefore be at least 2.5 times higher, around 10 MJ of primary energy per kWh of electricity consumed. Other examples are the accounting for petcokes and bituminous coal which are widely used and show significant differences. Where the PCA study provides a good LCI, it’s translation into energy consumed does not reflect the full cradle-to-grave perspective, and therefore cannot be compared to a full LCA perspective. The full LCA has an energy consumption that is approximately 25% higher. Those are the values that are reflected in this study. Based on the inventory under the cement plants we can conclude that the variation in reported data was larger than expected. Also most plants that reported data use petcokes and bituminous coal. This stresses the need for a well defined inventory and set of rules for reporting. We used actual transportation data for the different mixes based on a selection of 8 pavement sections. Other concrete mix ingredients The mix design for the concrete is based on 4 typical types of concrete that are applied in Michigan, all using natural aggregates, but with varying levels of Portland cement and SCMs. We modeled a straight Portland cement mix and mixes with 20, 30 and 40% of SCMs such as granulated blast furnace slag cement or fly ash. The LCA data for the different ingredients are sourced from literature, mostly from EcoInvent that has been adjusted for U.S. background data. One notable data point is that we assumed drying for the slag with natural gas. We used actual transportation data for the different mixes based on a selection of 8 pavement sections. Construction process Based on data collected from a recent construction project on I-96 diesel consumption patterns have been assumed for the on-site ready mixing and paving for both the base and the pavement. These are rough estimates. Maintenance processes All maintenance processes have been estimated in relation to the construction process data. End of life All end of life processes have been estimated.
MDOT ORE0904B Sustainability evaluation – LCA based indicators
page 25 of 55 09.0070-R09.0097
5 IMPACT ASSESSMENT
This chapter lays down the starting points for the impact assessment.
5.1 Impact assessment
We followed the CML-II classification and characterization for Carbon footprint, acidification and eutrophication. We calculated the energy consumption based on energy content. We applied 2nd order energy factors. The recycled content percentage is based on the composition of the actual pavement and base. The number of metric tonne.miles is the sum of all transportation related to material consumption and waste treatment over the life cycle of the assessment pavement scenarios. Appendix B. includes a definition of the CML-II impacts indicators. Appendix C. includes the applied impact assessment factors for carbon footprint, acidification, eutrophication and energy as they have been applied.
5.2 Normalization and weighting
Normalization and weighting are not part of this project.
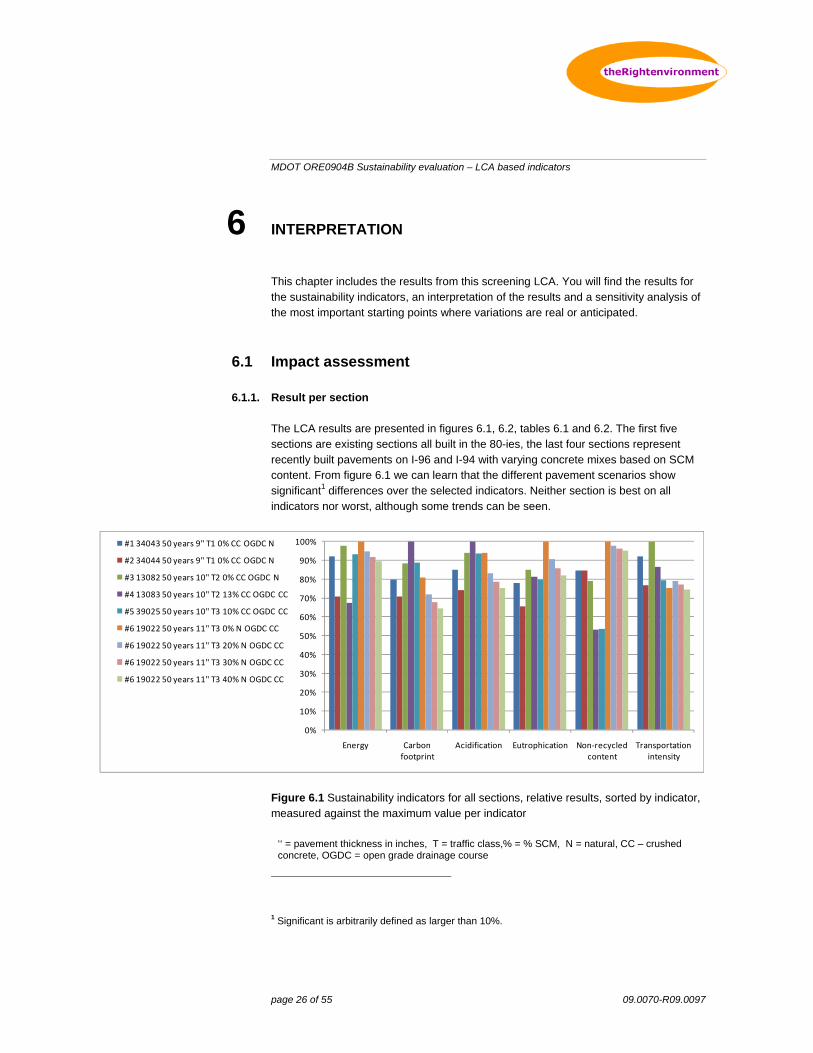
MDOT ORE0904B Sustainability evaluation – LCA based indicators
page 26 of 55 09.0070-R09.0097
6 INTERPRETATION
This chapter includes the results from this screening LCA. You will find the results for the sustainability indicators, an interpretation of the results and a sensitivity analysis of the most important starting points where variations are real or anticipated.
6.1 Impact assessment
6.1.1. Result per section The LCA results are presented in figures 6.1, 6.2, tables 6.1 and 6.2. The first five sections are existing sections all built in the 80-ies, the last four sections represent recently built pavements on I-96 and I-94 with varying concrete mixes based on SCM content. From figure 6.1 we can learn that the different pavement scenarios show significant1 differences over the selected indicators. Neither section is best on all indicators nor worst, although some trends can be seen.
0%
10%
20%
30%
40%
50%
60%
70%
80%
90%
100%
Energy Carbon footprint
Acidification Eutrophication Non‐recycled content
Transportation intensity
#1 34043 50 years 9" T1 0% CC OGDC N
#2 34044 50 years 9" T1 0% CC OGDC N
#3 13082 50 years 10" T2 0% CC OGDC N
#4 13083 50 years 10" T2 13% CC OGDC CC
#5 39025 50 years 10" T3 10% CC OGDC CC
#6 19022 50 years 11" T3 0% N OGDC CC
#6 19022 50 years 11" T3 20% N OGDC CC
#6 19022 50 years 11" T3 30% N OGDC CC
#6 19022 50 years 11" T3 40% N OGDC CC
Figure 6.1 Sustainability indicators for all sections, relative results, sorted by indicator, measured against the maximum value per indicator
‘‘ = pavement thickness in inches, T = traffic class,% = % SCM, N = natural, CC – crushed concrete, OGDC = open grade drainage course
1 Significant is arbitrarily defined as larger than 10%.
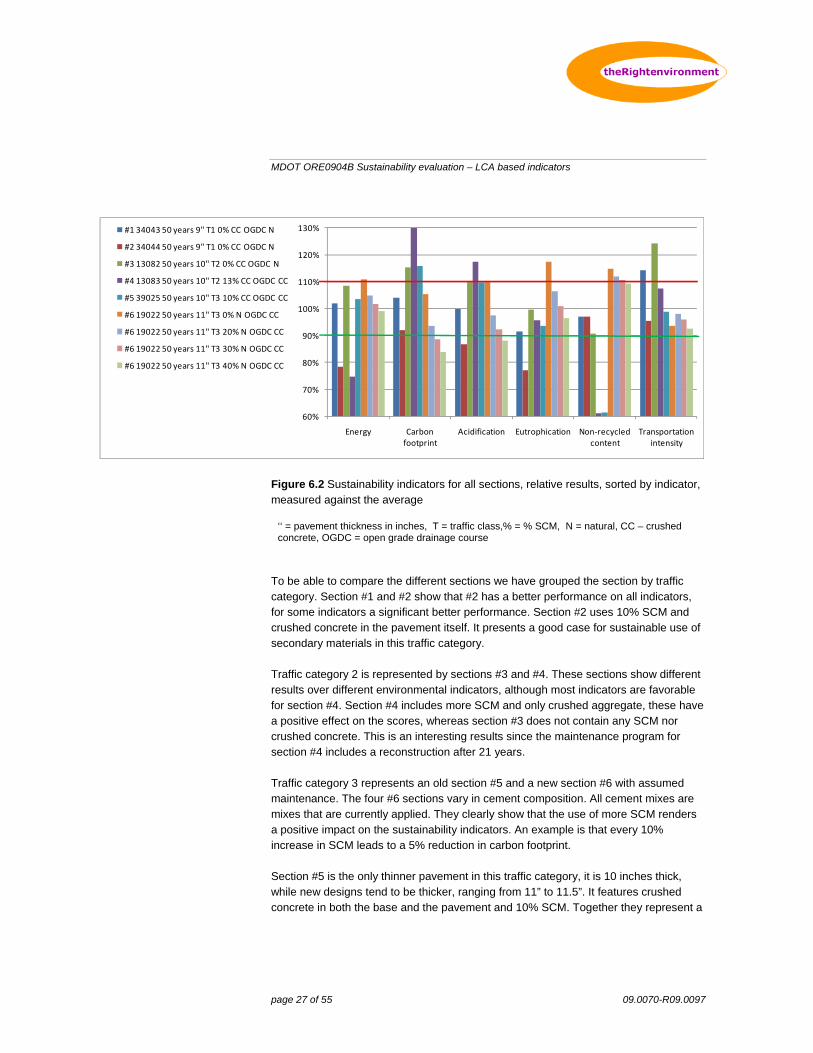
MDOT ORE0904B Sustainability evaluation – LCA based indicators
page 27 of 55 09.0070-R09.0097
60%
70%
80%
90%
100%
110%
120%
130%
Energy Carbon footprint
Acidification Eutrophication Non‐recycled content
Transportation intensity
#1 34043 50 years 9" T1 0% CC OGDC N
#2 34044 50 years 9" T1 0% CC OGDC N
#3 13082 50 years 10" T2 0% CC OGDC N
#4 13083 50 years 10" T2 13% CC OGDC CC
#5 39025 50 years 10" T3 10% CC OGDC CC
#6 19022 50 years 11" T3 0% N OGDC CC
#6 19022 50 years 11" T3 20% N OGDC CC
#6 19022 50 years 11" T3 30% N OGDC CC
#6 19022 50 years 11" T3 40% N OGDC CC
Figure 6.2 Sustainability indicators for all sections, relative results, sorted by indicator, measured against the average
‘‘ = pavement thickness in inches, T = traffic class,% = % SCM, N = natural, CC – crushed concrete, OGDC = open grade drainage course
To be able to compare the different sections we have grouped the section by traffic category. Section #1 and #2 show that #2 has a better performance on all indicators, for some indicators a significant better performance. Section #2 uses 10% SCM and crushed concrete in the pavement itself. It presents a good case for sustainable use of secondary materials in this traffic category. Traffic category 2 is represented by sections #3 and #4. These sections show different results over different environmental indicators, although most indicators are favorable for section #4. Section #4 includes more SCM and only crushed aggregate, these have a positive effect on the scores, whereas section #3 does not contain any SCM nor crushed concrete. This is an interesting results since the maintenance program for section #4 includes a reconstruction after 21 years. Traffic category 3 represents an old section #5 and a new section #6 with assumed maintenance. The four #6 sections vary in cement composition. All cement mixes are mixes that are currently applied. They clearly show that the use of more SCM renders a positive impact on the sustainability indicators. An example is that every 10% increase in SCM leads to a 5% reduction in carbon footprint. Section #5 is the only thinner pavement in this traffic category, it is 10 inches thick, while new designs tend to be thicker, ranging from 11” to 11.5”. It features crushed concrete in both the base and the pavement and 10% SCM. Together they represent a
MDOT ORE0904B Sustainability evaluation – LCA based indicators
page 28 of 55 09.0070-R09.0097
good sustainable performance. This is also reflected in a similar maintenance program for both the #5 and #6 sections.
6.1.2. Major contributions The major contributions for all sections are presented in appendix B. The general conclusions from the contributions are that: The most important parameters are:
- The concrete pavement itself - The lifespan of the concrete pavement - The full utilization of HMA overlay before reconstruction
Within these parameters the following guidance can be given:
- optimization of the lifespan of the concrete pavement is most important - use SCM and thereby reduce the amount of clinker - use local materials and thereby reduce the amount of transportation - reuse local materials and thereby reduce the amount of transportation and
mining - an HMA overlay should only be applied if the full potential lifespan of the
overlay can be utilized before a reconstruction is necessary The use of crushed concrete in the concrete pavement itself has been applied with mixed results, and is currently not applied anymore. There are pavement sections that perform well that include crushed concrete. It is recommended to study well performing pavement with crushed concrete in it to define what does work and evaluate how that success can be repeated. A last remark is that the maintenance programs that are modeled do not include a scenario where a thicker pavement is treated by diamond grinding and grooving instead of using an HMA overlay. This is a strategy that some other DOT’s have applied. Based on the major contribution this could be an interesting scenario for concrete pavement and the use of more recycled content and SCMs.
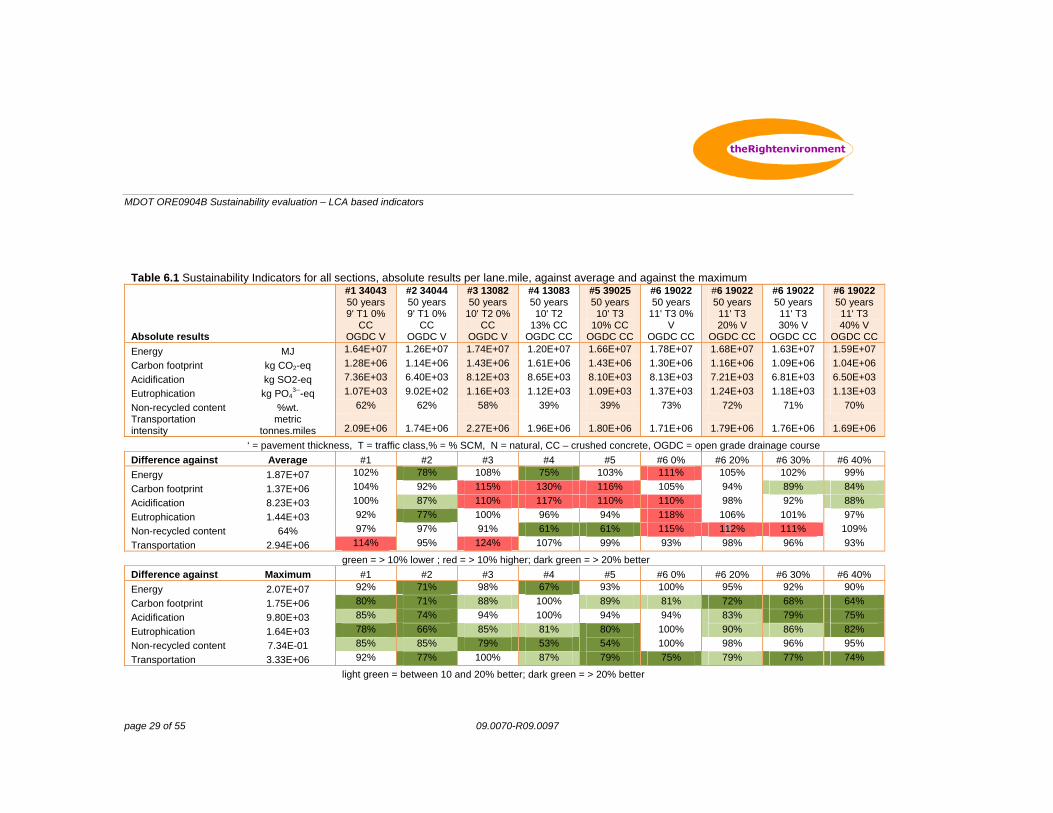
MDOT ORE0904B Sustainability evaluation – LCA based indicators
page 29 of 55 09.0070-R09.0097
Table 6.1 Sustainability Indicators for all sections, absolute results per lane.mile, against average and against the maximum
Absolute results
#1 34043 50 years 9' T1 0%
CC OGDC V
#2 34044 50 years 9' T1 0%
CC OGDC V
#3 13082 50 years
10' T2 0% CC
OGDC V
#4 13083 50 years 10' T2
13% CC OGDC CC
#5 39025 50 years 10' T3
10% CC OGDC CC
#6 19022 50 years
11' T3 0% V
OGDC CC
#6 19022 50 years 11' T3 20% V
OGDC CC
#6 19022 50 years 11' T3 30% V
OGDC CC
#6 19022 50 years 11' T3 40% V
OGDC CC
Energy MJ 1.64E+07 1.26E+07 1.74E+07 1.20E+07 1.66E+07 1.78E+07 1.68E+07 1.63E+07 1.59E+07
Carbon footprint kg CO2-eq 1.28E+06 1.14E+06 1.43E+06 1.61E+06 1.43E+06 1.30E+06 1.16E+06 1.09E+06 1.04E+06
Acidification kg SO2-eq 7.36E+03 6.40E+03 8.12E+03 8.65E+03 8.10E+03 8.13E+03 7.21E+03 6.81E+03 6.50E+03
Eutrophication kg PO43---eq 1.07E+03 9.02E+02 1.16E+03 1.12E+03 1.09E+03 1.37E+03 1.24E+03 1.18E+03 1.13E+03
Non-recycled content %wt. 62% 62% 58% 39% 39% 73% 72% 71% 70% Transportation intensity
metric tonnes.miles 2.09E+06 1.74E+06 2.27E+06 1.96E+06 1.80E+06 1.71E+06 1.79E+06 1.76E+06 1.69E+06
‘ = pavement thickness, T = traffic class,% = % SCM, N = natural, CC – crushed concrete, OGDC = open grade drainage course
Difference against Average #1 #2 #3 #4 #5 #6 0% #6 20% #6 30% #6 40%
Energy 1.87E+07 102% 78% 108% 75% 103% 111% 105% 102% 99%
Carbon footprint 1.37E+06 104% 92% 115% 130% 116% 105% 94% 89% 84%
Acidification 8.23E+03 100% 87% 110% 117% 110% 110% 98% 92% 88%
Eutrophication 1.44E+03 92% 77% 100% 96% 94% 118% 106% 101% 97%
Non-recycled content 64% 97% 97% 91% 61% 61% 115% 112% 111% 109%
Transportation 2.94E+06 114% 95% 124% 107% 99% 93% 98% 96% 93%
green = > 10% lower ; red = > 10% higher; dark green = > 20% better
Difference against Maximum #1 #2 #3 #4 #5 #6 0% #6 20% #6 30% #6 40%
Energy 2.07E+07 92% 71% 98% 67% 93% 100% 95% 92% 90%
Carbon footprint 1.75E+06 80% 71% 88% 100% 89% 81% 72% 68% 64%
Acidification 9.80E+03 85% 74% 94% 100% 94% 94% 83% 79% 75%
Eutrophication 1.64E+03 78% 66% 85% 81% 80% 100% 90% 86% 82%
Non-recycled content 7.34E-01 85% 85% 79% 53% 54% 100% 98% 96% 95%
Transportation 3.33E+06 92% 77% 100% 87% 79% 75% 79% 77% 74%
light green = between 10 and 20% better; dark green = > 20% better
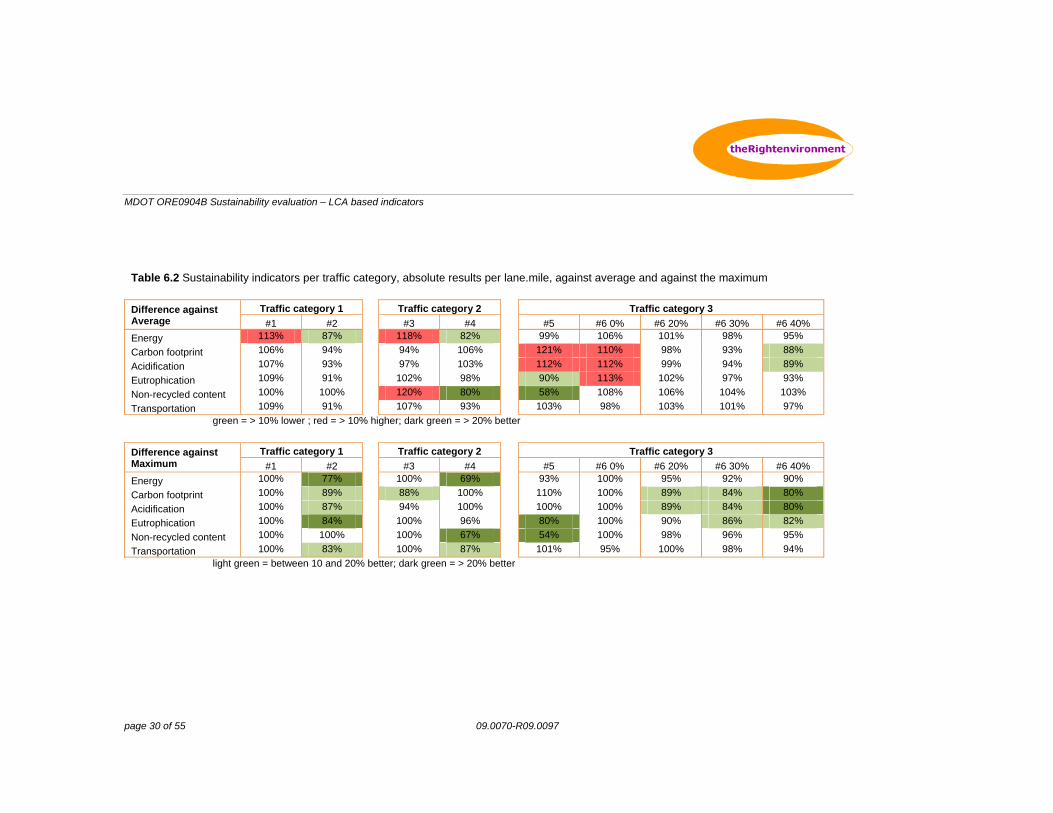
MDOT ORE0904B Sustainability evaluation – LCA based indicators
page 30 of 55 09.0070-R09.0097
Table 6.2 Sustainability indicators per traffic category, absolute results per lane.mile, against average and against the maximum
Difference against Average
Traffic category 1 Traffic category 2 Traffic category 3
#1 #2 #3 #4 #5 #6 0% #6 20% #6 30% #6 40%
Energy 113% 87% 118% 82% 99% 106% 101% 98% 95%
Carbon footprint 106% 94% 94% 106% 121% 110% 98% 93% 88%
Acidification 107% 93% 97% 103% 112% 112% 99% 94% 89%
Eutrophication 109% 91% 102% 98% 90% 113% 102% 97% 93%
Non-recycled content 100% 100% 120% 80% 58% 108% 106% 104% 103%
Transportation 109% 91% 107% 93% 103% 98% 103% 101% 97%
green = > 10% lower ; red = > 10% higher; dark green = > 20% better
Difference against Maximum
Traffic category 1 Traffic category 2 Traffic category 3
#1 #2 #3 #4 #5 #6 0% #6 20% #6 30% #6 40%
Energy 100% 77% 100% 69% 93% 100% 95% 92% 90%
Carbon footprint 100% 89% 88% 100% 110% 100% 89% 84% 80%
Acidification 100% 87% 94% 100% 100% 100% 89% 84% 80%
Eutrophication 100% 84% 100% 96% 80% 100% 90% 86% 82%
Non-recycled content 100% 100% 100% 67% 54% 100% 98% 96% 95%
Transportation 100% 83% 100% 87% 101% 95% 100% 98% 94%
light green = between 10 and 20% better; dark green = > 20% better
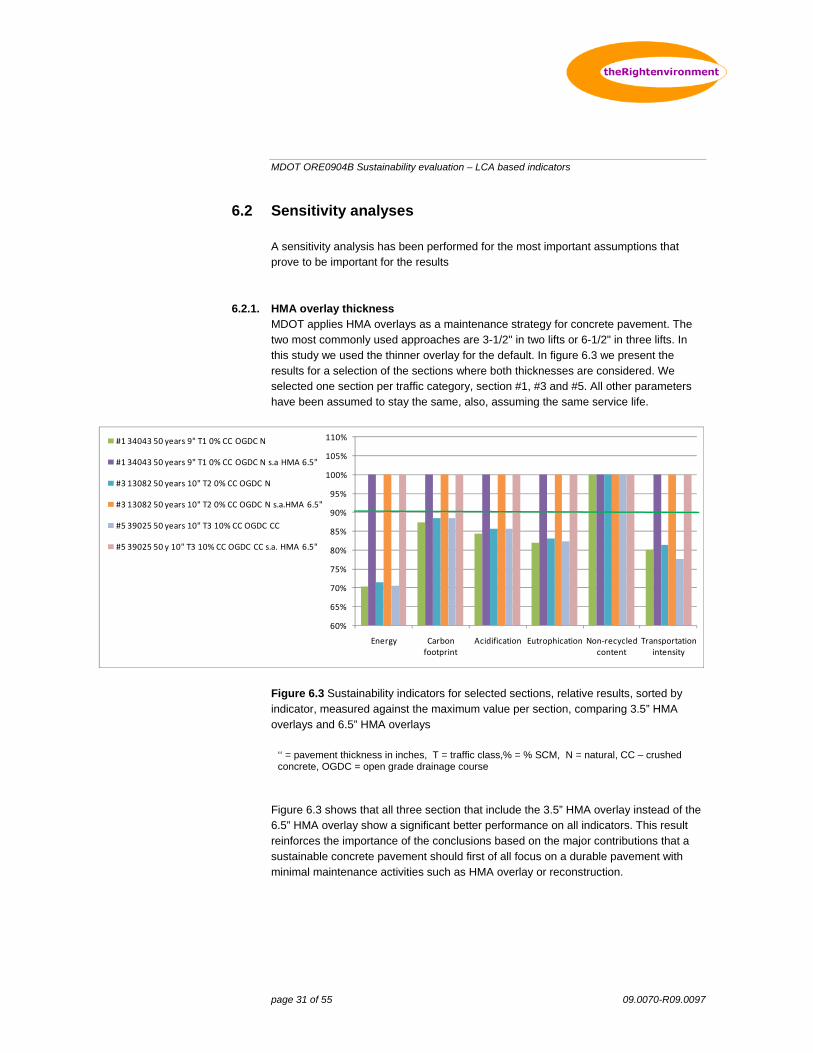
MDOT ORE0904B Sustainability evaluation – LCA based indicators
page 31 of 55 09.0070-R09.0097
6.2 Sensitivity analyses
A sensitivity analysis has been performed for the most important assumptions that prove to be important for the results
6.2.1. HMA overlay thickness MDOT applies HMA overlays as a maintenance strategy for concrete pavement. The two most commonly used approaches are 3-1/2" in two lifts or 6-1/2" in three lifts. In this study we used the thinner overlay for the default. In figure 6.3 we present the results for a selection of the sections where both thicknesses are considered. We selected one section per traffic category, section #1, #3 and #5. All other parameters have been assumed to stay the same, also, assuming the same service life.
60%
65%
70%
75%
80%
85%
90%
95%
100%
105%
110%
Energy Carbon footprint
Acidification Eutrophication Non‐recycled content
Transportation intensity
#1 34043 50 years 9" T1 0% CC OGDC N
#1 34043 50 years 9" T1 0% CC OGDC N s.a HMA 6.5"
#3 13082 50 years 10" T2 0% CC OGDC N
#3 13082 50 years 10" T2 0% CC OGDC N s.a.HMA 6.5"
#5 39025 50 years 10" T3 10% CC OGDC CC
#5 39025 50 y 10" T3 10% CC OGDC CC s.a. HMA 6.5"
Figure 6.3 Sustainability indicators for selected sections, relative results, sorted by indicator, measured against the maximum value per section, comparing 3.5” HMA overlays and 6.5” HMA overlays
‘‘ = pavement thickness in inches, T = traffic class,% = % SCM, N = natural, CC – crushed concrete, OGDC = open grade drainage course
Figure 6.3 shows that all three section that include the 3.5” HMA overlay instead of the 6.5” HMA overlay show a significant better performance on all indicators. This result reinforces the importance of the conclusions based on the major contributions that a sustainable concrete pavement should first of all focus on a durable pavement with minimal maintenance activities such as HMA overlay or reconstruction.
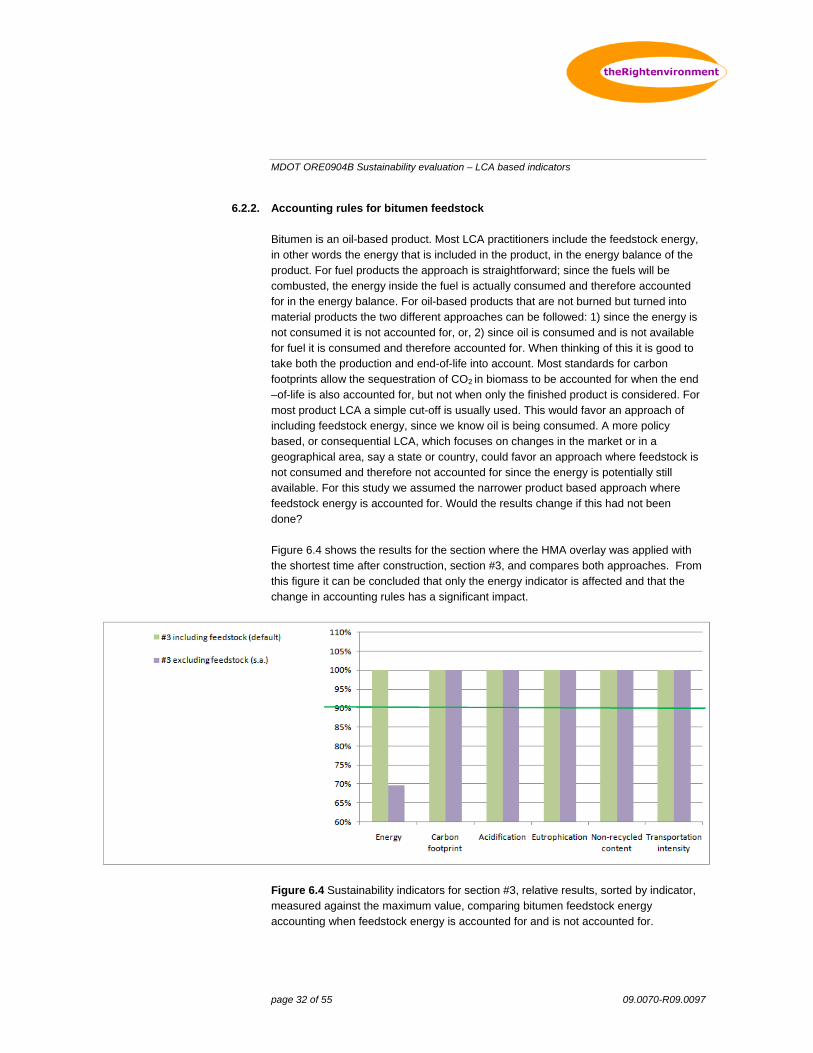
MDOT ORE0904B Sustainability evaluation – LCA based indicators
page 32 of 55 09.0070-R09.0097
6.2.2. Accounting rules for bitumen feedstock Bitumen is an oil-based product. Most LCA practitioners include the feedstock energy, in other words the energy that is included in the product, in the energy balance of the product. For fuel products the approach is straightforward; since the fuels will be combusted, the energy inside the fuel is actually consumed and therefore accounted for in the energy balance. For oil-based products that are not burned but turned into material products the two different approaches can be followed: 1) since the energy is not consumed it is not accounted for, or, 2) since oil is consumed and is not available for fuel it is consumed and therefore accounted for. When thinking of this it is good to take both the production and end-of-life into account. Most standards for carbon footprints allow the sequestration of CO2 in biomass to be accounted for when the end –of-life is also accounted for, but not when only the finished product is considered. For most product LCA a simple cut-off is usually used. This would favor an approach of including feedstock energy, since we know oil is being consumed. A more policy based, or consequential LCA, which focuses on changes in the market or in a geographical area, say a state or country, could favor an approach where feedstock is not consumed and therefore not accounted for since the energy is potentially still available. For this study we assumed the narrower product based approach where feedstock energy is accounted for. Would the results change if this had not been done? Figure 6.4 shows the results for the section where the HMA overlay was applied with the shortest time after construction, section #3, and compares both approaches. From this figure it can be concluded that only the energy indicator is affected and that the change in accounting rules has a significant impact.
Figure 6.4 Sustainability indicators for section #3, relative results, sorted by indicator, measured against the maximum value, comparing bitumen feedstock energy accounting when feedstock energy is accounted for and is not accounted for.
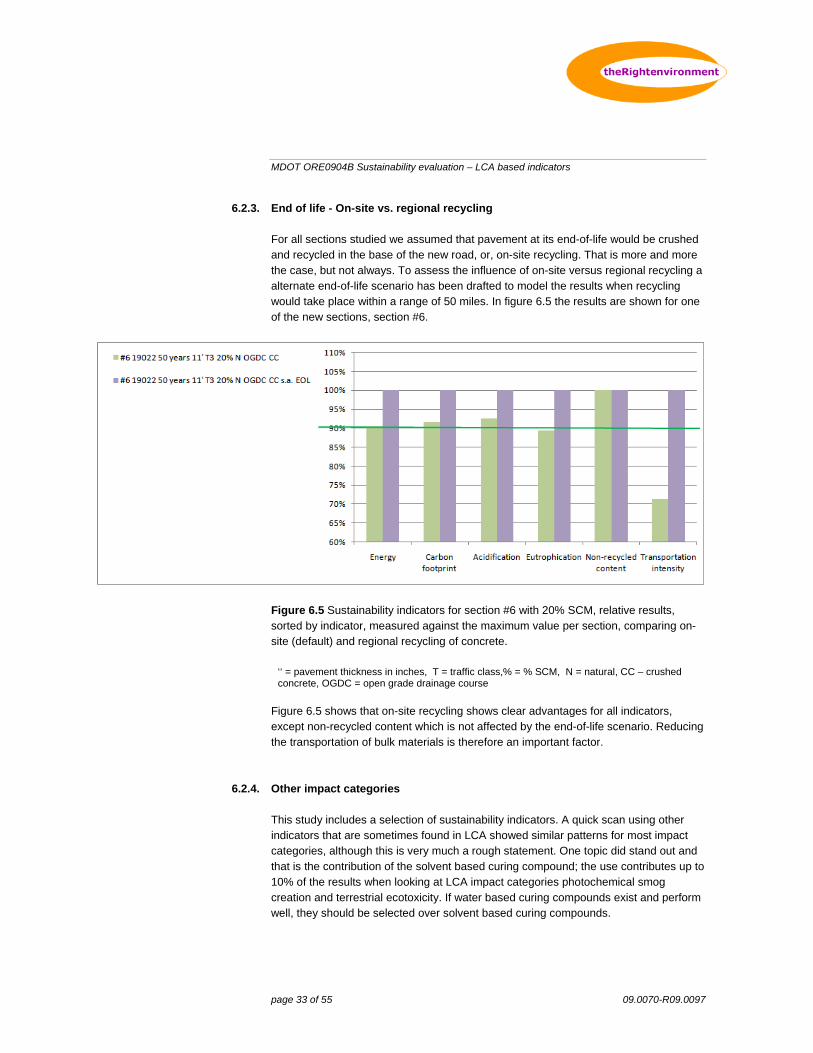
MDOT ORE0904B Sustainability evaluation – LCA based indicators
page 33 of 55 09.0070-R09.0097
6.2.3. End of life - On-site vs. regional recycling For all sections studied we assumed that pavement at its end-of-life would be crushed and recycled in the base of the new road, or, on-site recycling. That is more and more the case, but not always. To assess the influence of on-site versus regional recycling a alternate end-of-life scenario has been drafted to model the results when recycling would take place within a range of 50 miles. In figure 6.5 the results are shown for one of the new sections, section #6.
Figure 6.5 Sustainability indicators for section #6 with 20% SCM, relative results, sorted by indicator, measured against the maximum value per section, comparing on-site (default) and regional recycling of concrete.
‘‘ = pavement thickness in inches, T = traffic class,% = % SCM, N = natural, CC – crushed concrete, OGDC = open grade drainage course
Figure 6.5 shows that on-site recycling shows clear advantages for all indicators, except non-recycled content which is not affected by the end-of-life scenario. Reducing the transportation of bulk materials is therefore an important factor.
6.2.4. Other impact categories This study includes a selection of sustainability indicators. A quick scan using other indicators that are sometimes found in LCA showed similar patterns for most impact categories, although this is very much a rough statement. One topic did stand out and that is the contribution of the solvent based curing compound; the use contributes up to 10% of the results when looking at LCA impact categories photochemical smog creation and terrestrial ecotoxicity. If water based curing compounds exist and perform well, they should be selected over solvent based curing compounds.
MDOT ORE0904B Sustainability evaluation – LCA based indicators
page 34 of 55 09.0070-R09.0097
7 SOURCES
[1] ISO 14044, “Environmental management - Life cycle assessment - Requirements and guidelines”, ISO14044:2006
[2] CML 2002, “CML-IA - CML's impact assessment methods and characterization factors”, Last update: July 2002.
[3] USLCI, 2008. US Life Cycle Inventory Database, Aug 26, 2008 V 1.6.0. http://www.nrel.gov/lci/
[4] EcoInvent, 2007. ‘Overview and Methodology’, data v2.0, EcoInvent report No.1, December 2007
[5] MDOT, 2003. Standard Specifications for Construction. [6] MDOT, 2009. Special Provision for Open-Graded Drainage Course, Modified (Portland
cement-treated permeable base using crushed concrete). C&T:JFS C&T:APPR:ARB:CJB:06-12-09
[7] MDOT, 2005. Special provision for high performance Portland cement concrete grade P1 (Modified) C&T:APPR:ACR:CJB:09-13-04 Revised:08-05-05
[8] Medgar L. Marceau et.al, 2006, “Life Cycle Inventory of Portland Cement
Manufacture”, PCA R&D Serial No. SN2095b
[9] Medgar L. Marceau et.al, 2007, “Life Cycle Inventory of Portland Cement Concrete”, PCA R&D Serial No. SN3011
[10] Nicholas Santero et.al, 2010, “Life Cycle Assessment of Pavements: A Critical Review of Existing Literature and Research”, PCA R&D Serial No. SN3119a
[11] Athena Institute, 2006,” A Life Cycle Perspective on Concrete and Asphalt Roadways: Embodied Primary Energy and Global Warming Potential”. Cement Association of Canada. Prepared for the Cement Association of Canada. 2006.
[12] Chan, A.W.-C., 2007, “Economic and Environmental Evaluations of Life Cycle Cost Analysis Practice: A Case Study of Michigan DOT Pavement Projects”, Master of Science Thesis in Natural Resource and Environment, University of Michigan, 2007.
[13] MDOT, several documents including mix designs for sections and diesel consumption for construction practices in on-site ready mixing plants and paving processes
[14] MDOT, several emails from project team members on starting points [15] Cement suppliers, several filled out questionnaires with process data on cement
manufacturing (confidential). [16] MDOT, 2005. Pavement Design and Selection, Manual. Michigan Department of
Transportation, Lansing, MI.
MDOT ORE0904B Sustainability evaluation – LCA based indicators
page 35 of 55 09.0070-R09.0097
ACRONYMS
CPR Concrete Pavement Repair ISO International Standardization Organization
JPCP Jointed Plain Concrete Pavement JRCP Jointed Reinforced Concrete Pavement
LCA life cycle assessment LCI life cycle inventory
LCIA life cycle impact analysis OGDC open-graded drainage course
P1 High performance Portland cement concrete grade P1 (MDOT provisions)
DEFINITIONS
LCA For the purposes of this report, the terms and definitions given in ISO 14020, ISO 14025, ISO 14040, ISO 14041, ISO 14042, ISO 14043, ISO 14044 and ISO 21930 apply. The most important ones are included here:
aggregation aggregation of data allocation partitioning the input or output flows of a process or a product system between the
product system under study and one or more other product systems ancillary input material input that is used by the unit process producing the product, but does not
constitute part of the product building element largest functional part of a building building material material that can be used to produce building products or constructions building product item produced or fabricated to be part of a construction capital good Means, for instance ancillary input needed for activities, and all handling equipment
during the life cycle that can be characterised by a relative long lifespan and can be (re)used many times
category endpoint attribute or aspect of natural environment, human health, or resources, identifying an environmental issue giving cause for concern
characterization factor factor derived from a characterization model which is applied to convert an assigned life cycle inventory analysis result to the common unit of the category indicator
comparative assertion environmental claim regarding the superiority or equivalence of one product versus a competing product that performs the same function
completeness check process of verifying whether information from the phases of a life cycle assessment is sufficient for reaching conclusions in accordance with the goal and scope definition
consistency check process of verifying that the assumptions, methods and data are consistently applied throughout the study and are in accordance with the goal and scope definition performed before conclusions are reached
MDOT ORE0904B Sustainability evaluation – LCA based indicators
page 36 of 55 09.0070-R09.0097
construction / work everything that can be constructed or is the result of construction work construction work activities to assemble works or constructions co-product any of two or more products coming from the same unit process or product system critical review process intended to ensure consistency between a life cycle assessment and the
principles and requirements of the International Standards on life cycle assessment cut-off criteria specification of the amount of material or energy flow or the level of environmental
significance associated with unit processes or product system to be excluded from a study
data quality characteristics of data that relate to their ability to satisfy stated requirements elementary flow material or energy entering the system being studied that has been drawn from the
environment without previous human transformation, or material or energy leaving the system being studied that is released into the environment without subsequent human transformation
energy flow input to or output from a unit process or product system, quantified in energy units environmental aspect element of an organization's activities, products or services that can interact with the
environment environmental measure series of certain quantities, based on economic flows and weighing of environmental
effects. environmental mechanism
system of physical, chemical and biological processes for a given impact category, linking the life cycle inventory analysis results to category indicators and to category endpoints
environmental profile a series of environmental effects evaluation element within the life cycle interpretation phase intended to establish confidence in
the results of the life cycle assessment feedstock energy heat of combustion of a raw material input that is not used as an energy source to a
product system, expressed in terms of higher heating value or lower heating value functional lifespan the period or time during which a building or a building element fulfils the
performance requirements functional unit quantified performance of a product system for use as a reference unit impact category class representing environmental issues of concern to which life cycle inventory
analysis results may be assigned impact category indicator
quantifiable representation of an impact category
Input product, material or energy flow that enters a unit process interested party individual or group concerned with or affected by the environmental performance of a
product system, or by the results of the life cycle assessment intermediate flow product, material or energy flow occurring between unit processes of the product
system being studied intermediate product output from a unit process that is input to other unit processes that require further
transformation within the system life cycle consecutive and interlinked stages of a product system, from raw material acquisition
or generation from natural resources to final disposal life cycle assessment LCA
compilation and evaluation of the inputs, outputs and the potential environmental impacts of a product system throughout its life cycle
MDOT ORE0904B Sustainability evaluation – LCA based indicators
page 37 of 55 09.0070-R09.0097
life cycle impact assessment LCIA
phase of life cycle assessment aimed at understanding and evaluating the magnitude and significance of the potential environmental impacts for a product system throughout the life cycle of the product
life cycle interpretation phase of life cycle assessment in which the findings of either the inventory analysis or the impact assessment, or both, are evaluated in relation to the defined goal and scope in order to reach conclusions and recommendations
life cycle inventory analysis LCI
phase of life cycle assessment involving the compilation and quantification of inputs and outputs for a product throughout its life cycle
life cycle inventory analysis result LCI result
outcome of a life cycle inventory analysis that catalogues the flows crossing the system boundary and provides the starting point for life cycle impact assessment
multi-input process a unit process where more than one flow enters from different product systems for combined processing
multi-output process a unit process that results in more than one flow used in different product systems output product, material or energy flow that leaves a unit process performance behaviour based on use primary material a material produced from raw materials primary production a production process that produces primary material process set of interrelated or interacting activities that transforms inputs into outputs process energy energy input required for operating the process or equipment within a unit process,
excluding energy inputs for production and delivery of the energy itself product any goods or service product flow products entering from or leaving to another product system product system collection of unit processes with elementary and product flows, performing one or
more defined functions, and which models the life cycle of a product raw material primary or secondary material that is used to produce a product recycling all processes needed to recycle a material, product or element as a material input reference flow measure of the outputs from processes in a given product system required to fulfil the
function expressed by the functional unit releases emissions to air and discharges to water and soil return system a system to collect waste material from the market for the purpose of recycling or
reuse reuse all processes needed to reuse a material, product or element in the same function secondary material material input produced from recycled materials secondary production production process that produces secondary material sensitivity analysis systematic procedures for estimating the effects of the choices made regarding
methods and data on the outcome of a study system boundary set of criteria specifying which unit processes are part of a product system third party person or body that is independent of the involved parties, and as such recognized transparency open, comprehensive and understandable presentation of information type -III-environmental declaration
quantified environmental data of a product with a predefined set of categories based on the ISO 14040 standards, without excluding the presentation of supplementing relevant environmental data, provided within the scope of a type-III-environmental declaration framework
MDOT ORE0904B Sustainability evaluation – LCA based indicators
page 38 of 55 09.0070-R09.0097
type -III-environmental declaration framework
voluntary process of an industrial sector or independent body to develop a type- III-environmental declaration, including a framework that defines the essential requirements, the selection of categories or parameters, the level of involvement of third parties and a template for external communication
uncertainty analysis systematic procedure to quantify the uncertainty introduced in the results of a life cycle inventory analysis due to the cumulative effects of model imprecision, input uncertainty and data variability
unit process smallest element considered in the life cycle inventory analysis for which input and output data are quantified
waste substances or objects which the holder intends or is required to dispose of Pavement
Fly ash Class C Fly ash that is produced from the burning of lignite or subbituminous coal, in addition to having pozzolanic properties, also has some self-cementing properties (ability to harden and gain strength in the presence of water alone). When this fly ash meets the chemical composition and physical requirements outlined in ASTM C618, it is referred to as a Class C fly ash. Most Class C fly ashes have self-cementing
properties. [Source: http://www.tfhrc.gov/hnr20/recycle/waste/cfa51.htm ] Fly ash Class F Fly ash that is produced from the burning of anthracite or bituminous coal is typically
pozzolanic and is referred to as a Class F fly ash if it meets the chemical composition and physical requirements specified in ASTM C618. Materials with pozzolanic properties contain glassy silica and alumina that will, in the presence of water and free lime, react with the calcium in the lime to produce calcium silicate hydrates (cementitious compounds). [Source:
http://www.tfhrc.gov/hnr20/recycle/waste/cfa51.htm ] Portland cement Type I Different types of portland cement are manufactured to meet various physical and
chemical requirements. The American Society for Testing and Materials (ASTM) Specification C-150 provides for eight types of portland cement.Type I portland cement is a normal, general-purpose cement suitable for all uses. It is used in general construction projects such as buildings, bridges, floors, pavements, and other precast concrete products.
Portland cement Type IA Type IA portland cement is similar to Type I with the addition of air-entraining properties.
Portland cement Type II Type II portland cement generates less heat at a slower rate and has a moderate resistance to sulfate attack.
Portland cement Type IIA
Type IIA portland cement is identical to Type II and produces air-entrained concrete.
Portland cement Type II Type III portland cement is high-early-strength cement and causes concrete to set and gain strength rapidly. Type III is chemically and physically similar to Type I, except that its particles have been ground finer.
Portland cement Type IIIA
Type IIIA is air-entraining, high-early-strength cement.
Portland cement Type IV Type IV portland cement has a low heat of hydration and develops strength at a slower rate than other cement types, making it ideal for use in dams and other massive concrete structures where there is little chance for heat to escape.

MDOT ORE0904B Sustainability evaluation – LCA based indicators
page 39 of 55 09.0070-R09.0097
Portland cement Type V Type V portland cement is used only in concrete structures that will be exposed to severe sulfate action, principally where concrete is exposed to soil and groundwater with a high sulfate content.
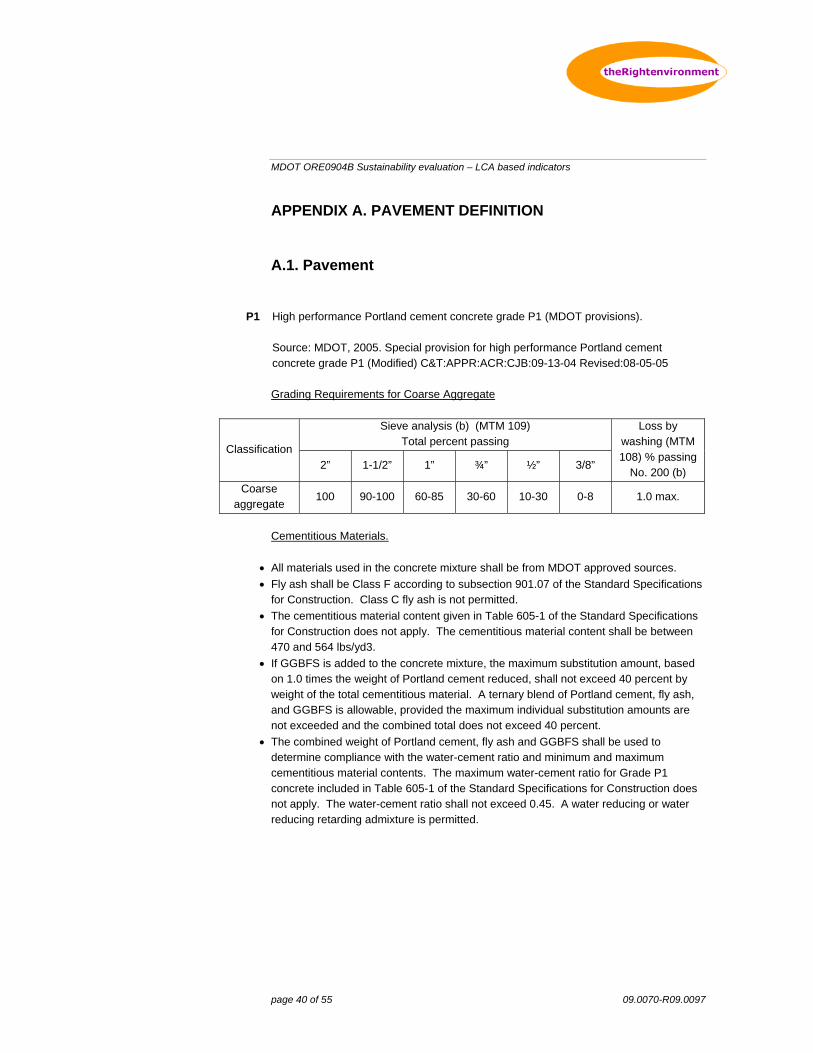
MDOT ORE0904B Sustainability evaluation – LCA based indicators
page 40 of 55 09.0070-R09.0097
APPENDIX A. PAVEMENT DEFINITION
A.1. Pavement
P1 High performance Portland cement concrete grade P1 (MDOT provisions).
Source: MDOT, 2005. Special provision for high performance Portland cement concrete grade P1 (Modified) C&T:APPR:ACR:CJB:09-13-04 Revised:08-05-05 Grading Requirements for Coarse Aggregate
Classification
Sieve analysis (b) (MTM 109) Total percent passing
Loss by washing (MTM 108) % passing
No. 200 (b) 2” 1-1/2” 1” ¾” ½” 3/8”
Coarse aggregate
100 90-100 60-85 30-60 10-30 0-8 1.0 max.
Cementitious Materials.
All materials used in the concrete mixture shall be from MDOT approved sources.
Fly ash shall be Class F according to subsection 901.07 of the Standard Specifications for Construction. Class C fly ash is not permitted.
The cementitious material content given in Table 605-1 of the Standard Specifications for Construction does not apply. The cementitious material content shall be between 470 and 564 lbs/yd3.
If GGBFS is added to the concrete mixture, the maximum substitution amount, based on 1.0 times the weight of Portland cement reduced, shall not exceed 40 percent by weight of the total cementitious material. A ternary blend of Portland cement, fly ash, and GGBFS is allowable, provided the maximum individual substitution amounts are not exceeded and the combined total does not exceed 40 percent.
The combined weight of Portland cement, fly ash and GGBFS shall be used to determine compliance with the water-cement ratio and minimum and maximum cementitious material contents. The maximum water-cement ratio for Grade P1 concrete included in Table 605-1 of the Standard Specifications for Construction does not apply. The water-cement ratio shall not exceed 0.45. A water reducing or water reducing retarding admixture is permitted.
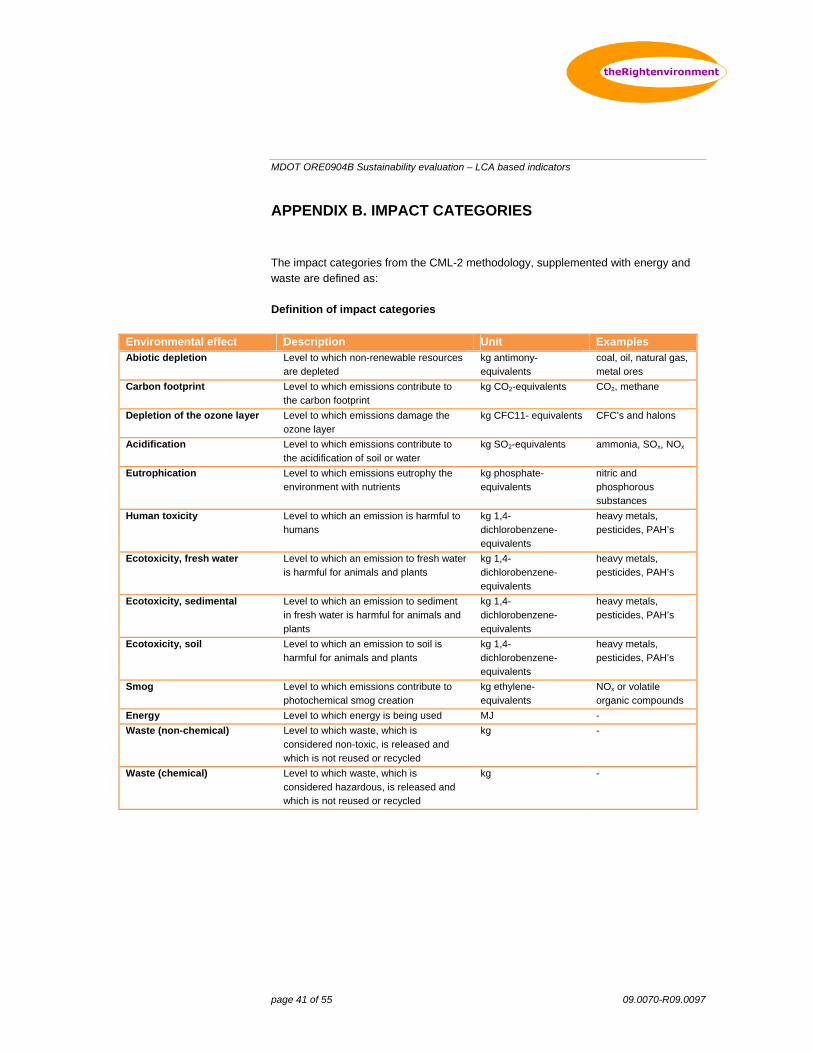
MDOT ORE0904B Sustainability evaluation – LCA based indicators
page 41 of 55 09.0070-R09.0097
APPENDIX B. IMPACT CATEGORIES
The impact categories from the CML-2 methodology, supplemented with energy and waste are defined as: Definition of impact categories
Environmental effect Description Unit Examples Abiotic depletion Level to which non-renewable resources
are depleted kg antimony-equivalents
coal, oil, natural gas, metal ores
Carbon footprint Level to which emissions contribute to the carbon footprint
kg CO2-equivalents CO2, methane
Depletion of the ozone layer Level to which emissions damage the ozone layer
kg CFC11- equivalents CFC’s and halons
Acidification Level to which emissions contribute to the acidification of soil or water
kg SO2-equivalents ammonia, SOx, NOx
Eutrophication Level to which emissions eutrophy the environment with nutrients
kg phosphate-equivalents
nitric and phosphorous substances
Human toxicity Level to which an emission is harmful to humans
kg 1,4-dichlorobenzene-equivalents
heavy metals, pesticides, PAH’s
Ecotoxicity, fresh water Level to which an emission to fresh water is harmful for animals and plants
kg 1,4-dichlorobenzene-equivalents
heavy metals, pesticides, PAH’s
Ecotoxicity, sedimental Level to which an emission to sediment in fresh water is harmful for animals and plants
kg 1,4-dichlorobenzene-equivalents
heavy metals, pesticides, PAH’s
Ecotoxicity, soil Level to which an emission to soil is harmful for animals and plants
kg 1,4-dichlorobenzene-equivalents
heavy metals, pesticides, PAH’s
Smog Level to which emissions contribute to photochemical smog creation
kg ethylene-equivalents
NOx or volatile organic compounds
Energy Level to which energy is being used MJ -
Waste (non-chemical) Level to which waste, which is considered non-toxic, is released and which is not reused or recycled
kg -
Waste (chemical) Level to which waste, which is considered hazardous, is released and which is not reused or recycled
kg -

MDOT ORE0904B Sustainability evaluation – LCA based indicators
page 42 of 55 09.0070-R09.0097
Impact assessment The CML-IA method represents the factors for classification and characterization of the life cycle inventory impacts. Combining the impacts with the classification factors renders the aggregated environmental profiles. After a brief introduction into the different methodologies, the applied classification factors are presented. Different impact assessment methodologies are being used in LCA. Most of them use the impact assessment defined by the CML-2 IA methodology and either limit or extend the range of impact categories. CML-2 IA uses the best scientific background and has the highest level of acceptance in the LCA community. A list of the most used impacts assessment methodologies includes the following:
• CML-2 Baseline v3.0 (Dutch) • Eco-Indicator 99 (Dutch, damage oriented) • Ecopoints 97 (Swiss, one score based on distance to policy targets) • EPS 2000 (Sweden/Nordic) • EDIP v2.1 (Danish)
From these the CML and the Eco-Indicator are most widely recognized and/or used. Others have either a more regional approach of focus on specific categories. The first is introduced here. CML-2 Baseline v3.0 The method is an update from the method in the Dutch Guide to LCA, published in 1992 by the Centre of Environmental Science (CML). This method is also referred to as “CML-2”. The methodology provides a list of impact assessment categories grouped into:
A. Obligatory impact categories (Category indicators used in most LCAs) B. Additional impact categories (operational indicators exist, but are not often included in
LCA studies) C. Other impact categories (no operational indicators available, therefore impossible to
include quantitatively in LCA) In case several methods are available for obligatory impact categories; a baseline indicator is selected, based on the principle of best available practice. These baseline indicators are category indicators at “mid-point level” (problem oriented approach)”. The guide provides guidelines for inclusion of other methods and impact category indicators. Baseline indicators are: Depletion of abiotic resources This impact category is concerned with protection of human welfare, human health and ecosystem health. This impact category indictor is related to extraction of minerals and
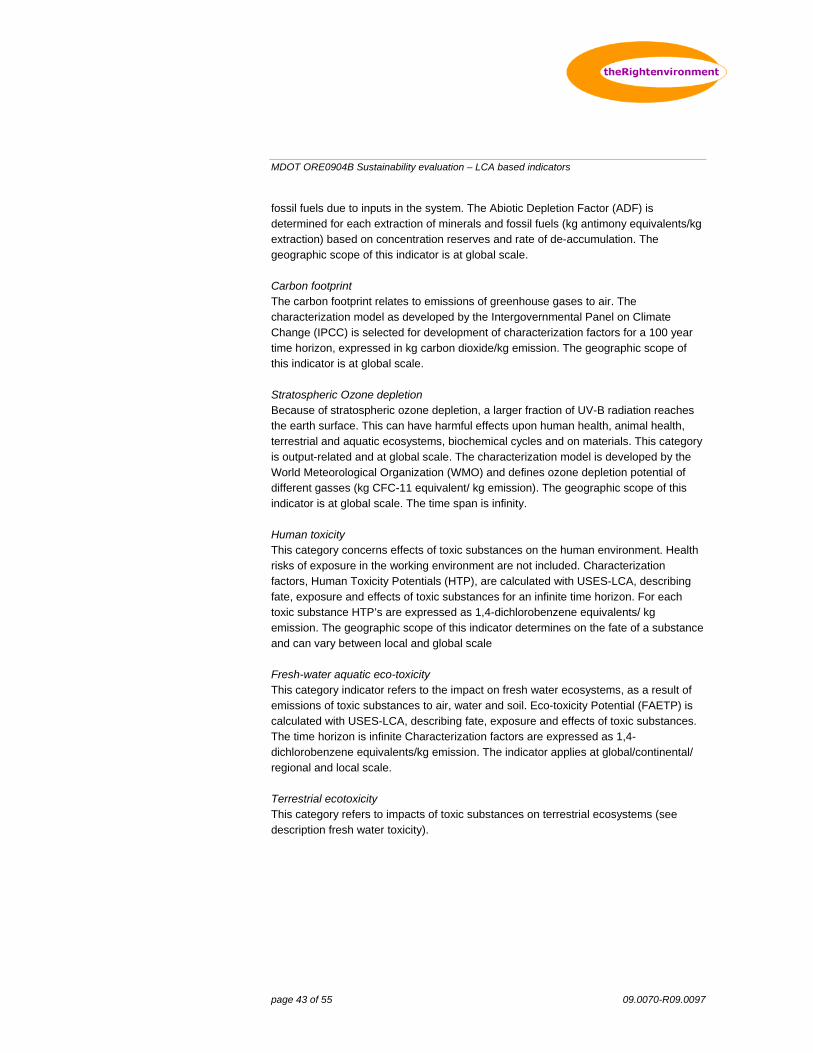
MDOT ORE0904B Sustainability evaluation – LCA based indicators
page 43 of 55 09.0070-R09.0097
fossil fuels due to inputs in the system. The Abiotic Depletion Factor (ADF) is determined for each extraction of minerals and fossil fuels (kg antimony equivalents/kg extraction) based on concentration reserves and rate of de-accumulation. The geographic scope of this indicator is at global scale. Carbon footprint The carbon footprint relates to emissions of greenhouse gases to air. The characterization model as developed by the Intergovernmental Panel on Climate Change (IPCC) is selected for development of characterization factors for a 100 year time horizon, expressed in kg carbon dioxide/kg emission. The geographic scope of this indicator is at global scale. Stratospheric Ozone depletion Because of stratospheric ozone depletion, a larger fraction of UV-B radiation reaches the earth surface. This can have harmful effects upon human health, animal health, terrestrial and aquatic ecosystems, biochemical cycles and on materials. This category is output-related and at global scale. The characterization model is developed by the World Meteorological Organization (WMO) and defines ozone depletion potential of different gasses (kg CFC-11 equivalent/ kg emission). The geographic scope of this indicator is at global scale. The time span is infinity. Human toxicity This category concerns effects of toxic substances on the human environment. Health risks of exposure in the working environment are not included. Characterization factors, Human Toxicity Potentials (HTP), are calculated with USES-LCA, describing fate, exposure and effects of toxic substances for an infinite time horizon. For each toxic substance HTP’s are expressed as 1,4-dichlorobenzene equivalents/ kg emission. The geographic scope of this indicator determines on the fate of a substance and can vary between local and global scale Fresh-water aquatic eco-toxicity This category indicator refers to the impact on fresh water ecosystems, as a result of emissions of toxic substances to air, water and soil. Eco-toxicity Potential (FAETP) is calculated with USES-LCA, describing fate, exposure and effects of toxic substances. The time horizon is infinite Characterization factors are expressed as 1,4-dichlorobenzene equivalents/kg emission. The indicator applies at global/continental/ regional and local scale. Terrestrial ecotoxicity This category refers to impacts of toxic substances on terrestrial ecosystems (see description fresh water toxicity).

MDOT ORE0904B Sustainability evaluation – LCA based indicators
page 44 of 55 09.0070-R09.0097
Photo-oxidant formation Photo-oxidant formation is the formation of reactive substances (mainly ozone) which are injurious to human health and ecosystems and which also may damage crops. This problem is also indicated with “summer smog”. Winter smog is outside the scope of this category. Photochemical Ozone Creation Potential (POCP) for emission of substances to air is calculated with the UNECE Trajectory model (including fate), and expressed in kg ethylene equivalents/kg emission. The time span is 5 days and the geographical scale varies between local and continental scale. Acidification Acidifying substances cause a wide range of impacts on soil, groundwater, surface water, organisms, ecosystems and materials (buildings). Acidification Potentials (AP) for emissions to air is calculated with the adapted RAINS 10 model, describing the fate and deposition of acidifying substances. AP is expressed as kg SO2 equivalents/ kg emission. The time span is eternity and the geographical scale varies between local scale and continental scale. Eutrophication Eutrophication (also known as nutrification) includes all impacts due to excessive levels of macro-nutrients in the environment caused by emissions of nutrients to air, water and soil. Nutrification potential (NP) is based on the stoichiometric procedure of Heijungs (1992), and expressed as kg PO4 equivalents/ kg emission. Fate and exposure is not included, time span is eternity, and the geographical scale varies between local and continental scale. The characterization factors can be downloaded here: http://www.leidenuniv.nl/cml/ssp/databases/cmlia/cmlia.zip The methodology reports can be viewed here: http://www.leidenuniv.nl/cml/ssp/projects/lca2/lca2.html
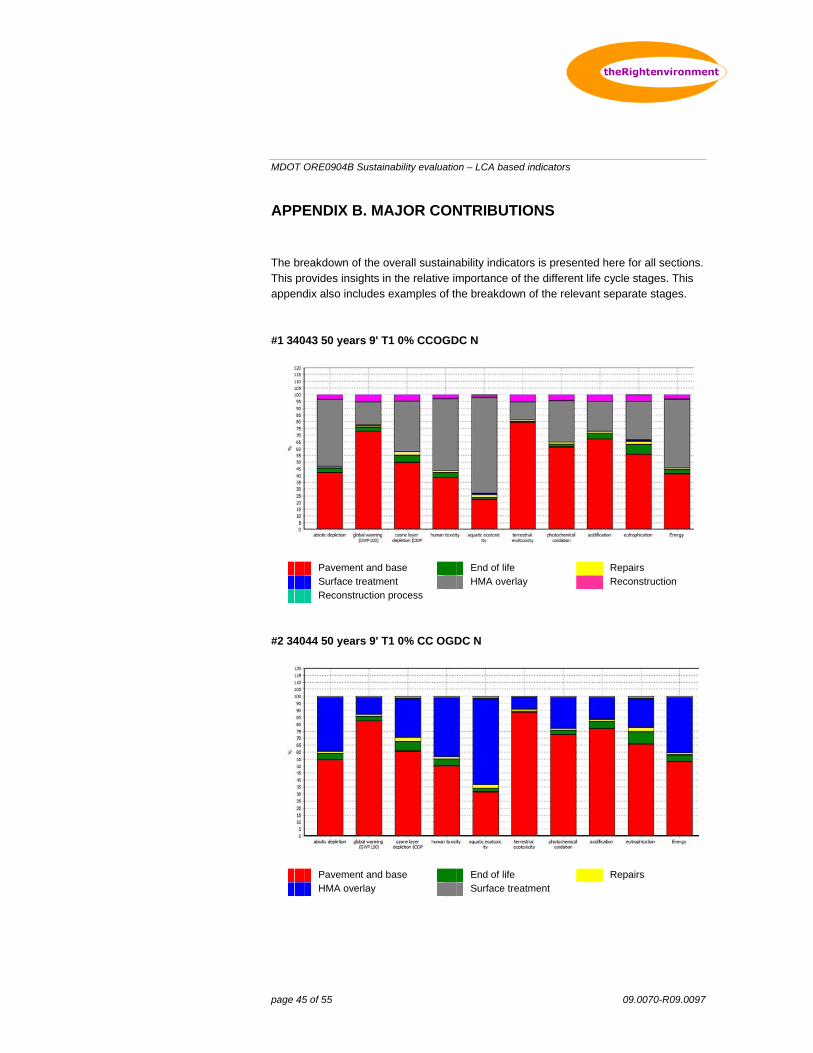
MDOT ORE0904B Sustainability evaluation – LCA based indicators
page 45 of 55 09.0070-R09.0097
APPENDIX B. MAJOR CONTRIBUTIONS
The breakdown of the overall sustainability indicators is presented here for all sections. This provides insights in the relative importance of the different life cycle stages. This appendix also includes examples of the breakdown of the relevant separate stages. #1 34043 50 years 9' T1 0% CCOGDC N
Pavement and base End of life Repairs Surface treatment HMA overlay Reconstruction Reconstruction process
#2 34044 50 years 9' T1 0% CC OGDC N
Pavement and base End of life Repairs HMA overlay Surface treatment
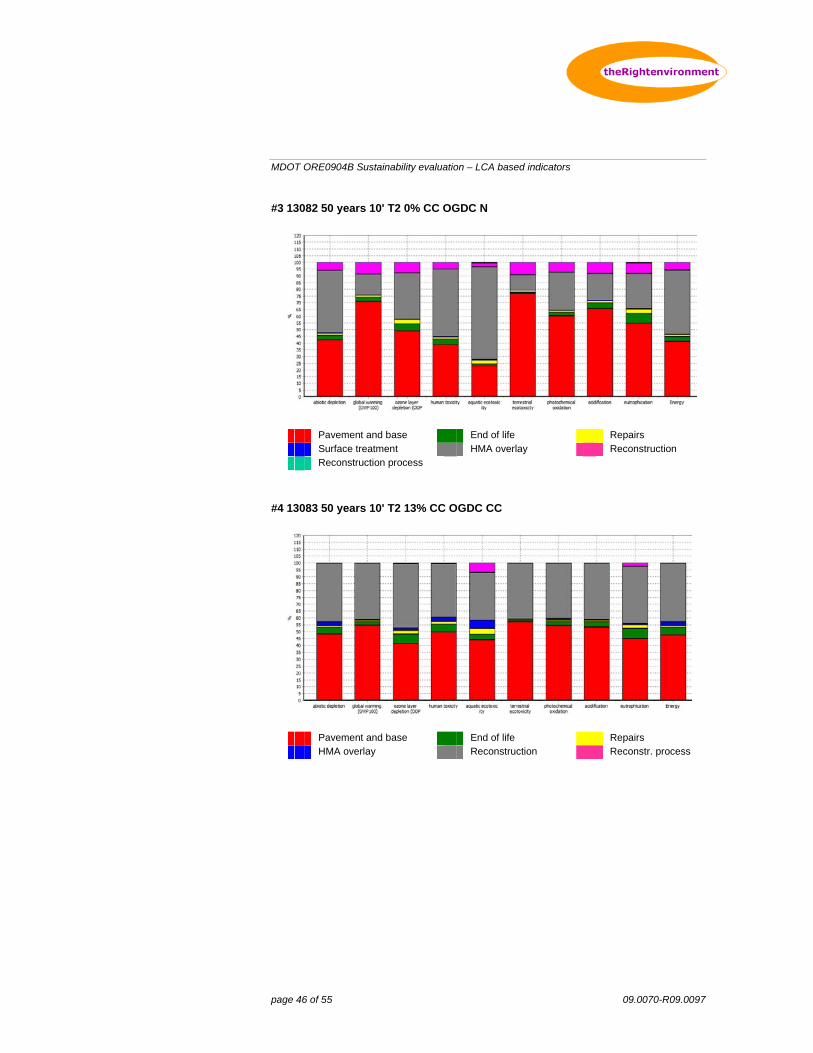
MDOT ORE0904B Sustainability evaluation – LCA based indicators
page 46 of 55 09.0070-R09.0097
#3 13082 50 years 10' T2 0% CC OGDC N
Pavement and base End of life Repairs Surface treatment HMA overlay Reconstruction Reconstruction process
#4 13083 50 years 10' T2 13% CC OGDC CC
Pavement and base End of life Repairs HMA overlay Reconstruction Reconstr. process
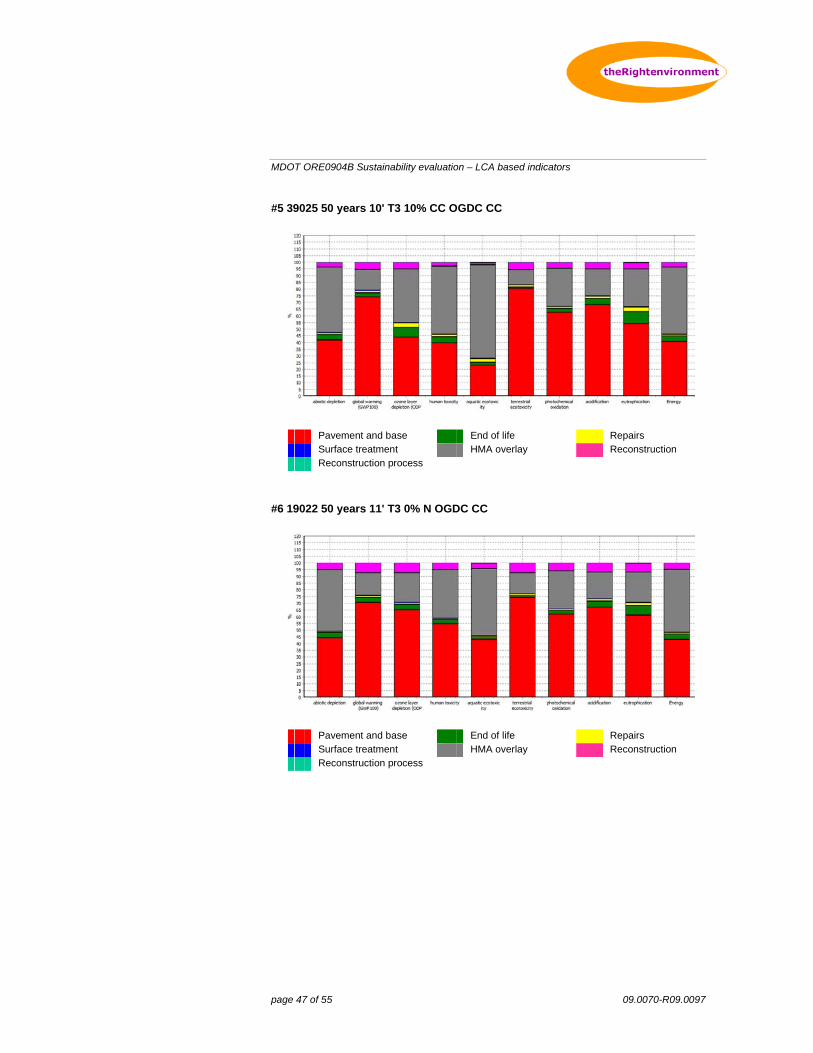
MDOT ORE0904B Sustainability evaluation – LCA based indicators
page 47 of 55 09.0070-R09.0097
#5 39025 50 years 10' T3 10% CC OGDC CC
Pavement and base End of life Repairs Surface treatment HMA overlay Reconstruction Reconstruction process
#6 19022 50 years 11' T3 0% N OGDC CC
Pavement and base End of life Repairs Surface treatment HMA overlay Reconstruction Reconstruction process
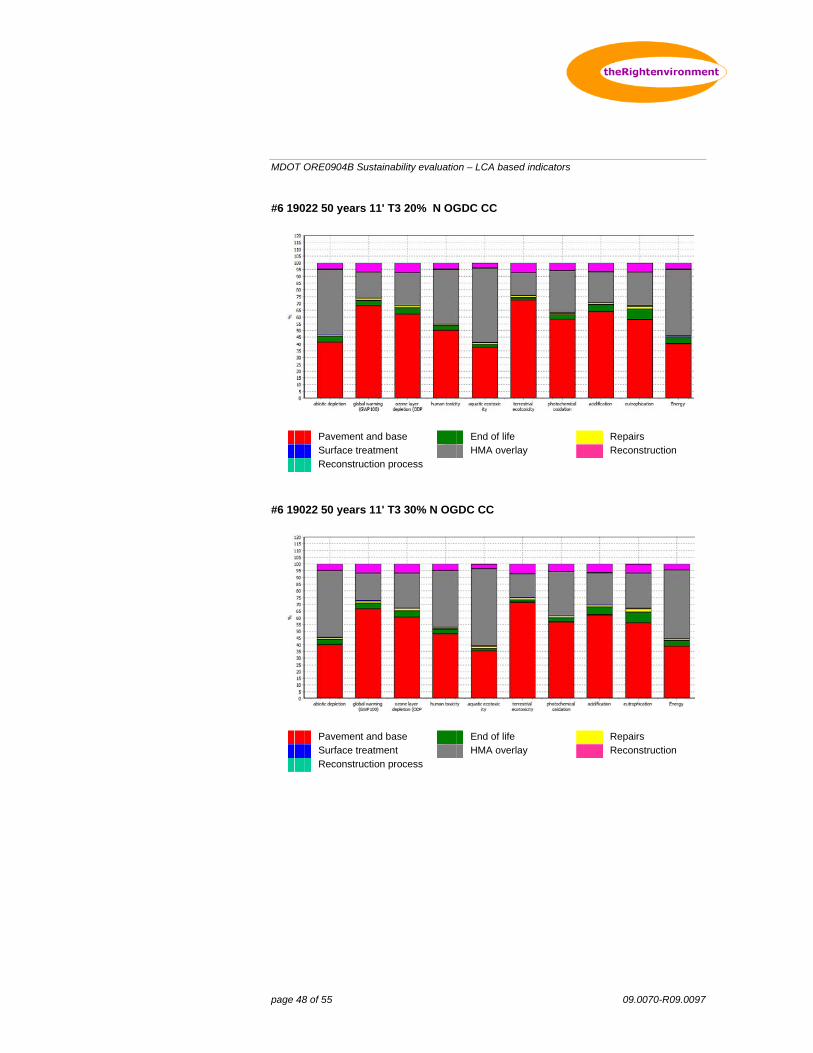
MDOT ORE0904B Sustainability evaluation – LCA based indicators
page 48 of 55 09.0070-R09.0097
#6 19022 50 years 11' T3 20% N OGDC CC
Pavement and base End of life Repairs Surface treatment HMA overlay Reconstruction Reconstruction process
#6 19022 50 years 11' T3 30% N OGDC CC
Pavement and base End of life Repairs Surface treatment HMA overlay Reconstruction Reconstruction process
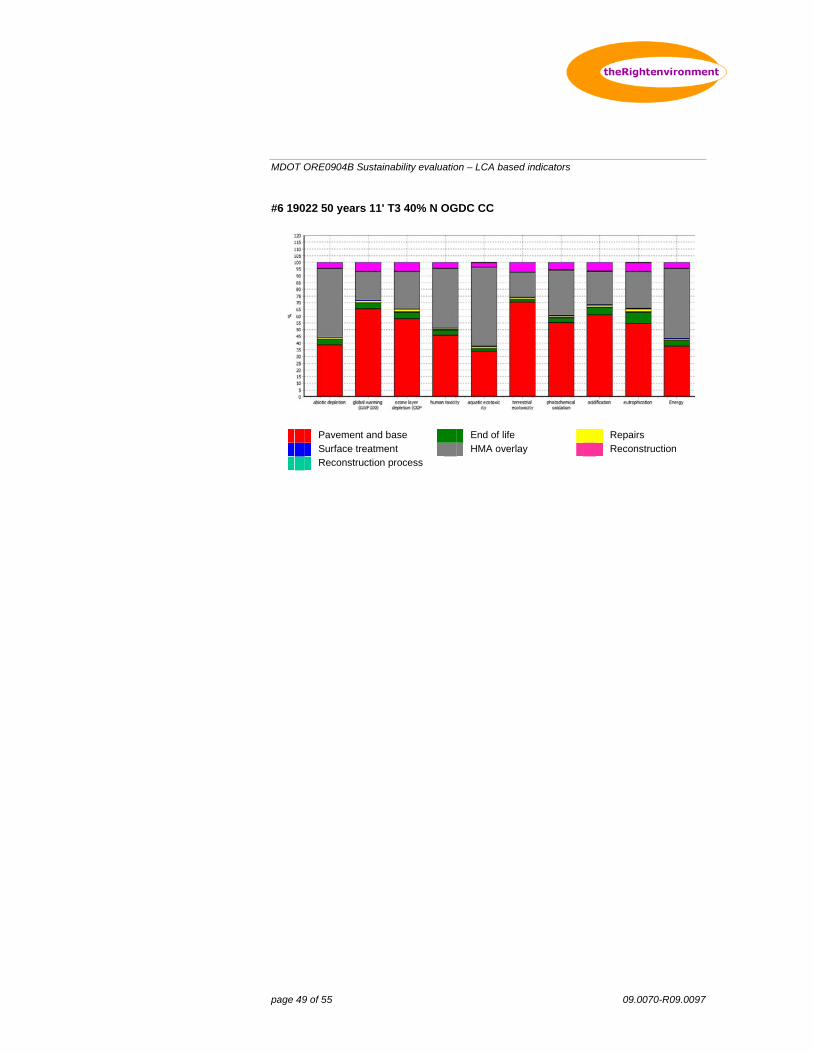
MDOT ORE0904B Sustainability evaluation – LCA based indicators
page 49 of 55 09.0070-R09.0097
#6 19022 50 years 11' T3 40% N OGDC CC
Pavement and base End of life Repairs Surface treatment HMA overlay Reconstruction Reconstruction process
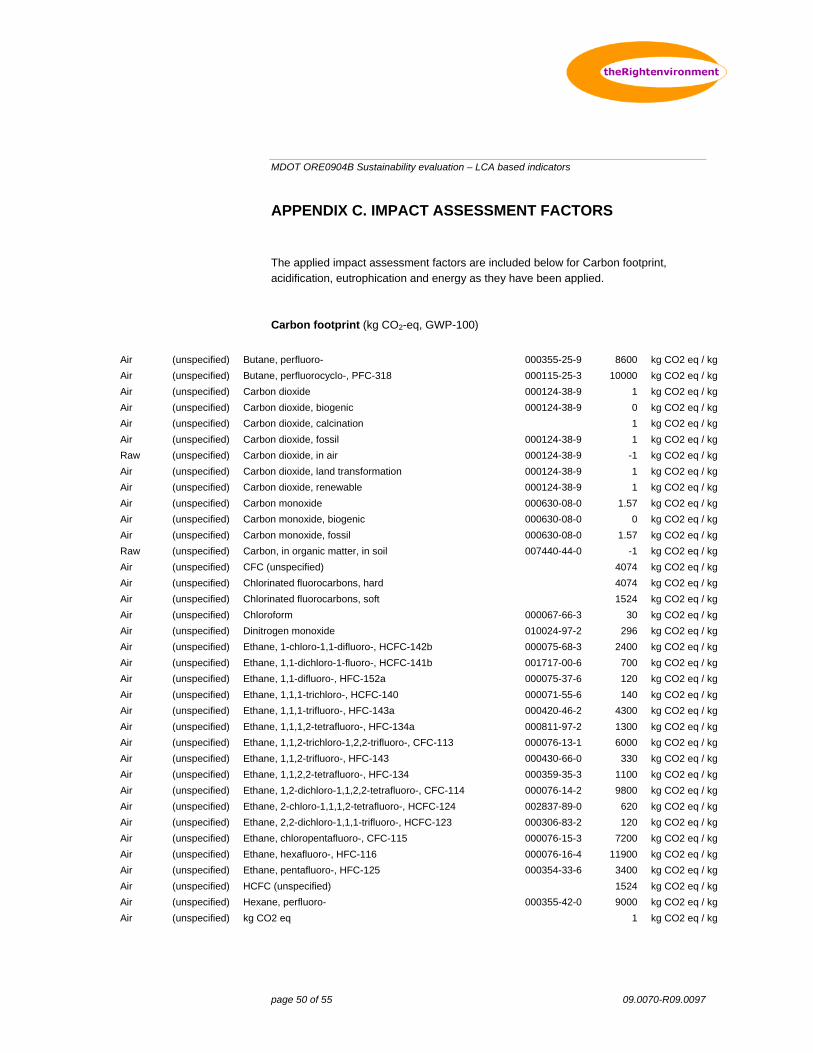
MDOT ORE0904B Sustainability evaluation – LCA based indicators
page 50 of 55 09.0070-R09.0097
APPENDIX C. IMPACT ASSESSMENT FACTORS
The applied impact assessment factors are included below for Carbon footprint, acidification, eutrophication and energy as they have been applied. Carbon footprint (kg CO2-eq, GWP-100)
Air (unspecified) Butane, perfluoro- 000355-25-9 8600 kg CO2 eq / kg
Air (unspecified) Butane, perfluorocyclo-, PFC-318 000115-25-3 10000 kg CO2 eq / kg
Air (unspecified) Carbon dioxide 000124-38-9 1 kg CO2 eq / kg
Air (unspecified) Carbon dioxide, biogenic 000124-38-9 0 kg CO2 eq / kg
Air (unspecified) Carbon dioxide, calcination 1 kg CO2 eq / kg
Air (unspecified) Carbon dioxide, fossil 000124-38-9 1 kg CO2 eq / kg
Raw (unspecified) Carbon dioxide, in air 000124-38-9 -1 kg CO2 eq / kg
Air (unspecified) Carbon dioxide, land transformation 000124-38-9 1 kg CO2 eq / kg
Air (unspecified) Carbon dioxide, renewable 000124-38-9 1 kg CO2 eq / kg
Air (unspecified) Carbon monoxide 000630-08-0 1.57 kg CO2 eq / kg
Air (unspecified) Carbon monoxide, biogenic 000630-08-0 0 kg CO2 eq / kg
Air (unspecified) Carbon monoxide, fossil 000630-08-0 1.57 kg CO2 eq / kg
Raw (unspecified) Carbon, in organic matter, in soil 007440-44-0 -1 kg CO2 eq / kg
Air (unspecified) CFC (unspecified) 4074 kg CO2 eq / kg
Air (unspecified) Chlorinated fluorocarbons, hard 4074 kg CO2 eq / kg
Air (unspecified) Chlorinated fluorocarbons, soft 1524 kg CO2 eq / kg
Air (unspecified) Chloroform 000067-66-3 30 kg CO2 eq / kg
Air (unspecified) Dinitrogen monoxide 010024-97-2 296 kg CO2 eq / kg
Air (unspecified) Ethane, 1-chloro-1,1-difluoro-, HCFC-142b 000075-68-3 2400 kg CO2 eq / kg
Air (unspecified) Ethane, 1,1-dichloro-1-fluoro-, HCFC-141b 001717-00-6 700 kg CO2 eq / kg
Air (unspecified) Ethane, 1,1-difluoro-, HFC-152a 000075-37-6 120 kg CO2 eq / kg
Air (unspecified) Ethane, 1,1,1-trichloro-, HCFC-140 000071-55-6 140 kg CO2 eq / kg
Air (unspecified) Ethane, 1,1,1-trifluoro-, HFC-143a 000420-46-2 4300 kg CO2 eq / kg
Air (unspecified) Ethane, 1,1,1,2-tetrafluoro-, HFC-134a 000811-97-2 1300 kg CO2 eq / kg
Air (unspecified) Ethane, 1,1,2-trichloro-1,2,2-trifluoro-, CFC-113 000076-13-1 6000 kg CO2 eq / kg
Air (unspecified) Ethane, 1,1,2-trifluoro-, HFC-143 000430-66-0 330 kg CO2 eq / kg
Air (unspecified) Ethane, 1,1,2,2-tetrafluoro-, HFC-134 000359-35-3 1100 kg CO2 eq / kg
Air (unspecified) Ethane, 1,2-dichloro-1,1,2,2-tetrafluoro-, CFC-114 000076-14-2 9800 kg CO2 eq / kg
Air (unspecified) Ethane, 2-chloro-1,1,1,2-tetrafluoro-, HCFC-124 002837-89-0 620 kg CO2 eq / kg
Air (unspecified) Ethane, 2,2-dichloro-1,1,1-trifluoro-, HCFC-123 000306-83-2 120 kg CO2 eq / kg
Air (unspecified) Ethane, chloropentafluoro-, CFC-115 000076-15-3 7200 kg CO2 eq / kg
Air (unspecified) Ethane, hexafluoro-, HFC-116 000076-16-4 11900 kg CO2 eq / kg
Air (unspecified) Ethane, pentafluoro-, HFC-125 000354-33-6 3400 kg CO2 eq / kg
Air (unspecified) HCFC (unspecified) 1524 kg CO2 eq / kg
Air (unspecified) Hexane, perfluoro- 000355-42-0 9000 kg CO2 eq / kg
Air (unspecified) kg CO2 eq 1 kg CO2 eq / kg
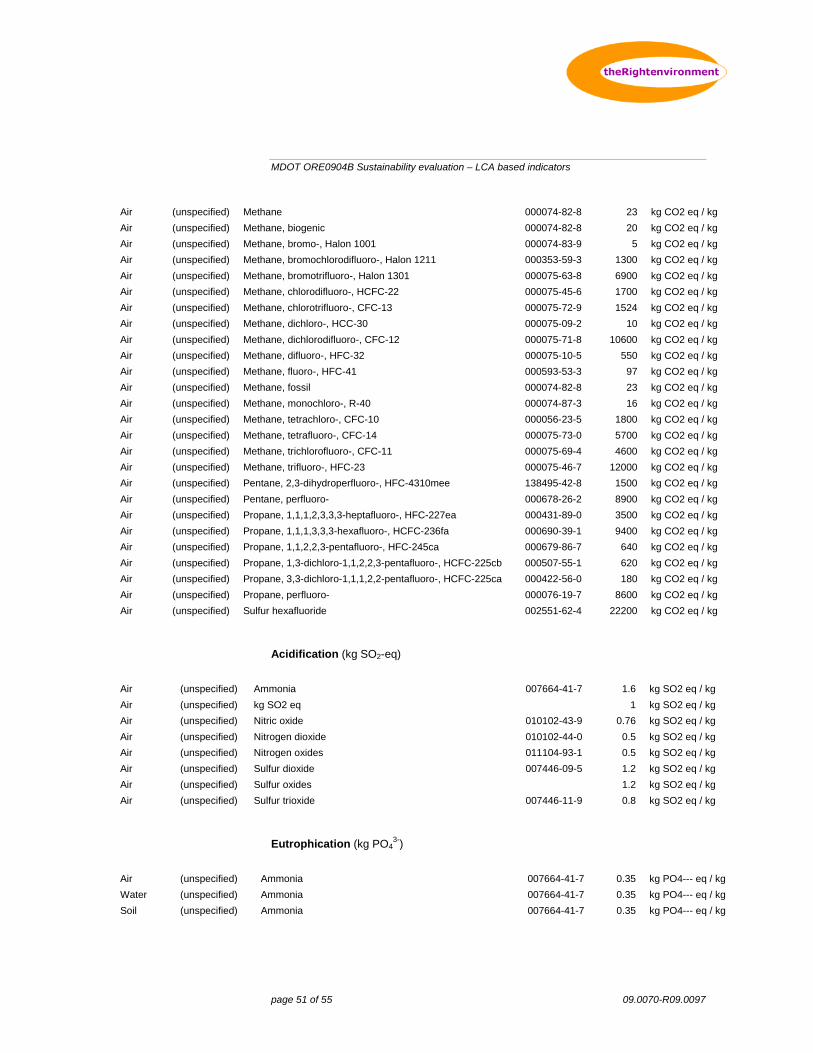
MDOT ORE0904B Sustainability evaluation – LCA based indicators
page 51 of 55 09.0070-R09.0097
Air (unspecified) Methane 000074-82-8 23 kg CO2 eq / kg
Air (unspecified) Methane, biogenic 000074-82-8 20 kg CO2 eq / kg
Air (unspecified) Methane, bromo-, Halon 1001 000074-83-9 5 kg CO2 eq / kg
Air (unspecified) Methane, bromochlorodifluoro-, Halon 1211 000353-59-3 1300 kg CO2 eq / kg
Air (unspecified) Methane, bromotrifluoro-, Halon 1301 000075-63-8 6900 kg CO2 eq / kg
Air (unspecified) Methane, chlorodifluoro-, HCFC-22 000075-45-6 1700 kg CO2 eq / kg
Air (unspecified) Methane, chlorotrifluoro-, CFC-13 000075-72-9 1524 kg CO2 eq / kg
Air (unspecified) Methane, dichloro-, HCC-30 000075-09-2 10 kg CO2 eq / kg
Air (unspecified) Methane, dichlorodifluoro-, CFC-12 000075-71-8 10600 kg CO2 eq / kg
Air (unspecified) Methane, difluoro-, HFC-32 000075-10-5 550 kg CO2 eq / kg
Air (unspecified) Methane, fluoro-, HFC-41 000593-53-3 97 kg CO2 eq / kg
Air (unspecified) Methane, fossil 000074-82-8 23 kg CO2 eq / kg
Air (unspecified) Methane, monochloro-, R-40 000074-87-3 16 kg CO2 eq / kg
Air (unspecified) Methane, tetrachloro-, CFC-10 000056-23-5 1800 kg CO2 eq / kg
Air (unspecified) Methane, tetrafluoro-, CFC-14 000075-73-0 5700 kg CO2 eq / kg
Air (unspecified) Methane, trichlorofluoro-, CFC-11 000075-69-4 4600 kg CO2 eq / kg
Air (unspecified) Methane, trifluoro-, HFC-23 000075-46-7 12000 kg CO2 eq / kg
Air (unspecified) Pentane, 2,3-dihydroperfluoro-, HFC-4310mee 138495-42-8 1500 kg CO2 eq / kg
Air (unspecified) Pentane, perfluoro- 000678-26-2 8900 kg CO2 eq / kg
Air (unspecified) Propane, 1,1,1,2,3,3,3-heptafluoro-, HFC-227ea 000431-89-0 3500 kg CO2 eq / kg
Air (unspecified) Propane, 1,1,1,3,3,3-hexafluoro-, HCFC-236fa 000690-39-1 9400 kg CO2 eq / kg
Air (unspecified) Propane, 1,1,2,2,3-pentafluoro-, HFC-245ca 000679-86-7 640 kg CO2 eq / kg
Air (unspecified) Propane, 1,3-dichloro-1,1,2,2,3-pentafluoro-, HCFC-225cb 000507-55-1 620 kg CO2 eq / kg
Air (unspecified) Propane, 3,3-dichloro-1,1,1,2,2-pentafluoro-, HCFC-225ca 000422-56-0 180 kg CO2 eq / kg
Air (unspecified) Propane, perfluoro- 000076-19-7 8600 kg CO2 eq / kg
Air (unspecified) Sulfur hexafluoride 002551-62-4 22200 kg CO2 eq / kg Acidification (kg SO2-eq)
Air (unspecified) Ammonia 007664-41-7 1.6 kg SO2 eq / kg
Air (unspecified) kg SO2 eq 1 kg SO2 eq / kg
Air (unspecified) Nitric oxide 010102-43-9 0.76 kg SO2 eq / kg
Air (unspecified) Nitrogen dioxide 010102-44-0 0.5 kg SO2 eq / kg
Air (unspecified) Nitrogen oxides 011104-93-1 0.5 kg SO2 eq / kg
Air (unspecified) Sulfur dioxide 007446-09-5 1.2 kg SO2 eq / kg
Air (unspecified) Sulfur oxides 1.2 kg SO2 eq / kg
Air (unspecified) Sulfur trioxide 007446-11-9 0.8 kg SO2 eq / kg Eutrophication (kg PO4
3-)
Air (unspecified) Ammonia 007664-41-7 0.35 kg PO4--- eq / kg
Water (unspecified) Ammonia 007664-41-7 0.35 kg PO4--- eq / kg
Soil (unspecified) Ammonia 007664-41-7 0.35 kg PO4--- eq / kg
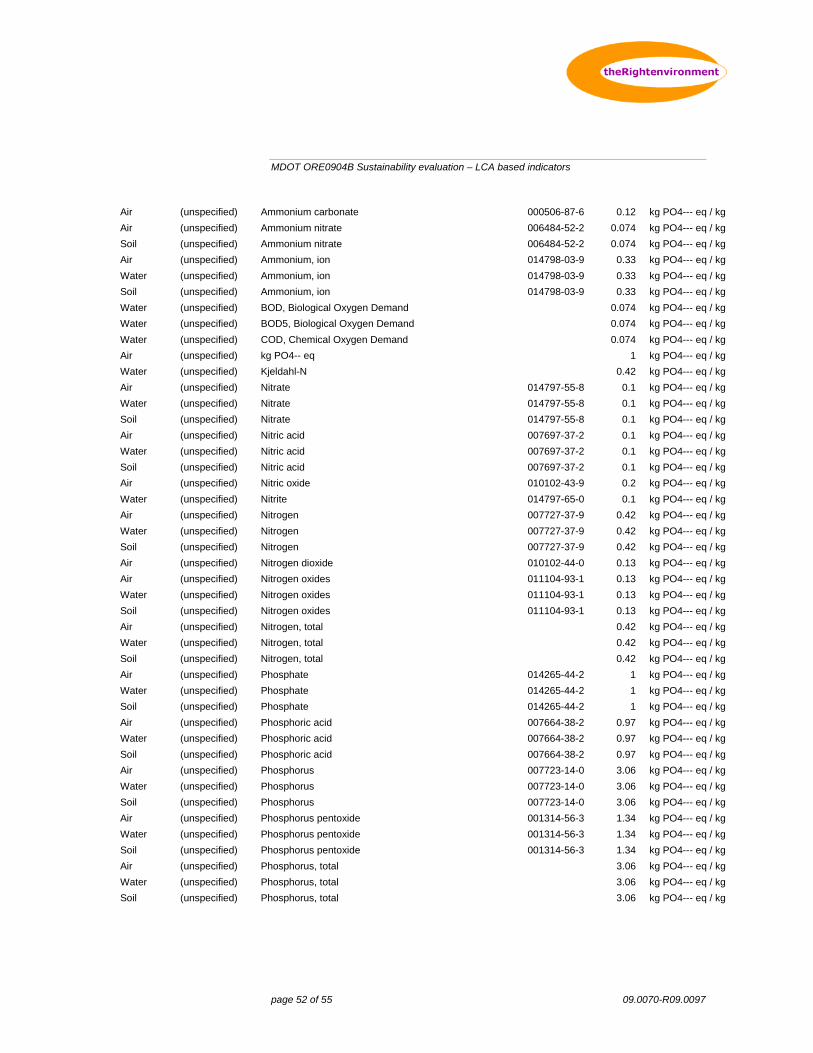
MDOT ORE0904B Sustainability evaluation – LCA based indicators
page 52 of 55 09.0070-R09.0097
Air (unspecified) Ammonium carbonate 000506-87-6 0.12 kg PO4--- eq / kg
Air (unspecified) Ammonium nitrate 006484-52-2 0.074 kg PO4--- eq / kg
Soil (unspecified) Ammonium nitrate 006484-52-2 0.074 kg PO4--- eq / kg
Air (unspecified) Ammonium, ion 014798-03-9 0.33 kg PO4--- eq / kg
Water (unspecified) Ammonium, ion 014798-03-9 0.33 kg PO4--- eq / kg
Soil (unspecified) Ammonium, ion 014798-03-9 0.33 kg PO4--- eq / kg
Water (unspecified) BOD, Biological Oxygen Demand 0.074 kg PO4--- eq / kg
Water (unspecified) BOD5, Biological Oxygen Demand 0.074 kg PO4--- eq / kg
Water (unspecified) COD, Chemical Oxygen Demand 0.074 kg PO4--- eq / kg
Air (unspecified) kg PO4-- eq 1 kg PO4--- eq / kg
Water (unspecified) Kjeldahl-N 0.42 kg PO4--- eq / kg
Air (unspecified) Nitrate 014797-55-8 0.1 kg PO4--- eq / kg
Water (unspecified) Nitrate 014797-55-8 0.1 kg PO4--- eq / kg
Soil (unspecified) Nitrate 014797-55-8 0.1 kg PO4--- eq / kg
Air (unspecified) Nitric acid 007697-37-2 0.1 kg PO4--- eq / kg
Water (unspecified) Nitric acid 007697-37-2 0.1 kg PO4--- eq / kg
Soil (unspecified) Nitric acid 007697-37-2 0.1 kg PO4--- eq / kg
Air (unspecified) Nitric oxide 010102-43-9 0.2 kg PO4--- eq / kg
Water (unspecified) Nitrite 014797-65-0 0.1 kg PO4--- eq / kg
Air (unspecified) Nitrogen 007727-37-9 0.42 kg PO4--- eq / kg
Water (unspecified) Nitrogen 007727-37-9 0.42 kg PO4--- eq / kg
Soil (unspecified) Nitrogen 007727-37-9 0.42 kg PO4--- eq / kg
Air (unspecified) Nitrogen dioxide 010102-44-0 0.13 kg PO4--- eq / kg
Air (unspecified) Nitrogen oxides 011104-93-1 0.13 kg PO4--- eq / kg
Water (unspecified) Nitrogen oxides 011104-93-1 0.13 kg PO4--- eq / kg
Soil (unspecified) Nitrogen oxides 011104-93-1 0.13 kg PO4--- eq / kg
Air (unspecified) Nitrogen, total 0.42 kg PO4--- eq / kg
Water (unspecified) Nitrogen, total 0.42 kg PO4--- eq / kg
Soil (unspecified) Nitrogen, total 0.42 kg PO4--- eq / kg
Air (unspecified) Phosphate 014265-44-2 1 kg PO4--- eq / kg
Water (unspecified) Phosphate 014265-44-2 1 kg PO4--- eq / kg
Soil (unspecified) Phosphate 014265-44-2 1 kg PO4--- eq / kg
Air (unspecified) Phosphoric acid 007664-38-2 0.97 kg PO4--- eq / kg
Water (unspecified) Phosphoric acid 007664-38-2 0.97 kg PO4--- eq / kg
Soil (unspecified) Phosphoric acid 007664-38-2 0.97 kg PO4--- eq / kg
Air (unspecified) Phosphorus 007723-14-0 3.06 kg PO4--- eq / kg
Water (unspecified) Phosphorus 007723-14-0 3.06 kg PO4--- eq / kg
Soil (unspecified) Phosphorus 007723-14-0 3.06 kg PO4--- eq / kg
Air (unspecified) Phosphorus pentoxide 001314-56-3 1.34 kg PO4--- eq / kg
Water (unspecified) Phosphorus pentoxide 001314-56-3 1.34 kg PO4--- eq / kg
Soil (unspecified) Phosphorus pentoxide 001314-56-3 1.34 kg PO4--- eq / kg
Air (unspecified) Phosphorus, total 3.06 kg PO4--- eq / kg
Water (unspecified) Phosphorus, total 3.06 kg PO4--- eq / kg
Soil (unspecified) Phosphorus, total 3.06 kg PO4--- eq / kg
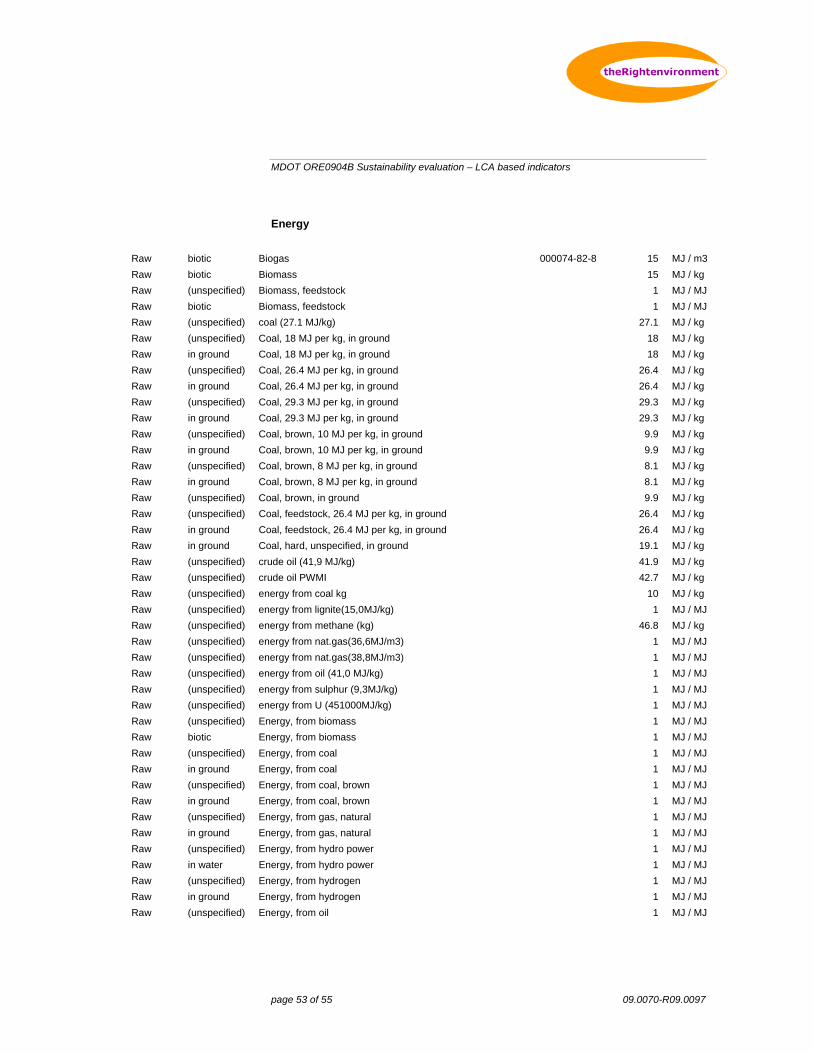
MDOT ORE0904B Sustainability evaluation – LCA based indicators
page 53 of 55 09.0070-R09.0097
Energy
Raw biotic Biogas 000074-82-8 15 MJ / m3
Raw biotic Biomass 15 MJ / kg
Raw (unspecified) Biomass, feedstock 1 MJ / MJ
Raw biotic Biomass, feedstock 1 MJ / MJ
Raw (unspecified) coal (27.1 MJ/kg) 27.1 MJ / kg
Raw (unspecified) Coal, 18 MJ per kg, in ground 18 MJ / kg
Raw in ground Coal, 18 MJ per kg, in ground 18 MJ / kg
Raw (unspecified) Coal, 26.4 MJ per kg, in ground 26.4 MJ / kg
Raw in ground Coal, 26.4 MJ per kg, in ground 26.4 MJ / kg
Raw (unspecified) Coal, 29.3 MJ per kg, in ground 29.3 MJ / kg
Raw in ground Coal, 29.3 MJ per kg, in ground 29.3 MJ / kg
Raw (unspecified) Coal, brown, 10 MJ per kg, in ground 9.9 MJ / kg
Raw in ground Coal, brown, 10 MJ per kg, in ground 9.9 MJ / kg
Raw (unspecified) Coal, brown, 8 MJ per kg, in ground 8.1 MJ / kg
Raw in ground Coal, brown, 8 MJ per kg, in ground 8.1 MJ / kg
Raw (unspecified) Coal, brown, in ground 9.9 MJ / kg
Raw (unspecified) Coal, feedstock, 26.4 MJ per kg, in ground 26.4 MJ / kg
Raw in ground Coal, feedstock, 26.4 MJ per kg, in ground 26.4 MJ / kg
Raw in ground Coal, hard, unspecified, in ground 19.1 MJ / kg
Raw (unspecified) crude oil (41,9 MJ/kg) 41.9 MJ / kg
Raw (unspecified) crude oil PWMI 42.7 MJ / kg
Raw (unspecified) energy from coal kg 10 MJ / kg
Raw (unspecified) energy from lignite(15,0MJ/kg) 1 MJ / MJ
Raw (unspecified) energy from methane (kg) 46.8 MJ / kg
Raw (unspecified) energy from nat.gas(36,6MJ/m3) 1 MJ / MJ
Raw (unspecified) energy from nat.gas(38,8MJ/m3) 1 MJ / MJ
Raw (unspecified) energy from oil (41,0 MJ/kg) 1 MJ / MJ
Raw (unspecified) energy from sulphur (9,3MJ/kg) 1 MJ / MJ
Raw (unspecified) energy from U (451000MJ/kg) 1 MJ / MJ
Raw (unspecified) Energy, from biomass 1 MJ / MJ
Raw biotic Energy, from biomass 1 MJ / MJ
Raw (unspecified) Energy, from coal 1 MJ / MJ
Raw in ground Energy, from coal 1 MJ / MJ
Raw (unspecified) Energy, from coal, brown 1 MJ / MJ
Raw in ground Energy, from coal, brown 1 MJ / MJ
Raw (unspecified) Energy, from gas, natural 1 MJ / MJ
Raw in ground Energy, from gas, natural 1 MJ / MJ
Raw (unspecified) Energy, from hydro power 1 MJ / MJ
Raw in water Energy, from hydro power 1 MJ / MJ
Raw (unspecified) Energy, from hydrogen 1 MJ / MJ
Raw in ground Energy, from hydrogen 1 MJ / MJ
Raw (unspecified) Energy, from oil 1 MJ / MJ
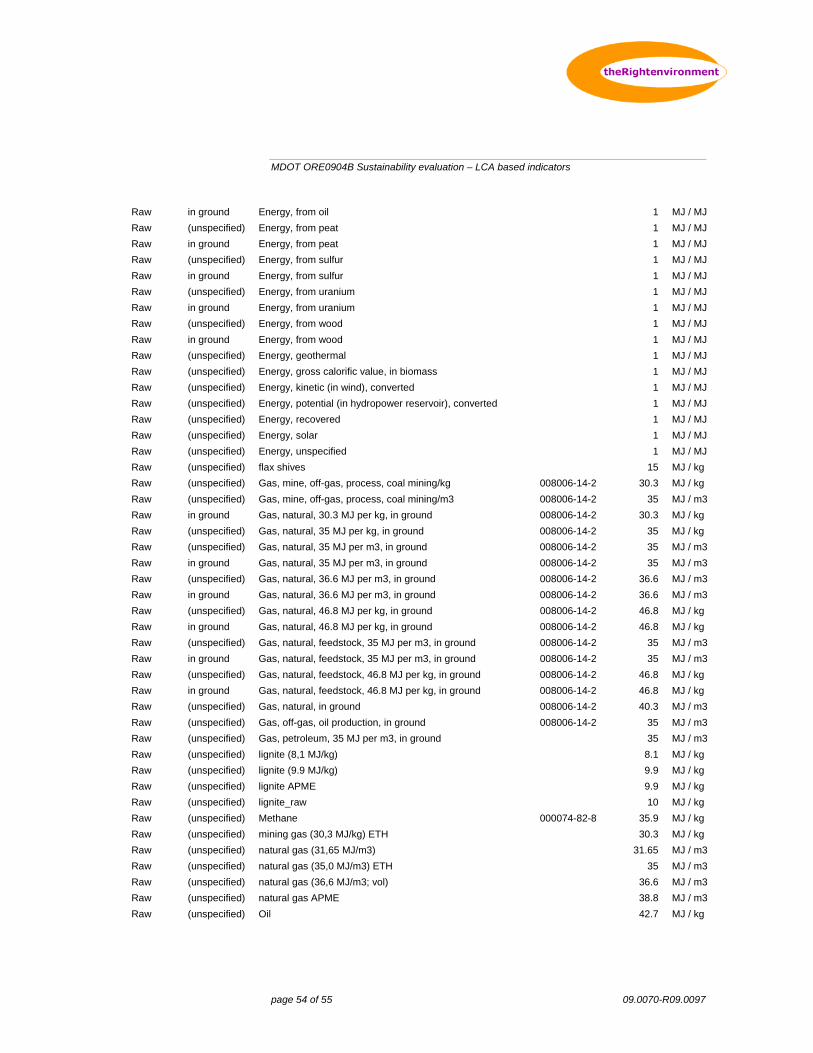
MDOT ORE0904B Sustainability evaluation – LCA based indicators
page 54 of 55 09.0070-R09.0097
Raw in ground Energy, from oil 1 MJ / MJ
Raw (unspecified) Energy, from peat 1 MJ / MJ
Raw in ground Energy, from peat 1 MJ / MJ
Raw (unspecified) Energy, from sulfur 1 MJ / MJ
Raw in ground Energy, from sulfur 1 MJ / MJ
Raw (unspecified) Energy, from uranium 1 MJ / MJ
Raw in ground Energy, from uranium 1 MJ / MJ
Raw (unspecified) Energy, from wood 1 MJ / MJ
Raw in ground Energy, from wood 1 MJ / MJ
Raw (unspecified) Energy, geothermal 1 MJ / MJ
Raw (unspecified) Energy, gross calorific value, in biomass 1 MJ / MJ
Raw (unspecified) Energy, kinetic (in wind), converted 1 MJ / MJ
Raw (unspecified) Energy, potential (in hydropower reservoir), converted 1 MJ / MJ
Raw (unspecified) Energy, recovered 1 MJ / MJ
Raw (unspecified) Energy, solar 1 MJ / MJ
Raw (unspecified) Energy, unspecified 1 MJ / MJ
Raw (unspecified) flax shives 15 MJ / kg
Raw (unspecified) Gas, mine, off-gas, process, coal mining/kg 008006-14-2 30.3 MJ / kg
Raw (unspecified) Gas, mine, off-gas, process, coal mining/m3 008006-14-2 35 MJ / m3
Raw in ground Gas, natural, 30.3 MJ per kg, in ground 008006-14-2 30.3 MJ / kg
Raw (unspecified) Gas, natural, 35 MJ per kg, in ground 008006-14-2 35 MJ / kg
Raw (unspecified) Gas, natural, 35 MJ per m3, in ground 008006-14-2 35 MJ / m3
Raw in ground Gas, natural, 35 MJ per m3, in ground 008006-14-2 35 MJ / m3
Raw (unspecified) Gas, natural, 36.6 MJ per m3, in ground 008006-14-2 36.6 MJ / m3
Raw in ground Gas, natural, 36.6 MJ per m3, in ground 008006-14-2 36.6 MJ / m3
Raw (unspecified) Gas, natural, 46.8 MJ per kg, in ground 008006-14-2 46.8 MJ / kg
Raw in ground Gas, natural, 46.8 MJ per kg, in ground 008006-14-2 46.8 MJ / kg
Raw (unspecified) Gas, natural, feedstock, 35 MJ per m3, in ground 008006-14-2 35 MJ / m3
Raw in ground Gas, natural, feedstock, 35 MJ per m3, in ground 008006-14-2 35 MJ / m3
Raw (unspecified) Gas, natural, feedstock, 46.8 MJ per kg, in ground 008006-14-2 46.8 MJ / kg
Raw in ground Gas, natural, feedstock, 46.8 MJ per kg, in ground 008006-14-2 46.8 MJ / kg
Raw (unspecified) Gas, natural, in ground 008006-14-2 40.3 MJ / m3
Raw (unspecified) Gas, off-gas, oil production, in ground 008006-14-2 35 MJ / m3
Raw (unspecified) Gas, petroleum, 35 MJ per m3, in ground 35 MJ / m3
Raw (unspecified) lignite (8,1 MJ/kg) 8.1 MJ / kg
Raw (unspecified) lignite (9.9 MJ/kg) 9.9 MJ / kg
Raw (unspecified) lignite APME 9.9 MJ / kg
Raw (unspecified) lignite_raw 10 MJ / kg
Raw (unspecified) Methane 000074-82-8 35.9 MJ / kg
Raw (unspecified) mining gas (30,3 MJ/kg) ETH 30.3 MJ / kg
Raw (unspecified) natural gas (31,65 MJ/m3) 31.65 MJ / m3
Raw (unspecified) natural gas (35,0 MJ/m3) ETH 35 MJ / m3
Raw (unspecified) natural gas (36,6 MJ/m3; vol) 36.6 MJ / m3
Raw (unspecified) natural gas APME 38.8 MJ / m3
Raw (unspecified) Oil 42.7 MJ / kg
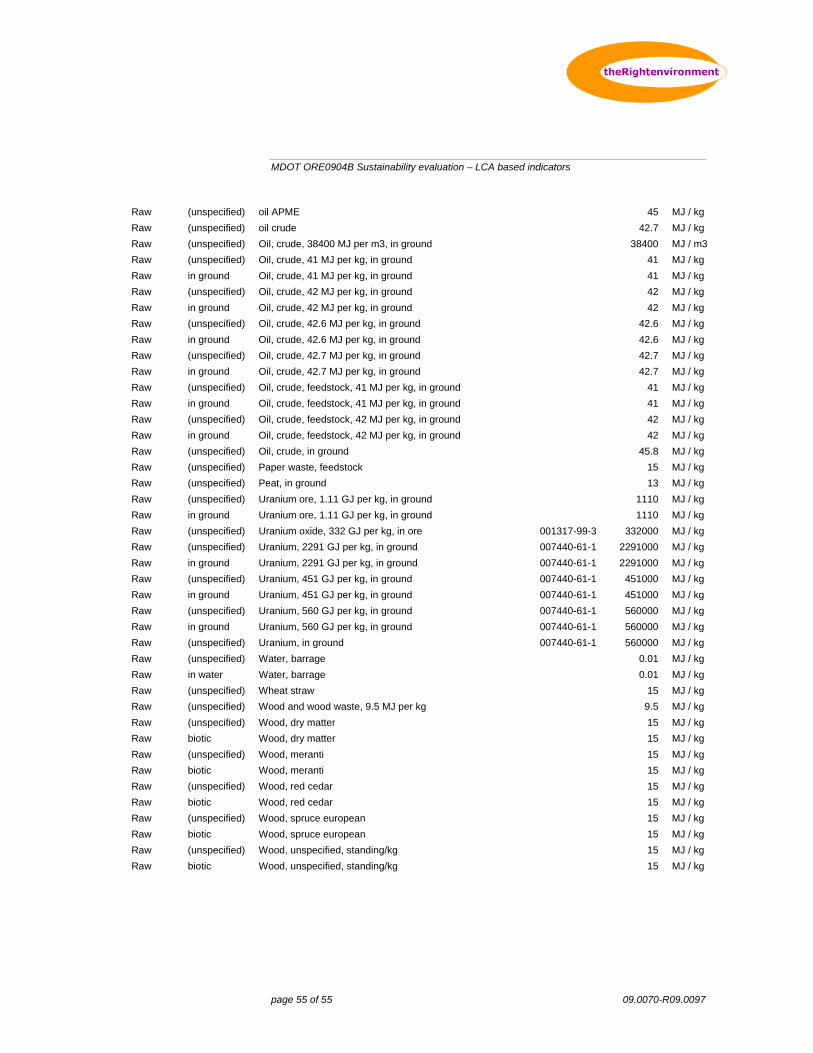
MDOT ORE0904B Sustainability evaluation – LCA based indicators
page 55 of 55 09.0070-R09.0097
Raw (unspecified) oil APME 45 MJ / kg
Raw (unspecified) oil crude 42.7 MJ / kg
Raw (unspecified) Oil, crude, 38400 MJ per m3, in ground 38400 MJ / m3
Raw (unspecified) Oil, crude, 41 MJ per kg, in ground 41 MJ / kg
Raw in ground Oil, crude, 41 MJ per kg, in ground 41 MJ / kg
Raw (unspecified) Oil, crude, 42 MJ per kg, in ground 42 MJ / kg
Raw in ground Oil, crude, 42 MJ per kg, in ground 42 MJ / kg
Raw (unspecified) Oil, crude, 42.6 MJ per kg, in ground 42.6 MJ / kg
Raw in ground Oil, crude, 42.6 MJ per kg, in ground 42.6 MJ / kg
Raw (unspecified) Oil, crude, 42.7 MJ per kg, in ground 42.7 MJ / kg
Raw in ground Oil, crude, 42.7 MJ per kg, in ground 42.7 MJ / kg
Raw (unspecified) Oil, crude, feedstock, 41 MJ per kg, in ground 41 MJ / kg
Raw in ground Oil, crude, feedstock, 41 MJ per kg, in ground 41 MJ / kg
Raw (unspecified) Oil, crude, feedstock, 42 MJ per kg, in ground 42 MJ / kg
Raw in ground Oil, crude, feedstock, 42 MJ per kg, in ground 42 MJ / kg
Raw (unspecified) Oil, crude, in ground 45.8 MJ / kg
Raw (unspecified) Paper waste, feedstock 15 MJ / kg
Raw (unspecified) Peat, in ground 13 MJ / kg
Raw (unspecified) Uranium ore, 1.11 GJ per kg, in ground 1110 MJ / kg
Raw in ground Uranium ore, 1.11 GJ per kg, in ground 1110 MJ / kg
Raw (unspecified) Uranium oxide, 332 GJ per kg, in ore 001317-99-3 332000 MJ / kg
Raw (unspecified) Uranium, 2291 GJ per kg, in ground 007440-61-1 2291000 MJ / kg
Raw in ground Uranium, 2291 GJ per kg, in ground 007440-61-1 2291000 MJ / kg
Raw (unspecified) Uranium, 451 GJ per kg, in ground 007440-61-1 451000 MJ / kg
Raw in ground Uranium, 451 GJ per kg, in ground 007440-61-1 451000 MJ / kg
Raw (unspecified) Uranium, 560 GJ per kg, in ground 007440-61-1 560000 MJ / kg
Raw in ground Uranium, 560 GJ per kg, in ground 007440-61-1 560000 MJ / kg
Raw (unspecified) Uranium, in ground 007440-61-1 560000 MJ / kg
Raw (unspecified) Water, barrage 0.01 MJ / kg
Raw in water Water, barrage 0.01 MJ / kg
Raw (unspecified) Wheat straw 15 MJ / kg
Raw (unspecified) Wood and wood waste, 9.5 MJ per kg 9.5 MJ / kg
Raw (unspecified) Wood, dry matter 15 MJ / kg
Raw biotic Wood, dry matter 15 MJ / kg
Raw (unspecified) Wood, meranti 15 MJ / kg
Raw biotic Wood, meranti 15 MJ / kg
Raw (unspecified) Wood, red cedar 15 MJ / kg
Raw biotic Wood, red cedar 15 MJ / kg
Raw (unspecified) Wood, spruce european 15 MJ / kg
Raw biotic Wood, spruce european 15 MJ / kg
Raw (unspecified) Wood, unspecified, standing/kg 15 MJ / kg
Raw biotic Wood, unspecified, standing/kg 15 MJ / kg

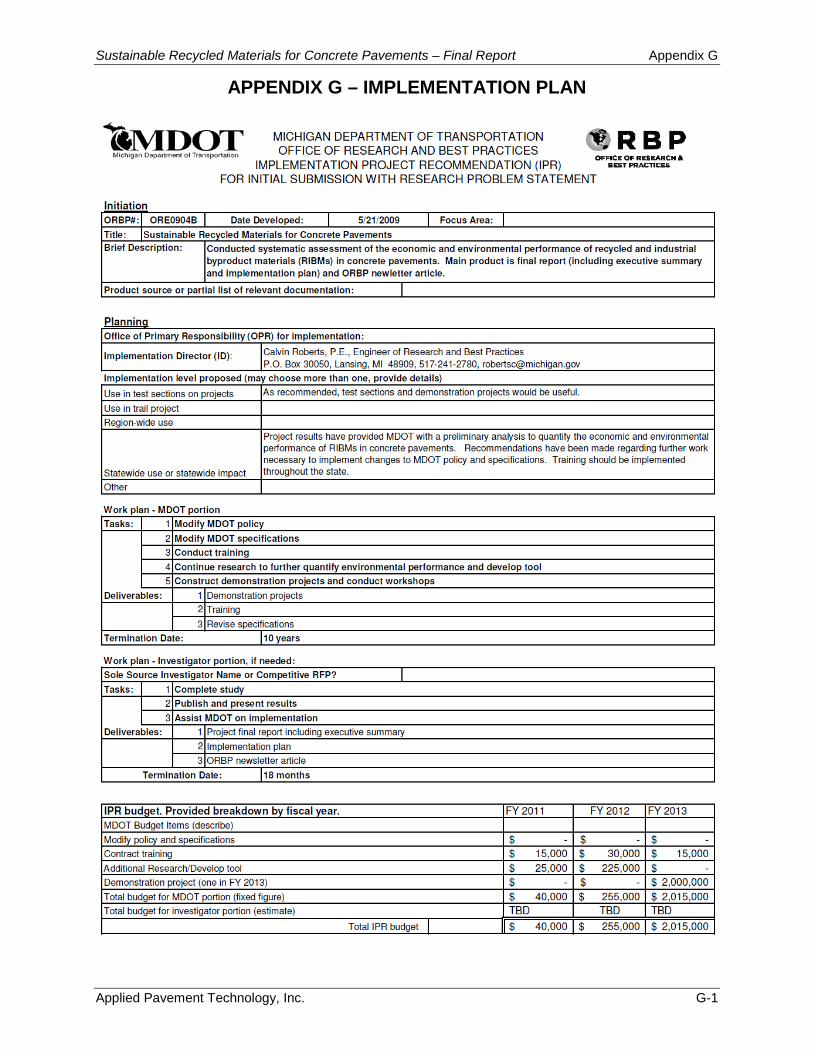
Sustainable Recycled Materials for Concrete Pavements – Final Report Appendix G
Applied Pavement Technology, Inc. G-1
APPENDIX G – IMPLEMENTATION PLAN