Embed Size (px)
Citation preview

European Rates Research 11 May 2012
Important disclosures can be found on the last page of this publication.
Analysts
Andrew Roberts Head of European Rates Research +44 20 7085 1702 [email protected]
Harvinder Sian Senior European Rates Strategist +44 20 7085 6539 [email protected]
Par Magnusson Chief Analyst Scandinavian Rates Strategy +46 8 506 198 79 [email protected]
Giles Gale European Rates Research +44 207 085 5917 [email protected]
Simon Peck European Rates Research +44 2033611931 [email protected]
Dmytro Bondar European Rates Research +44 20 3361 4160 [email protected]
Biagio Lapolla European Rates Research +44 2033617597 [email protected]
Brian Mangwiro European Rates Research +44 20 3361 3848 [email protected]
Claire Tucker European Rates Research +44 207 085 8480 [email protected]
www.rbsm.com/strategy
European Rates Weekly The exit discussion is now . . . open
Overview (p2): this past week has showed there are few FI longs. I think the risk of a yield plunge is higher than a yield sell-off. Watch now for reversal of those Q1 FI->equity trades. This would make you bullish 30s, but 10s remains safe sweetspot, in bunds. Though everyone wins: witness JGBs. The cat is out of the bag. The EMU exit debate is now finally in the open about whether exits would be devastating for the economy or not. We know what we think - it has been perfectly clear for 2 years how EMU will play through. Next steps: markets will educate on what exits looks like, deposit flight risk is next coming big theme. Euro Area Strategy (p7): Remain bullish core rates for instance still in €3F1Y and at the long end. FRA/OIS basis expected to drift wider but prefer via cheap 1x1 puts in front Euribor or forward basis spreads. The rally to new yield lows in Bunds is not done. Target 10y at 1.25%. €10s30s has flattened back to normal valuations. There is some risk of CVA and Danish long buying. We still like fwd steepeners, with 20y a sweet spot. New Greek elections likely and the hope is disaffected voters back ‘pro-bailout’ parties. If not, Euro exit risks rise. Absent a pro-Euro response, opening up of exit risk means deposit risk across periphery. Spain’s bad bank plan: The headline provisions are more realistic but will still be revised higher in our view which is a risk given market conditions. We do not think this plan is enough around the crisis for SPGBs.
UK Strategy (p31): 10s30s is too steep, and is tempting; but for now this remains a bear trade, 78% correlated to 10y. We look for the BoE Inflation Report on Wednesday to signal that the MPC has made a small move towards a more neutral bias, but this is discounted.
Scandinavian Strategy (p34): The Riksbank prepares for financial war as it establishes a framework for QE and LTRO. Macro data are deplorable in Sweden, so the road to more aggressive monetary policy is paved. We move your profit target levels.
Inflation-Linked Strategy (p38): Euro Area fundamentals suggest sticky inflation and a tight supply side. I argue to use the recent steepening to put on breakeven flatteners in 5s30s. In UK RPI, expect directionality in level and curve to remain until we break at least 10bp higher in real yield. The IL62s syndication makes me less positive on the ultra-longs.
Volatility Strategy (p 44): Euro Area and GBP volatilities have been very well bid, particularly in the top left in GBP and top-right in EUR. Scope for instability over the coming months is high and I would expect that disaster protection will keep volatility relatively supported.
Futures & Options Strategy (p49): Fade the sell-off in front Euribors. Consider EUR 2s10s or 5s30s flatteners. For Short Sterling, prefer high delta put structures in greens vs. selling 99.00-plus calls.
Technical Strategy (p56): Bunds have reached the 142.85 target, but displayed signals of possible short-term correction before continuing to move higher. A similar picture is Sweden.
EMU Issuance Update (p57): Weekly bond flows (p63), Auction Calendar (p64), Coupon & Redemption (p65), Portfolio of Trade Ideas (p66), Macro forecasts (p71)
European Rates Weekly | 11 May 2012
Page 2
Overview: the exit discussion is now… open Net: things can only get worse. My key theme of last week – that very few are believers in our scenario and so there are very few who are long, let alone limit long, seems the correct theme. I think the risk of a yield plunge is higher than a yield sell-off, especially since all those FI->equity trades in Q1 (when the world was allegedly fixed), have not been reversed yet. This would make you bullish 30s, but 10s remains safer sweetspot, bunds favoured market. But this is not just about bunds: witness the incredible moves in JGBs where shorts are being squeezed.
The cat is out of the bag. The debate is now – finally - on for Greece, and whether countries can live outside EMU, and whether this would be devastating for the economy or not (I know what I think – I show how Greece is a huge winner in total debt terms, if it left EMU and executed a currency or hard default on its debt, its circumstances would be changed). We are extremely clear on this: it has been obvious for a number of years how EMU will play through. It has worked to plan since Q2 2010, so next steps are a) markets will educate now on what exiting looks like, expect chat on Iceland, Argentina, Uruguay, etc; b) next big theme will be deposit flight risk; which in turn makes c) increasing discussion about others being affected. Short periphery.
I think the risk now is for a yield plunge.
Too many are still looking the wrong way, ie are looking for ‘exit’ trades on the overriding global financial theme of ‘safe havens rallying’.
There are many ways to view this, such as via EMU 5y25f, where you can enter a 1x2 spreads and as long as yields are above -6bp in 25 years, you make money. Note that long end EMU, which has been lagging the 5 & 10yr sectors as we would expect in this lower yield move, has seen a strong end of week performance, leaving 10s30s 2bp flatter on the week. And in forward space, such as EMU 5y25f mentioned above, there have been severe downward yield spikes. At the time of writing (Friday afternoon) this is -26bp on the day. A tempting sell at 1.81%? Perhaps, but I will not be selling it.
It is clear what is happening – no one is long, and eventually this will become an issue for ALM funds. Impossible to time, but not impossible to call as a theme. Also see Simon Peck’s very timely UK article about the UK pension fund solvency update – this is all very similar to that of EMU, ie, we know there is a mismatch, we know there is a latent bid, and we know that bid will eventually potentially disconnect yields much lower. We want to have such trades onside. We cannot risk a flattener in a bull steepening world, but it does make you more outright bullish.
I discussed last week another 3 pointers that show a marketplace that is underweight risk in our ‘safe haven’ trade (ie long 10y bunds is the sweetspot, or however you wish to position for this, eg 5y5y, or long of lower for longer trades in 1y3f in EMU, or long of 10y UK/US/Canada/Australia/Sweden – we will make or lose our years via absolute market-level bets). To recap, those pointers were the violent reaction to the Australian -50bp rate cut; the fact USTs made strong new highs and broke to new yield lows post payrolls despite our survey showing the highest proportion in a year of clients alleging (in advance) they wanted to sell upticks; and the sharp rally in Gilts two weeks ago as many short positions were squeezed out.
You could argue in the UK’s case that the same has just happened on Friday. After an alleged watershed last Thursday of no more QE from the MPC (merely locking in the move to neutral from Mr Posen/Tucker/MPC minutes – even we were not seeing more QE at that meeting), many jumped on the ‘end of QE’ view, and 10y Gilts took back most of the week’s gains – yet they then immediately bounced back the next day.
Andrew Roberts
European Rates Weekly | 11 May 2012
Page 3
Yet again, the market is causing most pain where it can – there is enough evidence to suck in bond bears for a day, but the overriding theme is still lower yields (for the record, even with that blowout +8bp day, 10y Gilts rallied net -5bp in the past week).
It is dangerous being short any safe haven product given Europe is hastening now to its conclusion.
Is this just about EMU? Not only. Some other very bullish pointers for you before we even start on the biggest theme in Europe – deposit flight – which will soon be everyone’s top theme.
1) Sweden this week followed through on end-April proposals to set up a Swedish gov’t bond portfolio, readying itself for QE if it needs to do so. An SEK10bn fund is not going to excite anyone, and this is just about increasing the available tools to the Riksbank, but the signal it sends is powerful. Well, it is to us - the reaction we were fed back with was ‘old news’ (it had been suggested on 27 April). Yet 10-yr Sweden has this week moved back below 10-yr Germany for the first time since February. Do read Par Magnusson’s piece where he discusses the portfolio in detail.
2) UK construction data was revised from -3% to -4.8%, which cuts GDP by an extra -0.14%, which means a revision down in UK Q1 GDP at next print from -0.2% to at least -0.3%.
3) Japan is not on everyone’s radar screens. We suspect this is partly because yields have been so low for so long that there has been an unwillingness to invest. I remember an old boss, 10 years ago, making the point that global investors had been underweight JGBs in their global gov’t portfolios for 15 years. Well, not much has changed. Being short JGBs has been a more popular trade in Q4 2011 with growing fears about lack of household sponsorship – I certainly had numerous conversations about it in November/December. I can see the reasons why Japan is inevitably a terrible credit in a few years time, but I would not consider that a trade for now. We have just updated our RBS sovereign risk index (which takes into account total debt levels, rule of law, bank assets, loan to deposit ratios, etc), and Japan is now the worst credit in the developed world. Last time – published in the year ahead - it was 2nd worst, after Greece. But the idea they sell-off now misses the large corporate surpluses which can and will be put to work, or the policy flexibility to keep JGB yields low (ie, it becomes a yen trade, not an FI trade – we will return to this in a year or perhaps longer). Anyway, the point is that all the payer swaptions were entered at 1-1.1% on 10y JGB equivalent, and Japan is showing one of the world’s most violent bond rallies. This is an absolute value world, do not be short any safe havens.
On that subject, read an ECB paper in the monthly bulletin which compares Europe to Japan. My new catchword is Japanification (of Europe). See Giles Gale’s volatility articles for more (especially last week’s). 1y forwards have converged from 20yrs onwards, but EMU forwards sit substantially higher than Japan further up the curve (eg 1y10f in EMU is 3.06%, over 100bp above the 2.01% in Japan). In my view, another strong support for longs in bunds at 5-10yr sector.
My website of the week: www.thecurrencycollector.com
For a great look at how money circulates on a currency exit, click on ‘stamps on notes’

European Rates Weekly | 11 May 2012
Page 4
Leaving aside the interesting charts above, which show that Japan did not start its recession/deleveraging period with terrible numbers, it was the ongoing lack of credit creation, and devastating cut to trend GDP that had such long lasting corrosive effect. One of my big themes some years ago was that trend GDP in Japan had moved from 4.1% in 1990 to sub 1% by the mid 2000s. This is a primary support for much lower structural bond yields in developed majors – trend GDP is on its way down once you overlay deleveraging and demographics, the 2 overriding themes in my opinion. The below chart shows how the US is going some way to getting through its deleveraging (well, only in a private sector sense), but EMU has done …nothing.
House prices. Adjustments can take a long time
Source: RBS; ECB monthly bulletin; S&P; Fiserv; MacroMarkets LLC; Japan Real Estate Research Institute
We apologise if this does not seem very ‘weekly’, but it is absolutely relevant as your big overarching theme. And it goes a long way to explaining why bonds are not rich right now. Sure, they may be close to the rich end of our fair value models for bunds and Gilts, but I would not describe them as over-expensive. It just requires an adoption of the concept of JAPANIFICATION to see that perhaps rates stay long forever (it was only a month ago that many were seeing early Fed & MPC exits etc), and term premia are too high along the curve out to 10 years.
Gross debt/GDP ratio: EMU is following the identical path to Japan. US and EMU have some optimistic forecasts
Source: IMF Word Economic Outlook, October 2011; RBS; ECB Monthly bulletin
. . . and Japan started with a far better primary balance than EMU (& US)
Source: IMF Word Economic Outlook, October 2011; RBS; ECB monthly bulletin
European Rates Weekly | 11 May 2012
Page 5
Back to Europe
I introduced last week’s overview with the following view on Greece
“Greece’s elections are woefully under focused on, a no result/weak majority is very possible, we are sceptical of the idea that PASOK/ND are an easy done deal (in financial market estimate terms), and suspect that immediate talk come the week ahead will be about exit & renegotiations.”
Why was Greece so underdiscussed? This past week has suddenly seen all those telling us that Greece was a one-off with no effect on anything else (well, 10yr Spain is net +28bp on the week) being replaced with the media now starting to talk about the most relevant point as far as I can see it: if a country exits, you have a blueprint, and it risks a bushfire across some European countries.
Why? Whether you believe or not that any other country will follow the path that Greece is about to tread (I personally believe they will, but have never wanted to be seen as stoking the fire of the crisis by writing such over the past two years), the prospect of the private sector removing their deposits risks making events self-fulfilling.
We suspect many will start discussing Argentina a lot more in coming weeks. Harvinder Sian and Biagio Lapolla write about it at length in this document. Remember that under exits from currency unions, you will not necessarily leave all your debts in other currencies – could Hellenic Telecom be paid in new drachmas but have its debt still in euros? – which is why Argentina, with its dollarized economy (90% of its mortgages were in USD), just passed a law converting everything to pesos.
Once you take this on board, you realise that the key numbers to be following are bank deposit data, which we have been discussing in every meeting for some months. It is not falling off dramatically yet in Italy, but it is doing so in Spain.
We have a responsibility not to be overly aggressive in this debate, which we hope you will feel we have not been, and there are many sensitive parties out there, but we have finally reached the point at which a sensible debate can start, about the economic viability of certain countries membership of EMU.
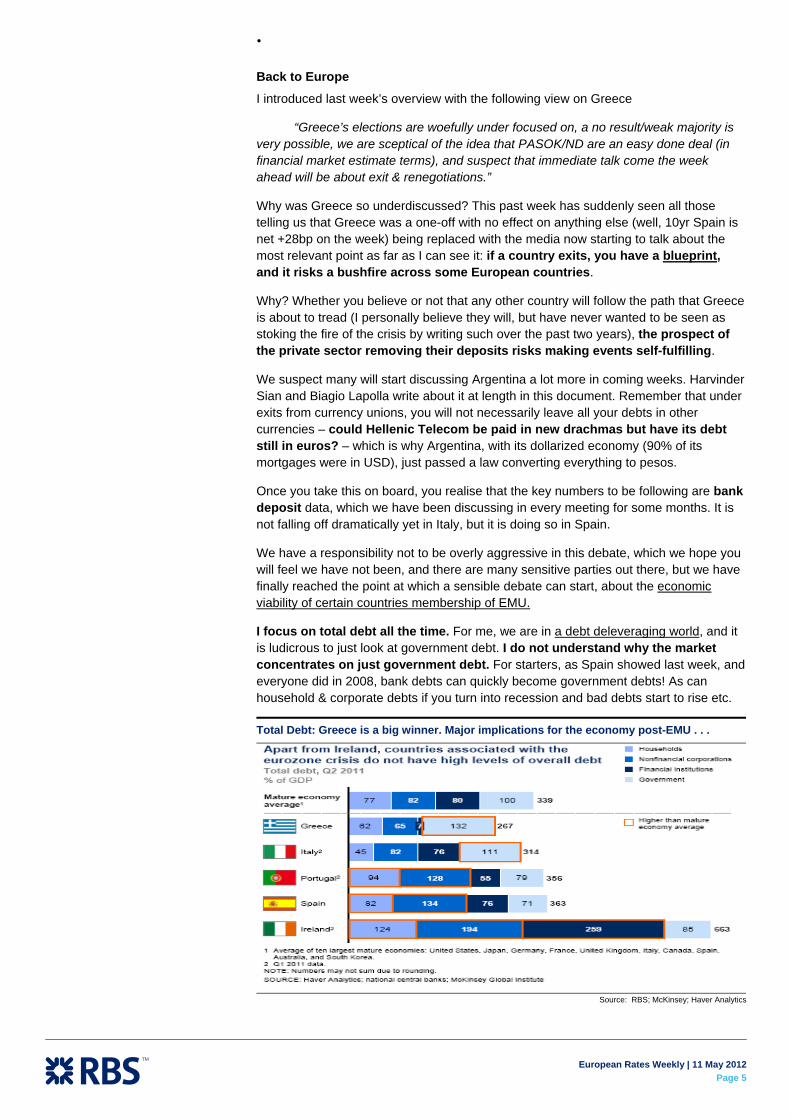
I focus on total debt all the time. For me, we are in a debt deleveraging world, and it is ludicrous to just look at government debt. I do not understand why the market concentrates on just government debt. For starters, as Spain showed last week, and everyone did in 2008, bank debts can quickly become government debts! As can household & corporate debts if you turn into recession and bad debts start to rise etc.
Total Debt: Greece is a big winner. Major implications for the economy post-EMU . . .
Source: RBS; McKinsey; Haver Analytics
European Rates Weekly | 11 May 2012
Page 6
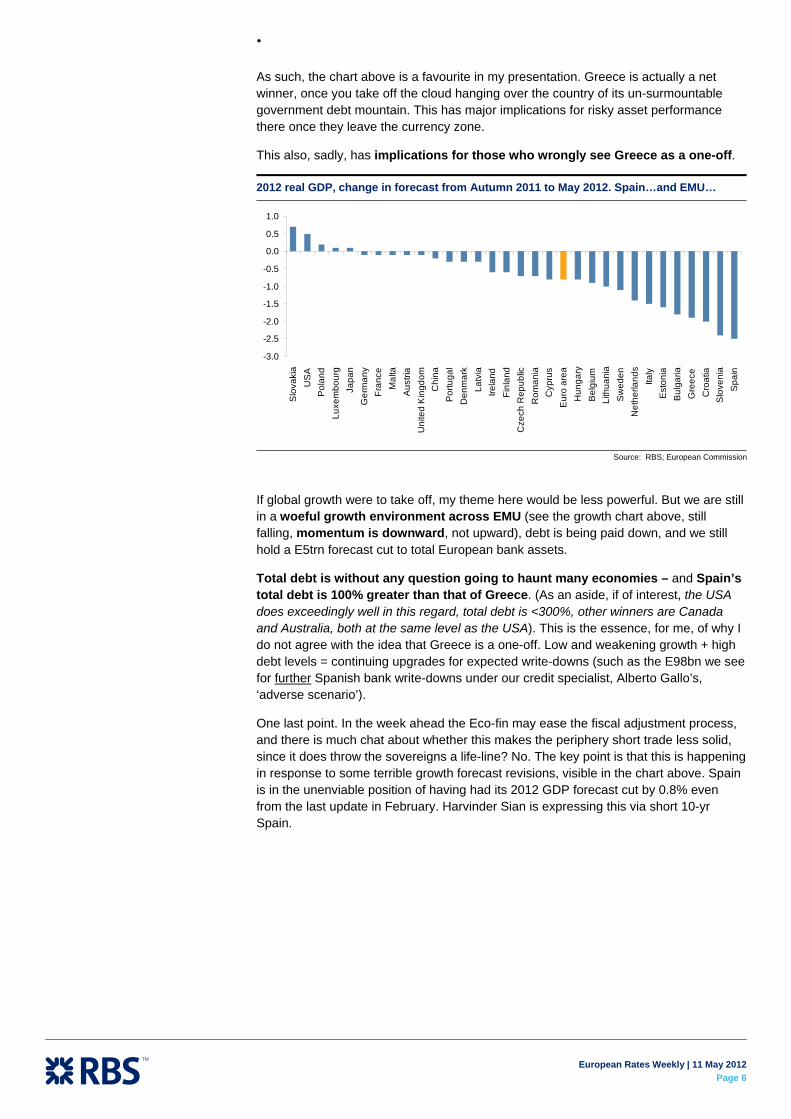
As such, the chart above is a favourite in my presentation. Greece is actually a net winner, once you take off the cloud hanging over the country of its un-surmountable government debt mountain. This has major implications for risky asset performance there once they leave the currency zone.
This also, sadly, has implications for those who wrongly see Greece as a one-off.
2012 real GDP, change in forecast from Autumn 2011 to May 2012. Spain…and EMU…
-3.0
-2.5
-2.0
-1.5
-1.0
-0.5
0.0
0.5
1.0
Slo
vaki
a
US
A
Pol
and
L
uxem
bour
g
Jap
an
Ger
man
y
Fra
nce
M
alta
A
ustri
a
Uni
ted
Kin
gdom
C
hina
P
ortu
gal
Den
mar
k
Lat
via
I
rela
nd
Fin
land
C
zech
Rep
ublic
R
oman
ia
Cyp
rus
E
uro
area
H
unga
ry
Bel
gium
L
ithua
nia
S
wed
en
Net
herla
nds
I
taly
E
ston
ia
Bul
garia
G
reec
e
Cro
atia
S
love
nia
S
pain
Source: RBS; European Commission
If global growth were to take off, my theme here would be less powerful. But we are still in a woeful growth environment across EMU (see the growth chart above, still falling, momentum is downward, not upward), debt is being paid down, and we still hold a E5trn forecast cut to total European bank assets.
Total debt is without any question going to haunt many economies – and Spain’s total debt is 100% greater than that of Greece. (As an aside, if of interest, the USA does exceedingly well in this regard, total debt is <300%, other winners are Canada and Australia, both at the same level as the USA). This is the essence, for me, of why I do not agree with the idea that Greece is a one-off. Low and weakening growth + high debt levels = continuing upgrades for expected write-downs (such as the E98bn we see for further Spanish bank write-downs under our credit specialist, Alberto Gallo’s, ‘adverse scenario’).
One last point. In the week ahead the Eco-fin may ease the fiscal adjustment process, and there is much chat about whether this makes the periphery short trade less solid, since it does throw the sovereigns a life-line? No. The key point is that this is happening in response to some terrible growth forecast revisions, visible in the chart above. Spain is in the unenviable position of having had its 2012 GDP forecast cut by 0.8% even from the last update in February. Harvinder Sian is expressing this via short 10-yr Spain.
European Rates Weekly | 11 May 2012
Page 7
Euro Area Rates Strategy There is no change in strategy or tactics from last week. We remain bullish in core rates with lower for long seen as favouring ongoing exposure to rates such as €3F1Y and also at the long end.
FRA/OIS basis is expected to drift wider but ability of the ECB to restrain bank risk is an important variable and means that we prefer to take on only cheap 1x1 puts in front Euribor or longer dated forward basis spreads.
In German bonds, the rally to new yield lows is not done. We continue to target 10y at 1.25% and below, if the Euro exit risk is for real, which we think is the case.
New Trade: Receive EUR 18m forward starting of the 7y tenor versus paying EUR 3F 2y.
€ 10s30s has flattened back to normal valuations and there is some risk of CVA activity and Danish ALM but not Dutch ALM. We continue to see forward steepeners, with 20y as the new sweet spot on the curve, as attractive.
Sovereign Strategy
The volatility and higher spreads that we expect come from two sources. Firstly, the Greece Euro exit risk and secondly, the prospect that the ESM will subordinate SPGB and BTPs will see these markets have more self-fulfilling crisis features.
New Greek elections are likely and the hope is that disaffected voters come back to ‘pro-bailout’ parties. If not, then Euro exit risks rise as Europe can not offer a gift sizeable enough to bribe Greek voters to stay the course. This means, on another hung parliament, that Greek government IOUs could trade as proxy currency as early as July. If this does not galvanise a large pro-euro vote intention into accepting Troika demands the actual exit looms. Opening up the Pandora’s box of exit means deposit risk across the periphery. The future of the euro would then be dictated by the subsequent policy response.
Spain’s new bad bank plan: We assess the news and the risks for SPGBs. The overall headline provisions are more realistic but will still be revised higher in our view which is a risk given that market conditions are not benign. We think that the provisions for small banks means more private to public sector risk transfer and this will also be necessary to make the bad bank plan work. Ultimately, we do not think this plan is enough around the crisis for SPGBs.
Harvinder Sian
Biagio Lapolla
European Rates Weekly | 11 May 2012
Page 8
Lower core rates set to push lower still The rally in core rates has continued with Bund yields hitting new lows. The near term bias from here is determined largely by the flow of events from Greece (on which we think the markets underestimate risk). Perhaps the most surprising feature of the rally is just how many investors have been looking to fight the move despite the fact that long 10y Bund has been one of the best trending performers with volatility low enough to deliver some attractive Sharpe ratios.
Our trading plan for the crisis and the macro data remains vanilla in that both call for
Much more ECB accommodation near term (policy easing and further large scale ECB balance sheet expansion).
Accommodation to be maintained medium term (lower for longer).
Portfolio rebalancing towards core markets favours Bunds, as evidenced in the fact that non resident exposure is rising and this data maps well the decline in Bund yields.
Our targets in 2y Schatz remain at negative yields and 10y Bund at 1.25%. Given the heightened risk of a Greek Euro exit (see the Sovereign section) we do not think that 1.25% is a floor for Bunds with levels below 1% feasible on flow.
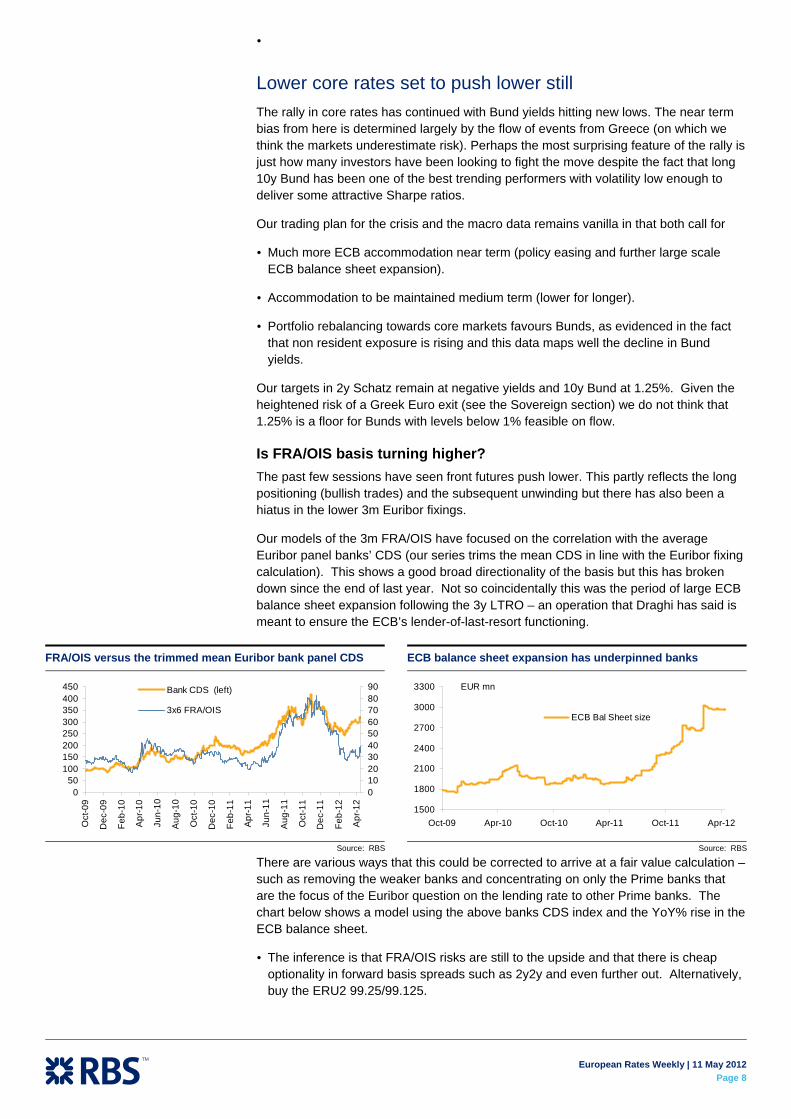
Is FRA/OIS basis turning higher? The past few sessions have seen front futures push lower. This partly reflects the long positioning (bullish trades) and the subsequent unwinding but there has also been a hiatus in the lower 3m Euribor fixings.
Our models of the 3m FRA/OIS have focused on the correlation with the average Euribor panel banks’ CDS (our series trims the mean CDS in line with the Euribor fixing calculation). This shows a good broad directionality of the basis but this has broken down since the end of last year. Not so coincidentally this was the period of large ECB balance sheet expansion following the 3y LTRO – an operation that Draghi has said is meant to ensure the ECB’s lender-of-last-resort functioning.
There are various ways that this could be corrected to arrive at a fair value calculation – such as removing the weaker banks and concentrating on only the Prime banks that are the focus of the Euribor question on the lending rate to other Prime banks. The chart below shows a model using the above banks CDS index and the YoY% rise in the ECB balance sheet.
The inference is that FRA/OIS risks are still to the upside and that there is cheap optionality in forward basis spreads such as 2y2y and even further out. Alternatively, buy the ERU2 99.25/99.125.
FRA/OIS versus the trimmed mean Euribor bank panel CDS
050
100150200250300350400450
Oct
-09
Dec
-09
Feb-
10
Apr
-10
Jun-
10
Aug
-10
Oct
-10
Dec
-10
Feb-
11
Apr
-11
Jun-
11
Aug
-11
Oct
-11
Dec
-11
Feb-
12
Apr
-12
0102030405060708090Bank CDS (left)
3x6 FRA/OIS
Source: RBS
ECB balance sheet expansion has underpinned banks
1500
1800
2100
2400
2700
3000
3300
Oct-09 Apr-10 Oct-10 Apr-11 Oct-11 Apr-12
ECB Bal Sheet size
EUR mn
Source: RBS
European Rates Weekly | 11 May 2012
Page 9
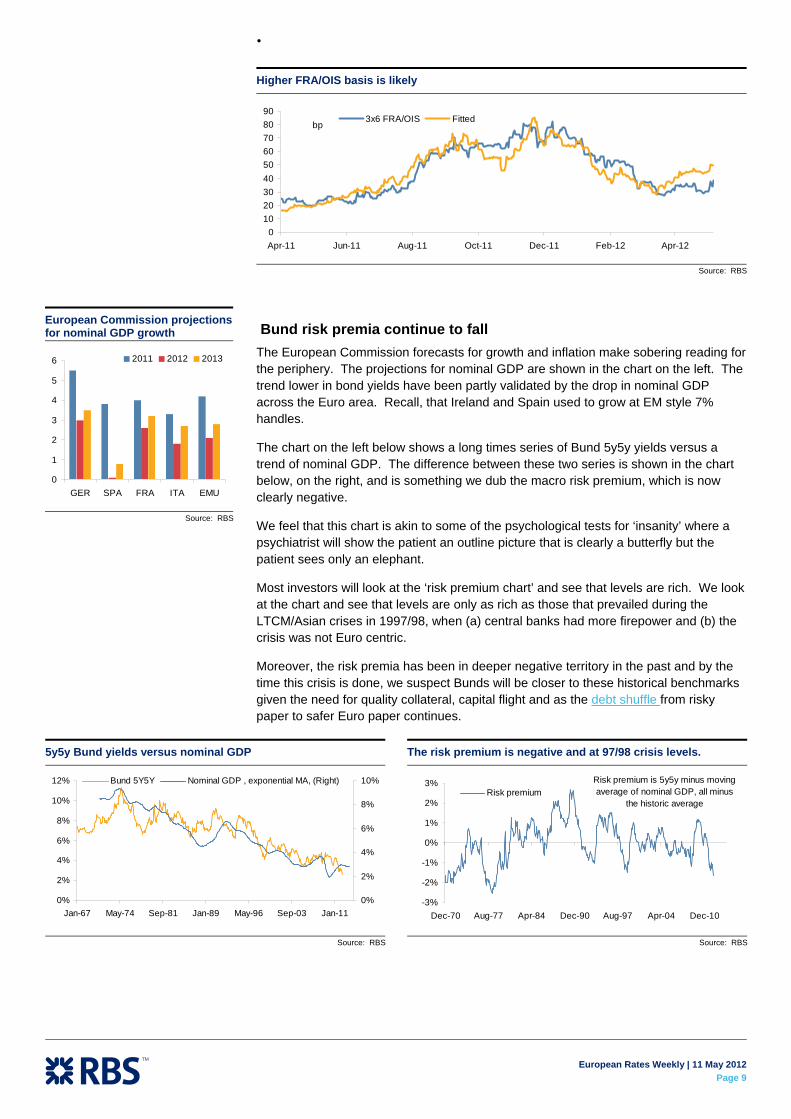
Higher FRA/OIS basis is likely
0102030405060708090
Apr-11 Jun-11 Aug-11 Oct-11 Dec-11 Feb-12 Apr-12
3x6 FRA/OIS Fittedbp
Source: RBS
Bund risk premia continue to fall The European Commission forecasts for growth and inflation make sobering reading for the periphery. The projections for nominal GDP are shown in the chart on the left. The trend lower in bond yields have been partly validated by the drop in nominal GDP across the Euro area. Recall, that Ireland and Spain used to grow at EM style 7% handles.
The chart on the left below shows a long times series of Bund 5y5y yields versus a trend of nominal GDP. The difference between these two series is shown in the chart below, on the right, and is something we dub the macro risk premium, which is now clearly negative.
We feel that this chart is akin to some of the psychological tests for ‘insanity’ where a psychiatrist will show the patient an outline picture that is clearly a butterfly but the patient sees only an elephant.
Most investors will look at the ‘risk premium chart’ and see that levels are rich. We look at the chart and see that levels are only as rich as those that prevailed during the LTCM/Asian crises in 1997/98, when (a) central banks had more firepower and (b) the crisis was not Euro centric.
Moreover, the risk premia has been in deeper negative territory in the past and by the time this crisis is done, we suspect Bunds will be closer to these historical benchmarks given the need for quality collateral, capital flight and as the debt shuffle from risky paper to safer Euro paper continues.
European Commission projections for nominal GDP growth
0
1
2
3
4
5
6
GER SPA FRA ITA EMU
2011 2012 2013
Source: RBS
5y5y Bund yields versus nominal GDP
0%
2%
4%
6%
8%
10%
12%
Jan-67 May-74 Sep-81 Jan-89 May-96 Sep-03 Jan-110%
2%
4%
6%
8%
10%Bund 5Y5Y Nominal GDP , exponential MA, (Right)
Source: RBS
The risk premium is negative and at 97/98 crisis levels.
-3%
-2%
-1%
0%
1%
2%
3%
Dec-70 Aug-77 Apr-84 Dec-90 Aug-97 Apr-04 Dec-10
Risk premium Risk premium is 5y5y minus moving average of nominal GDP, all minus
the historic average
Source: RBS

European Rates Weekly | 11 May 2012
Page 10
Richer term premium Our expectation that core rates will continue to push lower is obviously synonymous with flattening risk and lower curvature. To date the lower for longer theme has been played out to 5y but we are expecting longer tenors to 10y to also gain and this throws up some interesting trades.
For instance, the spread between EUR 18m forward start 7y and EUR 3F 2y looks attractive versus historical levels. The spread shows some long term mean-reverting features and the fact this spread has crossed the lower two-standard deviations band (based on an eight-year history) makes the risk reward compelling at these levels.
The trade shows some directionality, evident when looking at the correlation with 10y swaps. That said, the 32% R-squared is hardly impressive and secondly, the scatter chart on the right suggests that even if rates drop from here, the fact current levels are well below the fair value implied by the OLS regression, makes the trade compelling.
New Trade:
Receive EUR 18m forward starting of the 7y tenor versus paying EUR 3F 2y from current -26bp to target -11bp. Place stop loss at -32bp. The carry and roll is negative by 1 bp per month.
Long end swaps reach new lows: will there be an ALM push The all time low in swaps is causing some concern that forced buying at the long end of the curve may be seen by ALM. This has been partly behind the recent flattening in 10s30s swaps though fast money exiting steepeners has also been very prominent.
EUR 2Y Swap, 3Y Forward - EUR 7Y Swap, 18M Forward
-35-30-25-20-15-10
-505
1015
Jun-04 Sep-05 Dec-06 Mar-08 Jun-09 Sep-10 Dec-11
Rec EUR 18m 7Y vs 3F 2y
bp
Source: RBS
Scatter of EUR 18m 7y and EUR 3F 2y vs. 10y Swaps
R2 = 32%
-35-30-25-20-15-10
-505
1015
1.9 2.4 2.9 3.4 3.9 4.4 4.9 5.4
EUR 10y SwapRec
EU
R 1
8m 7
Y v
s 3F
2y
Source: RBS
Long end swap rates have hit new lows
2.0
2.5
3.0
3.5
4.0
4.5
5.0
5.5
May-07 Feb-08 Nov-08 Aug-09 May-10 Feb-11 Nov-11
30y swap 50y swap
Source: RBS
EUR 10s30s versus 30y swap rate
R2 = 0.0223
0
5
10
15
20
25
30
35
40
2.20 2.40 2.60 2.80 3.00 3.20 3.40
bp
30y rate
Source: RBS
European Rates Weekly | 11 May 2012
Page 11
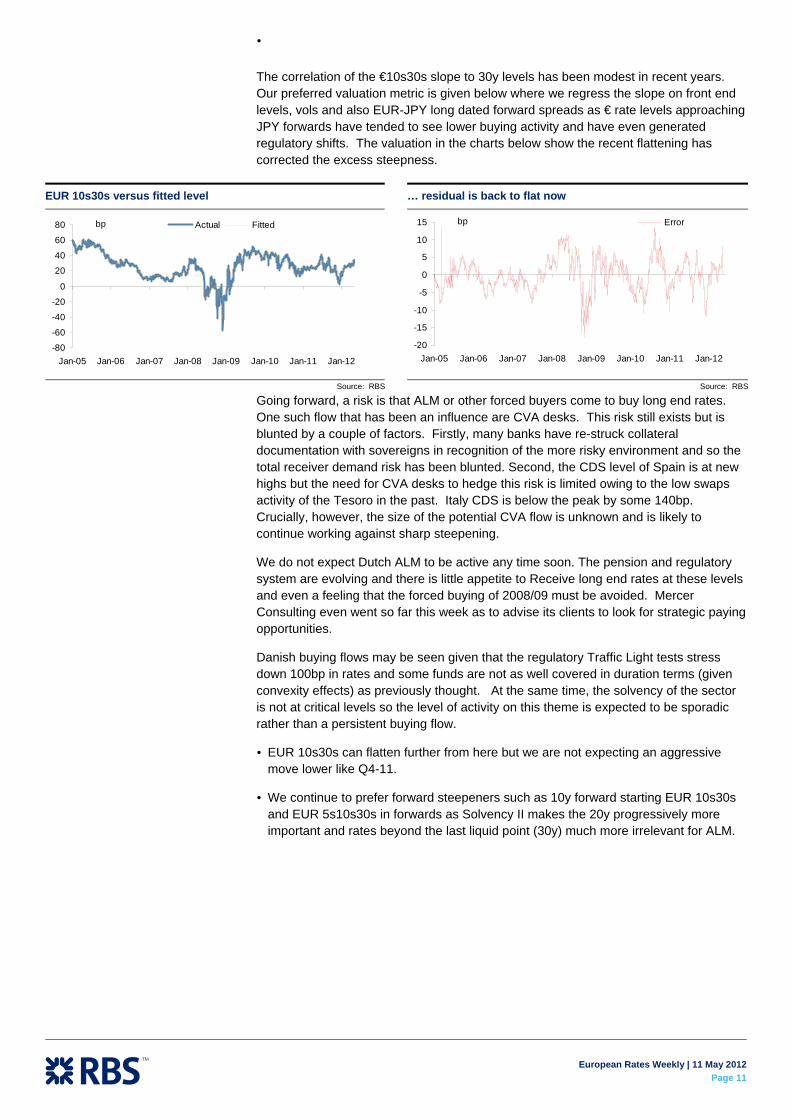
The correlation of the €10s30s slope to 30y levels has been modest in recent years. Our preferred valuation metric is given below where we regress the slope on front end levels, vols and also EUR-JPY long dated forward spreads as € rate levels approaching JPY forwards have tended to see lower buying activity and have even generated regulatory shifts. The valuation in the charts below show the recent flattening has corrected the excess steepness.
Going forward, a risk is that ALM or other forced buyers come to buy long end rates. One such flow that has been an influence are CVA desks. This risk still exists but is blunted by a couple of factors. Firstly, many banks have re-struck collateral documentation with sovereigns in recognition of the more risky environment and so the total receiver demand risk has been blunted. Second, the CDS level of Spain is at new highs but the need for CVA desks to hedge this risk is limited owing to the low swaps activity of the Tesoro in the past. Italy CDS is below the peak by some 140bp. Crucially, however, the size of the potential CVA flow is unknown and is likely to continue working against sharp steepening.
We do not expect Dutch ALM to be active any time soon. The pension and regulatory system are evolving and there is little appetite to Receive long end rates at these levels and even a feeling that the forced buying of 2008/09 must be avoided. Mercer Consulting even went so far this week as to advise its clients to look for strategic paying opportunities.
Danish buying flows may be seen given that the regulatory Traffic Light tests stress down 100bp in rates and some funds are not as well covered in duration terms (given convexity effects) as previously thought. At the same time, the solvency of the sector is not at critical levels so the level of activity on this theme is expected to be sporadic rather than a persistent buying flow.
EUR 10s30s can flatten further from here but we are not expecting an aggressive move lower like Q4-11.
We continue to prefer forward steepeners such as 10y forward starting EUR 10s30s and EUR 5s10s30s in forwards as Solvency II makes the 20y progressively more important and rates beyond the last liquid point (30y) much more irrelevant for ALM.
EUR 10s30s versus fitted level
-80
-60
-40
-20
0
20
40
60
80
Jan-05 Jan-06 Jan-07 Jan-08 Jan-09 Jan-10 Jan-11 Jan-12
Actual Fittedbp
Source: RBS
… residual is back to flat now
-20
-15
-10
-5
0
5
10
15
Jan-05 Jan-06 Jan-07 Jan-08 Jan-09 Jan-10 Jan-11 Jan-12
Errorbp
Source: RBS
European Rates Weekly | 11 May 2012
Page 12
Harvinder Sian
Biagio Lapolla
Sovereign Strategy The volatility and higher spreads that we expect come from two sources. Firstly, the Greece Euro exit risk and secondly, the prospect that the ESM will subordinate SPGB and BTPs will see these markets have more self-fulfilling crisis features.
New Greek elections are likely and the hope is that disaffected voters come back to ‘pro-bailout’ parties. If not, then Euro exit risks rise as Europe can not offer a gift sizeable enough to bribe Greek voters to stay the course. This means, on another hung parliament, that Greek government IOUs could trade as proxy currency as early as July. If this does not galvanise a large pro-euro vote intention into accepting Troika demands the actual exit looms. Opening up the Pandora’s box of exit means deposit risk across the periphery. The future of the euro would then be dictated by the subsequent policy response.
Spain’s new bad bank plan: We assess the news and the risks for SPGBs. The overall headline provisions are more realistic but will still be revised higher in our view which is a risk given that market conditions are not benign. We think that the provisions for small banks means more private to public sector risk transfer and this will also be necessary to make the bad bank plan work. Ultimately, we do not think this plan is enough around the crisis for SPGBs.
Trading plan update There is little new in the tactical game plan as we are maximum long Bunds and short periphery. If anything, we would want to raise sizes on the periphery shorts into the likely Greek election as exit risk is deemed higher than the market thinks. Moreover, we continue to think the ESM is a crisis accelerator.
As such, we still think our risk and trading calendar timing motivates moving from tactical risk to structural stress trades. What is the biggest near term positive? If this weekend’s German NRW election brings a federal government containing the SPD closer.
We remain in full size risk in BTP 2s10s flattener using BTP 2.25% Nov-13 and 5% Mar-22s, with a target of 150 bp initially.
Stay outright short SPGB 3.15% Jan16s. The initial target was 4.50% and then 5.0%. We are approaching our anticipated summer risk-off moves so target now 7%+.
Stay long DBR2 01/22 versus FRTR3 04/22 (DV01 weighted) from 135 bp to target 200 bp initially and place stop below 100 bp.
Short Italy versus Spain in 2026 paper. The fate of Italy and Spain is unlikely to be separated as far as the ESM is concerned and so current spreads at this point of the curve look attractive.
Remain in Bund ASW widening box versus Bobl;
Remain in Dutch 5s10s steepening versus France;
Remain in short DSL versus RFGB in 2028 bonds.
We are also long German 5y CDS protection from our Year Ahead publication and keep the trade. The long Bunds view is driven by a flow argument but that does not mean Germany is impervious to the crisis. The heatmaps of cross-market bond spreads and EGB slope spreads presented below show some potential interesting trades.
European Rates Weekly | 11 May 2012
Page 13
EGB rich-cheap heatmap
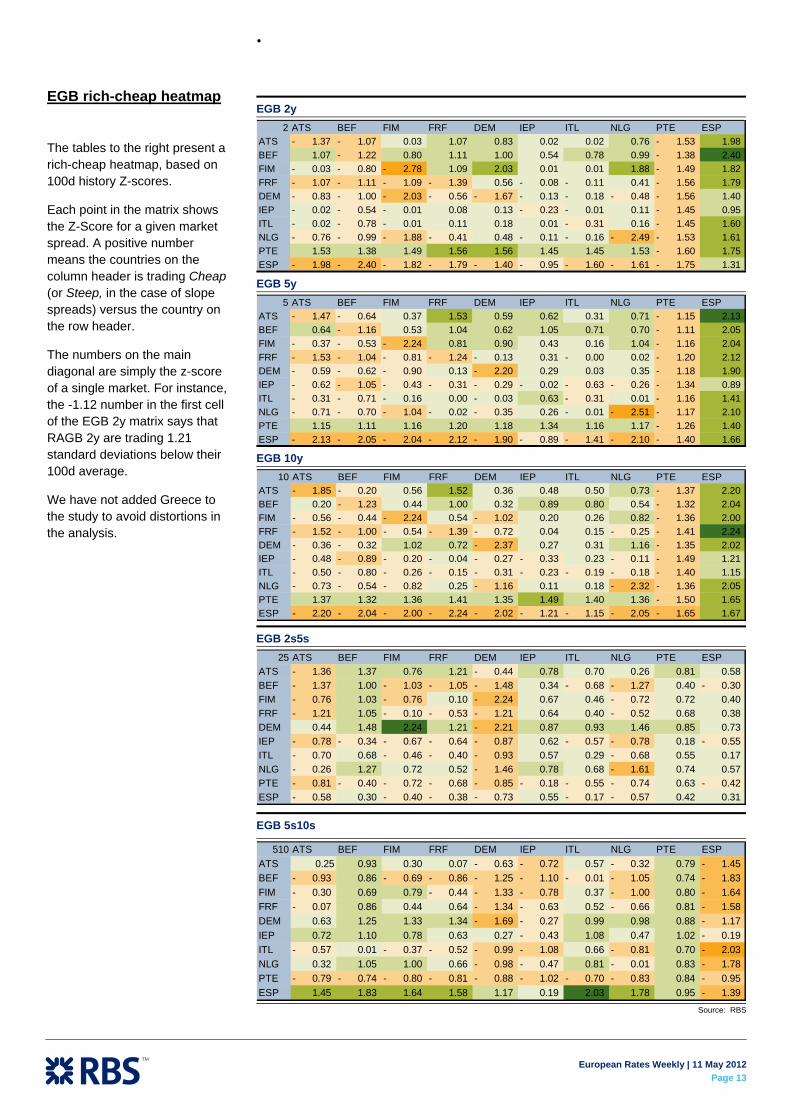
The tables to the right present a rich-cheap heatmap, based on 100d history Z-scores.
Each point in the matrix shows the Z-Score for a given market spread. A positive number means the countries on the column header is trading Cheap (or Steep, in the case of slope spreads) versus the country on the row header.
The numbers on the main diagonal are simply the z-score of a single market. For instance, the -1.12 number in the first cell of the EGB 2y matrix says that RAGB 2y are trading 1.21 standard deviations below their 100d average.
We have not added Greece to the study to avoid distortions in the analysis.
EGB 2y 2 ATS BEF FIM FRF DEM IEP ITL NLG PTE ESP
ATS 1.37- 1.07- 0.03 1.07 0.83 0.02 0.02 0.76 1.53- 1.98 BEF 1.07 1.22- 0.80 1.11 1.00 0.54 0.78 0.99 1.38- 2.40 FIM 0.03- 0.80- 2.78- 1.09 2.03 0.01 0.01 1.88 1.49- 1.82 FRF 1.07- 1.11- 1.09- 1.39- 0.56 0.08- 0.11- 0.41 1.56- 1.79 DEM 0.83- 1.00- 2.03- 0.56- 1.67- 0.13- 0.18- 0.48- 1.56- 1.40 IEP 0.02- 0.54- 0.01- 0.08 0.13 0.23- 0.01- 0.11 1.45- 0.95 ITL 0.02- 0.78- 0.01- 0.11 0.18 0.01 0.31- 0.16 1.45- 1.60 NLG 0.76- 0.99- 1.88- 0.41- 0.48 0.11- 0.16- 2.49- 1.53- 1.61 PTE 1.53 1.38 1.49 1.56 1.56 1.45 1.45 1.53 1.60- 1.75 ESP 1.98- 2.40- 1.82- 1.79- 1.40- 0.95- 1.60- 1.61- 1.75- 1.31
EGB 5y 5 ATS BEF FIM FRF DEM IEP ITL NLG PTE ESP
ATS 1.47- 0.64- 0.37 1.53 0.59 0.62 0.31 0.71 1.15- 2.13 BEF 0.64 1.16- 0.53 1.04 0.62 1.05 0.71 0.70 1.11- 2.05 FIM 0.37- 0.53- 2.24- 0.81 0.90 0.43 0.16 1.04 1.16- 2.04 FRF 1.53- 1.04- 0.81- 1.24- 0.13- 0.31 0.00- 0.02 1.20- 2.12 DEM 0.59- 0.62- 0.90- 0.13 2.20- 0.29 0.03 0.35 1.18- 1.90 IEP 0.62- 1.05- 0.43- 0.31- 0.29- 0.02- 0.63- 0.26- 1.34- 0.89 ITL 0.31- 0.71- 0.16- 0.00 0.03- 0.63 0.31- 0.01 1.16- 1.41 NLG 0.71- 0.70- 1.04- 0.02- 0.35- 0.26 0.01- 2.51- 1.17- 2.10 PTE 1.15 1.11 1.16 1.20 1.18 1.34 1.16 1.17 1.26- 1.40 ESP 2.13- 2.05- 2.04- 2.12- 1.90- 0.89- 1.41- 2.10- 1.40- 1.66
EGB 10y 10 ATS BEF FIM FRF DEM IEP ITL NLG PTE ESP
ATS 1.85- 0.20- 0.56 1.52 0.36 0.48 0.50 0.73 1.37- 2.20 BEF 0.20 1.23- 0.44 1.00 0.32 0.89 0.80 0.54 1.32- 2.04 FIM 0.56- 0.44- 2.24- 0.54 1.02- 0.20 0.26 0.82 1.36- 2.00 FRF 1.52- 1.00- 0.54- 1.39- 0.72- 0.04 0.15 0.25- 1.41- 2.24 DEM 0.36- 0.32- 1.02 0.72 2.37- 0.27 0.31 1.16 1.35- 2.02 IEP 0.48- 0.89- 0.20- 0.04- 0.27- 0.33- 0.23 0.11- 1.49- 1.21 ITL 0.50- 0.80- 0.26- 0.15- 0.31- 0.23- 0.19- 0.18- 1.40- 1.15 NLG 0.73- 0.54- 0.82- 0.25 1.16- 0.11 0.18 2.32- 1.36- 2.05 PTE 1.37 1.32 1.36 1.41 1.35 1.49 1.40 1.36 1.50- 1.65 ESP 2.20- 2.04- 2.00- 2.24- 2.02- 1.21- 1.15- 2.05- 1.65- 1.67
EGB 2s5s 25 ATS BEF FIM FRF DEM IEP ITL NLG PTE ESP
ATS 1.36- 1.37 0.76 1.21 0.44- 0.78 0.70 0.26 0.81 0.58 BEF 1.37- 1.00 1.03- 1.05- 1.48- 0.34 0.68- 1.27- 0.40 0.30- FIM 0.76- 1.03 0.76- 0.10 2.24- 0.67 0.46 0.72- 0.72 0.40 FRF 1.21- 1.05 0.10- 0.53- 1.21- 0.64 0.40 0.52- 0.68 0.38 DEM 0.44 1.48 2.24 1.21 2.21- 0.87 0.93 1.46 0.85 0.73 IEP 0.78- 0.34- 0.67- 0.64- 0.87- 0.62 0.57- 0.78- 0.18 0.55- ITL 0.70- 0.68 0.46- 0.40- 0.93- 0.57 0.29 0.68- 0.55 0.17 NLG 0.26- 1.27 0.72 0.52 1.46- 0.78 0.68 1.61- 0.74 0.57 PTE 0.81- 0.40- 0.72- 0.68- 0.85- 0.18- 0.55- 0.74- 0.63 0.42- ESP 0.58- 0.30 0.40- 0.38- 0.73- 0.55 0.17- 0.57- 0.42 0.31
EGB 5s10s
510 ATS BEF FIM FRF DEM IEP ITL NLG PTE ESPATS 0.25 0.93 0.30 0.07 0.63- 0.72- 0.57 0.32- 0.79 1.45- BEF 0.93- 0.86 0.69- 0.86- 1.25- 1.10- 0.01- 1.05- 0.74 1.83- FIM 0.30- 0.69 0.79 0.44- 1.33- 0.78- 0.37 1.00- 0.80 1.64- FRF 0.07- 0.86 0.44 0.64 1.34- 0.63- 0.52 0.66- 0.81 1.58- DEM 0.63 1.25 1.33 1.34 1.69- 0.27- 0.99 0.98 0.88 1.17- IEP 0.72 1.10 0.78 0.63 0.27 0.43- 1.08 0.47 1.02 0.19- ITL 0.57- 0.01 0.37- 0.52- 0.99- 1.08- 0.66 0.81- 0.70 2.03- NLG 0.32 1.05 1.00 0.66 0.98- 0.47- 0.81 0.01- 0.83 1.78- PTE 0.79- 0.74- 0.80- 0.81- 0.88- 1.02- 0.70- 0.83- 0.84 0.95- ESP 1.45 1.83 1.64 1.58 1.17 0.19 2.03 1.78 0.95 1.39-
Source: RBS
European Rates Weekly | 11 May 2012
Page 14
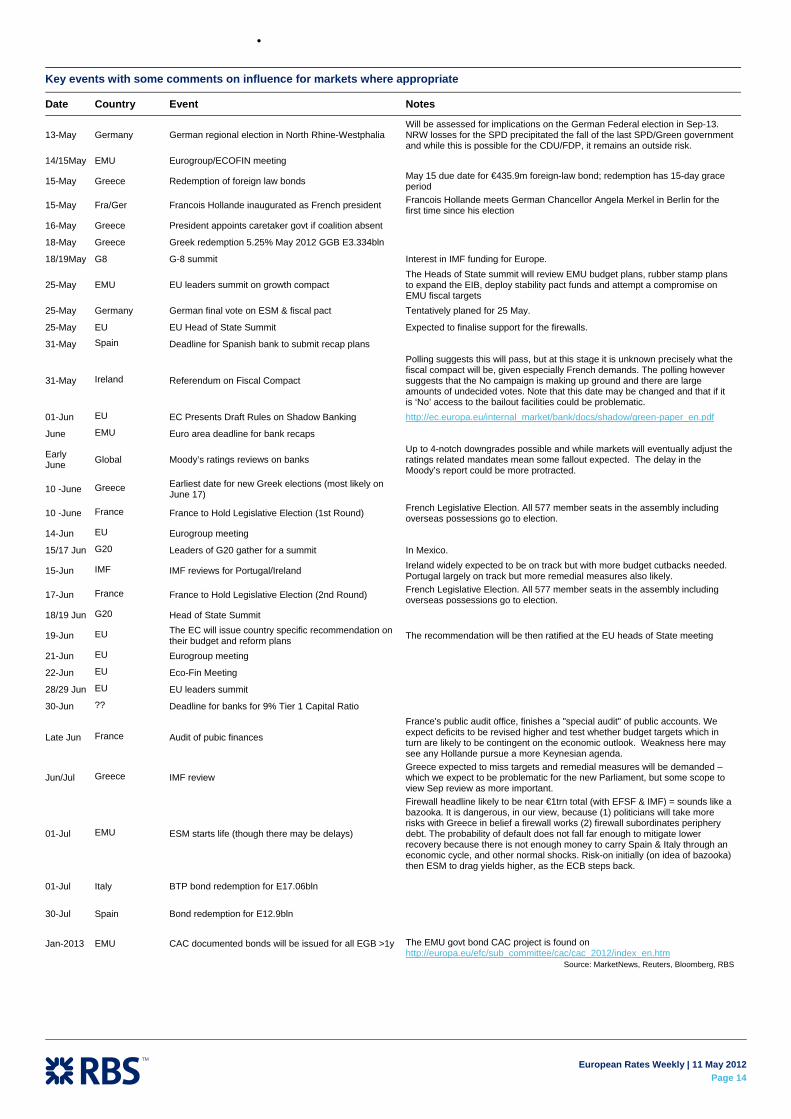
Key events with some comments on influence for markets where appropriate
Date Country Event Notes
13-May Germany German regional election in North Rhine-Westphalia Will be assessed for implications on the German Federal election in Sep-13. NRW losses for the SPD precipitated the fall of the last SPD/Green government and while this is possible for the CDU/FDP, it remains an outside risk.
14/15May EMU Eurogroup/ECOFIN meeting
15-May Greece Redemption of foreign law bonds May 15 due date for €435.9m foreign-law bond; redemption has 15-day grace period
15-May Fra/Ger Francois Hollande inaugurated as French president Francois Hollande meets German Chancellor Angela Merkel in Berlin for the first time since his election
16-May Greece President appoints caretaker govt if coalition absent
18-May Greece Greek redemption 5.25% May 2012 GGB E3.334bln
18/19May G8 G-8 summit Interest in IMF funding for Europe.
25-May EMU EU leaders summit on growth compact The Heads of State summit will review EMU budget plans, rubber stamp plans to expand the EIB, deploy stability pact funds and attempt a compromise on EMU fiscal targets
25-May Germany German final vote on ESM & fiscal pact Tentatively planed for 25 May.
25-May EU EU Head of State Summit Expected to finalise support for the firewalls.
31-May Spain Deadline for Spanish bank to submit recap plans
31-May Ireland Referendum on Fiscal Compact
Polling suggests this will pass, but at this stage it is unknown precisely what the fiscal compact will be, given especially French demands. The polling however suggests that the No campaign is making up ground and there are large amounts of undecided votes. Note that this date may be changed and that if it is ‘No’ access to the bailout facilities could be problematic.
01-Jun EU EC Presents Draft Rules on Shadow Banking http://ec.europa.eu/internal_market/bank/docs/shadow/green-paper_en.pdf
June EMU Euro area deadline for bank recaps
Early June Global Moody’s ratings reviews on banks
Up to 4-notch downgrades possible and while markets will eventually adjust the ratings related mandates mean some fallout expected. The delay in the Moody’s report could be more protracted.
10 -June Greece Earliest date for new Greek elections (most likely on June 17)
10 -June France France to Hold Legislative Election (1st Round) French Legislative Election. All 577 member seats in the assembly including overseas possessions go to election.
14-Jun EU Eurogroup meeting
15/17 Jun G20 Leaders of G20 gather for a summit In Mexico.
15-Jun IMF IMF reviews for Portugal/Ireland Ireland widely expected to be on track but with more budget cutbacks needed. Portugal largely on track but more remedial measures also likely.
17-Jun France France to Hold Legislative Election (2nd Round) French Legislative Election. All 577 member seats in the assembly including overseas possessions go to election.
18/19 Jun G20 Head of State Summit
19-Jun EU The EC will issue country specific recommendation on their budget and reform plans The recommendation will be then ratified at the EU heads of State meeting
21-Jun EU Eurogroup meeting
22-Jun EU Eco-Fin Meeting
28/29 Jun EU EU leaders summit
30-Jun ?? Deadline for banks for 9% Tier 1 Capital Ratio
Late Jun France Audit of pubic finances
France's public audit office, finishes a "special audit" of public accounts. We expect deficits to be revised higher and test whether budget targets which in turn are likely to be contingent on the economic outlook. Weakness here may see any Hollande pursue a more Keynesian agenda.
Jun/Jul Greece IMF review Greece expected to miss targets and remedial measures will be demanded – which we expect to be problematic for the new Parliament, but some scope to view Sep review as more important.
01-Jul EMU ESM starts life (though there may be delays)
Firewall headline likely to be near €1trn total (with EFSF & IMF) = sounds like a bazooka. It is dangerous, in our view, because (1) politicians will take more risks with Greece in belief a firewall works (2) firewall subordinates periphery debt. The probability of default does not fall far enough to mitigate lower recovery because there is not enough money to carry Spain & Italy through an economic cycle, and other normal shocks. Risk-on initially (on idea of bazooka) then ESM to drag yields higher, as the ECB steps back.
01-Jul Italy BTP bond redemption for E17.06bln
30-Jul Spain Bond redemption for E12.9bln
Jan-2013 EMU CAC documented bonds will be issued for all EGB >1y The EMU govt bond CAC project is found on http://europa.eu/efc/sub_committee/cac/cac_2012/index_en.htm
Source: MarketNews, Reuters, Bloomberg, RBS

European Rates Weekly | 11 May 2012
Page 15
Paths towards a Greek end-game New Greek elections are likely. The hope is that disaffected voters come back to ‘pro-bailout’ parties. If not, Euro exit risks rise. We do not think Europe can offer a gift sizeable enough to bribe Greek voters to stay the course. This means, on another hung parliament, that Greek government IOUs could trade as proxy currency as early as July. This may then galvanise a large pro-euro vote intention into accepting Troika demands. If not, exit looms. Opening up the Pandora’s box of exit means deposit risk across the periphery. The future of the euro would then be dictated by the subsequent policy response.
New Greek elections will be a referendum on the Euro
The Greek political establishment is trying to cobble together a coalition and while the leading parties, New Democracy and SYRIZA, have attempted and failed, there is a residual hope that PASOK may be successful. Its leader, Evangelos Venizelos, is courting the Democratic Left leader Fotis Kouvelis – though this also includes the negotiation of a gradual ‘disengagement’ from bailout austerity measures.
No party in Greece has a mandate to rewrite the bailout austerity measures and the comments from EU officials suggest there is little scope for large changes – a point we made in Greece: updated thoughts (7 May) when we argued that it is hard to see anything other than token efforts to relieve some of the austerity pain for Greece.
In terms of commentary: the rhetoric from core Europe, there is little confusion over what Greece needs to do:
ECB’s Jörg Asmussen: “Greece needs to be aware that there is no alternative to the agreed reform programme if it wants to remain a member of the Eurozone.”
German Foreign Minister Westerwelle: “If Greece ends the reform process it has undertaken, then I can’t see that the respective tranches [of aid] can be paid out.”
German Chancellor Merkel: “It is of utmost importance that the programs that we agreed on with Greece continue to be implemented. The process is a difficult one, but despite that it should go on.”
German Finance Minister Schäuble: “If Greece does not decide to stay in the Eurozone we can't force them to stay in it.”
Former SPD Finance Minister Steinbrück: “If I had political responsibility, I would want to prepare myself for a plan B in which the Eurozone is no longer necessarily composed of 17 members.”
(Bloomberg)
European Rates Weekly | 11 May 2012
Page 16
In other words, any compromise coalition – while likely to be welcomed near term – is likely to unravel as the full scale of the austerity programme demands comes clear with €11.5bn in new austerity measures needed as the first policy action. (The details of the MoU are presented on the next page.)
Equally, Greece may simply move to new elections, most likely on 17 June or perhaps as early as 10 June.
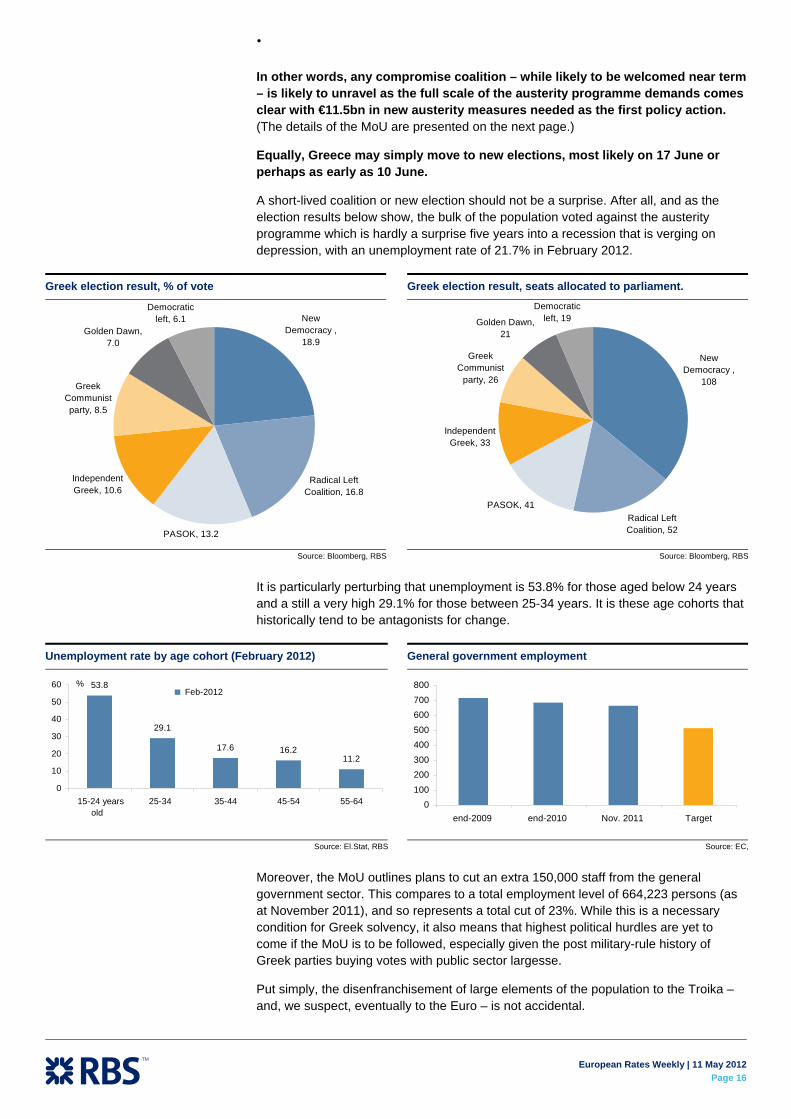
A short-lived coalition or new election should not be a surprise. After all, and as the election results below show, the bulk of the population voted against the austerity programme which is hardly a surprise five years into a recession that is verging on depression, with an unemployment rate of 21.7% in February 2012.
It is particularly perturbing that unemployment is 53.8% for those aged below 24 years and a still a very high 29.1% for those between 25-34 years. It is these age cohorts that historically tend to be antagonists for change.
Moreover, the MoU outlines plans to cut an extra 150,000 staff from the general government sector. This compares to a total employment level of 664,223 persons (as at November 2011), and so represents a total cut of 23%. While this is a necessary condition for Greek solvency, it also means that highest political hurdles are yet to come if the MoU is to be followed, especially given the post military-rule history of Greek parties buying votes with public sector largesse.
Put simply, the disenfranchisement of large elements of the population to the Troika – and, we suspect, eventually to the Euro – is not accidental.
Greek election result, % of vote
New Democracy ,
18.9
Radical Left Coalition, 16.8
PASOK, 13.2
Independent Greek, 10.6
Greek Communist party, 8.5
Golden Dawn, 7.0
Democratic left, 6.1
Source: Bloomberg, RBS
Greek election result, seats allocated to parliament.
New Democracy ,
108
Radical Left Coalition, 52
PASOK, 41
Independent Greek, 33
Greek Communist
party, 26
Golden Dawn, 21
Democratic left, 19
Source: Bloomberg, RBS
Unemployment rate by age cohort (February 2012)
53.8
29.1
17.6 16.211.2
0
10
20
30
40
50
60
15-24 yearsold
25-34 35-44 45-54 55-64
Feb-2012 %
Source: El.Stat, RBS
General government employment
0100200300400500600700800
end-2009 end-2010 Nov. 2011 Target
Source: EC,

European Rates Weekly | 11 May 2012
Page 17
Prior to first disbursement of the new programme, the government is to adopt the following measures, according to the latest MoU: • Reduction in pharmaceutical expenditure by at least €1.076bn in 2012. • Reduction in overtime pay for doctors in hospitals by at least €50m. • Reduction in the procurement of military material by €300m (cash and deliveries). • Reduction by 10% in the remuneration of elected and related staff at the local level and reduction in the number of deputy mayors and associated staff in 2013 with the aim of saving at least €9m in 2012 and €28m in 2013 and onwards. • Reduction in the central government's operational expenditure and election-related spending by at least €370m (compared to the 2012 budget), of which at least €100m is to come from military-related operational expenditure, and at least €70m from electoral spending. • Reduction in operational expenditure by local government with the aim of saving at least €50m. • Frontloading cuts in subsidies to residents in remote areas, and cuts in grants to several entities supervised by the several ministries, with the aim of reducing expenditure in 2012 by at least €190m. • Reduction in the public investment budget of €400m. • Changes in supplementary pension funds and pension funds with high average pensions or which receive high subsidies from the budget and cuts in other high pensions, with the aim of saving at least €450m (net after taking into account the impact on taxes and social contributions). • Cuts in family allowances for high-income households, with the aim of saving €43m. Prior to the disbursement, the government also is to adopt the following pending acts: • Ministerial Decisions for the implementation of the business tax (minimum levy on the self-employed) provided for in Article 31 of Law 3986/2011; • Ministerial Decisions to complete the full implementation of the new wage grid in all the pertinent entities, and legislation on the modalities for the recovery of wages paid in excess from November 2011 on. By end-June 2012, the government is to legislate an average reduction by 12% in the so-called 'special wages' of the public sector, to which the new wage grid does not apply. This will apply from 1 July 2012 and deliver savings of at least €205m (net after taking into account the impact on taxes and social contributions).
Source: IMF, EC
Exit threat: the only bargaining chip We had expected a mixed election result and one that would begin to test markets on the idea of the Greek EMU exit risk. The rationale for this view (which alongside the activation of the ESM) is seen as a key structural story behind wider EGB spreads this summer). On Greece the situation is clear.
The threat of another default from core EMU to Greece makes little sense as the bulk of loans to Greece are now in official hands and the PSI bonds are pari passu.
Greece would embrace a default that means less pain and reform – but markets would question just how it can remain in the Euro long term given that competitiveness and governance issues have not been addressed.
Given the weak bargaining position of core EMU to Greece, in the likely event of Troika non-compliance, the only feasible threat that may work in motivating real reform is the threat of exit from the Euro. Core Europe will have noted that 80% of the population wants to remain in the Euro but there is an equally high portion of the population that is against the austerity programme.
The exit threat is credible, a priori
We believe if there is a time in which core EMU may play the Greek exit card, it is when the ECB is backstopping banks and the ESM/EFSF/IMF firewall is in place. The latter is intended from July 2012. Given this, politicians may reason that contagion costs will be limited or at the least would be more inclined to take that gamble.
Second, the ability of Greece to survive in the Euro, even on a larger debt relief, is limited in the absence of economic restructuring.
Third, politicians have hinted at this threat before and the distrust is high enough to mean Greek bondholders get paid from an escrow account separate to other Greek bailout money.
The main argument against core EMU exercising the exit threat is the contagion it poses to other periphery countries, something that we explore below. Note that this does not prevent the a priori threat of exit.
The ex post action of core EMU will surely depend on the scale of the contagion to the rest of Europe, but there will be no easy choices here for the political elite as caving in to the fear of a Greek exit by offering Greece fiscal gifts will lead to huge moral hazard and a race to the bottom. If this were to be the case, then we would expect to hear about new bailout discussions which would involve more money for Greece.
European Rates Weekly | 11 May 2012
Page 18
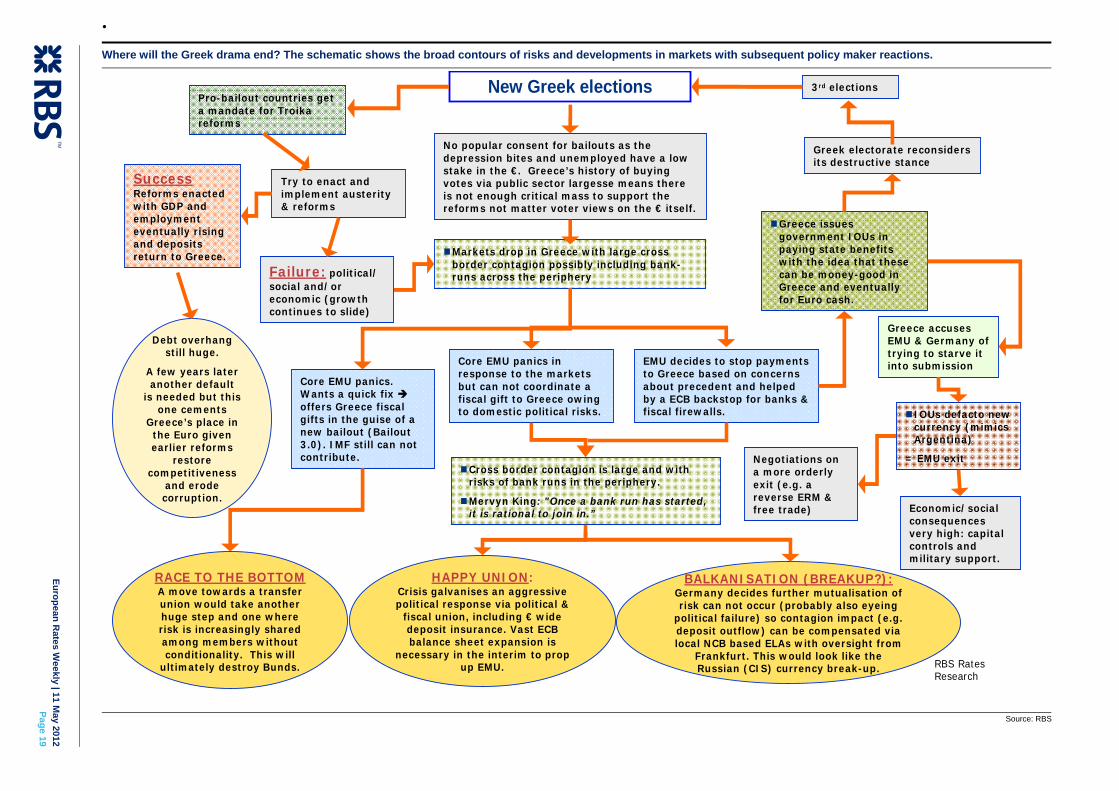
Assessing the paths for Greece In the chart on the next page, we outline various paths Greece may take; under the assumption of new elections (which are seen regardless of any near-term coalition deal). Our heavy bias is to an eventual exit of Greece from the Euro (90% risk in our view) but the exit risk for 2012 is path dependent on choices that are made, both by Greece and core EMU countries. One of key takeaways is the reflexive nature of the choices the Greek electorate and core EMU will make in response to market pressure and prior choices.
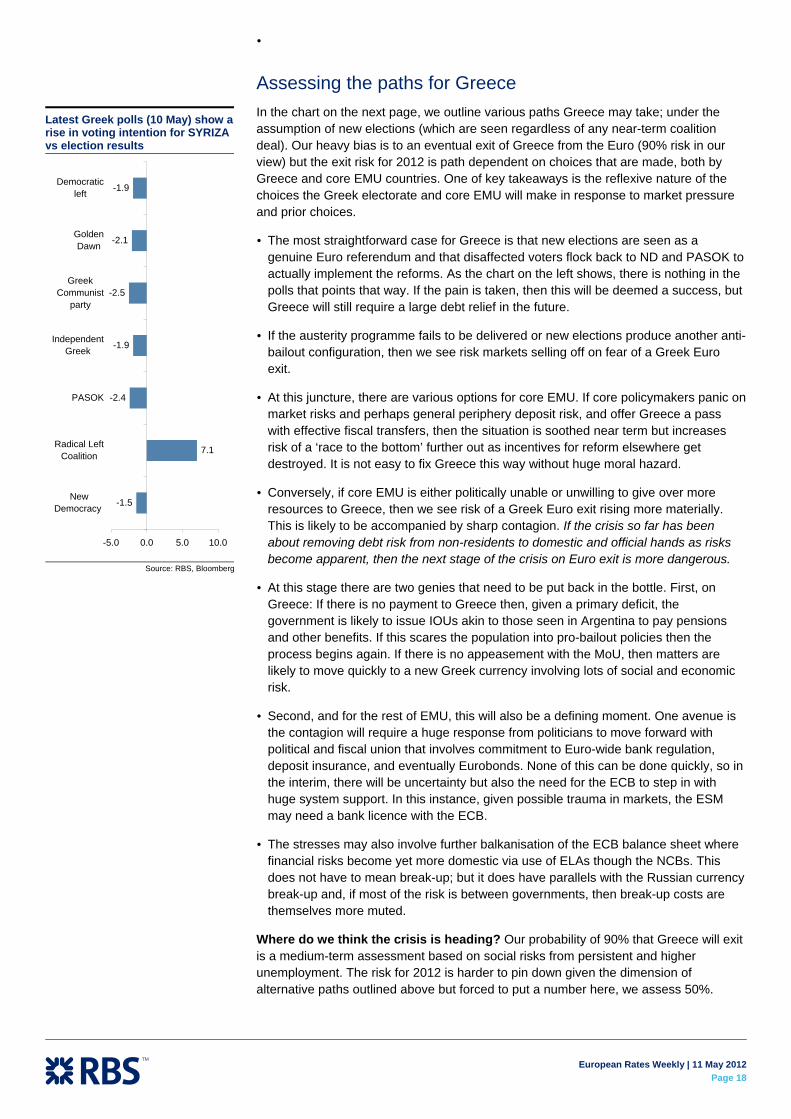
The most straightforward case for Greece is that new elections are seen as a genuine Euro referendum and that disaffected voters flock back to ND and PASOK to actually implement the reforms. As the chart on the left shows, there is nothing in the polls that points that way. If the pain is taken, then this will be deemed a success, but Greece will still require a large debt relief in the future.
If the austerity programme fails to be delivered or new elections produce another anti-bailout configuration, then we see risk markets selling off on fear of a Greek Euro exit.
At this juncture, there are various options for core EMU. If core policymakers panic on market risks and perhaps general periphery deposit risk, and offer Greece a pass with effective fiscal transfers, then the situation is soothed near term but increases risk of a ‘race to the bottom’ further out as incentives for reform elsewhere get destroyed. It is not easy to fix Greece this way without huge moral hazard.
Conversely, if core EMU is either politically unable or unwilling to give over more resources to Greece, then we see risk of a Greek Euro exit rising more materially. This is likely to be accompanied by sharp contagion. If the crisis so far has been about removing debt risk from non-residents to domestic and official hands as risks become apparent, then the next stage of the crisis on Euro exit is more dangerous.
At this stage there are two genies that need to be put back in the bottle. First, on Greece: If there is no payment to Greece then, given a primary deficit, the government is likely to issue IOUs akin to those seen in Argentina to pay pensions and other benefits. If this scares the population into pro-bailout policies then the process begins again. If there is no appeasement with the MoU, then matters are likely to move quickly to a new Greek currency involving lots of social and economic risk.
Second, and for the rest of EMU, this will also be a defining moment. One avenue is the contagion will require a huge response from politicians to move forward with political and fiscal union that involves commitment to Euro-wide bank regulation, deposit insurance, and eventually Eurobonds. None of this can be done quickly, so in the interim, there will be uncertainty but also the need for the ECB to step in with huge system support. In this instance, given possible trauma in markets, the ESM may need a bank licence with the ECB.
The stresses may also involve further balkanisation of the ECB balance sheet where financial risks become yet more domestic via use of ELAs though the NCBs. This does not have to mean break-up; but it does have parallels with the Russian currency break-up and, if most of the risk is between governments, then break-up costs are themselves more muted.
Where do we think the crisis is heading? Our probability of 90% that Greece will exit is a medium-term assessment based on social risks from persistent and higher unemployment. The risk for 2012 is harder to pin down given the dimension of alternative paths outlined above but forced to put a number here, we assess 50%.
Latest Greek polls (10 May) show a rise in voting intention for SYRIZA vs election results
-1.5
7.1
-2.4
-1.9
-2.5
-2.1
-1.9
-5.0 0.0 5.0 10.0
NewDemocracy
Radical LeftCoalition
PASOK
IndependentGreek
GreekCommunist
party
GoldenDawn
Democraticleft
Source: RBS, Bloomberg
European Rates W
eekly | 11 May 2012Page 19
Where will the Greek drama end? The schematic shows the broad contours of risks and developments in markets with subsequent policy maker reactions.
Pro-bailout countries get a mandate for Troika reforms
New Greek elections
Markets drop in Greece with large cross border contagion possibly including bank-runs across the periphery
No popular consent for bailouts as the depression bites and unemployed have a low stake in the €. Greece’s history of buying votes via public sector largesse means there is not enough critical mass to support the reforms not matter voter views on the € itself.
Try to enact and implement austerity & reforms
Failure: political/ social and/or economic (growth continues to slide)
SuccessReforms enacted with GDP and employment eventually rising and deposits return to Greece.
Core EMU panics. Wants a quick fix offers Greece fiscal gifts in the guise of a new bailout (Bailout 3.0). IMF still can not contribute.
3rd elections
Greece accuses EMU & Germany of trying to starve it into submission Core EMU panics in
response to the markets but can not coordinate a fiscal gift to Greece owing to domestic political risks.
EMU decides to stop payments to Greece based on concerns about precedent and helped by a ECB backstop for banks & fiscal firewalls.
Greece issues government IOUs in paying state benefits with the idea that these can be money-good in Greece and eventually for Euro cash.
Greek electorate reconsiders its destructive stance
Cross border contagion is large and with risks of bank runs in the periphery.
Mervyn King: "Once a bank run has started, it is rational to join in.”
RACE TO THE BOTTOMA move towards a transfer union would take another huge step and one where risk is increasingly shared among members without conditionality. This will
ultimately destroy Bunds.
HAPPY UNION:Crisis galvanises an aggressive political response via political &
fiscal union, including € wide deposit insurance. Vast ECB balance sheet expansion is
necessary in the interim to prop up EMU.
BALKANISATION (BREAKUP?):Germany decides further mutualisation of risk can not occur (probably also eyeing
political failure) so contagion impact (e.g. deposit outflow) can be compensated via local NCB based ELAs with oversight from
Frankfurt. This would look like the Russian (CIS) currency break-up.
IOUs defacto new currency (mimics Argentina)
= EMU exit Negotiations on a more orderly exit (e.g. a reverse ERM & free trade) Economic/social
consequences very high: capital controls and military support.
Debt overhang still huge.
A few years later another default
is needed but this one cements
Greece’s place in the Euro given earlier reforms
restore competitiveness
and erode corruption.
RBS Rates Research
Source: RBS
European Rates Weekly | 11 May 2012
Page 20
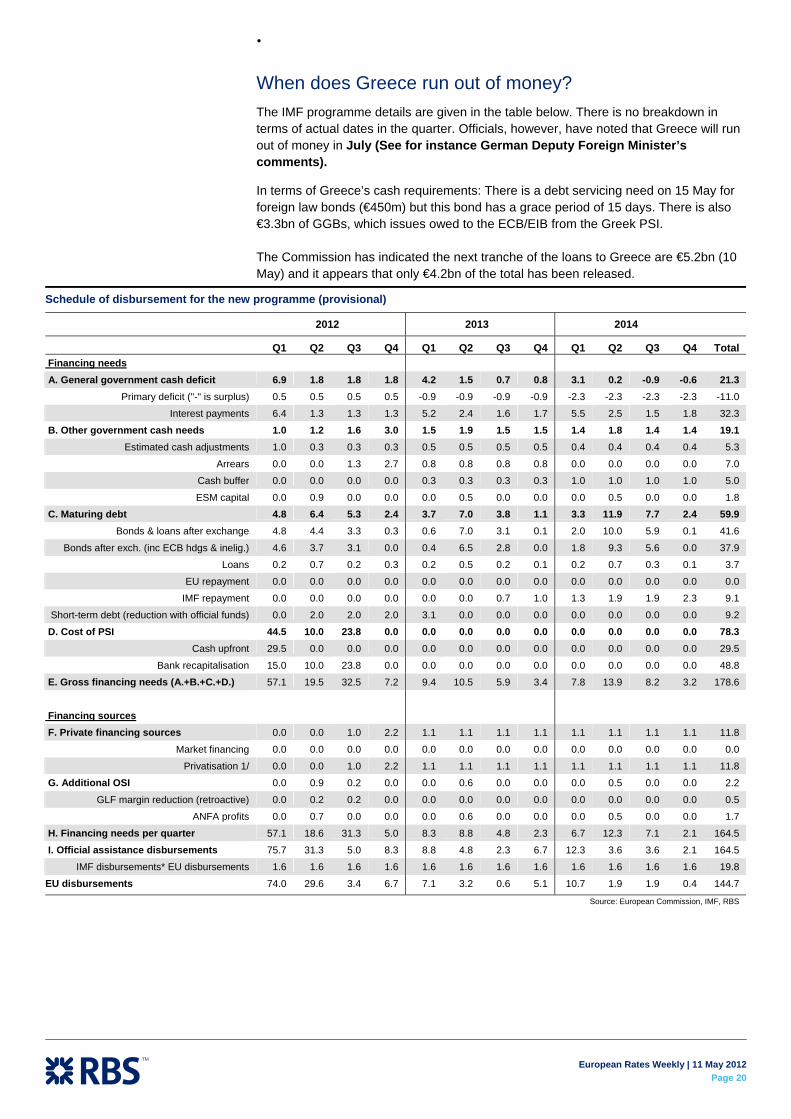
When does Greece run out of money? The IMF programme details are given in the table below. There is no breakdown in terms of actual dates in the quarter. Officials, however, have noted that Greece will run out of money in July (See for instance German Deputy Foreign Minister’s comments).
In terms of Greece’s cash requirements: There is a debt servicing need on 15 May for foreign law bonds (€450m) but this bond has a grace period of 15 days. There is also €3.3bn of GGBs, which issues owed to the ECB/EIB from the Greek PSI.
The Commission has indicated the next tranche of the loans to Greece are €5.2bn (10 May) and it appears that only €4.2bn of the total has been released.
Schedule of disbursement for the new programme (provisional)
2012 2013 2014
Q1 Q2 Q3 Q4 Q1 Q2 Q3 Q4 Q1 Q2 Q3 Q4 Total Financing needs
A. General government cash deficit 6.9 1.8 1.8 1.8 4.2 1.5 0.7 0.8 3.1 0.2 -0.9 -0.6 21.3 Primary deficit ("-" is surplus) 0.5 0.5 0.5 0.5 -0.9 -0.9 -0.9 -0.9 -2.3 -2.3 -2.3 -2.3 -11.0
Interest payments 6.4 1.3 1.3 1.3 5.2 2.4 1.6 1.7 5.5 2.5 1.5 1.8 32.3
B. Other government cash needs 1.0 1.2 1.6 3.0 1.5 1.9 1.5 1.5 1.4 1.8 1.4 1.4 19.1 Estimated cash adjustments 1.0 0.3 0.3 0.3 0.5 0.5 0.5 0.5 0.4 0.4 0.4 0.4 5.3
Arrears 0.0 0.0 1.3 2.7 0.8 0.8 0.8 0.8 0.0 0.0 0.0 0.0 7.0
Cash buffer 0.0 0.0 0.0 0.0 0.3 0.3 0.3 0.3 1.0 1.0 1.0 1.0 5.0
ESM capital 0.0 0.9 0.0 0.0 0.0 0.5 0.0 0.0 0.0 0.5 0.0 0.0 1.8
C. Maturing debt 4.8 6.4 5.3 2.4 3.7 7.0 3.8 1.1 3.3 11.9 7.7 2.4 59.9 Bonds & loans after exchange 4.8 4.4 3.3 0.3 0.6 7.0 3.1 0.1 2.0 10.0 5.9 0.1 41.6
Bonds after exch. (inc ECB hdgs & inelig.) 4.6 3.7 3.1 0.0 0.4 6.5 2.8 0.0 1.8 9.3 5.6 0.0 37.9
Loans 0.2 0.7 0.2 0.3 0.2 0.5 0.2 0.1 0.2 0.7 0.3 0.1 3.7
EU repayment 0.0 0.0 0.0 0.0 0.0 0.0 0.0 0.0 0.0 0.0 0.0 0.0 0.0
IMF repayment 0.0 0.0 0.0 0.0 0.0 0.0 0.7 1.0 1.3 1.9 1.9 2.3 9.1
Short-term debt (reduction with official funds) 0.0 2.0 2.0 2.0 3.1 0.0 0.0 0.0 0.0 0.0 0.0 0.0 9.2
D. Cost of PSI 44.5 10.0 23.8 0.0 0.0 0.0 0.0 0.0 0.0 0.0 0.0 0.0 78.3 Cash upfront 29.5 0.0 0.0 0.0 0.0 0.0 0.0 0.0 0.0 0.0 0.0 0.0 29.5
Bank recapitalisation 15.0 10.0 23.8 0.0 0.0 0.0 0.0 0.0 0.0 0.0 0.0 0.0 48.8
E. Gross financing needs (A.+B.+C.+D.) 57.1 19.5 32.5 7.2 9.4 10.5 5.9 3.4 7.8 13.9 8.2 3.2 178.6
Financing sources
F. Private financing sources 0.0 0.0 1.0 2.2 1.1 1.1 1.1 1.1 1.1 1.1 1.1 1.1 11.8
Market financing 0.0 0.0 0.0 0.0 0.0 0.0 0.0 0.0 0.0 0.0 0.0 0.0 0.0
Privatisation 1/ 0.0 0.0 1.0 2.2 1.1 1.1 1.1 1.1 1.1 1.1 1.1 1.1 11.8
G. Additional OSI 0.0 0.9 0.2 0.0 0.0 0.6 0.0 0.0 0.0 0.5 0.0 0.0 2.2
GLF margin reduction (retroactive) 0.0 0.2 0.2 0.0 0.0 0.0 0.0 0.0 0.0 0.0 0.0 0.0 0.5
ANFA profits 0.0 0.7 0.0 0.0 0.0 0.6 0.0 0.0 0.0 0.5 0.0 0.0 1.7
H. Financing needs per quarter 57.1 18.6 31.3 5.0 8.3 8.8 4.8 2.3 6.7 12.3 7.1 2.1 164.5
I. Official assistance disbursements 75.7 31.3 5.0 8.3 8.8 4.8 2.3 6.7 12.3 3.6 3.6 2.1 164.5
IMF disbursements* EU disbursements 1.6 1.6 1.6 1.6 1.6 1.6 1.6 1.6 1.6 1.6 1.6 1.6 19.8
EU disbursements 74.0 29.6 3.4 6.7 7.1 3.2 0.6 5.1 10.7 1.9 1.9 0.4 144.7
Source: European Commission, IMF, RBS
European Rates Weekly | 11 May 2012
Page 21
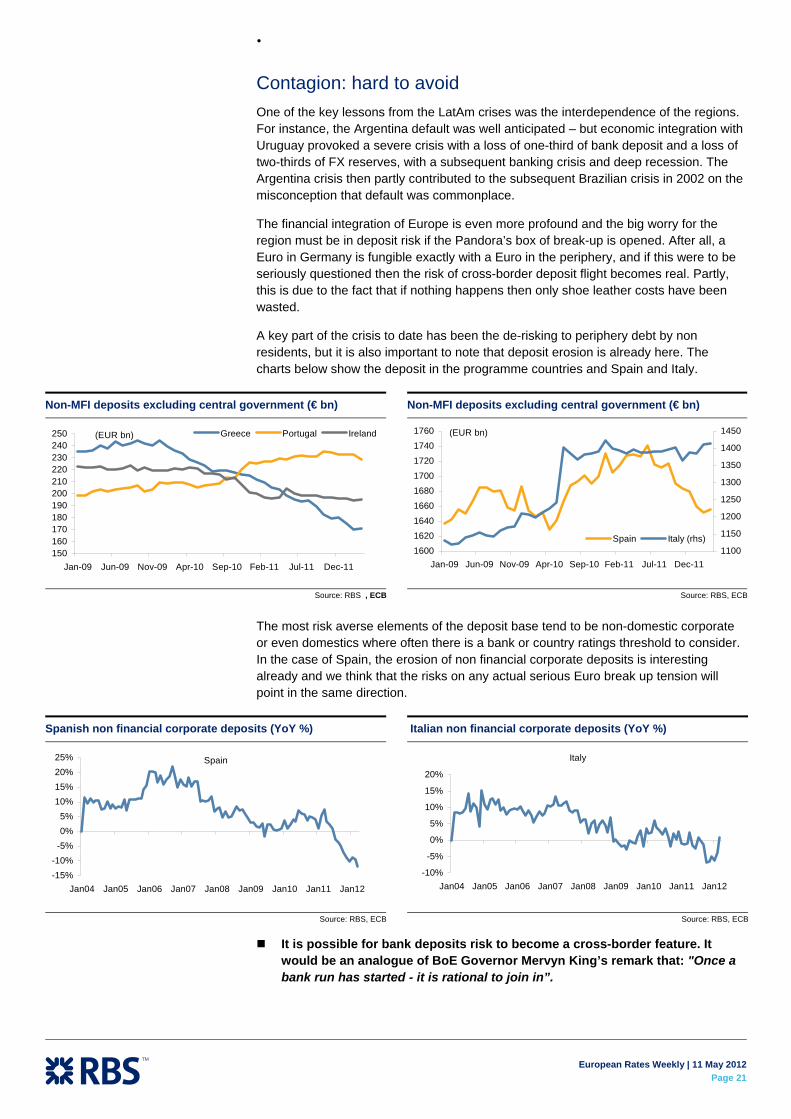
Contagion: hard to avoid One of the key lessons from the LatAm crises was the interdependence of the regions. For instance, the Argentina default was well anticipated – but economic integration with Uruguay provoked a severe crisis with a loss of one-third of bank deposit and a loss of two-thirds of FX reserves, with a subsequent banking crisis and deep recession. The Argentina crisis then partly contributed to the subsequent Brazilian crisis in 2002 on the misconception that default was commonplace.
The financial integration of Europe is even more profound and the big worry for the region must be in deposit risk if the Pandora’s box of break-up is opened. After all, a Euro in Germany is fungible exactly with a Euro in the periphery, and if this were to be seriously questioned then the risk of cross-border deposit flight becomes real. Partly, this is due to the fact that if nothing happens then only shoe leather costs have been wasted.
A key part of the crisis to date has been the de-risking to periphery debt by non residents, but it is also important to note that deposit erosion is already here. The charts below show the deposit in the programme countries and Spain and Italy.
The most risk averse elements of the deposit base tend to be non-domestic corporate or even domestics where often there is a bank or country ratings threshold to consider. In the case of Spain, the erosion of non financial corporate deposits is interesting already and we think that the risks on any actual serious Euro break up tension will point in the same direction.
It is possible for bank deposits risk to become a cross-border feature. It would be an analogue of BoE Governor Mervyn King’s remark that: "Once a bank run has started - it is rational to join in”.
Non-MFI deposits excluding central government (€ bn)
150160170180190200210220230240250
Jan-09 Jun-09 Nov-09 Apr-10 Sep-10 Feb-11 Jul-11 Dec-11
Greece Portugal Ireland(EUR bn)
Source: RBS , ECB
Non-MFI deposits excluding central government (€ bn)
160016201640
1660168017001720
17401760
Jan-09 Jun-09 Nov-09 Apr-10 Sep-10 Feb-11 Jul-11 Dec-111100
1150
1200
1250
1300
1350
1400
1450
Spain Italy (rhs)
(EUR bn)
Source: RBS, ECB
Spanish non financial corporate deposits (YoY %)
Spain
-15%-10%
-5%0%5%
10%15%20%25%
Jan04 Jan05 Jan06 Jan07 Jan08 Jan09 Jan10 Jan11 Jan12
Source: RBS, ECB
Italian non financial corporate deposits (YoY %)
Italy
-10%
-5%
0%
5%
10%
15%
20%
Jan04 Jan05 Jan06 Jan07 Jan08 Jan09 Jan10 Jan11 Jan12
Source: RBS, ECB

European Rates Weekly | 11 May 2012
Page 22
Summing up We have been expecting Greek exit risk to rise. The austerity push is getting to a tipping point for the social and electoral fabric of the country.
We are convinced that any new election will clearly be seen as a referendum on the Euro as core EMU countries will have no other way to impress upon Greece the need to stay the course.
This may work – but there is little basis to make that judgement at present.
If the anti-austerity vote remains strong – and in the absence of large fiscal gifts to Greece that 1) may not be politically feasible to deliver and 2) would encourage huge moral hazard – then the risk of a Greek Euro exit in 2012 rises notably.
A failure to make the bailout payments could see IOUs trade as proxy Greek currency as early as July. If these IOUs remain, because the electorate still is not willing to observe the reforms, then the exit will be cemented.
Just how the rest of Europe reacts here will dictate no less than the future of the Euro. The ECB will have a role to play in propping up the system to a far larger degree than now, but it will be political decisions on integration or balkanisation that should be most closely watched.
In terms of trades – and given that the Greek exit risk has been part of our trading plan – we stick to the themes and risk outlined in the last Rates Weekly and indeed much before that. Namely, remain limit long 10yr bunds (target 1.25% and perhaps below 1%), own 'lower for longer' (e.g. 1y3f) but also consider that the sweet spot can be 10yrs, while butterfly trades such as 5s10s30s in forward space are also excellent carry and performance vehicles. We expect the periphery crisis to take a turn for the worse and remain short Spain outright and France versus Bunds, with BTP flatteners and some other macro/RV switch ideas.

European Rates Weekly | 11 May 2012
Page 23
Appendix: A stylised history of currency break-ups for EMU investors Currency crises and currency break-ups are rare but not without precedent. In fact, there have been over 100 currency break-ups and exits from currency unions over the last hundred years (Checking Out: Exits from currency unions, A.K. Rose, 2007). While most of these events are not directly comparable with the EMU, they do provide a useful guide. The scope of this section is not to conduct an in-depth analysis into previous episodes of currency break-ups, but a glimpse into past experiences that might present useful similarities with the Euro crisis.
1. Argentina: from IOUs to Lecop burgers Argentina’s experience is one of the most interesting cases from which to draw comparisons with the Euro crisis. In fact, Argentina’s crisis unfolded around similar dimensions to those seen in the EMU: a partly self-inflicted economic grief linked to an artificially overvalued currency and exacerbated growing debt strains (especially external debt) that eventually filtered into the banking system.
Following a series of shocks that hit the country (starting with the 1999 recession), Argentina found itself trapped. Its choices: break the dollar currency board arrangement would be at the cost of bankrupting many domestic institutions (including the government) or muddle through a deflationary backdrop which could ultimately lead to an identical outcome.
In November 2001, Argentina converted domestically held international bonds into loans. Although the loans were issued under Argentine law and carried a lower interest rate, they were backed, at least in theory, by revenues from a financial transactions tax.
By end-2001, the economy and public finances were in deep crisis. In December, activity collapsed, with industrial production falling by 18% (year-on-year), construction by 36% and imports by more than 50%. Tax revenues plummeted 17% (year-on-year) in the final quarter of 2001 (in December, tax collections fell by almost 30% year-on year), and despite across-the-board spending cuts, the federal government ran an overall deficit of 4.5% of GDP in 2001 against a (revised) programme target of 2.5%.
Provincial finances also deteriorated. Out of Arg$17bn of federal transfers to the provinces, about Arg$1bn were in the form of federal guarantees of provincial T-bills (Lecops).
As the crisis progressed, provincial governments issued about Arg$1.6bn in bills (quasi-monies) to pay wages and suppliers – in the liquidity crunch – and this ‘money’ was also acceptable by the federal government in lieu of tax payments. The movement towards regional money is neatly captured by the fact that McDonald’s started selling Lecop burgers.
An example of Argentina’s Lecop (Letras de Cancelacion de Obligaciones Provinciales)
Source: Google Images
European Rates Weekly | 11 May 2012
Page 24
On 3 January 2002, President Duhalde – the fifth president in three weeks – confirmed the debt moratorium (as well as the intention to negotiate with private creditors) and announced the end of the convertibility regime. Three days later, Congress effectively replaced the convertibility regime with a dual exchange-rate system based on an official exchange rate of Arg$1.40 per US dollar for the public sector and most trade-related transactions (except luxury imports); all other transactions would take place at prevailing market rates.
At the same time, the monthly deposit withdrawal limit was raised to 1,500 pesos (previous limit: Arg$1,000), coupled with a freezing of term-deposits. US dollar deposits would remain frozen until at least 2003. To dampen inflation pressure, prices of privatised utilities (gas, electricity, telephones and water) were frozen indefinitely. Congress approved an emergency law that severely curtailed creditors’ rights.
USSR to the CIS
Following the break up of the Soviet Union and despite the independence of many post-Soviet states, the money supply was still officially controlled by the new Central Bank of Russia (CBR), which took over the role of the old Soviet central bank (Gosbank). Gosbank branches in the other post-USSR countries (now the Commonwealth of Independent States) became 14 independent central banks.
The old Soviet system was based on a dual monetary circuit: enterprises could convert Rubles in the bank into cash only for specified purposes – chiefly the payment of wages, which were paid in cash. All inter-enterprise transactions were required to be in non-cash Rubles to facilitate central planning and control. This dual circuit continued in the post-soviet Ruble zone. The implication was that while the CBR had monopoly on cash Rubles, the other central banks could and did create non-cash Rubles. This institutional structure not only led to a competition for seigniorage among post-Soviet states but the non-Russian states also found that they could finance their trade deficits with Russia by issuing credit to local commercial banks, which could extend it to local importers, with the resulting Ruble credit balances ending up in the accounts of the CBR.
The obvious flaw in this system was that credit creation was feasibly unlimited and created a free-rider problem, which eventually created much higher inflation that progressively saw the independent states abandon this monetary arrangement. The parallel with the Euro area is simply that if NCBs are allowed to extend local collateral rules and perhaps some form of ELA (to prop up local banking systems), then the free-rider/inflationary risk will also be apparent.
The CBR in July 1993 announced, without warning, that all Ruble notes printed between 1961 and 1992 would no longer be legal tender, leading to a crisis of Russians’ confidence in their monetary system. The behaviour of the second director of the CBR, Viktor Gerashchenko, led the Harvard economist Jeffrey Sachs to call him, famously, “the world’s worst central banker.” The Ruble fared little better outside Russia. The currency was subject to severe exchange-rate instability, and to repeated speculative attacks. Several post-Soviet governments rejected the “occupation Ruble” in early 1992 and introduced their own national currencies.
Czechoslovakia
During late 1992 and throughout January 1993, many Slovak firms and individuals transferred funds to Czech commercial banks in expectation of Slovak devaluation shortly after the political split. This was reflected in the apparent undervaluation of the Czech currency as the Czech exports to Slovakia rose 25% YoY at 1992 while Slovak exports to the Czech Republic increased by only 16%.
European Rates Weekly | 11 May 2012
Page 25
A consequence of this expectation of future devaluation of the Slovak currency was that Slovak importers sought to repay debts as soon as possible while Czech importers did exactly the opposite. All these developments led to a gradual outflow of currency from Slovakia to the Czech Republic. The central bank (SBCS) attempted to balance this outflow by credits to Slovak banks but this became increasingly difficult in December 1992 and January 1993. Thus, the Czech government and the CNB decided on 19 January 1993 to separate the currency.
After secret negotiations with the Slovak side, the separation date was set as 8 February 1993, and the Czech-Slovak Monetary Union ceased to exist less than six weeks after it came to being.
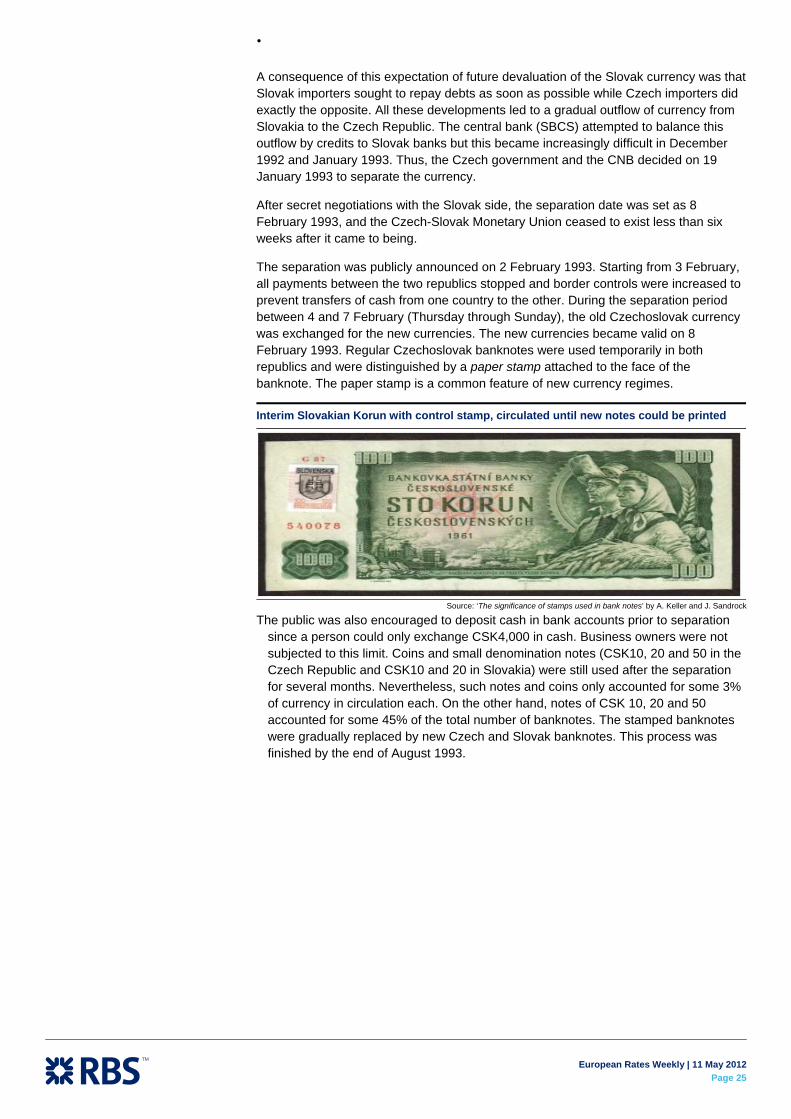
The separation was publicly announced on 2 February 1993. Starting from 3 February, all payments between the two republics stopped and border controls were increased to prevent transfers of cash from one country to the other. During the separation period between 4 and 7 February (Thursday through Sunday), the old Czechoslovak currency was exchanged for the new currencies. The new currencies became valid on 8 February 1993. Regular Czechoslovak banknotes were used temporarily in both republics and were distinguished by a paper stamp attached to the face of the banknote. The paper stamp is a common feature of new currency regimes.
Interim Slovakian Korun with control stamp, circulated until new notes could be printed
Source: ‘The significance of stamps used in bank notes’ by A. Keller and J. Sandrock
The public was also encouraged to deposit cash in bank accounts prior to separation since a person could only exchange CSK4,000 in cash. Business owners were not subjected to this limit. Coins and small denomination notes (CSK10, 20 and 50 in the Czech Republic and CSK10 and 20 in Slovakia) were still used after the separation for several months. Nevertheless, such notes and coins only accounted for some 3% of currency in circulation each. On the other hand, notes of CSK 10, 20 and 50 accounted for some 45% of the total number of banknotes. The stamped banknotes were gradually replaced by new Czech and Slovak banknotes. This process was finished by the end of August 1993.

European Rates Weekly | 11 May 2012
Page 26
Spain's bad bank plan The Spanish government announced the second phase of the Royal-Decree-Law of 3 February, which details the plan to resolve the banking crisis in the country. The measures discussed today are as follows:
The government will hire two auditors to undertake the valuation of all banks' entire loan portfolios.
General provisions on real estate exposure will increase to 30% from 7%, an extra EUR 30bn, before the year end. This is in addition to the EUR 53.8bn announced in the RDL. This EUR 83.8bn in total provisions compares to estimates of pre-provision income for 2012 of EUR 43bn across all the banks. Total provisions of Spanish banks against real estate assets and other loans will be EUR 137bn, vs. EUR 184bn of problematic exposure, giving a coverage ratio of 74.5%.
Spain will improve the flexibility of rental markets, which currently account for only 17% of total houses.
FROB will purchase CoCos in those banks unable to raise the provisions independently in order to recapitalise them. These will be charged interest at a rate of 10% and must be bought back within 5 years. These purchases are expected to be below EUR 15bn.
Spain will create a 'bad bank', which will take the form of an asset management company that will purchase non-performing and foreclosed real estate loans from the other banks. There is no information at this stage on how the bad banks will fund themselves or on what prices will be paid for these loans (i.e. market values, book values or some value in between), apart from that it will likely be linked to the values ascribed to the loans by the auditors. The expectation is that private investors will buy into these real estate asset management vehicles.
From a credit point of view, Alberto Gallo’s team in Macro Credit Strategy take on the announcement is that the plan is a positive step for Spain to get ahead of the curve in the bank recapitalisation process and to regain credibility, with the involvement of external auditors.
Yet, the measures take into account problematic real estate exposure only (EUR 184bn), which is a small fraction of the total domestic loan book of Spanish banks (EUR 1.7tn).
We discuss at the end of this chapter the implication for the Sovereign.
Some background info on Bankia Our Frequent Borrower team in Bankia partly nationalised (Special) has news. In March 2011, seven savings banks (Caja Madrid, Bancaja, Caja Insular de Canarias, Caja Avila, Caixa Laietana, Caja Segovia and Caja Rioja) agreed to transfer all of their assets and liabilities to BFA (except for social welfare projects). The savings banks together owned 100% of BFA. Bankia was constituted in April 2011. In May 2011, BFA as the initial 100% owner (it currently holds a 45.5% stake) transferred all of its assets and liabilities to Bankia - with a few exceptions.
A portfolio of assets worth €43.2bn including foreclosed land (€3bn), doubtful land development loans (€4.6bn), industrial stakes (€2.9bn), public debt (€10.2bn) and other long-term debt (€22.5bn) was kept at the BFA level.
On the liability side, liabilities including €14bn sub-debt (€4.5bn FROB's convertible preference shares, €4.1bn of other preference shares and €5.4bn dated sub debt),
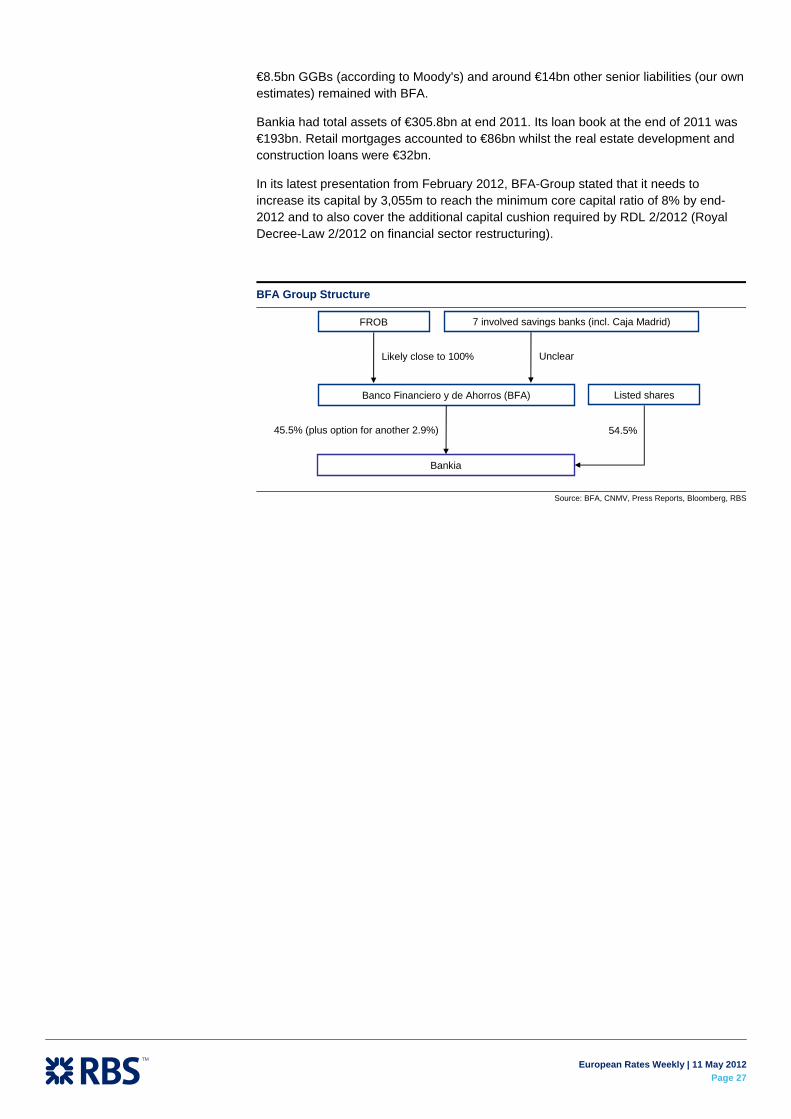
European Rates Weekly | 11 May 2012
Page 27
€8.5bn GGBs (according to Moody's) and around €14bn other senior liabilities (our own estimates) remained with BFA.
Bankia had total assets of €305.8bn at end 2011. Its loan book at the end of 2011 was €193bn. Retail mortgages accounted to €86bn whilst the real estate development and construction loans were €32bn.
In its latest presentation from February 2012, BFA-Group stated that it needs to increase its capital by 3,055m to reach the minimum core capital ratio of 8% by end-2012 and to also cover the additional capital cushion required by RDL 2/2012 (Royal Decree-Law 2/2012 on financial sector restructuring).
BFA Group Structure
Source: BFA, CNMV, Press Reports, Bloomberg, RBS
Banco Financiero y de Ahorros (BFA)
Bankia
45.5% (plus option for another 2.9%)
Listed shares
54.5%
FROB
Likely close to 100%
7 involved savings banks (incl. Caja Madrid)
Unclear
European Rates Weekly | 11 May 2012
Page 28
The Role of FROB
Consolidation of the Savings Bank Sector: The savings bank sector has consolidated from 45 institutions in June 2010 to 11 entities as of March 2012. A number of commercial banks have also been involved in the merger process. Of these, seven mergers received assistance from FROB (see below).
Functions: FROB essentially has three functions:
(1) It takes-over and restructures non-viable entities (e.g. CajaSur),
(2) FROB aids merger processes by subscribing to convertible instruments to aid integration, and
(3) Providing equity capital to recapitalise single name entities needing increased capital (i.e. as a "capital provider" of last resort).1
Capital: FROB was initially furnished with €9bn of capital (€6.75bn from the Spanish government and €2.25bn from the deposit guarantee fund). The Spanish government has pledged a further €6bn in February 2012 but this has not yet been disbursed.
Debt Raising Capacity: FROB can also raise long-term bonds, explicitly, irrevocably and unconditionally guaranteed by the Kingdom of Spain.
FROB Debt Treatment: FROB debt is included on the Spanish government balance sheet by Eurostat, increasing the public debt. As such from a national debt perspective there is no difference on the impact on the debt level of the Kingdom of Spain from injecting capital into FROB (funded by increase Bono issuance) or FROB raising money in the bond market.
Governance: FROB governing committee (of 9 members) is split between the Bank of Spain (4 members), the Finance & Economic Ministries (one each) and the Deposit Guarantee Fund (3 members)
EU approval: FROB must seek EU approval that it is acting within the 'state-aid' rules on a case-by-case basis for all three pillars of its mandate. Initially FROB has an overarching EU-approval scheme for the support of mergers, however this expired at year-end 2010 and now approval must be sought for such support as well.
Existing FROB support Existing FROB support has totalled €13.869bn across all operations. This can be essentially divided according to the different pillars of its mandate:
(a) Injections into the savings bank sector
Under the second pillar of its mandate, FROB has provided capital toward seven merged entities, which have received €9.67bn of capital in the form of convertible preference shares. This accounts for ~70% of all FROB assistance. The afore-mentioned shares have a 7.75% coupon and must be repurchased in a period of 5 to 7 years. This includes the €4.645bn of convertible preference shares provided by FROB for BFA, which will now be converted into common equity. Please see a breakdown of the capital injections below:
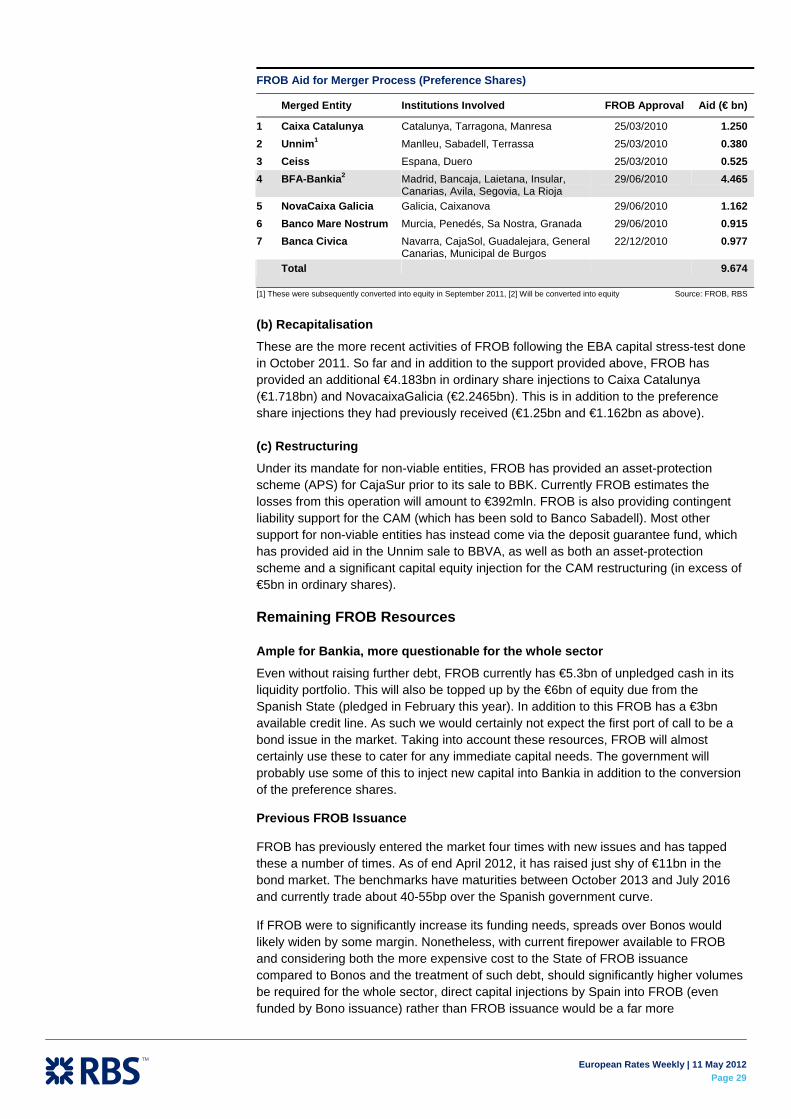
European Rates Weekly | 11 May 2012
Page 29
FROB Aid for Merger Process (Preference Shares)
Merged Entity Institutions Involved FROB Approval Aid (€ bn)
1 Caixa Catalunya Catalunya, Tarragona, Manresa 25/03/2010 1.250 2 Unnim1 Manlleu, Sabadell, Terrassa 25/03/2010 0.380 3 Ceiss Espana, Duero 25/03/2010 0.525 4 BFA-Bankia2 Madrid, Bancaja, Laietana, Insular,
Canarias, Avila, Segovia, La Rioja 29/06/2010 4.465
5 NovaCaixa Galicia Galicia, Caixanova 29/06/2010 1.162 6 Banco Mare Nostrum Murcia, Penedés, Sa Nostra, Granada 29/06/2010 0.915 7 Banca Civica Navarra, CajaSol, Guadalejara, General
Canarias, Municipal de Burgos 22/12/2010 0.977
Total 9.674
[1] These were subsequently converted into equity in September 2011, [2] Will be converted into equity Source: FROB, RBS
(b) Recapitalisation
These are the more recent activities of FROB following the EBA capital stress-test done in October 2011. So far and in addition to the support provided above, FROB has provided an additional €4.183bn in ordinary share injections to Caixa Catalunya (€1.718bn) and NovacaixaGalicia (€2.2465bn). This is in addition to the preference share injections they had previously received (€1.25bn and €1.162bn as above).
(c) Restructuring
Under its mandate for non-viable entities, FROB has provided an asset-protection scheme (APS) for CajaSur prior to its sale to BBK. Currently FROB estimates the losses from this operation will amount to €392mln. FROB is also providing contingent liability support for the CAM (which has been sold to Banco Sabadell). Most other support for non-viable entities has instead come via the deposit guarantee fund, which has provided aid in the Unnim sale to BBVA, as well as both an asset-protection scheme and a significant capital equity injection for the CAM restructuring (in excess of €5bn in ordinary shares).
Remaining FROB Resources
Ample for Bankia, more questionable for the whole sector
Even without raising further debt, FROB currently has €5.3bn of unpledged cash in its liquidity portfolio. This will also be topped up by the €6bn of equity due from the Spanish State (pledged in February this year). In addition to this FROB has a €3bn available credit line. As such we would certainly not expect the first port of call to be a bond issue in the market. Taking into account these resources, FROB will almost certainly use these to cater for any immediate capital needs. The government will probably use some of this to inject new capital into Bankia in addition to the conversion of the preference shares.
Previous FROB Issuance
FROB has previously entered the market four times with new issues and has tapped these a number of times. As of end April 2012, it has raised just shy of €11bn in the bond market. The benchmarks have maturities between October 2013 and July 2016 and currently trade about 40-55bp over the Spanish government curve.
If FROB were to significantly increase its funding needs, spreads over Bonos would likely widen by some margin. Nonetheless, with current firepower available to FROB and considering both the more expensive cost to the State of FROB issuance compared to Bonos and the treatment of such debt, should significantly higher volumes be required for the whole sector, direct capital injections by Spain into FROB (even funded by Bono issuance) rather than FROB issuance would be a far more
European Rates Weekly | 11 May 2012
Page 30
What does this mean for the sovereign? The key takeaways for SPGB investors are:
The €83.3 bn provision total is now not far off our Credit analysts’ calculations of total capital requirement near €100bn but further provisions will be required on the residential mortgage lending book and SMEs in light of the recessionary conditions.
A truly independent valuation of bank risk is important and necessary. It would allow markets to quantify risk rather than deal with Knightian uncertainty (where there is no clear probability risk distribution) on loan losses and remove the distrust of markets on the size of the problem.
There are execution problems. For instance, even if the level of provisions is realistic, it is a different matter as to whether banks can get there. The €84 bn needed over the year when pre-provision income across the sector is c. €43bn is very tough as capital can therefore not be raised via earnings – and where most of the €43 bn earnings anyway are with Santander and BBVA (€34 bn combined). As such, smaller banks will find the task too onerous (lending cannot shrink fast enough to create CT1 ratio increases without cutting financing for SME's which then hurts in other loan books.)
To help banks with these provisioning targets, Spain is proposing to buy Cocos with 5y maturity from the banks. The 10% interest rate is prohibitive and increases the likelihood that banks that need this end up having to convert the cocos to equity.
On the bad bank option, more detail is required. It seems the bad bank will be mandatory and banks will be forced to place problem real estate assets in a "real estate management vehicle". Spain somehow believes this will be funded by private investors with no detail yet on funding for the bad bank.
News of the clean up needs some further detail before a full assessment can be made but our initial read is that the measures do not turn around Spanish problems.
Why? The latest move by Spain results in another migration of private sector risk to the public sector. Importantly, in this context, the total numbers may be getting more realistic but are unlikely to be the final word. Spain does not have many chances left to clear the information vacuum and provide a one-off solution to the bank risk. The lesson from Ireland, where the size of problem continued to be revised higher, is that markets eventually lose patience.
In addition, a large role for the private sector in the solution is inconsistent with historical success stories in clean-up policy. This will simply mean Sovereign bad bank backstops and funding are ultimately necessary - and allied to the provisions needed by smaller banks - we expect that Spain is likely to end up holding stakes in these banks.
Finally, the market and economic backdrop for Spain to execute the clean-up is not benign and is made harder by the existence of the ESM which if needed will subordinate Sovereign debt holders. This threat, which on the deficit risk alone, means that we see no low yield equilibrium.

European Rates Weekly | 11 May 2012
Page 31
UK Strategy – QE complete (for now) With the end of QE confirmed (for now) we look for the 16th May BoE Inflation Report to uncover upward revisions to the 2y/3y forecasts (RBS economists expect 0.1% in both cases), signalling that the MPC has made a small move towards a more neutral bias, but we believe this is fully discounted.
Gilt 10s30s is two standard deviations too steep in our model. For now this remains a bear trade, 78% correlated to outright 10y over a two year history. There can be further steepening yet before any long end bull flattening. The April PPF 7800 index update (which shows £10.6bn deterioration in funding) is also supportive of 10s30s being too steep. . .
. . but 30y Gilts look rich on ASW. We hold our short position and target of 22bp, currently 11bp.
QE over for now….but lower yields stem from Europe
Scheduled QE has come to an end and there is no doubt that the past seven months have been supportive for Gilts. Though this aid is no longer in place, we do not believe there is reason to bring into question Gilts’ safe haven status.
Our long running view of the UK as a safe home for capital has been premised on the government’s commitment to austerity and the fiscal factors remain very much in place. The high domestic ownership of the Gilt market also provides more insulation from any foreign selling.
Over the next few weeks market direction will continue to be dominated by the developments in Europe, with the potential for a new round of Greek elections in June. What remains clear is that the longer the process is drawn out, the greater the scope for the market to price in exit risks. Gilts can continue to benefit from safe haven flows and continue to perform, in our opinion.
May inflation projections to show less of an undershoot than in February
As expected, the MPC left policy settings unchanged in May, maintaining the asset purchase target at £325bn. The decision was taken in light of the forecasts from the May Inflation Report, which will be released on Wednesday 16th May.
The February BoE Inflation Report placed the two and three year forecasts at 1.78% and 1.90% respectively, thus a small undershoot from the 2.00% target. Given the overshoot in inflation in Q1 (3.49%, so 14bp above the central projection in the February Report) in combination with the recent rhetoric from the MPC focusing around price stickiness, we believe the May Inflation Report CPI projection is likely to be raised.
RBS Economists expect a marginal undershoot of CPI at the two-year horizon (at, or fractionally above, 1.90%) with the three-year point at its 2% target. In so far as the central projection in two and three years' time is primarily a near-term policy signalling device (as opposed to a pure, high-conviction forecast) it would represent a small shift by the MPC from a mildly dovish bias towards a neutral position. A higher mean CPI projection would also act as further evidence of a dilution in the dovish policy stance.
We look for the tone of the May BoE Inflation Report to reflect a modest shift in the balance of risks. Whilst rate hike premia can reflect expectations on the far horizon, do not be under the impression that rate hikes are coming anytime soon. We think the bad news is discounted in terms of new CPI forecasts.
Simon Peck
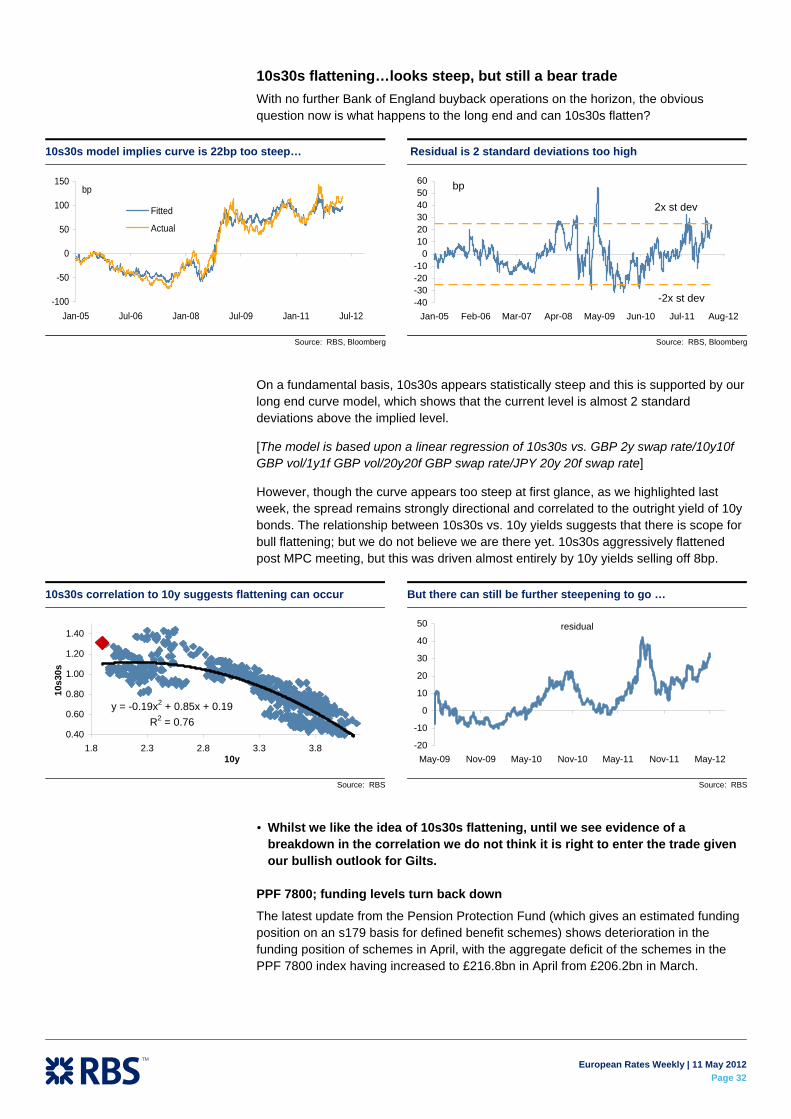
European Rates Weekly | 11 May 2012
Page 32
10s30s flattening…looks steep, but still a bear trade With no further Bank of England buyback operations on the horizon, the obvious question now is what happens to the long end and can 10s30s flatten?
On a fundamental basis, 10s30s appears statistically steep and this is supported by our long end curve model, which shows that the current level is almost 2 standard deviations above the implied level.
[The model is based upon a linear regression of 10s30s vs. GBP 2y swap rate/10y10f GBP vol/1y1f GBP vol/20y20f GBP swap rate/JPY 20y 20f swap rate]
However, though the curve appears too steep at first glance, as we highlighted last week, the spread remains strongly directional and correlated to the outright yield of 10y bonds. The relationship between 10s30s vs. 10y yields suggests that there is scope for bull flattening; but we do not believe we are there yet. 10s30s aggressively flattened post MPC meeting, but this was driven almost entirely by 10y yields selling off 8bp.
Whilst we like the idea of 10s30s flattening, until we see evidence of a breakdown in the correlation we do not think it is right to enter the trade given our bullish outlook for Gilts.
PPF 7800; funding levels turn back down
The latest update from the Pension Protection Fund (which gives an estimated funding position on an s179 basis for defined benefit schemes) shows deterioration in the funding position of schemes in April, with the aggregate deficit of the schemes in the PPF 7800 index having increased to £216.8bn in April from £206.2bn in March.
10s30s model implies curve is 22bp too steep…
-100
-50
0
50
100
150
Jan-05 Jul-06 Jan-08 Jul-09 Jan-11 Jul-12
Fitted
Actual
bp
Source: RBS, Bloomberg
Residual is 2 standard deviations too high
-40-30-20-10
0102030405060
Jan-05 Feb-06 Mar-07 Apr-08 May-09 Jun-10 Jul-11 Aug-12
bp
2x st dev
-2x st dev
Source: RBS, Bloomberg
10s30s correlation to 10y suggests flattening can occur
y = -0.19x2 + 0.85x + 0.19R2 = 0.76
0.40
0.60
0.80
1.00
1.20
1.40
1.8 2.3 2.8 3.3 3.810y
10s3
0s
Source: RBS
But there can still be further steepening to go …
residual
-20
-10
0
10
20
30
40
50
May-09 Nov-09 May-10 Nov-10 May-11 Nov-11 May-12
Source: RBS
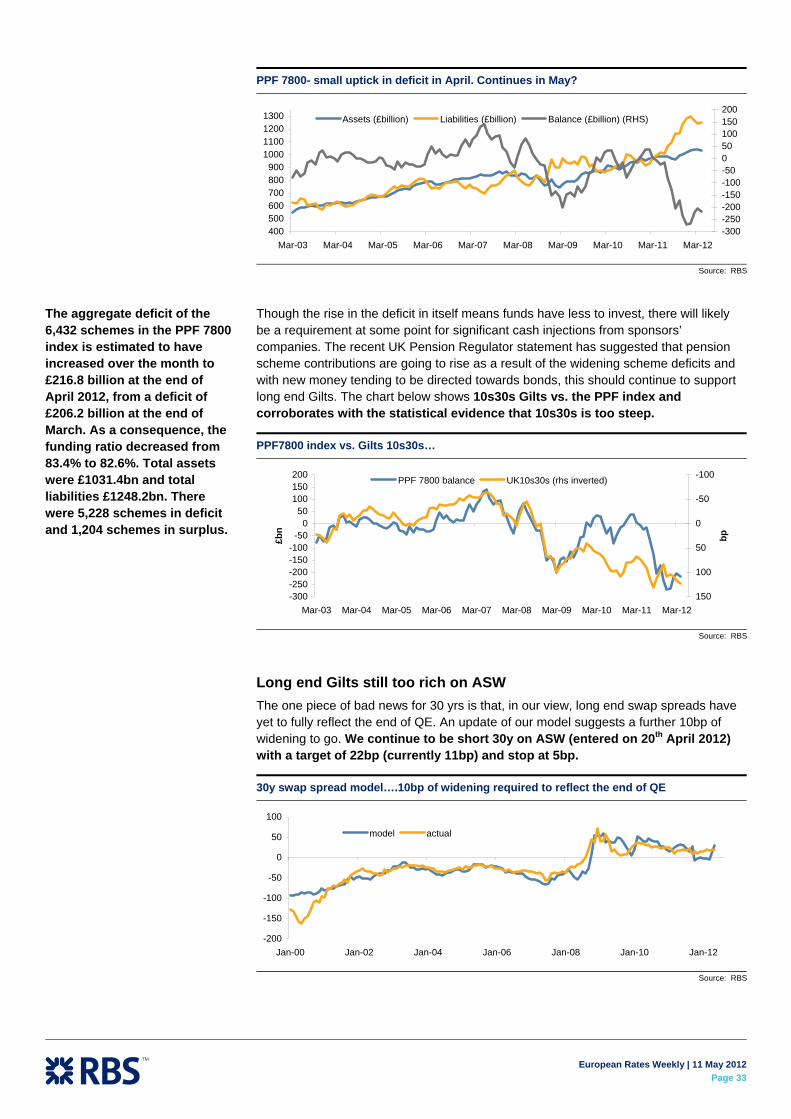
European Rates Weekly | 11 May 2012
Page 33
PPF 7800- small uptick in deficit in April. Continues in May?
400500600700800900
1000110012001300
Mar-03 Mar-04 Mar-05 Mar-06 Mar-07 Mar-08 Mar-09 Mar-10 Mar-11 Mar-12-300-250-200-150-100-50050100150200
Assets (£billion) Liabilities (£billion) Balance (£billion) (RHS)
Source: RBS
Though the rise in the deficit in itself means funds have less to invest, there will likely be a requirement at some point for significant cash injections from sponsors’ companies. The recent UK Pension Regulator statement has suggested that pension scheme contributions are going to rise as a result of the widening scheme deficits and with new money tending to be directed towards bonds, this should continue to support long end Gilts. The chart below shows 10s30s Gilts vs. the PPF index and corroborates with the statistical evidence that 10s30s is too steep.
PPF7800 index vs. Gilts 10s30s…
-300-250-200-150-100-50
050
100150200
Mar-03 Mar-04 Mar-05 Mar-06 Mar-07 Mar-08 Mar-09 Mar-10 Mar-11 Mar-12
£bn
-100
-50
0
50
100
150
bp
PPF 7800 balance UK10s30s (rhs inverted)
Source: RBS
Long end Gilts still too rich on ASW The one piece of bad news for 30 yrs is that, in our view, long end swap spreads have yet to fully reflect the end of QE. An update of our model suggests a further 10bp of widening to go. We continue to be short 30y on ASW (entered on 20th April 2012) with a target of 22bp (currently 11bp) and stop at 5bp.
30y swap spread model….10bp of widening required to reflect the end of QE
-200
-150
-100
-50
0
50
100
Jan-00 Jan-02 Jan-04 Jan-06 Jan-08 Jan-10 Jan-12
model actual
Source: RBS
The aggregate deficit of the 6,432 schemes in the PPF 7800 index is estimated to have increased over the month to £216.8 billion at the end of April 2012, from a deficit of £206.2 billion at the end of March. As a consequence, the funding ratio decreased from 83.4% to 82.6%. Total assets were £1031.4bn and total liabilities £1248.2bn. There were 5,228 schemes in deficit and 1,204 schemes in surplus.
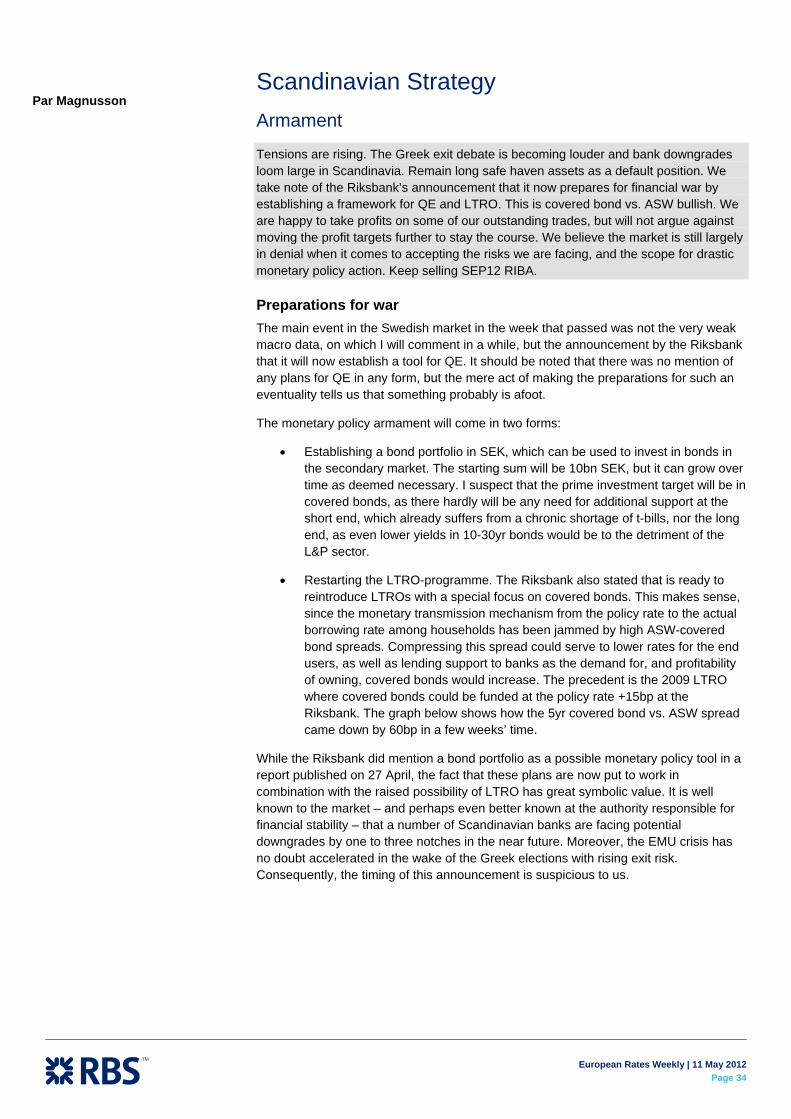
European Rates Weekly | 11 May 2012
Page 34
Scandinavian Strategy Armament
Tensions are rising. The Greek exit debate is becoming louder and bank downgrades loom large in Scandinavia. Remain long safe haven assets as a default position. We take note of the Riksbank’s announcement that it now prepares for financial war by establishing a framework for QE and LTRO. This is covered bond vs. ASW bullish. We are happy to take profits on some of our outstanding trades, but will not argue against moving the profit targets further to stay the course. We believe the market is still largely in denial when it comes to accepting the risks we are facing, and the scope for drastic monetary policy action. Keep selling SEP12 RIBA.
Preparations for war The main event in the Swedish market in the week that passed was not the very weak macro data, on which I will comment in a while, but the announcement by the Riksbank that it will now establish a tool for QE. It should be noted that there was no mention of any plans for QE in any form, but the mere act of making the preparations for such an eventuality tells us that something probably is afoot.
The monetary policy armament will come in two forms:
• Establishing a bond portfolio in SEK, which can be used to invest in bonds in the secondary market. The starting sum will be 10bn SEK, but it can grow over time as deemed necessary. I suspect that the prime investment target will be in covered bonds, as there hardly will be any need for additional support at the short end, which already suffers from a chronic shortage of t-bills, nor the long end, as even lower yields in 10-30yr bonds would be to the detriment of the L&P sector.
• Restarting the LTRO-programme. The Riksbank also stated that is ready to reintroduce LTROs with a special focus on covered bonds. This makes sense, since the monetary transmission mechanism from the policy rate to the actual borrowing rate among households has been jammed by high ASW-covered bond spreads. Compressing this spread could serve to lower rates for the end users, as well as lending support to banks as the demand for, and profitability of owning, covered bonds would increase. The precedent is the 2009 LTRO where covered bonds could be funded at the policy rate +15bp at the Riksbank. The graph below shows how the 5yr covered bond vs. ASW spread came down by 60bp in a few weeks’ time.
While the Riksbank did mention a bond portfolio as a possible monetary policy tool in a report published on 27 April, the fact that these plans are now put to work in combination with the raised possibility of LTRO has great symbolic value. It is well known to the market – and perhaps even better known at the authority responsible for financial stability – that a number of Scandinavian banks are facing potential downgrades by one to three notches in the near future. Moreover, the EMU crisis has no doubt accelerated in the wake of the Greek elections with rising exit risk. Consequently, the timing of this announcement is suspicious to us.
Par Magnusson
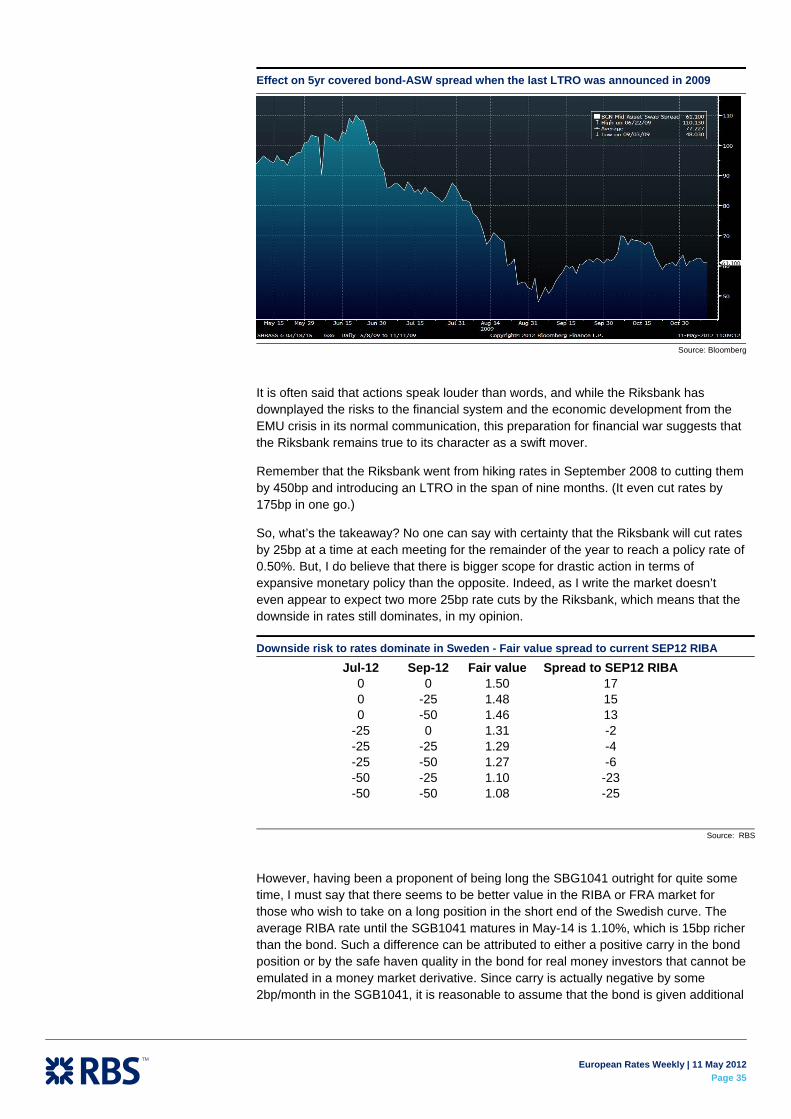
European Rates Weekly | 11 May 2012
Page 35
Effect on 5yr covered bond-ASW spread when the last LTRO was announced in 2009
Source: Bloomberg
It is often said that actions speak louder than words, and while the Riksbank has downplayed the risks to the financial system and the economic development from the EMU crisis in its normal communication, this preparation for financial war suggests that the Riksbank remains true to its character as a swift mover.
Remember that the Riksbank went from hiking rates in September 2008 to cutting them by 450bp and introducing an LTRO in the span of nine months. (It even cut rates by 175bp in one go.)
So, what’s the takeaway? No one can say with certainty that the Riksbank will cut rates by 25bp at a time at each meeting for the remainder of the year to reach a policy rate of 0.50%. But, I do believe that there is bigger scope for drastic action in terms of expansive monetary policy than the opposite. Indeed, as I write the market doesn’t even appear to expect two more 25bp rate cuts by the Riksbank, which means that the downside in rates still dominates, in my opinion.
Downside risk to rates dominate in Sweden - Fair value spread to current SEP12 RIBA
Jul-12 Sep-12 Fair value Spread to SEP12 RIBA0 0 1.50 170 -25 1.48 150 -50 1.46 13
-25 0 1.31 -2-25 -25 1.29 -4-25 -50 1.27 -6-50 -25 1.10 -23-50 -50 1.08 -25
Source: RBS
However, having been a proponent of being long the SBG1041 outright for quite some time, I must say that there seems to be better value in the RIBA or FRA market for those who wish to take on a long position in the short end of the Swedish curve. The average RIBA rate until the SGB1041 matures in May-14 is 1.10%, which is 15bp richer than the bond. Such a difference can be attributed to either a positive carry in the bond position or by the safe haven quality in the bond for real money investors that cannot be emulated in a money market derivative. Since carry is actually negative by some 2bp/month in the SGB1041, it is reasonable to assume that the bond is given additional

European Rates Weekly | 11 May 2012
Page 36
intrinsic value by virtue of being a place to park your money in a risk-averse world, and for being a potential target for Riksbank bond purchases.
As argued above I don’t think the Riksbank would be a heavy buyer in government bonds once it activates its bond portfolio, so we are left with the SGB1041 being particularly rich due to its “store-of-value” characteristic. A more daring trade could be to short the SGB1041 and sell the SEP12 RIBA, which would give you positive carry, while hedging the delta exposure.
Great expectations is the mother of great disappointment Regular readers of the Scandinavian research will know that I have been very sceptical of the industrial confidence data in Sweden. The confidence indictor in March jumped, but it was solely due to increased expectations, while current conditions remained in the doldrums. I had a hard time believing that there was a bright future for a “high-beta” industrial economy as the Swedish one, when the world was moving close to the brink risk-wise.I also thought that any optimism would soon be turned into disappointment, especially since I suspect the positive expectations was a case of misguided optimism on the back of LTRO effects.
Now we have the result. Or, at least, two months’ worth of results. Industrial production fell in both February and March. I know that February’s weak numbers were attributed to the fuzzy accounting in the pharma sector, and there was certainly something to that. But we ascertained from the March numbers that the industrial production ex pharma fell by 1.6% mom, and that March was the second consecutive month of negative growth in industrial production.
Since the Riksbank held up the improvement in the industrial sector as an important pretext for not cutting the rate at its last meeting, I think it’s fairly safe to say that it no longer can make that argument. Add to that the continued low inflation and it’s clear that the road for new rate cuts is paved.
Sweden is in an industrial recession – the road to rate cuts is paved
Industrial production ex chemicals and pharma [ma 12] Sweden, Industrial production, Total excl energy [ma 12, c.o.p 1 month]
01 02 03 04 05 06 07 08 09 10 11 12
-2.5
-2.0
-1.5
-1.0
-0.5
0.0
0.5
1.0
1.5
Source: Ecowin
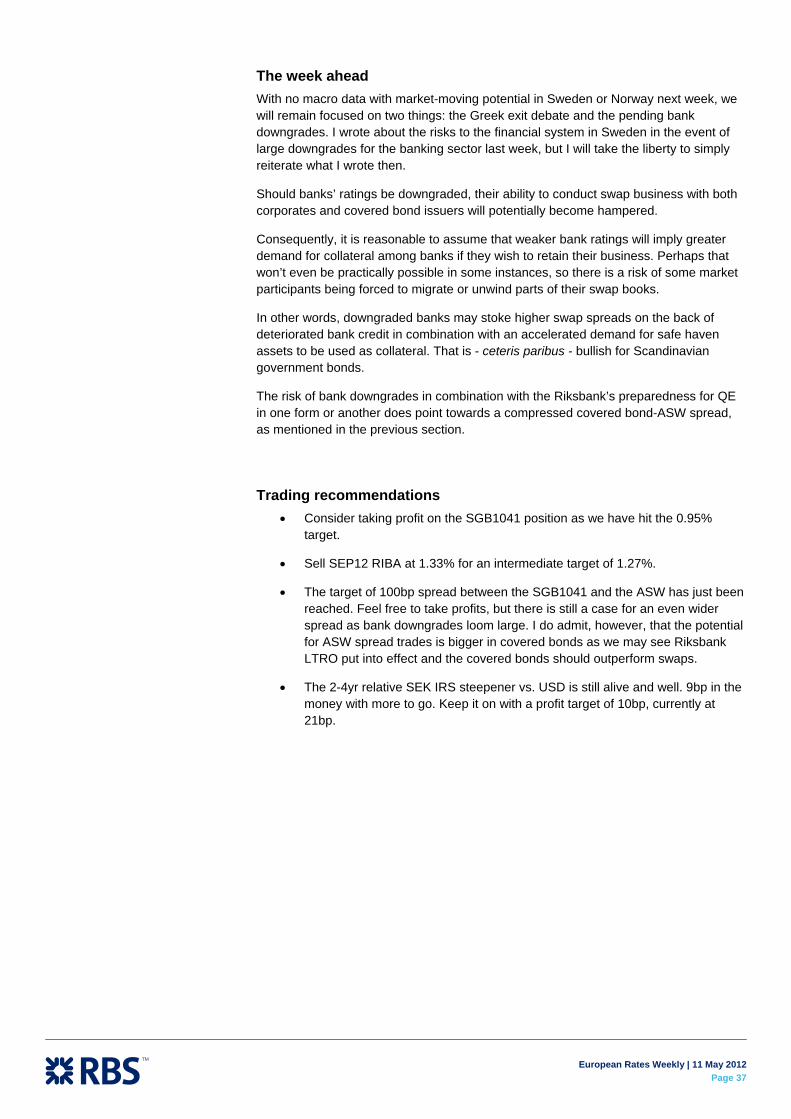
European Rates Weekly | 11 May 2012
Page 37
The week ahead With no macro data with market-moving potential in Sweden or Norway next week, we will remain focused on two things: the Greek exit debate and the pending bank downgrades. I wrote about the risks to the financial system in Sweden in the event of large downgrades for the banking sector last week, but I will take the liberty to simply reiterate what I wrote then.
Should banks’ ratings be downgraded, their ability to conduct swap business with both corporates and covered bond issuers will potentially become hampered.
Consequently, it is reasonable to assume that weaker bank ratings will imply greater demand for collateral among banks if they wish to retain their business. Perhaps that won’t even be practically possible in some instances, so there is a risk of some market participants being forced to migrate or unwind parts of their swap books.
In other words, downgraded banks may stoke higher swap spreads on the back of deteriorated bank credit in combination with an accelerated demand for safe haven assets to be used as collateral. That is - ceteris paribus - bullish for Scandinavian government bonds.
The risk of bank downgrades in combination with the Riksbank’s preparedness for QE in one form or another does point towards a compressed covered bond-ASW spread, as mentioned in the previous section.
Trading recommendations • Consider taking profit on the SGB1041 position as we have hit the 0.95%
target.
• Sell SEP12 RIBA at 1.33% for an intermediate target of 1.27%.
• The target of 100bp spread between the SGB1041 and the ASW has just been reached. Feel free to take profits, but there is still a case for an even wider spread as bank downgrades loom large. I do admit, however, that the potential for ASW spread trades is bigger in covered bonds as we may see Riksbank LTRO put into effect and the covered bonds should outperform swaps.
• The 2-4yr relative SEK IRS steepener vs. USD is still alive and well. 9bp in the money with more to go. Keep it on with a profit target of 10bp, currently at 21bp.

European Rates Weekly | 11 May 2012
Page 38
Inflation Linked Strategy Euro Area
French supply The AFT has announced that the supply for Thursday will be €800m-€1.2bn of OATei22s, OATi23s, and OATei27s. This is smaller size than usual, perhaps reflecting market conditions that might reasonably be viewed as moderately adverse. The choice of bonds, on the other hand, is relatively long. This seems sensible – sub 10y paper has been distinctly unloved recently. There was little market reaction to the announcement and I would not expect it to pose difficulty unless conditions deteriorate substantially.
Trade ideas: The recommendation to receive 5y5y breakeven in bonds against swaps has been stopped out. I reinstate it at current levels (75bp – Buy OATei20s vs OATei15s in equal cash amounts on b/e, against pay 10y swaps, receive 5y swaps in equal notionals with whole package duration neutral), looking for 35bp profit, with a stop at -15bp.
The remainder of this article is adapted from Linked-Up, published on May 10.
Forecasts and the front end Although energy price quotes are clearly lower over the week, the low sensitivity of European inflation to these means that we have not adjusted our inflation forecasts terribly much – we still see year end inflation at nearly 2.2%. From this we should probably remove the Italian hike, however, which would take this down to around 2%. There are still possible VAT hikes in Spain and the Netherlands, however, so there is a higher degree of uncertainty around this projection than usual.
Against this, OBL€I’s have been continuing to perform very well, and other short linkers have also been relatively well supported. The outperformance of OBLei13s, however now looks a spent trade.
Short-dated breakevens resilient, OBLei’s bulletproof
-200
-150
-100
-50
0
50
100
150
Jan-07 Jul-07 Jan-08 Jul-08 Jan-09 Jul-09 Jan-10 Jul-10 Jan-11 Jul-11 Jan-12OBLei13 OATi13 OATei15 DBRei16
Source: RBS
Giles Gale
HICPx Forecasts (RINF1 <GO> on Bloomberg) NSA m/m
Apr 115.57 0.47 May 115.51 -0.05 Jun 115.54 0.03 Jul 114.71 -0.72 Aug 114.95 0.21 Sep 115.7 0.65 Oct 115.99 0.25 Nov 115.99 0.00 Dec 116.39 0.34
Source: RBS

European Rates Weekly | 11 May 2012
Page 39
Japanification or inflationary muddle through? This is a theme that can be played in many ways, which is just as well, because there are lots of people whose base case (and, for many of those, ‘best case’) for Europe is a form of muddle through in which politicians get away with doing the minimum at the last moment rather than committing to grand plans. In this scenario, it is generally held, growth will be sclerotic, demand weak, and inflation pressures very, very low.
I have sympathy with some parts of this view. But I do not share the conclusions on inflation. I also think that the risks around it make it dangerous to play for.
It remains a point of some debate, I think, exactly why Japan has suffered such protracted deflation. For me the most persuasive reasoning simply that asset price falls and a very strong yen, which failed to correct fully until late last decade, combined to create weak demand and a struggle for efficiencies which were mutually reinforcing. I also believe that government activity crowded out consumption, and the price of government consumption may have been rising in compensation for consumer prices. Lastly, particularly over the last decade, I think that the global disinflationary forces of cheaper overseas production added to the problem.
There are parallels, but there are important differences. Asset price falls in Europe are localised and mild compared to those suffered by Japan. Parts of Europe need to work to improve efficiency, but it is not the case at the Euro Area level. The Euro is not overvalued, and indeed arguably threatens to become undervalued.
Other problems said to be associated with Japanese deflation I take issue with. Aging, in particular should be disinflation only while it bolsters the ranks of the productive, but lots of retired should be inflationary because it raises the consumption pressure per unit of productivity. Clearly moves to keep people in work, then, could be disinflationary, but I think that this just slows the process rather than puts it into reverse. Government austerity may be disinflationary in the short term (once indirect tax rises have been exhausted), but with reference to the above may not be over the long-haul. Perhaps most importantly also think that the disinflationary force of cheap foreign goods is likely to slow.
Turning to the standard analysis, I also reject the idea that the output gap will drag substantially on inflation. The charts below show standard estimates from the IMF and the OECD suggest that there is an enormous amount of slack to be taken up before inflation pressures should bite. But how to explain, then, that unit labour costs are rising in the Euro Area as a whole nearly as quickly as in Germany? Clearly the productivity story doesn’t support the notion that there is spare capacity to be used up. On the contrary, it suggests that rising unemployment may have legs. Secondly, the right hand chart strongly suggests that the output gap is mainly in the periphery. No surprises perhaps, but I would argue that spare capacity there may well in fact not be located in industries with a viable future. Construction springs to mind. The Bank of England appears to be coming round to the idea that spare capacity after a period of years either goes stale or is revealed to be obsolete capacity.

European Rates Weekly | 11 May 2012
Page 40
Spare capacity … …or obsolete capacity? Industrial capacity utilisation
-6
-5
-4
-3
-2
-1
0
1
2
3
Apr-01 Jan-04 Oct-06 Jul-09 Apr-12 Dec-140
10
20
30
40
50
60
70
80
90
Output gap (IMF) Output gap (OECD) EMU Capacity util'n
60
65
70
75
80
85
90
95
Jun-02 Jun-04 Jun-06 Jun-08 Jun-10EMU Capacity util'n Germany FranceItaly Spain
Source: OECB, IMF, RBS Source: EU, RBS
This in turn suggests to me that the Euro Area might in fact face more price stickiness and a higher bar for core inflation. I also expect that this should mean that lax monetary policy is more effective and that the Euro Area’s response to inflationary shocks (and, whether oil or a secular trend to higher import costs resulting from abroad will be greater pass-through to HICP.
But perhaps that’s a good thing. The Euro Area needs higher inflation. A rebalancing in price levels cannot be drawn out in an environment of real social pain for the best part of a decade. Inflation, not alarming inflation, but inflation above 2% will help. German hair shirt wearing insistence to the contrary is unhelpful. But fortunately it is unlikely to get its way. I don’t believe that Germany has the upper hand in the debate regarding the appropriate policy mix and I don’t think that the ECB, inflation fighter or no, will prize low inflation over financial stability and Euro Area cohesion. Besides Germany had ECB forbearance when it was disinflating in 2003-5 (at a time when to do was relatively easy because the global economy was entering and the riding a robust upswing) – inflation was stuck stubbornly above 2% for almost all of 2000-2006, including for nearly all of the period of 2% rates. Indeed Germany was also naughty with its public finances at the time. Naturally I don’t expect them to remember things this way, but it shows that it may be forced to tolerate higher inflation than it would like as the ECB sets rates according to Southern needs. Finally I think that the experience of H1 2011 when the ECB hiked rates is significant. I therefore think that it is entirely reasonable to assume that the ECB will accommodate price shocks and use an output-gap methodology to justify it.
My conclusion, then, is that Euro Area stagnation is possible, even likely. But I don’t think that Japanification is likely to extend to chronic low inflation or deflation.
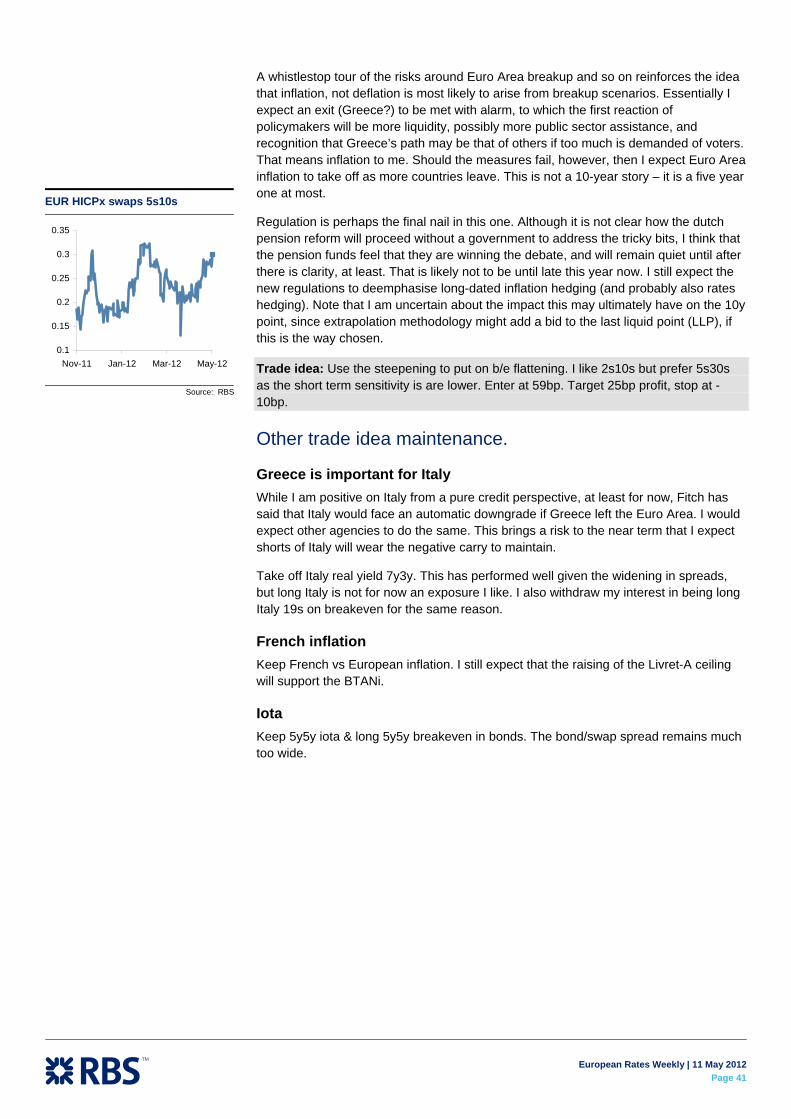
European Rates Weekly | 11 May 2012
Page 41
A whistlestop tour of the risks around Euro Area breakup and so on reinforces the idea that inflation, not deflation is most likely to arise from breakup scenarios. Essentially I expect an exit (Greece?) to be met with alarm, to which the first reaction of policymakers will be more liquidity, possibly more public sector assistance, and recognition that Greece’s path may be that of others if too much is demanded of voters. That means inflation to me. Should the measures fail, however, then I expect Euro Area inflation to take off as more countries leave. This is not a 10-year story – it is a five year one at most.
Regulation is perhaps the final nail in this one. Although it is not clear how the dutch pension reform will proceed without a government to address the tricky bits, I think that the pension funds feel that they are winning the debate, and will remain quiet until after there is clarity, at least. That is likely not to be until late this year now. I still expect the new regulations to deemphasise long-dated inflation hedging (and probably also rates hedging). Note that I am uncertain about the impact this may ultimately have on the 10y point, since extrapolation methodology might add a bid to the last liquid point (LLP), if this is the way chosen.
Trade idea: Use the steepening to put on b/e flattening. I like 2s10s but prefer 5s30s as the short term sensitivity is are lower. Enter at 59bp. Target 25bp profit, stop at -10bp.
Other trade idea maintenance.
Greece is important for Italy While I am positive on Italy from a pure credit perspective, at least for now, Fitch has said that Italy would face an automatic downgrade if Greece left the Euro Area. I would expect other agencies to do the same. This brings a risk to the near term that I expect shorts of Italy will wear the negative carry to maintain.
Take off Italy real yield 7y3y. This has performed well given the widening in spreads, but long Italy is not for now an exposure I like. I also withdraw my interest in being long Italy 19s on breakeven for the same reason.
French inflation Keep French vs European inflation. I still expect that the raising of the Livret-A ceiling will support the BTANi.
Iota Keep 5y5y iota & long 5y5y breakeven in bonds. The bond/swap spread remains much too wide.
EUR HICPx swaps 5s10s
0.1
0.15
0.2
0.25
0.3
0.35
Nov-11 Jan-12 Mar-12 May-12
Source: RBS
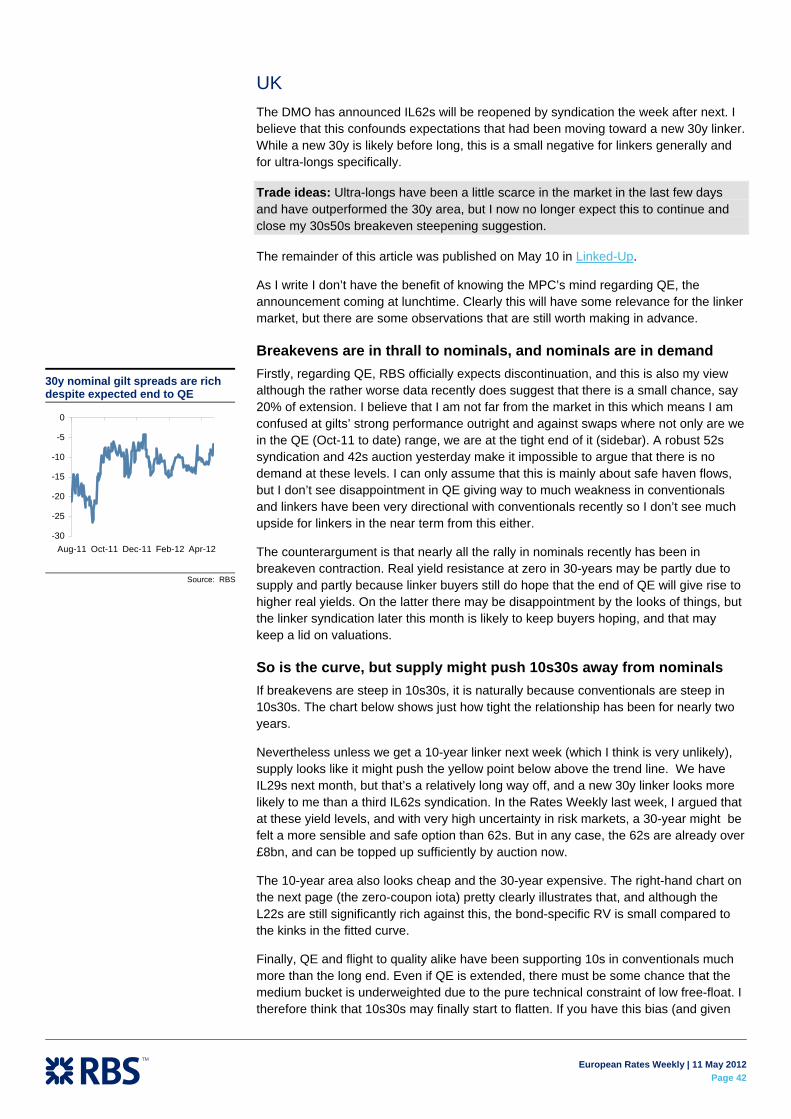
European Rates Weekly | 11 May 2012
Page 42
UK The DMO has announced IL62s will be reopened by syndication the week after next. I believe that this confounds expectations that had been moving toward a new 30y linker. While a new 30y is likely before long, this is a small negative for linkers generally and for ultra-longs specifically.
Trade ideas: Ultra-longs have been a little scarce in the market in the last few days and have outperformed the 30y area, but I now no longer expect this to continue and close my 30s50s breakeven steepening suggestion.
The remainder of this article was published on May 10 in Linked-Up.
As I write I don’t have the benefit of knowing the MPC’s mind regarding QE, the announcement coming at lunchtime. Clearly this will have some relevance for the linker market, but there are some observations that are still worth making in advance.
Breakevens are in thrall to nominals, and nominals are in demand Firstly, regarding QE, RBS officially expects discontinuation, and this is also my view although the rather worse data recently does suggest that there is a small chance, say 20% of extension. I believe that I am not far from the market in this which means I am confused at gilts’ strong performance outright and against swaps where not only are we in the QE (Oct-11 to date) range, we are at the tight end of it (sidebar). A robust 52s syndication and 42s auction yesterday make it impossible to argue that there is no demand at these levels. I can only assume that this is mainly about safe haven flows, but I don’t see disappointment in QE giving way to much weakness in conventionals and linkers have been very directional with conventionals recently so I don’t see much upside for linkers in the near term from this either.
The counterargument is that nearly all the rally in nominals recently has been in breakeven contraction. Real yield resistance at zero in 30-years may be partly due to supply and partly because linker buyers still do hope that the end of QE will give rise to higher real yields. On the latter there may be disappointment by the looks of things, but the linker syndication later this month is likely to keep buyers hoping, and that may keep a lid on valuations.
So is the curve, but supply might push 10s30s away from nominals If breakevens are steep in 10s30s, it is naturally because conventionals are steep in 10s30s. The chart below shows just how tight the relationship has been for nearly two years.
Nevertheless unless we get a 10-year linker next week (which I think is very unlikely), supply looks like it might push the yellow point below above the trend line. We have IL29s next month, but that’s a relatively long way off, and a new 30y linker looks more likely to me than a third IL62s syndication. In the Rates Weekly last week, I argued that at these yield levels, and with very high uncertainty in risk markets, a 30-year might be felt a more sensible and safe option than 62s. But in any case, the 62s are already over £8bn, and can be topped up sufficiently by auction now.
The 10-year area also looks cheap and the 30-year expensive. The right-hand chart on the next page (the zero-coupon iota) pretty clearly illustrates that, and although the L22s are still significantly rich against this, the bond-specific RV is small compared to the kinks in the fitted curve.
Finally, QE and flight to quality alike have been supporting 10s in conventionals much more than the long end. Even if QE is extended, there must be some chance that the medium bucket is underweighted due to the pure technical constraint of low free-float. I therefore think that 10s30s may finally start to flatten. If you have this bias (and given
30y nominal gilt spreads are rich despite expected end to QE
-30
-25
-20
-15
-10
-5
0
Aug-11 Oct-11 Dec-11 Feb-12 Apr-12
Source: RBS
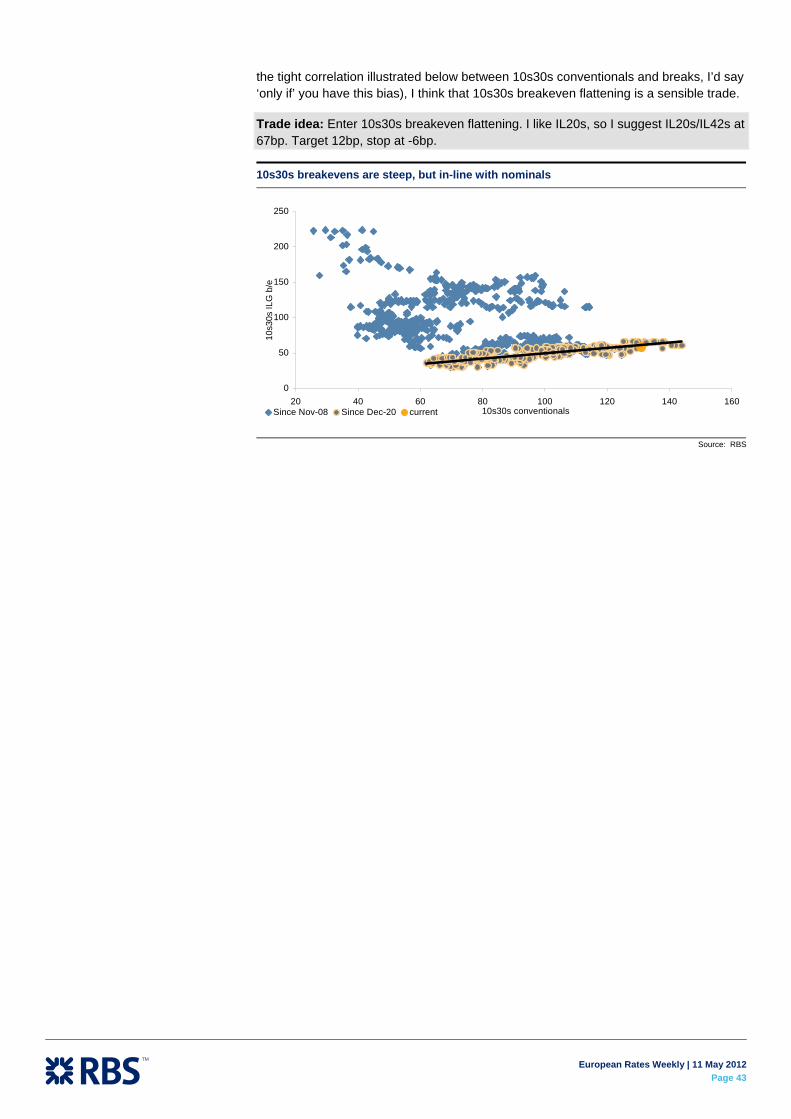
European Rates Weekly | 11 May 2012
Page 43
the tight correlation illustrated below between 10s30s conventionals and breaks, I’d say ‘only if’ you have this bias), I think that 10s30s breakeven flattening is a sensible trade.
Trade idea: Enter 10s30s breakeven flattening. I like IL20s, so I suggest IL20s/IL42s at 67bp. Target 12bp, stop at -6bp.
10s30s breakevens are steep, but in-line with nominals
0
50
100
150
200
250
20 40 60 80 100 120 140 16010s30s conventionals
10s3
0s IL
G b
/e
Since Nov-08 Since Dec-20 current
Source: RBS

European Rates Weekly | 11 May 2012
Page 44
Volatility Strategy Market update Volatility has been exceptionally well bid this week. Short expiries, which had become relatively cheap, have jumped very sharply, but bids have extended all the way down the expiries. The 30y column has been better bid than the 10y, reflecting the volatility in the long end that has revived some CVA receiving concerns. Interest in pinning short-dated rates in 1x3x2 receivers has also been ongoing. Long forward rates are now so low that selling long-dated OTM receivers break even at very low rates indeed and I imagine some yield enhancers may take note.
A week in European politics A week is a long time in politics, and a very long time in European politics. The brief conclusions for me at this stage are:
The new French government promises to meet its short-term promises on deficit reduction but its wider policy agenda will make ongoing deficit adjustment harder.
There is growing recognition of – and tolerance for – Spain’s efforts to reduce its public deficit and manage its banks back to health.
Germany is increasingly isolated in setting the European policy agenda. This is politically as dangerous for the Euro Area as discontent in the periphery. The reaction against suggestions that the Bundesbank might ‘tolerate’ higher inflation in Germany for the good of the Euro Area. (I noticed the emphasis on the Bundesbank rather than the ECB in local commentary.) In practice, this is a relatively innocuous suggestion and the ECB should be able to deliver on it without the Germans noticing too much, but the furore is indicative of deeper misgivings.
Greece is likely to leave the Euro Area. See here for much more on this from my colleagues in Rates Strategy. New elections are likely in the near term and it will be clearer than ever that it is a referendum on Euro membership. While polls suggest that Greeks want to stay in the Euro Area, it also makes clear that it doesn’t want the austerity. This matters more, judging by early polls on voting intentions, for a hypothetical second general election that show the Radical Left polling more strongly at the expense of all other parties. The most feasible scenario in which Greece does not leave, in my opinion, is where a government misses its targets and runs out of money, leading to IOUs to be introduced, which scare the public into submission on the austerity roadmap. Nevertheless, I think this is grasping at straws and would give the markets a rough ride in the meantime.
Greece’s bargaining position with the Euro Area is strong in principle: other European countries would lose very substantial claims on it and contagion could be very damaging. But pride and populism are more likely to drive the agenda. It is unlikely that Greece’s choices will look better in the future than they do now, in my opinion.
Clearly the scope for instability over the coming months looks very high and I would expect that disaster protection will keep volatility relatively well supported. The main problem here is that it is not entirely clear what strategies work in EUR options as disaster protection other than just buying volatility: in the worst events, I am not even sure whether the curve would steepen or flatten, for example.
What is the matter with asset swaps? Given the flight to quality, asset swaps have perhaps been surprisingly soft. In the same week that gilts have had the support of QE removed, 10y gilts are near their
Giles Gale

European Rates Weekly | 11 May 2012
Page 45
tightest against swaps in recent history compared to bunds (chart below). Of course there may come a time when we wonder about German credit quality, but that time is not now, and I would have expected the flight to quality to push bunds from the range that has really been established since late March.
German asset swaps have not behaved like flight-to-quality should
0
10
20
30
40
50
60
70
80
90
Nov-10 Feb-11 May-11 Aug-11 Nov-11 Feb-12 May-12UK 10y asw Germany 10y asw
Source: RBS
Options on September contracts suggest a give-up of 6bp to enter bullish wideners. This looks reasonable to me. But on the other hand, while the implied tightening in a sell-off is aggressive compared to recent history, it is worth wondering if the failure to push wider now is indicative of a belief in liquidity that may cheapen asset swaps further on the way back up in yield. Shatz vol in puts looks cheap as top-left has been bid in swaptions.
Zero cost entry levels for September (24-Aug expiry) contracts and historic yield/asw levels for CTDs
-100 bp
-90 bp
-80 bp
-70 bp
-60 bp
-50 bp
-40 bp
-30 bp
0.0% 0.2% 0.4% 0.6% 0.8% 1.0% 1.2% 1.4% 1.6% 1.8% 2.0%
Spr
ead
Bund Hist Bobl Hist Schatz Bobl Bund
ATM
ATM
ATM
Source: RBS
ATM vol multi-map: Euro Area Gamma appears relatively cheap on a two-year PCA basis. The middle of the surface in longer expiries has been supported and looks expensive historically.
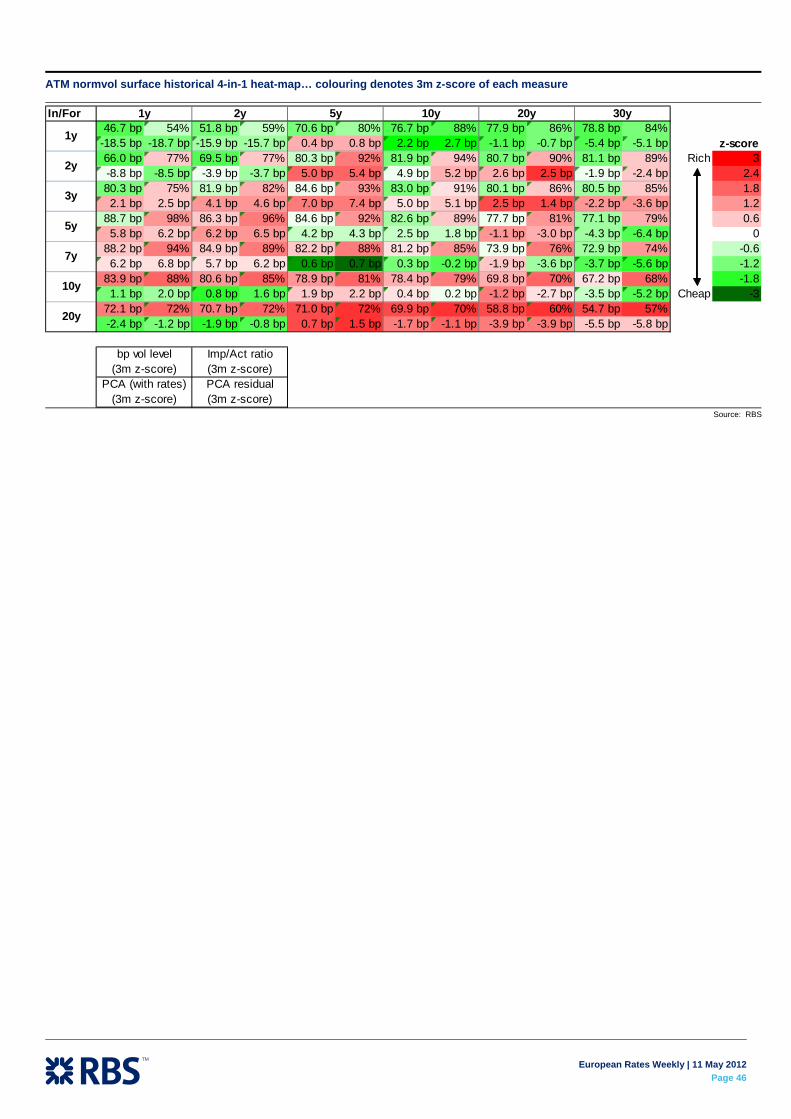
European Rates Weekly | 11 May 2012
Page 46
ATM normvol surface historical 4-in-1 heat-map… colouring denotes 3m z-score of each measure
In/For 1y 2y 5y 10y 20y 30y46.7 bp 54% 51.8 bp 59% 70.6 bp 80% 76.7 bp 88% 77.9 bp 86% 78.8 bp 84%
-18.5 bp -18.7 bp -15.9 bp -15.7 bp 0.4 bp 0.8 bp 2.2 bp 2.7 bp -1.1 bp -0.7 bp -5.4 bp -5.1 bp z-score66.0 bp 77% 69.5 bp 77% 80.3 bp 92% 81.9 bp 94% 80.7 bp 90% 81.1 bp 89% Rich 3-8.8 bp -8.5 bp -3.9 bp -3.7 bp 5.0 bp 5.4 bp 4.9 bp 5.2 bp 2.6 bp 2.5 bp -1.9 bp -2.4 bp 2.480.3 bp 75% 81.9 bp 82% 84.6 bp 93% 83.0 bp 91% 80.1 bp 86% 80.5 bp 85% 1.82.1 bp 2.5 bp 4.1 bp 4.6 bp 7.0 bp 7.4 bp 5.0 bp 5.1 bp 2.5 bp 1.4 bp -2.2 bp -3.6 bp 1.2
88.7 bp 98% 86.3 bp 96% 84.6 bp 92% 82.6 bp 89% 77.7 bp 81% 77.1 bp 79% 0.65.8 bp 6.2 bp 6.2 bp 6.5 bp 4.2 bp 4.3 bp 2.5 bp 1.8 bp -1.1 bp -3.0 bp -4.3 bp -6.4 bp 0
88.2 bp 94% 84.9 bp 89% 82.2 bp 88% 81.2 bp 85% 73.9 bp 76% 72.9 bp 74% -0.66.2 bp 6.8 bp 5.7 bp 6.2 bp 0.6 bp 0.7 bp 0.3 bp -0.2 bp -1.9 bp -3.6 bp -3.7 bp -5.6 bp -1.2
83.9 bp 88% 80.6 bp 85% 78.9 bp 81% 78.4 bp 79% 69.8 bp 70% 67.2 bp 68% -1.81.1 bp 2.0 bp 0.8 bp 1.6 bp 1.9 bp 2.2 bp 0.4 bp 0.2 bp -1.2 bp -2.7 bp -3.5 bp -5.2 bp Cheap -3
72.1 bp 72% 70.7 bp 72% 71.0 bp 72% 69.9 bp 70% 58.8 bp 60% 54.7 bp 57%-2.4 bp -1.2 bp -1.9 bp -0.8 bp 0.7 bp 1.5 bp -1.7 bp -1.1 bp -3.9 bp -3.9 bp -5.5 bp -5.8 bp
bp vol level Imp/Act ratio(3m z-score) (3m z-score)
PCA (with rates) PCA residual(3m z-score) (3m z-score)
1y
2y
3y
5y
7y
10y
20y
Source: RBS
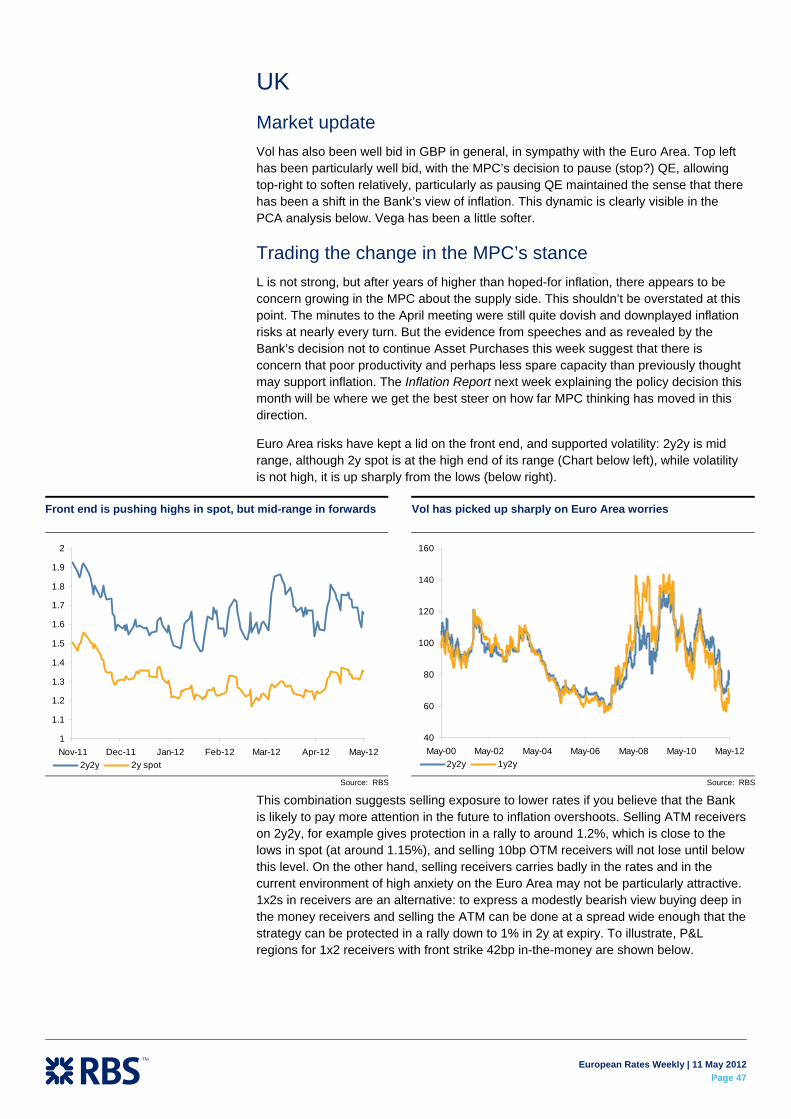
European Rates Weekly | 11 May 2012
Page 47
UK Market update Vol has also been well bid in GBP in general, in sympathy with the Euro Area. Top left has been particularly well bid, with the MPC’s decision to pause (stop?) QE, allowing top-right to soften relatively, particularly as pausing QE maintained the sense that there has been a shift in the Bank’s view of inflation. This dynamic is clearly visible in the PCA analysis below. Vega has been a little softer.
Trading the change in the MPC’s stance L is not strong, but after years of higher than hoped-for inflation, there appears to be concern growing in the MPC about the supply side. This shouldn’t be overstated at this point. The minutes to the April meeting were still quite dovish and downplayed inflation risks at nearly every turn. But the evidence from speeches and as revealed by the Bank’s decision not to continue Asset Purchases this week suggest that there is concern that poor productivity and perhaps less spare capacity than previously thought may support inflation. The Inflation Report next week explaining the policy decision this month will be where we get the best steer on how far MPC thinking has moved in this direction.
Euro Area risks have kept a lid on the front end, and supported volatility: 2y2y is mid range, although 2y spot is at the high end of its range (Chart below left), while volatility is not high, it is up sharply from the lows (below right).
Front end is pushing highs in spot, but mid-range in forwards Vol has picked up sharply on Euro Area worries
1
1.1
1.2
1.3
1.4
1.5
1.6
1.7
1.8
1.9
2
Nov-11 Dec-11 Jan-12 Feb-12 Mar-12 Apr-12 May-122y2y 2y spot
40
60
80
100
120
140
160
May-00 May-02 May-04 May-06 May-08 May-10 May-122y2y 1y2y
Source: RBS Source: RBS
This combination suggests selling exposure to lower rates if you believe that the Bank is likely to pay more attention in the future to inflation overshoots. Selling ATM receivers on 2y2y, for example gives protection in a rally to around 1.2%, which is close to the lows in spot (at around 1.15%), and selling 10bp OTM receivers will not lose until below this level. On the other hand, selling receivers carries badly in the rates and in the current environment of high anxiety on the Euro Area may not be particularly attractive. 1x2s in receivers are an alternative: to express a modestly bearish view buying deep in the money receivers and selling the ATM can be done at a spread wide enough that the strategy can be protected in a rally down to 1% in 2y at expiry. To illustrate, P&L regions for 1x2 receivers with front strike 42bp in-the-money are shown below.

European Rates Weekly | 11 May 2012
Page 48
P&L regions for 1x2 receiver spreads with front strike set 42bp OTM
0 .0
0 .5
1 .0
1 .5
2 .0
2 .5
O c t-10 A p r-11 O c t-11 A pr-12 O c t-12 A pr-13 O c t-13 A pr-14
(%)
2 y s w a p F ro nt s trike Ma x P &LB /E le ve l F o rw a rd s
A ll e xp ire O T M
L o s eL o s e
L o s e
Ma x P ro f it
Source: RBS
The prototype triangle monitor Please see p15. If you have any comments on this analysis (or any other in this document) please contact me.
ATM vol multi-map: UK
ATM normvol surface historical 4-in-1 heat-map… colouring denotes 3m z-score of each measure
In/For 1y 2y 5y 10y 20y 30y59.9 bp 92% 67.3 bp 92% 78.5 bp 91% 84.2 bp 91% 78.3 bp 93% 73.4 bp 91%
-12.5 bp -9.5 bp -12.3 bp -9.0 bp -6.8 bp -5.2 bp 0.0 bp -0.7 bp 0.1 bp -2.2 bp -1.2 bp -4.3 bp z-score77.4 bp 90% 80.9 bp 89% 82.9 bp 86% 83.6 bp 87% 77.8 bp 90% 73.8 bp 89% Rich 3
-10.8 bp -7.5 bp -7.0 bp -3.8 bp -3.0 bp -1.5 bp 0.4 bp 0.1 bp 0.8 bp -1.3 bp 0.4 bp -2.5 bp 2.486.3 bp 78% 87.6 bp 84% 85.4 bp 79% 82.1 bp 82% 76.1 bp 85% 72.4 bp 84% 1.8-4.3 bp -1.0 bp -1.4 bp 1.4 bp 0.9 bp 2.2 bp 1.3 bp 1.2 bp 1.0 bp -0.5 bp 0.5 bp -2.1 bp 1.290.1 bp 84% 88.3 bp 80% 84.7 bp 75% 79.3 bp 79% 73.3 bp 82% 69.8 bp 80% 0.62.5 bp 3.9 bp 3.4 bp 4.8 bp 3.7 bp 4.6 bp 2.5 bp 3.2 bp 1.2 bp 1.1 bp 0.1 bp -0.9 bp 0
85.3 bp 65% 83.3 bp 70% 80.0 bp 76% 76.1 bp 80% 69.5 bp 79% 65.4 bp 75% -0.65.6 bp 6.5 bp 5.4 bp 6.6 bp 4.4 bp 5.1 bp 3.2 bp 3.7 bp 0.4 bp 0.3 bp -0.7 bp -1.5 bp -1.2
76.8 bp 77% 75.8 bp 84% 73.6 bp 83% 71.0 bp 84% 64.2 bp 76% 59.7 bp 71% -1.85.1 bp 6.5 bp 4.2 bp 6.0 bp 1.6 bp 2.8 bp 0.6 bp 0.7 bp -2.1 bp -2.8 bp -3.0 bp -4.1 bp Cheap -3
64.8 bp 74% 63.9 bp 76% 61.2 bp 71% 59.1 bp 67% 51.9 bp 62% 47.0 bp 56%-0.1 bp 1.9 bp -0.8 bp 1.0 bp -2.5 bp -1.2 bp -2.8 bp -2.5 bp -5.2 bp -5.6 bp -6.2 bp -7.1 bp
bp vol level Imp/Act ratio(3m z-score) (3m z-score)
PCA (with rates) PCA residual(3m z-score) (3m z-score)
1y
2y
3y
5y
7y
10y
20y
Source: RBS
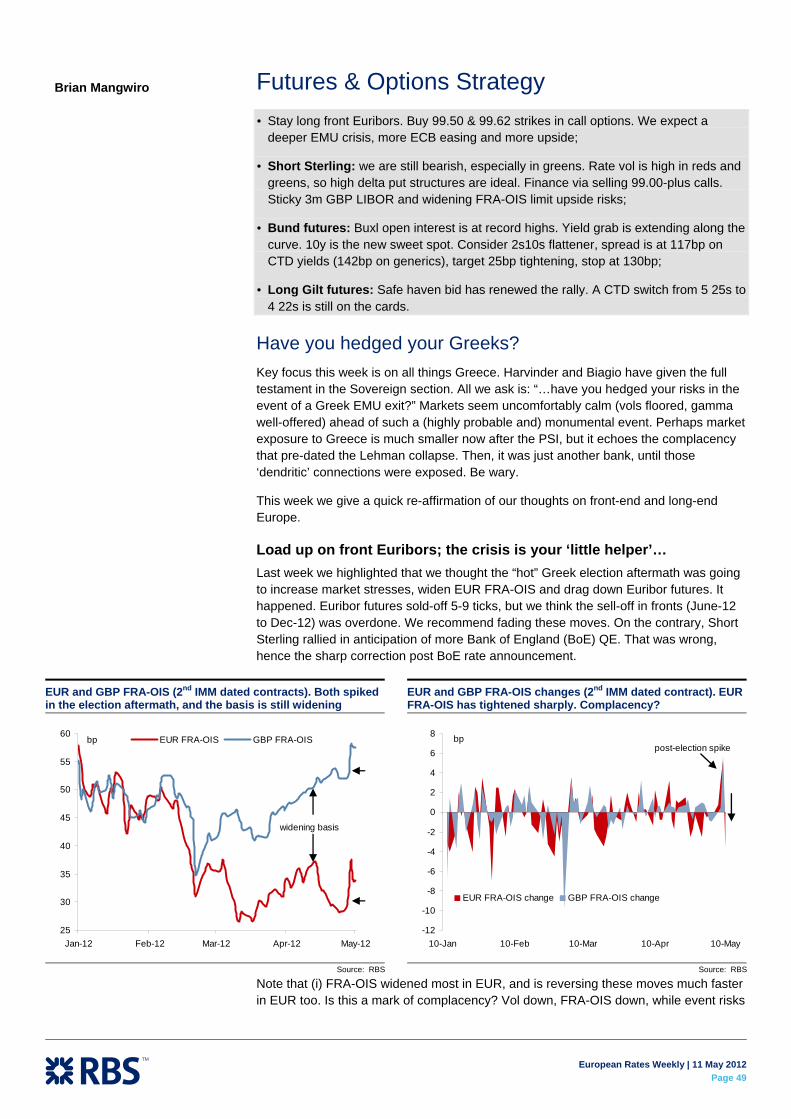
European Rates Weekly | 11 May 2012
Page 49
Futures & Options Strategy Stay long front Euribors. Buy 99.50 & 99.62 strikes in call options. We expect a deeper EMU crisis, more ECB easing and more upside;
Short Sterling: we are still bearish, especially in greens. Rate vol is high in reds and greens, so high delta put structures are ideal. Finance via selling 99.00-plus calls. Sticky 3m GBP LIBOR and widening FRA-OIS limit upside risks;
Bund futures: Buxl open interest is at record highs. Yield grab is extending along the curve. 10y is the new sweet spot. Consider 2s10s flattener, spread is at 117bp on CTD yields (142bp on generics), target 25bp tightening, stop at 130bp;
Long Gilt futures: Safe haven bid has renewed the rally. A CTD switch from 5 25s to 4 22s is still on the cards.
Have you hedged your Greeks? Key focus this week is on all things Greece. Harvinder and Biagio have given the full testament in the Sovereign section. All we ask is: “…have you hedged your risks in the event of a Greek EMU exit?” Markets seem uncomfortably calm (vols floored, gamma well-offered) ahead of such a (highly probable and) monumental event. Perhaps market exposure to Greece is much smaller now after the PSI, but it echoes the complacency that pre-dated the Lehman collapse. Then, it was just another bank, until those ‘dendritic’ connections were exposed. Be wary.
This week we give a quick re-affirmation of our thoughts on front-end and long-end Europe.
Load up on front Euribors; the crisis is your ‘little helper’… Last week we highlighted that we thought the “hot” Greek election aftermath was going to increase market stresses, widen EUR FRA-OIS and drag down Euribor futures. It happened. Euribor futures sold-off 5-9 ticks, but we think the sell-off in fronts (June-12 to Dec-12) was overdone. We recommend fading these moves. On the contrary, Short Sterling rallied in anticipation of more Bank of England (BoE) QE. That was wrong, hence the sharp correction post BoE rate announcement.
Note that (i) FRA-OIS widened most in EUR, and is reversing these moves much faster in EUR too. Is this a mark of complacency? Vol down, FRA-OIS down, while event risks
EUR and GBP FRA-OIS (2nd IMM dated contracts). Both spiked in the election aftermath, and the basis is still widening
25
30
35
40
45
50
55
60
Jan-12 Feb-12 Mar-12 Apr-12 May-12
EUR FRA-OIS GBP FRA-OISbp
widening basis
Source: RBS
EUR and GBP FRA-OIS changes (2nd IMM dated contract). EUR FRA-OIS has tightened sharply. Complacency?
-12
-10
-8
-6
-4
-2
0
2
4
6
8
10-Jan 10-Feb 10-Mar 10-Apr 10-May
EUR FRA-OIS change GBP FRA-OIS change
bppost-election spike
Source: RBS
Brian Mangwiro

European Rates Weekly | 11 May 2012
Page 50
loom large. (ii) FRA-OIS basis between GBP and EUR has been widening since Jan-12. This weighs on Short Sterling much more, hence our preference to sell Short Sterling versus Euribor.
One could argue that credit risk in the Eurosystem is being under-estimated, especially with the Euribor bank panel CDS still widening. Simply, this reflects the direct pumping of liquidity in Europe via ECB LTROs versus its absence in the UK. Excess liquidity distorts credit risk premia, in our view.
Recommended strategies: For Euribor, we recommend to maintain longs in June-12, Sep-12 and Dec-12 contracts. Our reasoning is two-pronged: (i) copious amounts of liquidity in the Eurosystem, but more importantly, if the crisis deepens, the ECB’s hand will be forced. We believe that currently, only the ECB has the pre-disposition and balance sheet to respond. More easing will come, Euribors will richen, hence our bias to play for upside in front white Euribors. RBS economists still expect two more ECB rate cuts in 2012: in June-12 and Sep-12.
June-12 Euribor: price and open interest Sep-12 Euribor: price and open interest Dec-12 Euribor: price and open interest
99.0099.0599.1099.1599.2099.2599.3099.3599.4099.45
Jan-12 Mar-12 May-12400000
450000
500000
550000
600000
650000June-12 priceOpen Int
99.0099.0599.1099.1599.2099.2599.3099.3599.4099.4599.50
Jan-12 Mar-12 May-12400000
420000
440000
460000
480000
500000
520000
540000
560000Sep-12 priceOpen Int
99.0099.0599.1099.1599.2099.2599.3099.3599.4099.4599.50
Jan-12 Mar-12 May-12350000
370000
390000
410000
430000
450000
470000
490000Dec-12 priceOpen Int
Source: RBS Source: RBS Source: RBS
Open interest in June-12 Euribor 99.50 and 99.625 call options is down. Buy.
Open interest in Sep-12 Euribor 99.50 and 99.625 call options is down. Buy.
Open interest in Dec-12 Euribor 99.50 and 99.625 call options is down. Buy.
0
50000
100000
150000
200000
250000
300000
350000
400000
Jan-12 Mar-12 May-120
20000
40000
60000
80000
100000
120000
ERM2C 99.50
ERM2C 99.625
0
50000
100000
150000
200000
250000
300000
Jan-12 Mar-12 May-120
20000
40000
60000
80000
100000
120000
140000
160000
ERU2C 99.50
ERU2C 99.6250
50000
100000
150000
200000
250000
Jan-12 Mar-12 May-120
50000
100000
150000
200000
250000ERZ2C 99.50
ERZ2C 99.625
Source: RBS Source: RBS Source: RBS
We would buy (i) outright futures; (ii) 99.50 and 99.62 call options (the decline in open interest implies suggests shorts exited in size. We see good value and recommend to stay long), or (iii) tactical whites/reds steepeners.
Our convictions and trades remain unchanged. The sell-off was mainly driven by panic profit taking, in our view, and liquidations were much sharper on the 99.50 strike. Front Euribor futures are still 7 ticks off their recent highs; vol is still floored and entry levels are still good. Recent flows suggest that investors are returning back to these “rate cut trades” (open interest has a 2-day lag).
FRA-OIS outlook for the coming week: We are surprised that EUR FRA-OIS is tightening sharply, especially when (i) Greece still has no government, (ii) Spain has its banks (and corporates) effectively shut out of capital markets, with deeply entrenched
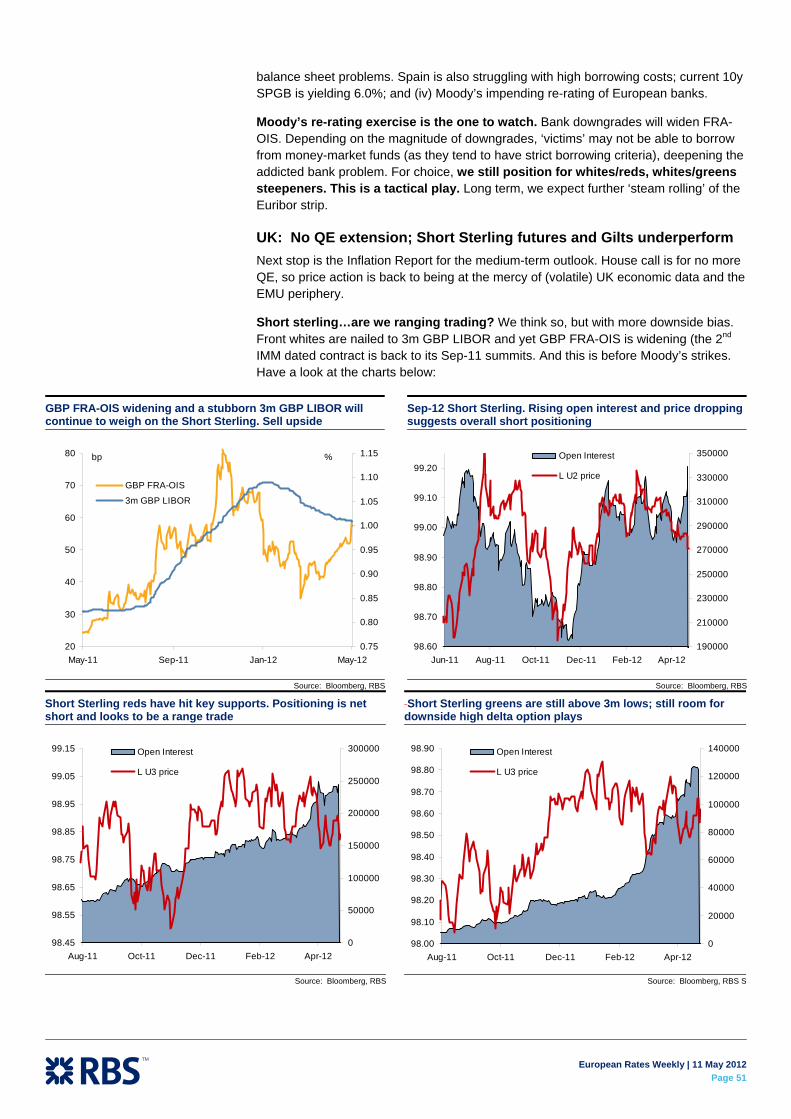
European Rates Weekly | 11 May 2012
Page 51
balance sheet problems. Spain is also struggling with high borrowing costs; current 10y SPGB is yielding 6.0%; and (iv) Moody’s impending re-rating of European banks.
Moody’s re-rating exercise is the one to watch. Bank downgrades will widen FRA-OIS. Depending on the magnitude of downgrades, ‘victims’ may not be able to borrow from money-market funds (as they tend to have strict borrowing criteria), deepening the addicted bank problem. For choice, we still position for whites/reds, whites/greens steepeners. This is a tactical play. Long term, we expect further ‘steam rolling’ of the Euribor strip.
UK: No QE extension; Short Sterling futures and Gilts underperform Next stop is the Inflation Report for the medium-term outlook. House call is for no more QE, so price action is back to being at the mercy of (volatile) UK economic data and the EMU periphery.
Short sterling…are we ranging trading? We think so, but with more downside bias. Front whites are nailed to 3m GBP LIBOR and yet GBP FRA-OIS is widening (the 2nd IMM dated contract is back to its Sep-11 summits. And this is before Moody’s strikes. Have a look at the charts below:
GBP FRA-OIS widening and a stubborn 3m GBP LIBOR will continue to weigh on the Short Sterling. Sell upside
20
30
40
50
60
70
80
May-11 Sep-11 Jan-12 May-120.75
0.80
0.85
0.90
0.95
1.00
1.05
1.10
1.15
GBP FRA-OIS
3m GBP LIBOR
%bp
Source: Bloomberg, RBS
Sep-12 Short Sterling. Rising open interest and price dropping suggests overall short positioning
98.60
98.70
98.80
98.90
99.00
99.10
99.20
Jun-11 Aug-11 Oct-11 Dec-11 Feb-12 Apr-12190000
210000
230000
250000
270000
290000
310000
330000
350000Open Interest
L U2 price
Source: Bloomberg, RBS
Short Sterling reds have hit key supports. Positioning is net short and looks to be a range trade
98.45
98.55
98.65
98.75
98.85
98.95
99.05
99.15
Aug-11 Oct-11 Dec-11 Feb-12 Apr-120
50000
100000
150000
200000
250000
300000Open Interest
L U3 price
Source: Bloomberg, RBS
Short Sterling greens are still above 3m lows; still room for downside high delta option plays
98.00
98.10
98.20
98.30
98.40
98.50
98.60
98.70
98.80
98.90
Aug-11 Oct-11 Dec-11 Feb-12 Apr-120
20000
40000
60000
80000
100000
120000
140000Open Interest
L U3 price
Source: Bloomberg, RBS S
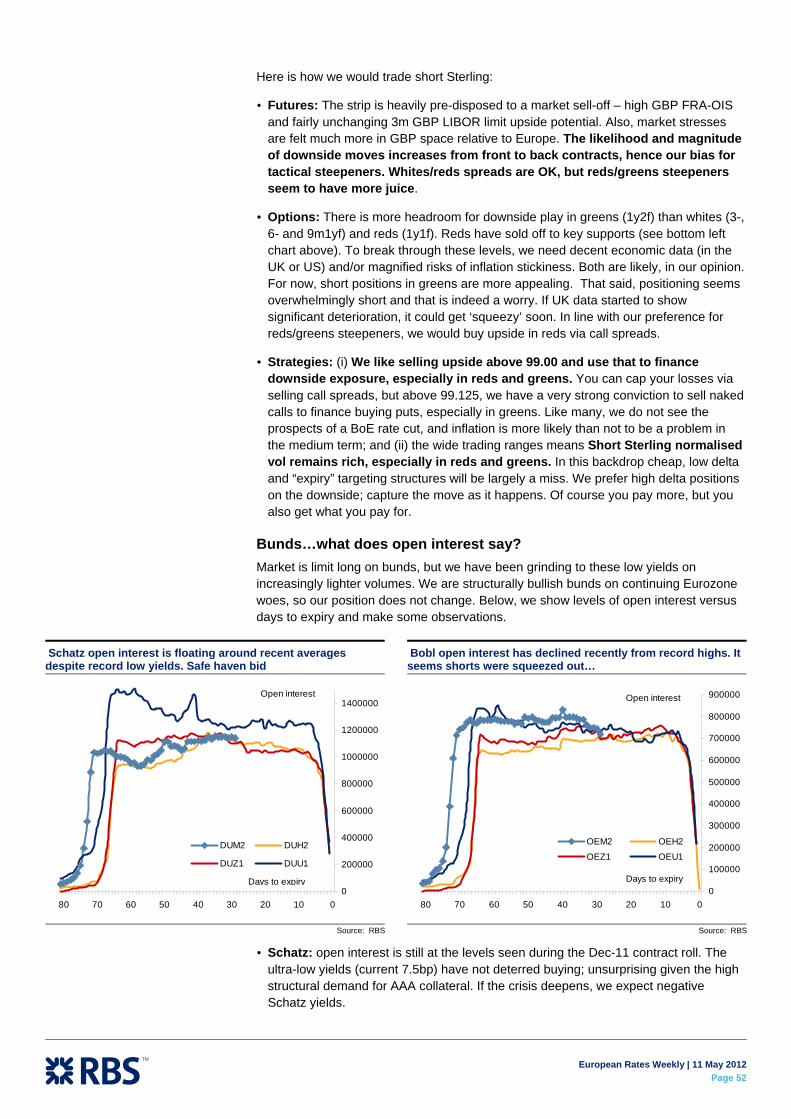
European Rates Weekly | 11 May 2012
Page 52
Here is how we would trade short Sterling:
Futures: The strip is heavily pre-disposed to a market sell-off – high GBP FRA-OIS and fairly unchanging 3m GBP LIBOR limit upside potential. Also, market stresses are felt much more in GBP space relative to Europe. The likelihood and magnitude of downside moves increases from front to back contracts, hence our bias for tactical steepeners. Whites/reds spreads are OK, but reds/greens steepeners seem to have more juice.
Options: There is more headroom for downside play in greens (1y2f) than whites (3-, 6- and 9m1yf) and reds (1y1f). Reds have sold off to key supports (see bottom left chart above). To break through these levels, we need decent economic data (in the UK or US) and/or magnified risks of inflation stickiness. Both are likely, in our opinion. For now, short positions in greens are more appealing. That said, positioning seems overwhelmingly short and that is indeed a worry. If UK data started to show significant deterioration, it could get ‘squeezy’ soon. In line with our preference for reds/greens steepeners, we would buy upside in reds via call spreads.
Strategies: (i) We like selling upside above 99.00 and use that to finance downside exposure, especially in reds and greens. You can cap your losses via selling call spreads, but above 99.125, we have a very strong conviction to sell naked calls to finance buying puts, especially in greens. Like many, we do not see the prospects of a BoE rate cut, and inflation is more likely than not to be a problem in the medium term; and (ii) the wide trading ranges means Short Sterling normalised vol remains rich, especially in reds and greens. In this backdrop cheap, low delta and “expiry” targeting structures will be largely a miss. We prefer high delta positions on the downside; capture the move as it happens. Of course you pay more, but you also get what you pay for.
Bunds…what does open interest say? Market is limit long on bunds, but we have been grinding to these low yields on increasingly lighter volumes. We are structurally bullish bunds on continuing Eurozone woes, so our position does not change. Below, we show levels of open interest versus days to expiry and make some observations.
Schatz: open interest is still at the levels seen during the Dec-11 contract roll. The ultra-low yields (current 7.5bp) have not deterred buying; unsurprising given the high structural demand for AAA collateral. If the crisis deepens, we expect negative Schatz yields.
Schatz open interest is floating around recent averages despite record low yields. Safe haven bid
0
200000
400000
600000
800000
1000000
1200000
1400000
01020304050607080
DUM2 DUH2
DUZ1 DUU1
Open interest
Days to expiry
Source: RBS
Bobl open interest has declined recently from record highs. It seems shorts were squeezed out…
0
100000
200000
300000
400000
500000
600000
700000
800000
900000
01020304050607080
OEM2 OEH2
OEZ1 OEU1
Days to expiry
Open interest
Source: RBS

European Rates Weekly | 11 May 2012
Page 53
Bobl: open interest has been steadily declining in the past 10 trading days in line with market flows. Investors have been switching out of DEM5y into 5y DSL, RAGB and OATs. The side chart also provides further evidence of the drop in interest, but with the price holding firm, suggesting shorts caught offside rather than initiation of new shorts. In line, DEM5y has not underperformed; stuck in an 8bp range (currently 53.6bp). Nonetheless, the risk of Bobl underperforming cannot be overlooked, especially as it is quite rich on the fly.
Bund: Bund open interest is still grinding higher, almost touching on Sep-11 highs. With Schatz and Bobl floored in yields, Bunds are the next sweet spot for carry/ rolldown, especially for investors restricted to investing in EMU AAA government bonds. That open interest and price are both rising suggests the market is still getting long. This is further substantiated by the futures yield spread charts shown below.
Buxl: This contract has seen a significant surge in open interest coupled with flattening in the 2s30s, 5s 30s and 10s30s slope. This suggests the market is getting long German long end as well in search of yield, given that the front end of the curve is well-bid and super flat.
Another consideration is the Solvency II framework due to be implemented in Europe. Broadly, this is expected to reduce demand at the very long end as pensions funds shift from bonds to a swap discount curve (thus less structural demand for the long end). The Buxl CTD is a 25 yr, which is around the last liquid point on the swap discounting curve under Solvency II. This would stimulate some hedging demand, and consequently an increase in open interest.
Slope trades: Flattening is the overriding theme Below we also show how the Buxl has recently outperformed Schatz, Bobls and Bunds. More importantly, with both 2s and 5s floored, 10s and 30s are attracting a much stronger bid on ‘carry foraging’.
Have a look at the charts below. We show both the generic and futures CTD yield basis. The overall theme here is…flattening; rolling yield curve compression.
Bund open interest is still grinding higher. With Schatz and Bobl at ultra lows, Bunds are the new ‘sweet spot’
0
200000
400000
600000
800000
1000000
01020304050607080
RXM2 RXH2RXZ1 RXU1
Open interest
Days to expiry
Source: Bloomberg, RBS
Buxl open interest is at record highs. (25y) sector is flattening. Is this an extension of the yield grab?
0
10000
20000
30000
40000
50000
60000
01020304050607080
UBM2 UBH2UBZ1 UBU1
Open interest
Days to expiry
Source: Bloomberg, RBS
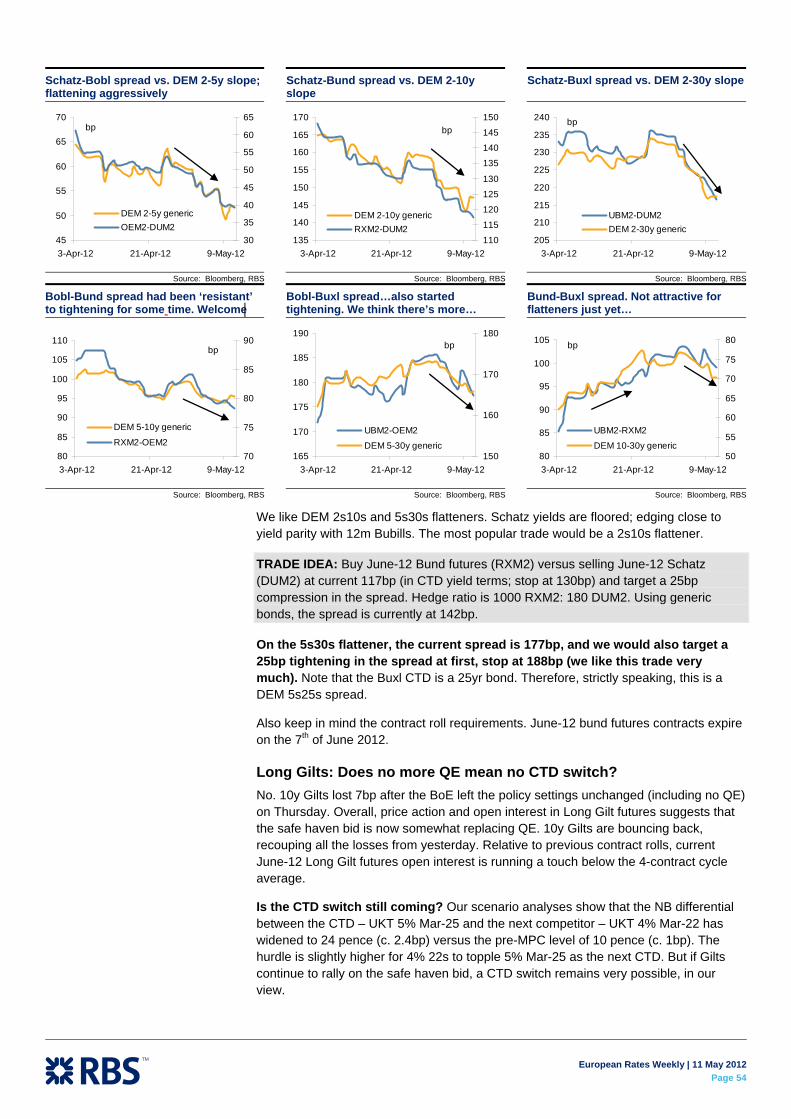
European Rates Weekly | 11 May 2012
Page 54
Schatz-Bobl spread vs. DEM 2-5y slope; flattening aggressively
Schatz-Bund spread vs. DEM 2-10y slope
Schatz-Buxl spread vs. DEM 2-30y slope
45
50
55
60
65
70
3-Apr-12 21-Apr-12 9-May-1230
35
40
45
50
55
60
65
DEM 2-5y genericOEM2-DUM2
bp
135
140
145
150
155
160
165
170
3-Apr-12 21-Apr-12 9-May-12110
115
120
125
130
135
140
145
150
DEM 2-10y genericRXM2-DUM2
bp
205
210
215
220
225
230
235
240
3-Apr-12 21-Apr-12 9-May-12
UBM2-DUM2DEM 2-30y generic
bp
Source: Bloomberg, RBS Source: Bloomberg, RBS Source: Bloomberg, RBS
Bobl-Bund spread had been ‘resistant’ to tightening for some time. Welcome
Bobl-Buxl spread…also started tightening. We think there’s more…
Bund-Buxl spread. Not attractive for flatteners just yet…
80
85
90
95
100
105
110
3-Apr-12 21-Apr-12 9-May-1270
75
80
85
90
DEM 5-10y generic
RXM2-OEM2
bp
165
170
175
180
185
190
3-Apr-12 21-Apr-12 9-May-12150
160
170
180
UBM2-OEM2
DEM 5-30y generic
bp
80
85
90
95
100
105
3-Apr-12 21-Apr-12 9-May-1250
55
60
65
70
75
80
UBM2-RXM2
DEM 10-30y generic
bp
Source: Bloomberg, RBS Source: Bloomberg, RBS Source: Bloomberg, RBS
We like DEM 2s10s and 5s30s flatteners. Schatz yields are floored; edging close to yield parity with 12m Bubills. The most popular trade would be a 2s10s flattener.
TRADE IDEA: Buy June-12 Bund futures (RXM2) versus selling June-12 Schatz (DUM2) at current 117bp (in CTD yield terms; stop at 130bp) and target a 25bp compression in the spread. Hedge ratio is 1000 RXM2: 180 DUM2. Using generic bonds, the spread is currently at 142bp.
On the 5s30s flattener, the current spread is 177bp, and we would also target a 25bp tightening in the spread at first, stop at 188bp (we like this trade very much). Note that the Buxl CTD is a 25yr bond. Therefore, strictly speaking, this is a DEM 5s25s spread.
Also keep in mind the contract roll requirements. June-12 bund futures contracts expire on the 7th of June 2012.
Long Gilts: Does no more QE mean no CTD switch? No. 10y Gilts lost 7bp after the BoE left the policy settings unchanged (including no QE) on Thursday. Overall, price action and open interest in Long Gilt futures suggests that the safe haven bid is now somewhat replacing QE. 10y Gilts are bouncing back, recouping all the losses from yesterday. Relative to previous contract rolls, current June-12 Long Gilt futures open interest is running a touch below the 4-contract cycle average.
Is the CTD switch still coming? Our scenario analyses show that the NB differential between the CTD – UKT 5% Mar-25 and the next competitor – UKT 4% Mar-22 has widened to 24 pence (c. 2.4bp) versus the pre-MPC level of 10 pence (c. 1bp). The hurdle is slightly higher for 4% 22s to topple 5% Mar-25 as the next CTD. But if Gilts continue to rally on the safe haven bid, a CTD switch remains very possible, in our view.

European Rates Weekly | 11 May 2012
Page 55
UKT 5% 25 auction and the CTD switch: As we mentioned last week, the UKT 5% Mar-25 bond gets auctioned on the 15th of May. If the bond were to concede into the auction, this will further raise the CTD switch hurdle. Our general view is that the bond is not too attractive on flies, and may need to see the some concession for strong results. By and large, the larger the concession, the higher the chances of a good take-up and strength of a post-auction rally, which would in turn support the CTD switch optionality (25s rally much more than 22s). Until then we wait.
Below we show our usual customary scenario analysis charts for June-12 delivery.
Note that: (i) our scenario analyses show a CTD switch is still possible if outright yield levels in 10y Gilts drop by 10bp (to c. 1.85%; current 1.96%); (ii) a strong post-auction rally will help reduce the hurdle; and (iii) an even stronger rally brings UKT 3.75% Sep-21 into the frame as yet another CTD competitor. In the event of a messy conclusion to the Greek saga, we can see 10y Gilts at 1.5%, 10y bunds at 1%, in which case, the UKT 3.75% Sep-21 bond should become CTD.
June-12 Long Gilt futures open interest versus previous contract rolls; a tad below average
0
50000
100000
150000
200000
250000
300000
350000
400000
05101520253035404550556065707580
G M2 G H2 G Z1
G U1 G M1
Source: Bloomberg, RBS
June-12 Long Gilt futures open interest versus price. Trends suggests market went short before the MPC
114.00
114.50
115.00
115.50
116.00
116.50
117.00
117.50
118.00
118.50
2-Apr 9-Apr 16-Apr 23-Apr 30-Apr 7-May270000
280000
290000
300000
310000
320000
330000G M2 Open interest
Source: Bloomberg, RBS
Same-day net basis (NB) scenario analyses. For CTD, NB at delivery is zero. CTD switch to Mar-22s happens at point A, and to Sep-21s at point B
0.00
0.20
0.40
0.60
0.80
1.00
1.20
1.40
1.60
1.80
2.00
60 40 30 20 10 0 -10 -20 -30 -40 -60
UKT 3.75% Sep-21UKT 4% Mar-22 UKT 5% Mar-25
A
B
net basis at delvry (GBP0.00)
market sell-off market rally
Source: Bloomberg, RBS
Theo fut prices for June-12 deliverables. Lowest price = CTD at the yield level. CTD switch to Mar-22s happens at point A, and to Sep-1s at point B
110.5000
112.5000
114.5000
116.5000
118.5000
120.5000
122.5000
124.5000
60 40 30 20 10 0 -10 -20 -30 -40 -60
UKT 3.75% Sep-21
UKT 4% Mar-22
UKT 5% Mar-25
AB
market sell-off market rally
Price
Source: Bloomberg, RBS

European Rates Weekly | 11 May 2012
Page 56
Technical Strategy
Bund RX1 – met the 142.85 target (long-term target published in the previous weekly) and even rallied to 143.00; although in our view the trend looks like it has run ahead of itself and hence a correction/consolidation is needed. Among technical indicators pointing to this are momentum divergence with the price, a Harami cross candlestick pattern and a 3rd-time failure to break 143.00. If so, the key support levels would be 142.00 and 141.40. The bias is for a correction/consolidation in the short term to 142.00 (possibly 141.40), but a resumption of the uptrend to 143.00 and new highs thereafter. Once 143.00 is broken, our next long-term targets would be 143.70, 144.30, 144.70 and 145.10.
Sweden 10-yr generic yield– a break of the 1.55% resistance (the 150% Fibonacci retracement from the Aug’10-Feb’11 extremes) in a strong trend suggests further potential for the yields to go lower to the next key resistance level 1.39%, although an RSI oscillator entering overbought region (on the yield chart) suggests a possible pause/correction to the 5-day moving average before trend resumption.
Dmytro Bondar Bund RX1 daily chart with Fibonacci retracements, slow stochastic, volume and 9-day MA
Source: RBS, Bloomberg
Bund RX
Bunds reached the 142.85 target, but displayed signals of a possible correction
If so, the major support levels should provide buying opportunities, as we believe the long-term view remains bullish
Sweden 10-yr
In the long term, the market is still bullish post key level breakout and positive momentum
In the short term, it is overbought and a correction to 5-day MA looks possible
10-yr Sweden daily chart with Fibonacci retracements, 5-day MA and RSI
Source: RBS, Bloomberg

European Rates Weekly | 11 May 2012
Page 57
EMU Issuance Update
Gross Issuance Our gross issuance forecasts for 2012 are adjusted to reflect the extra funding required for the ESM (a total of EUR 32bn shared across the euro area countries). The percentage contributions to the ESM are based on each country’s National Central Bank’s contribution to the ECB capital key.
Please note that all issuance amounts are quoted on an auction date basis rather than a settlement date basis.
Gross Issuance 2012 (EUR bn)
RBS
Forecast Year To
Date ESM contrb.
(%of 32bn) RBS adj. for ESM
Remaining (inc. ESM)
% complete (inc. ESM)
Germany 182.0 66.0 27.1% 190.7 124.7 34.6%
France 195.0 85.0 20.3% 201.5 116.5 42.2%
Italy* 221.0 80.3 17.9% 226.7 146.4 35.4%
Spain 98.0 48.1 11.9% 101.8 53.7 47.2%
Nether. 61.0 30.8 5.7% 62.8 32.0 49.1%
Belgium 28.0 17.0 3.5% 29.1 12.1 58.3%
Austria 22.0 10.2 2.8% 22.9 12.7 44.6%
Finland 13.0 3.0 1.8% 13.6 10.6 22.1% Issuance amounts are quoted on an auction date basis Source: RBS Rates Strategy, ECB
Chart 1 below shows the total amount issued by each country compared to the amount that remains to be issued in order to meet the country’s funding requirement for 2012 (according to our estimates, including ESM funding).
Chart 1: Gross Issuance 2012 YTD & Remaining (EUR bn)
6685 80
4831
17 10 3
125117
146
54
32
12 1311
0
25
50
75
100
125
150
175
200
225
Germany France Italy Spain Netherlands Belgium Austria Finland
EUR billions Issued to date Remaining (2012, inc ESM funding)
Source: RBS Rates Strategy .
Chart 2 shows a breakdown of the debt issued to date this year by maturity sector (as a percentage of the total amount issued to date).
Claire Tucker
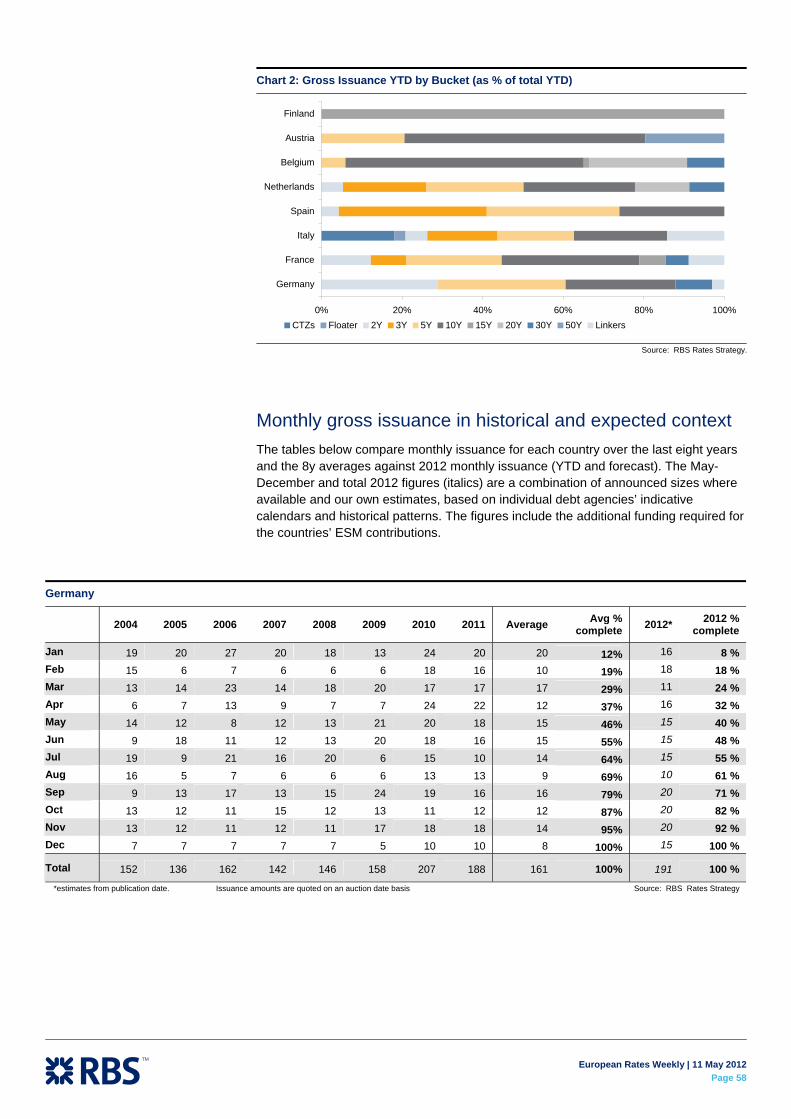
European Rates Weekly | 11 May 2012
Page 58
Chart 2: Gross Issuance YTD by Bucket (as % of total YTD)
0% 20% 40% 60% 80% 100%
Germany
France
Italy
Spain
Netherlands
Belgium
Austria
Finland
CTZs Floater 2Y 3Y 5Y 10Y 15Y 20Y 30Y 50Y Linkers
Source: RBS Rates Strategy.
Monthly gross issuance in historical and expected context The tables below compare monthly issuance for each country over the last eight years and the 8y averages against 2012 monthly issuance (YTD and forecast). The May-December and total 2012 figures (italics) are a combination of announced sizes where available and our own estimates, based on individual debt agencies’ indicative calendars and historical patterns. The figures include the additional funding required for the countries’ ESM contributions.
Germany
2004 2005 2006 2007 2008 2009 2010 2011 Average Avg %
complete 2012* 2012 % complete
Jan 19 20 27 20 18 13 24 20 20 12% 16 8 % Feb 15 6 7 6 6 6 18 16 10 19% 18 18 % Mar 13 14 23 14 18 20 17 17 17 29% 11 24 % Apr 6 7 13 9 7 7 24 22 12 37% 16 32 % May 14 12 8 12 13 21 20 18 15 46% 15 40 % Jun 9 18 11 12 13 20 18 16 15 55% 15 48 % Jul 19 9 21 16 20 6 15 10 14 64% 15 55 % Aug 16 5 7 6 6 6 13 13 9 69% 10 61 % Sep 9 13 17 13 15 24 19 16 16 79% 20 71 % Oct 13 12 11 15 12 13 11 12 12 87% 20 82 % Nov 13 12 11 12 11 17 18 18 14 95% 20 92 % Dec 7 7 7 7 7 5 10 10 8 100% 15 100 %
Total 152 136 162 142 146 158 207 188 161 100% 191 100 % *estimates from publication date. Issuance amounts are quoted on an auction date basis Source: RBS Rates Strategy

European Rates Weekly | 11 May 2012
Page 59
France
2004 2005 2006 2007 2008 2009 2010 2011 Average Avg %
complete 2012* 2012 % complete
Jan 16 14 13 13 13 15 23 22 16 11% 19 9 % Feb 14 20 12 12 14 15 19 21 16 22% 20 19 % Mar 14 10 11 9 11 18 23 19 14 32% 18 28 % Apr 11 10 13 11 18 16 20 22 15 42% 19 38 % May 13 10 11 11 7 17 21 23 14 51% 18 47 % Jun 14 13 9 11 11 23 20 21 15 62% 21 57 % Jul 9 14 14 9 7 16 20 20 14 71% 21 67 % Aug - - - - - - - - 0 71% - 67 % Sep 11 11 10 8 12 18 19 20 14 80% 20 77 % Oct 11 9 11 7 13 18 20 18 13 89% 20 87 % Nov 12 11 9 8 14 17 20 17 13 98% 20 97 % Dec - - - - - 6 9 5 2 100% 6 100 %
Total 125 123 113 97 118 179 214 208 147 100% 202 100 % *estimates from publication date. Issuance amounts are quoted on an auction date basis Source: RBS Rates Strategy
Italy
2004 2005 2006 2007 2008 2009 2010 2011 Average Avg %
complete 2012* 2012 % complete
Jan 23 23 17 15 19 20 24 21 20 10% 20 9 % Feb 22 17 19 17 17 24 24 17 20 20% 19 17 % Mar 26 16 18 18 12 25 19 19 19 30% 26 29 % Apr 26 18 19 19 21 30 19 24 22 41% 16 35 % May 18 16 15 16 15 23 19 18 17 49% 17 43 % Jun 14 17 18 17 14 27 20 18 18 59% 21 52 % Jul 12 13 14 14 15 29 21 15 16 67% 20 61 % Aug 11 9 10 11 12 18 22 10 13 73% 16 68 % Sep 15 17 11 13 7 28 25 20 17 82% 21 78 % Oct 12 16 11 18 15 21 24 18 17 90% 20 86 % Nov - 2 4 3 14 10 15 15 8 94% 16 93 % Dec 8 8 13 9 14 13 15 11 11 100% 15 100 %
Total 186 171 166 167 173 268 246 206 198 100% 227 100 % *estimates from publication date. Issuance amounts are quoted on an auction date basis Source: RBS Rates Strategy
Spain
2004 2005 2006 2007 2008 2009 2010 2011 Average Avg %
complete 2012* 2012 % complete
Jan 4 10 5 5 6 9 10 9 7 12% 19 19 % Feb 3 3 3 2 5 16 9 7 6 22% 14 32 % Mar 2 2 3 3 1 7 11 8 5 30% 8 40 % Apr 2 4 2 4 2 10 6 8 5 38% 5 45 % May 4 3 1 - 4 14 7 7 5 46% 7 52 % Jun 6 2 1 6 2 3 8 8 5 53% 7 59 % Jul 2 1 3 2 5 10 13 6 5 62% 7 66 % Aug - - - - 4 4 4 4 2 65% 5 71 % Sep 3 5 2 3 2 12 7 8 5 74% 8 78 % Oct 2 1 5 - 5 8 8 9 5 82% 8 86 % Nov 4 3 1 2 12 9 7 9 6 91% 7 93 % Dec 4 1 1 1 9 5 8 12 5 100% 7 100 %
Total 37 34 28 27 57 107 96 94 60 100% 102 100 % *estimates from publication date. Issuance amounts are quoted on an auction date basis Source: RBS Rates Strategy
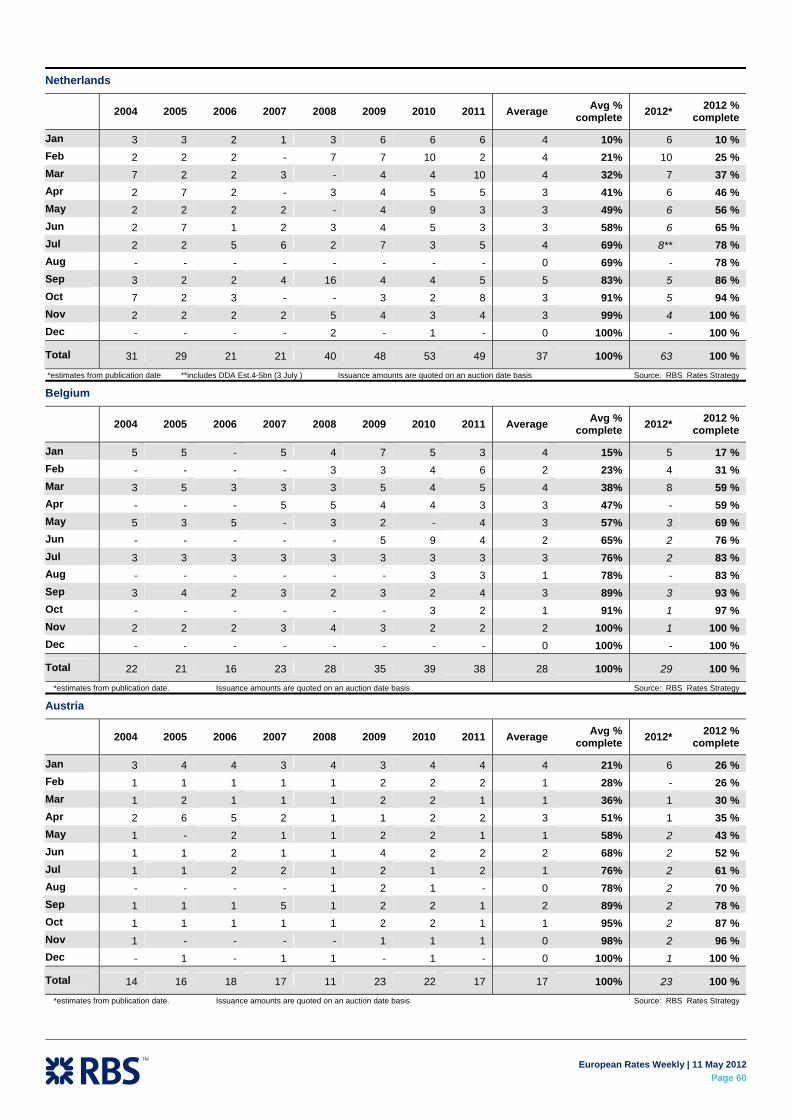
European Rates Weekly | 11 May 2012
Page 60
Netherlands
2004 2005 2006 2007 2008 2009 2010 2011 Average Avg %
complete 2012* 2012 % complete
Jan 3 3 2 1 3 6 6 6 4 10% 6 10 % Feb 2 2 2 - 7 7 10 2 4 21% 10 25 % Mar 7 2 2 3 - 4 4 10 4 32% 7 37 % Apr 2 7 2 - 3 4 5 5 3 41% 6 46 % May 2 2 2 2 - 4 9 3 3 49% 6 56 % Jun 2 7 1 2 3 4 5 3 3 58% 6 65 % Jul 2 2 5 6 2 7 3 5 4 69% 8** 78 % Aug - - - - - - - - 0 69% - 78 % Sep 3 2 2 4 16 4 4 5 5 83% 5 86 % Oct 7 2 3 - - 3 2 8 3 91% 5 94 % Nov 2 2 2 2 5 4 3 4 3 99% 4 100 % Dec - - - - 2 - 1 - 0 100% - 100 %
Total 31 29 21 21 40 48 53 49 37 100% 63 100 % *estimates from publication date **includes DDA Est.4-5bn (3 July ) Issuance amounts are quoted on an auction date basis Source: RBS Rates Strategy
Belgium
2004 2005 2006 2007 2008 2009 2010 2011 Average Avg %
complete 2012* 2012 % complete
Jan 5 5 - 5 4 7 5 3 4 15% 5 17 % Feb - - - - 3 3 4 6 2 23% 4 31 % Mar 3 5 3 3 3 5 4 5 4 38% 8 59 % Apr - - - 5 5 4 4 3 3 47% - 59 % May 5 3 5 - 3 2 - 4 3 57% 3 69 % Jun - - - - - 5 9 4 2 65% 2 76 % Jul 3 3 3 3 3 3 3 3 3 76% 2 83 % Aug - - - - - - 3 3 1 78% - 83 % Sep 3 4 2 3 2 3 2 4 3 89% 3 93 % Oct - - - - - - 3 2 1 91% 1 97 % Nov 2 2 2 3 4 3 2 2 2 100% 1 100 % Dec - - - - - - - - 0 100% - 100 %
Total 22 21 16 23 28 35 39 38 28 100% 29 100 % *estimates from publication date. Issuance amounts are quoted on an auction date basis Source: RBS Rates Strategy
Austria
2004 2005 2006 2007 2008 2009 2010 2011 Average Avg %
complete 2012* 2012 % complete
Jan 3 4 4 3 4 3 4 4 4 21% 6 26 % Feb 1 1 1 1 1 2 2 2 1 28% - 26 % Mar 1 2 1 1 1 2 2 1 1 36% 1 30 % Apr 2 6 5 2 1 1 2 2 3 51% 1 35 % May 1 - 2 1 1 2 2 1 1 58% 2 43 % Jun 1 1 2 1 1 4 2 2 2 68% 2 52 % Jul 1 1 2 2 1 2 1 2 1 76% 2 61 % Aug - - - - 1 2 1 - 0 78% 2 70 % Sep 1 1 1 5 1 2 2 1 2 89% 2 78 % Oct 1 1 1 1 1 2 2 1 1 95% 2 87 % Nov 1 - - - - 1 1 1 0 98% 2 96 % Dec - 1 - 1 1 - 1 - 0 100% 1 100 %
Total 14 16 18 17 11 23 22 17 17 100% 23 100 % *estimates from publication date. Issuance amounts are quoted on an auction date basis Source: RBS Rates Strategy
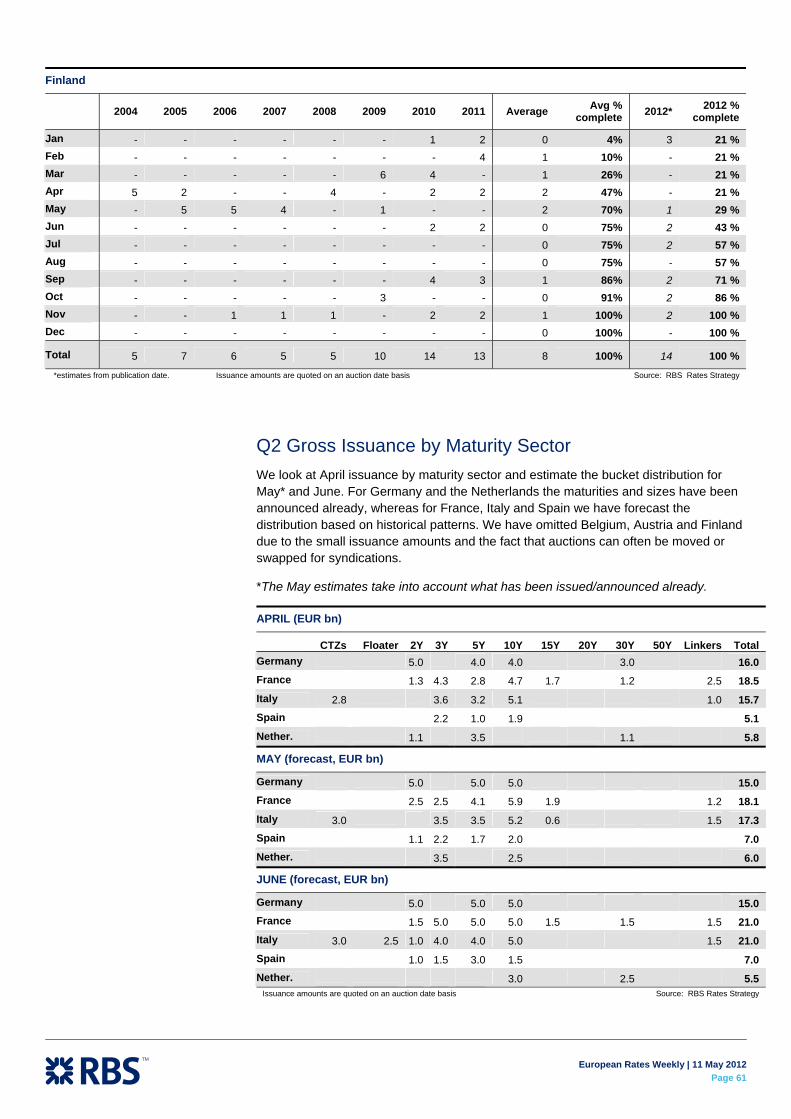
European Rates Weekly | 11 May 2012
Page 61
Finland
2004 2005 2006 2007 2008 2009 2010 2011 Average Avg %
complete 2012* 2012 % complete
Jan - - - - - - 1 2 0 4% 3 21 % Feb - - - - - - - 4 1 10% - 21 % Mar - - - - - 6 4 - 1 26% - 21 % Apr 5 2 - - 4 - 2 2 2 47% - 21 % May - 5 5 4 - 1 - - 2 70% 1 29 % Jun - - - - - - 2 2 0 75% 2 43 % Jul - - - - - - - - 0 75% 2 57 % Aug - - - - - - - - 0 75% - 57 % Sep - - - - - - 4 3 1 86% 2 71 % Oct - - - - - 3 - - 0 91% 2 86 % Nov - - 1 1 1 - 2 2 1 100% 2 100 % Dec - - - - - - - - 0 100% - 100 %
Total 5 7 6 5 5 10 14 13 8 100% 14 100 % *estimates from publication date. Issuance amounts are quoted on an auction date basis Source: RBS Rates Strategy
Q2 Gross Issuance by Maturity Sector We look at April issuance by maturity sector and estimate the bucket distribution for May* and June. For Germany and the Netherlands the maturities and sizes have been announced already, whereas for France, Italy and Spain we have forecast the distribution based on historical patterns. We have omitted Belgium, Austria and Finland due to the small issuance amounts and the fact that auctions can often be moved or swapped for syndications.
*The May estimates take into account what has been issued/announced already.
APRIL (EUR bn)
CTZs Floater 2Y 3Y 5Y 10Y 15Y 20Y 30Y 50Y Linkers Total Germany 5.0 4.0 4.0 3.0 16.0 France 1.3 4.3 2.8 4.7 1.7 1.2 2.5 18.5 Italy 2.8 3.6 3.2 5.1 1.0 15.7 Spain 2.2 1.0 1.9 5.1 Nether. 1.1 3.5 1.1 5.8
MAY (forecast, EUR bn)
Germany 5.0 5.0 5.0 15.0 France 2.5 2.5 4.1 5.9 1.9 1.2 18.1 Italy 3.0 3.5 3.5 5.2 0.6 1.5 17.3 Spain 1.1 2.2 1.7 2.0 7.0 Nether. 3.5 2.5 6.0
JUNE (forecast, EUR bn)
Germany 5.0 5.0 5.0 15.0 France 1.5 5.0 5.0 5.0 1.5 1.5 1.5 21.0 Italy 3.0 2.5 1.0 4.0 4.0 5.0 1.5 21.0 Spain 1.0 1.5 3.0 1.5 7.0 Nether. 3.0 2.5 5.5
Issuance amounts are quoted on an auction date basis Source: RBS Rates Strategy
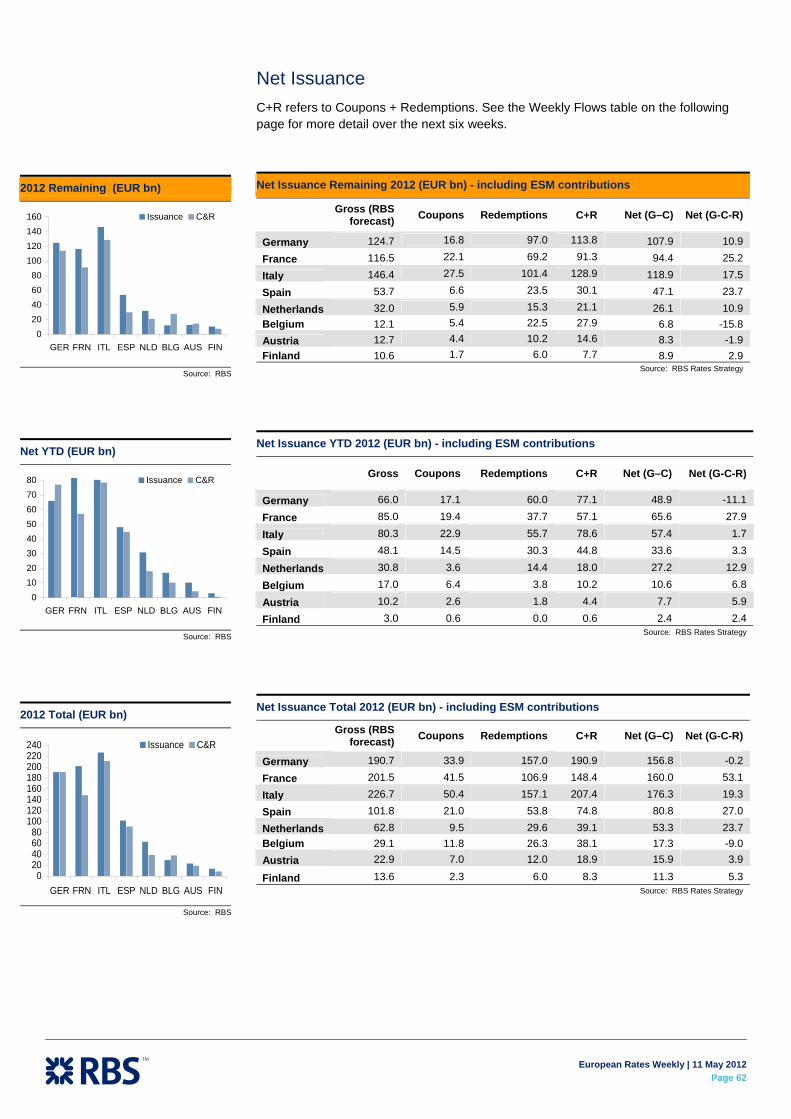
European Rates Weekly | 11 May 2012
Page 62
Net Issuance C+R refers to Coupons + Redemptions. See the Weekly Flows table on the following page for more detail over the next six weeks.
Net Issuance Remaining 2012 (EUR bn) - including ESM contributions
Gross (RBS forecast) Coupons Redemptions C+R Net (G–C) Net (G-C-R)
Germany 124.7 16.8 97.0 113.8 107.9 10.9
France 116.5 22.1 69.2 91.3 94.4 25.2
Italy 146.4 27.5 101.4 128.9 118.9 17.5
Spain 53.7 6.6 23.5 30.1 47.1 23.7
Netherlands 32.0 5.9 15.3 21.1 26.1 10.9 Belgium 12.1 5.4 22.5 27.9 6.8 -15.8 Austria 12.7 4.4 10.2 14.6 8.3 -1.9 Finland 10.6 1.7 6.0 7.7 8.9 2.9
Source: RBS Rates Strategy
Net Issuance YTD 2012 (EUR bn) - including ESM contributions
Gross Coupons Redemptions C+R Net (G–C) Net (G-C-R)
Germany 66.0 17.1 60.0 77.1 48.9 -11.1
France 85.0 19.4 37.7 57.1 65.6 27.9
Italy 80.3 22.9 55.7 78.6 57.4 1.7
Spain 48.1 14.5 30.3 44.8 33.6 3.3
Netherlands 30.8 3.6 14.4 18.0 27.2 12.9
Belgium 17.0 6.4 3.8 10.2 10.6 6.8
Austria 10.2 2.6 1.8 4.4 7.7 5.9
Finland 3.0 0.6 0.0 0.6 2.4 2.4 Source: RBS Rates Strategy
Net Issuance Total 2012 (EUR bn) - including ESM contributions
Gross (RBS forecast) Coupons Redemptions C+R Net (G–C) Net (G-C-R)
Germany 190.7 33.9 157.0 190.9 156.8 -0.2
France 201.5 41.5 106.9 148.4 160.0 53.1
Italy 226.7 50.4 157.1 207.4 176.3 19.3
Spain 101.8 21.0 53.8 74.8 80.8 27.0
Netherlands 62.8 9.5 29.6 39.1 53.3 23.7 Belgium 29.1 11.8 26.3 38.1 17.3 -9.0 Austria 22.9 7.0 12.0 18.9 15.9 3.9
Finland 13.6 2.3 6.0 8.3 11.3 5.3 Source: RBS Rates Strategy
2012 Remaining (EUR bn)
020406080
100120140160
GER FRN ITL ESP NLD BLG AUS FIN
Issuance C&R
Source: RBS
Net YTD (EUR bn)
01020304050607080
GER FRN ITL ESP NLD BLG AUS FIN
Issuance C&R
Source: RBS
2012 Total (EUR bn)
020406080
100120140160180200220240
GER FRN ITL ESP NLD BLG AUS FIN
Issuance C&R
Source: RBS
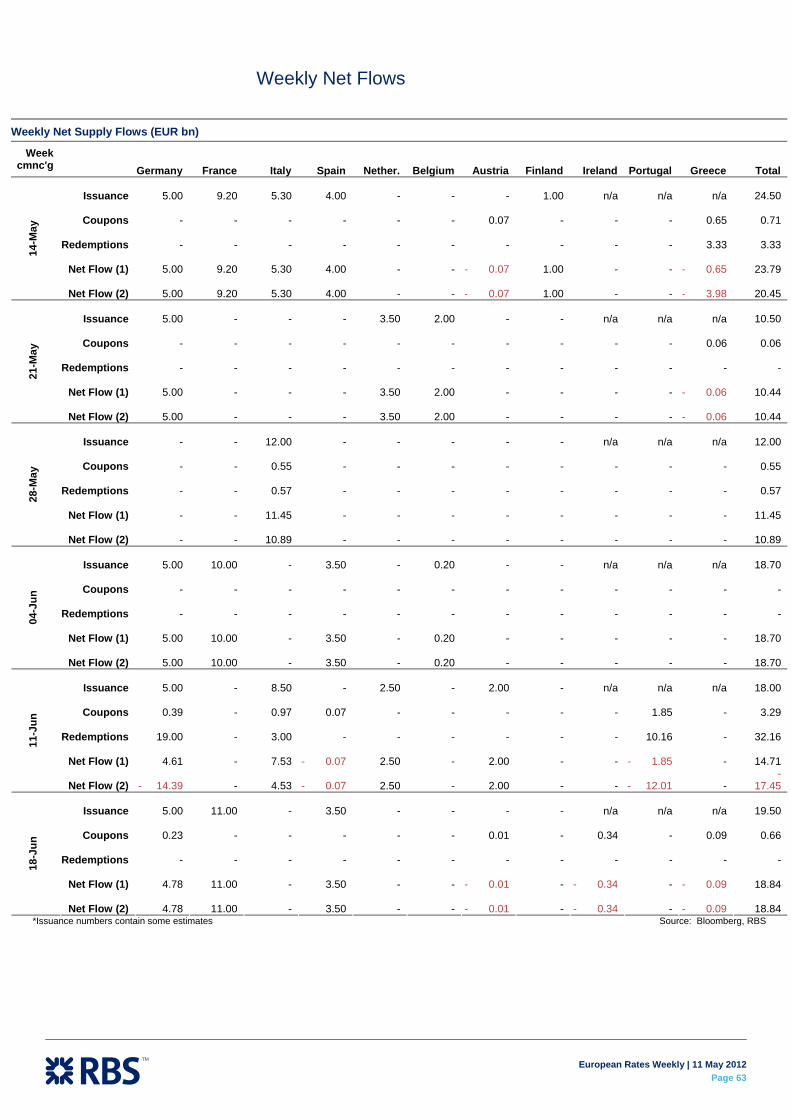
European Rates Weekly | 11 May 2012
Page 63
Weekly Net Flows
*Issuance numbers contain some estimates Source: Bloomberg, RBS
Weekly Net Supply Flows (EUR bn)
Week cmnc'g
Germany France Italy Spain Nether. Belgium Austria Finland Ireland Portugal Greece Total
Issuance 5.00 9.20 5.30 4.00
-
- - 1.00 n/a n/a n/a
24.50
Coupons - - - -
-
- 0.07 - - - 0.65
0.71
Redemptions - - - -
-
- - - - - 3.33
3.33
Net Flow (1) 5.00 9.20 5.30 4.00
-
- - 0.07 1.00 - - - 0.65
23.79
14-M
ay
Net Flow (2) 5.00 9.20 5.30 4.00
-
- - 0.07 1.00 - - - 3.98
20.45
Issuance 5.00 - - -
3.50
2.00 - - n/a n/a n/a
10.50
Coupons - - - -
-
- - - - - 0.06
0.06
Redemptions - - - -
-
- - - - - -
-
Net Flow (1) 5.00 - - -
3.50
2.00 - - - - - 0.06
10.44
21-M
ay
Net Flow (2) 5.00 - - -
3.50
2.00 - - - - - 0.06
10.44
Issuance - - 12.00 -
-
- - - n/a n/a n/a
12.00
Coupons - - 0.55 -
-
- - - - - -
0.55
Redemptions - - 0.57 -
-
- - - - - -
0.57
Net Flow (1) - - 11.45 -
-
- - - - - -
11.45
28-M
ay
Net Flow (2) - - 10.89 -
-
- - - - - -
10.89
Issuance 5.00 10.00 - 3.50
-
0.20 - - n/a n/a n/a
18.70
Coupons - - - -
-
- - - - - -
-
Redemptions - - - -
-
- - - - - -
-
Net Flow (1) 5.00 10.00 - 3.50
-
0.20 - - - - -
18.70
04-J
un
Net Flow (2) 5.00 10.00 - 3.50
-
0.20 - - - - -
18.70
Issuance 5.00 - 8.50 -
2.50
- 2.00 - n/a n/a n/a
18.00
Coupons 0.39 - 0.97 0.07
-
- - - - 1.85 -
3.29
Redemptions 19.00 - 3.00 -
-
- - - - 10.16 -
32.16
Net Flow (1) 4.61 - 7.53 - 0.07
2.50
- 2.00 - - - 1.85 -
14.71
11-J
un
Net Flow (2) - 14.39 - 4.53 - 0.07
2.50
- 2.00 - - - 12.01 - -
17.45
Issuance 5.00 11.00 - 3.50
-
- - - n/a n/a n/a
19.50
Coupons 0.23 - - -
-
- 0.01 - 0.34 - 0.09
0.66
Redemptions - - - -
-
- - - - - -
-
Net Flow (1) 4.78 11.00 - 3.50
-
- - 0.01 - - 0.34 - - 0.09
18.84
18-J
un
Net Flow (2) 4.78 11.00 - 3.50
-
- - 0.01 - - 0.34 - - 0.09
18.84
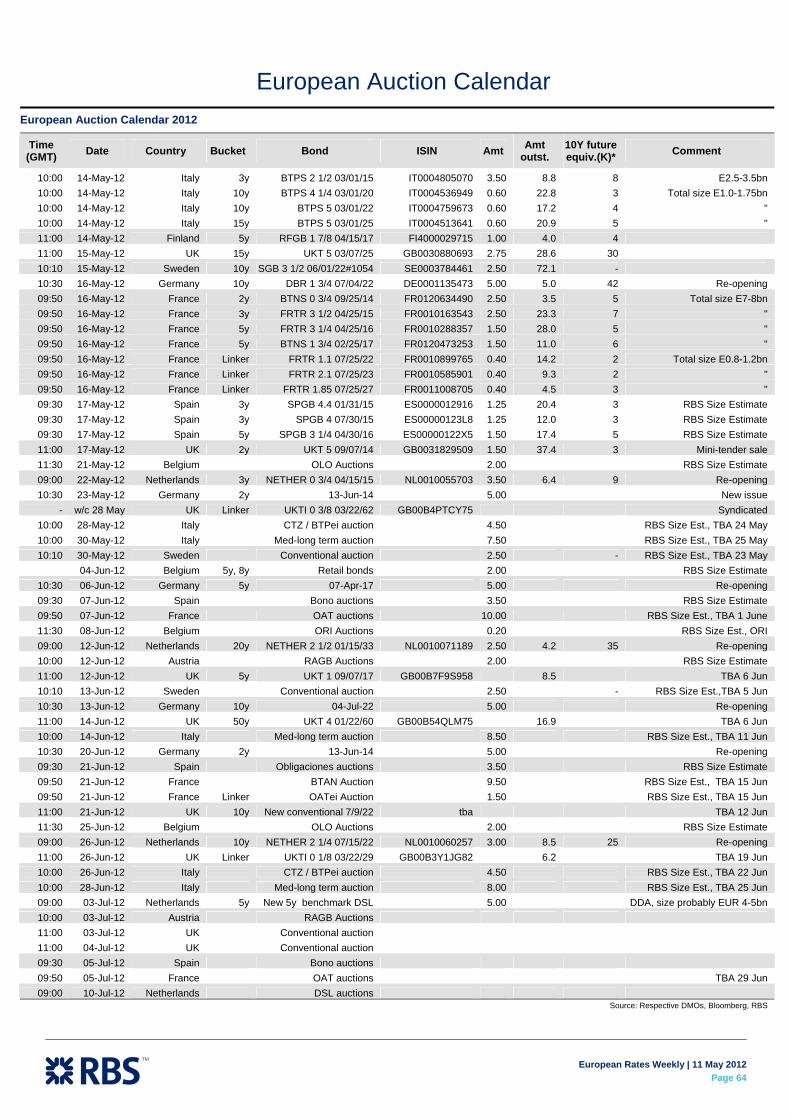
European Rates Weekly | 11 May 2012
Page 64
European Auction Calendar
European Auction Calendar 2012
Time (GMT) Date Country Bucket Bond ISIN Amt Amt
outst. 10Y future equiv.(K)* Comment
10:00 14-May-12 Italy 3y BTPS 2 1/2 03/01/15 IT0004805070 3.50 8.8 8 E2.5-3.5bn 10:00 14-May-12 Italy 10y BTPS 4 1/4 03/01/20 IT0004536949 0.60 22.8 3 Total size E1.0-1.75bn 10:00 14-May-12 Italy 10y BTPS 5 03/01/22 IT0004759673 0.60 17.2 4 " 10:00 14-May-12 Italy 15y BTPS 5 03/01/25 IT0004513641 0.60 20.9 5 " 11:00 14-May-12 Finland 5y RFGB 1 7/8 04/15/17 FI4000029715 1.00 4.0 4 11:00 15-May-12 UK 15y UKT 5 03/07/25 GB0030880693 2.75 28.6 30 10:10 15-May-12 Sweden 10y SGB 3 1/2 06/01/22#1054 SE0003784461 2.50 72.1 - 10:30 16-May-12 Germany 10y DBR 1 3/4 07/04/22 DE0001135473 5.00 5.0 42 Re-opening 09:50 16-May-12 France 2y BTNS 0 3/4 09/25/14 FR0120634490 2.50 3.5 5 Total size E7-8bn 09:50 16-May-12 France 3y FRTR 3 1/2 04/25/15 FR0010163543 2.50 23.3 7 " 09:50 16-May-12 France 5y FRTR 3 1/4 04/25/16 FR0010288357 1.50 28.0 5 " 09:50 16-May-12 France 5y BTNS 1 3/4 02/25/17 FR0120473253 1.50 11.0 6 " 09:50 16-May-12 France Linker FRTR 1.1 07/25/22 FR0010899765 0.40 14.2 2 Total size E0.8-1.2bn 09:50 16-May-12 France Linker FRTR 2.1 07/25/23 FR0010585901 0.40 9.3 2 " 09:50 16-May-12 France Linker FRTR 1.85 07/25/27 FR0011008705 0.40 4.5 3 " 09:30 17-May-12 Spain 3y SPGB 4.4 01/31/15 ES0000012916 1.25 20.4 3 RBS Size Estimate 09:30 17-May-12 Spain 3y SPGB 4 07/30/15 ES00000123L8 1.25 12.0 3 RBS Size Estimate 09:30 17-May-12 Spain 5y SPGB 3 1/4 04/30/16 ES00000122X5 1.50 17.4 5 RBS Size Estimate 11:00 17-May-12 UK 2y UKT 5 09/07/14 GB0031829509 1.50 37.4 3 Mini-tender sale 11:30 21-May-12 Belgium OLO Auctions 2.00 RBS Size Estimate 09:00 22-May-12 Netherlands 3y NETHER 0 3/4 04/15/15 NL0010055703 3.50 6.4 9 Re-opening 10:30 23-May-12 Germany 2y 13-Jun-14 5.00 New issue
- w/c 28 May UK Linker UKTI 0 3/8 03/22/62 GB00B4PTCY75 Syndicated 10:00 28-May-12 Italy CTZ / BTPei auction 4.50 RBS Size Est., TBA 24 May 10:00 30-May-12 Italy Med-long term auction 7.50 RBS Size Est., TBA 25 May 10:10 30-May-12 Sweden Conventional auction 2.50 - RBS Size Est., TBA 23 May
04-Jun-12 Belgium 5y, 8y Retail bonds 2.00 RBS Size Estimate 10:30 06-Jun-12 Germany 5y 07-Apr-17 5.00 Re-opening 09:30 07-Jun-12 Spain Bono auctions 3.50 RBS Size Estimate 09:50 07-Jun-12 France OAT auctions 10.00 RBS Size Est., TBA 1 June 11:30 08-Jun-12 Belgium ORI Auctions 0.20 RBS Size Est., ORI 09:00 12-Jun-12 Netherlands 20y NETHER 2 1/2 01/15/33 NL0010071189 2.50 4.2 35 Re-opening 10:00 12-Jun-12 Austria RAGB Auctions 2.00 RBS Size Estimate 11:00 12-Jun-12 UK 5y UKT 1 09/07/17 GB00B7F9S958 8.5 TBA 6 Jun 10:10 13-Jun-12 Sweden Conventional auction 2.50 - RBS Size Est.,TBA 5 Jun 10:30 13-Jun-12 Germany 10y 04-Jul-22 5.00 Re-opening 11:00 14-Jun-12 UK 50y UKT 4 01/22/60 GB00B54QLM75 16.9 TBA 6 Jun 10:00 14-Jun-12 Italy Med-long term auction 8.50 RBS Size Est., TBA 11 Jun 10:30 20-Jun-12 Germany 2y 13-Jun-14 5.00 Re-opening 09:30 21-Jun-12 Spain Obligaciones auctions 3.50 RBS Size Estimate 09:50 21-Jun-12 France BTAN Auction 9.50 RBS Size Est., TBA 15 Jun 09:50 21-Jun-12 France Linker OATei Auction 1.50 RBS Size Est., TBA 15 Jun 11:00 21-Jun-12 UK 10y New conventional 7/9/22 tba TBA 12 Jun 11:30 25-Jun-12 Belgium OLO Auctions 2.00 RBS Size Estimate 09:00 26-Jun-12 Netherlands 10y NETHER 2 1/4 07/15/22 NL0010060257 3.00 8.5 25 Re-opening 11:00 26-Jun-12 UK Linker UKTI 0 1/8 03/22/29 GB00B3Y1JG82 6.2 TBA 19 Jun 10:00 26-Jun-12 Italy CTZ / BTPei auction 4.50 RBS Size Est., TBA 22 Jun 10:00 28-Jun-12 Italy Med-long term auction 8.00 RBS Size Est., TBA 25 Jun 09:00 03-Jul-12 Netherlands 5y New 5y benchmark DSL 5.00 DDA, size probably EUR 4-5bn 10:00 03-Jul-12 Austria RAGB Auctions 11:00 03-Jul-12 UK Conventional auction 11:00 04-Jul-12 UK Conventional auction 09:30 05-Jul-12 Spain Bono auctions 09:50 05-Jul-12 France OAT auctions TBA 29 Jun 09:00 10-Jul-12 Netherlands DSL auctions
Source: Respective DMOs, Bloomberg, RBS
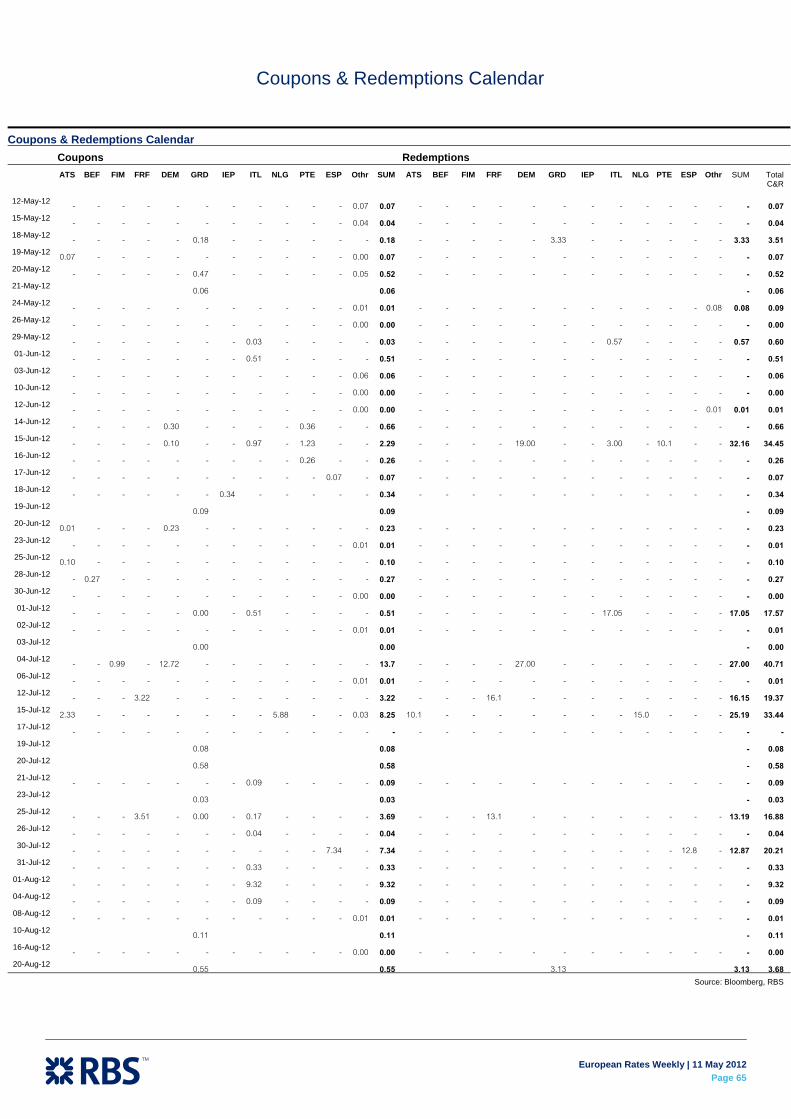
European Rates Weekly | 11 May 2012
Page 65
Coupons & Redemptions Calendar
Coupons & Redemptions Calendar Coupons Redemptions
ATS BEF FIM FRF DEM GRD IEP ITL NLG PTE ESP Othr SUM ATS BEF FIM FRF DEM GRD IEP ITL NLG PTE ESP Othr SUM TotalC&R
12-May-12 -
-
-
-
-
-
-
-
-
-
-
0.07
0.07
-
-
-
-
-
-
-
-
-
-
-
-
-
0.07
15-May-12 -
-
-
-
-
-
-
-
-
-
-
0.04
0.04
-
-
-
-
-
-
-
-
-
-
-
-
-
0.04
18-May-12 -
-
-
-
-
0.18
-
-
-
-
-
-
0.18
-
-
-
-
-
3.33
-
-
-
-
-
-
3.33
3.51
19-May-12 0.07
-
-
-
-
-
-
-
-
-
-
0.00
0.07
-
-
-
-
-
-
-
-
-
-
-
-
-
0.07
20-May-12 -
-
-
-
-
0.47
-
-
-
-
-
0.05
0.52
-
-
-
-
-
-
-
-
-
-
-
-
-
0.52
21-May-12 0.06
0.06
-
0.06
24-May-12 -
-
-
-
-
-
-
-
-
-
-
0.01
0.01
-
-
-
-
-
-
-
-
-
-
-
0.08
0.08
0.09
26-May-12 -
-
-
-
-
-
-
-
-
-
-
0.00
0.00
-
-
-
-
-
-
-
-
-
-
-
-
-
0.00
29-May-12 -
-
-
-
-
-
-
0.03
-
-
-
-
0.03
-
-
-
-
-
-
-
0.57
-
-
-
-
0.57
0.60
01-Jun-12 -
-
-
-
-
-
-
0.51
-
-
-
-
0.51
-
-
-
-
-
-
-
-
-
-
-
-
-
0.51
03-Jun-12 -
-
-
-
-
-
-
-
-
-
-
0.06
0.06
-
-
-
-
-
-
-
-
-
-
-
-
-
0.06
10-Jun-12 -
-
-
-
-
-
-
-
-
-
-
0.00
0.00
-
-
-
-
-
-
-
-
-
-
-
-
-
0.00
12-Jun-12 -
-
-
-
-
-
-
-
-
-
-
0.00
0.00
-
-
-
-
-
-
-
-
-
-
-
0.01
0.01
0.01
14-Jun-12 -
-
-
-
0.30
-
-
-
-
0.36
-
-
0.66
-
-
-
-
-
-
-
-
-
-
-
-
-
0.66
15-Jun-12 -
-
-
-
0.10
-
-
0.97
-
1.23
-
-
2.29
-
-
-
-
19.00
-
-
3.00
-
10.1
-
-
32.16
34.45
16-Jun-12 -
-
-
-
-
-
-
-
-
0.26
-
-
0.26
-
-
-
-
-
-
-
-
-
-
-
-
-
0.26
17-Jun-12 -
-
-
-
-
-
-
-
-
-
0.07
-
0.07
-
-
-
-
-
-
-
-
-
-
-
-
-
0.07
18-Jun-12 -
-
-
-
-
-
0.34
-
-
-
-
-
0.34
-
-
-
-
-
-
-
-
-
-
-
-
-
0.34
19-Jun-12 0.09
0.09
-
0.09
20-Jun-12 0.01
-
-
-
0.23
-
-
-
-
-
-
-
0.23
-
-
-
-
-
-
-
-
-
-
-
-
-
0.23
23-Jun-12 -
-
-
-
-
-
-
-
-
-
-
0.01
0.01
-
-
-
-
-
-
-
-
-
-
-
-
-
0.01
25-Jun-12 0.10
-
-
-
-
-
-
-
-
-
-
-
0.10
-
-
-
-
-
-
-
-
-
-
-
-
-
0.10
28-Jun-12 -
0.27
-
-
-
-
-
-
-
-
-
-
0.27
-
-
-
-
-
-
-
-
-
-
-
-
-
0.27
30-Jun-12 -
-
-
-
-
-
-
-
-
-
-
0.00
0.00
-
-
-
-
-
-
-
-
-
-
-
-
-
0.00
01-Jul-12 -
-
-
-
-
0.00
-
0.51
-
-
-
-
0.51
-
-
-
-
-
-
-
17.05
-
-
-
-
17.05
17.57
02-Jul-12 -
-
-
-
-
-
-
-
-
-
-
0.01
0.01
-
-
-
-
-
-
-
-
-
-
-
-
-
0.01
03-Jul-12 0.00
0.00
-
0.00
04-Jul-12 -
-
0.99
-
12.72
-
-
-
-
-
-
-
13.7
-
-
-
-
27.00
-
-
-
-
-
-
-
27.00
40.71
06-Jul-12 -
-
-
-
-
-
-
-
-
-
-
0.01
0.01
-
-
-
-
-
-
-
-
-
-
-
-
-
0.01
12-Jul-12 -
-
-
3.22
-
-
-
-
-
-
-
-
3.22
-
-
-
16.1
-
-
-
-
-
-
-
-
16.15
19.37
15-Jul-12 2.33
-
-
-
-
-
-
-
5.88
-
-
0.03
8.25
10.1
-
-
-
-
-
-
-
15.0
-
-
-
25.19
33.44
17-Jul-12 -
-
-
-
-
-
-
-
-
-
-
-
-
-
-
-
-
-
-
-
-
-
-
-
-
-
-
19-Jul-12 0.08
0.08
-
0.08
20-Jul-12 0.58
0.58
-
0.58
21-Jul-12 -
-
-
-
-
-
-
0.09
-
-
-
-
0.09
-
-
-
-
-
-
-
-
-
-
-
-
-
0.09
23-Jul-12 0.03
0.03
-
0.03
25-Jul-12 -
-
-
3.51
-
0.00
-
0.17
-
-
-
-
3.69
-
-
-
13.1
-
-
-
-
-
-
-
-
13.19
16.88
26-Jul-12 -
-
-
-
-
-
-
0.04
-
-
-
-
0.04
-
-
-
-
-
-
-
-
-
-
-
-
-
0.04
30-Jul-12 -
-
-
-
-
-
-
-
-
-
7.34
-
7.34
-
-
-
-
-
-
-
-
-
-
12.8
-
12.87
20.21
31-Jul-12 -
-
-
-
-
-
-
0.33
-
-
-
-
0.33
-
-
-
-
-
-
-
-
-
-
-
-
-
0.33
01-Aug-12 -
-
-
-
-
-
-
9.32
-
-
-
-
9.32
-
-
-
-
-
-
-
-
-
-
-
-
-
9.32
04-Aug-12 -
-
-
-
-
-
-
0.09
-
-
-
-
0.09
-
-
-
-
-
-
-
-
-
-
-
-
-
0.09
08-Aug-12 -
-
-
-
-
-
-
-
-
-
-
0.01
0.01
-
-
-
-
-
-
-
-
-
-
-
-
-
0.01
10-Aug-12 0.11
0.11
-
0.11
16-Aug-12 -
-
-
-
-
-
-
-
-
-
-
0.00
0.00
-
-
-
-
-
-
-
-
-
-
-
-
-
0.00
20-Aug-12 0.55
0.55
3.13
3.13
3.68
Source: Bloomberg, RBS

European Rates Weekly | 11 May 2012
Page 66
Portfolio of Trade Ideas Trade Performance *Trades that have hit targets/stop this wk have P&L shown green (red); or blue if contract has expired / taken off for another reason Levels Cash Exposure Rationale Details Delta Vega Open Now* Target Stop Target Stop P&L Write-up EUR
Sell 3y1y ATM payer
Roll-down makes 60% return in first year
Sell 1.87 strike 3y1y payer 0.0k 187 bp 130 bp 125 bp 225 bp 62 bp -38 bp € 29,150
Volatility Weekly 23Jan
Bearish Sep Euribor
Correlation to FRA/OIS widening risk
Sep Euribor risk reversal: long 99 put short 99.5 call -2.0k 0.0 ticks 0.0 ticks 10 ticks -7 ticks 10 ticks -7 ticks € 5,000
Weekly: April-5
Germany 5y CDS
Failure to resolve crisis pushes EMU CDS higher.
Buy 5y German CDS 10.0k 98 bp 87 bp 200 bp 65 bp 102 bp -33 bp -€110,000
Year End: Trade 3
2s5s10s fly
Attractive levels and rolls down to -16.3bp in spot. Aided by 5s10s flattening view
Receive the € 2s5s10s fly, 1-year forward starting. 20.6k 16.3 bp 3.5 bp -16 bp 32 bp 32 bp -16 bp € 125,873
Year End: Trade 4
FRA/OIS widener
Long lived funding stress means FRA/OIS continues to remain wide
Buy 2y2y FRA/OIS 10.6k 34 bp 53 bp 75 bp 20 bp 42 bp -14 bp € 189,437
Year End: Trade 7
EUR 10s30s 10y forward
We expect ALM paying in long rates and long slopes to push aggressively higher
10s30s 10y forward steepener 10.9k -54 bp -49 bp -30 bp -70 bp 24 bp -16 bp € 54,347
Year End: Trade 8
EUR 20s30s
Alternative to 10s30s 10y forward. Levels driven more inverted by year end REC flows
EUR 20s30s steepener 10.7k -19 bp -9 bp 10 bp -43 bp 29 bp -24 bp € 107,846
Year End: Trade 10
EUR 10s30s 2y forward
Favourable carry and fits with our long-end steepening theme
EUR 10s30s 2y forward steepener 10.8k -29 bp 0 bp 10 bp -43 bp 39 bp -14 bp € 309,543
Year End: Trade 9
Long Denmark vs Finland 5y CDS
Euro 'outs' should outperform euro 'ins'. Denmark should be considered a safe haven.
5y CDS 2:1 (beta) weighted -10.0k -20 bp -30 bp -80 bp 40 bp 60 bp -60 bp € 100,000
Year End: Trade 12
Euribor flattener
The Euribor curve is steep, and greens and blues are yet to catch the bid that reflects deteriorating Euro economy
Sell the ERM3-ERM4 Spread 10.0k 49 bp 25 bp 20 bp 55 bp 29 bp -6 bp € 235,000
Year End: Trade 23
Jun-12 Euribor bearish options
Front euribors rich, interbank stress to stay high.
Buy 98.875 / sell 98.625 0.0k 6.0 ticks 0.5 ticks 25 ticks 0 ticks 19 ticks -6 ticks -€ 55,000
Year End: Trade 24
Rec EUR 6y Pay 2f 1y
Richening of the belly should mean levels normalise
Rec 6y Pay 2f 1y 10.3k 54 bp 54 bp 40 bp 62 bp 14 bp -8 bp € 1,695
Early 2012 thoughts
SPGB 2037 vs. 2032
Long end of the SPGB curve not showing any price differentiation, which is likely to change over 2012
Long SPGB 37s versus 32s on price differential 9.6k -2.4 bp -4.4 bp -40 bp 5 bp 38 bp -7 bp -€ 9,734
Early 2012 thoughts
Buy USD 2y2y payers against EUR
If economic improvement and near-term inflation pressures take hold, the front end of the US should come under pressure first.
Buy USD 2y2y payers against EUR 0.0k 53 bp 30 bp 50 bp -25 bp € 5,147
Vol Weekly 06 Jan-12
Bull steepening long EUR
Solvency II to steepen long end. Risk is bear flattening.
Buy 1y20y receivers ATM-25bp and sell 1y30y receivers ATM-27.5bp 0.0k 0.0k -24 bp -12 bp 15 bp -40 bp 39 bp -16 bp € 79,165
Year End: Trade 34
Bull steepening broad curve EUR
Solvency II to steepen long end. QE to depress out to 10 years.
Buy 1y5y ATM receivers and sell 1y30y receivers 15bp OTM, DV01 neutral at expiry 0.0k 0.0k 35 bp 84 bp 95 bp 5 bp 60 bp -30 bp € 380,222
Year End: Trade 35
Sell correlation in EUR
Convergence to US curve dynamics. Front end pinned and FRA/OIS may be negatively correlated with long end.
Buy 1y single-look 2y/30y capfloors vs 1y30y swaption straddles 0.0k 0.0k 0 vols -6 vols 15 vols
-10 vols -€ 63,088
Year End: Trade 36
German 2s5s10s fly
5y is still the sweet spot but we expect a yield grab for 10y
Pay the belly in the German 2s5s10s -19.5k -43 bp -47 bp -25 bp -50 bp 18 bp -7 bp -€ 63,167
Weekly 27 Jan-12
Long Dec ECB OIS
Expect long term ECB liquidity to bring down Eonia-deposit rate spread
Receive Dec-12 ECB OIS -10.2k 37 bp 27 bp 20 bp 45 bp 17 bp -8 bp € 95,138
Weekly 27 Jan-12
Rec EUR 3F1Y
3m carry and roll is worth 17bp and is the highest on the 1Y forward curve Rec EUR 3F1Y -10.6k 186 bp 149 bp 128 bp 210 bp 58 bp -24 bp € 392,776
Weekly 27 Jan-12
Long-end steepener, 40F10Y vs 30F10Y
50y REC flow done. Long-end cheapening in response to Dutch pensions sector & Solvency II.
Long-end steepener, 40F10Y vs 30F10Y -8.7k -12.0 bp -26.4 bp -45 bp 0 bp 33 bp -12 bp € 126,055
Weekly 3 Feb-12
Long belly in EUR 2s5s30s 1Y forward
Roll-down makes 52bp over 1 year.
Long belly in EUR 2s5s30s 1Y forward 20.6k -3.2 bp -27.8 bp -53 bp -12 bp 50 bp -9 bp € 240,199
Weekly 3 Feb-12
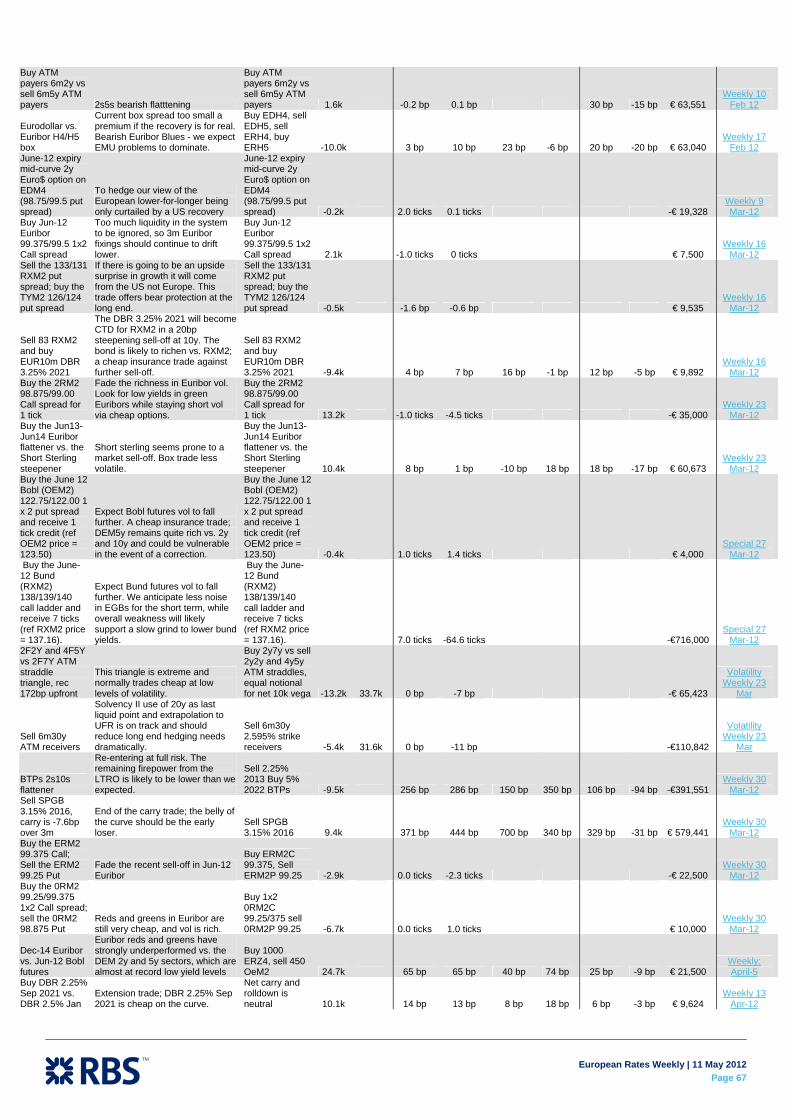
European Rates Weekly | 11 May 2012
Page 67
Buy ATM payers 6m2y vs sell 6m5y ATM payers 2s5s bearish flatttening
Buy ATM payers 6m2y vs sell 6m5y ATM payers 1.6k -0.2 bp 0.1 bp 30 bp -15 bp € 63,551
Weekly 10 Feb 12
Eurodollar vs. Euribor H4/H5 box
Current box spread too small a premium if the recovery is for real. Bearish Euribor Blues - we expect EMU problems to dominate.
Buy EDH4, sell EDH5, sell ERH4, buy ERH5 -10.0k 3 bp 10 bp 23 bp -6 bp 20 bp -20 bp € 63,040
Weekly 17 Feb 12
June-12 expiry mid-curve 2y Euro$ option on EDM4 (98.75/99.5 put spread)
To hedge our view of the European lower-for-longer being only curtailed by a US recovery
June-12 expiry mid-curve 2y Euro$ option on EDM4 (98.75/99.5 put spread) -0.2k 2.0 ticks 0.1 ticks -€ 19,328
Weekly 9 Mar-12
Buy Jun-12 Euribor 99.375/99.5 1x2 Call spread
Too much liquidity in the system to be ignored, so 3m Euribor fixings should continue to drift lower.
Buy Jun-12 Euribor 99.375/99.5 1x2 Call spread 2.1k -1.0 ticks 0 ticks € 7,500
Weekly 16 Mar-12
Sell the 133/131 RXM2 put spread; buy the TYM2 126/124 put spread
If there is going to be an upside surprise in growth it will come from the US not Europe. This trade offers bear protection at the long end.
Sell the 133/131 RXM2 put spread; buy the TYM2 126/124 put spread -0.5k -1.6 bp -0.6 bp € 9,535
Weekly 16 Mar-12
Sell 83 RXM2 and buy EUR10m DBR 3.25% 2021
The DBR 3.25% 2021 will become CTD for RXM2 in a 20bp steepening sell-off at 10y. The bond is likely to richen vs. RXM2; a cheap insurance trade against further sell-off.
Sell 83 RXM2 and buy EUR10m DBR 3.25% 2021 -9.4k 4 bp 7 bp 16 bp -1 bp 12 bp -5 bp € 9,892
Weekly 16 Mar-12
Buy the 2RM2 98.875/99.00 Call spread for 1 tick
Fade the richness in Euribor vol. Look for low yields in green Euribors while staying short vol via cheap options.
Buy the 2RM2 98.875/99.00 Call spread for 1 tick 13.2k -1.0 ticks -4.5 ticks -€ 35,000
Weekly 23 Mar-12
Buy the Jun13-Jun14 Euribor flattener vs. the Short Sterling steepener
Short sterling seems prone to a market sell-off. Box trade less volatile.
Buy the Jun13-Jun14 Euribor flattener vs. the Short Sterling steepener 10.4k 8 bp 1 bp -10 bp 18 bp 18 bp -17 bp € 60,673
Weekly 23 Mar-12
Buy the June 12 Bobl (OEM2) 122.75/122.00 1 x 2 put spread and receive 1 tick credit (ref OEM2 price = 123.50)
Expect Bobl futures vol to fall further. A cheap insurance trade; DEM5y remains quite rich vs. 2y and 10y and could be vulnerable in the event of a correction.
Buy the June 12 Bobl (OEM2) 122.75/122.00 1 x 2 put spread and receive 1 tick credit (ref OEM2 price = 123.50) -0.4k 1.0 ticks 1.4 ticks € 4,000
Special 27 Mar-12
Buy the June-12 Bund (RXM2) 138/139/140 call ladder and receive 7 ticks (ref RXM2 price = 137.16).
Expect Bund futures vol to fall further. We anticipate less noise in EGBs for the short term, while overall weakness will likely support a slow grind to lower bund yields.
Buy the June-12 Bund (RXM2) 138/139/140 call ladder and receive 7 ticks (ref RXM2 price = 137.16). 7.0 ticks -64.6 ticks -€716,000
Special 27 Mar-12
2F2Y and 4F5Y vs 2F7Y ATM straddle triangle, rec 172bp upfront
This triangle is extreme and normally trades cheap at low levels of volatility.
Buy 2y7y vs sell 2y2y and 4y5y ATM straddles, equal notional for net 10k vega -13.2k 33.7k 0 bp -7 bp -€ 65,423
Volatility Weekly 23
Mar
Sell 6m30y ATM receivers
Solvency II use of 20y as last liquid point and extrapolation to UFR is on track and should reduce long end hedging needs dramatically.
Sell 6m30y 2.595% strike receivers -5.4k 31.6k 0 bp -11 bp -€110,842
Volatility Weekly 23
Mar
BTPs 2s10s flattener
Re-entering at full risk. The remaining firepower from the LTRO is likely to be lower than we expected.
Sell 2.25% 2013 Buy 5% 2022 BTPs -9.5k 256 bp 286 bp 150 bp 350 bp 106 bp -94 bp -€391,551
Weekly 30 Mar-12
Sell SPGB 3.15% 2016, carry is -7.6bp over 3m
End of the carry trade; the belly of the curve should be the early loser.
Sell SPGB 3.15% 2016 9.4k 371 bp 444 bp 700 bp 340 bp 329 bp -31 bp € 579,441
Weekly 30 Mar-12
Buy the ERM2 99.375 Call; Sell the ERM2 99.25 Put
Fade the recent sell-off in Jun-12 Euribor
Buy ERM2C 99.375, Sell ERM2P 99.25 -2.9k 0.0 ticks -2.3 ticks -€ 22,500
Weekly 30 Mar-12
Buy the 0RM2 99.25/99.375 1x2 Call spread; sell the 0RM2 98.875 Put
Reds and greens in Euribor are still very cheap, and vol is rich.
Buy 1x2 0RM2C 99.25/375 sell 0RM2P 99.25 -6.7k 0.0 ticks 1.0 ticks € 10,000
Weekly 30 Mar-12
Dec-14 Euribor vs. Jun-12 Bobl futures
Euribor reds and greens have strongly underperformed vs. the DEM 2y and 5y sectors, which are almost at record low yield levels
Buy 1000 ERZ4, sell 450 OeM2 24.7k 65 bp 65 bp 40 bp 74 bp 25 bp -9 bp € 21,500
Weekly: April-5
Buy DBR 2.25% Sep 2021 vs. DBR 2.5% Jan
Extension trade; DBR 2.25% Sep 2021 is cheap on the curve.
Net carry and rolldown is neutral 10.1k 14 bp 13 bp 8 bp 18 bp 6 bp -3 bp € 9,624
Weekly 13 Apr-12

European Rates Weekly | 11 May 2012
Page 68
2021 DUN2 110.8/111.0 1x2 call spread, cost 1 tick
Trading the negative yield view in 2y Germany; expect tensions to build more seriously around mid-year.
July option expiry on Schatz Sep-12 future 1.3k -1.0 ticks -0.4 ticks € 6,000
Weekly 13 Apr-12
Sell BTP 4.5% 2026, buy SPGB 5.9% 2026
Weaker Italian budget targets will see more speculation on eventual bailout risk; also trade to catch index shifts
ASW spread 65bp at entry -9.9k 48 bp 58 bp 10 bp 85 bp 38 bp -37 bp -€ 88,777
Special 19 Apr-12
Buy NETHER 3.25% 2015, sell RFGB 4.25% 2015
Budget consolidation effort and continued domestic support + demand from intl investors looking for core Euro risk with a pick-up.
Yield pick-up 5.1bp -9.9k 5 bp 6 bp -5 bp 10 bp 10 bp 5 bp -€ 5,117
Special 19 Apr-12
TECHNICAL TRADE: Sell 5y Spain
Pullback level 4.53% seen in generic yield 18 Apr. A possible short-term relief to the 200d moving average should be faded.
Sell the SPGB 5.5% 2017 9.8k 471 bp 509 bp 538 bp 425 bp 67 bp -46 bp € 318,569
Weekly 13 Apr-12
Sell 1y mid-curve ATM straddle on Dec13 Euribor; buy the 2y on Dec14 Euribor
Play the relative movement between the two contracts and volatility within the calendar spread. Net cost 15 ticks
Buy 0RZ2C & 0RZ2P 99.125; Sell 2RZ2C & 2RZ2P 98.625 4.2k 15 bp 10 bp -€ 4,400
Weekly 20 Apr-12
Buy Sep-13 IMM dated EUR OIS vs. USD OIS
ECB risk premium rising vs. USD. ECB easing will be a strong lower-for-longer message - failure to ease will fwd risk premium fall; US data is better than EMU
Roll on 3m is favourable by 1.7bp 10.0k 29 bp 19 bp 10 bp 34 bp 19 bp 5 bp € 103,750
Weekly 20 Apr-12
Rec 2F2Y Pay 4F2Y (2s4s6s fly)
Non-directional fly trade opportunity; 4y is cheap and 4F2Y too low given the level of the 2F2Y.
Roll is -0.7bpover 3m 10.2k 87 bp 83 bp 105 bp 80 bp 18 bp -7 bp -€ 44,546
Weekly 20 Apr-12
Buy OAT 3.75% 2021 on fly vs. 4.25% 2018 and 4.25% 2023
Correlation between the fly and the French 5s10s suggests the OAT 3.75% 2021 is too cheap on the fly vs the 2018 and the 2023
Duration weighted (0.64: 1.0: 0.4); 3m carry is around +1.5bp 10.1k 37.2 bp 29.4 bp 12 bp 45 bp 25 bp -8 bp € 78,866
Weekly 27 Apr-12
Bund ASW widener boxed with OBL ASW tightening, using futures
Regime shift based on collateral value and non-resident buying means the German curve should to continue to richen in ASW on a rolling basis.
Buy RXM2, sell OEM2, rec 5y, pay 10y (maturity matched swaps) 10.1k 15.1 bp 18.9 bp 0 bp 21 bp 15 bp -6 bp € 15,823
Weekly 27 Apr-12
5s10s steepener in the Netherlands vs. France flattener
Higher duration supply in the Netherlands is expected to weigh on the Dutch long end while the French curve is too steep in 5s10s owing to overseas buying of the 5y sector, which we expect to dissipate.
Sell Nether 2.25% 2022 vs. 4.5% 2017; Buy FRTR 3% 2022 vs. BTNS 1.75% 2017 -10.0k 34.3 bp 27.7 bp 20 bp 40 bp 14 bp -6 bp € 66,491
Weekly 27 Apr-12
Buy RFGB 2.75% 2028 vs. DSL 5.5% 2028
Finland rated higher in our EGB risk index & RFGB 28s are highest pick up to DSLs, where Finland typically trades tighter. Insurer liability discounting curve changes / Solvency II negative for Dutch long end. Carry is neutral 10.2k 6 bp 6 bp -5 bp 11 bp 11 bp -5 bp € 1,633
Weekly 27 Apr-12
Short 10y France vs. Germany
Re-entering after taking profit before the French election. Our more aggressive targets simply reflect our view on the Euro crisis.
Sell 10y FRTR vs. 10y Bunds -10.0k 135 bp 136 bp 200 bp 100 bp 65 bp -35 bp € 14,442
Weekly 4 May-12
Rec EUR 5F5Y, Pay USD 5F5Y
Term premium in EMU still too high. EMU growth likely to underperform US.
3m carry and roll is 2bp in favour of the trade 9.9k -17 bp -25 bp -50 bp 0 bp 33 bp -17 bp € 82,097
Weekly 4 May-12
Rec EUR 5F5Y, Pay CHF 5F5Y
EUR 5y5y is trading at the cheap end of its long term relationship with CHF. Higher vol in EUR means best risk-reward is through a beta-weighted spread.
Beta of 1.2 on the CHF leg 12.1k 92 bp 84 bp 60 bp 110 bp 32 bp -18 bp € 79,821
Weekly 4 May-12
Buy Jun13/14 Euribor steepener
Z-score is -2.2, indicating the spread is cheap and offers a good buying opportunity in our view.
Buy ERM3 Sell ERM4 10.0k 26 bp 25 bp 40 bp 18 bp -14 bp 8 bp -€ 5,000
Weekly 4 May-12
Buy the RXM2 142.00 straddle for 155 ticks
Vol is cheap. We are targeting a sharp break-out from current tight ranges. 25th May expiry should capture the 'hot' aftermath of the Greek and French elections.
Buy RXM2C 142.00 & RXM2P 142.00 14.2k
-155.0 ticks
-156.6 ticks -€ 16,000
Weekly 4 May-12
GBP Receive GBP 20F10Y, Pay EUR 20F10Y
Solvency II requires different discount curve assumptions in EUR and GBP
Receive GBP 20F10Y, Pay EUR 20F10Y 12.0k 115 bp 164 bp 60 bp 170 bp 55 bp -55 bp € 23,120
Solvency II Trades
10s30s bullish steepening in ATM receivers
Increasingly likelihood that the current £50bn of QE will be the last. The steepening pressure on the announcement may just be the start.
10s30s bullish steepening in ATM receivers 0.0k 0.0k 67 bp 81 bp 25 bp -15 bp € 163,582
Weekly 10 Feb 12
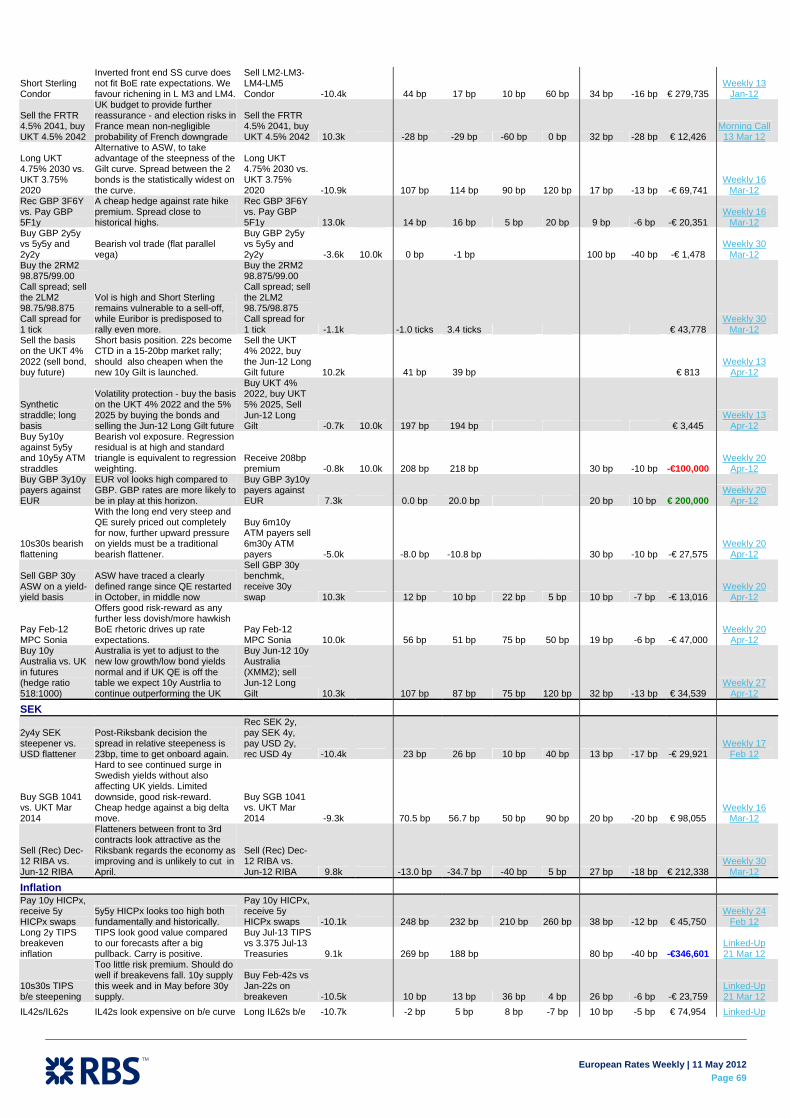
European Rates Weekly | 11 May 2012
Page 69
Short Sterling Condor
Inverted front end SS curve does not fit BoE rate expectations. We favour richening in L M3 and LM4.
Sell LM2-LM3-LM4-LM5 Condor -10.4k 44 bp 17 bp 10 bp 60 bp 34 bp -16 bp € 279,735
Weekly 13 Jan-12
Sell the FRTR 4.5% 2041, buy UKT 4.5% 2042
UK budget to provide further reassurance - and election risks in France mean non-negligible probability of French downgrade
Sell the FRTR 4.5% 2041, buy UKT 4.5% 2042 10.3k -28 bp -29 bp -60 bp 0 bp 32 bp -28 bp € 12,426
Morning Call 13 Mar 12
Long UKT 4.75% 2030 vs. UKT 3.75% 2020
Alternative to ASW, to take advantage of the steepness of the Gilt curve. Spread between the 2 bonds is the statistically widest on the curve.
Long UKT 4.75% 2030 vs. UKT 3.75% 2020 -10.9k 107 bp 114 bp 90 bp 120 bp 17 bp -13 bp -€ 69,741
Weekly 16 Mar-12
Rec GBP 3F6Y vs. Pay GBP 5F1y
A cheap hedge against rate hike premium. Spread close to historical highs.
Rec GBP 3F6Y vs. Pay GBP 5F1y 13.0k 14 bp 16 bp 5 bp 20 bp 9 bp -6 bp -€ 20,351
Weekly 16 Mar-12
Buy GBP 2y5y vs 5y5y and 2y2y
Bearish vol trade (flat parallel vega)
Buy GBP 2y5y vs 5y5y and 2y2y -3.6k 10.0k 0 bp -1 bp 100 bp -40 bp -€ 1,478
Weekly 30 Mar-12
Buy the 2RM2 98.875/99.00 Call spread; sell the 2LM2 98.75/98.875 Call spread for 1 tick
Vol is high and Short Sterling remains vulnerable to a sell-off, while Euribor is predisposed to rally even more.
Buy the 2RM2 98.875/99.00 Call spread; sell the 2LM2 98.75/98.875 Call spread for 1 tick -1.1k -1.0 ticks 3.4 ticks € 43,778
Weekly 30 Mar-12
Sell the basis on the UKT 4% 2022 (sell bond, buy future)
Short basis position. 22s become CTD in a 15-20bp market rally; should also cheapen when the new 10y Gilt is launched.
Sell the UKT 4% 2022, buy the Jun-12 Long Gilt future 10.2k 41 bp 39 bp € 813
Weekly 13 Apr-12
Synthetic straddle; long basis
Volatility protection - buy the basis on the UKT 4% 2022 and the 5% 2025 by buying the bonds and selling the Jun-12 Long Gilt future
Buy UKT 4% 2022, buy UKT 5% 2025, Sell Jun-12 Long Gilt -0.7k 10.0k 197 bp 194 bp € 3,445
Weekly 13 Apr-12
Buy 5y10y against 5y5y and 10y5y ATM straddles
Bearish vol exposure. Regression residual is at high and standard triangle is equivalent to regression weighting.
Receive 208bp premium -0.8k 10.0k 208 bp 218 bp 30 bp -10 bp -€100,000
Weekly 20 Apr-12
Buy GBP 3y10y payers against EUR
EUR vol looks high compared to GBP. GBP rates are more likely to be in play at this horizon.
Buy GBP 3y10y payers against EUR 7.3k 0.0 bp 20.0 bp 20 bp 10 bp € 200,000
Weekly 20 Apr-12
10s30s bearish flattening
With the long end very steep and QE surely priced out completely for now, further upward pressure on yields must be a traditional bearish flattener.
Buy 6m10y ATM payers sell 6m30y ATM payers -5.0k -8.0 bp -10.8 bp 30 bp -10 bp -€ 27,575
Weekly 20 Apr-12
Sell GBP 30y ASW on a yield-yield basis
ASW have traced a clearly defined range since QE restarted in October, in middle now
Sell GBP 30y benchmk, receive 30y swap 10.3k 12 bp 10 bp 22 bp 5 bp 10 bp -7 bp -€ 13,016
Weekly 20 Apr-12
Pay Feb-12 MPC Sonia
Offers good risk-reward as any further less dovish/more hawkish BoE rhetoric drives up rate expectations.
Pay Feb-12 MPC Sonia 10.0k 56 bp 51 bp 75 bp 50 bp 19 bp -6 bp -€ 47,000
Weekly 20 Apr-12
Buy 10y Australia vs. UK in futures (hedge ratio 518:1000)
Australia is yet to adjust to the new low growth/low bond yields normal and if UK QE is off the table we expect 10y Austrlia to continue outperforming the UK
Buy Jun-12 10y Australia (XMM2); sell Jun-12 Long Gilt 10.3k 107 bp 87 bp 75 bp 120 bp 32 bp -13 bp € 34,539
Weekly 27 Apr-12
SEK
2y4y SEK steepener vs. USD flattener
Post-Riksbank decision the spread in relative steepeness is 23bp, time to get onboard again.
Rec SEK 2y, pay SEK 4y, pay USD 2y, rec USD 4y -10.4k 23 bp 26 bp 10 bp 40 bp 13 bp -17 bp -€ 29,921
Weekly 17 Feb 12
Buy SGB 1041 vs. UKT Mar 2014
Hard to see continued surge in Swedish yields without also affecting UK yields. Limited downside, good risk-reward. Cheap hedge against a big delta move.
Buy SGB 1041 vs. UKT Mar 2014 -9.3k 70.5 bp 56.7 bp 50 bp 90 bp 20 bp -20 bp € 98,055
Weekly 16 Mar-12
Sell (Rec) Dec-12 RIBA vs. Jun-12 RIBA
Flatteners between front to 3rd contracts look attractive as the Riksbank regards the economy as improving and is unlikely to cut in April.
Sell (Rec) Dec-12 RIBA vs. Jun-12 RIBA 9.8k -13.0 bp -34.7 bp -40 bp 5 bp 27 bp -18 bp € 212,338
Weekly 30 Mar-12
Inflation Pay 10y HICPx, receive 5y HICPx swaps
5y5y HICPx looks too high both fundamentally and historically.
Pay 10y HICPx, receive 5y HICPx swaps -10.1k 248 bp 232 bp 210 bp 260 bp 38 bp -12 bp € 45,750
Weekly 24 Feb 12
Long 2y TIPS breakeven inflation
TIPS look good value compared to our forecasts after a big pullback. Carry is positive.
Buy Jul-13 TIPS vs 3.375 Jul-13 Treasuries 9.1k 269 bp 188 bp 80 bp -40 bp -€346,601
Linked-Up 21 Mar 12
10s30s TIPS b/e steepening
Too little risk premium. Should do well if breakevens fall. 10y supply this week and in May before 30y supply.
Buy Feb-42s vs Jan-22s on breakeven -10.5k 10 bp 13 bp 36 bp 4 bp 26 bp -6 bp -€ 23,759
Linked-Up 21 Mar 12
IL42s/IL62s IL42s look expensive on b/e curve Long IL62s b/e -10.7k -2 bp 5 bp 8 bp -7 bp 10 bp -5 bp € 74,954 Linked-Up
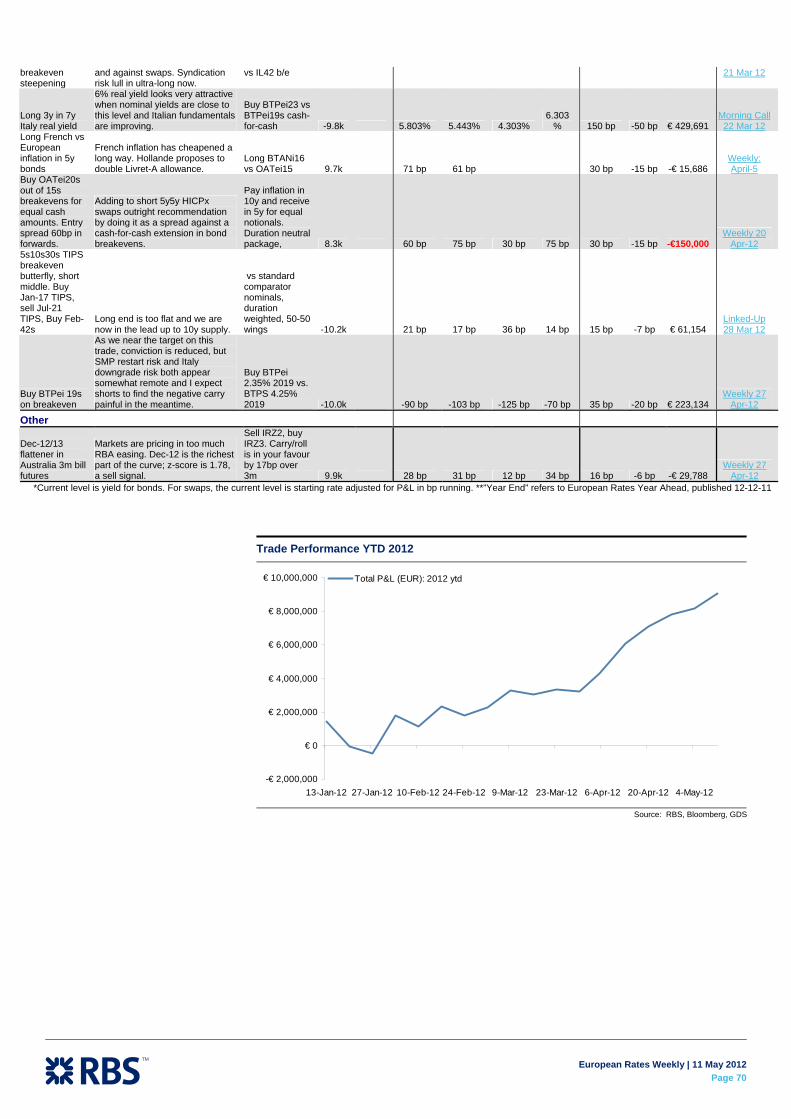
European Rates Weekly | 11 May 2012
Page 70
breakeven steepening
and against swaps. Syndication risk lull in ultra-long now.
vs IL42 b/e 21 Mar 12
Long 3y in 7y Italy real yield
6% real yield looks very attractive when nominal yields are close to this level and Italian fundamentals are improving.
Buy BTPei23 vs BTPei19s cash-for-cash -9.8k 5.803% 5.443% 4.303%
6.303% 150 bp -50 bp € 429,691
Morning Call 22 Mar 12
Long French vs European inflation in 5y bonds
French inflation has cheapened a long way. Hollande proposes to double Livret-A allowance.
Long BTANi16 vs OATei15 9.7k 71 bp 61 bp 30 bp -15 bp -€ 15,686
Weekly: April-5
Buy OATei20s out of 15s breakevens for equal cash amounts. Entry spread 60bp in forwards.
Adding to short 5y5y HICPx swaps outright recommendation by doing it as a spread against a cash-for-cash extension in bond breakevens.
Pay inflation in 10y and receive in 5y for equal notionals. Duration neutral package, 8.3k 60 bp 75 bp 30 bp 75 bp 30 bp -15 bp -€150,000
Weekly 20 Apr-12
5s10s30s TIPS breakeven butterfly, short middle. Buy Jan-17 TIPS, sell Jul-21 TIPS, Buy Feb-42s
Long end is too flat and we are now in the lead up to 10y supply.
vs standard comparator nominals, duration weighted, 50-50 wings -10.2k 21 bp 17 bp 36 bp 14 bp 15 bp -7 bp € 61,154
Linked-Up 28 Mar 12
Buy BTPei 19s on breakeven
As we near the target on this trade, conviction is reduced, but SMP restart risk and Italy downgrade risk both appear somewhat remote and I expect shorts to find the negative carry painful in the meantime.
Buy BTPei 2.35% 2019 vs. BTPS 4.25% 2019 -10.0k -90 bp -103 bp -125 bp -70 bp 35 bp -20 bp € 223,134
Weekly 27 Apr-12
Other
Dec-12/13 flattener in Australia 3m bill futures
Markets are pricing in too much RBA easing. Dec-12 is the richest part of the curve; z-score is 1.78, a sell signal.
Sell IRZ2, buy IRZ3. Carry/roll is in your favour by 17bp over 3m 9.9k 28 bp 31 bp 12 bp 34 bp 16 bp -6 bp -€ 29,788
Weekly 27 Apr-12
*Current level is yield for bonds. For swaps, the current level is starting rate adjusted for P&L in bp running. **”Year End” refers to European Rates Year Ahead, published 12-12-11
Trade Performance YTD 2012
-€ 2,000,000
€ 0
€ 2,000,000
€ 4,000,000
€ 6,000,000
€ 8,000,000
€ 10,000,000
13-Jan-12 27-Jan-12 10-Feb-12 24-Feb-12 9-Mar-12 23-Mar-12 6-Apr-12 20-Apr-12 4-May-12
Total P&L (EUR): 2012 ytd
Source: RBS, Bloomberg, GDS
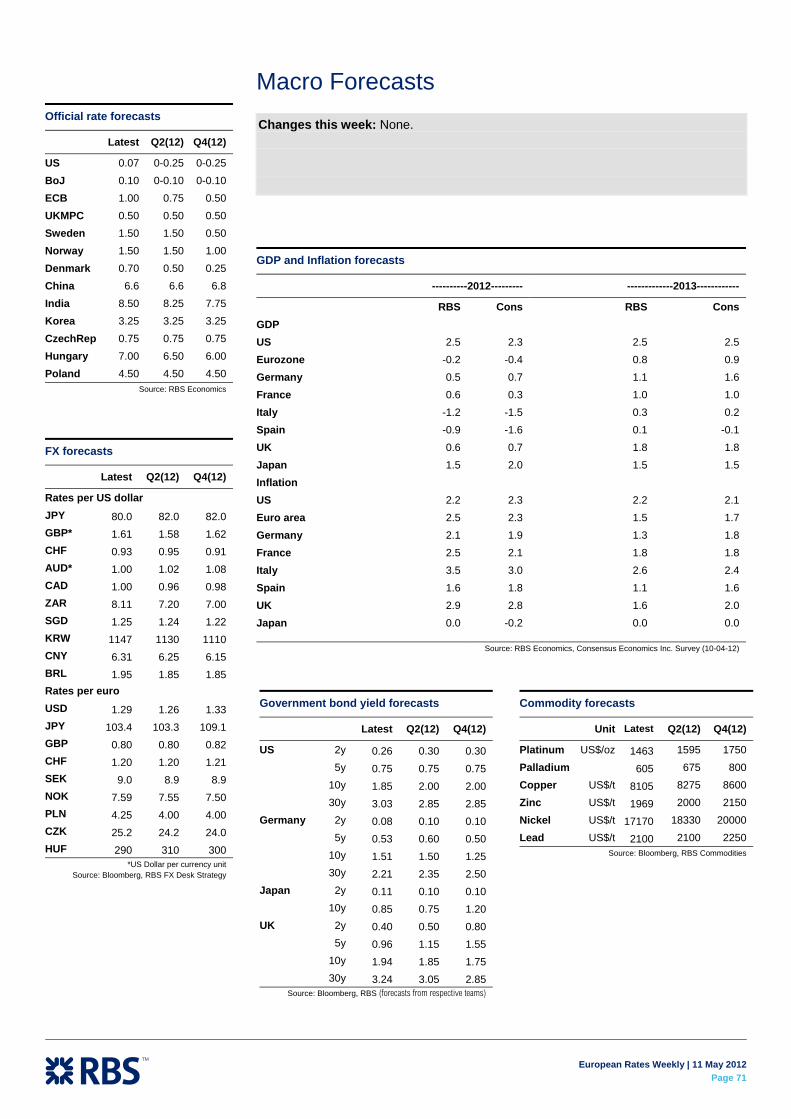
European Rates Weekly | 11 May 2012
Page 71
Changes this week: None.
Macro Forecasts
Official rate forecasts
Latest Q2(12) Q4(12)
US 0.07 0-0.25 0-0.25 BoJ 0.10 0-0.10 0-0.10 ECB 1.00 0.75 0.50 UKMPC 0.50 0.50 0.50 Sweden 1.50 1.50 0.50 Norway 1.50 1.50 1.00 Denmark 0.70 0.50 0.25 China 6.6 6.6 6.8 India 8.50 8.25 7.75 Korea 3.25 3.25 3.25 CzechRep 0.75 0.75 0.75 Hungary 7.00 6.50 6.00 Poland 4.50 4.50 4.50
Source: RBS Economics
FX forecasts
Latest Q2(12) Q4(12)
Rates per US dollar JPY 80.0 82.0 82.0 GBP* 1.61 1.58 1.62 CHF 0.93 0.95 0.91 AUD* 1.00 1.02 1.08 CAD 1.00 0.96 0.98 ZAR 8.11 7.20 7.00 SGD 1.25 1.24 1.22 KRW 1147 1130 1110 CNY 6.31 6.25 6.15 BRL 1.95 1.85 1.85 Rates per euro USD 1.29 1.26 1.33 JPY 103.4 103.3 109.1 GBP 0.80 0.80 0.82 CHF 1.20 1.20 1.21 SEK 9.0 8.9 8.9 NOK 7.59 7.55 7.50 PLN 4.25 4.00 4.00 CZK 25.2 24.2 24.0 HUF 290 310 300
*US Dollar per currency unit Source: Bloomberg, RBS FX Desk Strategy
GDP and Inflation forecasts
----------2012--------- -------------2013------------
RBS Cons RBS Cons GDP US 2.5 2.3 2.5 2.5 Eurozone -0.2 -0.4 0.8 0.9 Germany 0.5 0.7 1.1 1.6 France 0.6 0.3 1.0 1.0 Italy -1.2 -1.5 0.3 0.2 Spain -0.9 -1.6 0.1 -0.1 UK 0.6 0.7 1.8 1.8 Japan 1.5 2.0 1.5 1.5 Inflation US 2.2 2.3 2.2 2.1 Euro area 2.5 2.3 1.5 1.7 Germany 2.1 1.9 1.3 1.8 France 2.5 2.1 1.8 1.8 Italy 3.5 3.0 2.6 2.4 Spain 1.6 1.8 1.1 1.6 UK 2.9 2.8 1.6 2.0 Japan 0.0 -0.2 0.0 0.0
Source: RBS Economics, Consensus Economics Inc. Survey (10-04-12)
Government bond yield forecasts
Latest Q2(12) Q4(12)
US 2y 0.26 0.30 0.30 5y 0.75 0.75 0.75 10y 1.85 2.00 2.00 30y 3.03 2.85 2.85 Germany 2y 0.08 0.10 0.10 5y 0.53 0.60 0.50 10y 1.51 1.50 1.25 30y 2.21 2.35 2.50 Japan 2y 0.11 0.10 0.10 10y 0.85 0.75 1.20 UK 2y 0.40 0.50 0.80 5y 0.96 1.15 1.55 10y 1.94 1.85 1.75 30y 3.24 3.05 2.85
Source: Bloomberg, RBS (forecasts from respective teams)
Commodity forecasts
Unit Latest Q2(12) Q4(12)
Platinum US$/oz 1463 1595 1750 Palladium 605 675 800 Copper US$/t 8105 8275 8600 Zinc US$/t 1969 2000 2150 Nickel US$/t 17170 18330 20000 Lead US$/t 2100 2100 2250
Source: Bloomberg, RBS Commodities

European Rates Weekly | 11 May 2012
Page 72
© Copyright 2012 The Royal Bank of Scotland plc and affiliated companies ("RBS"). All rights reserved. This Material was prepared by the legal entity named on the cover or inside cover page. It is provided for informational purposes only and does not constitute an offer to sell or a solicitation to buy any security or other financial instrument. While based on information believed to be reliable, no guarantee is given that it is accurate or complete. While we endeavour to update on a reasonable basis the information and opinions contained herein, there may be regulatory, compliance or other reasons that prevent us from doing so. The opinions, forecasts, assumptions, estimates, derived valuations and target price(s) contained in this Material are as of the date indicated and are subject to change at any time without prior notice. The investments referred to may not be suitable for the specific investment objectives, financial situation or individual needs of recipients and should not be relied upon in substitution for the exercise of independent judgement. The stated price of any securities mentioned herein is as of the date indicated and is not a representation that any transaction can be effected at this price. Neither RBS nor other persons shall be liable for any direct, indirect, special, incidental, consequential, punitive or exemplary damages, including lost profits arising in any way from the information contained in this Material. This Material is for the use of intended recipients only and the contents may not be reproduced, redistributed, or copied in whole or in part for any purpose without RBS' prior express consent. In any jurisdiction in which distribution to private/retail customers would require registration or licensing of the distributor which the distributor does not currently have, this Material is intended solely for distribution to professional and institutional investors. THIS MATERIAL IS CLASSIFIED AS INVESTMENT RESEARCH AS DEFINED BY THE FINANCIAL SERVICES AUTHORITY. Australia: This Material is issued in Australia by The Royal Bank of Scotland plc (ABN 30 101 464 528), 88 Phillip Street, Sydney NSW 2000, Australia which is authorised and regulated in Australia by the Australian Securities and Investments Commission (AFS License No. 241114) and the Australian Prudential Regulation Authority. Canada: The securities mentioned in this Material are available only in accordance with applicable securities laws and many not be eligible for sale in all jurisdictions. Persons in Canada requiring further information should contact their own advisors. EEA: This Material constitutes "investment research" for the purposes of the Markets in Financial Instruments Directive and as such contains an objective or independent explanation of the matters contained in the Material. Any recommendations contained in this Material must not be relied upon as investment advice based on the recipient's personal circumstances. In the event that further clarification is required on the words or phrases used in this Material, the recipient is strongly recommended to seek independent legal or financial advice. Denmark: Royal Bank of Scotland N.V. is authorised and regulated in the Netherlands by De Netherlandsche Bank. In addition, Royal Bank of Scotland N.V. Danish branch is subject to local supervision by Finanstilsynet, The Danish Financial Supervisory Authority. Hong Kong: Material in connection only with equity securities is distributed in Hong Kong by, and is attributable to, RBS Asia Limited which is regulated by the Securities and Futures Commission of Hong Kong. All other material is distributed in Hong Kong by The Royal Bank of Scotland plc (Hong Kong branch), 30/F AIA Central, 1 Connaught Road Central, Hong Kong, which is regulated by the Hong Kong Monetary Authority. India: Shares traded on stock exchanges within the Republic of India may only be purchased by different categories of resident Indian investors, Foreign Institutional Investors registered with The Securities and Exchange Board of India ("SEBI") or individuals of Indian national origin resident outside India called Non Resident Indians ("NRIs"). Any recipient of this Material wanting additional information or to effect any transaction in Indian securities or financial instrument mentioned herein must do so by contacting a representative of RBS Equities (India) Limited. RBS Equities (India) Limited is a subsidiary of The Royal Bank of Scotland N.V.. Italy: Persons receiving this Material in Italy requiring further information should contact The Royal Bank of Scotland N.V. Milan Branch. Japan: This report is being distributed in Japan by RBS Securities Japan Limited to institutional investors only. South Korea: This Material is being distributed in South Korea by, and is attributable to, RBS Asia Limited (Seoul) Branch which is regulated by the Financial Supervisory Service of South Korea. Malaysia: RBS research, except for economics and FX research, is not for distribution or transmission into Malaysia. Netherlands: the Authority for the Financial Markets ("AFM") is the competent supervisor. Russia: This Material is distributed in the Russian Federation by RBS and "The Royal Bank of Scotland" ZAO (general banking license No. 2594 issued by the Central Bank of the Russian Federation, registered address: building 1, 17 Bolshaya Nikitskaya str., Moscow 125009, the Russian Federation), an affiliate of RBS, for information purposes only and is not an offer to buy or subscribe or otherwise to deal in securities or other financial instruments, or to enter into any legal relations, nor as investment advice or a recommendation with respect to such securities or other financial instruments. This Material does not have regard to the specific investment purposes, financial situation and the particular business needs of any particular recipient. The investments and services contained herein may not be available to persons other than 'qualified investors" as this term is defined in the Federal Law "On the Securities Market". Singapore: Material in connection only with equity securities is distributed in Singapore by The Royal Bank of Scotland Asia Securities (Singapore) Pte Limited ("RBS Asia Securities") (RCB Regn No. 198703346M) under MICA (P) 155/08/2011. All other material is distributed in Singapore by The Royal Bank of Scotland plc (Singapore branch) ("RBS plc Singapore”) under MICA (P) 158/06/2011. Both entities are regulated by the Monetary Authority of Singapore. Singapore recipients should contact RBS Asia Securities or RBS plc Singapore at +65 6518 8888 for additional information. This material and the securities, investments or other financial instruments referred to herein are not in any way intended for, and will not be available to, investors in Singapore unless they are accredited investors, expert investors and institutional investors (as defined in Section 4A(1) of the Securities and Futures Act (Cap. 289) of Singapore ("SFA")). Further, without prejudice to any of the foregoing disclaimers, where this material is distributed to accredited investors or expert investors, RBS Asia Securities and RBS plc Singapore are exempted by Regulation 35 of the Financial Advisers Regulations from the requirements in Section 36 of the Financial Advisers Act (Cap.110) of Singapore ("FAA") mandating disclosure of any interest in securities referred to in this material, or in their acquisition or disposal. Recipients who are not accredited investors, expert investors or institutional investors should seek the advice of their independent financial advisors prior to making any investment decision based on this document or for any necessary explanation of its contents. Thailand: Pursuant to an agreement with Asia Plus Securities Public Company Limited (APS), reports on Thai securities published out of Thailand are prepared by APS but distributed outside Thailand by RBS Bank NV and affiliated companies. Responsibility for the views and accuracy expressed in such documents belongs to APS. Turkey: The Royal Bank of Scotland N.V. is regulated by Banking Regulation and Supervision Authority (BRSA). UAE and Qatar: This Material is produced by The Royal Bank of Scotland N.V and is being distributed to professional and institutional investors only in the United Arab Emirates and Qatar in accordance with the regulatory requirements governing the distribution of investment research in these jurisdictions. Dubai International Financial Centre: This Material has been prepared by The Royal Bank of Scotland N.V. and is directed at "Professional Clients" as defined by the Dubai Financial Services Authority (DFSA). No other person should act upon it. The financial products and services to which the Material relates will only be made available to customers who satisfy the requirements of a "Professional Client". This Material has not been reviewed or approved by the DFSA. Qatar Financial Centre: This Material has been prepared by The Royal Bank of Scotland N.V. and is directed solely at persons who are not "Retail Customer" as defined by the Qatar Financial Centre Regulatory Authority. The financial products and services to which the Material relates will only be made available to customers who satisfy the requirements of a "Business Customer" or "Market Counterparty". United States of America: This Material is intended for distribution only to "major institutional investors" as defined in Rule 15a-6 under the U.S. Exchange Act of 1934 as amended (the "Exchange Act"), and may not be furnished to any other person in the United States. Each U.S. major institutional investor that receives these Materials by its acceptance hereof represents and agrees that it shall not distribute or provide these Materials to any other person. Any U.S. recipient of these Materials that wishes further information regarding, or to effect any transaction in, any of the securities discussed in this Material, should contact and place orders solely through a registered representative of RBS Securities Inc., 600 Washington Boulevard, Stamford, CT, USA. Telephone: +1 203 897 2700. RBS Securities Inc. is an affiliated broker-dealer registered with the U.S. Securities and Exchange Commission under the Exchange Act, and a member of the Securities Investor Protection Corporation (SIPC) and the Financial Industry Regulatory Authority (FINRA). - Material means all research information contained in any form including but not limited to hard copy, electronic form, presentations, e-mail, SMS or WAP. The research analyst or analysts responsible for the content of this research report certify that: (1) the views expressed and attributed to the research analyst or analysts in the research report accurately reflect their personal opinion(s) about the subject securities and issuers and/or other subject matter as appropriate; and, (2) no part of his or her compensation was, is or will be directly or indirectly related to the specific recommendations or views contained in this research report. On a general basis, the efficacy of recommendations is a factor in the performance appraisals of analysts. For a discussion of the valuation methodologies used to derive our price targets and the risks that could impede their achievement, please refer to our latest published research on those stocks at research.rbsm.com. Disclosures regarding companies covered by us can be found on our research website. Please use research.rbsm.com for Equity Research and http://strategy.rbsm.com/disclosures for FICC Research. Our policy on managing research conflicts of interest can be found at https://research.rbsm.com/Disclosure/Disclosure.AspX?MI=2. Should you require additional information please contact the relevant research team or the author(s) of this Material.