Embed Size (px)
Citation preview
RBS Sustainability Briefing Document
Our financing of the energy sector
October 2010

1
Why this briefing?Climate change and energy security now represent two of the biggest challenges toensuring a safe, sustainable future for the world’s inhabitants over the comingdecades. The energy industry is the major source of man-made greenhouse gasemissions worldwide, predominantly through the burning of fossil fuels such as coal,oil and gas.
The aim of this briefing is to provide more information on the role RBS plays inlending to the energy sector. Because of the relevance of the energy sector toclimate change, and the need for us to understand climate-related risks in ourlending, we have conducted analysis that is allowing us to provide more informationon the different types of electricity generation that our energy clients are involved in.
We intend this document to contribute to enhanced disclosure on our financing ofthe energy industry in the years to come. Due to client confidentiality, we are not ableto disclose details of specific clients but we believe there is substantial scope to addfurther analysis of the role RBS plays in financing the energy industry and how weare working with our clients to understand and mitigate climate-related risks.
Key Points
• Across the whole of RBS, approximately 3.6% of our lending (measured by totalcredit risk assets) is committed to the oil and gas and electricity sectorscombined.
• Of this, 2.1% is to the oil and gas sector and 1.5% is to the electricity sector, whichuses a mix of gas, nuclear, coal, oil and renewables.
• Since the UK Government’s recapitalisation of RBS in 2008, our lending to the oiland gas and electricity sectors globally (measured by credit risk assets) has fallenby £9.1 billion and £11.2 billion respectively, and makes up a smaller proportion ofour lending now than it did then.
• Our top 25 electricity clients are collectively generating electricity from gas andnuclear at a rate higher than the global average, and from coal at a rate muchlower than the global average.
• Since 2006, we have provided more finance to wind power projects than any othertype of energy project.
• Approximately 3% of our oil and gas lending is to companies who derive morethan 10% of their income from oil sands operations.
RBS Sustainability Briefing Document
2
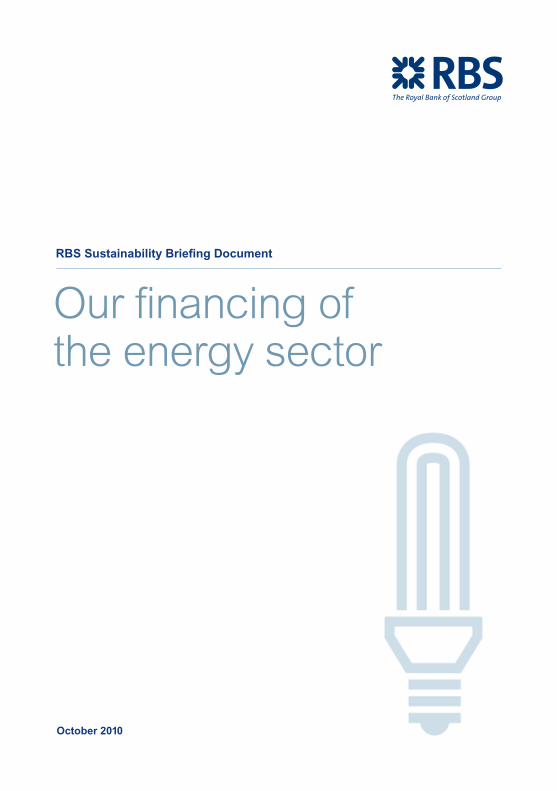
About RBSRBS is a large, international bank, providing a wide variety of banking servicesglobally. As one of the top five largest lenders in the world1, we provide bankingservices to almost all the major sectors of the global economy. The majority of ourlending goes to personal customers, other banks, the property sector andgovernments. The chart below shows that approximately 2.1% of our total lendingis to companies in the oil and gas sector, and 1.5% to the electricity sector - whichis slightly less than their share of the global economy. The actual totals at June2010 were £15 billion out to the oil and gas sector and £10.7 billion out to theelectricity sectors, from a total lending portfolio of £706.9 billion.
Since the UK Government’s recapitalisation of RBS in 2008, our lending to theenergy sector has reduced significantly. In December 2008, shortly after the firstphase of the UK Government’s recapitalisation, our total lending to the oil and gassector stood at £24.1 billion, with another £21.9 billion to the electricity sector.These sectors’ share of our total lending were also higher then, accounting for2.8% and 2.6% respectively of our total lending in December 2008.
Personal 184,251
Banks and financialinstitutions 165,209
Property 99,604
Transport and storage 49,171
Manufacturing 32,390
Wholesale and retail trade 30,454
Public Sector 30,345
Oil and gas extraction and production 10,054
Oil and gas supply, wholesale and retail (inc. petroleum) 4,950
Industrial chemicals etc.239
Nuclear fuel miningand processing 121
Coal mining and production 291
Electricity generation 6,543
Electricity transmission4,132
Water 3,516
Waste and recycling1,300
Telecom, media andtechnology 21,972
Building 20,166
Tourism and leisure 18,655
Business services 17,680
Resources 15,657
Resources break-out Power, water, waste and recycling break-out
Power, water, wasteand recycling 15,491
Agricultural 5,526
Resources 15,657
Power, water, wasteand recycling 15,491
1 Bloomberg data, September 2010.
Which sectors does RBS lend to? Total credit risk assets, June 2010 (£millions)
Our financing of the energy sector

3
Our lending RBS is predominantly a deposit and lending bank: we take in money from depositsand other sources and lend it in the form of loans with the expectation that thesewill be paid back, usually over a pre-arranged period. For the energy sector, aswith other sectors, we provide loans and other banking services (such as overdraftand money transmission services) but we do not usually ‘invest’ in energycompanies or take ownership stakes in them. At any one time, the money we have lent out to the energy sector is continually being repaid and re-lent.
The majority of our lending to the energy sector is in the form of general corporatefinance, which isn’t usually tied to a specific use or project. When we providegeneral corporate finance, the client will make use of it in a variety of ways (forexample by investing in their infrastructure or offices, purchasing other businessesor paying other costs). Much like the provision of a loan to a personal customer, abank cannot under these circumstances stipulate how the loan is used, providedthe client meets its requirements for the credit risks they represent. RBS has a rangeof policies and procedures in place to ensure we lend responsibly to customers.
We also offer structured finance and associated advisory services for specificenergy projects in the UK and US such as wind farms, gas pipelines andtransmission grids. This type of lending is usually done as part of a group of bankswho all lend to the same project. The repayment terms of the loan tend to be moreclosely defined, usually involving a source of cash-flow identified at the outset (e.g.earnings from the sale of electricity), and the repayment period is generally longer– up to 18 years in some cases.
RBS Sustainability Briefing Document

4
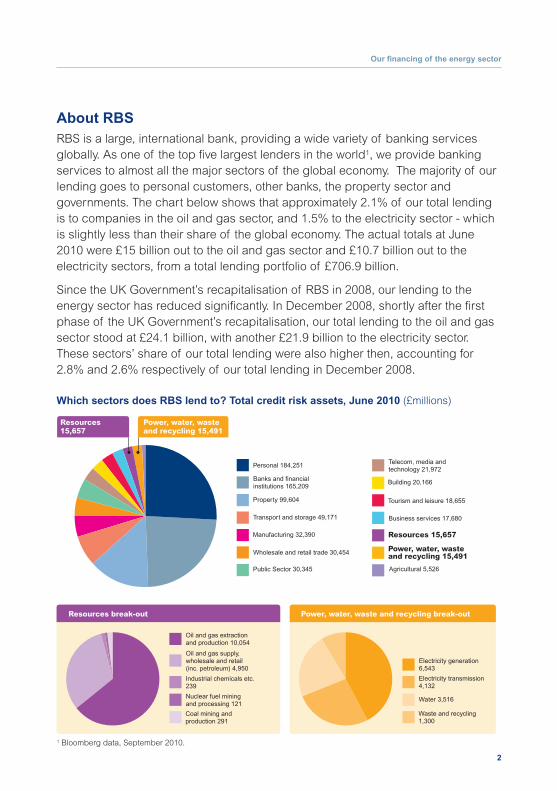
Total primary energy supply by fuel2
2 IEA, Key World Energy Statistics, 2010. (2008 figures)3 IPCC, Mitigation of Climate Change, Contribution of Working Group III to the Fourth Assessment Report, 2007. Figure 1.2.4 IEA, CO2 from Fossil Fuel Combustion, Paris, 2009.
The world’s use of energy Around the world, the demand for energy continues to rise as populations growand living standards increase. Electricity is obtained from gas, coal, nuclear andrenewables (hydro, biomass, wind, solar etc.), whereas oil tends to be usedprimarily as a transport fuel, heating fuel and in many industrial processes andproducts. Globally, total energy consumption is roughly twice what it was in 1970,with oil providing the largest proportion2.
Global energy supply is still heavily dependent on fossil fuels: over 80% of totalprimary energy supply comes from coal/peat, oil and gas. The remainder is fromnuclear power, hydro and combustible renewables (mostly wood and other biomass).Other forms of energy supply, such as wind, solar and geothermal have seen rapidgrowth in recent years but still make up a very small proportion of the world’s primaryenergy supply. Within the electricity sector, however, their role is more significant.
Electricity and heat generation are the largest man-made source of greenhouse gasemissions globally, producing over 10Gt of CO2 per year3. 75% of these emissionscome from burning coal4. The Electricity sector is also the one that has seen thefastest growth in emissions in the last 40 years. Transport and industry are the nextbiggest sources of greenhouse gas emissions, with c.5Gt of CO2 per year each.
2008200319991995199119871983197919751971
14,000
12,000
10,000
8,000
6,000
4,000
2,000
Coal/peat 27%
Gas 21.1%
Hydro 2.2%
Oil 33.2%
Nuclear 5.8%
Combustible renewablesand waste 10%
Other (wind, solargeothermal etc.) 0.7%
Our financing of the energy sector

5
General corporate finance to electricity generatorsBecause general corporate finance is not tied to specific projects, we cannotassociate it directly with specific forms of energy generation. We have, however,developed ways to better understand the nature of our energy clients’ business.
Our analysis identifies the generation mix (gas, coal, nuclear, renewables etc.) of our top 25 electricity sector clients and arrives at an average for each type ofgeneration across this group of companies. We have compiled this data based on our clients’ publicly reported information on the fuel mix of their installedgenerating capacity. The chart overleaf shows the current split between thesedifferent generation sources.
To help put this in context, we have compared these figures with the global averageof electricity generation sources (see second chart, overleaf). This comparisonshows that at present, our top 25 clients are on average using more gas andnuclear generation than the global average, slightly less renewables, and muchless coal.
Coal is by far the most carbon intensive form of electricity generation, beingresponsible for c.75% of global CO2 emissions from electricity generation5.Nuclear and gas are less carbon intensive, with renewables being the least. In theUK, approximately 6.2% of electricity is generated from renewables, which is lessthan the global average primarily because of the relative absence of very large-scale hydropower schemes.
5 IEA, CO2 from Fossil Fuel Combustion, Paris, 2009.
RBS Sustainability Briefing Document

6
Our financing of the energy sector
Electricity generation sources for our top 25 electricity clients (average, as at April 2010)
Renewables (including hydro) 17%
Gas 32%
Coal 26%
Nuclear 22%
Oil 2%
Other 1%
45
40
35
30
25
20
15
10
5
Renewables(including hydro)
Global average electricity generationby fuel (IEA Key World Energy Statistics, 2010)
RBS top 25 electricity clients electricity generation by fuel (2010)
Gas Coal Nuclear Oil Other
Electricity generation by fuel: RBS electricity clients vs. global average

7
RBS Sustainability Briefing Document
Lending to specific energy projects
In contrast with general corporate finance, some of our lending to the energy sector
is in the form of structured finance where the client has identified a specific project
that they need finance for. Typically, a group of banks will be involved in financing a
project, each providing a share of the loan and taking a share of the risk.
We have categorised our lending to different types of energy projects from January
2006 to July 2010 (see chart below). Over this period, we have provided more finance
to wind power projects than any other type of energy project, largely as a result of the
significant growth this sector has experienced over recent years.
Oil sands
Unconventional oil production, such as the oil sands developments in Alberta, Canada,
have additional environmental impacts not normally associated with conventional oil
extraction. These include additional CO2 emissions from production and impacts on the
local landscape, ecosystems and communities.
RBS has not provided any finance directly to an oil sands project for at least three years.
We do however provide general corporate finance to a small number of companies who
have some oil sands extraction and production operations. For most of these clients this
forms a relatively small part of their overall business, but for others it forms a more
significant part of their operations and income.
Overall, approximately 3% of our total oil and gas lending is to companies who derive
more than 10% of their income from oil sands operations.
Wind Power Electricity Generation 30.7%
Gas-Fired Electricity Generation 23.8%
Oil and Gas (for Fuel and Petrochemicals) 23.3%
Coal-Fired Electricity Generation 11.6%
Biofuels (Fuel and Electricity Generation) 5.6%
Solar Thermal and Photovoltaics 4.5%
Transmission and Distribution 0.4%
RBS Energy Related Structured Financing 2006-2010

Client disclosure on carbon emissions
We support the objectives of the Carbon Disclosure Project (CDP), which is
building an international database of companies’ greenhouse gas emissions. We
have identified which of our top 25 oil and gas and top 25 electricity clients
respond publicly to the CDP on their scope 1 and 2 greenhouse gas emissions.
We have plotted these emissions against our total committed exposure to each
client, which helps us to understand the carbon risks in our lending. The dots on
the graphs below represent individual clients. Those which fall in the top right
warrant greater attention either because we have a large lending exposure or
because their reported greenhouse gas emissions are relatively high.
Oil and gas clients
Electricity clients
Scope 1&2 CO2 emissions of our top 25 Oil and GasClients who respond publicly to the CDP
To
tal C
om
mit
ted
Len
din
g E
xp
osu
re (
£m
)
Scope 1&2 CO2 emissions (tonnes)
Lower Risk
Higher Risk
0 20,000,000 40,000,000 60,000,000 80,000,000 100,000,000
High
Low
Scope 1&2 CO2 emissions of our top 25 ElectricityClients who respond publicly to the CDP
To
tal C
om
mit
ted
Len
din
g E
xp
osu
re (
£m
)
Scope 1&2 CO2 emissions (tonnes)
High
Low
0 50,000,000 100,000,000 150,000,000 200,000,000 250,000,000 300,000,000
Lower Risk
Higher Risk
8
Our financing of the energy sector

9
The future: Our commitments
Disclosure We are committed to providing enhanced disclosure on our financing of the energy
industry in the years to come. We will include further information on this in our annual
Sustainability Report, as well as individual briefings such as this one. Due to client
confidentiality, we will not be able to disclose details of specific clients, but we
believe there is substantial scope to provide further analysis of the important role
RBS plays in financing the energy industry and the ways we are addressing climate
change-related risks.
The shape and focus of RBS as a business is likely to change over the coming years,
which may mean that year-on-year comparisons are not always available or valid.
However, we will continue to encourage our energy sector clients to disclose publicly
to the Carbon Disclosure Project, and we will continue to do so as well. In 2010, RBS
achieved the joint highest score globally among all the banks in the CDP.
PoliciesIn addition to our long-standing adoption of the Equator Principles for project
finance, we are introducing revised environmental, social and ethical (ESE) risk
policies governing our general lending to certain sectors, including the oil and gas
sector. These policies will ensure that additional checks are made to ensure that
clients have adequate procedures in place to mitigate adverse environmental and
social impacts. In certain circumstances, these policies will also prevent the provision
of finance where the environmental or social impacts are considered too high.
RBS Sustainability Briefing Document

10
Renewables financing We are committed to supporting the renewable energy industry through a variety
of financing and advisory services. With 20 years’ worth of expertise, we are
continuing to develop ways to finance all sizes of installation, from micro-
generation to large-scale wind farms. Our focus is on more mature technologies:
as a major bank, it can be difficult to finance early-stage and developmental
technologies due to the high credit risks involved.
The EU has a target of generating 20% of electricity supply from renewable
sources by 2020 (with a UK target of 15%). Our top 25 electricity clients are
already close to this figure and we are committed to helping to support the industry
as a whole over the coming years. We believe that the regulatory and technological
drivers are now in place within the energy industry to make this a realistic goal.
CollaborationThe most effective way of addressing the energy financing challenge is through
cross-sector collaboration because this moves the whole banking sector forward as
a whole. In this spirit, RBS will take a leading role in discussions to improve the way
the Equator Principles for project finance incorporate climate change risks, as well
as taking part in other initiatives to address climate change risks in energy sector
financing. In September 2010, RBS will be supporting the Scottish Low Carbon
Investment Conference in Edinburgh and in early 2011 we will be sponsoring the
first ever Climate Week initiative: a programme of events showcasing the solutions
to climate change and encouraging action in all parts of society.
More information on our overall approach to Sustainability, including our annual
Sustainability Report, can be found on our website at www.rbs.com/sustainability
Our financing of the energy sector
Note on dataThis document uses data from a variety of sources which have not all been independently verified. In some cases, it makesuse of data provided on a voluntary basis by other organisations that may involve some approximation. Whilst we have madeevery effort to ensure that data is current, we cannot guarantee its complete accuracy.