Embed Size (px)
Citation preview

7/29/2019 Rba Financial Stability Report Sep 2012
http://slidepdf.com/reader/full/rba-financial-stability-report-sep-2012 1/66
Conns
Overview 1
1. The Global Financial Environment 5
2. The Australian Financial System 19
Box A: Funding Composition o Banks in Australia 33
3. Household and Business Balance Sheets 37
Box B: Households’ Mortgage Prepayment Bufers 49
4. Developments in the Financial System Architecture 51
Copyright and Disclaimer Notices 63
FinancialSailiy
RviwSeptembeR 2012

7/29/2019 Rba Financial Stability Report Sep 2012
http://slidepdf.com/reader/full/rba-financial-stability-report-sep-2012 2/66
The material in this Financial Stability Review was finalised on 24 September 2012.
The Financial Stability Review is published semi-annually in March and September.
It is available on the Reserve Bank’s website (www.rba.gov.au).
Financial Stability Review enquiries
Information Department Telephone: (612) 9551 9830Facsimile: (612) 9551 8033Email: [email protected]
ISSN 1449-3896 (Print)ISSN 1449-5260 (Online)
7/29/2019 Rba Financial Stability Report Sep 2012
http://slidepdf.com/reader/full/rba-financial-stability-report-sep-2012 3/66
1financial stability review | s e p t e m b e r 2 0 1 2
The euro area sovereign debt and banking crisis has
continued to weigh on global financial conditions
in the period since the previous Financial Stability
Review . Although fears of a liquidity crisis in the
euro area were generally assuaged earlier in the
year following the European Central Bank’s (ECB’s)
large-scale lending to banks, concerns about the
resilience of sovereign and bank balance sheets in
the region have persisted. Developments in Greece
and Spain, in particular, triggered a renewed bout of
risk aversion and market volatility between April and
July, as markets became less confident that these
and other euro area countries could return their
fiscal positions to more sustainable paths. Sovereignborrowing costs and risk premiums rose to record
levels in some euro area countries and global share
prices declined. These events added to broader
doubts about the viability of the monetary union,
spurring investors to move capital out of the most
troubled countries to avoid redenomination risk
should they exit the euro. This put further funding
strain on banks in the region, many of which have
been under pressure for some time given the
deteriorating economic conditions in the euro area
and their exposures to sovereigns with weak fiscal
positions.
Since August, there has been a noticeable
improvement in market sentiment and risk pricing
in the euro area. This mainly reflected the ECB’s
announcement of a sovereign bond purchase
program, known as Outright Monetary Transactions.
European authorities also recently announced
plans to more closely integrate the region’s financialregulatory structure, including by centralising bank
supervision under the ECB; in addition, there has
been further progress towards the establishment
of the expanded and permanent European bailout
mechanism. Despite these steps, some of the
longer-term policy measures involve significant
implementation risk, and many of the underlying
problems in the euro area are yet to be effectively
resolved. Fiscal deficits remain large; many banks
need to repair their balance sheets further; and the
adverse feedback loop between sovereign and bank
finances has yet to be broken. Given these ongoing
difficulties, markets will likely remain sensitive to
any setbacks in dealing with the euro area crisis.
Along with the weaker near-term outlook for globalgrowth, the euro area problems will continue to
pose heightened risks to global financial stability in
the period ahead.
Outside the euro area, the major advanced country
banking systems have generally continued on a
gradual path to recovery in recent quarters. However,
sentiment towards them has also been held back by
the risk of a disorderly resolution to the European
problems and softer economic indicators in some
of the largest economies, including the United
States and China. While asset quality measures have
generally improved, underlying profitability of the
major banking systems remains subdued. Weak
property market conditions and the financial market
and regulatory pressures on certain bank business
models are continuing to weigh on the outlook for
many large banks.
Asian banking systems have largely been resilient
to the euro area problems, partly because of their
domestic focus. While non-performing loan ratios
Ovrviw
7/29/2019 Rba Financial Stability Report Sep 2012
http://slidepdf.com/reader/full/rba-financial-stability-report-sep-2012 4/66
2 ReseRve bank of austRalia
are generally low, vulnerabilities may have built
up during recent credit expansions, which could
be revealed in the event of a significant decline in
asset prices or economic activity. As some banking
systems in Asia are now quite large, there is a greater
chance that problems in them could have adverse
international spillovers.
Against this backdrop, the Australian banking
system has remained in a relatively strong position.
Pressures in wholesale funding markets have eased
since late last year, allowing the large banks to
maintain good access to international bond markets
during the past six months. Banks’ bond spreads
have narrowed, and are now comparable to levelsin mid 2011, prior to the escalation of the euro area
debt problems. This has enabled the banks to issue
a larger share of their bonds in unsecured form than
they did at the beginning of the year when tensions
in global funding markets were high. Even so,
banks have reduced their relative use of wholesale
funding further as growth in deposits has continued
to outpace growth in credit. While the Australian
banks have little direct asset exposure to the most
troubled euro area countries, they remain exposed
to swings in global financial market sentiment
associated with the problems in Europe. They should
be more resilient to such episodes though, given
the improvements they have made to their funding,
liquidity and capital positions over recent years.
Around half of the banks’ funding now comes from
customer deposits, which is a broadly similar share
to a number of other comparable countries’ banking
systems. The Australian banks’ asset performance has
improved a little over the past six months, but the
aggregate non-performing loan ratio is still higher
than it was prior to the crisis, mainly reflecting some
poorly performing commercial property loans and
difficult conditions being experienced in some
other parts of the business sector. In aggregate,
the banks’ bad and doubtful debt charges have
declined more substantially since the peak of the
crisis period. However, they now appear to have
troughed, which has contributed – along with
higher funding costs and lower credit growth – to
a slower rate of profit growth in recent reporting
periods. While this has prompted a renewed focus
by banks on cost containment, at this stage, it has
not spurred inappropriate risk-taking. With demand
for credit likely to remain moderate, a challenge for
firms in a competitive banking environment will be
to resist the pressure to ease lending standards to
gain market share in the pursuit of unrealistic profit
expectations.
The household and business sectors have continued
to display a relatively prudent approach towards
their finances in recent quarters. Many householdscontinue to prefer saving and paying down their
existing debt more quickly than required, which has
contributed to household credit growth being more
in line with income growth in recent years. Although
there are some isolated pockets of weakness,
aggregate measures of financial stress remain low.
Ongoing consolidation of household balance
sheets would be desirable from a financial stability
perspective, as it would make indebted households
better able to cope with any future income shock or
fall in housing prices.
After a period of deleveraging, there has recently
been a pick-up in business borrowing, though
businesses’ overall recourse to external funding
remains below average. While the uneven conditions
in the business sector have been contributing to
the weaker performance in banks’ loan portfolios
in recent years, business balance sheets are in
good shape overall. Aggregate profit growth of the non-financial business sector has moderated
recently, but profits remain around average as a
share of GDP.
Managing the risks posed by systemically important
financial institutions (SIFIs) continues to be a focus
of the international regulatory reform agenda. A
principles-based policy framework for domestic
systemically important banks (so-called D-SIBs)
is close to being finalised, complementing theframework for dealing with global SIBs agreed last

7/29/2019 Rba Financial Stability Report Sep 2012
http://slidepdf.com/reader/full/rba-financial-stability-report-sep-2012 5/66
3financial stability review | s e p t e m b e r 2 0 1 2
year. Work to strengthen resolution regimes for global
SIFIs and extend the SIFI framework to non-bank
financial institutions is also underway. Progress has
also been made both globally and domestically on
several other initiatives, including reforms to the
regulation of financial market infrastructures and
over-the-counter derivatives. Domestically, the
Australian Prudential Regulation Authority has been
continuing the process of implementing the Basel III
bank capital and liquidity reforms in Australia, as
well as finalising reforms to the regulatory capital
framework for insurers and introducing prudential
standards for superannuation funds. As noted in the
previous Review , Australia has this year undergone
an IMF Financial Sector Assessment Program review.
The results, which are due to be published later this
year, confirm that Australia has a stable financial
system, with robust financial regulatory, supervisory
and crisis management frameworks. R

7/29/2019 Rba Financial Stability Report Sep 2012
http://slidepdf.com/reader/full/rba-financial-stability-report-sep-2012 6/66
4 ReseRve bank of austRalia

7/29/2019 Rba Financial Stability Report Sep 2012
http://slidepdf.com/reader/full/rba-financial-stability-report-sep-2012 7/66
5financial stability review | s e p t e m b e r 2 0 1 2
including declines in spreads on southern euro area
sovereign bonds and increases in euro area bank
share prices, which are now only a little below the
level they were at the time of the previous Review .
Despite the recent improvement, market confidence
in euro area banks is still generally weak, and there
are ongoing concerns about some banks’ solvency.
Confidence in the global financial system remains
fragile and susceptible to further setbacks in dealing
with the euro area crisis or a further softening in
global economic growth.
th euro Ara Crisis and SovrignD marks
The euro area sovereign debt and banking crisis
has been a continued source of market concern
during the six months since the previous Review .
Since the March Review , global financial markets
have been through another period of heightened
risk aversion and volatility associated with an
escalation of the euro area sovereign debt crisis and
related banking sector problems. Greece and Spain
have been a particular focus of market attention
during this period. The difficulties these and other
euro area countries are having in returning their
fiscal positions to more sustainable paths and
resolving banking sector problems have raised
doubts about the viability of the monetary union.
This contributed to further capital outflows from the
most troubled countries and greater financial market
fragmentation in the euro area. The pressures wereevident around the middle of the year in rising yields
on sovereign bonds issued by some of the most
troubled euro area countries and declining euro
area bank share prices (Graph 1.1). A weakening of
economic activity in the euro area also contributed
to the adverse feedback loop between sovereign
and bank balance sheets. Outside the euro area,
financial market sentiment in recent months was
weighed down by the events in Europe, as well as
concerns about the health of the global economy
following the release of softer economic indicators
in some large economies, including China and the
United States.
Since August, there has been a marked improvement
in global financial market sentiment, largely
reflecting the European Central Bank’s (ECB’s) plans to
intervene in sovereign debt markets to help preserve
the euro area monetary union. The improvement has
been reflected in the pricing of a range of risk assets,
1. th Gloal Financial environn
Graph 1.1
l l l l l l25
50
75
100
25
50
75
100
Banks’ Share Prices1 January 2011 = 100
* Market capitalisation-weighted index of 18 large banks** MSCI financials indexSource: Bloomberg
US*
Index Index
UK
Australia
Euro area
Asia**
(excluding Japan)
Japan
Canada
Mar Jun Dec Jun SepMar Sep
2012
China
2011
March Review

7/29/2019 Rba Financial Stability Report Sep 2012
http://slidepdf.com/reader/full/rba-financial-stability-report-sep-2012 8/66
6 ReseRve bank of austRalia
Developments in Greece and Spain, in particular,
sparked renewed market stress in Europe at various
points between April and July. In the lead-up to
the elections in Greece, concerns that its bailout
package might not be adhered to prompted
speculation that the country may exit the euro
area. Deposit outflows accelerated at Greek banks
as depositors sought to avoid redenomination
risk. These concerns eased somewhat after parties
supportive of the bailout package were elected
in June, but market participants remain doubtful
that Greece can meet the terms of its package and
continue to receive financing, given that economic
conditions are still deteriorating. The risk that Greece
might exit the euro, imposing losses on holders of
financial contracts in Greece and possibly spurring
contagion to other countries, therefore continues to
weigh on asset prices in the region.
In Spain, the recent concerns have mostly been
about the weakness of its banking system and
what this might mean for its deteriorating public
finances. Spanish banks have been suffering from
poorly performing property exposures and weak
economic conditions for a few years now, and the
part-nationalisation of Spain’s third-largest bank
(BFA-Bankia) in May triggered renewed market
concerns about their position. Spanish sovereign
and bank bond yields rose sharply, and the Spanish
banking system further increased its reliance on
central bank liquidity (Graph 1.2). The Spanish
authorities took a number of steps to shore up
confidence in the system, including strengthening
provision requirements on still-performingproperty development loans and commissioning
independent stress tests of the banks. In June, Spain
sought financial assistance from the European
Union (EU) of up to €100 billion to help recapitalise
troubled Spanish banks, and the European
authorities formally agreed to this in July. Stress tests
to determine the capital needs of individual Spanish
banks are due to be released around the end of
September. Spain also recently announced that it
will establish a ‘bad bank’ later this year to remove
certain non-performing assets from the balance
sheets of Spanish banks that have received public
funds, and manage these assets over time.
While investors initially responded favourably to
the announcement of the Spanish bank bailout
package, market sentiment quickly reversed as
attention focused on the increase in government
debt this funding would entail. Together with the
poor state of regional government finances in Spain,
this contributed to fears that a more comprehensive
sovereign bailout package would be required, along
the lines of those already provided to Greece, Ireland
and Portugal. In this environment, attention naturally
also turned to Italy because of the state of its publicfinances, and Italian sovereign (and bank) bond
yields rose around the middle of the year. Meanwhile,
in June, Cyprus became the fifth euro area country
to request international financial assistance when
it asked for funds to help recapitalise its banking
system (which has significant exposures to Greece)
and finance its budget deficit. In contrast to these
developments in southern Europe, government
bond yields for northern euro area countries
continued to decline over the past six months, with
German and Dutch short-term yields recently falling
below zero. This largely reflects safe-haven flows
given these countries’ better fiscal positions.
Graph 1.2Euro Area Government Bond Yields
l l l l l l l l l l l l l l l l l l l l-2
0
2
4
6
8
l l l l l l l l l l l l l l l l l l l l -2
0
2
4
6
8
Source: Bloomberg
2012
10-year
Italy
France
2011
2-year
M J S D M
20122011
Netherlands
Spain
J S M J S D M J S
% %
March Review
Germany

7/29/2019 Rba Financial Stability Report Sep 2012
http://slidepdf.com/reader/full/rba-financial-stability-report-sep-2012 9/66
7financial stability review | s e p t e m b e r 2 0 1 2
European authorities have announced a number of
measures in recent months to help alleviate market
strains and keep the euro area intact. In early August,
the ECB said that it was considering purchasing
short-term sovereign debt in secondary markets,
given its view that the exceptionally high risk premia
observed in some sovereign debt markets and the
associated financial fragmentation are hampering
the transmission of monetary policy in the euro
area. The details of a new sovereign bond-buying
program, known as Outright Monetary Transactions
(OMT), were released in September. The ECB will only
purchase sovereign debt of euro area countries that
have an EU assistance program and are meeting
the attached policy conditionality. There will be no
ex-ante limit on purchases, which will be focusedon the shorter end of the yield curve, particularly
securities with 1–3 year residual maturities. The
ECB’s holdings will rank equally with existing senior
creditors, in contrast to the position taken in the
Greek debt restructuring.
While the OMT has yet to be activated, the ECB’s
announcements have contributed to a marked
narrowing of spreads on southern euro area
sovereign bonds, particularly at the shorter end
As recent events added to broader doubts about
the viability of the monetary union, there was a
general move to reduce cross-border exposures
within the euro area. This was evident in significant
capital outflows from some troubled euro area
countries over the past year: foreign holdings of
these governments’ debt declined sharply; euro
area banks reduced their holdings of debt (mainly
government and bank debt) issued outside their
home jurisdictions (Graph 1.3); and non-domestic
depositors withdrew funds from banks in most euro
area countries (Graph 1.4). Cross-border financial
institutions have been seeking to match their
liabilities and assets in individual euro area countries
more closely, to protect themselves if one of these
countries should exit the euro. In particular, banks
have been reducing funding shortfalls in the more
troubled euro area countries by further cutting back
their exposures there, reinforcing broader efforts
to deleverage and refocus on their core activities.
Some European banks have reportedly increased
their borrowing from national central banks in the
host countries where they have subsidiaries and
branches, rather than from the central bank in theirhome country as was typical in the past.
Graph 1.3
Graph 1.4
-30
-25
-20
-15
-10
-5
0
5
-30
-25
-20
-15
-10
-5
0
5
Change in Private Sector Deposits*Year to June 2012, per cent
* Includes deposits from monetary financial institutionsSource: Central banks
P o r t u g a l
%% n Non-resident
n Resident
E u r o a
r e a
I t a l y
F r a
n c e
G e r m
a n y
S p a i n
I r e l a n d
G r e
e c e
A u s t r i a
N e t h e r l a
n d s
B e l g
i u m
G e r m a n y
F r a n c e
I t a l y
S p a i n
N e t h e r l a n d s
B e l g i u m
A u s t r i a
-45
-30
-15
0
15
-45
-30
-15
0
15
Banks’ Holdings of Non-residentEuro Area Bonds
Year-ended percentage change
%n June 2011n June 2012
Source: ECB
%
7/29/2019 Rba Financial Stability Report Sep 2012
http://slidepdf.com/reader/full/rba-financial-stability-report-sep-2012 10/66
8 ReseRve bank of austRalia
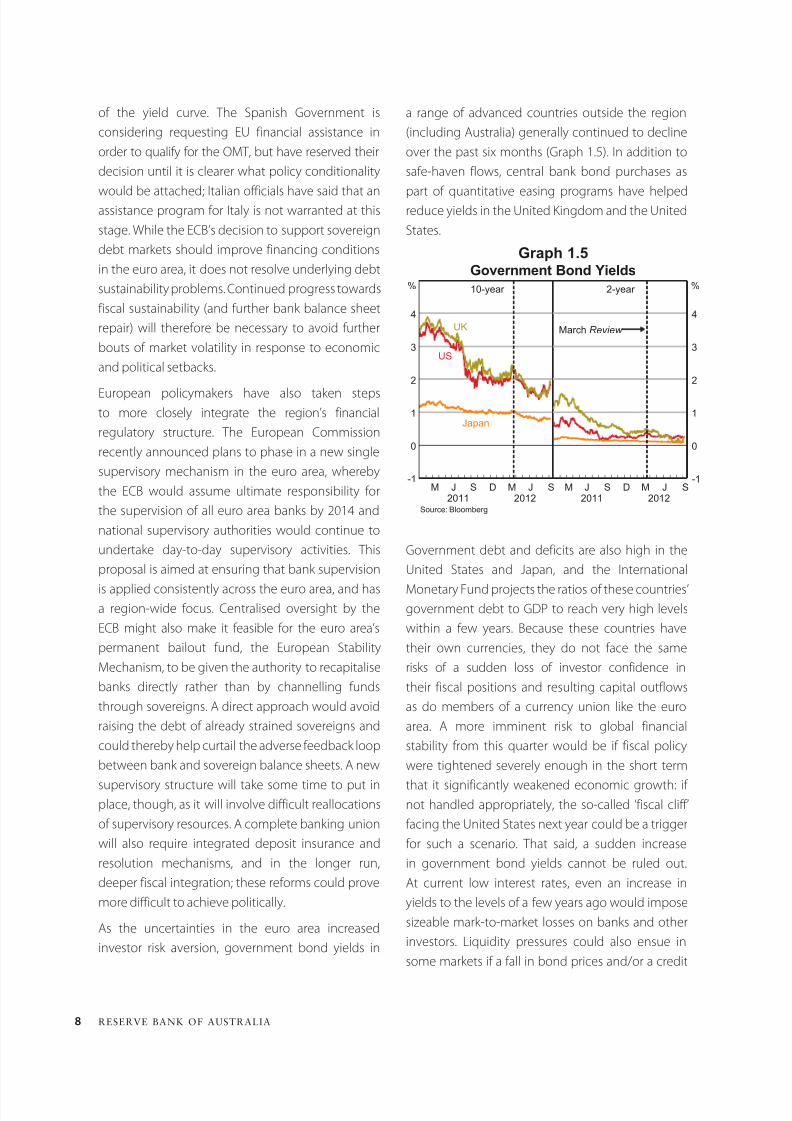
a range of advanced countries outside the region
(including Australia) generally continued to decline
over the past six months (Graph 1.5). In addition to
safe-haven flows, central bank bond purchases as
part of quantitative easing programs have helped
reduce yields in the United Kingdom and the United
States.
Government debt and deficits are also high in the
United States and Japan, and the International
Monetary Fund projects the ratios of these countries’
government debt to GDP to reach very high levels
within a few years. Because these countries have
their own currencies, they do not face the same
risks of a sudden loss of investor confidence in
their fiscal positions and resulting capital outflows
as do members of a currency union like the euro
area. A more imminent risk to global financial
stability from this quarter would be if fiscal policywere tightened severely enough in the short term
that it significantly weakened economic growth: if
not handled appropriately, the so-called ‘fiscal cliff’
facing the United States next year could be a trigger
for such a scenario. That said, a sudden increase
in government bond yields cannot be ruled out.
At current low interest rates, even an increase in
yields to the levels of a few years ago would impose
sizeable mark-to-market losses on banks and other
investors. Liquidity pressures could also ensue in
some markets if a fall in bond prices and/or a credit
of the yield curve. The Spanish Government is
considering requesting EU financial assistance in
order to qualify for the OMT, but have reserved their
decision until it is clearer what policy conditionality
would be attached; Italian officials have said that an
assistance program for Italy is not warranted at this
stage. While the ECB’s decision to support sovereign
debt markets should improve financing conditions
in the euro area, it does not resolve underlying debt
sustainability problems. Continued progress towards
fiscal sustainability (and further bank balance sheet
repair) will therefore be necessary to avoid further
bouts of market volatility in response to economic
and political setbacks.
European policymakers have also taken steps
to more closely integrate the region’s financial
regulatory structure. The European Commission
recently announced plans to phase in a new single
supervisory mechanism in the euro area, whereby
the ECB would assume ultimate responsibility for
the supervision of all euro area banks by 2014 and
national supervisory authorities would continue to
undertake day-to-day supervisory activities. This
proposal is aimed at ensuring that bank supervision
is applied consistently across the euro area, and has
a region-wide focus. Centralised oversight by the
ECB might also make it feasible for the euro area’s
permanent bailout fund, the European Stability
Mechanism, to be given the authority to recapitalise
banks directly rather than by channelling funds
through sovereigns. A direct approach would avoid
raising the debt of already strained sovereigns and
could thereby help curtail the adverse feedback loopbetween bank and sovereign balance sheets. A new
supervisory structure will take some time to put in
place, though, as it will involve difficult reallocations
of supervisory resources. A complete banking union
will also require integrated deposit insurance and
resolution mechanisms, and in the longer run,
deeper fiscal integration; these reforms could prove
more difficult to achieve politically.
As the uncertainties in the euro area increased
investor risk aversion, government bond yields in
Graph 1.5Government Bond Yields
l l l l l l l l l l l l l l l l l l l l-1
0
1
2
3
4
l l l l l l l l l l l l l l l l l l l l -1
0
1
2
3
4
Source: Bloomberg
2012
Japan
%10-year % 2-year
March Review
201120122011
US
UK
M J S D M J S DM J S M J S

7/29/2019 Rba Financial Stability Report Sep 2012
http://slidepdf.com/reader/full/rba-financial-stability-report-sep-2012 11/66
9financial stability review | s e p t e m b e r 2 0 1 2
rating downgrade required more collateral to be
posted to counterparties.
bank Funding Condiions and
marksECB policy actions and announcements over the
course of the year have brought interbank borrowing
costs down, but overall funding conditions for banks
in the euro area remain strained. The ECB cut the
rate it pays on its deposit facility from 0.25 per cent
to zero in July, in an attempt to stimulate activity
in short-term interbank markets. Despite these
actions, the volume of interbank lending remains
weak, especially across borders, and even in securedlending (repo) markets, liquidity has been low.
Concerns about counterparty risk and collateral
quality have also resulted in greater differentiation in
lending rates across banks, which has been inhibiting
the transmission of euro area monetary policy. As
some securities are now seen as lower quality and
a significant portion of the remaining high-quality
collateral has been pledged to the ECB, the pool of
unencumbered high-quality assets available to euro
area financial markets has declined at the same time
as demand for these assets as collateral has been
particularly strong. As a result, repo lending rates
involving these assets have been slightly negative
over recent months (Graph 1.6).
Conditions in term funding markets have also
been relatively subdued. Euro area banks have
issued around €185 billion of bonds since April,
compared with €225 billion in the same period last
year, though there has been a pick-up in issuance
activity since the details of the ECB’s OMT program
were announced in early September (Graph 1.7). A
significant share of bond issuance over the past six
months has been retained by banks to provide them
with additional collateral for central bank funding.
While some banks have not needed to issue as
much debt this year because they obtained ample
three-year funding in the ECB’s earlier refinancing
operations, many banks have seen their market
access curtailed, especially for unsecured debt.
Some banks in Cyprus and Spain, in particular, have
been forced to rely more heavily on collateralised
borrowing from the ECB or their national central
bank given their difficulties accessing term markets
(Graph 1.8). The ECB broadened further the range
of collateral eligible for its liquidity operations
over recent months as some banks’ collateral had
reportedly been depleted. The increased reliance of
many euro area banks on central bank funding couldeventually complicate exit strategies, especially if
banks are not able to return to wholesale markets by
the time the large stock of three-year loans from the
ECB matures in 2015.
Graph 1.6 Graph 1.7
l l l l-1
0
1
2
3
4
5
-1
0
1
2
3
4
5
Euro Interbank Interest Rates3-month maturity
%
Secured(Eurepo)
Unsecured(Euribor)
Source: Bloomberg 20122011201020092008
%
0
100
200
0
100
200
Euro Area Banks’ Bond Issuance*
* September 2012 is quarter-to-dateSources: Bloomberg; Dealogic; RBA; Thomson Reuters
2011
n Covered bonds n Government-guaranteed n Unguaranteed
20122010200920082007
€b €b

7/29/2019 Rba Financial Stability Report Sep 2012
http://slidepdf.com/reader/full/rba-financial-stability-report-sep-2012 12/66
10 ReseRve bank of austRalia
As euro area banks have increased their collateralised
borrowing from the ECB and become more reliant
on covered bonds and other forms of secured
funding, concerns have also been raised about
their increasing asset encumbrance. The structural
subordination of unsecured creditors that this entails
could ultimately result in higher unsecured fundingcosts for banks in the future. Accordingly, there have
been calls for banks to improve their reporting on
asset encumbrance to address some of the market
uncertainty. Over the longer term, unsecured debt
holders’ concerns about potential subordination and
lower recovery rates may also be exacerbated by the
introduction of bail-in and other resolution options
in Europe that are currently being developed.
The euro area problems have been contributing to
periods of volatility in wholesale funding markets
for banks in other countries for some time, though
these spillover effects have generally been fairly
limited. Bank bond spreads rose in April and May
across a number of markets, though they remained
well below levels seen in late 2011, and have since
declined. Bank bond issuance outside the euro area
has remained subdued over recent quarters given
the market volatility and slow credit growth in most
countries. Banks in a number of major markets havealso been increasing the share of their funding
Graph 1.9
from customer deposits over recent years, thereby
reducing their reliance on less stable market-based
funding, particularly short-term wholesale debt
(Graph 1.9). This has contributed to higher funding
costs as banks replace cheaper wholesale funding
with more expensive customer deposits and term
debt.
Euro area Sweden Switzerland UK*** US0
20
40
60
0
20
40
60
Customer Deposit Funding*Share of total funding**
%n December 2007n December 2009
n June 2012
* Total deposits excluding deposits from banks and other monetary financialinstitutions; ratios across banking systems are subject to definitionaldifferences; certificates of deposit are classified as wholesale debt in allcountries except the US, where these instruments are eligible for depositinsurance
** Total liabilities including equity less derivatives and other non-debt liabilities*** December 2007 and December 2009 data are for banks, while June 2012data are for all monetary f inancial institutions
Sources: FDIC; central banks
%
Graph 1.8
0
5
10
15
20
25
30
0
5
10
15
20
25
30
2011
Greece**
% %
Ireland**
Portugal
Spain**
Italy
2010
By national central bank, share of national total bank assets*
2012
France
* Banks proxied by credit institutions except Cyprus, France and Portugalwhich use the broader category of monetary f inancial institutions
** Includes estimate of emergency liquidity assistanceSources: RBA; central banks
Central Bank Lending to Banks inSelected Euro Area Countries
Cyprus**
banks’ Caial posiions
Euro area banks have continued to strengthen
their capital positions in response to market and
regulatory pressures. In aggregate, the large euro
area banks increased their core Tier 1 capital ratio by
1.2 percentage points (or about €75 billion) over the
year to June 2012, to 10.5 per cent (Graph 1.10). Themajority of this increase came from higher capital
levels, mainly retained earnings and the conversion
of hybrids to common equity; there was little
issuance of new equity given depressed share prices
in the region. Most of the large European banks
did not require government assistance to meet the
target imposed by the European Banking Authority
(EBA) of a 9 per cent core Tier 1 capital ratio by June
2012, plus a buffer to allow for valuation losses on
their EU sovereign exposures. However, given their

7/29/2019 Rba Financial Stability Report Sep 2012
http://slidepdf.com/reader/full/rba-financial-stability-report-sep-2012 13/66
11financial stability review | s e p t e m b e r 2 0 1 2
sizeable losses, a number of banks from the most
troubled euro area countries required government
capital injections to meet the target. A decline
in risk-weighted assets of about 4 per cent also
boosted the euro area banks’ aggregate capital ratio
over the year to June. Total assets fell by less than
risk-weighted assets, mainly due to banks’ shedding
assets with above-average risk weights.
Despite the recent steps to strengthen capital
positions, market confidence in many euro area
banks remains low. This reflects ongoing doubts
about the asset quality and hence solvency of some
banks, particularly those from the most troubled euro
area countries where economic activity is quite weak.
This has been evident in various market indicators,
including elevated bond and credit default swap
premia, as well as low credit ratings. Indeed, around
one-third of a sample of large euro area banks are
currently rated sub-investment grade (Graph 1.11).
More broadly, euro area banks’ equity valuations
remain at very low levels, despite increases in bank
share prices over the past couple of months.
Large banks outside the euro area have also
continued to strengthen their capital positions
over recent periods (Graph 1.12). This has mainly
been through retaining earnings, in many cases
supported by dividend payout ratios that are still
below pre-crisis levels. Many banks have been
able to increase their capital ratios even though
the introduction of Basel 2.5 capital rules raised
risk weights for certain trading book assets and
securitisations. The revised capital standards, which
have been implemented in all major jurisdictions
except the United States, particularly affected banks
Graph 1.10 Graph 1.11
Graph 1.12
0
3
6
9
12
15
0
3
6
9
12
15
Large Banks’ Tier 1 Capital*
US
% %
Euro area Japan Canada
Per cent of risk-weighted assets
* Tier 1 capital ratios across banking systems are subject to definitionaldifferences; includes the weighted average of: 19 large US banks, 52large institutions from across the euro area, the four largest UK banks,13 large other European banks, the three largest Japanese banks andthe six largest Canadian banks
** July 2012 used for Canada; latest available data used where banks havenot reported for June 2012
Sources: Bloomberg; FDIC; RBA; SNL Financial; banks’ annual and interim reports
UK
n 2011n 2010n 2007 n 2008 n 2009
Other Europe
n June 2012**
A A A
A A +
A A
A A -
A + A A
-
B B B +
B B B
B B B -
L o w e r0
6
12
18
0
6
12
18
Euro Area Banks’ Credit Ratings*No
* Fixed sample of 60 large institutions from across the euro area;predominantly Standard & Poor’s local long-term ratings, unless unrated,then Moody’s senior unsecured
Sources: Moody’s; RBA; Standard & Poor’s
Non December 2006n December 2010
n March 2012
n
September 2012
Change in Euro Area Banks’ Core Tier 1 Capital*Year to June 2012
-60
Capital measures
-40 -20 0 20 40 60 €b
Total
Subtotal
Aggregate net loss
Government capital
New private capital
Subtotal
Risk-weighted asset measures**
* 44 large banks from across the euro area; latest availabledata used where banks have not reported for June 2012
** Capital equivalent effect of changes in risk-weighted assets
Sources: SNL Financial; banks’ annual and interim reports

7/29/2019 Rba Financial Stability Report Sep 2012
http://slidepdf.com/reader/full/rba-financial-stability-report-sep-2012 14/66
12 ReseRve bank of austRalia
with large capital markets businesses, among them
some large European banks (Graph 1.13).
Although large banks in the major advanced
countries have significantly strengthened their
balance sheets over the past few years, many will
need to take further action to meet the tougher
regulatory requirements that are being phased in
over coming years. In particular, many banks need
to increase common equity positions to meet the
Basel III capital requirements, as well as the extra
capital buffers that will apply to those banks deemed
systemically important. The Basel Committee on
Banking Supervision estimated that, as at December
2011, the world’s largest banks required a total of around €370 billion in extra capital (equivalent to
about 2 per cent of their risk-weighted assets) to
meet the Basel III minimum capital requirements.1
Even though most banks have increased their capital
ratios since then, some still have further to go. Many
1 Basel Committee on Banking Supervision (2012), ‘Results of the
Basel III Monitoring Exercise as of 31 December 2011’, September, p 2.
banks also need to alter their funding structures to
meet the Basel III liquidity and funding ratios.
Improving capital and funding positions will take
time to achieve and banks therefore need to be
transitioning now. Because banks’ progress will
come under market and supervisory scrutiny,
laggards run the risk of being forced to take quicker
and potentially more drastic action at a later date.
Raising capital or retaining earnings to meet higher
capital requirements will be difficult for banks
with depressed share prices and weak earnings
prospects, so many of them are still looking to
deleverage by reducing assets and exiting capital-
intensive businesses. This is reflected, for example,in the current plans of large European banks to
reduce their aggregate risk-weighted assets by
about 7–8 per cent by 2015. They have targeted their
biggest reductions at corporate and investment
banking, but also exposures to parts of Europe where
economic conditions are weakest. The overall effect
of this deleveraging on financial conditions and
markets is likely to be noticeable, but limited by the
fact that a number of banks headquartered outside
Europe are looking to expand into certain markets
where European banks are pulling back.
bank profiailiy
The profitability of the major banking systems
remains subdued. Annualised returns on equity for
the largest banks in euro area, Japan, the United
Kingdom and the United States averaged 2–8 per
cent in the first half of 2012, well below the rates
recorded prior to 2008 (Graph 1.14). Returns were
broadly unchanged from those recorded in 2011,
with the exception of the large euro area banks,
whose average returns in 2011 were held down by
sizeable write-downs on their goodwill and Greek
sovereign exposures. Many of the smaller and
more domestically focused banks in the weakest
economies in Europe have recorded large losses in
recent reporting periods.
The recent modest profitability of large banks in themajor advanced economies reflects a number of
Graph 1.13
0 5 10 15 20 25
Increase in Risk-weighted Assets due toBasel 2.5
December 2011*
* January 2012 for Canadian banks and March 2012 for Australianbanks
Source: Banks’ financial disclosures
%
UBSDBK
CSBAR
CASG
BNPCMZRBSUCG
HSBCWBCING
LBG
MFGBPCE
SC
NABISP
CBA
MUFJ
SMFG
TD
NDA
DANS
SWED
n Australia
n Canadan Euro area
n Japan
n Other Europe
n UK

7/29/2019 Rba Financial Stability Report Sep 2012
http://slidepdf.com/reader/full/rba-financial-stability-report-sep-2012 15/66
13financial stability review | s e p t e m b e r 2 0 1 2
factors. Most banks have recorded little or no growth
in net interest income, with credit growth remaining
weak and net interest margins being weighed
down by higher funding costs and the prolonged
low interest-rate environment. Investment banking
income has also been under pressure as volatile
financial market conditions reduced trading
revenues and demand for capital markets services.
While declines in loan-loss provisioning have
boosted profits of large UK and US banks in recent
reporting periods, some euro area banks’ provisions
have risen due to deteriorating economic conditions
within the region and ongoing weakness in the
Spanish property market. Some large banks have alsoincurred significant legal/regulatory expenses arising
from previous inappropriate business practices, such
as poor mortgage practices in the United States, the
mis-selling of payment protection insurance in the
United Kingdom, and the recent LIBOR manipulation
scandal. JP Morgan recently recorded large trading
losses on its synthetic credit portfolio, highlighting
the consequences of inadequate risk controls and
unconventional investment strategies. A further
factor contributing to lower returns on equity is that
the large banks are holding higher levels of capital
now, as noted earlier.
Recent returns recorded by the large banks in
the major banking systems are well below those
typically demanded by equity investors, as well
as banks’ own targets. Investors also appear to be
expecting banks’ profitability to remain subdued,
with market valuations of banks’ equity well below
book valuations – that is, banks’ price-to-book ratios
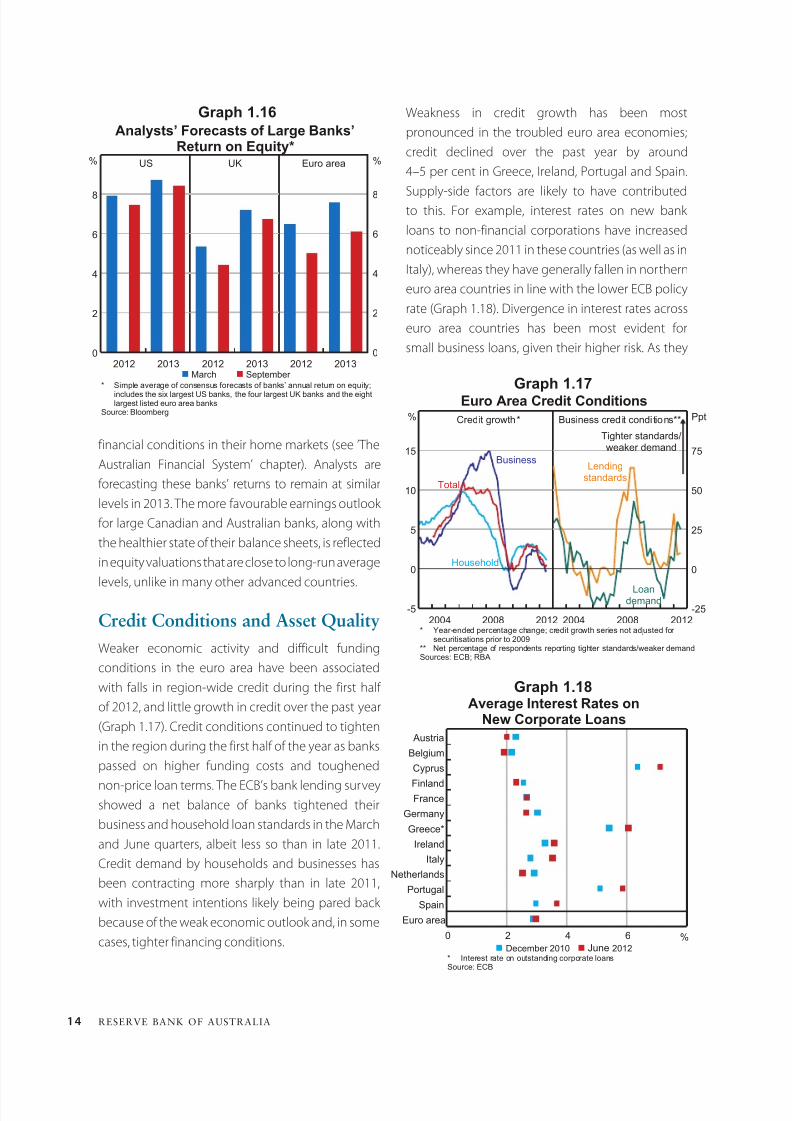
are below 1 (Graph 1.15). Consistent with these low
equity valuations, equity analysts are forecasting
the large global banks to post average returns on
equity of 5–7 per cent for 2012 as a whole, and only
slightly higher returns in 2013; these forecasts wererevised down during the past six months as the
global macro-financial environment deteriorated
(Graph 1.16). Low equity valuations may also reflect
some investor scepticism over banks’ asset valuations
and/or an additional risk premium required by
investors to compensate for heightened uncertainty.
These concerns are likely to be especially relevant for
euro area banks at the current juncture.
In contrast to many of their international peers, theprofitability of the large Canadian and Australian
banks has remained robust over recent periods,
with returns on equity generally averaging around
15 per cent, consistent with stronger economic and
Graph 1.14
-15
-10
-5
0
5
10
15
20
-15
-10
-5
0
5
10
15
20
% %
After tax and minority interests
Large Banks’ Return on Equity*
US
Euro area
UK
Canada
Australia
20122010200820062004
Japan**
* Return on equity of the six largest US banks, eight largest listed euro areabanks, four largest UK banks, three largest Japanese banks, six largestCanadian banks and four largest Australian banks; adjusted for significantmergers and acquisitions; 2012 profit is annualised and total equity isassumed constant from last reporting date
** 2003–2007 results are to financial year ended 31 MarchSources: Bloomberg; RBA; banks’ annual and interim reports
Graph 1.15
0
1
2
3
0
1
2
3
Banks’ Price-to-book-value Ratios*
2012
Australia
* Monthly; September 2012 observation is the latest available** Diversified financials
Source: Bloomberg
Ratio
201020082006
US**
UK
Canada
Euro area
Ratio
2004
7/29/2019 Rba Financial Stability Report Sep 2012
http://slidepdf.com/reader/full/rba-financial-stability-report-sep-2012 16/66
14 ReseRve bank of austRalia
financial conditions in their home markets (see ’The
Australian Financial System’ chapter). Analysts are
forecasting these banks’ returns to remain at similar
levels in 2013. The more favourable earnings outlook
for large Canadian and Australian banks, along with
the healthier state of their balance sheets, is reflected
in equity valuations that are close to long-run averagelevels, unlike in many other advanced countries.
Crdi Condiions and Ass Qualiy
Weaker economic activity and difficult funding
conditions in the euro area have been associated
with falls in region-wide credit during the first half
of 2012, and little growth in credit over the past year
(Graph 1.17). Credit conditions continued to tighten
in the region during the first half of the year as bankspassed on higher funding costs and toughened
non-price loan terms. The ECB’s bank lending survey
showed a net balance of banks tightened their
business and household loan standards in the March
and June quarters, albeit less so than in late 2011.
Credit demand by households and businesses has
been contracting more sharply than in late 2011,
with investment intentions likely being pared back
because of the weak economic outlook and, in some
cases, tighter financing conditions.
Graph 1.17
Graph 1.18
Weakness in credit growth has been most
pronounced in the troubled euro area economies;
credit declined over the past year by around
4–5 per cent in Greece, Ireland, Portugal and Spain.
Supply-side factors are likely to have contributed
to this. For example, interest rates on new bank
loans to non-financial corporations have increased
noticeably since 2011 in these countries (as well as in
Italy), whereas they have generally fallen in northern
euro area countries in line with the lower ECB policy
rate (Graph 1.18). Divergence in interest rates across
euro area countries has been most evident for
small business loans, given their higher risk. As they
Euro Area Credit Conditions
-5
0
5
10
15
-25
0
25
50
75
* Year-ended percentage change; credit growth series not adjusted for securitisations prior to 2009
** Net percentage of respondents reporting tighter standards/weaker demandSources: ECB; RBA
2012
Total
% Credit growth* Business credit conditions**
2008201220082004 2004
Ppt
Household
BusinessLending
standards
Loandemand
Tighter standards/weaker demand
Euro area
Spain
Portugal
Netherlands
Italy
Ireland
Greece*
Germany
France
Finland
Cyprus
Belgium
Austria
0 2 4 6
Average Interest Rates onNew Corporate Loans
%
* Interest rate on outstanding corporate loansSource: ECB
n December 2010 n June 2012
Graph 1.16
0
2
4
6
8
0
2
4
6
8
Analysts’ Forecasts of Large Banks’Return on Equity*
* Simple average of consensus forecasts of banks’ annual return on equity;includes the six largest US banks, the four largest UK banks and the eightlargest listed euro area banks
Source: Bloomberg
2013
%US% UK Euro area
201220132012 20132012
n March n September

7/29/2019 Rba Financial Stability Report Sep 2012
http://slidepdf.com/reader/full/rba-financial-stability-report-sep-2012 17/66
15financial stability review | s e p t e m b e r 2 0 1 2
said, risks to economic growth in the United States
are skewed to the downside and any deterioration
in economic conditions could stall this nascent
recovery. Concerns over the strength of the US
economic recovery and the labour market have
prompted the US Federal Reserve to announce
plans to undertake further monetary stimulus by
purchasing asset-backed securities.
do not have access to alternative sources of debt
finance via capital markets, tight lending conditions
for small businesses could have a negative effect
on economic activity within the region, with the
potential for adverse second-round effects on banks’
asset performance. Even some large businesses in
the euro area currently have more limited access to
capital markets than usual because of the current
low credit ratings of their sovereigns.
Banks’ asset quality has come under continued
pressure in the euro area as economic and
financial conditions have weakened to a point
that is similar to the adverse scenario used in last
year’s EBA stress tests. The large euro area banks’average non-performing loan (NPL) ratio increased
significantly over 2011 and the first half of 2012,
in contrast to most other jurisdictions where NPL
ratios have continued to drift down from crisis
peaks (Graph 1.19). Average NPL ratios are currently
highest for Cypriot, Greek, Irish and Italian banks, but
a number of banks from other countries in the region
also have very high ratios (Graph 1.20). There is also
significant market concern about the asset quality
of many Spanish banks given that property prices
continue to decline in Spain and current property
valuations may come under further downward
pressure because of future asset purchases by the
‘bad bank’ being introduced in Spain.
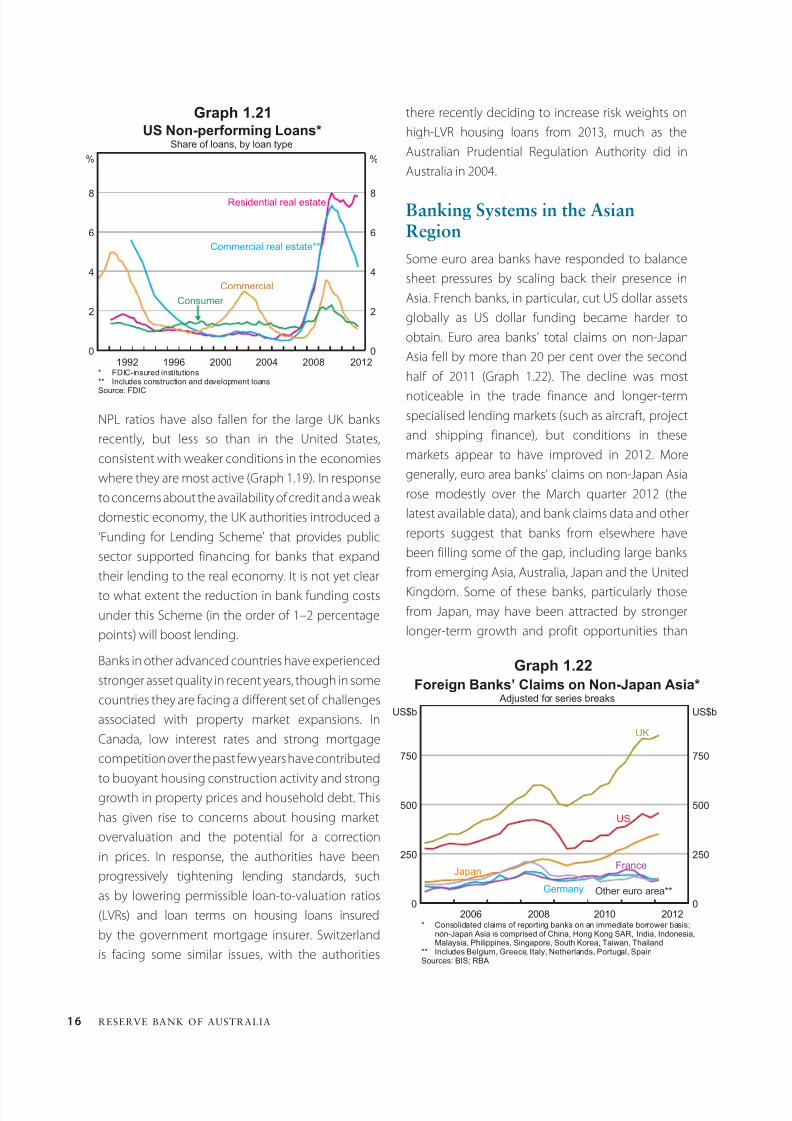
In the United States, banks’ NPL ratios have
trended lower over recent quarters, in line with
the gradual improvement in parts of the US
economy. Non-performing ratios for commercial
and consumer loans have now declined to aroundtheir long-run average levels, while the ratio for
commercial real estate loans has fallen sharply,
consistent with the partial recovery in commercial
real estate prices (Graph 1.21). In contrast, residential
real estate NPLs remain at very high levels of around
8 per cent; although around one-fifth of housing
loans are estimated to be in negative equity given
the decline in housing prices. There are tentative
signs of a recovery in the housing market, with
prices rising mildly over the past few months. That
Graph 1.19
Graph 1.20Large European Banks’Non-performing Loans*
%* Definitions of ‘non-performing’ differ across jurisdictions, and in
some cases exclude loans that are 90+ days past due but are notimpaired; latest available ratios have been used for someinstitutions where June 2012 data are unavailable
Sources: SNL Financial; banks’ annual and interim reports
UK
Sweden
Spain
Portugal
Netherlands
Italy
Ireland
Greece
Germany
France
DenmarkCyprus
Belgium
Austria
0 5 10 15 20 25
Maximum, minimum and weighted average ratios, June 2012
0
2
4
6
0
2
4
6
Large Banks’ Non-performing Loans*Share of loans
US
20122008 20102006
%
Other Europe
UK
Canada
Euro area
* Definitions of ‘non-performing’ differ across jurisdictions, and in somecases exclude loans that are 90+ days past due but are not impaired;includes 18 large US banks, 52 large institutions from across the euroarea, 13 large other European banks, four UK banks, the six largestCanadian banks and the four largest Australian banks; latest available ratioshave been used for some euro area and UK institutions where June 2012data are unavailable
Sources: APRA; RBA; SNL F inancial; banks’ annual and interim reports
%
Australia
7/29/2019 Rba Financial Stability Report Sep 2012
http://slidepdf.com/reader/full/rba-financial-stability-report-sep-2012 18/66
16 ReseRve bank of austRalia
NPL ratios have also fallen for the large UK banks
recently, but less so than in the United States,
consistent with weaker conditions in the economies
where they are most active (Graph 1.19). In response
to concerns about the availability of credit and a weak
domestic economy, the UK authorities introduced a
‘Funding for Lending Scheme’ that provides public
sector supported financing for banks that expandtheir lending to the real economy. It is not yet clear
to what extent the reduction in bank funding costs
under this Scheme (in the order of 1–2 percentage
points) will boost lending.
Banks in other advanced countries have experienced
stronger asset quality in recent years, though in some
countries they are facing a different set of challenges
associated with property market expansions. In
Canada, low interest rates and strong mortgage
competition over the past few years have contributed
to buoyant housing construction activity and strong
growth in property prices and household debt. This
has given rise to concerns about housing market
overvaluation and the potential for a correction
in prices. In response, the authorities have been
progressively tightening lending standards, such
as by lowering permissible loan-to-valuation ratios
(LVRs) and loan terms on housing loans insured
by the government mortgage insurer. Switzerlandis facing some similar issues, with the authorities
there recently deciding to increase risk weights on
high-LVR housing loans from 2013, much as the
Australian Prudential Regulation Authority did in
Australia in 2004.
banking Syss in h AsianRgion
Some euro area banks have responded to balance
sheet pressures by scaling back their presence in
Asia. French banks, in particular, cut US dollar assets
globally as US dollar funding became harder to
obtain. Euro area banks’ total claims on non-Japan
Asia fell by more than 20 per cent over the second
half of 2011 (Graph 1.22). The decline was mostnoticeable in the trade finance and longer-term
specialised lending markets (such as aircraft, project
and shipping finance), but conditions in these
markets appear to have improved in 2012. More
generally, euro area banks’ claims on non-Japan Asia
rose modestly over the March quarter 2012 (the
latest available data), and bank claims data and other
reports suggest that banks from elsewhere have
been filling some of the gap, including large banks
from emerging Asia, Australia, Japan and the United
Kingdom. Some of these banks, particularly those
from Japan, may have been attracted by stronger
longer-term growth and profit opportunities than
Graph 1.21
Graph 1.22
US Non-performing Loans*Share of loans, by loan type
% %
Commercial real estate**
0
2
4
6
8
0
2
4
6
8
Commercial
Consumer
Residential real estate
201220082004200019961992
* FDIC-insured institutions** Includes construction and development loansSource: FDIC
0
250
500
750
0
250
500
750
Adjusted for series breaksForeign Banks’ Claims on Non-Japan Asia*
US$b
UK
* Consolidated claims of reporting banks on an immediate borrower basis;
non-Japan Asia is comprised of China, Hong Kong SAR, India, Indonesia,Malaysia, Philippines, Singapore, South Korea, Taiwan, Thailand** Includes Belgium, Greece, Italy, Netherlands, Portugal, SpainSources: BIS; RBA
US
Japan
Other euro area**Germany
France
201020082006
US$b
2012

7/29/2019 Rba Financial Stability Report Sep 2012
http://slidepdf.com/reader/full/rba-financial-stability-report-sep-2012 19/66
17financial stability review | s e p t e m b e r 2 0 1 2
Graph 1.23
Graph 1.24those available in their home markets. They might
also have been taking advantage of higher US dollar
funding as investors have cut back their lending to
euro area banks. However, the diversification and
other benefits from cross-border lending must be
weighed against the resultant funding, credit and
operational risks.
Putting these shifts in perspective, though, euro
area banks account for only a small share of credit in
Asia, and local Asian banks have little direct exposure
to Europe. Asian banking systems have therefore
been resilient to the turmoil in the euro area, and
the local banks’ limited usage of wholesale funding
has largely insulated them from volatility in globalfunding markets. Their profitability has also generally
been robust over recent years and NPL ratios have
declined to historically low levels (Graph 1.23). The
question is whether these trends have been flattered
by strong growth in domestic credit and nominal
incomes in the region.
Property prices have also risen significantly in a
few economies, especially where exchange rate
regimes have limited the scope to raise interest rates,prompting authorities to introduce a range of other
measures over recent years to cool their property
markets (Graph 1.24). If property prices were to
unwind, or global growth – and thus export sector
revenue – were to slow substantially, Asian banks
could encounter some credit quality problems.
That said, capital buffers have increased over recent
years to fairly high levels, which should help banks
cope with any slowing in economic activity and
associated rise in problem loans. The authorities in
most of these countries also generally have room to
ease macroeconomic policies if necessary.
Slowing economic activity in India over the past
year has contributed to an increase in banks’ NPL
ratios and slower profit growth, especially for some
state-owned banks. There has also been a sharp
increase in the share of Indian banks’ loans that
have been restructured to assist troubled borrowers.
In China, the banks’ aggregate NPL ratio remains
at a low level of about 1 per cent, but there are
signs that bank asset performance has begun todeteriorate this year as the pace of economic activity
has moderated.2 Some large Chinese commercial
banks have reported a pick-up in their NPL ratios
for specific industries or regions, while a number of
smaller commercial banks have recorded increases
in their overall NPL ratios. There have also been
reports of repayment difficulties in parts of the
2 For information on trends in Chinese banks’ asset performance over
the past couple of decades, see Turner G, N Tan and D Sadeghian
(2012), ‘The Chinese Banking System’, RBA Bulletin, September,
pp 53–63.
Non-Japan Asia – Non-performing Loans*
Singapore**%
0
15
30
0
15
30
5
10
5
10
* Definitions of ‘non-performing’ differ across jurisdictions; dots areJune quarter estimates with the exception of Korea where estimate isfor the March quarter
** Domestic banks only*** Data for 2002–2004 are for major commercial banks onlySources: CEIC; RBA; banks’ annual reports; national banking regulators
% %
%
Hong Kong SARTaiwan
Korea
India
China***
Thailand
Indonesia
Malaysia
201220072002
Share of loans
2012200720021997
0
50
100
150
200
Asset Prices and Credit
2003
China
20121994
Hong KongSAR
Singapore
Index %
* Adjusted for inflation; for China, data are an average of new and existingresidential property prices
Residential property prices*June 2005 = 100
Credit-to-GDP
40
70
100
130
160
Taiwan
Sources: CEIC; RBA; central banks
2003 20121994

7/29/2019 Rba Financial Stability Report Sep 2012
http://slidepdf.com/reader/full/rba-financial-stability-report-sep-2012 20/66
18 ReseRve bank of austRalia
private (non-bank) lending sector, which mainly
services relatively small and higher-risk business
borrowers. While the direct links between these
lenders and the banking sector are not large, there
could be indirect links and their experience may
signal a broader deterioration in asset quality in the
Chinese financial system that a growing number
of commentators are now predicting. Investor
concerns over Chinese banks’ asset quality are
reflected in significant declines in their share prices
over the past six months.
Concerns about the effects of slowing economic
activity have already prompted Chinese policymakers
to ease fiscal and monetary settings this year. Theyhave also taken a number of prudential and other
measures to support lending growth, including:
delaying the introduction of Basel III capital standards
by one year to the start of 2013, to be in line with the
international timetable; and granting banks greater
ability to price loans below benchmark lending rates
set by the People’s Bank of China.3 Banks have also
been encouraged to ensure that growth in lending
to small businesses is maintained at a pace that is
at, or above, total credit growth. To facilitate lending
to small businesses, the China Banking Regulatory
Commission has reduced the risk weighting on small
business loans and allowed certain small business
loans to be excluded from regulatory loan-to-
deposit ratio calculations. Because lending to small
businesses currently represents a relatively small
share of Chinese banks’ total lending, an increase in
this type of lending could reduce concentrations in
banks’ loan portfolios, as well as support economic
activity, though the risks of such loans will also need
to be carefully managed. R
3 The larger allowable discount on Chinese banks’ loan rates is part of a
broader move towards greater interest rate flexibility in China; all bank
deposit rates are now permitted to be set up to 10 per cent above the
relevant benchmark rates.
7/29/2019 Rba Financial Stability Report Sep 2012
http://slidepdf.com/reader/full/rba-financial-stability-report-sep-2012 21/66
19financial stability review | s e p t e m b e r 2 0 1 2
2. th Ausralian Financial Sys
The Australian banking system remains well placed
to cope with shocks from abroad, such as those that
may emanate from the ongoing problems in Europe.
Australian banks’ direct exposures to the most
troubled euro area countries are small and declining.
Disruptions to wholesale funding markets and/or a
deterioration in global economic activity would likely
be more important contagion channels to Australian
banks from any escalation of the European problems.
However, the banks are better positioned to manage
these risks than prior to the 2008–2009 crisis, having
substantially strengthened their capital, funding and
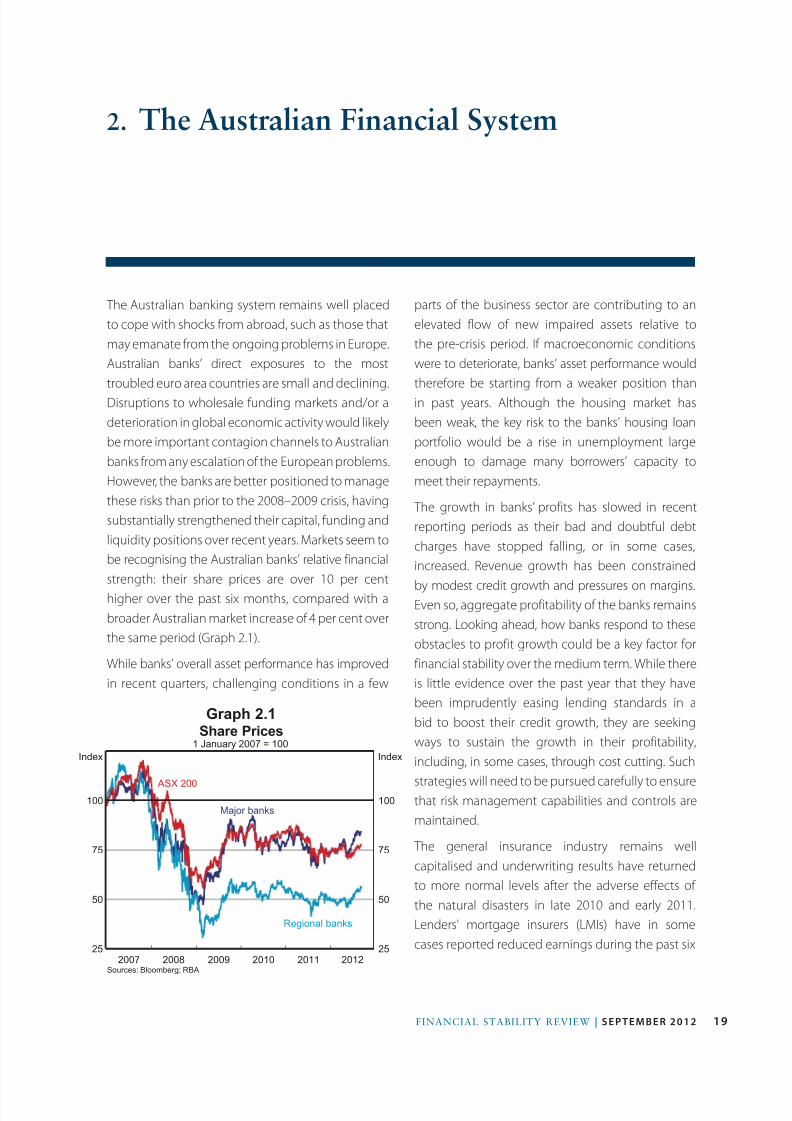
liquidity positions over recent years. Markets seem to
be recognising the Australian banks’ relative financialstrength: their share prices are over 10 per cent
higher over the past six months, compared with a
broader Australian market increase of 4 per cent over
the same period (Graph 2.1).
While banks’ overall asset performance has improved
in recent quarters, challenging conditions in a few
parts of the business sector are contributing to an
elevated flow of new impaired assets relative to
the pre-crisis period. If macroeconomic conditions
were to deteriorate, banks’ asset performance would
therefore be starting from a weaker position than
in past years. Although the housing market has
been weak, the key risk to the banks’ housing loan
portfolio would be a rise in unemployment large
enough to damage many borrowers’ capacity to
meet their repayments.
The growth in banks’ profits has slowed in recent
reporting periods as their bad and doubtful debt
charges have stopped falling, or in some cases,
increased. Revenue growth has been constrained
by modest credit growth and pressures on margins.
Even so, aggregate profitability of the banks remains
strong. Looking ahead, how banks respond to these
obstacles to profit growth could be a key factor for
financial stability over the medium term. While there
is little evidence over the past year that they have
been imprudently easing lending standards in a
bid to boost their credit growth, they are seeking
ways to sustain the growth in their profitability,
including, in some cases, through cost cutting. Such
strategies will need to be pursued carefully to ensure
that risk management capabilities and controls are
maintained.
The general insurance industry remains well
capitalised and underwriting results have returned
to more normal levels after the adverse effects of
the natural disasters in late 2010 and early 2011.
Lenders’ mortgage insurers (LMIs) have in some
cases reported reduced earnings during the past six
Graph 2.1
l l l l l25
50
75
100
25
50
75
100
Share Prices
Sources: Bloomberg; RBA
Index
ASX 200
Major banks
Regional banks
2012
1 January 2007 = 100
20112010200920082007
Index

7/29/2019 Rba Financial Stability Report Sep 2012
http://slidepdf.com/reader/full/rba-financial-stability-report-sep-2012 22/66
20 ReseRve bank of austRalia
months, as recent weakness in residential property
markets has boosted the number and average
size of claims on them. Were this property market
weakness to be extended and coupled with higher
unemployment, LMIs could experience even higher
claims. The LMI sector is well positioned, though,
because its capital requirements are calibrated to
withstand a substantially weaker outcome than is
currently in evidence.
banks’ euro Ara Risks
Australian-owned banks continue to report very
limited direct exposures to the sovereign debt
of euro area countries facing the greatest fiscalproblems (Table 2.1). On the assets side of their
balance sheets, the banks are still indirectly exposed
to euro area sovereign debt problems through
several channels. One is through their claims on euro
area banks – such as the French, German and Dutch
banks – which in turn have substantial exposures to
the weaker euro area countries. Australian-owned
banks’ exposures to these euro area banks are
quite low, however, at less than 1 per cent of their
consolidated assets as at end March 2012. A more
important indirect transmission channel would be if
the European problems resulted in a sharp slowing
in global, and consequently, Australian economic
growth. Depending on the nature and size of
any economic slowdown, Australian banks’ asset
performance could deteriorate in such a situation.
As the experience of the past few years has shown,
the biggest risk from an escalation of European
problems comes from the liabilities side of the
Australian banks’ balance sheets. In particular,
tensions in Europe could trigger a renewed increase
in risk aversion and disruption to global capital
markets, which would likely undermine Australian
banks’ access to offshore wholesale funding.
Compared with several years ago, however, banks
are in a better position to cope with such disruptions.
Funding and Liquidiy The ongoing difficulties in Europe have been
contributing to volatile funding conditions for
Australian banks, but in recent quarters wholesale
funding pressures have eased from the levels of
late last year. Offshore investors have focused on
the relatively strong position of the Australian banks
compared with those in some other countries. The
banks have therefore been able to take advantage
of periods of more favourable market conditions toissue opportunistically.
The Australian banks issued around $50 billion of
bonds in the past six months, mostly in unsecured
form. This was a little less than the amount issued in
Table 2.1: Australian-owned Banks’ Claims on the Euro AreaUltimate risk basis, as at end March 2012
Total of which:
Banks Publicsector
Privatesector
$ billionPer cent of
assetsPer cent of
assetsPer cent of
assetsPer cent of
assets
Euro area 48.1 1.6 0.7 0.3 0.5
of which:
Greece, Ireland, Italy,
Portugal and Spain 4.7 0.2 0.0 0.0 0.1
France, Germany and
the Netherlands38.9 1.3 0.6 0.3 0.4
Source: APRA
7/29/2019 Rba Financial Stability Report Sep 2012
http://slidepdf.com/reader/full/rba-financial-stability-report-sep-2012 23/66
21financial stability review | s e p t e m b e r 2 0 1 2
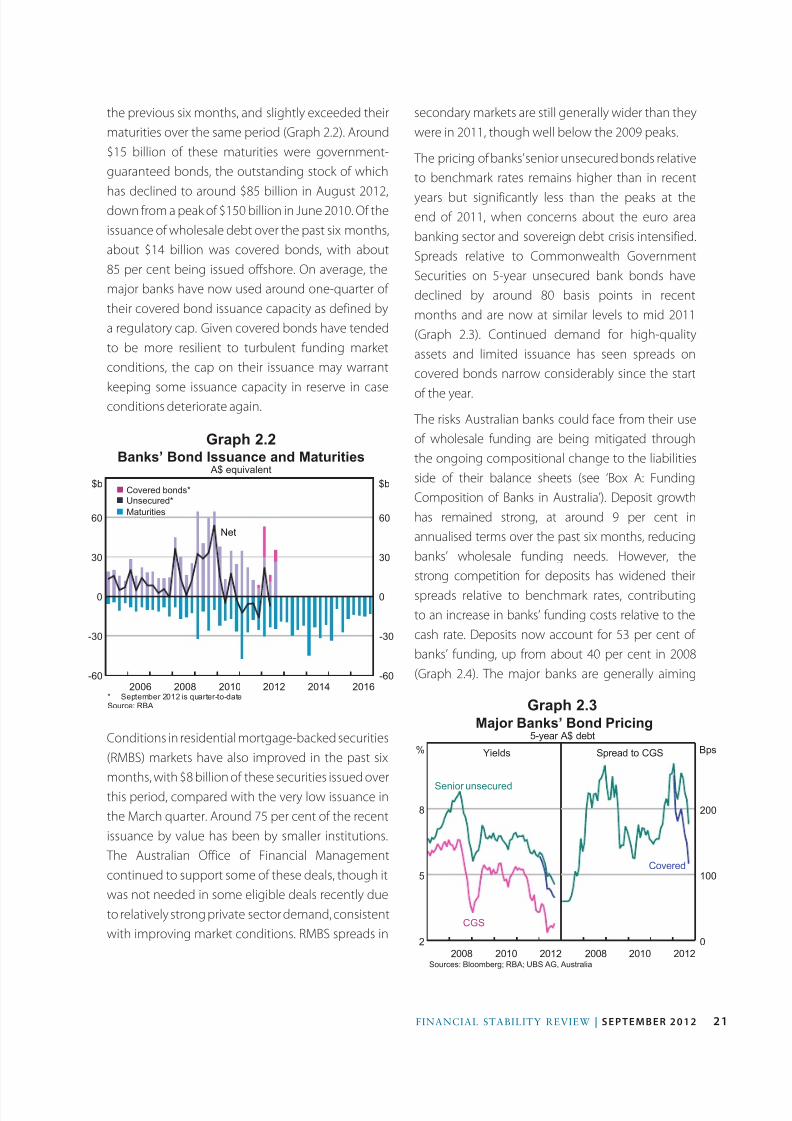
the previous six months, and slightly exceeded their
maturities over the same period (Graph 2.2). Around
$15 billion of these maturities were government-
guaranteed bonds, the outstanding stock of which
has declined to around $85 billion in August 2012,
down from a peak of $150 billion in June 2010. Of the
issuance of wholesale debt over the past six months,
about $14 billion was covered bonds, with about
85 per cent being issued offshore. On average, the
major banks have now used around one-quarter of
their covered bond issuance capacity as defined by
a regulatory cap. Given covered bonds have tended
to be more resilient to turbulent funding market
conditions, the cap on their issuance may warrant
keeping some issuance capacity in reserve in case
conditions deteriorate again.
secondary markets are still generally wider than they
were in 2011, though well below the 2009 peaks.
The pricing of banks’ senior unsecured bonds relative
to benchmark rates remains higher than in recent
years but significantly less than the peaks at the
end of 2011, when concerns about the euro area
banking sector and sovereign debt crisis intensified.
Spreads relative to Commonwealth Government
Securities on 5-year unsecured bank bonds have
declined by around 80 basis points in recent
months and are now at similar levels to mid 2011
(Graph 2.3). Continued demand for high-quality
assets and limited issuance has seen spreads on
covered bonds narrow considerably since the startof the year.
The risks Australian banks could face from their use
of wholesale funding are being mitigated through
the ongoing compositional change to the liabilities
side of their balance sheets (see ‘Box A: Funding
Composition of Banks in Australia’). Deposit growth
has remained strong, at around 9 per cent in
annualised terms over the past six months, reducing
banks’ wholesale funding needs. However, thestrong competition for deposits has widened their
spreads relative to benchmark rates, contributing
to an increase in banks’ funding costs relative to the
cash rate. Deposits now account for 53 per cent of
banks’ funding, up from about 40 per cent in 2008
(Graph 2.4). The major banks are generally aiming
Conditions in residential mortgage-backed securities
(RMBS) markets have also improved in the past six
months, with $8 billion of these securities issued over
this period, compared with the very low issuance in
the March quarter. Around 75 per cent of the recent
issuance by value has been by smaller institutions.
The Australian Office of Financial Management
continued to support some of these deals, though it
was not needed in some eligible deals recently due
to relatively strong private sector demand, consistent
with improving market conditions. RMBS spreads in
Graph 2.2
Graph 2.3
-60
-30
0
30
60
-60
-30
0
30
60
Banks’ Bond Issuance and Maturities
$b
2016
Net
n Covered bonds*n Unsecured*
n Maturities
* September 2012 is quarter-to-dateSource: RBA
20142012201020082006
$b
A$ equivalent
2
5
8
0
100
200
Covered
CGS
Major Banks’ Bond Pricing5-year A$ debt
Spread to CGS% BpsYields
2010 20122008 2010 20122008Sources: Bloomberg; RBA; UBS AG, Australia
Senior unsecured

7/29/2019 Rba Financial Stability Report Sep 2012
http://slidepdf.com/reader/full/rba-financial-stability-report-sep-2012 24/66
22 ReseRve bank of austRalia
to fund new lending with new deposits on a dollar
for dollar basis; changes in their stock of lending and
deposits show this has been happening for some
time (Graph 2.5). This approach is likely to support
a continued upward trend in the proportion of
funding sourced from deposits, at least in the near
term. Stronger competition for deposits would mean
banks would face the prospect of their margins
coming under pressure from further increases in
funding costs, though the risk to their profits would
be mitigated to the extent banks can reprice their
loan books.
Table 2.2: Banks’ Liquid AssetsDomestic books, excludes interbank deposits
March 2007 March 2009 March 2012
Level Share(a)
Level Share(a)
Level Share(a)
$ billion Per cent $ billion Per cent $ billion Per cent
Liquid assets 98 6 199 8 270 10
Commonwealth Government
& semi-government securities 6 6 29 15 82 30
Short-term bank paper 54 56 94 47 59 22
Long-term bank paper 9 10 42 21 79 29
Other(b) 28 29 33 17 50 18
Total bank assets 1 640 2 411 2 636
Memo: Self-securitised assets 0 142 178
(a) Share of total A$ assets, subcomponents are the share of l iquid assets(b) Includes notes and coins, A$ debt issued by non-residents and securitised assets (excluding self-securitised assets)Sources: ABS; APRA; RBA
Graph 2.4 Graph 2.5
Banks have also improved their ability to manage
funding stress by strengthening their liquidity
positions. Liquid assets – cash and securities eligible
for normal repo operations with the RBA – currently
account for about 10 per cent of banks’ domestic
Australian dollar assets, up from around 6 per
cent in early 2007 (Table 2.2). In addition, banks’
holdings of self-securitised RMBS have increased,
and now total around $180 billion (7 per cent of
domestic Australian dollar assets), up from about
$145 billion in 2011. The composition of liquid asset
portfolios has also changed over recent years, with
an increasing share held in government securities
%%
0
10
20
30
40
50
0
10
20
30
40
50
Short-term debt**
Equity
Securitisation
Long-term debt
Domestic deposits
Share of total
Banks’ Funding*
* Adjusted for movements in foreign exchange rates
** Includes deposits and intragroup funding from non-residentsSources: APRA; RBA; Standard & Poor’s
2004 2006 2008 2010 2012-120
-60
0
60
120
180
-120
-60
0
60
120
180
Major Banks’ Credit and DepositsYear-ended change in stock
$b
2012
Deposits less credit
* Excludes securitisations** Excludes intragroup depositsSources: APRA; RBA
Credit*
Deposits**
2010200820062004
$b

7/29/2019 Rba Financial Stability Report Sep 2012
http://slidepdf.com/reader/full/rba-financial-stability-report-sep-2012 25/66
23financial stability review | s e p t e m b e r 2 0 1 2
and long-term bank bonds, and less in short-term
bank paper. These trends in banks’ liquidity positions
are partly a response to the forthcoming Basel III
liquidity standards which will require banks to hold
more and higher-quality liquid assets. A structural
shortage of higher-quality liquid assets in Australia,
stemming from the low level of government debt,
means banks will also need to access the RBA’s
Committed Liquidity Facility to meet part of their
Basel III requirements. The Australian Prudential
Regulation Authority (APRA) is in the process
of developing a framework for determining the
extent to which banks will be able to count this
facility towards meeting their Liquidity Coverage
Ratio versus holding more eligible liquid assets or
changing their business models to reduce their
liquid asset requirements.
Crdi Condiions and LndingSandards
Banks’ domestic loan books have continued to grow at
a relatively modest pace in recent quarters, despite a
pick-up in business credit (Graph 2.6). As discussed in
the ‘Household and Business Balance Sheets’ chapter,
households’ demand for credit remains restrained
as they continue to consolidate their balance
sheets; growth in financial institutions’ lending to
households slowed a little to an annualised rate of
around 4 per cent in recent months compared with
4 per cent in the second half of 2011. Following
a number of years of below-system growth, the
smaller Australian-owned banks have recently
recorded a stronger rate of growth in householdlending to now be broadly in line with the major
banks. After contracting over much of the past three
years, financial institutions’ lending to businesses has
picked up in recent months, to an annualised growth
rate of around 6 per cent, driven by the major and
foreign-owned banks.
According to industry liaison, household and
business credit growth is expected to remain fairly
subdued for some time because of weak demand. If this proves correct, banks could struggle to achieve
the rate of profit growth they were accustomed
to in previous decades of rapid credit growth. In
this environment, it would be undesirable if banks
responded by loosening their lending standards or
imprudently shifting into new products or markets
in a bid to boost their balance sheet growth. While
lending standards have eased somewhat since
2009, over the past year they appear to have been
largely unchanged. Recently, some banks have beenadjusting their assessments of borrower’s repayment
capabilities by shifting to a new data source on
estimated living expenses, but the net effect of
this on the overall availability of credit is likely to
be minor (for more details, see the ‘Household and
Business Balance Sheets’ chapter).
Ass prforanc
Banks’ asset performance has gradually improvedover the past two years but remains weaker than in
the years leading up to the 2008–2009 crisis. On a
consolidated group basis, the ratio of non-performing
assets to total on-balance sheet assets has declined
from a peak of 1.7 per cent in mid 2010, to 1.4 per
cent in June 2012 (Graph 2.7). The improvement over
this period was mostly driven by a fall in the share
of loans classified as impaired (i.e. not well secured
and where repayment is doubtful), while the share
of loans classified as past due (where the loan is inarrears but well secured) declined only slightly.
Graph 2.6
-40
-20
0
20
40
60
Credit GrowthSix-month-ended, annualised
Sources: APRA; RBA
Other Australian-owned banks
% %
Major banks
2008 2012
Foreign-ownedbanks
-40
-20
0
20
40
60
Household Business
Financialinstitutions total
2008 2012
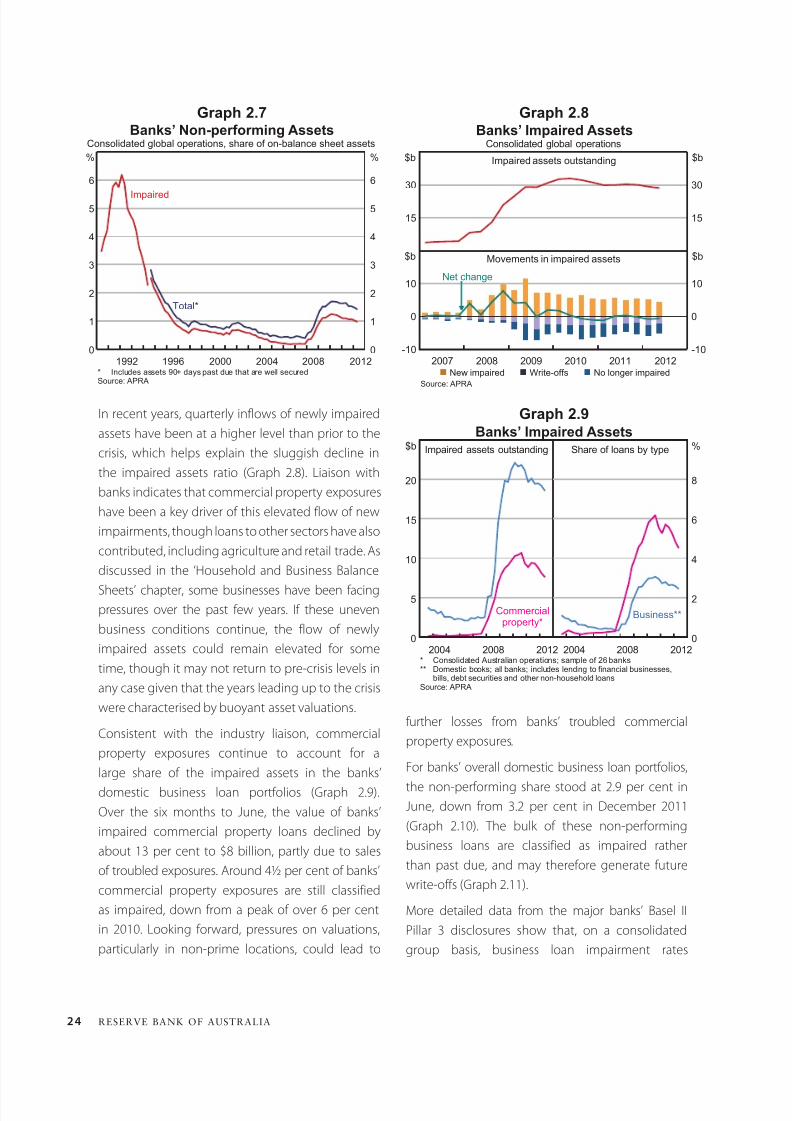
7/29/2019 Rba Financial Stability Report Sep 2012
http://slidepdf.com/reader/full/rba-financial-stability-report-sep-2012 26/66
24 ReseRve bank of austRalia
Graph 2.7 Graph 2.8
Graph 2.9In recent years, quarterly inflows of newly impaired
assets have been at a higher level than prior to the
crisis, which helps explain the sluggish decline in
the impaired assets ratio (Graph 2.8). Liaison with
banks indicates that commercial property exposures
have been a key driver of this elevated flow of new
impairments, though loans to other sectors have also
contributed, including agriculture and retail trade. As
discussed in the ‘Household and Business Balance
Sheets’ chapter, some businesses have been facing
pressures over the past few years. If these uneven
business conditions continue, the flow of newly
impaired assets could remain elevated for some
time, though it may not return to pre-crisis levels in
any case given that the years leading up to the crisis
were characterised by buoyant asset valuations.
Consistent with the industry liaison, commercial
property exposures continue to account for a
large share of the impaired assets in the banks’
domestic business loan portfolios (Graph 2.9).
Over the six months to June, the value of banks’
impaired commercial property loans declined by
about 13 per cent to $8 billion, partly due to sales
of troubled exposures. Around 4 per cent of banks’
commercial property exposures are still classified
as impaired, down from a peak of over 6 per cent
in 2010. Looking forward, pressures on valuations,
particularly in non-prime locations, could lead to
further losses from banks’ troubled commercial
property exposures.
For banks’ overall domestic business loan portfolios,
the non-performing share stood at 2.9 per cent in
June, down from 3.2 per cent in December 2011
(Graph 2.10). The bulk of these non-performing
business loans are classified as impaired rather
than past due, and may therefore generate future
write-offs (Graph 2.11).
More detailed data from the major banks’ Basel II
Pillar 3 disclosures show that, on a consolidated
group basis, business loan impairment rates
Banks’ Non-performing Assets
0
1
2
3
4
5
6
0
1
2
3
4
5
6
Consolidated global operations, share of on-balance sheet assets
%
Impaired
Total*
* Includes assets 90+ days past due that are well securedSource: APRA
2004 2008 2012200019961992
%
15
30
15
30
Banks’ Impaired AssetsConsolidated global operations
Source: APRA
2007
Impaired assets outstanding $b$b
-10
0
10
-10
0
10
Movements in impaired assets
2008 2010 2011
$b$b
Net change
n New impaired
n Write-offs
n No longer impaired
20122009
Banks’ Impaired Assets
0
5
10
15
20
0
2
4
6
8
2012
Business**
$b Impaired assets outstanding
Commercialproperty*
20082004 20122008* Consolidated Australian operations; sample of 26 banks** Domestic books; all banks; includes lending to financial businesses,
bills, debt securities and other non-household loansSource: APRA
Share of loans by type %
2004

7/29/2019 Rba Financial Stability Report Sep 2012
http://slidepdf.com/reader/full/rba-financial-stability-report-sep-2012 27/66
25financial stability review | s e p t e m b e r 2 0 1 2
Graph 2.10 Graph 2.12
Graph 2.11
cafes and restaurants. These data also show that
the average business loan write-off rate increased
slightly during the six months to March 2012, with
the property and business services, and construction
industries continuing to have relatively high write-off
rates.
Asset performance in the banks’ domestic mortgage
portfolios has been fairly steady in recent quarters.
The share of the banks’ domestic housing loans that
is non-performing remained around 0.7 per cent
over the six months to June, after falling slightly in
the second half of 2011 (Graph 2.10). Within this, the
share of past-due loans has declined a little sinceits peak in mid 2011, while the share of impaired
loans has continued to edge up slowly, consistent
with the weakness in housing prices in some parts
of Australia (Graph 2.11). Further declines in housing
prices could result in more impaired housing loans,
though recent indicators suggest that prices are
beginning to stabilise in many regions.
The improvement in banks’ domestic asset
performance over the first half of 2012 wasbroad based across the industry (Graph 2.13).
declined across most industries during the six
months to March 2012 (Graph 2.12). A notable
exception was loans to the construction industry,
where the average impairment rate increased fairly
sharply over this period. Although the construction
industry now has the highest impairment rate of all
industries, it accounts for only a small share, around
4 per cent, of the major banks’ total business loans.
Other industries with above-average impairment
rates include property and business services
(incorporating commercial property), agriculture,forestry, fishing and mining, and accommodation,
0
1
2
3
4
5
Domestic books
Banks’ Non-performing Assets
%
* Includes lending to financial businesses, bills, debt securities and other non-household loansSource: APRA
0
1
2
3
4
5
Share of all loans Share of loans by type
Total
Business*
Personal
Housing
20122010
%
2008 201220102008
Banks’ Asset Performance
0
5
10
15
20
0
5
10
15
20
* 90+ days but well secured** Includes lending to financial businesses, bills, debt securities and
other non-household loansSource: APRA
2012
Impaired
$b
Domestic books
Past due*
$b
201220082004 2008
Non-performing housingassets
Non-performing businessassets**
2004
Asset Performance by Industry
* December 2011 for CBA** June 2012 for CBASource: Banks’ Basel II Pillar 3 reports
%
2
4
2
4
0.0
0.2
0.4
0.0
0.2
0.4
%
%% Write-offs, six months ending
A c c o m m o d a
t i o n ,
c a f e s a n d r e s t a u r a n t s
C o n s t r u c t i o n
P r o p e r t y
a n d
b u s i n e s s s e r v i c e s
A g r i c u l t u r e ,
f o r e
s t r y ,
f i s h i n g a n d m i n i n g
M a n u f a c t u r i n g
O
t h e r
W h o l e s a l e
a n d
r e t a i l t r a d e
T r a n s p o r t a n d s t o r a g e
A l l b u s i n e s s
Impaired assets
Major banks’ global operations, per cent of industry exposures
n September 2011*n March 2012**

7/29/2019 Rba Financial Stability Report Sep 2012
http://slidepdf.com/reader/full/rba-financial-stability-report-sep-2012 28/66
26 ReseRve bank of austRalia
Graph 2.14
Foreign-owned banks, along with the smaller
Australian-owned banks, continue to have weaker
asset performance than the major banks, in
large part due to problems in their business loan
portfolios. The non-performing assets ratio for credit
unions and building societies (CUBS) rose a little
over the six months to June but remains much lower
than that for the banks. Compared with banks, CUBS
make a larger share of their loans to households, so it
is not surprising that their overall asset performance
is better. But this also means the recent weakness
in the housing market may have a bigger effect on
their loan portfolios.
Caial and profis
The Australian banks have continued to strengthen
their capital positions over recent years, helping
improve their resilience to shocks. Their aggregate Tier 1 capital ratio rose further over the first half of
the year, to 10 per cent of risk-weighted assets, up
from about 8 per cent in mid 2009 (Graph 2.14).
This increase has been broad based, with most
individual banks reporting increases in their Tier 1
capital ratios in the range of 1 to 3 percentage
points in the past couple of years. This reflects the
increased emphasis on Tier 1 capital and that some
Tier 2 instruments will not qualify as capital under
Basel III. The banks’ aggregate Tier 2 capital ratio hascontinued to decline in recent quarters as banks
have chosen not to replace most of their maturing
subordinated debt. As a result, the total capital ratio
has not risen as much as the Tier 1 ratio in recent
years, but it is still relatively high at 11.8 per cent
in June 2012. CUBS have maintained their higher
capital ratios, consistent with their less diversified
business models and different corporate structure;
their aggregate Tier 1 capital ratio stood at 15.7 per
cent in June 2012.
After issuing large amounts of new equity in 2008
and 2009, most of the growth in banks’ Tier 1 capital
in recent years has been organic, mainly through
earnings retention. Banks’ stock of retained earnings
Graph 2.13
0
1
2
3
4
Domestic booksBanks’ Asset Performance and Lending
Index
Source: APRA
80
100
120
140
160
Non-performing assetsShare of loans
Loans outstandingJune 2007 = 100
Major banks
Foreign-ownedbanks
20122010
%
2012201020082008
Other Australian-ownedbanks
Capital Ratios*
0
4
8
12
0
4
8
12
Locally incorporated banks
Tier 1
Tier 2
Total
* Per cent of risk-weighted assets; break in March 2008 due to theintroduction of Basel II for most banks
Source: APRA
200219971992 20122007
% %
Banks’ non-performing overseas assets were steady
at around 0.3 per cent of their consolidated assets
in the year to June, after peaking in mid 2010 at
0.4 per cent. However, the performance of the banks’
overseas assets has been mixed across countriesin recent quarters. For the banks’ New Zealand
operations, which account for about 40 per cent
of their foreign exposures, asset performance has
improved over recent quarters and should continue
to do so if the better economic conditions in New
Zealand persist. In contrast, the actual and expected
asset performance of the banks’ UK operations,
which represent around 20 per cent of their foreign
exposures, remain weaker given the fragile UK
economy.
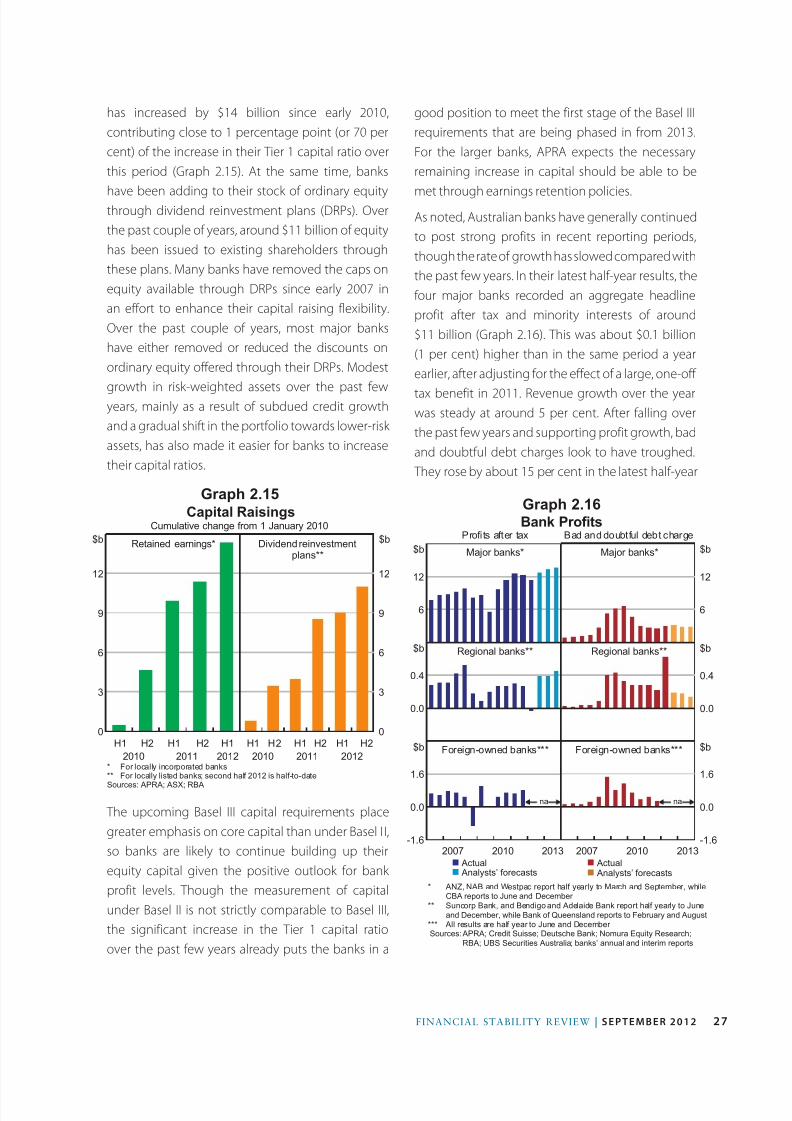
7/29/2019 Rba Financial Stability Report Sep 2012
http://slidepdf.com/reader/full/rba-financial-stability-report-sep-2012 29/66
27financial stability review | s e p t e m b e r 2 0 1 2
good position to meet the first stage of the Basel III
requirements that are being phased in from 2013.
For the larger banks, APRA expects the necessary
remaining increase in capital should be able to be
met through earnings retention policies.
As noted, Australian banks have generally continued
to post strong profits in recent reporting periods,
though the rate of growth has slowed compared with
the past few years. In their latest half-year results, the
four major banks recorded an aggregate headline
profit after tax and minority interests of around
$11 billion (Graph 2.16). This was about $0.1 billion
(1 per cent) higher than in the same period a year
earlier, after adjusting for the effect of a large, one-off tax benefit in 2011. Revenue growth over the year
was steady at around 5 per cent. After falling over
the past few years and supporting profit growth, bad
and doubtful debt charges look to have troughed.
They rose by about 15 per cent in the latest half-year
has increased by $14 billion since early 2010,
contributing close to 1 percentage point (or 70 per
cent) of the increase in their Tier 1 capital ratio over
this period (Graph 2.15). At the same time, banks
have been adding to their stock of ordinary equity
through dividend reinvestment plans (DRPs). Over
the past couple of years, around $11 billion of equity
has been issued to existing shareholders through
these plans. Many banks have removed the caps on
equity available through DRPs since early 2007 in
an effort to enhance their capital raising flexibility.
Over the past couple of years, most major banks
have either removed or reduced the discounts on
ordinary equity offered through their DRPs. Modest
growth in risk-weighted assets over the past few
years, mainly as a result of subdued credit growth
and a gradual shift in the portfolio towards lower-risk
assets, has also made it easier for banks to increase
their capital ratios.
Graph 2.16Graph 2.15
0
3
6
9
12
Capital RaisingsCumulative change from 1 January 2010
Retained earnings*
* For locally incorporated banks** For locally listed banks; second half 2012 is half-to-dateSources: APRA; ASX; RBA
0
3
6
9
12
$b Dividend reinvestmentplans**
H1H1H1
2010 2011 2012
H2 H2 H1H1H1 H2 H2
2011 20122010
$b
H2
6
12
Bank Profits
$b
0.0
0.4
6
12
0.0
0.4
$b
$b$b
2013-1.6
0.0
1.6
-1.6
0.0
1.6
$b$b
2010201320102007n Actualn Analysts’ forecasts
n Actualn Analysts’ forecasts
Major banks* Major banks*
Regional banks** Regional banks**
Foreign-owned banks*** Foreign-owned banks***
Profits after tax Bad and doubtful debt charge
Sources:APRA; Credit Suisse; Deutsche Bank; Nomura Equity Research;RBA; UBS Securities Australia; banks’ annual and interim reports
* ANZ, NAB and Westpac report half yearly to March and September, whileCBA reports to June and December
** Suncorp Bank, and Bendigo and Adelaide Bank report half yearly to Juneand December, while Bank of Queensland reports to February and August
*** All results are half year to June and December
2007
na na
The upcoming Basel III capital requirements place
greater emphasis on core capital than under Basel I I,
so banks are likely to continue building up their
equity capital given the positive outlook for bank
profit levels. Though the measurement of capital
under Basel II is not strictly comparable to Basel III,
the significant increase in the Tier 1 capital ratio
over the past few years already puts the banks in a

7/29/2019 Rba Financial Stability Report Sep 2012
http://slidepdf.com/reader/full/rba-financial-stability-report-sep-2012 30/66
28 ReseRve bank of austRalia
reporting period, mostly due to higher impairments
in the major banks’ UK operations.
For the major banks, analysts are generally expecting
bad and doubtful debt charges to level out over
the next year. With revenue growth tending to
match growth in operating expenses, the banks are
continuing to focus on improving cost efficiency;
a number of them have announced cost-cutting
initiatives, including targeted staff cuts in some areas.
Looking ahead, analysts are currently forecasting
the major banks’ aggregate profits to rise by about
12 per cent in the next half-year reporting period
and their return on equity to remain around 15 per
cent, similar to the past two years (Graph 2.17).
and charges for bad and doubtful debts to decline.
Other authorised deposit-taking institutions have
had relatively small changes in their profitability:
the foreign-owned banks and building societies
increased their aggregate profits in their latest
half-year results while credit unions’ profitability fell
slightly.
Overall, while banks’ profitability is expected to
remain high, a continuation of the modest credit
growth environment and higher funding costs is
likely to constrain future profit growth. The challenge
for the industry in this environment will be to
avoid taking on unnecessary risk or cutting costs
indiscriminately in a bid to sustain unrealistic profitexpectations, as this could ultimately sow the seeds
of future problems.
Gnral Insuranc
The general insurance industry remains well
capitalised at 1.8 times the minimum capital
requirement, similar to the levels of the past couple
of years. Underwriting results have returned to more
normal levels after the adverse effects of the naturaldisasters in late 2010 and early 2011. However, return
on equity for the industry, at around 15 per cent
annualised for the June half 2012, remains below
the average over the years leading up to the global
financial crisis (Graph 2.18). A challenge for the
industry is operating in a low-yield environment,
which is related to the ongoing difficulties in Europe
and weak growth in the major countries’ economies.
Because insurers invest premium revenue in
generally low-risk assets to cover future claim
payments, the lower the investment yield, the more
premium that needs to be collected to cover future
claims, particularly for ‘long-tail’ insurance products
such as liability insurance. While the insurance
industry has been increasing premium rates in
response to higher reinsurance costs (related to
the recent natural disasters), competitive pressures
may limit insurers’ capacity to raise premium rates
further. In this environment, it would be undesirable
if insurers sought to improve their profitability by
Graph 2.17
In aggregate, the regional Australian banks reported
a loss after tax and minority interests of $30 million
in their latest half-year results, with profits falling byaround $300 million compared with the same period
a year earlier. The main contributor to the loss was a
sharp rise in charges for bad and doubtful debts to
$600 million, up from $200 million in the previous
reporting period. This was mainly due to losses on
commercial property loans at a couple of the banks
that are more exposed to the weaker Queensland
market. Analysts expect the losses to be a once-off,
with the asset performance of the regional banks
forecast to stabilise in the next reporting period
0
10
20
0
10
20
Major Banks’ Profitability*
2012
%
2007200219971992
%
0.0
0.5
1.0
1.5
0.0
0.5
1.0
1.5
Charge for bad and doubtful debtsPer cent of average assets
%%
Return on shareholders’ equity After tax and minority interests
1987
* From 2006, data are on an IFRS basis; prior years are on an AGAAP basisSources: Credit Suisse; Deutsche Bank; Nomura Equity Research; RBA; UBS
Securities Australia; banks’ annual and interim reports
FY12 forecasts

7/29/2019 Rba Financial Stability Report Sep 2012
http://slidepdf.com/reader/full/rba-financial-stability-report-sep-2012 31/66
29financial stability review | s e p t e m b e r 2 0 1 2
investing imprudently in riskier, higher-yielding
investments.
The profits of lenders’ mortgage insurers (LMIs)
have come under some pressure from the recent
weakness in the residential property market, which
has boosted the number and average size of claims,
although their overall profitability over the past
year remains solid. A prolonged or more severedownturn in property prices combined with higher
housing loan arrears (for instance, due to higher
unemployment), would increase claim rates further
and reduce profits. As noted earlier, though, recent
indications are that the housing market is beginning
to stabilise. The LMI sector holds about 1 times a
minimum capital requirement that is designed to
absorb losses from a very severe housing market
downturn. While the LMIs are currently rated highly
by the major rating agencies, Moody’s is in the
process of reviewing its global methodology for
rating LMIs, which could result in changes to the
Australian LMIs’ ratings. Prior to this review, it had
flagged the Australian LMIs for a possible downgrade,
noting its concern that their capital buffers would
be tested in the event of a severe downturn in the
Australian residential property market.
managd Funds
Unconsolidated assets under management in the
Australian funds management industry grew by
9 per cent in annualised terms over the six months
to June, to $1.9 trillion, more than reversing a decline
over the second half of 2011 (Table 2.3). The rise was
driven by superannuation funds, whose assets under
management rose by 12 per cent in annualised
terms, and now represent over 70 per cent of the
unconsolidated assets of managed funds.
Graph 2.18
Table 2.3: Assets of Domestic Funds Management Institutions As at end June 2012
Six-month-ended
annualised change
Level Share o total Dec 11 Jun 12
$ billion Per cent Per cent Per centSuperannuation funds 1 349 72 –4.6 12.1
Life insurers(a) 235 12 –5.2 5.6
Public unit trusts 260 14 –10.9 –3.6
Other managed funds(b) 38 2 –0.6 4.2
Total (unconsolidated) 1 882 100 –5.6 8.8
Of which:
Cross investments 382 – –10.2 5.9
Total (consolidated) 1 500 – –4.3 9.5
(a) Includes superannuation funds held in the statutory funds of life insurers(b) Cash management trusts, common funds and friendly societiesSource: ABS
-30
-15
0
15
30
-30
-15
0
15
30
Contribution to return on equity, annualisedGeneral Insurers’ Performance*
%
2012* Change in prudential reporting requirements from December 2010 half Source: APRA
%
2010200820062004
n Investment incomen Underwriting results
n Tax and other n Profit after tax

7/29/2019 Rba Financial Stability Report Sep 2012
http://slidepdf.com/reader/full/rba-financial-stability-report-sep-2012 32/66
30 ReseRve bank of austRalia
Superannuation funds’ holdings of cash and
deposits continued to grow, in part reflecting the
heightened demand for safer assets in an uncertain
investment environment (Graph 2.19). Even so,
equities and units in trusts remain the largest
component of superannuation investments at
40 per cent of funds under management. About
20 per cent of their equity holdings or 6 per cent
of their total assets are invested in equity issued by
Australian banks. Superannuation funds’ holdings of
domestic bank equity have increased over the past
two decades, and now account for over one-quarter
of the equity issued by banks. However, the share
of total superannuation assets that is invested in
domestic bank equity has remained steady over the
past decade.
Partly because they have quite long investment
horizons, superannuation funds have been willing
to purchase Australian bank equity even during
times of market strain; their net purchases during
the height of the global financial crisis exemplifies
this behaviour. Indeed, throughout the past decade
or so, superannuation funds have been more often
net purchasers of bank equity than net sellers during
periods when bank share prices have declined. As
the size of the superannuation industry grows, these
funds should continue to be a valuable source of
new capital, should it be required, for the banking
sector in stress conditions.
Against a backdrop of relatively steady contribution
inflows, superannuation funds have experienced
mixed investment performance in recent years
associated with the volatility in global financial
markets (Graph 2.20). A recovery in share markets
during the March quarter this year drove a pick-up
in funds’ investment returns, but this was partially
offset by declining share prices in the June quarter.
Over the year to June, superannuation funds inaggregate recorded little net investment income.
Life insurers’ funds under management rose by
about 6 per cent in annualised terms in the six
months to June 2012. Their profitability increased
over the six months to June, aided by investment
returns on fixed-interest securities (Graph 2.21). The
life insurance industry remained well capitalised
at 1.4 times the minimum requirements as at
June 2012.
Graph 2.19Composition of Superannuation Assets*
0
10
20
30
40
Per cent of total, unconsolidated**
% %
Cash and deposits
Debtsecurities Assets overseas
Land and buildings,
and other assets
20122002
Loans
Net equity inlife offices***
Equities andunits in trusts***
201220021992* Apart from ‘assets overseas’, individual asset types represent investments
in Australia** Excludes positions between superannuation funds and positions with other
managed funds*** Reclassification by ABS from June 1995Source: ABS
0
10
20
30
40
1992
Graph 2.20
-40
0
40
-40
0
40
Superannuation Funds’ Financial Performance*
* From December 2004, data cover entities with at least $50 million inassets only
** Total contributions received by funds plus net rollovers minus benefitpayments
Source: APRA
n Net investment incomen Net contribution flows**
$b Quarterly $b
201220092006
Four-quarter rolling sum
-200
-100
0
100
-200
-100
0
100
$b $b
20032000

7/29/2019 Rba Financial Stability Report Sep 2012
http://slidepdf.com/reader/full/rba-financial-stability-report-sep-2012 33/66
31financial stability review | s e p t e m b e r 2 0 1 2
Graph 2.22
Graph 2.21 by 6 per cent over the same period to an average
of $158 billion per day – the lowest level since the
March quarter 2006, and about 22 per cent below
the peak in the March quarter 2008.
Settlement of low-value transactions, such as
direct entry, consumer electronic (cards-based)
payments and cheque transactions, also occurs in
RITS through a daily batch, rather than on a real-time
gross settlement basis. To increase the efficiency
of the settlement of these transactions, the Bank
recently implemented a new system, the Low Value
Settlement Service (LVSS). The settlement of direct
entry transactions was successfully migrated to the
LVSS in May 2012, followed by the clearing systemfor consumer electronic transactions in August. The
clearing system for cheques is expected to migrate
in October. Currently, an average of about $17 billion
of transactions are settled using the LVSS each day.
The two ASX central counterparties, ASX Clear and
ASX Clear (Futures), use a variety of risk controls to
centrally manage counterparty risk in Australia’s
main exchange-traded equities and derivatives
markets. These include the collection of marginfrom participants, and pooled risk resources
(i.e. ‘default funds’). Variation or mark-to-market
margin is collected from participants on a daily
basis to cover the risk exposure resulting from actual
changes in the value of their positions. Initial margin
is also collected for participants’ new positions, to
cover the potential future risk exposure from changes
in the value of a defaulting participant’s positions
between the last collection of variation margin and
the time at which the positions can be closed out.Currently, at ASX Clear, initial margin is collected on
derivatives positions only, but ASX Clear is working
towards introducing routine margining of equities in
the 2012/13 financial year.
Margin held at the central counterparties provides
an indication of the aggregate risk of open positions
held in normal market conditions. Margin held
on derivatives positions cleared by ASX Clear
continued to decline over the first half of 2012, as
Profits after taxn Investment revenuen Impact from movements in policy liabilities
nNet premiums*n Net policy payments**
n Other
-30
-15
0
15
30
45
Life Insurers’ Financial Performance
$b
* Sum of net policy revenue, premium-related fees and net policy revenuerecognised as a deposit
** Sum of net policy expenses and net policy expenses recognised as awithdrawal
Source: APRA
$m
-600
-300
0
300
600
900
20122010 20122010
0
10
20
30
40
0
50
100
150
200
0
10
20
30
40
0
50
100
150
200
’000
RITS Settled Payments*Four-quarter moving daily average
$b
Value(RHS)
Volume(LHS)
* September 2012 is quarter-to-date
Source: RBA
20122010200820062004
Financial mark Infrasrucur
The Reserve Bank’s high-value payments settlement
system, RITS, continued to operate smoothly during
the past six months, settling around 4 million
payments worth $16 trillion – equivalent to around
25 times the value of GDP over the same period. Theaverage daily volume of transactions was 5 per cent
higher in the six months to September compared
with the previous half year (Graph 2.22). In contrast,
the value of transactions settled in RITS declined
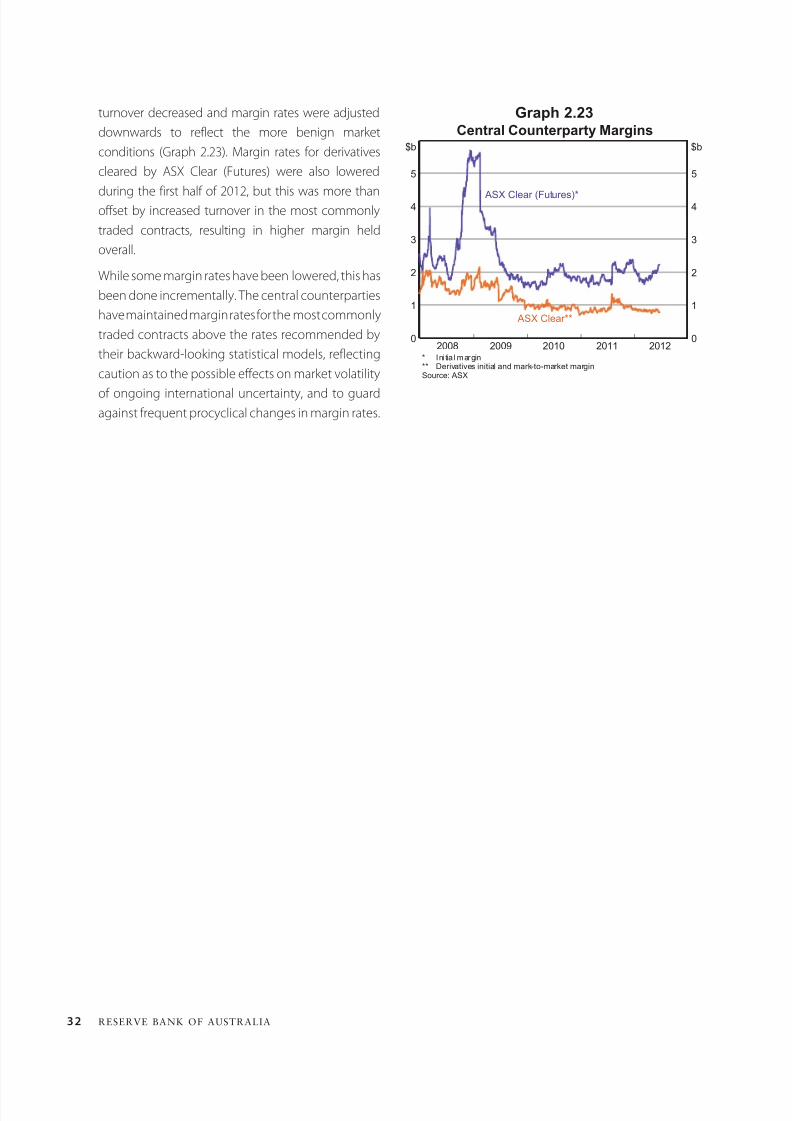
7/29/2019 Rba Financial Stability Report Sep 2012
http://slidepdf.com/reader/full/rba-financial-stability-report-sep-2012 34/66
32 ReseRve bank of austRalia
turnover decreased and margin rates were adjusted
downwards to reflect the more benign market
conditions (Graph 2.23). Margin rates for derivatives
cleared by ASX Clear (Futures) were also lowered
during the first half of 2012, but this was more than
offset by increased turnover in the most commonly
traded contracts, resulting in higher margin held
overall.
While some margin rates have been lowered, this has
been done incrementally. The central counterparties
have maintained margin rates for the most commonly
traded contracts above the rates recommended by
their backward-looking statistical models, reflecting
caution as to the possible effects on market volatilityof ongoing international uncertainty, and to guard
against frequent procyclical changes in margin rates.
l l l l0
1
2
3
4
5
0
1
2
3
4
5
Central Counterparty Margins$b $b
2008* Ini tia l margin** Derivatives initial and mark-to-market margin
Source: ASX
ASX Clear**
ASX Clear (Futures)*
2009 2010 2011 2012
Graph 2.23

7/29/2019 Rba Financial Stability Report Sep 2012
http://slidepdf.com/reader/full/rba-financial-stability-report-sep-2012 35/66
FINANCIAL STABILITY revIew | s eptem ber 2 0 1 2 33
Since the onset of the global financial crisis, there has
been a pronounced shift in the funding composition
of banks in Australia. In particular, there has been a
move away from the use of wholesale debt securities,
including securitisation, towards domestic deposits.
The crisis spurred banks, investors and regulators
globally to reassess funding risks, and the Australian
banks have responded to the resulting pressures
to secure more stable funding sources. An increase
in the use of deposits has been evident across all
types of banks in Australia, although it has been
most pronounced for the regional and other smaller
Australian-owned banks, which had previously used
securitisation more heavily (Graph A1). These banks
have increased their share of deposits broadly across
most products, whereas most of the growth in the
major and foreign-owned banks’ deposits (and thebanking sector’s deposits as a whole over recent
years) has been concentrated in term deposits.
Reflecting greater competition, term deposits now
attract higher interest rates than a number of other
forms of deposits and wholesale debt securities of a
similar maturity.1
Australian banks in aggregate have also slightly
increased stable funding in the form of long-term
wholesale debt and this has been complemented by
a sharp fall in the share of short-term wholesale debt.
Most of this decline was in domestic debt; the share
of domestic short-term debt in total bank funding
has declined from a peak of over 20 per cent in early
2008 to around 10 per cent recently (Graph A2). The
share of short-term debt issued overseas has fallen
somewhat less, from a peak of 15 per cent of funding
prior to the crisis to 12 per cent currently. There
1 For more in-depth discussion of the role of deposits in bank fundingcosts, see Deans C and C Stewart (2012), ‘Banks’ Funding Costs and
Lending Rates’, RBA Bulletin, March, pp 37–43.
Box A
Funding Composition of Banks in Australia
Graph A1
0
15
30
45
60
0
15
30
45
60
Funding Composition of Banks in Australia*
Major banks Other Australian-owned
banks
Foreign banks
* Adjusted for movements in foreign exchange rates; not adjusted for mergers and changes in capital structure
** Includes deposits and intragroup funding from non-residentsSources: APRA; RBA
%%
Short-termdebt**
EquitySecuritisation
Share of total funding
Domesticdeposits
Long-term debt
20122008 20122008 20122008
Graph A2
0
5
10
15
20
0
5
10
15
20
Wholesale Funding of Banks in Australia*Share of total funding
%%
Short-term
Short-term**
Long-term
* Adjusted for movements in foreign exchange rates; wholesale debt is ona residual maturity basis
** Includes deposits and intragroup funding from non-residentsSources: APRA; RBA
Domestic Offshore
20122008201220082004
are a number of possible reasons why the share
of domestic short-term debt has declined more
than that of offshore short-term debt. Domestic
investors are likely to have had more opportunityto substitute away from short-term debt securities,
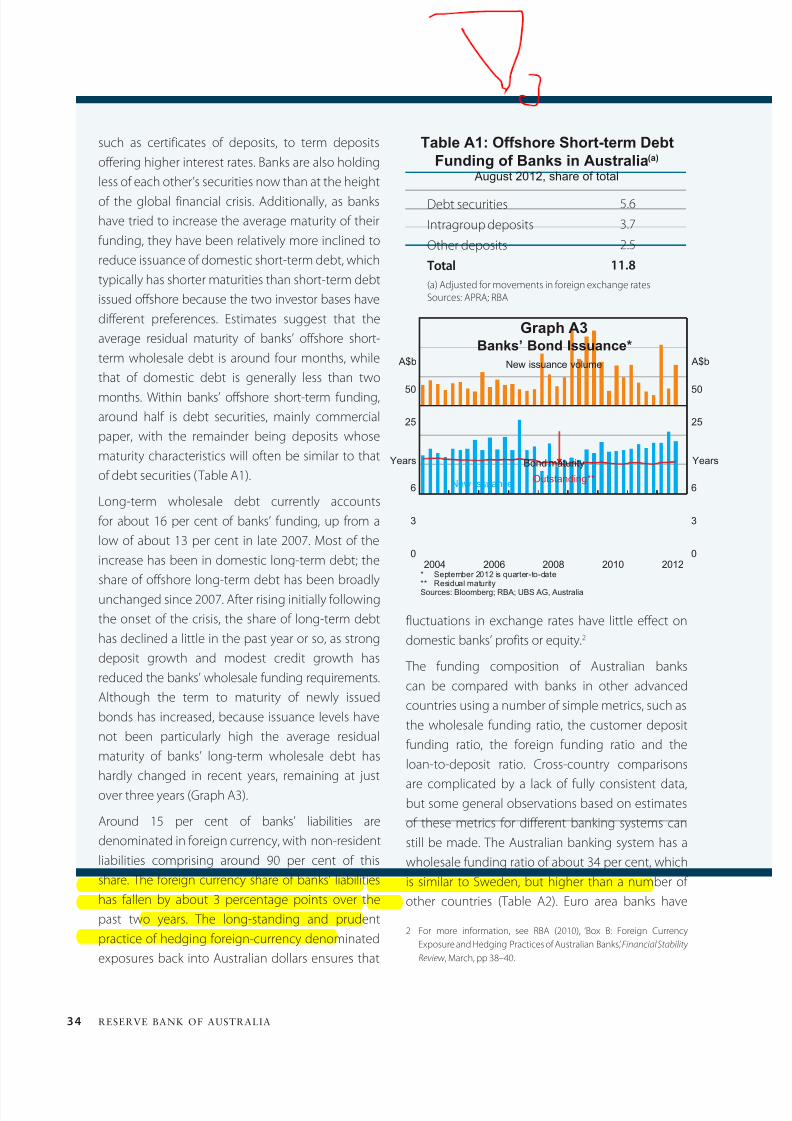
7/29/2019 Rba Financial Stability Report Sep 2012
http://slidepdf.com/reader/full/rba-financial-stability-report-sep-2012 36/66
ReseRve Bank of austRalia34
fluctuations in exchange rates have little effect on
domestic banks’ profits or equity.2
The funding composition of Australian banks
can be compared with banks in other advanced
countries using a number of simple metrics, such as
the wholesale funding ratio, the customer deposit
funding ratio, the foreign funding ratio and theloan-to-deposit ratio. Cross-country comparisons
are complicated by a lack of fully consistent data,
but some general observations based on estimates
of these metrics for different banking systems can
still be made. The Australian banking system has a
wholesale funding ratio of about 34 per cent, which
is similar to Sweden, but higher than a number of
other countries (Table A2). Euro area banks have
2 For more information, see RBA (2010), ‘Box B: Foreign Currency
Exposure and Hedging Practices of Australian Banks,’Financial Stability
Review , March, pp 38–40.
such as certificates of deposits, to term deposits
offering higher interest rates. Banks are also holding
less of each other’s securities now than at the heightof the global financial crisis. Additionally, as banks
have tried to increase the average maturity of their
funding, they have been relatively more inclined to
reduce issuance of domestic short-term debt, which
typically has shorter maturities than short-term debt
issued offshore because the two investor bases have
different preferences. Estimates suggest that the
average residual maturity of banks’ offshore short-
term wholesale debt is around four months, while
that of domestic debt is generally less than twomonths. Within banks’ offshore short-term funding,
around half is debt securities, mainly commercial
paper, with the remainder being deposits whose
maturity characteristics will often be similar to that
of debt securities (Table A1).
Long-term wholesale debt currently accounts
for about 16 per cent of banks’ funding, up from a
low of about 13 per cent in late 2007. Most of the
increase has been in domestic long-term debt; theshare of offshore long-term debt has been broadly
unchanged since 2007. After rising initially following
the onset of the crisis, the share of long-term debt
has declined a little in the past year or so, as strong
deposit growth and modest credit growth has
reduced the banks’ wholesale funding requirements.
Although the term to maturity of newly issued
bonds has increased, because issuance levels have
not been particularly high the average residual
maturity of banks’ long-term wholesale debt has
hardly changed in recent years, remaining at just
over three years (Graph A3).
Around 15 per cent of banks’ liabilities are
denominated in foreign currency, with non-resident
liabilities comprising around 90 per cent of this
share. The foreign currency share of banks’ liabilities
has fallen by about 3 percentage points over the
past two years. The long-standing and prudent
practice of hedging foreign-currency denominatedexposures back into Australian dollars ensures that
Graph A3Banks’ Bond Issuance*
* September 2012 is quarter-to-date** Residual maturitySources: Bloomberg; RBA; UBS AG, Australia
2012
Outstanding**
A$bNew issuance volume
25
50
25
50
0
3
6
0
3
6
A$b
Years Bond maturity
2010200820062004
New issuance
Years
Table A1: Offshore Short-term Debt
Funding of Banks in Australia(a)
August 2012, share of total
Debt securities 5.6
Intragroup deposits 3.7
Other deposits 2.5
Total 11.8
(a) Adjusted for movements in foreign exchange ratesSources: APRA; RBA

7/29/2019 Rba Financial Stability Report Sep 2012
http://slidepdf.com/reader/full/rba-financial-stability-report-sep-2012 37/66
FINANCIAL STABILITY revIew | s eptem ber 2 0 1 2 35
lower wholesale funding ratios but they also make
more use of interbank deposits than Australian
banks; these deposits are not counted as part
of wholesale funding, but arguably share similar
characteristics. US and Canadian banks’ certificates
of deposit are not recorded as wholesale funding,
even though at least some investors in these
instruments may behave in a similar way. While
wholesale funding is often assumed to be less stable
than customer deposit funding, a higher wholesale
funding ratio for the Australian banking systemdoes not necessarily indicate higher funding risks –
the maturity and diversity of wholesale funding are
also important factors to consider; as noted earlier,
some wholesale funding is at quite long terms. Also,
because an investor’s decision to lend to a bank is
largely based on a credit assessment of the bank’s
assets, the Australian banks’ fund-raising activities
in global capital markets has created a strong
incentive for them to maintain high credit ratings
and sound asset quality, factors which improve the
stability of their funding base.3
Australian banks’ use of foreign funding is also often
singled out by some observers as a potential source
of vulnerability. However, the foreign funding ratio
for the Australian banking system is lower than for
banking systems in Europe outside the euro area,
mainly because Australian banks raise little non-
resident deposit funding. Non-resident deposit
funding can be less stable than domestic deposits,
as the recent experience of some euro area banking
systems demonstrates (see ‘The Global Financial
Environment’ chapter). Also, as noted earlier,
Australian banks hedge almost all of their foreign
currency denominated exposure to manage the
foreign exchange risk.
3 On the importance of maintaining high-quality assets, see
Debelle G (2011), ‘Collateral, Funding and Liquidity’, Address to
Conference on Systemic Risk, Basel III, Financial Stability and
Regulation, Sydney, 28 June.
Table A2: Bank Funding Structures in Selected Countries(a)
June 2012, per cent
Wholesalefunding ratio(b)
Customerdeposit
funding ratio(b), (c)
Foreignfunding ratio(d)
Loan-to-depositratio
Australia 34 49 24 135
Canada 23 67 10 103
Euro area 23 41 15 110
France 20 32 19 110
Germany 20 46 18 107
Japan 21 72 12 73
Sweden 33 40 34 129
Switzerland 21 55 27 97
United Kingdom 24 59 48 138
United States 13 73 24 77
(a) Funding ratios across banking systems are subject to definitional differences; certificates of deposits are classified as wholesalefunding in all countries except Canada and the United States, where these instruments are eligible for deposit insurance
(b) Expressed as a share of funding liabilities (total liabilities including equity less derivatives and other non-debt liabilities)(c) Customer deposits are total deposits minus deposits from banks and other monetary financial institutions(d) Gross foreign liabilities of BIS reporting banks on a locational basis, expressed as a share of total liabilities and equity ; data as
at 31 March 2012Sources: APRA; BIS; Bloomberg; FDIC; OSFI; RBA; central banks

7/29/2019 Rba Financial Stability Report Sep 2012
http://slidepdf.com/reader/full/rba-financial-stability-report-sep-2012 38/66
ReseRve Bank of austRalia36
The loan-to-deposit ratio for the Australian banking
system is higher than those for the other large
advanced banking systems in Table A2, with theexception of the United Kingdom, though it is
comparable to that in Sweden. The Australian banks’
ratio has declined significantly since the onset of
the global financial crisis, as deposit growth has
outpaced credit growth. Loan-to-deposit ratios can
be misleading indicators of the vulnerability of a
bank’s funding profile: very different ratios can apply
to banks with the same funding mix but different
shares of banking and trading book assets on their
balance sheets. In the Australian banks’ case, therelatively high loan-to-deposit ratio partly reflects
their lower share of trading book assets. A low
loan-to-deposit ratio is not necessarily an indicator
of stability as there are numerous instances over
recent years where banks have invested their ‘excess’
deposits in trading securities or other assets that
proved to be riskier than domestic loans. R

7/29/2019 Rba Financial Stability Report Sep 2012
http://slidepdf.com/reader/full/rba-financial-stability-report-sep-2012 39/66
37financial stability review | s e p t e m b e r 2 0 1 2
The household sector has continued to consolidate
its financial position in 2012. The household saving
ratio appears to have stabilised at a level significantly
above that recorded in the 1990s and early to mid
2000s, and households have been actively shifting
their portfolios towards more conservative assets
such as deposits. Household borrowing has also
slowed in recent years to a pace that is more in
line with income growth and many households are
choosing to repay their existing debt more quickly
than required. Though there are some isolated
pockets of weakness, aggregate measures of
financial stress remain low. However, with aggregate
indebtedness still around historically high levels,a continuation of the recent borrowing restraint
would help strengthen the financial resilience of
households.
Overall, business balance sheets are in good shape,
with gearing and debt-servicing ratios at relatively
low levels, though profits have moderated recently.
The dispersion in economic conditions across sectors
has continued in recent quarters, with firms in some
industries facing challenges associated with the high
level of the exchange rate and the weak housing
market as the Australian economy goes through
a period of structural change. These pressures are
evident in banks’ business loan performance: inflows
of newly impaired business loans remain elevated
and, associated with this, the non-performance rate
on banks’ business loans has declined only modestly
from its peak a couple of years ago.
Houshold Scor
The household sector’s more prudent financial
behaviour has continued in 2012. The saving ratio
has averaged around 9 per cent of disposableincome for the past few years, well above its level
of five to ten years ago (Graph 3.1). Disaggregated
household-level data from the Household, Income
and Labour Dynamics in Australia (HILDA) Survey
show that this increase in saving was broad based
across most income and age groups, with the
exception of retirees, who typically dissave and
are disproportionately represented in the lowest
income quintile, as well as other households with
low or temporarily low incomes (Graph 3.2).
The higher rate of saving has partly been motivated
by a desire to rebuild wealth following the falls in
asset prices over recent years. Real net worth per
household has declined by 11 per cent from its
3. Houshold and businssbalanc Shs
Graph 3.1
-5
0
5
10
15
-5
0
5
10
15
Household Saving*Per cent of household disposable income
* Net of depreciationSource: ABS
2012
%%
200720021997199219871982

7/29/2019 Rba Financial Stability Report Sep 2012
http://slidepdf.com/reader/full/rba-financial-stability-report-sep-2012 40/66
38 ReseRve bank of austRalia
2007 peak, in contrast to the strong growth in the
years leading up to that point (Graph 3.3). Much
of the decline has reflected weakness in housing
values. Average housing prices are around 6 per cent
below their 2011 peak nationally, and even further
below their peaks in Melbourne and south-east
Queensland, where earlier overdevelopment locallymay have weighed on prices. While prices nationally
have stopped falling in recent months, any future
recovery is unlikely to produce housing price growth
much faster than income growth, as was seen
through much of the 1990s and 2000s, because that
earlier period was one of adjustment to the structural
decrease in nominal interest rates and liberalisation
of the banking system.
Households’ more circumspect financial behaviour
is also related to a decrease in their appetite for
risk and riskier assets. For example, on top of the
effect of declining equity prices, households have
actively reduced their equity holdings. As a result,
the share of households’ financial assets held directly
in equities (i.e. outside superannuation) has roughly
halved, from 18 per cent in 2007 to 8 per cent in
March 2012 (Graph 3.4). In contrast, the share of
deposits has increased from 18 to 25 per cent over
that period. Disaggregated data from the latestHILDA Survey also show that between 2006 and
2010 the proportion of households owning equities
directly fell slightly, to 34 per cent; the decline was
seen across most age and income groups. Overall,
real financial assets per household have been
flat in recent years as the growth in deposits and
superannuation assets has been roughly offset
by the fall in the value of equity holdings. While
households appear to have become more risk
averse in recent years, it is not always clear that they
fully account for the complexity inherent in some
financial products. For example, there have recently
been a number of hybrid securities issued by banks
and other companies aimed at retail investors. The
Graph 3.2
Graph 3.3 Graph 3.4
-8
-4
0
4
8
Change in Median Saving Ratios*From 2006 to 2010
ppt By income percentile
* Population weighted and using income measures equivalised acrossdifferent household structures
Source: HILDA Release 10.0
A l l -8
-4
0
4
8
1 5 – 2 9
3 0 – 4 4
6 0 +
4 5 – 5 9
By age in years ppt
8 0 > 1 0 0
6 0 > 8 0
4 0 > 6 0
2 0 > 4 0
0 > 2 0
-200
0
200
400
600
-200
0
200
400
600
Real Household Assets*
2012
Net worth
20082004200019961992
Non-financial assets
Financial assets
Total debt
$’000 $’000
* In 2009/10 dollars; deflated using the household final consumptionexpenditure implicit price deflator; dots are RBA estimates for Junequarter 2012
Sources: ABS; RBA
Per household
0
5
10
15
20
25
0
5
10
15
20
25
Household AssetsShare of financial assets
Source: ABS
2003
Deposits
%
Equities
%
2006 2009 20122000

7/29/2019 Rba Financial Stability Report Sep 2012
http://slidepdf.com/reader/full/rba-financial-stability-report-sep-2012 41/66
39financial stability review | s e p t e m b e r 2 0 1 2
Australian Securities and Investments Commission,
through its MoneySmart consumer awareness
website, has warned about the risks associated with
these types of securities, which combine debt and
equity features, relative to standard debt instruments
like corporate bonds.
Household credit growth has been much slower
in recent years than over the previous couple of
decades, and in recent months has slowed further
(Graph 3.5). It has also been more in line with income
growth, such that the household debt-to-income
ratio has been broadly flat at around 150 per cent
since 2006. Soft demand for both owner-occupier
and investor housing credit has resulted in, andreflected, lower housing prices. Data on housing
loan approvals suggest that housing credit growth
is likely to remain modest in the near term. Appetite
for other forms of borrowing also remains low. Credit
card debt was broadly steady over the year to July,
while the stock of other forms of personal credit
has generally been declining. Despite the easing in
household credit growth in recent years, household
gearing is around a historically high level, reflecting
the fall in the value of housing assets.
Subdued credit growth, lower interest rates
and modest income growth over the past year
have led to a further fall in the ratio of household
interest payments to disposable income. At 10 per
cent in the June quarter, this ratio is now at its
Graph 3.5
Graph 3.6
0
10
20
0
6
12
10
20
Household Indebtedness
* Six-month-ended, annualisedSources: ABS; RBA
2012
%Credit growth*%
%%
60
120
1997
Interest payments-to-income
Debt-to-income
Debt-to-assets
201219971982
0
25
50
0
25
50
10
20
10
20
Banks’ Housing Loan Characteristics*Share of new loan approvals
* LVR = loan-to-valuation ratio; ‘Other’ includes loans approved outsidenormal policies, and other non-standard loans; ‘Interest-only’ includes
mortgages with 100 per cent offset accounts** Series break due to changes in data management at one of the major banksSource: APRA
% Owner-occupiers Investors %
% %
Low-docOther
2010 2012 2010 2012
Interest-only**
2008
LVR > 90
80 < LVR < 90
decade average. Real household disposable income
increased by around 4 per cent over the year to the
June quarter 2012, underpinned by solid growth in
compensation of employees. Even so, households’
sentiment towards their financial position remains
weak, despite the unemployment rate remaining
at a relatively low level in recent months. Forward-
looking indicators, such as surveys of business hiring
intentions, point to modest growth in employment
in the period ahead.
The risk profile of new housing loans has been lower
in recent years compared with the earlier period of
strong growth in household borrowing. Lending
standards are tighter now than prior to the financialcrisis, and liaison with the major banks indicates that
they have been broadly unchanged over the past six
months. The share of bank lending that is low-doc
remains low, at less than 2 per cent of banks’ loan
approvals and around 5 per cent of outstanding
housing credit (Graph 3.6). The share of new loans
with loan-to-valuation ratios (LVRs) above 90 per
cent is also lower than around the onset of the
financial crisis, at around 14 per cent, though it has
increased noticeably over the past couple of years.
Part of this can be attributed to first home buyer
(FHB) incentives; for example, some demand was
pulled forward ahead of the expiry of the New South

7/29/2019 Rba Financial Stability Report Sep 2012
http://slidepdf.com/reader/full/rba-financial-stability-report-sep-2012 42/66
40 ReseRve bank of austRalia
The recently released Census data show that in 2011
only a small share of indebted owner-occupiers met
standard vulnerability criteria, broadly consistent
with trends seen in recent years in the HILDA Survey.
For instance, slightly under 10 per cent of indebtedowner-occupier households had high DSRs (above
50 per cent) and 6 per cent had both high DSRs
and were in the lowest 40 per cent of income earners.
Consistent with these survey-based measures,
aggregate indicators of financial stress confirm that
the household sector has been coping reasonably
well with its debt level. The past-due share of
housing loans has eased somewhat since its peak in
mid 2011, to be a little below 0.6 per cent (Graph 3.8).
Although this arrears rate is low by international
standards, it remains above its historical average. The
non-performance rates for banks’ credit card (1.3 per
cent) and other personal (2.2 per cent) loans have
increased slightly in recent quarters, but remain a
little below recent peaks.
According to the 2011 Census, the geographic
regions that had the highest incidence of potential
mortgage vulnerability, as measured by the share
of households that had high DSRs and were in
Wales FHB stimulus at the end of 2011. Many banks
have recently changed how they estimate living
expenses in their debt-serviceability calculations,
moving from using the Henderson Poverty Index to
the Household Expenditure Measure, which is based
on the ABS Household Expenditure Survey. The
new measure was designed to be a more accurate
estimate of households’ living expenses. The impact
of the change will vary for different borrowers; for
couples, it will generally reduce their borrowing
capacity, while for singles it will generally increase it.
The available evidence suggests that using the new
measure will result in only minor changes to the
availability of credit overall.
Some households are using their increased saving to
pay down debt more quickly than required, which
has contributed to the slower aggregate pace of
debt accumulation. Data from the major banks
and the HILDA Survey indicate that around half of
borrowers are repaying their mortgages ahead
of schedule and are thereby building up buffers
they could temporarily draw on to stay current on
their loan if their income were to fall. The size of
these buffers can be quite substantial (see ‘Box B:
Households’ Mortgage Prepayment Buffers’).
Given the large share of households with mortgage
prepayment buffers, along with relatively low
unemployment and moderate income growth, most
households appear well placed to meet their debt
obligations. According to the latest HILDA Survey,
around 70 per cent of owner-occupier housing
debt is held by higher-income households (those
in the top 40 per cent of the income distribution)that typically have lower debt-to-income and
debt-servicing ratios (DSRs) (Graph 3.7). Only a
relatively small share of low-income households (in
the bottom 20 per cent of the income distribution)
has housing debt; those that do, however, tend to
be quite indebted, with high DSRs. This is partly
explained by this group containing people with
temporarily low incomes, for example, because they
were unemployed or between jobs when the Survey
was taken.
Graph 3.7
150
300
150
300
0
30
60
0
30
60
25
50
25
50
Owner-occupier Housing Debt2010
* Excludes households without mortgage debtSource: HILDA Release 10.0
Total
% Median debt-to-income ratio*
Median debt-servicing ratio*
Share of households with debt
%
% %
% %
Income bracket (per cent)
0>20 20>40 40>60 60>80 80>100
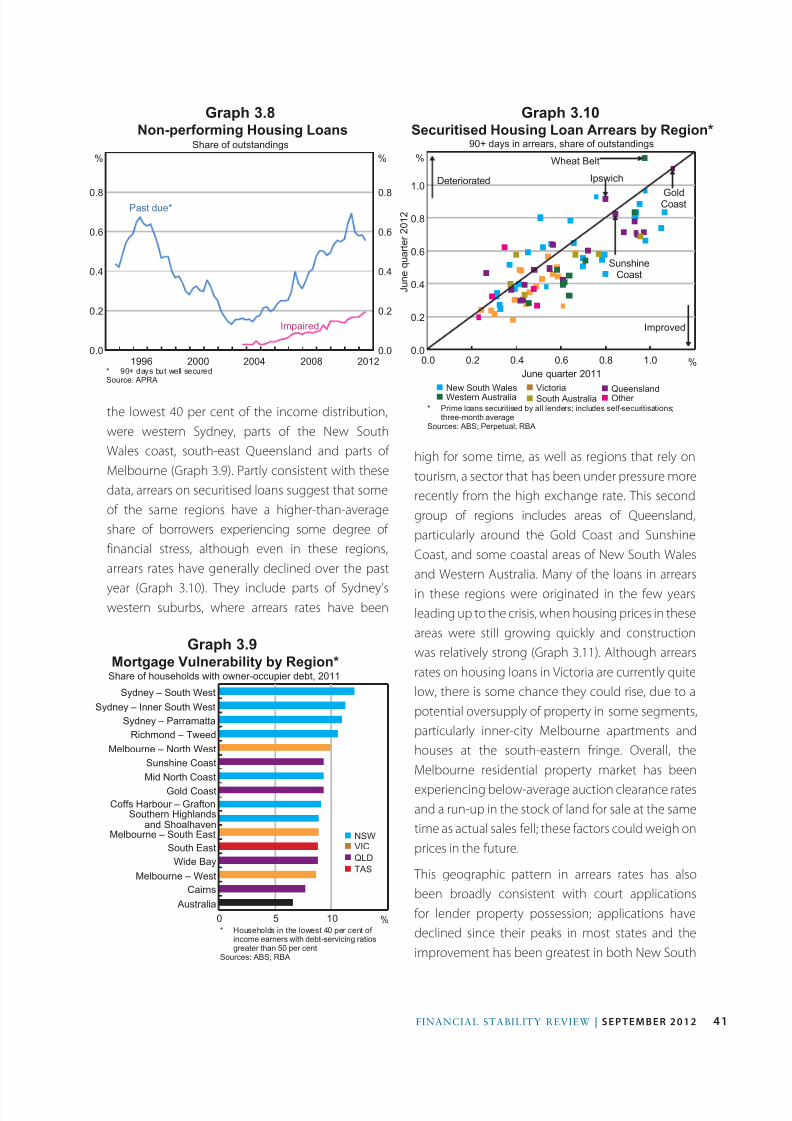
7/29/2019 Rba Financial Stability Report Sep 2012
http://slidepdf.com/reader/full/rba-financial-stability-report-sep-2012 43/66
41financial stability review | s e p t e m b e r 2 0 1 2
the lowest 40 per cent of the income distribution,
were western Sydney, parts of the New South
Wales coast, south-east Queensland and parts of
Melbourne (Graph 3.9). Partly consistent with these
data, arrears on securitised loans suggest that some
of the same regions have a higher-than-average
share of borrowers experiencing some degree of
financial stress, although even in these regions,
arrears rates have generally declined over the past
year (Graph 3.10). They include parts of Sydney’s
western suburbs, where arrears rates have been
high for some time, as well as regions that rely on
tourism, a sector that has been under pressure more
recently from the high exchange rate. This second
group of regions includes areas of Queensland,
particularly around the Gold Coast and Sunshine
Coast, and some coastal areas of New South Wales
and Western Australia. Many of the loans in arrears
in these regions were originated in the few years
leading up to the crisis, when housing prices in these
areas were still growing quickly and construction
was relatively strong (Graph 3.11). Although arrears
rates on housing loans in Victoria are currently quite
low, there is some chance they could rise, due to a
potential oversupply of property in some segments,
particularly inner-city Melbourne apartments and
houses at the south-eastern fringe. Overall, theMelbourne residential property market has been
experiencing below-average auction clearance rates
and a run-up in the stock of land for sale at the same
time as actual sales fell; these factors could weigh on
prices in the future.
This geographic pattern in arrears rates has also
been broadly consistent with court applications
for lender property possession; applications have
declined since their peaks in most states and theimprovement has been greatest in both New South
Graph 3.8
Graph 3.9
Graph 3.10
0.0
0.2
0.4
0.6
0.8
0.0
0.2
0.4
0.6
0.8
Non-performing Housing LoansShare of outstandings
2012
Impaired
%
2008200420001996
%
* 90+ days but well securedSource: APRA
Past due*
0 5 10
Mortgage Vulnerability by Region*Share of households with owner-occupier debt, 2011
%
n NSWn VIC
n QLD
n TAS
* Households in the lowest 40 per cent of
income earners with debt-servicing ratiosgreater than 50 per cent
Sources: ABS; RBA
Southern Highlandsand Shoalhaven
Sydney – South West
Sydney – Inner South West
Sydney – Parramatta
Richmond – Tweed
Melbourne – North WestSunshine Coast
Mid North Coast
Gold Coast
Coffs Harbour – Grafton
Melbourne – South East
South East
Wide Bay
Melbourne – West
Cairns
Australia
Securitised Housing Loan Arrears by Region*90+ days in arrears, share of outstandings
%
Improved
J u n e
q u a r t e r 2 0 1 2
Wheat Belt
* Prime loans securitised by all lenders; includes self-securitisations;three-month average
Sources: ABS; Perpetual; RBA
0.0
0.2
0.4
0.6
0.8
1.0
0.0 0.2 0.4 0.6 0.8 1.0 %
Deteriorated
GoldCoast
Ipswich
June quarter 2011
SunshineCoast
n New South Walesn Western Australia
n Queenslandn Other
n Victoria
n South Australia
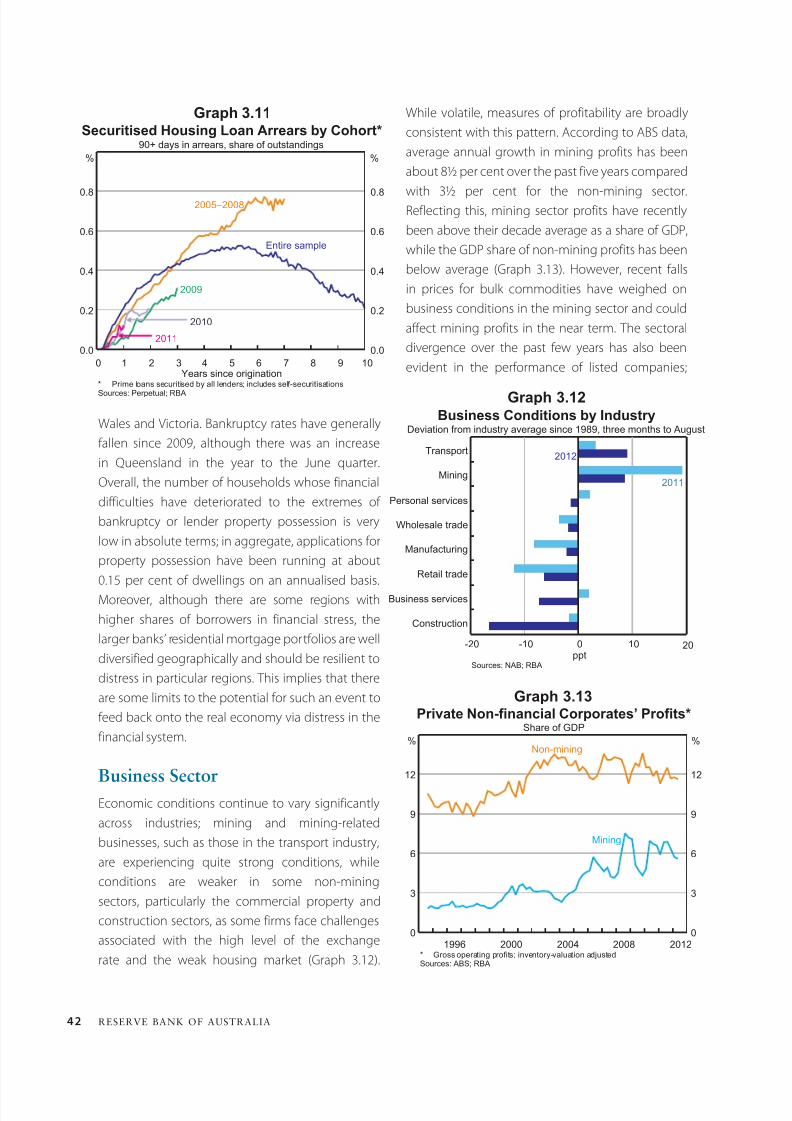
7/29/2019 Rba Financial Stability Report Sep 2012
http://slidepdf.com/reader/full/rba-financial-stability-report-sep-2012 44/66
42 ReseRve bank of austRalia
Wales and Victoria. Bankruptcy rates have generally
fallen since 2009, although there was an increase
in Queensland in the year to the June quarter.
Overall, the number of households whose financial
difficulties have deteriorated to the extremes of
bankruptcy or lender property possession is very
low in absolute terms; in aggregate, applications for
property possession have been running at about0.15 per cent of dwellings on an annualised basis.
Moreover, although there are some regions with
higher shares of borrowers in financial stress, the
larger banks’ residential mortgage portfolios are well
diversified geographically and should be resilient to
distress in particular regions. This implies that there
are some limits to the potential for such an event to
feed back onto the real economy via distress in the
financial system.
businss Scor
Economic conditions continue to vary significantly
across industries; mining and mining-related
businesses, such as those in the transport industry,
are experiencing quite strong conditions, while
conditions are weaker in some non-mining
sectors, particularly the commercial property and
construction sectors, as some firms face challenges
associated with the high level of the exchangerate and the weak housing market (Graph 3.12).
While volatile, measures of profitability are broadly
consistent with this pattern. According to ABS data,
average annual growth in mining profits has been
about 8 per cent over the past five years compared
with 3 per cent for the non-mining sector.
Reflecting this, mining sector profits have recently
been above their decade average as a share of GDP,
while the GDP share of non-mining profits has been
below average (Graph 3.13). However, recent falls
in prices for bulk commodities have weighed on
business conditions in the mining sector and could
affect mining profits in the near term. The sectoral
divergence over the past few years has also been
evident in the performance of listed companies;
Graph 3.12
Graph 3.13
-20 -10 0 10
Business Conditions by Industry
ppt
Transport
Retail trade
Construction
Personal services
Mining
Manufacturing
Wholesale trade
Business services
Deviation from industry average since 1989, three months to August
2011
2012
Sources: NAB; RBA
20
0
3
6
9
12
0
3
6
9
12
Private Non-financial Corporates’ Profits*Share of GDP
* Gross operating profits; inventory-valuation adjustedSources: ABS; RBA
2012
Mining
% %
Non-mining
2008200420001996
Graph 3.11
0.0
0.2
0.4
0.6
0.8
0.0
0.2
0.4
0.6
0.8
90+ days in arrears, share of outstandings
Securitised Housing Loan Arrears by Cohort*
%
Entire sample
2009
%
2005–2008
Years since origination
2010
109876543210
2011
* Prime loans securitised by all lenders; includes self-securitisationsSources: Perpetual; RBA

7/29/2019 Rba Financial Stability Report Sep 2012
http://slidepdf.com/reader/full/rba-financial-stability-report-sep-2012 45/66
43financial stability review | s e p t e m b e r 2 0 1 2
around 9 per cent of banks’ assets), even though
the amount outstanding has fallen in recent years.
This is also true for most individual banks, including
the major banks, though to a lesser extent than for
some of the smaller banks (Table 3.1). Given the
importance of the commercial property sector to
the banking system and its tendency to be higher
risk, it is discussed separately below. The remainderof banks’ business exposures is relatively diversified
across sectors. It is notable that banks have very
little lending to the mining sector; this sector has
relatively low leverage and tends to borrow more
although mining profits have softened in the most
recent reporting season, profits remain at a high
level, particularly relative to other sectors. While
aggregate profitability remains solid, the median
return on equity of listed companies is a little below
average and there appears to be a larger-than-usual
segment of poorly performing firms (Graph 3.14). Of
the top 100 listed companies, 8 reported a loss in
2011, compared with 4 each year on average over
the past decade. Around half of these loss-making
firms have little or no debt, however, limiting the
potential flow-on effect to the financial system.
Small businesses continue to report more subdued
conditions; this partly reflects that they areconcentrated in industries such as construction that
have been under pressure. Credit bureau data show
that the share of unlisted firms making losses was
broadly steady at around a quarter in 2011. Survey
measures of small business profitability remain
below average. National accounts measures of both
unincorporated and incorporated business profits
declined over the year to the June quarter 2012.
Data on bank exposures by industry indicate howmuch the varying business conditions might affect
the financial system. Property-related lending
continues to account for the largest share of banks’
business loans, at around 30 per cent (though only
Graph 3.14
-5
0
5
10
15
20
25
-5
0
5
10
15
20
25
Return on Equity*Top 100 listed companies by market capitalisation
%
2012
10th percentile
* EBITDA-to-book value equity; June 2012 observations are estimatesbased on companies that have reported to date
Sources: Bloomberg; Morningstar; RBA
25th percentile
Median
75th percentile
2009200620032000
%
Table 3.1: Major Banks’ Business LendingExposures as at end March 2012(a)
Sector Share of total
Per cent
Property 25
Utilities, telecommunications & other 22
Wholesale & retail trade 13
Agriculture, forestry & fishing 10
Manufacturing 8
Transport & storage 7
Business services 5
Construction 4
Accommodation, cafes & restaurants 4
Mining 2(a) June 2012 for CBASources: APRA; RBA; banks’ Basel II Pillar 3 reports

7/29/2019 Rba Financial Stability Report Sep 2012
http://slidepdf.com/reader/full/rba-financial-stability-report-sep-2012 46/66
44 ReseRve bank of austRalia
and those in the construction sector. Despite
the recent pick-up in credit growth, liaison with
banks suggests that demand for credit is still fairly
soft. One reason for this is that businesses’ internal
funding remains quite strong. Solid aggregate profit
levels combined with lower interest payments and
below-average dividend payout ratios have resulted
in internal funding of non-financial corporates
averaging around 10 per cent of GDP in recent years,
compared with a long-run average of about 7 per
cent (Graph 3.16). Much of this internal funding has
been concentrated in the mining sector, where it
is helping fund that sector’s sizeable investment
program, though the recent falls in prices for
bulk commodities could undermine mining firms’
profitability, as noted earlier.
Rather than borrow from local banks, resources
companies have instead contributed to solid
corporate bond issuance over the first half of 2012.
Demand from foreign investors remains strong, with
about 80 per cent of bond issuance being offshore
and denominated in foreign currency, mainly US
dollars. The most recent available data from 2009
show that Australian non-financial corporates
hedged around 60 per cent of their foreign currency
debt through derivatives at that time; in addition,
for resources companies, much of their foreign
currency exposure is naturally hedged as many of
Graph 3.15 Graph 3.16Lending to Businesses
-20
-10
0
10
20
30
0
100
200
300
400
500
Business credit growth*%
201220092006
Lending by banks $b
* Six-month-ended, annualisedSources: APRA; RBA
20122005
Loans less than$2 million
Loans greater than $2 million
19981991 -6
0
6
12
18
-6
0
6
12
18
Business Funding
%
2012
Internal funding
* Does not capture loans by institutions domiciled outside AustraliaSources: ABS; APRA; ASX; Austraclear Limited; RBA
20082004200019961992
Total external*
%
Per cent of GDP
n Business credit
n Non-intermediated debtn Listed equity
from offshore bond markets when debt funding
is needed rather than from local banks. The
construction and manufacturing sectors are quite
cyclical, but Australian banks have relatively small
exposures to them.
Following a period of significant deleveraging over
recent years, there are signs that businesses’ appetite
for debt may be starting to recover. Business credit
grew by 6 per cent in annualised terms over the
six months to July after declining for much of the
previous three years (Graph 3.15). While volatile, the
recent pick-up was evident across most industries,
and like the previous decline, it was mostly driven
by the borrowing behaviour of larger businesses,particularly listed companies. This is consistent
with the pattern in banks’ business lending by size
of facility: the outstanding value of loans that are
larger than $2 million has increased by 10 per cent
since June 2011 after declining over the previous
2 years, while the outstanding value of loans less
than $2 million each has been broadly unchanged
since 2009.
The supply factors that contributed to weak creditgrowth in recent years appear to have eased; liaison
with businesses suggests that the availability of
finance has improved for many firms over 2011
and 2012. Even so, credit conditions remain tight
for some firms, particularly property developers

7/29/2019 Rba Financial Stability Report Sep 2012
http://slidepdf.com/reader/full/rba-financial-stability-report-sep-2012 47/66
45financial stability review | s e p t e m b e r 2 0 1 2
the year to July 2012, compared with 12 per cent
over 2011.
Reflecting businesses’ low leverage, solid
profitability and below-average interest rates,
aggregate DSRs remain relatively low (Graph 3.18).
In addition, many firms earn interest revenue in net
terms; around one-fifth of listed companies earn
interest revenue in excess of their interest payments.As with leverage, although the average DSR has
declined from its 2008 peak, the distribution is
still relatively wide. Ratios for a number of listed
these firms are exporters or have significant foreign
operations with US dollar revenues. Consistent
with global market conditions, Australian corporate
bond spreads remain quite wide. But with yields
at relatively low levels, debt remains a comparably
attractive source of funding for businesses.
Reflecting the recent pick-up in debt raising,
businesses’ total external funding increased over
the past year, to around 5 per cent of GDP in the
June quarter. This is still lower than pre-crisis levels:
external funding accounted for about 20 per cent
of total business funds raised over the past year,
compared with an average of about 40 per cent in
the years leading up to the crisis. Net equity raisingshave been fairly subdued in recent quarters, partly
due to increased buyback activity and businesses
choosing to switch from equity to debt funding
after a period of deleveraging. Consistent with this,
preliminary data suggest that average book-value
gearing of listed non-financial companies increased
slightly over the year to June 2012, from about 46 to
50 per cent (Graph 3.17). Nonetheless, leverage
remains low by historical standards. The distribution
of gearing ratios also remains quite wide: leverage
of the most highly geared firms is around average
levels, whereas the median gearing ratio is below
the level typically seen over the past decade. Among
the highly geared firms, infrastructure and real estate
companies are over-represented, reflecting business
models that tend to rely more on debt financing.
Credit bureau data indicate that smaller businesses’
median gearing also increased slightly in 2011 after
decreasing over the previous few years. Smallerbusinesses tend to have lower leverage than larger
businesses; many of them do not use any debt
finance and those that do tend to be less geared
than indebted larger businesses.
Business balance sheets remain more liquid than
they were prior to the financial crisis, but of late
there has been no tendency to shift further in this
direction. Average cash holdings have declined a
little recently, and growth in business deposits atbanks has slowed, averaging about 6 per cent over
Graph 3.17
Graph 3.18
Listed Corporates’ Gearing*
0
20
40
60
80
100
0
75
150
225
300
375
2012
95th percentile
% Aggregate Distribution**%
25th percentile
75th percentile
Median
201219991986 20072002* Book value debt-to-equity; excludes foreign-domiciled companies; dots
are estimates based on companies that have reported to date** Indebted companies only; excludes companies with negative equitySources: Bloomberg; Morningstar; RBA; Statex
Debt-servicing Ratios
0
10
20
30
0
40
80
120
2012
All businesses*
% Aggregate %
Listed corporates**
95th percentile
75th percentile
Median
200219921982 201220062000
Interest payments as a per cent of profits
Distribution**Listed corporates
* Gross interest on intermediated debt from Australian-domiciled financialinstitutions
** Net interest on all debt; excludes foreign-domiciled companies; dots are
estimates based on companies that have reported to date; distributionexcludes companies with negative profits
Sources: ABS; Bloomberg; Morningstar; RBA

7/29/2019 Rba Financial Stability Report Sep 2012
http://slidepdf.com/reader/full/rba-financial-stability-report-sep-2012 48/66
46 ReseRve bank of austRalia
Corcial prory
Overall, conditions in the commercial property
market continued to improve in early 2012, though
they remain softer than prior to the financial crisis
and building activity has also been weak by historical
standards (Graph 3.21). The strength of the recovery
since the crisis has varied across market segments;
conditions have improved more in the prime CBD
office market than in the industrial and retail sectors.
This may partly reflect the more pronounced cycle
in the CBD office sector, as well as the pressures that
some parts of the non-mining business sector have
been under. For example, rental and price growth
for some retail properties, particularly in non-prime
locations, have been weak recently given the patchy
retail conditions.
firms are high; most of these companies are
in the manufacturing or property sectors, and
they generally have high debt levels and are
experiencing below-average earnings. Almost all
of these companies have no outstanding bonds,
implying that their debt is primarily sourced from
banks; that said, their total debt is only a small share
of business credit. Of the top 100 listed firms, 5 per
cent of those with outstanding debt recorded a loss
in 2011 compared with an average of around 4 per
cent over the past decade. Although some of these
loss-making firms may have difficulty servicing their
debts out of current cashflows, many have buffers
that they are able to access and accordingly are not
in arrears.
As discussed in ‘The Australian Financial System’
chapter, the share of banks’ business loans that is
non-performing decreased over the first half of 2012,
but remains higher than average (Graph 3.19). Data
from the major banks’ Pillar 3 reports indicate that
the property and business services and construction
sectors have the highest non-performing assets
ratios. Despite the economy growing at around trend
and relatively strong overall profit levels, business
failure rates have been a little above average over
the year to date (Graph 3.20). This implies that the
segment of poorly performing firms is currently
larger than the aggregate data alone would suggest.
Graph 3.19
Graph 3.20
0
2
4
6
0
2
4
6
Banks’ Non-performing Business Assets*Domestic books, share of outstandings by type
2010
All businesses
% %
Incorporated businesses
Unincorporated businesses
20082006 20122004
* Excludes lending to financial businesses and includes bills and debtsecurities
Sources: APRA; RBA
0.3
0.6
0.3
0.6
Business FailuresShare of businesses in each sector, annual
* Companies entering external administration** Business-related personal bankruptciesSources: ABS; ASIC; ITSA; RBA
2012
%Incorporated*
0.0
0.3
0.6
0.0
0.3
0.6
Unincorporated**
%
%%
20072002199719921987
Many of these firms are located in Queensland and
are experiencing challenging conditions associated
with the high exchange rate and the weak property
market there. The business failure rate has also
risen in Western Australia over the past few years,
though it remains low compared with other states
and is currently below its recent peak. Nationally,
failures have been concentrated in the services and
construction sectors, and relatively more have been
attributed to economic conditions in recent years.

7/29/2019 Rba Financial Stability Report Sep 2012
http://slidepdf.com/reader/full/rba-financial-stability-report-sep-2012 49/66
47financial stability review | s e p t e m b e r 2 0 1 2
a small rise in exposures, broadly offsetting a further
decline in the exposures of foreign-owned banks.
European-owned banks, in particular, continued
to run down their commercial property exposures,
which are now down about 65 per cent from their
early 2009 peak. This may be because of the higher
impairment rate these banks have experienced on
their commercial property portfolios, as well as some
of these banks being under pressure to deleverage
given the difficulties their parent groups are facing in
Europe. Non-bank sources of finance for commercial
property remain constrained, with little issuance of
commercial mortgage-backed securities in recent
years.
While liaison with construction companies and
developers suggests that access to credit remains
tight, large developers report that they are able to
progress most projects with bank funding or the
assistance of domestic or foreign investors. Smaller
developers indicate that they continue to face tight
credit conditions through lower LVR limits, andother stricter terms and conditions. Liaison with the
banks and partial data suggest that, as for residential
property, areas that are more reliant on tourism
(such as the Gold Coast and Sunshine Coast in
Queensland) are facing greater challenges, including
oversupply and declining valuations.
As noted earlier, banks have large exposures to the
commercial property market (including developers
of residential property), with lending to that sector
accounting for about one-third of their business
loans and a disproportionate share – slightly
less than half in recent years – of business loan
impairments. Consistent with the improvement in
conditions, the performance of banks’ commercial
property exposures improved slightly over the year
to June 2012, but the impairment rate remains
above that for banks’ total business lending. In
aggregate, banks’ outstanding commercial property
lending was broadly unchanged over the year toJune (Graph 3.22). Australian-owned banks recorded
Graph 3.21
Graph 3.22
60
100
60
100
Commercial Property*March 1995 = 100, log scale
Index
Prices
CBD office Industrial Retail
Rents**
Index
20121998
160
260
160
260
20121998 20121998
* CBD office and industrial are prime property, retail is regional (non-CBD)centres** CBD office is effective rents, industrial and retail are face rentsSources: ABS; Jones Lang LaSalle Research; Property Council of Australia;
RBABanks’ Commercial Property Exposures
0
50
100
150
200
0
5
10
15
20
* Includes UK and continental European banksSources: APRA; RBA
2012
All banks
$b
European banks*
201220082008 2004
$b
Major banks
US banks
Asian banks
Non-major Australian banks
2004
Consolidated Australian operations
The financial position of Australian listed real estate
investment trusts (REITs) has continued to improve,
but they are no longer deleveraging as quickly as
they did immediately after the crisis (Graph 3.23). The sector’s deleveraging has been concentrated
in intermediated debt, with non-intermediated
debt levels stable over much of the decade.
After recording large losses over 2008 and 2009,
mostly due to property write-downs, the sector’s
profitability has stabilised at levels experienced
around the mid 2000s. Consequently, their aggregate
debt-servicing requirements have also declined.
Nonetheless, the distribution of leverage across REITs
is wide and the gearing ratios of the most highly

7/29/2019 Rba Financial Stability Report Sep 2012
http://slidepdf.com/reader/full/rba-financial-stability-report-sep-2012 50/66
48 ReseRve bank of austRalia
Graph 3.23Australian Listed REITs
-100
0
100
200
300
400
-50
0
50
100
150
200
* Book value, excludes REITs with negative equity** Net interest payments-to-earnings, excludes REITs with negative earnings
Sources: Bloomberg; Morningstar; RBA
2012
Median
% Debt-to-equity ratio* %Debt-servicing ratio**
90th percentile
75th percentile
25th percentile
20072002200720021997 2012
geared firms (around the 90th percentile) remain
elevated, due to falls in equity valuations. Many of
these highly leveraged REITs have also experienced
low or negative profits recently and, accordingly, high
debt-servicing requirements. Overall, loss-making
REITs tend to be small and only account for a low
share of business credit.

7/29/2019 Rba Financial Stability Report Sep 2012
http://slidepdf.com/reader/full/rba-financial-stability-report-sep-2012 51/66
FINANCIAL STABILITY revIew | s eptem ber 2 0 1 2 49
In Australia, households often choose to pay down
their mortgage more quickly than required. Various
data sources suggest that around half of borrowers
are ahead of schedule on their mortgage. In this
way, many households have a buffer that they could
temporarily draw on to stay current on their loan
repayments if their incomes were to fall. The share of
Australian households paying their mortgage ahead
of schedule is high compared with many other
countries, though the available evidence suggests it
is broadly similar to Canada.
In aggregate, the stock of Australian households’
prepayment buffers is estimated to be equivalent to
over 10 per cent of the outstanding stock of housing
loans (Graph B1). This includes balances in mortgage
offset and redraw facilities. Flows into these accounts
include regular excess repayments and one-off excess repayments paid out of salary bonuses or
other irregular income. The stock of prepayments
has risen recently, in part because most borrowers
do not change their regular repayment amounts
when interest rates fall. Some borrowers have also
been choosing to make very large prepayments
Box B
Households’ MortgagePrepayment Buffers
Graph B1
recently; according to the latest HILDA Survey, the
share of indebted households who made substantial
principal repayments on their mortgage (of $25 000
or more over the year) was significantly higher in
2010 (22 per cent) than the average between 2002
and 2007 (15 per cent).1
Measured a different way, in aggregate, indebtedhouseholds’ mortgage prepayment buffers are
estimated to be equivalent to around 1 years of
scheduled repayments (principal plus interest) based
on current interest rates. While this average figure is
boosted by a group of borrowers that are significantly
ahead of schedule – liaison with the major banks
suggests that around 15 per cent of borrowers are
ahead by two years or more – many borrowers still
have sizeable buffers. Of those borrowers that are
ahead on their mortgage: around 45 per cent areestimated to have a buffer of up to six months; 15 per
cent have a buffer of between six months and a year;
and over 40 per cent have a buffer greater than one
year’s repayments (Graph B2).
Data from the HILDA Survey suggest that households
with large mortgage buffers tend to be older and
have higher incomes, which is consistent with these
households having had more time and/or income to
accumulate such buffers (Graph B3). Borrowers thathave small or no buffers tend to be younger or have
more recently taken out their loan. Even among these
latter groups, however, just over half of borrowers are
reported to be ahead of schedule on their repayments.
The bulk of households that are not ahead of
schedule on their mortgage are not in financial stress;
1 See RBA (2012), ‘Box B: Home Mortgage Debt: Recent Insights from the
HILDA Survey’, Financial Stability Review, March, pp 53–56. Generally,
the HILDA Survey interviews the same set of individuals each year,
mainly between August and November, with the latest publishedresults being for 2010. It therefore makes it possible to trace individual
changes in housing debt over the past decade.
Aggregate Mortgage Buffer
2008
No
Per cent of housing loans outstanding
10
20
10
20
0
10
20
0
10
20
2009 2010 2011 2012
Number of monthsNo
%%
Source: APRA

7/29/2019 Rba Financial Stability Report Sep 2012
http://slidepdf.com/reader/full/rba-financial-stability-report-sep-2012 52/66
ReseRve Bank of austRalia50
roughly half of indebted households are paying their
mortgages on schedule, with only a very small share
of borrowers in arrears. Some borrowers may have
chosen to take out loan products that discourage
excess repayments but nonetheless suit the
borrowers’ circumstances. For example, prepayments
are less common on fixed-rate loans because these
loans typically involve fees on prepayments above
a certain threshold. In contrast, variable-rate loans
– which are the bulk of housing loans in Australia –
do not generally involve prepayment penalties and
therefore show higher rates of excess repayment.
Decisions to prepay may also be influenced by taxincentives. Owner-occupiers have an incentive to
pay down their mortgage ahead of schedule as their
interest payments are not tax deductible: in effect,
the post-tax return to prepaying these loans equals
the mortgage rate. Investors, by contrast, do not have
the same incentive to make excess repayments given
they can negatively gear their property. Consistent
with this, over half of owner-occupiers are estimated
to be ahead on their mortgage compared with less
than 40 per cent of investors, and, of those that areahead, owner-occupiers tend to have larger buffers.
The share of owner-occupier households that could
be considered to be most vulnerable, that is, with
both high debt-servicing ratios (DSRs) and high loan-
to-valuation ratios (LVRs), was quite low at around
2 per cent in 2010 according to data from the
latest HILDA Survey (Graph B4). The measure of debt
servicing used here covers actual repayments made
by households and includes excess repayments;more than one-third of these households are ahead
of schedule on their mortgage. For these borrowers,
this would suggest that their high DSRs are largely
voluntary and that they are therefore less vulnerable
to falling into stress. R
Graph B2
Graph B3
Graph B4
0
10
20
30
0
10
20
30
Mortgage Buffers*Share of ahead-of-schedule borrowers, 2012
* Estimates from a sample of large banksSource: RBA
1–3
%
3–6 6–12 12–24 24+Months
%
Mortgage Borrowers Ahead of Schedule*
* Owner-occupier households with mortgage debtSource: HILDA Release 10.0
0
15
30
45
60
% %
1 5 – 3 4
3 5 – 4 4
4 5 – 5 4
5 5 +
Age of household headShare of each age bracket,
years
Income bracketShare of each income bracket,
per cent
2010
0
15
30
45
60
8 0 > 1 0 0
6 0 > 8 0
4 0 > 6 0
2 0 > 4 0
0 > 2 0
0
1
2
3
4
0
1
2
3
4
Households with High LVRs and DSRs*Share of households with owner-occupier debt
%
2010
Of which: ahead of schedule
All
* Households with loan-to-valuation ratios above 80 per cent anddebt-servicing ratios greater than 50 per cent
Source: HILDA Release 10.0
%
2008200620042002

7/29/2019 Rba Financial Stability Report Sep 2012
http://slidepdf.com/reader/full/rba-financial-stability-report-sep-2012 53/66
51financial stability review | s e p t e m b e r 2 0 1 2
The international regulatory bodies have continued
their financial reform efforts in several areas over
the past six months. Further progress has been
made in implementing aspects of the framework for
systemically important financial institutions (SIFIs),
especially for globally systemic banks, but more
recently also for other types of systemic institutions.
Improving resolution regimes for SIFIs is an important
element of this reform program, with countries
encouraged to alter their resolution frameworks to
be consistent with a new international standard for
them. The Financial Stability Board (FSB) recently
initiated a peer review to monitor progress in this
area. In a related development, the Committeeon Payment and Settlement Systems (CPSS)
and the International Organization of Securities
Commissions (IOSCO) released a consultation paper
on recovery and resolution of financial market
infrastructures (FMIs). These two bodies also released
new principles for FMIs, which aim to strengthen
them and their supervision. These developments
have been considered by the Council of Financial
Regulators (CFR) in recent discussions on changes to
the domestic regulatory framework for FMIs.
Reform of over-the-counter (OTC) derivatives market
regulation to meet G-20 commitments is progressing
in many jurisdictions, including Australia. Standard-
setting bodies released capital rules and proposed
margin requirements that support one of these
commitments, which is for all standardised OTC
derivatives contracts to be centrally cleared. The
FSB is continuing to lead work on the regulation
of shadow banking; several workstreams havedelivered initial reports and are scheduled to deliver
policy recommendations regarding specific shadow
banking entities and activities by end 2012.
The International Monetary Fund (IMF) has recently
undertaken a Financial Sector Assessment Program(FSAP) update of Australia to assess the stability of
the financial sector and the quality of domestic
regulatory, supervisory and resolution arrangements.
CFR agencies prepared background material and
held extensive discussions with the IMF on these
issues and on banking and financial stability issues
more generally. The Australian Prudential Regulation
Authority (APRA) has continued to consult with
authorised deposit-taking institutions (ADIs) on the
implementation of the Basel III capital and liquidity
reforms in Australia, and will soon release its final
capital standards, with a revised draft liquidity
standard due to be released in December 2012. APRA
has also engaged with financial sector stakeholders
on a range of other draft prudential standards,
including those relating to superannuation,
conglomerate supervision and capital requirements
for insurers.
Inrnaional RgulaoryDvlons and Ausralia
Sysically ioran financial
insiuions (SIFIs)
As discussed in the March 2012 Review , the FSB,
in close coordination with the Basel Committee
on Banking Supervision (BCBS), developed a
comprehensive policy framework to address the
risks posed by SIFIs. Some specific elements of this
framework focus on institutions that are systemically
4. Dvlons in h FinancialSys Archicur
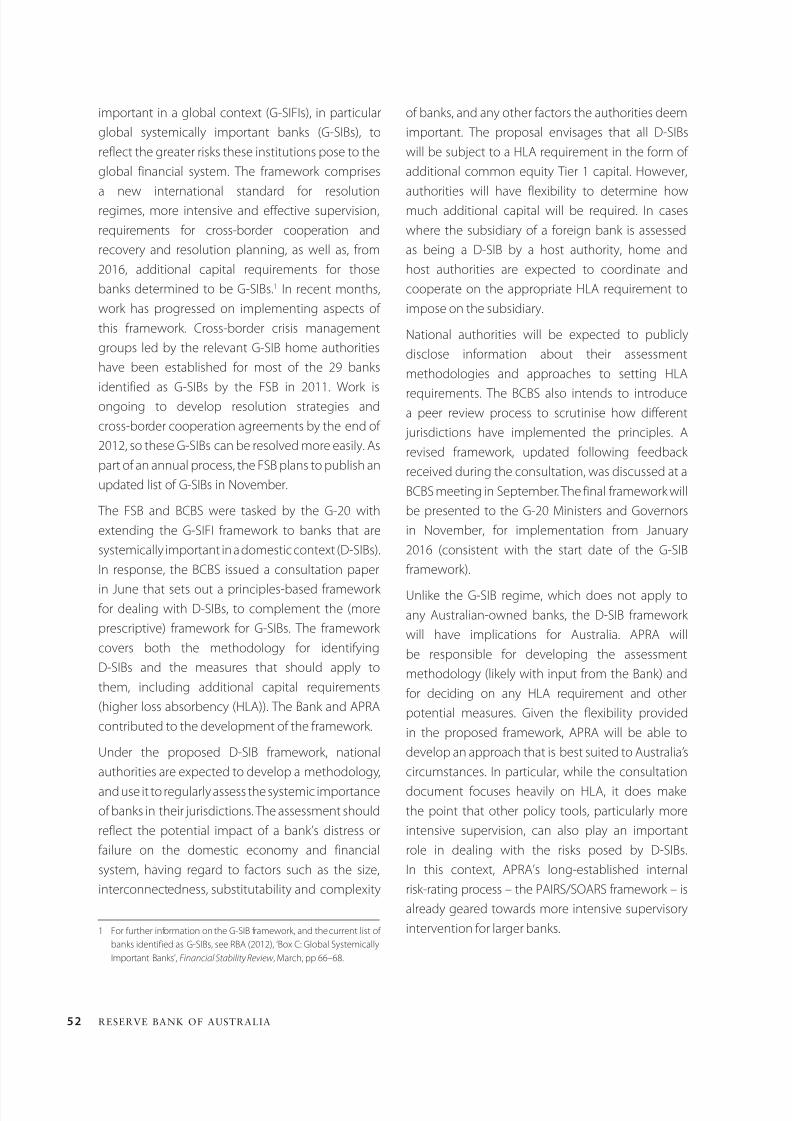
7/29/2019 Rba Financial Stability Report Sep 2012
http://slidepdf.com/reader/full/rba-financial-stability-report-sep-2012 54/66
52 ReseRve bank of austRalia
important in a global context (G-SIFIs), in particular
global systemically important banks (G-SIBs), to
reflect the greater risks these institutions pose to the
global financial system. The framework comprises
a new international standard for resolution
regimes, more intensive and effective supervision,
requirements for cross-border cooperation and
recovery and resolution planning, as well as, from
2016, additional capital requirements for those
banks determined to be G-SIBs.1 In recent months,
work has progressed on implementing aspects of
this framework. Cross-border crisis management
groups led by the relevant G-SIB home authorities
have been established for most of the 29 banks
identified as G-SIBs by the FSB in 2011. Work is
ongoing to develop resolution strategies and
cross-border cooperation agreements by the end of
2012, so these G-SIBs can be resolved more easily. As
part of an annual process, the FSB plans to publish an
updated list of G-SIBs in November.
The FSB and BCBS were tasked by the G-20 with
extending the G-SIFI framework to banks that are
systemically important in a domestic context (D-SIBs).
In response, the BCBS issued a consultation paper
in June that sets out a principles-based framework
for dealing with D-SIBs, to complement the (more
prescriptive) framework for G-SIBs. The framework
covers both the methodology for identifying
D-SIBs and the measures that should apply to
them, including additional capital requirements
(higher loss absorbency (HLA)). The Bank and APRA
contributed to the development of the framework.
Under the proposed D-SIB framework, nationalauthorities are expected to develop a methodology,
and use it to regularly assess the systemic importance
of banks in their jurisdictions. The assessment should
reflect the potential impact of a bank’s distress or
failure on the domestic economy and financial
system, having regard to factors such as the size,
interconnectedness, substitutability and complexity
1 For further information on the G-SIB framework, and the current list of
banks identified as G-SIBs, see RBA (2012), ‘Box C: Global Systemically
Important Banks’, Financial Stability Review , March, pp 66–68.
of banks, and any other factors the authorities deem
important. The proposal envisages that all D-SIBs
will be subject to a HLA requirement in the form of
additional common equity Tier 1 capital. However,
authorities will have flexibility to determine how
much additional capital will be required. In cases
where the subsidiary of a foreign bank is assessed
as being a D-SIB by a host authority, home and
host authorities are expected to coordinate and
cooperate on the appropriate HLA requirement to
impose on the subsidiary.
National authorities will be expected to publicly
disclose information about their assessment
methodologies and approaches to setting HLArequirements. The BCBS also intends to introduce
a peer review process to scrutinise how different
jurisdictions have implemented the principles. A
revised framework, updated following feedback
received during the consultation, was discussed at a
BCBS meeting in September. The final framework will
be presented to the G-20 Ministers and Governors
in November, for implementation from January
2016 (consistent with the start date of the G-SIB
framework).
Unlike the G-SIB regime, which does not apply to
any Australian-owned banks, the D-SIB framework
will have implications for Australia. APRA will
be responsible for developing the assessment
methodology (likely with input from the Bank) and
for deciding on any HLA requirement and other
potential measures. Given the flexibility provided
in the proposed framework, APRA will be able to
develop an approach that is best suited to Australia’scircumstances. In particular, while the consultation
document focuses heavily on HLA, it does make
the point that other policy tools, particularly more
intensive supervision, can also play an important
role in dealing with the risks posed by D-SIBs.
In this context, APRA’s long-established internal
risk-rating process – the PAIRS/SOARS framework – is
already geared towards more intensive supervisory
intervention for larger banks.

7/29/2019 Rba Financial Stability Report Sep 2012
http://slidepdf.com/reader/full/rba-financial-stability-report-sep-2012 55/66
53financial stability review | s e p t e m b e r 2 0 1 2
list of G-SIIs, if any, is expected to be published by the
FSB in the first half of 2013. The IAIS has also been
developing a set of policy measures for G-SIIs, which
will be consulted on later in 2012. These measures
are expected to be consistent with the FSB’s overall
SIFI policy framework.
In addition to the G-SII methodology, the IAIS is
continuing its work in other areas that will have
implications for a wider set of insurers. In July, it
released a draft of the Common Framework for
Supervision of Internationally Active Insurance Groups.
This framework is proposed to contain qualitative
and quantitative requirements for internationally
active insurers, recommendations on the supervisoryprocess aimed at achieving consistent and effective
supervision, as well as requirements for greater
cooperation and coordination among national
authorities in supervising complex cross-border
insurance groups. The IAIS expects to finalise the
framework by end 2013.
Rsoluion rgis
A key part of the SIFI framework is the FSB’s new
standard, Key Attributes of Effective Resolution Regimes
for Financial Institutions (Key Attributes), which sets
out the features that countries should have in their
resolution frameworks. National authorities are being
encouraged by the G-20 and the FSB to amend
national resolution regimes to be consistent with
the Key Attributes. To monitor, and hasten, progress
in this area, the FSB recently initiated a thematic
peer review of resolution regimes, to review FSB
member jurisdictions’ existing resolution regimes,and any planned changes, using the Key Attributes
as a benchmark. The findings of the review will also
inform the development of a methodology to assess
jurisdictions’ compliance with the Key Attributes.
The review covers banks, insurers, securities firms
and FMIs, though it will focus on banks because
resolution regimes for them are generally the most
advanced. The review is expected to conclude in
early 2013.
The flexibility provided in the D-SIB framework also
accommodates the different approaches to identify
domestic SIFIs that have already been adopted in
several countries. As noted in the previous Review ,
some of these identification methodologies are
based on a single indicator (such as size) while others
use multiple indicators, similar to the G-SIB approach.
An example of the latter was the approach used by
the US Financial Stability Oversight Council (FSOC)
to recently designate eight ‘financial market utilities’
(FMUs) as systemically important. These FMUs will
be subject to additional prudential and reporting
requirements. These are the first designations by
FSOC of systemically important FMUs under the
Dodd-Frank Act, and were based on factors such as
the value of transactions processed by the FMU, its
counterparty exposures, its interconnectedness with
other FMUs and the effect its failure would have on
critical markets or the broader financial system.
The G-SIFI framework is also being extended to
global systemically important insurers (G-SIIs). In
May, the International Association of Insurance
Supervisors (IAIS) issued for consultation its proposed
methodology for identifying G-SIIs. The methodology
is similar to the BCBS’ approach for identifying G-SIBs.
It uses indicators from five broad categories: size,
global activity, substitutability, interconnectedness,
and non-traditional insurance and non-insurance
activities, though with a higher weight on the last
two categories. As noted in the previous Review ,
the greater emphasis on non-traditional insurance
and non-insurance activities reflects the IAIS’
view that traditional insurance business does notnormally generate systemic risk. Such risk is more
likely to stem from other activities such as financial
guaranty (including mortgage) insurance, credit
default swaps, derivatives trading and leveraging
assets to enhance market returns. The IAIS tested
its methodology using 2010 data collected from
48 insurers in 13 jurisdictions. No Australian-owned
insurer was included in the data collection. The
IAIS is currently reviewing feedback received on its
proposals before finalising its methodology. An initial
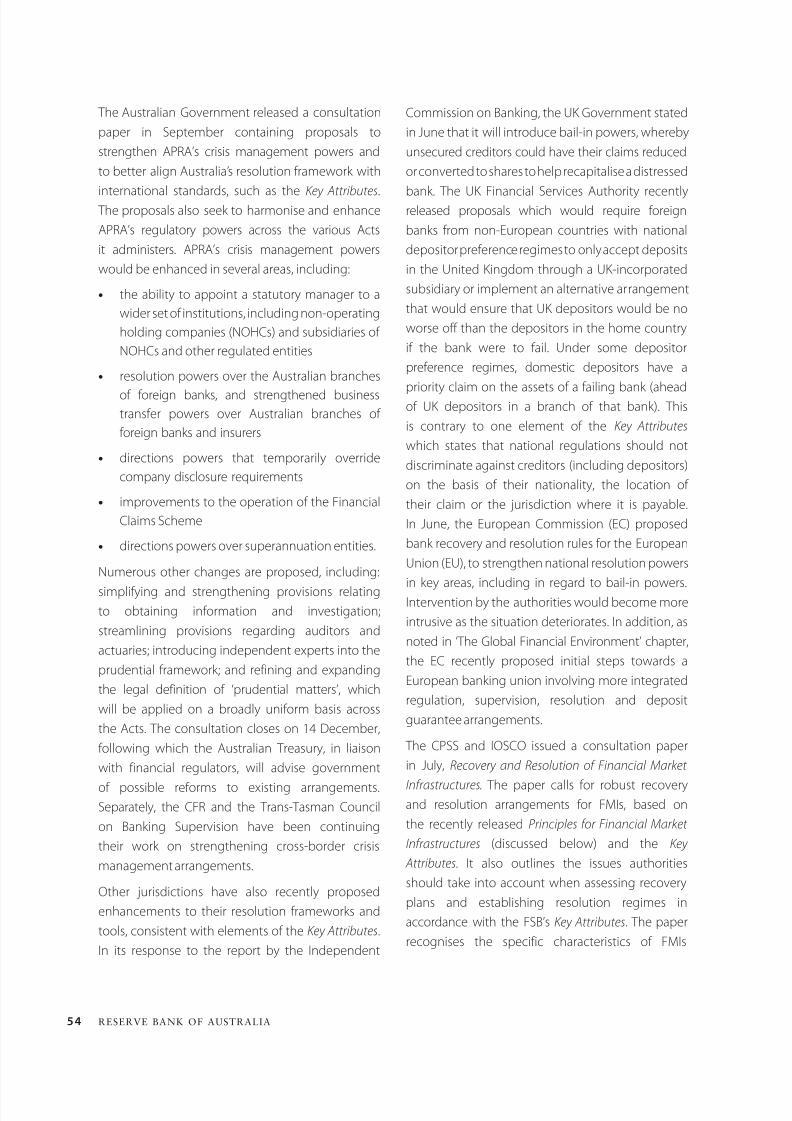
7/29/2019 Rba Financial Stability Report Sep 2012
http://slidepdf.com/reader/full/rba-financial-stability-report-sep-2012 56/66
54 ReseRve bank of austRalia
Commission on Banking, the UK Government stated
in June that it will introduce bail-in powers, whereby
unsecured creditors could have their claims reduced
or converted to shares to help recapitalise a distressed
bank. The UK Financial Services Authority recently
released proposals which would require foreign
banks from non-European countries with national
depositor preference regimes to only accept deposits
in the United Kingdom through a UK-incorporated
subsidiary or implement an alternative arrangement
that would ensure that UK depositors would be no
worse off than the depositors in the home country
if the bank were to fail. Under some depositor
preference regimes, domestic depositors have a
priority claim on the assets of a failing bank (ahead
of UK depositors in a branch of that bank). This
is contrary to one element of the Key Attributes
which states that national regulations should not
discriminate against creditors (including depositors)
on the basis of their nationality, the location of
their claim or the jurisdiction where it is payable.
In June, the European Commission (EC) proposed
bank recovery and resolution rules for the European
Union (EU), to strengthen national resolution powersin key areas, including in regard to bail-in powers.
Intervention by the authorities would become more
intrusive as the situation deteriorates. In addition, as
noted in ‘The Global Financial Environment’ chapter,
the EC recently proposed initial steps towards a
European banking union involving more integrated
regulation, supervision, resolution and deposit
guarantee arrangements.
The CPSS and IOSCO issued a consultation paperin July, Recovery and Resolution of Financial Market
Infrastructures. The paper calls for robust recovery
and resolution arrangements for FMIs, based on
the recently released Principles for Financial Market
Infrastructures (discussed below) and the Key
Attributes. It also outlines the issues authorities
should take into account when assessing recovery
plans and establishing resolution regimes in
accordance with the FSB’s Key Attributes. The paper
recognises the specific characteristics of FMIs
The Australian Government released a consultation
paper in September containing proposals to
strengthen APRA’s crisis management powers and
to better align Australia’s resolution framework with
international standards, such as the Key Attributes.
The proposals also seek to harmonise and enhance
APRA’s regulatory powers across the various Acts
it administers. APRA’s crisis management powers
would be enhanced in several areas, including:
• the ability to appoint a statutory manager to a
wider set of institutions, including non-operating
holding companies (NOHCs) and subsidiaries of
NOHCs and other regulated entities
• resolution powers over the Australian branchesof foreign banks, and strengthened business
transfer powers over Australian branches of
foreign banks and insurers
• directions powers that temporarily override
company disclosure requirements
• improvements to the operation of the Financial
Claims Scheme
• directions powers over superannuation entities.
Numerous other changes are proposed, including:
simplifying and strengthening provisions relating
to obtaining information and investigation;
streamlining provisions regarding auditors and
actuaries; introducing independent experts into the
prudential framework; and refining and expanding
the legal definition of ‘prudential matters’, which
will be applied on a broadly uniform basis across
the Acts. The consultation closes on 14 December,
following which the Australian Treasury, in liaisonwith financial regulators, will advise government
of possible reforms to existing arrangements.
Separately, the CFR and the Trans-Tasman Council
on Banking Supervision have been continuing
their work on strengthening cross-border crisis
management arrangements.
Other jurisdictions have also recently proposed
enhancements to their resolution frameworks and
tools, consistent with elements of theKey Attributes
.In its response to the report by the Independent
7/29/2019 Rba Financial Stability Report Sep 2012
http://slidepdf.com/reader/full/rba-financial-stability-report-sep-2012 57/66
55financial stability review | s e p t e m b e r 2 0 1 2
relative to other financial institutions, including that
there is often only a sole FMI providing systemically
important services in a particular market and hence
continuity of service provision is often paramount.
Intervention by the relevant authorities, potentially
through the appointment of a statutory manager,
may therefore be necessary for the resolution of
an FMI. Following feedback received during the
consultation, CPSS-IOSCO will report on how to
incorporate FMI-specific issues into the methodology
for assessing compliance with the Key Attributes. The
issues raised in the consultation paper also have
a bearing on proposed intervention powers for
Australian regulators of FMIs (see below).
Financial ark infrasrucurs
In April, the CPSS and IOSCO released the Principles
for Financial Market Infrastructures (PFMIs), a
comprehensive set of standards designed to apply to
all systemically important payment systems, central
counterparties (CCPs), securities settlement systems
and trade repositories. The PFMIs, which harmonise
and replace three existing sets of standards for FMIs,
aim to provide greater consistency in the oversightand regulation of FMIs across jurisdictions. They
recognise the critical role of FMIs, and the increasing
use of centralised infrastructure, in part in response
to the G-20 commitments around central clearing
and centralised reporting of OTC derivatives. The
PFMIs strengthen existing requirements in a number
of areas, including the coverage of credit risk, the
management of liquidity risk and governance. They
also introduce several new principles, including
on segregation and portability of client monies,
general business risk and disclosure. Further, the
PFMIs include resolution planning requirements,
and arrangements for the orderly wind-down or
recapitalisation of a failed CCP. Together with the
PFMIs, CPSS-IOSCO issued two related consultation
documents – an assessment methodology and a
disclosure framework for PFMIs – which are due to
be finalised later this year.
CPSS and IOSCO members and other relevant
authorities are expected to adopt the PFMIs in
their legal and regulatory frameworks by end 2012,
while FMIs should observe the standards as soon
as possible. In accordance with this, and as a CPSS
member, the Bank is currently consulting on revisions
to its Financial Stability Standards for clearing and
settlement facilities, to ensure that they align with
the PFMIs. The Bank will also apply the PFMIs in its
self-assessments of RITS, Australia’s real-time gross
settlement system, and increase the frequency
of these assessments. The PFMIs also affect the
Australian Securities and Investments Commission’s
(ASIC’s) supervisory framework. Accordingly, ASIC is
also consulting on revisions to its Regulatory Guide on
Clearing and Settlement Facilities.
OtC drivaivs arks
In June, the FSB published a third progress report
on jurisdictions’ implementation of the G-20
commitments relating to OTC derivatives, namely,
that all standardised OTC derivative contracts should
be traded on exchanges or electronic platforms,
where appropriate, and centrally cleared by end2012, and that all OTC derivative contracts should
be reported to trade repositories. The report noted
that jurisdictions with the largest OTC derivatives
markets – the EU, Japan and the United States –
have made the most progress with their legislative
and regulatory programs. Other jurisdictions are
generally less advanced in implementing the
commitments, although progress has been made
by many of them, particularly with respect to central
clearing and the use of trade repositories.
As foreshadowed in the previous Review , the CFR
provided a number of recommendations to the
government in March on how best to implement
the G-20 commitments in Australia. The government
endorsed these recommendations and issued a
consultation paper in April proposing a domestic
legislative framework for implementing the reforms.
Under this proposal, the Corporations Act 2001 would
be amended so that mandatory obligations could be

7/29/2019 Rba Financial Stability Report Sep 2012
http://slidepdf.com/reader/full/rba-financial-stability-report-sep-2012 58/66
56 ReseRve bank of austRalia
imposed requiring that certain classes of derivatives
be cleared by a CCP, reported to a trade repository,
or executed on a trading platform. Any mandatory
obligation would be imposed via a two-stage
process. First, the relevant Minister, with advice from
APRA, ASIC and the Bank, would prescribe a class of
derivatives as being subject to a given obligation.
Second, ASIC would develop rules covering matters
such as the parties subject to the obligation and
the timing of its introduction. The Bank and APRA
would be consulted as part of any decision to
issue a mandate. Following the consultation, a Bill
setting out amendments to the Act was introduced
into Parliament in September. In parallel, the CFR
agencies are working on an assessment report on
the domestic OTC derivatives market, due to be
completed towards the end of the year – similar
reports will be undertaken on a regular basis. One
purpose of these reports is to assess progress of the
Australian market in adopting desired reforms; if
progress is insufficient then this could be a factor in
determining whether mandatory obligations might
be imposed.
To support the G-20 OTC derivatives-related
commitments, in July international standard-setting
bodies released capital rules and proposed margin
requirements to encourage central clearing of OTC
derivative contracts by banks and other institutions.
•• • The BCBS issued interim rules for the capital to
be held against bank exposures to CCPs. For
derivatives and securities financing transactions
that are centrally cleared, the counterparty credit
risk for these trades will attract a risk weight of 2 per cent if the CCP is supervised in a manner
consistent with the PFMIs (and is thus a ‘qualifying’
CCP). This risk weight is substantially lower than
that applying to counterparty exposures arising
out of bilateral transactions, or exposures to
‘non-qualifying’ CCPs, thereby creating a capital
incentive for central clearing through qualified
CCPs. The BCBS is to undertake further work on
a finalised approach, in collaboration with other
standard-setting bodies. APRA recently releasedproposals for implementing these requirements
for Australian ADIs as part of its consultation on
counterparty credit risk under Basel III.
•• • The G-20 commitment that OTC derivative
contracts be centrally cleared relates specifically
to standardised derivative contracts, since only
these are likely to be suitable for central clearing.
Non-standardised contracts, which account for a
substantial share of the derivatives market, will
therefore most likely remain subject to bilateral
arrangements. To mitigate some of the risks
associated with this segment of the market, and
to ensure appropriate incentives to centrally
clear trades, the BCBS and IOSCO released for
consultation draft margining requirements
for non-centrally cleared OTC derivatives. The
proposals would require the bilateral exchange
of both ‘variation’ margin and ‘initial’ margin
between all financial institutions, as well as
systemically important non-financial institutions.
Variation margin provides for the regular
exchange of cash between counterparties to
meet mark-to-market profits and losses. Initial
margin is collateral calibrated to cover, with a
high probability, any losses arising should market
prices move adversely between the last payment
of variation margin and the close-out of exposure
to a defaulting counterparty. Variation margin is
already typically exchanged for non-centrally
cleared trades, but initial margin has been less
frequently applied. The BCBS and IOSCO are
conducting a quantitative impact study to assess
the effect of these proposals, including the likely
demand on collateral, and will consider the
results when finalising the proposal by end 2012.
In June, IOSCO published International Standards
for Derivatives Market Intermediary Regulation, which
provides international standards for the regulation
of market participants in the business of dealing,
making a market or intermediating transactions in
OTC derivatives (‘derivatives market intermediaries’ or
DMIs). Historically, these entities have, in many cases,
not been subject to the same level of regulation as
participants in the traditional securities market. The
report makes recommendations in several areas,
including registration/licensing standards, capital
7/29/2019 Rba Financial Stability Report Sep 2012
http://slidepdf.com/reader/full/rba-financial-stability-report-sep-2012 59/66
57financial stability review | s e p t e m b e r 2 0 1 2
standards or other financial resource requirements
for non-prudentially regulated DMIs and
business conduct and supervision standards. The
recommendations seek to reduce risks to financial
stability by helping to manage counterparty
risk in OTC derivatives markets. They also aim to
protect participants in OTC derivatives markets
from unfair, improper or fraudulent practices. The
report emphasises the importance of cross-border
consistency in the regulation of DMIs given that
many operate in multiple jurisdictions.
Assssing ilnaion of basl III
caial rfors
The BCBS continues to monitor implementation
of the Basel capital framework (that is, Basel II,
Basel 2.5 and Basel III), to encourage its full, timely
and consistent implementation by countries. In
a June report to the G-20, the BCBS stated that
significant progress had been made, with most of
its 27 members having already implemented Basel II
and 2.5 (the July 2009 enhancements on market
risk and securitisations) and released draft or final
rules for the implementation of Basel III in their
jurisdictions. However, the BCBS also noted that,
based on current plans, some jurisdictions may not
implement Basel III according to the agreed time
lines. The BCBS will present an updated progress
report on Basel III implementation to the G-20
Ministers and Governors in November.
As noted in the previous Review , the BCBS is
also conducting peer reviews of its members’
implementation of all components of the Baselcapital framework, to ensure they are consistent
with the minimum standards agreed under Basel III.
The results of the initial reviews (for the EU, Japan
and the United States) are due to be published
around the end of September.
Shadow anking
Led by the FSB, work is progressing on strengthening
the oversight and regulation of shadow banking
systems. The five workstreams noted in the March
2012 Review are continuing their work to develop
policies to manage the risks posed by: banks’
interactions with shadow banking entities; money
market funds (MMFs); other shadow banking entities
such as finance companies; securitisation; and
securities lending and repos. These workstreams are
scheduled to provide their policy recommendations
by end 2012. IOSCO is leading the workstreams
on MMFs and securitisation and released initial
reports on these two areas in April and June. The
report on MMFs provides a preliminary analysis of
the risks that MMFs could pose to financial stability
and seeks views on a range of policy options to
address those risks, such as imposing capital and
liquidity requirements. The report on securitisation
includes draft policy recommendations covering
risk retention, improvements in transparency and
measures to standardise disclosure of securitisation
structures. The workstream on securities lending
and repos released an interim report in April that
provides an overview of these markets and how
they are currently regulated. It also discusses how
these activities might pose risks to financial stability,
for example by contributing to the procyclicality of leverage and interconnectedness (such as through
collateral re-use), or possibly sparking a fire sale of
collateral assets.
The FSB has also been examining the results of
its latest annual monitoring exercise on shadow
banking, which was extended this year to cover
all of its 24 member jurisdictions. The Bank again
contributed information on Australia’s relatively small
shadow banking system for this exercise, drawing onits own regular monitoring of developments in the
sector. In addition to enforcing disclosure, licensing
and conduct requirements on shadow banking
entities, ASIC also monitors industry trends, with
a focus on identifying emerging risks to financial
stability. In late March, ASIC released a report on
the Australian exchange-traded fund (ETF) market,
including details of how the market is regulated. The
report concluded that Australia’s current regulatory
framework is consistent with IOSCO’s proposed

7/29/2019 Rba Financial Stability Report Sep 2012
http://slidepdf.com/reader/full/rba-financial-stability-report-sep-2012 60/66
58 ReseRve bank of austRalia
international principles for the regulation of ETFs,
which are due to be finalised soon.
FSb and IOSCO r rviws
The FSB has continued with its program of ‘thematic’
and country peer reviews, as part of its efforts to
monitor and strengthen adherence to international
standards. As discussed earlier, a peer review on
resolution regimes is currently under way. The
recommendations of past thematic peer reviews
have often led to follow-up activities by the FSB
and/or national authorities. For example:
•• •In response to recommendations from an
earlier review of mortgage origination andunderwriting practices, the FSB released a
report in April, Principles for Sound Residential
Mortgage Underwriting Practices, which is a
principles-based framework to promote sound
lending practices. The Bank was represented on
the expert team that developed these principles.
These principles are already having an effect
on national regulatory frameworks: in June,
the Canadian banking and insurance regulator
issued a guideline that sets out expectationsfor prudent residential mortgage underwriting,
based in part on the FSB principles.
•• •Following a 2011 review on risk disclosure
practices, the FSB recently sponsored the
formation of a private sector task force to
develop principles for improved disclosures by
financial institutions of their risk exposures and
risk-management practices. The principles are
expected to be published in October. In a related
step, the FSB is currently undertaking a thematic
review of financial institutions’ risk governance.
Earlier this year, IOSCO established a committee,
currently chaired by ASIC, to conduct thematic and
member country reviews. Similar to the FSB peer
review process, the aim is to encourage full and
consistent implementation of IOSCO principles and
standards across jurisdictions. The first review will
cover the implementation of principles related to
systemic risk in securities markets.
Ohr Work of h Council of Financial Rgulaors (CFR)
Rgulaion of financial ark
infrasrucurs and ayns infrasrucur
As reported in the previous Review , the CFR undertook
a public consultation in late 2011 on measures to
enhance the regulation of FMIs. Following feedback
from industry, the CFR recommended to the
government a program of legislative reforms largely
in line with its original proposals. The government
subsequently released the CFR’s recommendations
for final consultation in late March 2012. Among its
key recommendations the CFR proposed resolutionmeasures for FMIs and powers to ensure adequate
regulatory influence over cross-border FMIs.
The resolution measures recognise that the
disorderly failure of an FMI could result in financial
markets ceasing to operate effectively, severely
disrupting the financial system. A key concern of
regulators, therefore, is to ensure the continuity of
critical services when an FMI is in financial distress,
especially given, as noted earlier, there is oftenonly a single FMI providing services in a particular
market. If an FMI is unable to recover through its
own efforts, regulators may need to intervene to
maintain continuity of services while organising
a recapitalisation or orderly wind-down of the
FMI. The CFR recommendations would give the
regulators power to appoint a statutory manager
to a distressed FMI. A similar power is available to
APRA for ADIs under the Banking Act 1959. Under the
proposed reforms, the regulators would also have
enhanced powers to give directions to, and impose
sanctions on, FMIs.
To be able to carry out their oversight responsibilities
effectively for overseas FMIs operating in Australia
or domestic FMIs that are seeking to outsource
their operations, ASIC and the Bank must have
sufficient influence over the FMI’s activities and
risk-management practices. Accordingly, the CFR
recommended giving the regulators explicit powersunder the Corporations Act to support a proportional

7/29/2019 Rba Financial Stability Report Sep 2012
http://slidepdf.com/reader/full/rba-financial-stability-report-sep-2012 61/66
59financial stability review | s e p t e m b e r 2 0 1 2
and graduated ‘location policy’ that could require
certain elements of a licensed FMI’s operations to
be located in Australia. To provide further clarity in
this area, the CFR issued a paper in July, Ensuring
Appropriate Influence for Australian Regulators over
Cross-border Clearing and Settlement Facilities. This
paper sets out a framework within which ASIC and
the Bank could impose additional requirements on
clearing and settlement facilities with cross-border
operations. The framework considers how
requirements might be escalated according to the
nature and scope of a facility ’s operations in Australia.
ASIC and the Bank are seeking feedback on specific
measures within the framework as part of a broader
consultation on implementation of the Principles for
Financial Market Infrastructures discussed earlier.
CFR agencies have continued their work with the
Australian Competition and Consumer Commission
(ACCC) on the competition aspects of clearing and
settlement. In June, the CFR published a consultation
paper, Competition in the Clearing and Settlement of
the Australian Cash Equity Market . The paper takes
openness to competition and foreign participation
in clearing and settlement services as a starting
point. However, it acknowledges that competition
can change the operating environment for banks,
securities dealers, issuers and investors in ways that
could have implications for financial stability and the
effective functioning of markets; additional policy
measures might therefore be needed. The CFR and
the ACCC are currently reviewing feedback from
the consultation before advising the government of
their conclusions.In July 2012, as part of the CFR’s work on FMI
regulation, the Bank amended its Exchange
Settlement Account (ESA) policy. Recognising that
settlement across central bank accounts and CCP
access to central bank liquidity can contribute to
financial stability, the new policy clarifies that any
Australian-licensed CCP with payment arrangements
giving rise to Australian dollar settlements may
hold an ESA. Moreover, the policy states that any
Australian-licensed CCP of systemic importance in
Australia must settle any Australian dollar margin-
related, or derivatives-related payments across
an ESA in its own name, or that of a related body
corporate. The Bank will take into account a number
of factors in determining the systemic importance of
a CCP, including: the size of the facility in Australia;
the availability of substitutes for the facility’s services
in Australia; the nature and complexity of the
products cleared or settled by the facility; and the
degree of interconnectedness with other parts of
the Australian financial system. Both of the ASX CCPs
currently settle Australian dollar obligations arising
from their activities via RITS across an ESA held by
their parent, ASX Clearing Corporation.
Following the Bank’s decision earlier this year to
formalise the requirements for reporting significant
retail payment system incidents, new reporting
standards were released in April. Significant incidents
must now be advised to the Bank within one hour,
and followed up with a post-incident report. The
Bank also intends to gather regular statistics on retail
payment system incidents, and will be consulting
with the industry on the modalities for doing this.
Financial Scor Assssn progra
(FSAp) rviw of Ausralia
As noted in the March 2012 Review , Australia has
this year undergone an IMF FSAP review. This is
a follow-up to Australia’s first FSAP conducted in
2005/06 and is consistent with a recent commitment
of FSB members to undergo an FSAP approximately
every five years. The focus of FSAP reviews is to
assess the stability of a country’s financial sector,the quality of its financial supervisory and crisis
management arrangements, and to review progress
in addressing recommendations from previous
FSAPs. CFR agencies prepared background material
for the IMF on aspects of Australia’s financial stability
and supervisory frameworks. The Bank and APRA
published one of these background papers, on
the financial stability policy framework, in early
September.

7/29/2019 Rba Financial Stability Report Sep 2012
http://slidepdf.com/reader/full/rba-financial-stability-report-sep-2012 62/66
60 ReseRve bank of austRalia
Overall, the FSAP found that Australia’s financial
system was sound and resilient due to several
factors: good economic management, prudent
and proactive supervision, and effective systemic
oversight. Stress testing indicated that the
banking sector was likely to withstand even severe
macroeconomic shocks. Discussions during the
FSAP focused on a number of themes, including
issues posed by a concentrated and interconnected
banking system, high household debt and elevated
house prices, and the banks’ use of offshore funding.
A combination of low public debt, a flexible
exchange rate, positive domestic interest rates
and a well-capitalised banking system was seen as
providing ample policy space to respond to any
stress event. The IMF is in the process of finalising a
report containing its detailed assessment and policy
recommendations, which is due to be published in
late 2012.
Ohr Dosic RgulaoryDvlons
Ilnaion of basl III caial andliquidiy rfors
In late March, APRA released its ‘response paper’
on feedback received during consultations with
the ADI industry on its proposals for implementing
the Basel III capital reforms in Australia. While the
paper provided detailed further guidance on the
application of the new standards, APRA indicated
that it does not intend to substantively alter its
planned approach from that proposed in its earlierconsultation (outlined in the September 2011
Review ). Australian ADIs will be required to meet the
Basel III minimum capital requirements, including
regulatory adjustments, in full from 1 January
2013 and the Basel III capital conservation buffer
requirement from 1 January 2016. Alongside the
response paper, APRA released for consultation draft
prudential standards which, together with additional
proposals released in August on counterparty credit
risk and other limited changes, will give effect to the
full implementation of the Basel III capital reforms
in Australia. Following industry feedback on these
proposals, APRA is expecting to release its final
capital standards soon. It is also looking to release a
further draft revised liquidity standard in December
2012.
Ohr rudnial sandards
As foreshadowed in the previous Review , APRA
has recently consulted on a draft set of prudential
standards for the superannuation industry. These
prudential standards would be the first for the
superannuation funds regulated by APRA (following
the recent passage of legislation giving APRAstandards-making powers for this sector) and are
aimed at strengthening the regulation of these
funds, as well as putting their regulatory framework
on a similar footing to ADIs and insurers. The
standards cover areas such as: risk management,
outsourcing, business continuity management,
audit and governance. APRA is currently reviewing
submissions to the consultation and intends to
finalise the prudential standards by end 2012, with
most of them to take effect from July 2013. To supportthese new prudential standards and implement the
transparency and accountability recommendations
of the government’s Stronger Super reforms, APRA
proposed in September substantially expanded
data reporting requirements for APRA-regulated
superannuation funds, including on investment
allocation, costs and returns.
As part of a long-running review which is nearing
completion, APRA published final versions of itscapital standards for life and general insurers in
May. The revised standards aim to increase the
loss-absorbing capacity of insurers by improving
the risk-sensitivity of the capital framework applying
to them. For example, the reforms will require
insurers to better account for the risk of incurring
multiple or unusually large losses in a year, such
as from multiple natural disasters, a pandemic, or
higher-than-expected volatility in credit spreads
as was experienced internationally during the
7/29/2019 Rba Financial Stability Report Sep 2012
http://slidepdf.com/reader/full/rba-financial-stability-report-sep-2012 63/66
61financial stability review | s e p t e m b e r 2 0 1 2
global financial crisis. The reforms will also continue
APRA’s practice of aligning capital standards across
APRA-regulated industries where appropriate; in
particular, they will maintain the consistency of
insurers’ capital standards with APRA’s proposed
Basel III capital standards for ADIs. This in turn should
help simplify the supervision of conglomerate
groups that include banking and insurance entities.
APRA also released draft prudential standards
covering some remaining capital matters as well
as audit, actuarial and risk management issues. The
overall framework will come into effect on 1 January
2013.
APRA announced in May that its implementation of a proposed prudential framework for the supervision
of financial conglomerates, outlined in an earlier
discussion paper, will be deferred to January
2014. The additional time will allow APRA to refine
the framework through a consultation on draft
prudential standards planned for later in the year,
and to ensure consistency with ongoing domestic
and international regulatory developments, as well
as allowing time for ADIs and insurers to adapt to
the new Basel III and insurance capital standards.
In a related development, as discussed earlier, the
government recently proposed enhanced crisis
management powers for APRA, including for the
resolution of financial conglomerates.
APRA’s new prudential standard for covered bonds
took effect from 1 August 2012 and applies to all
Australian ADI covered bond programs involving
Australian assets. A key requirement of the standard
is that ADIs identify on registers the assets transferredto a covered bond special purpose vehicle and those
that form part of a cover pool. APRA views this asset
identification as a key safeguard to ensure that there
is clarity about which assets support depositors and
which support covered bondholders.
Crdi roring
In May, the government introduced legislation to
amend the Privacy Act 1988 to, among other things,
allow more comprehensive credit reporting. The
changes are in response to an earlier Australian Law
Reform Commission inquiry into the application
of the Act. As discussed in the September 2007
Review , credit reporting is the practice of providing
information about an individual’s creditworthiness
to banks and other credit providers through credit
reporting agencies (CRAs). The Act governs theinformation that CRAs are permitted to keep on
individuals’ credit files and regulates the storage
and provision of this information. Currently, an
individual’s credit file is limited to basic personal
and employment details, a record of credit
applications made and ‘negative’ information
regarding any defaults, dishonoured cheques,
bankruptcy orders or relevant court judgments in
the past five years. The proposed changes to the
Act would allow CRAs to record additional ‘positive’information such as current credit accounts held,
available limits, account types and repayment
histories. The reforms aim to allow credit providers
to build a fuller picture of an individual’s financial
circumstances when determining their eligibility for
credit, thereby enabling more accurate assessments
of creditworthiness. The reforms also improve
consumer protection under the Act, by making it
easier for individuals to dispute and correct any
errors on their credit file. The Bill is currently being
considered by Parliament. R

7/29/2019 Rba Financial Stability Report Sep 2012
http://slidepdf.com/reader/full/rba-financial-stability-report-sep-2012 64/66
62 ReseRve bank of austRalia

7/29/2019 Rba Financial Stability Report Sep 2012
http://slidepdf.com/reader/full/rba-financial-stability-report-sep-2012 65/66
63financial stability review | s e p t e m b e r 2 0 1 2
Coyrigh and Disclair Noics
HILDA
The following Disclaimer applies to data obtained
from the HILDA Survey and reported in the chapter
on ‘Household and Business Balance Sheets’ and‘Box B: Households’ Mortgage Prepayment Buffers’ in
this issue of the Review.
Disclair
The Household, Income and Labour Dynamics
in Australia (HILDA) Survey was initiated and is
funded by the Australian Government Department
of Families, Housing, Community Services and
Indigenous Affairs (FaHCSIA), and is managed by
the Melbourne Institute of Applied Economic and
Social Research (Melbourne Institute). Findings and
views based on these data should not be attributed
to either FaHCSIA or the Melbourne Institute.

7/29/2019 Rba Financial Stability Report Sep 2012
http://slidepdf.com/reader/full/rba-financial-stability-report-sep-2012 66/66


![arXiv:1208.3112v2 [math.AP] 26 Sep 2012 · Rayleigh{B enard convection, ... [math.AP] 26 Sep 2012. ... stability inspection for stationary solutions of (3)](https://img.dokumen.tips/doc/110x75/5afe10ee7f8b9a944d8e50a1/arxiv12083112v2-mathap-26-sep-2012-b-enard-convection-mathap-26-sep.jpg)


![Cvd&Rba Design]](https://img.dokumen.tips/doc/110x75/557c4714d8b42a23598b534c/cvdrba-design.jpg)