Embed Size (px)
Citation preview

Reckitt Benckiser Group plc (RB)
RB Half Year 2019 Results Presentation30th July 2019
Security Level: Please select the appropriate data classification for this document as Public, RB Internal or Confidential

Cautionary note concerning forward-looking statements
This presentation contains statements with respect to the financial condition, results of operations and business of RB (the “Group”)
and certain of the plans and objectives of the Group that are forward-looking statements. Words such as ‘‘intends’, ‘targets’, or the
negative of these terms and other similar expressions of future performance or results, and their negatives, are intended to identify such forward-looking statements. In particular,
all statements that express forecasts, expectations and projections with respect to future matters, including targets for net revenue, operating margin and cost efficiency, are
forward-looking statements. Such statements are not historical facts, nor are they guarantees of future performance.
By their nature, forward-looking statements involve risk and uncertainty because they relate to events and depend on circumstances that
~will occur in the future. There are a number of factors that could cause actual results and developments to differ materially from those expressed or implied by these forward-
looking statements, including many factors outside the Group’s control. Among other risks and uncertainties, the material or principal factors which could cause actual results to
differ materially are: the general economic, business, political and social conditions in the key markets in which the Group operates; the ability of the Group to manage regulatory,
tax and legal matters, including changes thereto; the reliability of the Group’s technological infrastructure or that of third parties on which the
Group relies; interruptions in the Group’s supply chain and disruptions to its production facilities; the reputation of the Group’s global brands;
and the recruitment and retention of key management.
These forward-looking statements speak only as of the date of this announcement. Except as required by any applicable law or regulation, the Group expressly disclaims any
obligation or undertaking to release publicly any updates or revisions to any forward-looking statements contained herein to reflect any change in the Group’s expectations with
regard thereto or any change in events, conditions or circumstances on which any such statement is based.
Disclaimer

RakeshKapoorChief Executive Officer

Laxman NarasimhanChief Executive Officer designate

Key MessagesNew CEO
5
Improve Performance
DriveRB2.0
Listen to employeesand the market
2018-2020

RakeshKapoorChief Executive Officer

TRANSFORM RB
STEP CHANGE CONSUMER HEALTH WITH MJN
UNLEASH HYGIENE HOME
RB 2.0

AdrianHennahChief Financial Officer

Income statement (reported)H1 2019 results
9
£mHY
2019 2018*
Net Revenue 6,240 6,138
Adjusted operating profit** 1,475 1,453
Adjusting items (69) (162)
Operating profit 1,406 1,291
Net finance expense (144) (180)
Profit before taxation 1,262 1,111
Taxation (271) (232)
Tax Rate - Adjusted 23% 23%
Non-controlling Interest (12) (12)
Continuing net income 979 867
Discontinued net income (867) (7)
Total net income 112 860
Adjusted net income** 1,032 991
Diluted EPS 15.8p 121.2p
Adjusted diluted EPS 145.4p 139.6p
* Restated for the adoption of IFRS 16: Leases
** Adjusted to exclude the impact of adjusting items

Sources of earnings growthH1 2019 results
10
HY 19
Net revenue 1%
Adjusted operating margin impact -1%
Interest 2%
Taxation -
Total adjusted net income at Constant FX 2%
FX 2%
Total adjusted net income at Actual FX 4%

£mQ2 HY
2019 2018 2019 2018*
Revenue 3,083 3,027 6,240 6,138
LFL% - 4% 1% 3%
Gross Margin 3,757 3.710
Gross Margin % 60.2% 60.4%
BEI % 15.4% 15.3%
SG&A % 21.2% 21.4%
Adjusted Operating Profit** 1,475 1,453
Adjusted Operating Profit % 23.6% 23.7%
Group revenue and profit – like-for-like and proformaH1 2019 results
11* Restated for the adoption of IFRS 16: Leases
** Adjusted to exclude the impact of adjusting items

RB Health – net revenue by category – proformaH1 2019 results
12
2018 2019 Total NR HY 19
Q1 Q2 Q3 Q4 FY Q1 Q2 HY £’bn % total
Infant Nutrition 6% 9% -6% 5% 3% 5% - 2% 1.5 39%
OTC 5% 8% 6% 2% 5% -9% 1% -5% 0.9 23%
Other -2% - 2% 4% 1% - -3% -1% 1.4 38%
RB Health 3% 5% - 4% 3% - -1% -1% 3.8 100%

% Volume Price / Mix Total
Reported
H1 19 -5% 4% -1%
Q2 19 -5% 4% -1%
Q1 19 -4% 4% -
Pro forma
FY 18 1% 2% 3%
Q4 18 1% 3% 4%
Q3 18 -1% 1% -
Q2 18 2% 3% 5%
Q1 18 1% 2% 3%
RB Health Price / Mix and VolumesH1 2019 results
13

RB Health – net revenue by geography - proformaH1 2019 results
14
2018 2019 Total NR HY19
Q1 Q2 Q3 Q4 FY Q1 Q2 HY £’bn % total
North America 4% 3% 6% 5% 4% -11% 4% -4% 0.9 23%
Europe -4% 1% -4% -3% -3% -2% -2% -2% 1.0 26%
DVM 6% 8% -1% 7% 5% 5% -3% 1% 1.9 52%
Total 3% 5% - 4% 3% - -1% -1% 3.8 100%

RB Health HY margin analysisH1 2019 results
15* Adjusted to exclude the impact of adjusting items
Adjusted operating profit* bridge
Total Decrease Increase
-120bps

£m FY 17 FY 18 H1 19 Total Guidance
GBP* USD
Total 20 158 233 228 300
MJN cost synergy delivery H1 2019 results
16* Translated at weighted average rate ($/£ 1.31)

2018 2019Total
NR
Q1 Q2 Q3 Q4 FY Q1 Q2 HY £’bn
RB Hygiene Home
4% 4% 4% 4% 4% 2.4
RB Hygiene HomeH1 2019 results
17

% Volume Price / Mix Total
Reported
H1 19 -1% 4% 3%
Q2 19 -1% 4% 3%
Q1 19 -1% 4% 3%
Pro forma
FY 18 3% 1% 4%
Q4 18 1% 3% 4%
Q3 18 2% 2% 4%
Q2 18 5% -1% 4%
Q1 18 5% -1% 4%
RB Hygiene Home Price / Mix and VolumesH1 2019 results
18

RB Hygiene Home – net revenue by geographyH1 2019 results
19
2018 2019 Total NR HY 19
Q1 Q2 Q3 Q4 FY Q1 Q2 HY £’bn % total
North America 8% 6% 5% 6% 6% 2% 2% 2% 0.8 31%
Europe 2% - - -2% - - 3% 1% 1.0 44%
DVM 3% 10% 12% 11% 9% 9% 3% 6% 0.6 25%
Total 4% 4% 4% 4% 4% 3% 3% 3% 2.4 100%

RB Hygiene Home HY margin analysisH1 2019 results
20
Adjusted Operating profit* bridge
Total Decrease Increase
+190bps
* Adjusted to exclude the impact of adjusting items

Group HY margin analysisH1 2019 results
21
Adjusted Operating profit* bridge
* Adjusted to exclude the impact of adjusting items
** Restated for the adoption of IFRS 16: Leases
Total Decrease Increase
-10bps

£m HY 19 HY 18 FY 18
Inventory% to last 12 month revenue
1,33411%
1,26110%
1,27610%
Receivables% to last 12 month revenue
2,07416%
1,93615%
2,09717%
Payables% to last 12 month revenue
(4,856)-38%
(4,662)-37%
(4,811)-38%
Net working capital% to last 12 month revenue
(1,448)-11%
(1,465)-12%
(1,438)-11%
Net working capitalH1 2019 results
22

£m HY 2019 HY 2018*
Adjusted Operating Profit** 1,475 1,453
Share based payment 35 38
Depreciation and amortisation 174 158
Net capital expenditure (152) (166)
Movement in net working capital (42) 78
Movement in provisions and other creditors (21) (9)
Trading cashflow 1,469 1,552
Exceptional cashflow (106) (92)
Operating Cashflow 1,363 1,460
Net interest paid (129) (175)
Taxation paid (305) (331)
Free Cashflow 929 954
Free Cashflow as % of Adjusted Continuing Net Income 90% 96%
Closing net debt (10,545) (11,095)
Free cash flowH1 2019 results
23* Restated for the adoption of IFRS 16: Leases
** Adjusted to exclude the impact of adjusting items

Analysis of net debtH1 2019 results
24
Net Debt Jun 2019
Gross debt ($15.0bn) £12.3bn
Cash £1.8bn
Net debt £10.5bn
Gross debt components
Commercial paper - $1.1bn & €1.4bn $2.7bn
USD B & C Term Loans $1.1bn
USD Bonds $11.3bn
Gross Debt - maturity profile
364 days - CP 364 days - Bond
2 - 5 years TL & Bonds 5+ years Bonds

Rob de GrootPresident – Hygiene Home

26
Potential Purpose Performance

Strong delivery in H1 2019
27
Net revenue Margin
H1 2019 vs. H1 2018
+190bpsQ1
+3%Q2
+3%
H1 2019
+3%H1 2019
21.9%

Consistent, broad-base revenue growth
28
2018 2019 Total NR HY 19
Q1 Q2 Q3 Q4 FY Q1 Q2 HY £’bn % total
North America 8% 6% 5% 6% 6% 2% 2% 2% 0.8 31%
Europe 2% - - -2% - - 3% 1% 1.0 44%
DVM 3% 10% 12% 11% 9% 9% 3% 6% 0.6 25%
Total 4% 4% 4% 4% 4% 3% 3% 3% 2.4 100%

Growth across geographies and Power Brands
29
3 / 3 GeographiesGrowing revenues
5 / 7 Power BrandsGrowing revenues
DvM
North America
Europe 1%
2%
6%

Balanced price and volume-led growth over 2018 and 2019
FY18-HY19 calculated as LFL, applying 2018 FX rates to 2018 price/volume contributions 30
H1 ’18 H2 ‘18 H1 ‘19CumulativeH1 ’18-H1 ‘19
Volume 5% 1% -1% 1-2%
Price Mix -1% 3% 4% 1-2%
Growth 4% 4% 3% 3-4%

Strategic growth drivers on track in H1 2019
31
Acceleratinginnovation
Unlockemerging markets
e-Businessgrowth
+50%Growth from
pipeline vs. P2Y
>50%Contribution to total NR growth
+40%E-Business
Growth vs. PY
Delivery On Track

Delivering on our e-Business growth model
32
Dedicated organisationdriving growth in priority markets
Whitespace expansionwith Hyper Targeting Top-of-Pyramid Consumers
Example: Air Wick, in IndiaeBU Hubs in
Priority marketsRevenue growth vs. PYH1 across all eBU Hubs
˜25%
to
˜75%

H1 2019 Highlights RB Hygiene Home
Innovations H2, 2019

Innovation highlights H1 2019
34
Developing markets
Superior solutionson big brands
New consumer needs
CHINAFinish® All-in-One for Compact Dishwashers
BRAZILVeja® Power Fusion
INDIAMortein® 2-in-1 Insect Killer
Air Wick ®
Essential Mist AROMA
Vanish®
Improved Performance GELS
Harpic® / Lysol PlatinumPro-Shield
Finish®
Quantum Ultimate
Vanish®
0%
Finish®
0% range

Innovation for developing markets in H2 2019
35
India Asia Brazil Indonesia
Lizol® Surface Cleaner for Cement
Vanish® Oxi Action All in One
SBP® Odourlessinsect control range
Harpic® Bathroom Cleaner with 10x better cleaning

Innovation in superior solutions for big brands in H2 2019
36
Vanish®
Oxi Action Crystal WhiteAir Wick®
Seasonal DevicesLysol®
Free & Clear and Sport
Whites 10 shades whiter in 1 wash Laundry sanitizers for new needsAirwick decorated electrical devices

Create a cleaner world
Eliminate dirt, germs, pests & odour
that impact health & happiness
Accelerate hygiene foundations
across the world
Deliver sustainable
outperformance
37

Our differentiated purpose-led brands are a force for good
Powerful social cause Purpose led brand
Superior product solutions
38

Expanding purpose across brands & geographies
39
Ensure access to hygienically clean toilets
Protect communities from pest-borne disease
Keep your lovedones illness free
Ease the burdenof dishwashing
2019 and beyond2018

40
Potential Purpose Performance

Aditya SehgalChief Operating Officer – Health

Below expectations - DVM and ‘other health’Q2
42
Q1 Q2 H1
North America
Europe/ANZ
DvM
Total
IFCN
OTC
Other
Total
-11%
-2%
+5%
-
+4%
-2%
-3%
-1%
-4%
-2%
+1%
-1%
+5%
-9%
-
-
-
+1%
-3%
-1%
+2%
-5%
-1%
-1%
By geography
By category

2%
Share gain in USA behind Neuropro
China on expectation
Improving shares globally
Q1: +5% Q2: 0%
In line with expectationsIFCN
43
IFCN OTC Other Health

on trackIFCN China
44
Market as expectedImproving brand
momentumStrong pipeline
in H2
Birth rates
Premiumization
e-Commerce, MBS and SHP segment
Supply normal in H2
Enfinitas equity strong
Improving shares
e-Commerce & go deep capabilities
Channel focused launches in H2

Strong performance in power brands, weaknesses in local brandsOTC
45
IFCN OTC Other Health
-5%
Mucinex growing and improving share
PowerBrands performed well
Slow Quarter for local brands
Q1: -9% Q2: +1%
2%
Share gain in USA behind Neuropro
China on expectation
Improving shares globally
Q1: +5% Q2: 0%
-5%
Mucinex growing and improving share
PowerBrands performed well
Slow Quarter for local brands
Q1: -9% Q2: +1%
2%
Share gain in USA behind Neuropro
China on expectation
Improving shares globally
Q1: +5% Q2: 0%
RB Health
46
IFCN OTC Other Health
H1 -1%Q1 0% Q2 -1%
-1%
Dettol – pricing actions in India, Asia and Africa
Durex – Increasing competitive intensity in China
Scholl – strategic re-focus continues
VMS – Neuriva - good start
Q1: 0% Q2: -3%

47
Enfagrow Grass Fed

48
Enfagrow Pro Mental

49
Mucinex Nightshift

50
Dettol co-created with Moms range

51
Durex Fetherlite relaunch

52
Durex E-Commerce condoms

e-Commerce progress on track
2X Investments 2017-19
1,000 FTE in 2019
32D2C stores
53* retail sales value, based on H1 2019 annualized

Internal transformation to '21st century marketing'with over 40% of global media spend online
54
Consumer ObsessedMIND SET
Brand ExperienceSKILL SET
Globally ConnectedTOOL SET
100%of brand marketing upskilled in 21C
1,200Team members trained
AI CONSUMER INSIGHTStools for every category
Always-on
COMMS PLANNINGfor every brand
10+ agile, in-house
CONTENT STUDIOS
Centralized
1p, 2p, 3p data for insights and audience building
Connected
Tech Stack across all brands and channels

55
Disappointing Q2 resultsPerformance expected to
sequentially improve in H2Continuing investment & focus to return to outperformance
Strong performance in USA
IFCN as expected
DVM and ‘Other health’ weak
Strong innovationson IFCN and Mucinex
IFCN supply disruption in base
Dettol competitiveness in DVM addressed
Strong BEI investment in H2
Continued organization building and stabilisation
Digital and eCommerce focus
Investment in capabilitiesand resilience continues

AdrianHennahChief Financial Officer

Steps to structural independenceRB 2.0
57
Multiple work
streams
Legal entity restructuring
ERP systems
Shared service
Operating model
Financial reporting
Application separation and readiness
Product lifecycle management
2018 - 2020
Completion of infrastructure
1,000+ FTEs working across 7 workstreams at peak times

2019 Updated Targets
58
Net revenueat constant rates
Operating marginAdjusted to exclude the impact of adjusting items
+2-3% LFL Maintain

Reckitt Benckiser Group plc (RB)
Q&A

Appendices

Net revenue by geography (2018 proforma)H1 2019 results
61
2018 2019Total NR
HY 19
Q1 Q2 Q3 Q4 FY Q1 Q2 HY £’bn % total
North America 5% 4% 6% 5% 5% -5% 3% -1% 1.6 26%
Europe -1% - -2% -2% -1% -1% - - 2.0 33%
DVM 5% 9% 2% 8% 6% 6% -1% 2% 2.6 41%
Total 3% 5% 2% 4% 3% 1% - 1% 6.2 100%

% Volume Price / Mix Total
Reported
H1 19 -3% 4% 1%
Q2 19 -3% 3% -
Q1 19 -3% 4% 1%
Pro forma
FY 18 2% 1% 3%
Q4 18 1% 3% 4%
Q3 18 - 2% 2%
Q2 18 3% 2% 5%
Q1 18 3% - 3%
Group Price / Mix and VolumesH1 2019 results
62
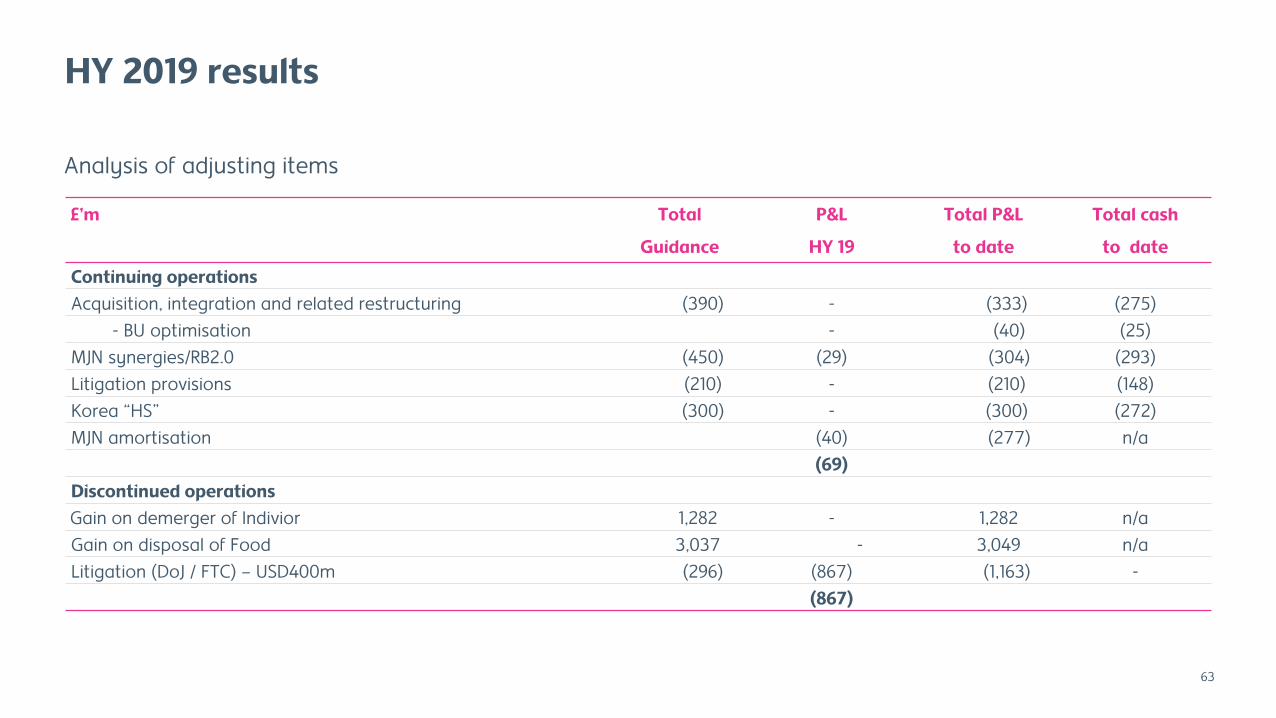
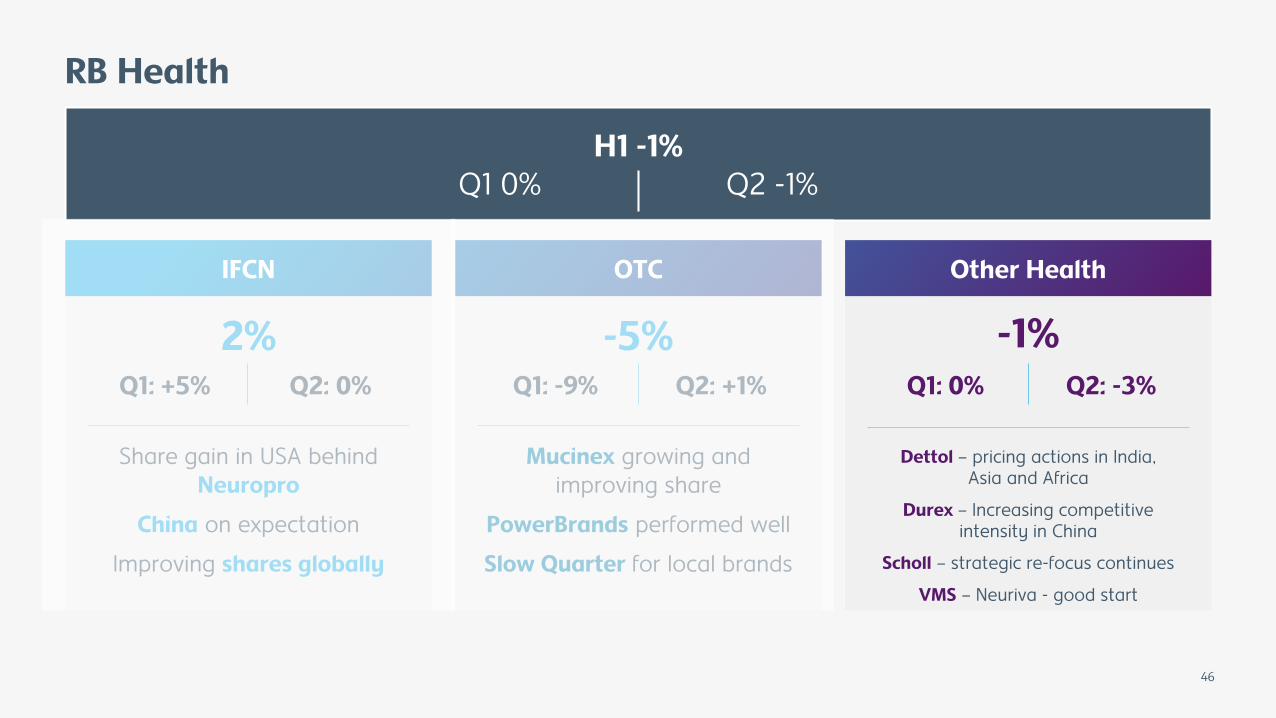
£’m Total P&L Total P&L Total cash
Guidance HY 19 to date to date
Continuing operations
Acquisition, integration and related restructuring (390) - (333) (275)
- BU optimisation - (40) (25)
MJN synergies/RB2.0 (450) (29) (304) (293)
Litigation provisions (210) - (210) (148)
Korea “HS” (300) - (300) (272)
MJN amortisation (40) (277) n/a
(69)
Discontinued operations
Gain on demerger of Indivior 1,282 - 1,282 n/a
Gain on disposal of Food 3,037 - 3,049 n/a
Litigation (DoJ / FTC) – USD400m (296) (867) (1,163) -
(867)
HY 2019 results
63
Analysis of adjusting items

HY 2019 results
64
Reported Adjusting items Adjusted
£’m 2019 Exceptional Other Finance expense 2019
Operating profit 1,406 29 40 - 1,475
Net finance expense (144) - - 25 (119)
Profit before taxation 1,262 29 40 25 1,356
Taxation (271) (7) (9) (25) (312)
Non-controlling Interest (12) - - - (12)
Continuing Net income 979 22 31 - 1,032
Discontinued Net income (867) 867 - - -
Total Net Income 112 889 31 - 1,032
Reconciliation of Reported to Adjusted

£’m 2019
Opening net debt* (10,746)
Free cashflow from continuing operations 929
Shares reissued 33
Purchase of investments and acquisition of businesses (24)
Dividends paid (724)
Exchange and other movements 23
Movement in lease liabilities (36)
Closing net debt (10,545)
HY 2019 results
65
Reconciliation in Net Debt
* Restated for the adoption of IFRS 16, recognising £340m of lease liabilities as at 1 January 2019.

RoundTotal
ApplicantsApplicants Assessed
Category I & IICat I & II
percentageOxy RB
Cat I & IIApplication
cut-off Assessment completion
(expected)
1 361 361 174 48% 140 Nov-12 Completed
2 169 169 53 31% 46 Oct-14 Completed
3 752 669 84 13% 76 Dec-15 Completed
3.1 165 42 25% 39
3.2 188 21 11% 20
3.3 99 3 3% 2
3.4 205 18 9% 15
3.5 12 - - -
4* 5,194 4,236 163 4% 146 Ongoing Ongoing
4.1 1,009 79 8% 73
4.2 339 7 2% 7
4.3 536 9 2% 8
4.4 912 20 2% 17
4.5 753 15 2% 14
4.6 505 27 5% 24
4.7** - - - -
4.8 38 - - -
4.9 144 6 4% 3
KCDC assessments
66* Round 4 remains open to applicants. The number of applicants shown in the table are the applicants set out on the KEITI website as at 19 July 2019.
** Round 4.7 Asthma related injuries only.
Note: On 26 July 2019, the South Korean government announced 10 additional lung injury victims, from an additional 360 cases assessed for Round 4.10 categorisation. These results have not yetbeen updated on the KEITI website and are therefore not updated in the table above.