Embed Size (px)
Citation preview

October 21, 2002 NYSED Third Annual InvitationalTechnology Conference
Slide 1 of 22
Raw Score to Scaled Score Conversions
Jon S. Twing, Ph.D.
Vice President, Psychometric Services
NCS Pearson - Iowa City

October 21, 2002 NYSED Third Annual InvitationalTechnology Conference
Slide 2 of 22
Raw Score to Scaled Score Conversions
Personal Background• Doctorate in Educational Measurement and Statistics, University of Iowa.• Responsible for psychometric and content development for NCS Pearson.• Based in Iowa City - Measurement Services Division.
Experience• WISC-III, Aprenda I, MAT-7, Stanford 9, WIAT, NNAT, CMEE, and others.
• Michigan (MEAP), Texas (TAAS, RPTE, SDAA), Minnesota (BST, MCA),Florida (FCAT).
• Advisory roles: Iowa DOE, Texas DOE, Virginia DOE, Federal Government.
October 21, 2002 NYSED Third Annual InvitationalTechnology Conference
Slide 3 of 22
Raw Score to Scaled Score Conversions
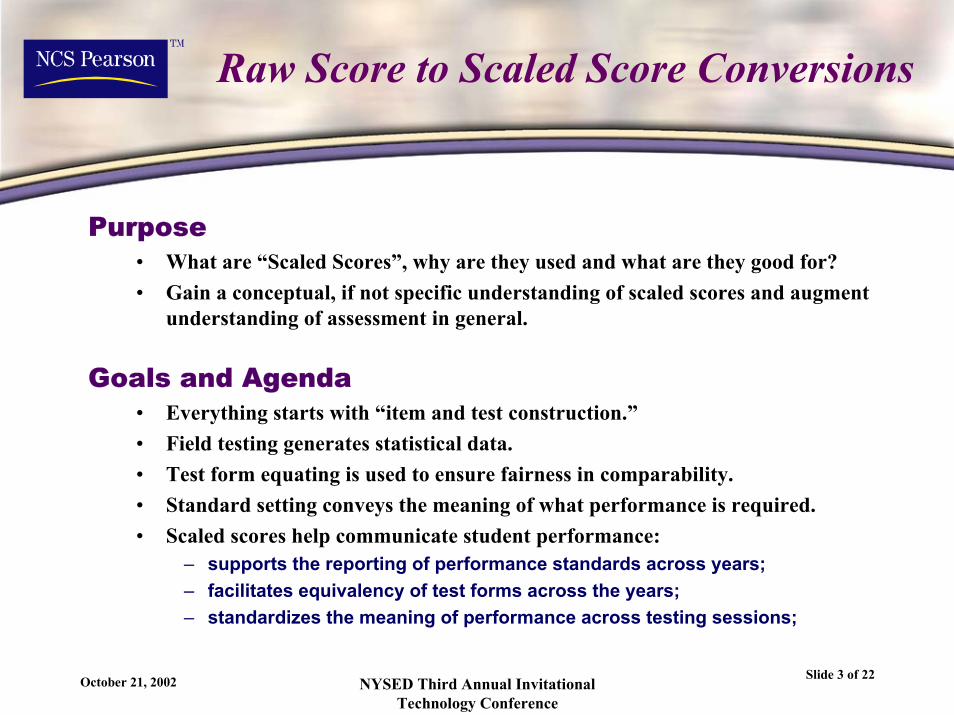
Purpose• What are “Scaled Scores”, why are they used and what are they good for?• Gain a conceptual, if not specific understanding of scaled scores and augment
understanding of assessment in general.
Goals and Agenda• Everything starts with “item and test construction.”• Field testing generates statistical data.• Test form equating is used to ensure fairness in comparability.• Standard setting conveys the meaning of what performance is required.• Scaled scores help communicate student performance:
– supports the reporting of performance standards across years;– facilitates equivalency of test forms across the years;– standardizes the meaning of performance across testing sessions;

October 21, 2002 NYSED Third Annual InvitationalTechnology Conference
Slide 4 of 22
Raw Score to Scaled Score Conversions
Item Generation• Test questions (items) are generated to match various requirements as
provided in the item development specifications:
– What will be measured…the curriculum (Standards and Benchmarks):• Scope and sequence• Reporting objectives• New York State Learning Standards
– How it will be measured…the specifications (Development Guidelines):• Format• Fairness
– Is it Art or is it Science?• Expert judgement (measurement specialists)• Empirical evidence from field testing (psychometricians)• Educator review (teachers)

October 21, 2002 NYSED Third Annual InvitationalTechnology Conference
Slide 5 of 22
Raw Score to Scaled Score Conversions
Field Testing• Newly developed test questions are field tested using real students to collect
statistical information for a variety of purposes.
– What are the psychometric / statistical properties of the items?• Difficulty, discrimination, response options.
– Equating to existing item pools and/or test forms.• How can we fairly compare the statistical properties of all items in the pool?• How can we build test forms of comparable difficulty from year to year?
– What evidence do we have that the items are fair?• Appropriate difficulty level.• Differential Item Functioning (DIF) analyses.• Educator review.
– Ultimately the goal is to add items to the item pool.
October 21, 2002 NYSED Third Annual InvitationalTechnology Conference
Slide 6 of 22
Raw Score to Scaled Score Conversions
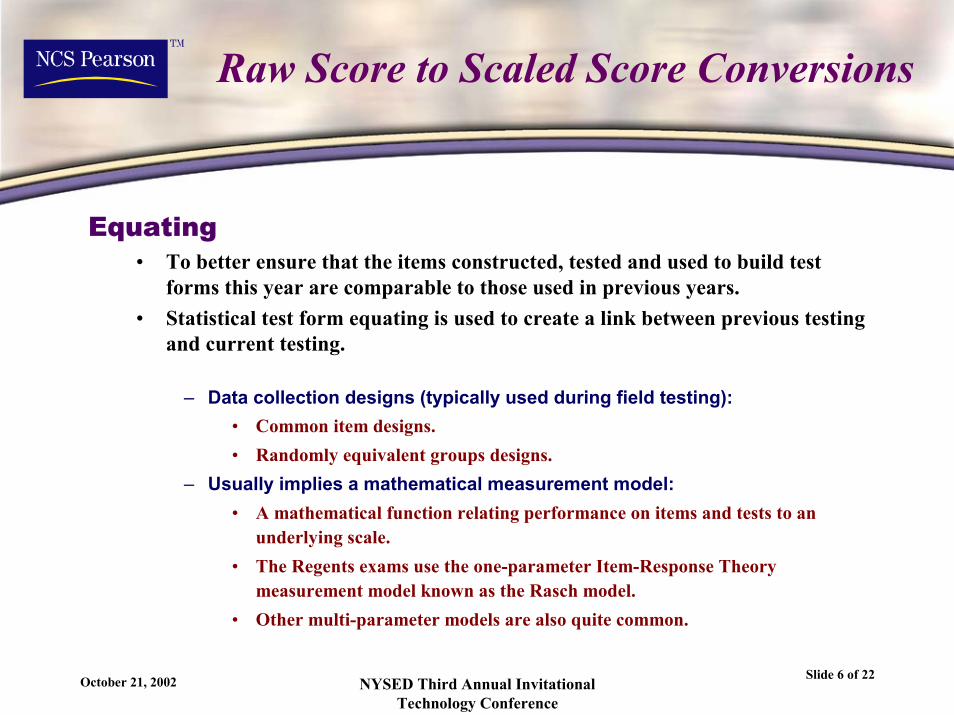
Equating• To better ensure that the items constructed, tested and used to build test
forms this year are comparable to those used in previous years.• Statistical test form equating is used to create a link between previous testing
and current testing.
– Data collection designs (typically used during field testing):• Common item designs.• Randomly equivalent groups designs.
– Usually implies a mathematical measurement model:• A mathematical function relating performance on items and tests to an
underlying scale.• The Regents exams use the one-parameter Item-Response Theory
measurement model known as the Rasch model.• Other multi-parameter models are also quite common.

October 21, 2002 NYSED Third Annual InvitationalTechnology Conference
Slide 7 of 22
Raw Score to Scaled Score Conversions
Calibration• Calibration is the process of relating student performance on test questions to
statements about student ability.– This is done by describing the interaction between test items and student
ability via a mathematical function or measurement model.• For the Regents examinations this is the Rasch measurement model.
– Parameters of the mathematical function are estimated (usually via acomputer) and used to obtain various derived scores (scaled scores) foritems and students.
– Derived scores facilitate test construction, equating, standard setting,fairness and longitudinal reporting.
−−+
= ) ( exp 1
1 )( ibiP θθ

October 21, 2002 NYSED Third Annual InvitationalTechnology Conference
Slide 8 of 22
Raw Score to Scaled Score Conversions
An Example• Suppose we wanted to build an Algebra test.
– Suppose you had test questions that were:
• aligned to the curriculum;
• reviewed for appropriateness and fairness.
– Suppose further that a field testing had taken place and that the results ofstudent performance on the field test were collected and placed into a database for your use.
– Finally, suppose we followed a statistical equating process such that allitems in the pool were comparable to each other as well to other existingitems already in the pool.
• How would you get started?

October 21, 2002 NYSED Third Annual InvitationalTechnology Conference
Slide 9 of 22
Raw Score to Scaled Score Conversions
An Example Continued• Typically in testing, a database of test questions is referred to as a test item
bank:

October 21, 2002 NYSED Third Annual InvitationalTechnology Conference
Slide 10 of 22
Raw Score to Scaled Score Conversions
An Example Continued• Suppose we select test items from the pool to build this Grade 9 Algebra Test
from the resultantfield test data:

October 21, 2002 NYSED Third Annual InvitationalTechnology Conference
Slide 11 of 22
Raw Score to Scaled Score Conversions
An Example Continued• How did we do it?
– Start with one objective at a time.– Use the last “live” assessment
for “target” statistical values.• Don’t forget, content is more
important than the statisticalparameters when selectingitems to place on a test.– “…content must rule the day.”
• This is what is often referred toas the combination of “art andscience” in test construction.– Obviously, this requires highly
skilled individuals and is apainstaking process.

October 21, 2002 NYSED Third Annual InvitationalTechnology Conference
Slide 12 of 22
Raw Score to Scaled Score Conversions
An Example Continued• The results of the field-
testing can be veryextensive dependingupon the requirements:– DIF– History– Multiple Forms– Reviewer Comments– Actual Item Image
• As such, each buildermust consider a lot ofstatistical and evaluativeinformation.

October 21, 2002 NYSED Third Annual InvitationalTechnology Conference
Slide 13 of 22
Raw Score to Scaled Score Conversions
An Example Continued• Because we are using the Rasch measurement
model, the item difficulty estimates (R.Diff) andthe person ability estimates (theta or θ) are on thesame scale (logistic scale).– This makes direct comparisons between
student skills and test items possible.– A student with a theta value = 1.00 has a
probability of 0.50 of answering a test itemwith a difficulty of 1.00 correctly.
• As the student ability increases and/or thetest item difficulty decreases, this probabilitywill go up.
• Similarly, as the student ability decreasesand/or the test item difficulty increases,this probability will go down.

October 21, 2002 NYSED Third Annual InvitationalTechnology Conference
Slide 14 of 22
Raw Score to Scaled Score Conversions
An Example Continued• In fact, this is the probability returned in the mathematical conversion
formula provided by the Rasch model as already discussed:
• The calibration process provides both the required theta values (θ) as well asthe item difficulty values (δ)– Because a statistical equating process was followed, these values are
comparable not only to each other, but to other items (and students) whohave been tested before.
– This means that the test we just constructed is comparable to those testspreviously used...that is, this test has been pre-equated.
−−+
= ) ( exp 1
1 )( ibiP θθ

October 21, 2002 NYSED Third Annual InvitationalTechnology Conference
Slide 15 of 22
Raw Score to Scaled Score Conversions
Something Exciting has Just Happened!• So what…what does all this mean to me? Think about and summarized what
has just transpired:– Items were constructed measuring the New York State Learning Standards.
• These items were reviewed for fairness and appropriateness.– These newly constructed items were included in a “small” field test.
• Many thousands of students…but not all...and each student was not requiredto take all items.
– This field test included link items or used some other methodology tostatistically equate the newly constructed items as well as the studentperformances on these items to previous tests that actually counted.
• A statistical equating process was followed allowing for comparability acrossthe years.
– We know what the passing standard was for these previously used tests.• Since the new items have been equated to these previously used tests we can
also know what the passing standard is on the new form we just constructed:» BUT REMEMBER…NO ONE HAS TAKEN THE TEST YET!!!

October 21, 2002 NYSED Third Annual InvitationalTechnology Conference
Slide 16 of 22
Raw Score to Scaled Score Conversions
Equivalent Test Forms via Pre-Equating• The test we constructed is equivalent in difficulty to the test forms previously
used.– The same passing standard established on the previous tests will be the
passing standard on the current test.• Suppose we know that the previous passing standard (the one established on
the previous test form) was 65 percent of the items.– This process usually comes about from a formal “Standard Setting”
• The Regents exams use “item mapping” standard setting methodology.– Assume that this 65 percent was 24 items out of 40 and that a Rasch ability
value of 1.50 was associated with this value of 24.• Even though we have constructed this new form to be equivalent, random
error may mean that the best we can do is to get within one raw score point.So, assume that our test is one raw score harder and that this is the best wecan do.– We would know this…and actually do know it…as a result of the equating.

October 21, 2002 NYSED Third Annual InvitationalTechnology Conference
Slide 17 of 22
Raw Score to Scaled Score Conversions
A Derived Score (Scaled Score) is Needed• This means that the equivalent passing standard on our test (which is one
score point harder than last year’s) is 23.– In other words, a 23 / 40 on our test (which is one point harder than last
year’s test) is equivalent to last year’s passing standard (on a test one itemeasier) which was 24 / 40.
• How many of you would like to try to explain this to your Board of Educationor a parent…that 24 / 40 is equivalent to 23 / 40?
– Yet, we know that 24 / 40 last year was equal to a Rasch theta value of 1.50.And, if you believe me when I say that we know the test we constructed isone item more difficult, then 23 / 40 on our test will have a theta value of1.50!
Last Year's Test Our TestTotal Score at 65%Passing Standard
Rasch ThetaValue
Rasch ThetaValue
Equivalent 65% TotalScore Passing Standard
24 / 40 1.50 1.50 23 / 40
October 21, 2002 NYSED Third Annual InvitationalTechnology Conference
Slide 18 of 22
Raw Score to Scaled Score Conversions
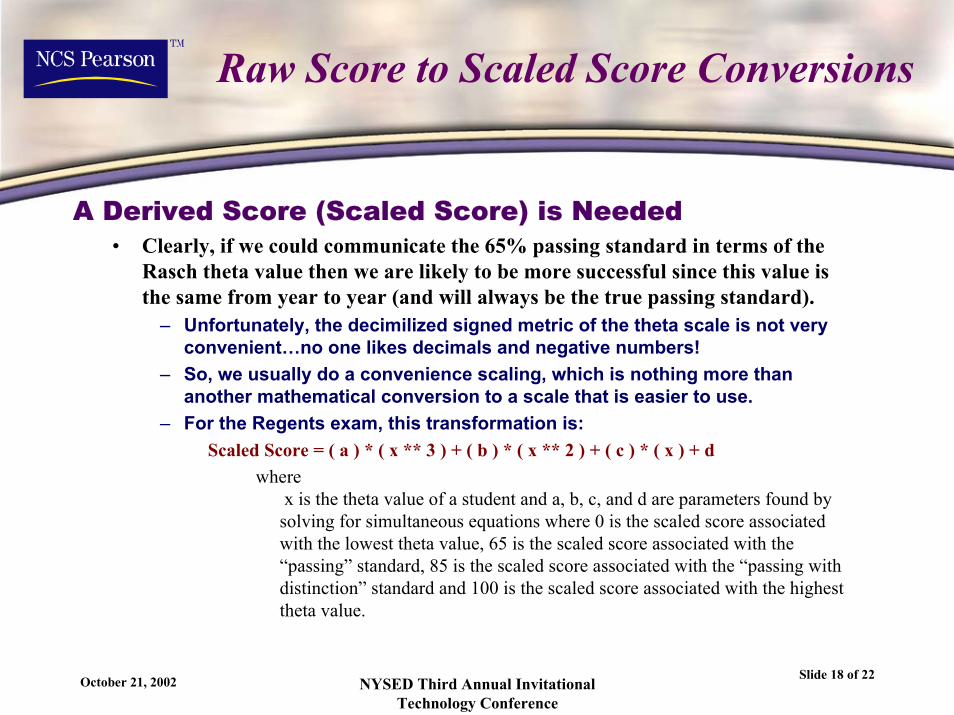
A Derived Score (Scaled Score) is Needed• Clearly, if we could communicate the 65% passing standard in terms of the
Rasch theta value then we are likely to be more successful since this value isthe same from year to year (and will always be the true passing standard).– Unfortunately, the decimilized signed metric of the theta scale is not very
convenient…no one likes decimals and negative numbers!– So, we usually do a convenience scaling, which is nothing more than
another mathematical conversion to a scale that is easier to use.– For the Regents exam, this transformation is:
Scaled Score = ( a ) * ( x ** 3 ) + ( b ) * ( x ** 2 ) + ( c ) * ( x ) + dwhere
x is the theta value of a student and a, b, c, and d are parameters found bysolving for simultaneous equations where 0 is the scaled score associatedwith the lowest theta value, 65 is the scaled score associated with the“passing” standard, 85 is the scaled score associated with the “passing withdistinction” standard and 100 is the scaled score associated with the highesttheta value.

October 21, 2002 NYSED Third Annual InvitationalTechnology Conference
Slide 19 of 22
Raw Score to Scaled Score Conversions
Fun with Scaled Scores• Do you remember the conversion
table we generated from our test...basedon the pre-equating?
• If we had used the Regents conversion wewould have known what the passing scoreswere and which raw score was associated witheach one (0, 65, 85 and 100).
• Furthermore, we could go back and add orremove items to construct a test to get the“correct” raw score associated with eachscaled score.– For example, we could go back and remove
a hard item and add an easy item to see ifwe could build a test where a scaled scoreof 65 was equal to 24 and not 23.

October 21, 2002 NYSED Third Annual InvitationalTechnology Conference
Slide 20 of 22
Raw Score to Scaled Score Conversions
Fun with Scaled Scores• What would happen without such scaled scores?• Consider the table below:
• If we mistakenly used 24 as the passing standard for both years we can seethat the passing standard would be a theta value of 1.50 one year and 1.56 thenext year– In other words…it would be harder to pass the second year without the
scale!
Last Year's Test Our TestTotal Score at 65%Passing Standard
Rasch ThetaValue
Rasch ThetaValue
Equivalent 65% TotalScore Passing Standard
.
.
.23 / 4024 / 4025 / 40
.
.
.
.
.
.1.451.501.55
.
.
.
.
.
.1.471.501.56
.
.
.
.
.
.22 / 4023 / 4024 / 40
.
.
.

October 21, 2002 NYSED Third Annual InvitationalTechnology Conference
Slide 21 of 22
Raw Score to Scaled Score Conversions
Fun with Scaled Scores• Measurement standards and best practice tell us some things:
– Validity of score use is completely tied to the meaning and interpretabilityof scores generated from a testing occasion.
– Builders of assessments are burdened with facilitating the validinterpretation and use of scores resulting from an assessment.
• Experience tells us some things:– Teachers, parents and the public alike think they know and understand
simple scores like total scores, percent correct and perhaps percentileranks…when they don’t.
– Teachers, parents and the public rarely claim they know and understandhow to interpret scaled scores…but they need to.
– Most large-scaled assessment systems use scaled scores and providetraining around the use and interpretation of such scores.
• Still, these scores are not embraced by the majority of the public.– We, as leaders in education, must be diligent in our explanations of derived
scores such as scaled scores.

October 21, 2002 NYSED Third Annual InvitationalTechnology Conference
Slide 22 of 22
Raw Score to Scaled Score Conversions
Conclusions:• Scaled scores result from one step of a multi-step test construction process.• When used with thoughtful item development, standard setting, field testing
and statistical test form equating, scaled scores:– Facilitate fair communication of student performance relative to
established passing standards;– Allow for easy to understand comparability of student performance from
year to year;– Provide for additional steps in the test development process to build forms
parallel in both content and statistical parameters.• Scaled scores suffer from the same misinterpretations as do raw scores but
have the perception of being more difficult to understand.– People misinterpret raw scores but fail to recognize it…most people
recognize, that they fail to understand scaled score interpretations.