Embed Size (px)
Citation preview
Raw Cocoa (Theobroma cacao L.) Quality Parameters -
with special Reference to West Africa.
Dissertation
submitted for the award of the Doctorate Degree
-Dr. rer. nat.-
at the Biology Department,
Faculty of Mathematics, Informatics and Natural Sciences,
University of Hamburg
Presented by
Isaac Yaw Berbiye,
From Ghana
Hamburg, 2014

2

3
"Nine out of ten people like chocolate. The tenth person always lies."
- John Q. Tullius
This work is dedicated to all the Berbiye, Boachie and Asemiah-Yeboah
Families

4

5
Table of Contents General Summary ............................................................................................................................... 8
Zusammenfassung.............................................................................................................................. 9
1. Introduction .................................................................................................................................. 10
2. Background information .............................................................................................................. 12
2.1 The cacao tree (Theobroma cacao L.) ........................................................................................ 12
2.1.1 History and origin .................................................................................................................... 12
2.1.2 Classification and types of cacao ............................................................................................ 13
2.2 Cacao cultivation: ecology .......................................................................................................... 14
2.3 Flowering, fertilization and pod development ........................................................................... 15
2.4 Harvesting .................................................................................................................................. 16
2.5 Cacao diseases and pests ........................................................................................................... 16
2.6 Processing and utilization of cacao ............................................................................................ 18
2.6.1 Fermentation ........................................................................................................................... 18
2.6.2 Drying, transport and storage ................................................................................................. 20
2.6.3 Roasting ................................................................................................................................... 21
2.7 Heterogeneity of raw cocoa ....................................................................................................... 22
3. Materials and methods ................................................................................................................ 25
3.1 Plant materials ........................................................................................................................... 25
3.1.1 Description of plant materials used in the biochemical analysis ............................................ 25
3.1.2 Description of plant materials used in the fermentation-like incubation of fresh cocoa bean seeds................................................................................................................................................. 25
3.2 Methods ..................................................................................................................................... 25
3.2.1 Defatting of raw cocoa bean samples ..................................................................................... 26
3.2.2 pH determination .................................................................................................................... 26
3.2.3 Antioxidative potential determination ................................................................................... 26
3.2.4 Phenolic compounds determination ....................................................................................... 27
3.2.4.1 Determination and extraction of polyphenols and anthocyanins using the RP-HPLC ......... 27
3.2.4.2 Determination of total phenolic substances using the Folin-Ciocalteus phenol reagent method .............................................................................................................................................. 29
3.2.5 Determination of the amount of acetic and lactic acids ......................................................... 30
3.2.6 Determination of the amount of methylxanthines (theobromine and caffeine) ................... 32
3.2.7 Determination of sugar contents ............................................................................................ 33
3.2.8 Determination of the free amino acids contents by means of HPLC ...................................... 34
3.2.9 Preparation of acetone-dried powder .................................................................................... 36

6
3.2.10 Measurement and detection of oligopeptide linkages ........................................................... 36
3.2.11 Fermentation index value ..................................................................................................... 37
3.2.12 Fermentation-like incubation of raw cocoa bean seeds ....................................................... 38
3.2.13 Characterization of individual protein by separation on the SDS-polyacrylamid-gel electrophoresis (SDS-PAGE) ............................................................................................................. 39
3.2.13.1 Preparation of the samples for gel electrophoresis ........................................................... 42
3.2.13.2 Staining of polyacrylamide gels with Coomassie Brilliant Blue R 250 ................................ 42
4. Results .......................................................................................................................................... 43
4.1 Quality assessment tests of raw cocoa seeds ............................................................................ 43
4.1.1 Sample structure of raw cocoa bean seeds ............................................................................ 43
4.1.2 Differences in the sample structure of raw cocoa bean samples ........................................... 44
4.2 Interpretation of quality parameters of different raw cocoa bean samples ............................. 45
4.2.1 Phenolic compounds ............................................................................................................... 45
4.2.1.1 Total phenolic compounds ................................................................................................... 45
4.2.1.2 Epicatechin content.............................................................................................................. 47
4.2.1.3 Catechin content .................................................................................................................. 49
4.2.2 Antioxidative capacity ............................................................................................................. 51
4.2.3 Methylxanthines ..................................................................................................................... 53
4.2.3.1 Theobromine content .......................................................................................................... 53
4.2.3.2 Caffeine content ................................................................................................................. 55
4.2.3.3 Ratio of theobromine to caffeine (T/C) value ...................................................................... 57
4.2.4 Moisture content.................................................................................................................... 59
4.2.5 Fermentation index value ....................................................................................................... 61
4.2.6 pH value .................................................................................................................................. 63
4.2.7 Acetic acid content .................................................................................................................. 65
4.2.8 Lactic acid content .................................................................................................................. 67
4.2.9 Free amino acid content ........................................................................................................ 69
4.2.9.1 Individual amounts of free amino acids ............................................................................... 71
4.2.9.2 Classification of free amino acids ......................................................................................... 72
4.2.9.3 Group 1: Hydrophobic amino acids-alanine, leucine, phenylalanine, tyrosin, valine and isoleucine. ......................................................................................................................................... 77
4.2.9.4 Group 2: Acidic free amino acids-asparagine, aspartic acid, glutamine, glutamic acid and histidine. ........................................................................................................................................... 80
4.2.9.5 Group 3: Other free amino acids-tryptophan, lysine, serine, glycine, arginine and threonine. .......................................................................................................................................................... 83
4.2.10 γ-Aminobutyric acid content (GABA value) ........................................................................... 86

7
4.2.11 Summary ............................................................................................................................... 88
4.3 Fermentation-like incubation of fresh cocoa bean seeds .......................................................... 89
4.3.1 Storage protein pattern and degradation ............................................................................... 89
4.3.1.1 Characterizing individual proteins by separation on the SDS-polyacrylamid-gel electrophoresis (SDS-PAGE) ............................................................................................................. 89
4.3.1.2 Polypeptide profile ............................................................................................................... 91
4.3.1.3 Cotyledon protein degradation ............................................................................................ 91
4.3.1.4 Polypeptide spectrum of cacao bean seeds incubated at different pH levels over a 7-day incubation process. ........................................................................................................................... 92
4.3.2 Changes in the free amino acids content .............................................................................. 102
4.3.3 Changes in the sugar content during incubation .................................................................. 109
4.3.3.1 Fructose content ................................................................................................................ 109
4.3.3.2 Glucose content ................................................................................................................. 110
4.3.3.3 Sucrose content ................................................................................................................. 111
4.3.4 Changes in the amount of phenolic compounds .................................................................. 113
4.3.4.1 Epicatechin content............................................................................................................ 113
4.3.4.2 Catechin content ................................................................................................................ 114
4.4 Agroforestry ............................................................................................................................. 116
4.4.1 Impact of agricultural production systems on quality formation in raw cocoa .................... 116
4.4.1.1 Short introduction to agroforestry ..................................................................................... 116
4.4.1.2 Diversity of planting systems in agroforestry .................................................................... 117
4.4.2 Agroforestry: the functional basis for managed ecosystems ............................................... 118
4.4.3 The focus of modern production research in agroforestry: closing cycles. ......................... 118
4.4.4 Ecophysiology of the cocoa tree and its variability ............................................................... 121
4.4.5 Phosphate acquisition in plant-microbe interactions ........................................................... 123
4.4.6 Production factors and quality parameters for cocoa .......................................................... 124
4.4.7 How to produce fine and flavour cocoa in Ghana ................................................................ 125
5. Discussion ................................................................................................................................... 127
5.1 Quality aspects of raw cocoa ................................................................................................... 127
5.2 The role of the incubation process as a potential for quality formation ................................. 129
5.3 Ecophysiological parameters for fine flavour cocoa under conditions in Ghana .................... 130
6. References .................................................................................................................................. 132
7. Abbreviations ............................................................................................................................. 141

8
General Summary
Raw cocoa quality is the result of production methods, harvest procedure and post-
harvest treatment including fermentation, drying and storage. The quality of the product
is defined by physical factors such as the cut test and seed evaluation. The central
objective of this study was to establish a quality description of traded raw cocoa with
the focus on the variability of quality parameters of the traded good. For this
comparative analysis samples of cocoa from two production years (2007 and 2008)
from Ghana and Ivory Coast were purchased and compared to a set of samples from
Trinidad and Tobago.
The samples were studied with respect to the methodology of the Cocoa Atlas Project
and the parameters analysed were compared with incubation experiments. Finally an
analysis of new agricultural production methods using typical agroforestry methods was
presented.
The chemical parameters revealed a country-specific grouping of parameters in which
the West African samples differed from the Caribbean samples.
The incubation experiments clearly showed that the proteolysis of storage proteins is
very fast and needs less than 48 hours, whereas the fermentation process needs more
than double of that time. So it must be concluded that the time needed for a complete
fermentation process is as a result of the combination of a microbiological activity
phase that is required for the production of acid conditions in the fermentation mass and
then a subsequent proteolysis phase.
A literature-based agroforestry survey delivered important data about the application of
the combination of cocoa trees with service trees with the focus on water distribution,
phosphate solubilisation, shade and microbe management. Using these concepts will
allow us to obtain a modern management of resilient cocoa agroforestry in Ghana.

9
Zusammenfassung Die Qualität des Nutzpflanzenproduktes Rohkakao ist für die Einordnung des Wertes
dieses Handelsproduktes für die Produzenten und für die Konsumenten von
ausschlaggebender Bedeutung. Als zentraler Ansatz dieser Studie gilt es,
objektivierbare physikalische und chemische Faktoren des Rohkakaos zu erfassen und
an einer Vielzahl von Samplen jeweils einer Provenienz die interne Variabilität des
Rohkakaos zu erfassen.
An einer Sammlung von Samplen der Herkünfte „Ghana“, „Elfenbeinküste“ und
„Trinidad und Tobago“ über die Jahre 2007 und 2008 wurden Analysen der
Qualitäsfaktoren vorgenommen und in Bezug gestellt. Es ließen sich länderspezifische
Eigenschaften zuordnen, wobei ein auffälliger Unterschied zwischen den Provenienzen
hervortrat zwischen westafrikanischen und karibischen Rohkakaos.
Bei der im Labor vorgenommenen Inkubation der frischen Kakaosamen wurde deutlich,
dass die säureinduzierte Proteolyse der Resereveproteine der Samen innerhalb von etwa
48 Stunden abgeschlossen war, wie aus der Elektrophorese der Proteinmuster
hervorging, wohingegen bei der Fermentation etwa die doppelte Zeit oder sogar mehr
erforderlich war. Dies unterstreicht die Bedeutung der mikrobiellen Säureproduktion
während der ersten Phase der Fermentation. Erst im sauren Medium tritt dann die
Proteolyse auf.
Als abschließende Thematik wurden die Komponenten zur Kakaokultur
zusammengetragen, die für die Konzeption einer Mischkulturanzucht des Kakaos
erforderlich sind und die zu einer Stabilisierung der Produktqualität im Anbau beitragen
können. Daraus werden Empfehlungen für die Qualitätssicherung abgeleitet.
10
1. Introduction Approximately 70% of the world-wide annual production of raw cocoa is delivered
from West Africa. Since the introduction of cocoa trees to the former “Gold Coast” a
selection of plant material was brought together which guaranteed high yield and stable
production under the environmental conditions of Ivory Coast, Ghana and the other
West African cocoa producing countries. The second important feature was the
resistance of the selected plant material to local and regional pests and diseases. The
third important factor was the development of a stable and reproducible postharvest
technology which guaranteed the production of the well-known standard quality of bulk
cocoa for the chocolate industry.
Over the past 40 years the worldwide bulk cocoa market had undergone remarkable
changes, induced by new production areas in South America and South East Asia. And
this has increased the consumption of cocoa worldwide. This strong growth of cocoa
production and consumption was directly coupled with new methods in postharvest
processing and with the growing influence of fine and flavour cocoa on the international
market. With the introduction of the specially important fine flavour genotypes of the
Criollo group of Central America, the Nacional Cocoa from Ecuador and the Trinitario
hybrids, a group of crossings involving Criollo mother plants and Forastero pollen
donors was realized. The value of the market coupled with the quality of fine and
flavour cocoa clearly demonstrated that there is a considerable influence of the genetic
material on the product “raw cocoa”. Until now modern research in cocoa quality was
focused on the genetic material, the interaction of plant genotypes and environmental
factors and also on the importance of the biochemical and biophysical reaction during
the postharvest treatments such as the fermentation process, drying and storage.
The raw cocoa on the market must deliver a reproducible quality because the chocolate
industry needs raw material of homogenous properties. So far the quality tests that have
been worked out for the description of raw cocoa is widely based on the physical and
chemical parameters, like those outlined in the Cocoa-Atlas (Rohsius et al., 2010); but
there is still a gap between the chemical factors identified and the organoleptic tests of
raw cocoa.
The aim of this study therefore starts with an analysis of the extent of the variability
between raw cocoa purchased from West African origins which have been produced
from two different production periods. And the results obtained from such analysis

11
allow us to outline the fact that there is still no exact reproducibility of chemical
constituents from the raw cocoa product. The second part of the study involves the
comparison of fermented raw cocoa with cocoa which was treated in an acid dominated
incubation media, in order to obtain information about the time needed for the
breakdown of the storage proteins and the third chapter of this study deals with the
theoretical analysis of new biological approaches to stabilize the ecophysiological
conditions for good agricultural practices within the context of agroforestry.

12
2. Background information
2.1 The cacao tree (Theobroma cacao L.)
2.1.1 History and origin
Cacao bean traces its origins to the South American cultures, especially, the Olmecs,
Mayans and Aztecs. The earliest discovery of the cacao fruit is credited to the Olmecs
(1500-400 BC). The generic name Theobroma which means “drink” (broma) of the
“god” (theo) emphasizes the fact that the crop is held in high esteem by the native
producers. Local beverages were made from cacao beans and its cultivation received
much attention especially in equatorial Mexico. Later, the Mayans (600 BC) and Aztecs
(400 AD) also started cultivating cacao using much improved methods and practices;
long before the arrival of Columbus. During this period cacao beans were crushed,
mixed with water and various spices resulting in a frothy drink called “chocolatl”.
Cacao beans were also used as currency and a measuring unit and thereby receiving
much added attention in many social and religious events.
Cacao is believed to have found its way into Europe after the defeat of Mexico and the
fall of the Aztec Empire. This was when Hernando Cortez, a Spanish brought cacao to
Spain as a beverage and later helped to spread and intensify its cultivation across the
region. In the subsequent years, trade in cacao had begun to spread across Europe, with
cacao beans arriving at the ports of the major cities involved in the trade. As the
production of cacao developed across Europe, it began slowly to spread across and to
the rest of the world. During this period the crop had been introduced into areas such as
the Caribbean Islands, Trinidad, Jamaica, the Philippines, Haiti, Brazil, Sri Lanka and
Venezuela.
During the colonization of Africa, the Europeans also brought cacao with them. The
plant was first established at Fernando Po (now Bibiko), near the coast of Cameroun by
the Spanish in 1822. Later a man called Tetteh Quarshie took some seedlings from
Fernando Po and introduced them into Ghana (then Gold Coast) in 1879. This then laid
the foundation for cacao production in the West African sub-region (Torres and
Momsen, 2011).

13
2.1.2 Classification and types of cacao
The cacao tree is a tropical perennial woody tree species botanically called Theobroma
cacao L. This was the name given to it by Linnaeus during the earliest documentations
of his Species Plantarum published in 1753. In 1964 Cuatrecasas divided the genus
Theobroma into six main groups, comprising of twenty-two species. He then assigned
Theobroma cacao, which is the only species cultivated world-wide to the Sterculiaceae
family. It was later reclassified into the Malvaceae family (Alverson et al., 1999).
There exist three distinct groups within the species cacao. These are the two traditional
races - Criollo and Forastero, in addition to the third derived group - Trinitario. These
varieties have arisen as a result of the differences in morphology, genetic characteristics
and as well as their geographical origins. Criollo cacao (dulce or sweet cacao) is native
to South and Central America. This variety has been cultivated since the prehistoric
period and therefore constitutes the earliest domesticated cacao trees (Sounigo et al.,
2003). Criollo cacao has white, through ivory to pale-yellow or purple cotyledon
colouration. Criollo cacao is also normally soft, crinkly and bears about 20-30 seeds per
pod. This characteristic is comparatively classified as a low-yielding cacao in relation to
the other two varieties of cacao available. Criollo cacao trees are normally seen as
slender with green–coloured pods or usually covered by anthocyanin pigments. The pod
husks are also normally red and the pods are easier to break open with a conspicuously
missing woody layer as found in the other varieties. Criollo cacao has also very low tree
vigour and hence flourishes very slowly. They are also very susceptible to pests and
diseases as a result of their lower level of adaptability. Criollo cacao also occurs in two
forms: Ancient and Modern Criollo cacao.
Forastero cacao (cacao amargo or bitter cacao) are the variety also known as the ‘bulk
or basic’ cacao. These varieties of cacao are of very significant importance because they
account for about 90% of the total world cacao production. This variety of cacao is very
diverse in populations with respect to different geographical origins. Forastero cacao is
usually hard, robust and smooth in terms of pod texture. They are higher reproductive
than the Criollo cacao variety, producing an average of more than 30 seeds in each pod.
This cacao is characterised by pale to deep purple cotyledons, and with green pods
possessing shallow ridges. They produce leaves that are much larger in size than the
Criollo varieties. The pericarp is also thickened by a strong lignified mesocarp and
hence makes them rather more difficult to be opened. Forastero cacao is noted for their
14
superior growth vigour, higher bean yield and more importantly their ability to tolerate
diseases, especially the West African virus strains. This group is also sub-divided into
the Lower and Upper Amazonian Forasteros (Iwaro et al., 2001). There are also
varieties from the Orinocco and Guyanas. It is also worth-noting that the earliest forms
of the Forastero cacao varieties originated from the lower Amazon Basin and were
cultivated in Brazil and Venezuela (Sounigo et al., 2003). For instance the Amelonado
cacao is also a form of Forastero cacao and also a product from the Lower Amazon
Basin region. This type of cacao variety is also very peculiar in the West African sub-
region and almost all other cacao-producing nations of the world.
The Trinitario variety of cacao is a product of the hybridization between Criollo and the
lower Amazonian Forastero genotypes. Trinitario cacao trees are composed of a
heterogeneous collection of trees with its origin in Trinidad. They therefore possess all
the intermediate features of both the Criollo and the Forastero cacao varieties. The pods
are mostly hard, may possess variable colourations and may also produce a relatively
higher number of beans per pod than the other two varieties. The cotyledons also show a
range of variability, with rare white beans. Bean colour may therefore vary from light to
very dark purple. Trinitario cacao trees are very highly productive and tend to bear
cacao pods all the year round, with the peak periods varying between producing
countries. Even though the trees exhibit variable reaction to pests and diseases, they
seem to be resistant to the disease features of the Forastero.
2.2 Cacao cultivation: ecology Cacao is currently cultivated in most of the tropical lowlands throughout the world.
Their cultivation requires climates that lie between the Tropics of Cancer and Capricorn
respectively. Cacao plantations are mostly suitable within 20° north and south of the
Equator. But the main belt is within 10° north and south of the Equator, and at best for
sea level up to a maximum of about 500 m. Altitude between 200 m and 300 m is also
suitable for cacao cultivation. Cacao requires constant supply of rainfall that is evenly
distributed throughout the year; preferably between 1500 mm to 2000 mm. Cacao
cultivation also requires temperatures between 18°C and 32°C. Lower temperatures can
also be tolerated for cacao production but not for long consecutive periods since this
could impart very negative diverse effects on the total output. In most of the tropical
regions where cacao is grown, it is mostly done on landscapes with low elevations,

15
usually below 300 m. Cacao trees also require locations with higher humidity
throughout the year, this is especially crucial in tropical areas where there exists a dry
season period with very low humidity. The soil conditions prevailing on cacao
plantations also require that they are porous, well-drained and more importantly rich in
humus and other vital minerals needed for its growth. In effect, the soil should be fertile.
Soil conditions exhibiting a pH between neutral and slightly acidic are also preferred,
whilst carefully controlling the prevalence of pests and diseases (Fowler, 1999). Cacao
trees may grow to a height of about 3 m or even more depending on the variety.
2.3 Flowering, fertilization and pod development
Cacao is normally propagated from seeds, or may also be vegetatively reproduced from
bud cuttings. The onset of the cacao bean development is characterized by the
emergence of buds through the barks of the cacao trees. The buds mature, sepals split
and continue to open during the night. Flowers are then observed to be fully opened
early the following day and the anthers release their pollens. Cacao trees produce many
flowers yearly but only a minute percentage (1-5%) of these flowers has the chance to
be successfully pollinated to develop into pods. Cacao flowers are therefore formed on
the trunks and branches of the tree, a condition referred to as cauliflorous or truncate.
Flowers normally consist of five yellowish petals, five pink sepals, ten stamens and an
ovary of five carpels. The flowers, about 15 mm in diameter are carried on long
pedicels. Pollination of the cacao embryo is usually executed by smaller insects
including midges, ants and aphids. After a successful pollination and fertilization, the
ovules continue to mature and become the embryo, from which the seedlings develop.
The pods and ovules attain their maximum size after about 75 days of maturation
following pollination. Their growth is then slowed down to enhance the maturation of
the embryo. Pods mature for another 65 days, making a total of 140 days after
pollination and fertilization. By this period, the ovule, filled with the jelly-like
endosperm has been completely consumed by the embryo. The pods are then left to
mature for 10 more days before harvesting is done. The development of the pods
therefore takes place between 5 to 6 months after pollination to attain the fully desired
ripeness. Ripening of the cacao fruit is usually characterised by the change of colour;
normally from the green or purple unripe stage to various shades of red, orange or
yellow, signifying ripeness. This, however also depends on the genotype of the cacao

16
seeds. For instance, Forastero cacao may change from green to yellow when fully ripe,
whilst Criollo cacao changes from dark red to red.
A fully matured pod is therefore considered as the fruit of the cacao tree, which is ovoid
or ellipsoidal in shape and arises from the flower cushions directly located on the trunk
or branches. Pods may be 15-30 cm long, 8-10 cm wide and surrounded by a 10-20 cm
thick husk, depending on the variety. Each pod may contain about 30-40 seeds. These
seeds or beans consist of two convoluted cotyledons, a small germ, together enclosed in
the testa. The seeds of cacao are also attached to the placenta and each bean is enclosed
in a sweet mucilaginous pulp. The pulp contains about 80-90% water 6-13% sugar, 0.5-
1% citric acid and the rest is made up of minute amounts of aspartic acid, asparagine
and glutamic acid. The cacao bean is basically made up of a testa (shell) and the
cotyledon (kernel). Cotyledons are varied in colour; cotyledons of Criollo cacao are
usually white, Forastero are dark purple whilst Trinitario possess colour shades from
white to deep purple cotyledons. The cotyledons also contain about 30% water, 30% fat
and the rest is made up of phenolic compounds, starch, sugar, theobromine, non-volatile
acids and a host of other compounds in trace concentrations.
2.4 Harvesting Harvesting periods of cacao fruits is very crucial to the cacao farmers since mature pods
are easily attacked by diseases. And if the harvesting time is also prolonged, cacao
beans may also germinate inside the pod which then renders the whole pod unhealthy.
Harvesting normally involves the removal of the pods from the trees, followed by the
extraction of the beans and pulp from the inside of the pod. Where cacao pods can be
easily reached, a knife or cutlass is used to remove the pod from the trees. A specially
made long-edged knife is used in instances where pods are much higher up on the trees.
Harvested pods are sorted out and only the healthy pods are heaped together. Splitting
of the pods follows next, and these are done with cutlasses, machetes or pods may also
be even clubbed open. Care must be exercised during this stage since the cacao bean
seeds could be damaged and render them unhealthy.
2.5 Cacao diseases and pests The prevalence of pests, weeds and diseases on cultivated cacao farms contribute a
major and significant percentage to the loss of the overall yield and quality of the final

17
beans produced. Disease that affect cacao include swollen shoot, black pod and the
witches broom diseases. The swollen shoot disease is restricted to the West African
cacao-producing countries. This disease is caused by a virus and spread by small
whitish insects called mealy bugs. Symptoms of this disease include whitening of the
veins of the leaves which eventually lead to the swelling of the limbs, branches and
roots of the affected plants. The pods also show signs of roundish shape and then reduce
drastically in size. The overall effect of these symptoms is that it leads to severe crop
losses and finally the death of the infected plants. Affected trees are completely cut
down and burnt.
The black pod disease poses a major problem and also concern to the global cacao
world. It is caused by various Phytophthora species; notably among them are
Phytophthora palmivora and Phytophthora megakarya. Cacao trees attacked by these
fungi show patches of browning, blackening and then followed by rotting of the cacao
pods and beans. It also attacks almost every portion of the tree. Infected plants must
therefore be removed and spraying with the appropriate fungicides may help to some
extent. Improved ventilation and pruning are also highly recommended. The witches
broom disease is caused by the fungus Marasmius perniciosus and is peculiar to the
central and southern Americas. There have been reports of considerable damages caused
to cacao plantations in Trinidad & Tobago and Brazil. The disease is characterised by
the vegetative growth on the bark of cacao trees, and thereby hindering pod formation.
Pods that are later formed become diseased and rendered useless due to the
malformation. Spraying of the infected plantations with the recommended fungicides is
a control measure.
Insect pests such as mealy bugs, moths, thrips and capsids also cause damage to cacao
tress to a larger extent. These pests, with the aid of their sharp mouthparts, pierce into
the soft delicate young tissues of the shoots, introduce virus particles into them and
eventually cause infections. They also feed on the internal fluid food of the shoot and
eventually cause their death. Young flourishing leaves of cacao plants could also be
drastically chewed and destroyed by these insects. Control of these insect pests can be
achieved by the use of appropriate insecticides whilst also ensuring proper shade
management for the young developing plants (Afoakwa, 2010).

18
2.6 Processing and utilization of cacao
2.6.1 Fermentation
After harvesting the cacao pods, the beans together with the adhering pulp are subjected
a post - harvest fermentation process. Fermentation therefore ensures that the pulp is
removed and also more importantly leads to the formation of the appropriate precursors
of cacao flavour formation. The fermentation requirements depend on a number of
factors including the genotype of the cacao beans, prevailing climatic conditions and the
method of fermentation adopted. These factors may vary across geographical regions
and also within the same geographical community. The duration of the fermentation
process also depends on the variety of the cacao. Typical forastero and trinitario cacaos
may last between 5 and 6 days whilst criollo and nacional last shorter, usually within 3
days. Fermentation can be executed in heaps, sweat boxes or baskets. Heap
fermentations are mostly carried out in West Africa on small farms whilst box
fermentations are common in South America, Trinidad & Tobago and also in Indonesia
where large-scale plantations are managed. In most of these fermentations, banana
leaves are normally used to cover the cacao beans in order to generate heat required for
the process. Fermentation is a very important step in the processing of cacao because it
leads to the development of flavour and aroma precursors. It also among other
functions, reduces the otherwise bitter taste of the seed, kills the germ of the seed,
removes the mucilaginous pulp and then loosens the testa. Therefore, on the onset of the
fermentation process, the mucilaginous pulp surrounding the cacao bean liquidifies and
drains off, with a steady rise in temperature. The fermentation process then begins with
the microbial conversion of the pulp (Biehl and Adomako, 1983).
Fermentation of cacao beans generally involves a two – step biochemical reaction. The
first phase involves an anaerobic hydrolytic reaction which results in the fermentation of
fermentable sugars in the pulp surrounding the cacao beans. Fermentation of the pulp
sugars is caused by the microbial succession of yeasts, lactic acid bacteria and
acetobacter. The microbial activity on the cacao pulp involves an exothermic reaction
(temperature increase) that leads to the generation of heat. The net result of this is the
production of alcohol in the form of ethanol coupled with the formation of acetic and
lactic acids. These compounds, in association with heat, facilitate the death of the
embryo. This then makes it possible for the release of enzymes and substrates that are
required for subsequent fermentation reactions. The yeasts metabolise citric acid with

19
the end product being ethanol and the large proportion of the fermentable sugars in the
mucilaginous pulp is converted to ethanol and carbon dioxide. The continuous
consumption of the citric acid for the yeast metabolism leads to a rise in the pH of the
pulp material and also the fermentation mass. Within this period (usually 24-36 hours)
of the fermentation process, yeasts are found to be predominant in the fermentation
mass. Enzymes released by the yeasts then attack the pectin constituents of the cell
walls of the pulp mass (Afoakwa, 2010). This enzymatic degradation of the pulp is
characterised by the liquidification of the pulp and this finally drains off as ‘sweatings’.
The conditions present in the prevailing environment also make it conducive for the
conversion of the remaining fermentable sugars into lactic acid by lactic acid bacteria.
The continuous breakdown of the pulp results in the formation of voids between the
cells in the pulp. Atmospheric oxygen then diffuses through these voids and into the
fermentation mass. This change from anaerobic to aerobic conditions in the
fermentation mass signals the end of the first, anaerobic stage of the fermentation
process.
The second phase of the fermentation involves an oxidative condensation process which
occurs under aerobic conditions. Aeration is provided by the action of the draining pulp
and this enhances the growth of acetobacter (aerobic bacteria). The fermentation mass is
initially dominated by the presence of lactic acid bacteria. Most notable lactic acid
bacteria which play vital roles during fermentation have been isolated from cacao
fermenting masses (Schwan and Wheals, 2004). The microbial activity of these lactic
acid bacteria causes the acetobacter to transform alcohol, through oxidation into acetic
acid. These acetic acid – forming bacteria then replace the lactic acid bacteria in the
fermenting mass. At this stage, conditions in the fermenting mass mainly involve
exothermic reactions, leading to an increase in temperature of up to about 50°C. Acetic
acid is further oxidised to carbon dioxide and water. The predominant acetic acid
produced then penetrates into the internal tissues of the cacao bean. Due to this acid
influx and coupled with high temperature, the internal cellular structure of the cacao
bean is destroyed. This eventually leads to the death of the cacao seeds. The
consequence of this disruption is the release of compounds in the cacao beans which
mix and ultimately trigger a series of reactions between themselves. Subcellular changes
in the seeds release key enzymes that initiate reactions between substrates in
unfermented cacao bean seeds (Hansen et al., 1998). Reactions between storage
proteins, enzymes (proteolytic proteases, polyphenol oxidase, invertase) and

20
polyphenols result in the formation of the crucial chocolate flavour precursors. Proteins
are degraded by respective enzymes to polypeptides and amino acids, which form the
basis of chocolate flavour precursors. Proteolytic reactions are catalysed by proteases
(peptidases). Cacao seeds contain two types of proteases; the aspartic endopeptidase and
the serine carboxy-(exo) peptidase. The aspartic endopeptidase has an optimum pH of
about 3.8 and it is characterised by the production of more hydrophobic oligopeptides
and less free amino acids. Through the action of hydrolytic processes, oligopeptides
with hydrophobic ends are formed (Biehl and Voigt, 1995). The serine carboxy-(exo)
peptidase then cleaves onto the amino acids of the hydrophobic oligopeptidases. The
serine-carboxy-(exo) peptidase has a functional pH optimum close to about 5.8 and it
produces increased amounts of hydrophilic oligopeptides and hydrophobic amino acids.
The net effect of the action of these two proteases is the removal of the carboxyl
terminal of the hydrophobic amino acid residues from the hydrophobic oligopeptides.
Proteins are therefore degraded into peptides and free amino acids; a very crucial
consideration that is necessary for the formation of the precursors of chocolate aroma
and flavour formation. Subsequently, the fermentation process also leads to the
oxidation of the polyphenols. This reaction, catalysed by the enzyme
polyphenoloxidase, gives rise to the browning nature of the cocoa fruit.
2.6.2 Drying, transport and storage
After a successful fermentation process, it is necessary to reduce the water content of
the cocoa seeds to between 5 and 8%; and this is achieved by drying. The drying
process is not only important in preserving the cocoa seeds but also plays a very crucial
role in the development of cocoa flavour and the over-all quality of the raw cocoa
seeds. In most tropical cocoa producing areas, drying of the cocoa seeds is done directly
under the sun. Cocoa seeds are either spread on straw mats or plastic sheets laid a few
meters above the ground to be dried in most West African countries. In some highly
mechanized plantations, special drying tables fitted with retractable roofs are used. This
has the added advantage of regulating the amount of sunlight and also to protect the
cocoa seeds in the event of rainfall. In the rainy seasons, drying is normally done in
ovens using firewood. This is however not practically desired, unless it is very carefully
carried out taking all the necessary precautions into consideration. The smoke which is
generated in this mode of drying has a higher potential of contaminating the delicate

21
raw cocoa seeds and this may lead to the development of ‘off-flavours’ (Fowler, 1995),
which are not desired. This is also a slow process and due to time constraints, the cocoa
seeds might not be dried enough and could easily be plagued by mold infestation. The
drying process normally takes 6-7 days. Drying of the cocoa seeds in a relatively short
time is also not advisable because the necessary oxidation processes in the seeds might
not be completed and this may give rise to relatively high amounts of acids still
remaining in the seeds. Comparably, drying in the sun leads to lower amounts of acids
in the seeds than observed in other means of drying (Wood and Lass, 1989). The
amount of temperature that these seeds are subjected to during the drying process must
also be taken care of. In general, the temperature should not exceed 65°C during solar
drying and when ovens are used, a maximum of 70°C should be maintained. After
drying, the cocoa seeds have to be transported immediately to the consumer countries.
This is done to avoid mold and pest infestation. Drying is an efficient means of
preserving these seeds for longer periods of time. Jute sacks are filled with dried cocoa
seeds to the appropriate weights, placed in containers and then transported by ships to
the consumer countries. The containers into which the cocoa seed sacks are stored
during the shipment should be very well-ventilated. Also the moisture content of the
cocoa seeds from this exit point, during the entire transportation period and up to the
final destination and even before they finally leave for the confectioneries should
always be checked. This is a precaution to minimize mold and pest invasion.
2.6.3 Roasting
The roasting of the cocoa seeds takes place in the consumer countries. During this
process, the products of the proteolysis reaction (free amino acids and oligopeptides) of
the fermentation and reducing sugars are involved in Maillard series of reactions which
subsequently give rise to the formation of the typical cocoa flavour. Browning of the
cocoa seeds is also evident after this non-enzymatic reaction. Roasting may take place
up to about 140°C and last for about 10 minutes. The seed coat also gets separated from
the rest of the cocoa seed mass during roasting. This is then followed by grinding of the
cocoa mass at about 50°C, after which it can then be used for the production of different
products. Chocolate, cocoa powder and cocoa butter are the main end products derived
from the cocoa mass.

22
2.7 Heterogeneity of raw cocoa The strive to achieve raw cocoa beans of very high quality has been an on-going
process. There are therefore unarguably high demands and expectations from cocoa
producing countries to satisfy their purchasers or consumer counterparts. Very high
quality cultivated breeds of raw cocoa beans, coupled with very good fermentation
requirements is expected to produce a good cocoa flavour which is desired on the global
market. Purchasers of cocoa have therefore placed a very high importance on this
criterion which they use as one of the quality assessment tools in their business deals
with the producer countries.
The rise of these premium quality cocoa beans has led the world cocoa market to
distinguish and also to define between two main lines of cocoa beans, based on the
genotypes. These are the ‘fine or flavour’ cocoa beans, and the ‘bulk or ordinary’ cocoa
beans. In general, fine or flavour cocoa beans are produced from Criollo or Trinitario
cocoa tree varieties, while bulk cocoa beans come from Forastero trees (ICCO, 2007).
There are, however some discrepancies to this generalisation. For example, Nacional
trees in Ecuador, considered to be Forastero-type trees, produce fine or flavour cocoa.
On the other hand, Cameroon cocoa beans, produced by Trinitario-type trees and whose
cocoa powder has a distinct and sought-after red colour, are classified as bulk cocoa.
The fine cocoa is characterised by a full cocoa flavour and associated with pleasant
ancillary flavours such as molasses, liquorice, caramel, nuts and raisin, and is simply
described as fruity. This is considered as a superior and of the highest quality with an
accompanying higher price-tag. Total world production of fine cocoa beans is however
just under 5% annually (ICCO, 2007). Major fine cocoa bean producing countries
include Trinidad and Tobago, Costa Rica, Grenada, Jamaica, Madagascar and Saint
Lucia (ICCO, 2010).
Bulk cocoa has served the world cocoa market over the past five decades, and it is not
undesired. Ghana has been considered a major producer of the best bulk cocoa for
decades and this quality characteristic continues to be maintained to a higher extent.
However, certain cocoa clones in Ghana have recently been identified as possessing the
potential to produce fine cocoa with the help of cocoa experts. Preliminary
investigations and tests have already been carried out and expectations are high for a
higher success rate.
23
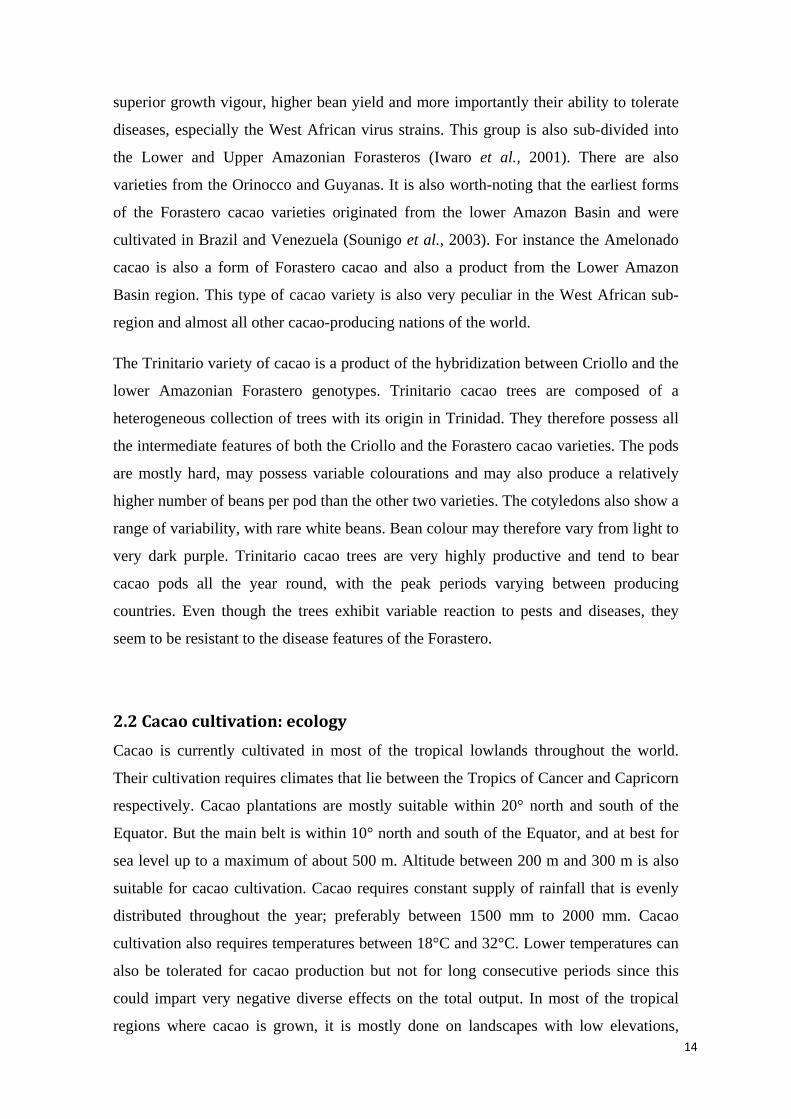
Figure 1: Seedling, flowering, pod variability and fresh fruits of Theobroma cacao L.
(Rohsius).
A: Young cocoa seedling, B: flowering, C-F: Different pod types, C: Criollo or Trinitario, D: Criollo, E: Forastero, F: Trinitario, G-I: Cocoa pods cut open showing fresh fruits.
A B C
D E F
G H I

24
Figure 2: Harvesting, fermentation, drying of cocoa beans and cocoa beans with poor quality (Rohsius).
A: Harvesting of mature cocoa pods using a special long knife, B: Cutting cocoa pods open, C: Cocoa fermentation using plantain leaves, D: Drying of fermented cocoa beans under the sun, E-F: Poor quality cocoa beans showing infestation.
A B
C D
E F

25
3. Materials and methods
3.1 Plant material
3.1.1 Description of plant materials used in the biochemical analysis
A total of 89 raw cocoa bean samples were utilized for the biochemical and qualitative
analyses. These materials could be referred to as raw cocoa bean seeds from Theobroma
cacao L., which had already been fermented and dried in the various producing
countries. These raw cocoa bean seeds were obtained from Ghana, the Ivory Coast and
Trinidad & Tobago, which accounted for 84 samples. The rest of the samples were
obtained from various cocoa plantations in Madagascar, Papua New Guinea, the
Dominican Republic, São Tome and Venezuela.
3.1.2 Description of plant materials used in the fermentation-like incubation
of fresh cocoa bean seeds
For the incubation experiments, plant materials from Ecuador with different
genotypes were utilized. The incubation experiments were performed at the
Biozentrum Klein Flottbek of the University of Hamburg and under laboratory scale
basis.
Raw cocoa fruits used for this part of the study were obtained from a plantation in
Ecuador. Physical examination of the raw cocoa fruits gives more indication of the
Criollo type, even though the specific genotype remained unknown.
3.2 Methods Unless otherwise stated, all chemicals used for the analyses were obtained from the
chemical company Merck (Fa. VWR) in good quality. Dilutions from these
concentrated chemicals were performed with high quality deionized water.
For most of the analyses involving chemical and biochemical reactions, it was very
necessary to remove the higher concentrations of fat and phenolic substances that are
formed in the cotyledons of the cocoa bean seeds. Defatted cocoa bean materials
make it possible for the various reactions to be successfully carried out in aqueous
medium, and also prevents the protein components in the seeds from undergoing
further reactions which otherwise might interfere with the intended analytic reactions
being carried out.

26
3.2.1. Defatting of raw cocoa bean samples
The first step involves the removal of the testa and radicle from the entire bean seed.
These are then shock-frozen, dried and finally chopped into smaller, coarsely pieces
for easy grinding. About 2 g of these smaller cocoa materials together with 10 ml of
n-hexane solution are filled into a milling vessel containing 6 metal milling balls
(type MM200, Retsch). The mixture is then subjected to 10 minutes of vigorous
shaking at a frequency of 20/s for complete grinding up to particle sizes of about 1
µm. The outcome is a homogenate which is then quantitatively washed out of the
grinding vessel. This is then followed by a filtration process performed with vacuum
filtration apparatus involving a glass filter and a 0.45 µm polyamide filter paper
(Sartorius). The homogenate is washed with about 75 ml of petroleum ether (bp 40-
60°C) during the filtration step in order to remove the fatty components from the
homogenate. The filtrate is then dried in a vacuum-dryer (Heraeus) at room
temperature and 100 mbar. It is then kept at -20°C for further analyses. This material
is then designated as a fatty free dried material (ffdm).
3.2.2 pH determination
1 g of the defatted sample was taken and finely ground in a mortar and mixed with
10 ml of boiled distilled water. The mixture was stirred for about 3 minutes and then
filtered through a folded filter paper (Nr. 595 ½, Schleicher & Schuell). The pH
value of the filtrate at 20°C was finally determined using a pH electrode (pH meter
654, Metrohm).
3.2.3 Antioxidative potential determination
The antioxidative potential was determined by means of the TEAC (Trolox®
Equivalent Antioxidative Capacity) method (Miller et al., 1993).
10 mg of the defatted material was mixed in a vessel containing 2 ml of a mixture of
acetone/methanol/phosphate buffer 6+2+2 (v/v/v), prepared from 5 mmol phosphate
buffer and pH 7.4. The resulting solution was then centrifuged at 14 000 rpm for 15
minutes. The supernatant is then used for the analysis, according to the method of
Liebert et al., (1999). 10 µl of this solution is introduced into a cuvette that already
contains 600 µl of ABTS solution (500 µmol ABTS/l). 1 ml of the phosphate buffer

27
solution is then added to the mixture in the cuvette. The reaction is then initiated by
the addition of 30 µl of a 2% H2O2 solution. The photometer then records values at
an absorption extinction of 734 nm.
3.2.4 Phenolic compounds determination
Determination of the phenolic substances (-)-epicatechin and catechin was performed
using two different methods, the Reverse Phase-High Performance Liquid
Chromatography (RP-HPLC) method and the Folin-Ciocalteus phenol reagent
method.
3.2.4.1 Determination and extraction of polyphenols and anthocyanins using the RP-
HPLC
The separation and detection of various compounds can be performed using the RP-
HPLC. The components of the HPLC system that was used consisted basically of a
Millenium® 32Version 3.20 Chromatography Manager Software (Waters), an
autosampler, a pump, a gradient mixer (Dynamic Mixing Chamber, Knauer) and a
vacuum degasser for degassing the eluent. Separated compounds are then captured
on different detectors for quantification and identification. The photometric detection
of various compounds functions within a range of different wavelengths.
3 ml of methanol was added to 50 mg of defatted cocoa powder in a centrifuge glass
measuring 16 mm x 100 mm. This was vigorously stirred for about 20-30 seconds
using an Ultraturrax T25 (Janke and Kunkel). An additional 2 ml of methanol was
used to wash down cocoa powder remaining on the Ultraturrax stirrer. Subsequently,
the solution was left on ice for about 15 minutes and finally centrifuged at 5000 rpm
(Labofuge GL, Heraeus Christ). The clear methanol supernatant was then decanted
into a 50 ml conical flask. This extraction process was repeated three times but this
time with only two minutes of ice treatment. The combined methanol extracts were
then passed through a rotary evaporator (LABO Rota SE 320, Resma Technics) at
40°C and at 100 mbar until it dries up. It is then dissolved in 1.5 ml of methanol
(Lichrosolv®) and finally filtered through a 0.45 µm filter apparatus (Multoclear 25
mm PTFE, CS-Chromatographic Service) into a HPLC vial, air-tightly closed and
eventually stored at -20°C. The sample is then measured against a calibrated series

28
with the help of the HPLC. Identification and quantification of the peaks was made
using standard solutions of catechin and epicatechin as references.
HPLC parameters
Elution solution A: 2% Acetic acid
B: Acetonnitrile / distilled water / glacial acetic acid:
400 + 90 + 10 (v/v/v)
Measurement: Isocratic HPLC measurement over a UV-detector at
λ = 280 nm for polyphenols and λ = 540 nm for
anthocyanins
Volume of sample solution: 20 µl
Pre-column: Endcapped Lichrospher 100 RP-18 (LiChroCART)
Separating column: Endcapped Lichrospher 100 RP-18 (LiChroCART
particle size: 5 µm, length: 250 mm, internal
diameter: 4 mm)
Column temperature: 26°C
Sample sampler: Autosampler AS-2000 (Merck Hitachi)
Detection: Photo-Dioden-Array-Detector (PDA Detector 996,
Waters)
Pump: Smartline Pump 1000 (Knauer)
Vacuum degasser: Degasser (Knauer)

29
Table 1: A profile diagram of the composition, time and flow rate of the elution solutions used in the determination of polyphenols and anthocyanins.
3.2.4.2 Determination of total phenolic substances using the Folin-Ciocalteus phenol
reagent method
0.5 g of the defatted material was transferred into a 100 ml centrifuge glass. This was
then extracted three times with an acetone/H2O mixture - 60+40 (v/v) by vigorous
stirring. After every extraction step, the mixture was treated in an ultrasonic vessel
for three minutes before finally being centrifuged at 5000 rpm for 10 minutes. The
supernatant was then poured into a 250 ml round-bottom flask already containing 2
ml glacial acetic acid in order to prevent the oxidation of the supernatant. In order to
fully evaporate all the acetone, the mixture is then passed through a rotary evaporator
at 40°C and 60 mbar. The acetone free solution that finally remains is then
transferred into a 100 ml measuring flask and made up to the mark using distilled
water. The sample extract is finally stored in a polyvinylchloride container and kept
at -20°C until further analysis.
Next, this sample solution is handled in an ultrasonic vessel for about 20 minutes,
thawed and thoroughly mixed. 2 ml of this solution is then diluted in 2.5% acetic
acid solution. In order to develop a coloured complex, 1 ml of this diluted solution is
pipetted into a 10 ml measuring flask, followed by the addition of 0.5 ml Folin-
Ciocalteus-phenol reagent (Merck-No. 109001). Next, 2 ml of 20 % Na2CO3 solution
is added to this mixture and the measuring flask is immediately swirled twice and
Time Volume Composition of elution solution
(min) (ml) % A % B 0 1.2 100 0
8 1.2 95 5
38 1.1 85 15
50 1.0 60 40
70 1.0 50 50
73 1.0 0 100
78 1.2 0 100
93 1.2 100 0

30
finally filled with distilled water up to the mark. The Na2CO3 solution used for the
analyses must be freshly prepared on daily basis. The mixture is finally handled in a
hot water vessel at 70°C for 10 minutes. This stabilises the coloured complex that has
been developed. The sample solution is than allowed to cool (up to 20°C) and this is
then transferred into a 1 cm cuvette and measured using the photometer at 730 nm
against a blank value.
Calibration and measurement
A stock solution of 50 mg of epicatechin dissolved in 50 ml of 2.5% acetic acid
solution was obtained. From this stock solution, concentrations of 20, 40, 60, 80 and
140 µg epicatechin/ml were obtained. These derived solutions were then used for the
calibration of the total amount of phenolic compounds in the raw cocoa bean
samples.
3.2.5 Determination of the amount of acetic and lactic acids
The amounts of acetic and lactic acids were determined according to Tomlins et al.
(1990). This method makes use of the Reversed Phase High Performance Liquid
Chromatography (RP-HPLC) in conjunction with an ultraviolet detector. The acids
were extracted with benzoic acid and these raw extracts were then cleaned over an
anion exchange cartridge. This method also requires an additional cleaning procedure
of an SPE-anion exchange column.
Extraction
2 g of ground cocoa cotyledons were transferred into a steel cup containing a metal
milling ball (Type MM200, Retsch). 10 ml of 0.2% benzoic acid solution is added
and then extracted by vigorous shaking at a frequency of 50 s-1 for 10 minutes. The
homogeneous solution is then transferred into a 20 ml centrifugation glass and
separated at 5000 rpm for 10 minutes using the Laborfuge GL Centrifuge (Heraeus
Christ). The supernatant is obtained and this is centrifuged once more at 13 000 rpm
for 10 minutes. This final clear supernatant is then filtered through a 0.45 µm watery-
membrane filter (Multoclear® 25 mm; code: red, CS-Chromatographic Service) and
stored in plastic containers.
31
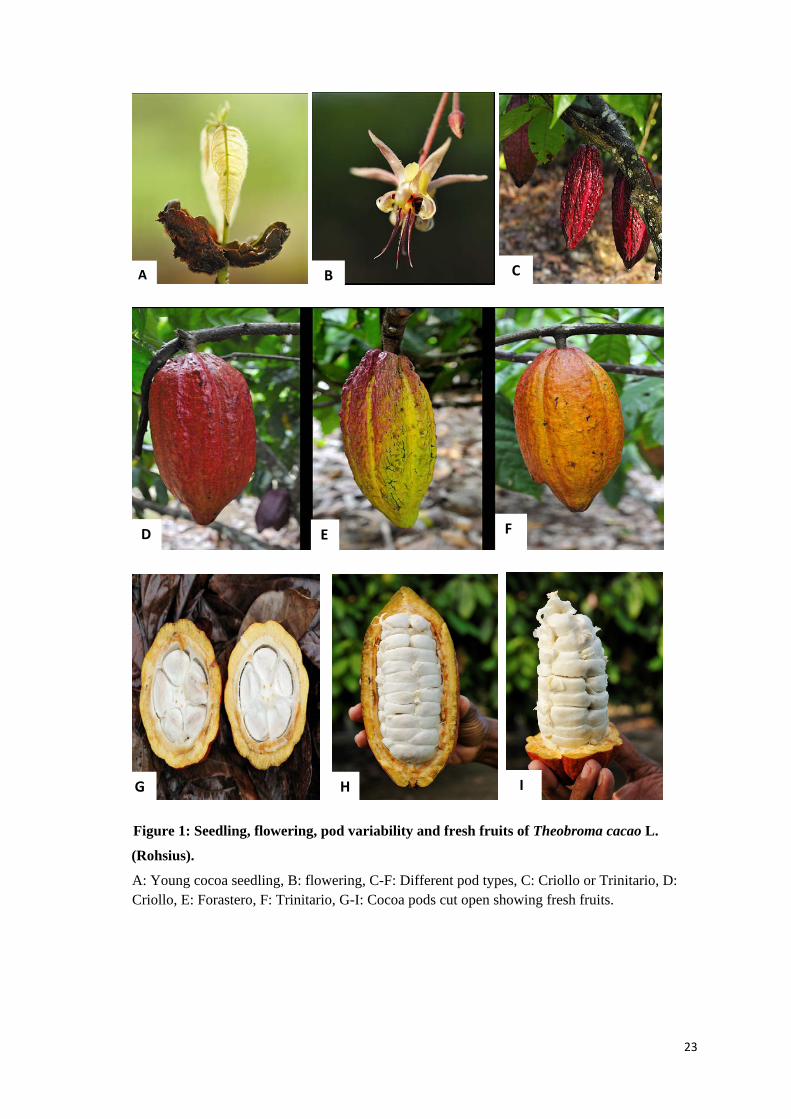
Conditioning and cleaning the anion exchange cartridge
5 ml of methanol is run over the anion exchange column which ensures a slow elution
process that lasts for about 5 minutes. The column is then conditioned by pouring 2 ml
of distilled water slowly over the column, which lasts for another 10 minutes. Elution of
the water is done by a vacuum pump system (Baker-10 SPE system).
Cleaning of the sample solution
1 ml of the sample solution is run over the pre-conditioned cartridge and eluted in a 5
ml measuring cylinder. The organic acids are finally eluted by the addition of 36 ml
phosphate elution buffer solution (c = 0.15 mol/l, pH 7.5). The measuring flask is then
filled with distilled water up to the mark and the solution is used for the HPLC
measurement against a calibrated standard.
HPLC Parameters
Measurement: Isocratic HPLC measurement over a UV-detector,
λ = 215 nm
Volume of sample solution: 20 µl
Pre-column: Micro-Guard Cation-H cart. (30 mm x 4.6 mm;
Bio-Rad)
Separating column: Cation exchanger Aminex HP-87H (300 mm x 7.8
mm; Bio Rad)
Elution solution: c = 0.013 mol/l H2SO4
Flow rate: 0.6 ml min-1
Column temperature: 25°C-27°C
Sample sampler: Autosampler 717plus (Waters)

32
Detection: UV-VIS-Detector L-7420 (Merck Hitachi),
λ = 215 nm
Pump: HPLC Pump 64 (Knauer)
Degasser: Degassex DG-4400 (Phenomenex)
3.2.6 Determination of the amount of methylxanthines (theobromine and
caffeine)
Preparation of the samples
0.05 g of the defatted cocoa powder was boiled in a 100 ml volumetrical flask
containing 80 ml of boiled distilled water, mounted in a water bath under gentle
swirling for about 30 minutes. The samples are subsequently reduced to 20°C by the
addition of 100 µl of Carrez I-solution (150 g/l potassium hexacyanoferrat(II)-
trihydrate, (K4[Fe(CN)6] x 3H2O) and 100 µl Carrez II-solution (300 g/l zinc sulfate
heptahydrate, ZnSO4 x 7H2O). The mixture is then made up to the 100 ml mark with
distilled water, thoroughly mixed and then filtered (Filter paper 595 ½, Schleicher &
Schuell).
HPLC measurement of the theobromine and caffeine content
The HPLC System used for the separation and detection of the theobromine and
caffeine content was associated with a Millennium®32 Version 3.20 Chromatography
Manager software (Waters Co.), an autosampler (717 plus from Waters), a pump
(HPLC pump 64 with analytical Pump head, Knauer), a vacuum degasser (Knauer)
for degassing of the eluent and a UV detector (UV-VIS detector L7420, Merck
Hitachi). A digital converter (bus SAT/IN Module, Waters) converts values recorded
on the UV detector and passes these on for transmission on the Millennium®32
Chromatography Manager software. The separation was performed on a
LiChrospher® 60 RP select B column (particle size: 5 µm, length: 250 mm, internal
diameter: 4 mm. The flow rate was maintained at 1.2 ml/min, the column
temperature was 30°C. The samples were eluted isocratically with a mixture of
acetonitrile, methanol and 0.02 mol/l KH2PO4 buffer, pH 4 separated at a ratio of
7+3+90 (v/v/v), and then detected over the UV detector at a wavelength of λ = 274
nm. For the identification of the different peaks concentrated standard solutions of

33
theobromine and caffeine were used as reference solutions. In each case, 20 µl of the
sample were injected.
3.2.7 Determination of sugar contents
Preparation of the samples
100 mg of defatted cocoa powder was added to 1 ml of pre-warmed deionized water.
This mixture was vortexed until the cocoa powder has completely suspended and
heated in a thermomixer for 15 min (Thermomixer comfort, Eppendorf) at 99°C.
Subsequently the samples were centrifuged for 10 min at 13,000 rpm (centrifuge:
Biofugefresco, Fa. Heraeus Instruments). The resulting supernatant in the ratio of 1:4
was diluted with acetonitrile and filtered through 0.45 µm filter (Multoclear, 25 mm
PTFE, Fa. CS Chromatographie Service).
HPLC measurement of the sugars
The separation and detection of the sugars was carried out by the HPLC, with a
Millennium®32 Version 3.20 Chromatography Manager software (Waters Co.)
equipped. It was also equipped with an autosampler (Waters 717 plus Fa), a pump
(HPLC pump 64 analytical pump head, Knauer), a vacuum degasser (Knauer) for
degassing the eluent and a refractometer (differential refractometer R 401, from
Waters) for detection. Through a digital converter (bus SAT/IN Module, from
Waters) the sugar contents were measured on the refractometer and the values
transmitted on the Millennium®32 Chromatography Manager software for conversion.
The separation was performed on a Hypersil APS column (particle size: 5 µm,
length: 125 mm, inner diameter: 4 mm, Shame Beck) with a Hypersil APS guard
column (particle size: 5 µm, length: 10 mm, inner diameter: 4 mm, Shame Beck).
The flow rate was 1.0 ml/min, with a column temperature of 30°C. The samples were
13 min isocratically separated with a mixture of acetonitrile and deionized water,
88+12 (v/v) as eluent and then subsequently detected by refractometer. To quantify
the different peaks, concentrated standard solutions of glucose, fructose and sucrose
were used as reference solutions. In each case, 50 µl of sample were injected.

34
3.2.8 Determination of the free amino acids contents by means of HPLC
The chromatographic separation of amino acids was carried out according to a slightly
modified method of Kirchhoff et al., (1989a) through an RP-HPLC (Reversed Phase
High Performance Liquid Chromatography). This is a non-polar stationary phase with a
polar mobile phase combined. The column packing, together with the stationary phase
is porous with C18 alkyl modified silica gels. The substances to be separated which are
in the mobile phase, called the analytes, are dissolved and applied to the column. The
separation is based on the different adsorption of analytes on the column matrix, so that
the analytes are eluted at different retention times.
Sample preparation
0.1 g of defatted cocoa powder were placed in a centrifuge tube and 0.3 g of
polyvinylpolypyrrolidone (PVPP, Fluka) and 25 ml of 4°C cold deionized water, which
was preset with trifluoroacetic acid to a pH value of 2.0 are added. While stirring, the
pH was adjusted to a value of 2.5 with 50% aqueous trifluoroacetic acid. For the
extraction of amino acids, the mixture was left in a magnetic stirrer in an ice bath for
one hour. After extraction, the sample was centrifuged for 10 min at 5000 rpm
(Labofuge, Heraeus Christ) and the resulting clear supernatant was filtered through a
0.45 µm filter (MULTOCLEAR, 25 mm PTFE, CS-Chromatographie Service).
For the analysis of amino acids 30 µl of the filtrate were placed in a HPLC sample vial,
freeze-dried at -20°C and 0.05 mbar for one hour.
Reagents
Borate buffer: 200 mmol/l boric acid solution (12.38 g of boric acid in 1 l H2O
(gradient grade) was treated with potassium hydroxide solution to a pH value of 9.5,
boiled for 5 min and stored until use at 4°C.
OPA reagent: 100 mg o-phthalaldehyde (Fluka) were dissolved in 2.5 ml of
methanol (gradient grade). 100 µl of 2-mercaptoethanol and 22.4 ml of borate buffer
(pH 9.5) were added to this solution. The OPA reagent was prepared 24 hours before
use and stored at 4°C.
Eluent A: 1.6 liters of 50 mmol/l sodium acetate solution were mixed with 10%
sodium acetic acid adjusted to a pH value of 6.2. 50 ml of methanol (Lichrosolv®
gradient grade) and 20 ml of tetrahydrofuran (Lichrosolv® gradient grade) were later

35
added to the final solution.
Eluent B: 200 ml of 50 mmol/l sodium acetate solution were mixed with acetic acid
and adjusted to a pH value of 6.2. 800 ml of methanol (Lichrosolv® gradient grade)
were then added.
Derivatization of samples
For the HPLC measurement 800 µl of borate buffer were added to the freeze-dried
samples. Before the start of each measurement of the samples by HPLC 400 µl of
OPA reagent was added to each sample for derivatization. Derivatization ended
exactly after 2 min with injection of 20 µl of this mixture onto the column.
HPLC measurement
The separation was performed on a LiChroCART 250-4 column (particle size: 5 µm,
length: 250 mm; Merck). The 100 RP-18 guard column was preceded by a
Lichrospher separating column. The flow rate was 1.3 ml/min with a column
temperature of 30°C. The measurement of amino acids was carried out against
standard solutions. For the determination, the samples were dissolved in borate
buffer for 2 min with the addition of 400 µl and OPA reagent to derivatize it.
Time Composition of elution solution
(min) % A % B
0 100 0
2 95 5
12 85 15
20 60 40
25 50 50
40 0 100
50 0 100
55 100 0
75 100 0
Table 2: A profile diagram of the composition and time of elution during the determination of free amino acids.

36
Quantification of free amino acids The quantification of free amino acids was carried out by comparing the peak areas
of the sample chromatogram with those of the standard chromatograms, taking the
respective dilutions into consideration. The standard solutions contained
concentrations between 125-1000 ng amino acids/ml. The values are given as results
of free amino acids obtained from fat-free dried materials.
3.2.9 Preparation of acetone-dried powder
For the extraction of polyphenols, about 1 g of the defatted sample together with 15
ml of 80% aqueous acetone solution were shaken for 15 min in an ice bath.
Subsequently, the mixture was centrifuged at 13,000 rpm for 15 min at 4°C. The
supernatant was decanted and the residue was one more time with 80% and two
times with 70% aqueous acetone solution extracted respectively. The residual
polyphenols were finally extracted one more time with 25 ml of acetone solution.
The acetone was decanted and the samples were dried in a vacuum-drying cabinet at
room temperature to be freed from residual acetone. The resulting acetone powder
was then stored at -20°C until further analyses.
3.2.10 Measurement and detection of oligopeptide linkages
Measurement and detection of the oligopeptides were performed by the use of the
Reversed-Phase High Performance Liquid Chromatography. It is based on the
principle that a mixture of the substances is separated over two phases; a non-polar
stationary phase and a polar mobile phase. The separation occurs in such a way that
the polar phase is separated first and then followed by the non-polar substance which
is eluted and detected. In order to prove the presence of the oligopeptides and support
the findings of the test, the extracts were hydrolysed in concentrated hydrochloric
acid. The net result of this reaction was that all the peptide bonds between the
oligopeptides were broken and hence liberating the free amino acids in solution.
Most of the peaks became extinct as a result of the acidic hydrolysis; some of them
however resisted and showed that they were not oligopeptides at all. Their chemical
nature therefore remained unknown.

37
Extraction of the oligopeptides
0.35 mg of dried acetone powder were added to 40 ml of 70% aqueous methanol.
The mixture was vigorously stirred with a magnetic stirrer for about one hour at
room temperature to extract the oligopeptide. The resulting solution was then filtered
through a vacuum filter (Sartolon polyamide, pore size: 45 µm) to remove the non-
soluble portions of the dried acetone powder. The filtrate was then passed through a
rotary vacuum evaporator at 40°C to eliminate any trace of methanol. This methanol-
free solution was then centrifuged for 30 minutes at 4°C and 17,000 rpm (Sorvall
RC5C Instruments). The resulting supernatant was freeze-dried at -20°C and then
dissolved in 1 ml of 0.1% trifluroacetic acid solution (Amin et al., 2002, Voigt et al.,
1993). The mixture was finally centrifuged for 15 minutes at 13,000 rpm (Biofuge
fresco, Heraeus Instruments). 60 µl of the supernatant was injected onto the HPLC
column for the measurement of the oligopeptides. Furthermore, 30 µl from the rest of
the solution was freeze-dried and later used for the measurement of free amino acids.
HPLC parameters
Separating column: Octadecylsilyl-C18-column (Restek, particle size: 5 µm,
length: 250 mm, internal diameter: 4.6 mm)
Detection: PDA Photo-diode-array-detector (Waters 996)
Elution solution A: 0.1% Trifluroacetic acid
Elution solution B: 800 ml Acetonitrile (Roth, gradient grade) added to 0.1%
trifluroacetic acid and 200 ml of elution solution A.
Column temperature: 30°C
Flow rate: 10 ml/min
The samples were eluted isocratically with elution solution A and then with a linear
gradient (0-50%) elution solution B. After about 60 minutes, an elution mixture
comprising of about 50% elution solutions of A and B might have been achieved.
The oligopeptides were then eluted and measured at a wavelength of λ = 210 nm.
3.2.11 Fermentation index value
50 mg of defatted cocoa powder was weighed into a 125 ml conical flask. 50 ml of
methanol-hydrochloric acid (97:3, v/v) was added and the mixture was extracted
under cold conditions with vigorous stirring for about 2 hours. The solution was then

38
centrifuged at 15,000 rpm and the filtrate absorbance was finally measured at 460 nm
and 530 nm respectively using the spectrophotometer. The fermentation index value
of the samples were then obtained by calculating the ratios of the absorbance at 460
nm and 530 nm (fermentation index = A460/A530).
3.2.12 Fermentation-like incubation of raw cocoa bean seeds
During the fermentation process biochemical changes occur in the cotyledons of the
cocoa bean seeds. These biochemical changes can also be artificially initiated
through fermentation-like incubation experiments by the use of acetic acid and then
subjected to appropriate temperatures and under anaerobic conditions (Biehl and
Passern, 1982). Within the scope of this study, fermentation-like incubation
experiments were performed under four varying pH regimes: pH 3, pH 3.5, pH 5 and
pH 5.5 respectively. All other prevailing conditions however remained the same.
The incubations were performed under sterile conditions. The cocoa pods containing
the fruits were first thoroughly washed with soapy water several times and then
finally washed and rubbed with Sterilium disinfection solution. The pods were then
opened under a sterilized clean bench after their surfaces have been sterilized with
burning ethanol. The seeds were carefully removed and separated from the adhering
pulp using sterile paper pads. The seeds were incubated with complete testa.
Incubations were carried out in 250 ml glass flasks (Duran bottles). About 40 cocoa
seeds were suspended in four of such glass flasks containing 200 ml of the
incubation media. These four incubation flasks represented each of the four varying
pH regimes under investigation. The incubation media contained 200 mmol/l acetic
acid (1.14%). A second similar experiment was set up to run parallel to this. Nitrogen
gas was introduced into the set-up during the first anaerobic phase of the incubation,
and then followed by normal air to initiate the second phase of aerobic incubation.
The incubation set-up was covered with lids that were perforated with two holes
through which tubes could be fitted into. One tube was connected so that it ended in
the incubation medium, in order to allow the flow of nitrogen through a sterile air
filter (Sartorius) into the incubation vessel. A second tube, connected just above the
incubation medium was also mounted so that the air could escape again and enter the
second phase of incubation. This gassing and subsequent ventilation system was used
to serve as a simulation of fermentation process occurring under ideal conditions.

39
The incubation was carried out over a period of 3 to 7 days in a water bath
(Koettermann), with gentle shaking. The temperature at the start of the incubation
was 40°C. It was increased after 24 hours to 45°C and after 48 hours to 50°C.
Sampling of the incubated cocoa bean seeds was then carried out after every 24
hours, during which about 6-8 cocoa seeds were removed from each of the
incubation medium. Fresh and un-incubated seeds which had been briefly introduced
into the varying incubation medium for about 30 minutes were also sampled out and
these were labelled “Day 0”. The testae were then removed and the incubated cocoa
bean seeds were freeze-dried in a vacuum dryer and finally frozen at -20°C until
further analysis. As and when necessary, some of the incubated cocoa bean seeds
were defatted and eventually processed into fatty-free dried material for further
chemical analysis (as described in section 3.2.1).
3.2.13 Characterization of individual protein by separation on the SDS-
polyacrylamid-gel electrophoresis (SDS-PAGE)
An SDS-Polyacrylamid-gel electrophoresis protocol from Laemmli (1970) was used
to separate different proteins depending on their relative molecular weights, and also
to obtain information about the purity of the separated bands. This method is also
suitable for separating proteins that have relative molecular masses greater than 10
kDa. With respect to this method, the anionic detergent SDS (sodium dodecylsulfate)
is applied to the protein sample to linearize it. The SDS binds to the protein, forms a
SDS-protein complex and then imparts a negative charge to the linearized protein.
The binding also imparts an even distribution of charge per unit mass and thereby
resulting in a fractionation of the individual proteins according to their approximate
molecular weight during electrophoresis. The SDS also suppresses all non-covalent
bonds. The sample buffer moreover contains 2-mercaptoethanol which reduces the
disulfide bridges of the proteins.
A discontinuous 10-20% gradient gel was prepared together with a 4.5% stacking
gel, which served as the point of start of the electrophoresis.
Preparation of buffers:
Stacking buffer (pH 6.8): 37.85 g (0.625 mol/l) Tris(hydroxymethyl) -

40
aminomethane (Serva)
2.92 g (20 mmol/l) EDTA
(ethylenedinitrilotetraacetic acid)
1% SDS (sodium dodecylsulfate, Serva)
The final solution is made up to 500 ml with deionized water.
Separating gel (pH 8.8): 90.85 g (1.5 mol/l) Tris(hydroxymethyl)-
aminomethane
1.16 g (8 mmol/l) EDTA
0.4% SDS
The final solution is made up to 500 ml with deionized water.
Running gel buffer: 3 g Tris(hydroxymethyl)-aminomethane
14 g Glycine
The final solution is made up to 500 ml with deionized water. This buffer was later
diluted 10 times with deionized water and adjusted to the final concentration with 1%
SDS.
SDS sample buffer: 0.75 g (0.025 mol/l) Tris(hydroxymethyl)-
aminomethane (adjusted to pH of 6.8 with HCl).
5 g (2%) SDS
12.5 ml (5%) Mercaptoethanol
31.5 g (10%) Glycerine
0.0025 g (0.001%) Bromophenol blue
The final solution is made up to 250 ml with deionized water.
Other reagents and solutions:
Staining solution: 1.25 g Coomassie brilliant blue R 250
454 ml Methanol
46 ml Glacial acetic acid
The staining solution is later diluted 5 times with deionized water before being used.
Destaining solution: 100 ml Glacial acetic acid
300 ml Ethanol
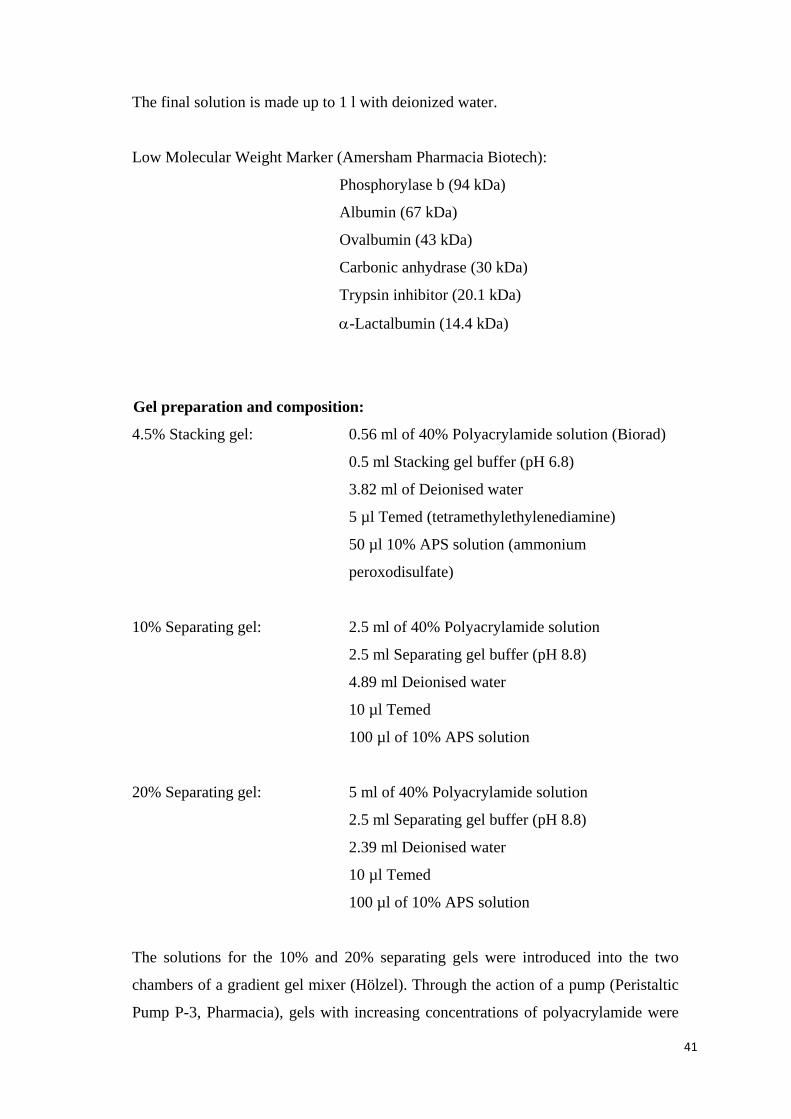
41
The final solution is made up to 1 l with deionized water.
Low Molecular Weight Marker (Amersham Pharmacia Biotech):
Phosphorylase b (94 kDa)
Albumin (67 kDa)
Ovalbumin (43 kDa)
Carbonic anhydrase (30 kDa)
Trypsin inhibitor (20.1 kDa)
α-Lactalbumin (14.4 kDa)
Gel preparation and composition:
4.5% Stacking gel: 0.56 ml of 40% Polyacrylamide solution (Biorad)
0.5 ml Stacking gel buffer (pH 6.8)
3.82 ml of Deionised water
5 µl Temed (tetramethylethylenediamine)
50 µl 10% APS solution (ammonium
peroxodisulfate)
10% Separating gel: 2.5 ml of 40% Polyacrylamide solution
2.5 ml Separating gel buffer (pH 8.8)
4.89 ml Deionised water
10 µl Temed
100 µl of 10% APS solution
20% Separating gel: 5 ml of 40% Polyacrylamide solution
2.5 ml Separating gel buffer (pH 8.8)
2.39 ml Deionised water
10 µl Temed
100 µl of 10% APS solution
The solutions for the 10% and 20% separating gels were introduced into the two
chambers of a gradient gel mixer (Hölzel). Through the action of a pump (Peristaltic
Pump P-3, Pharmacia), gels with increasing concentrations of polyacrylamide were

42
prepared. These gradient gels were then coated with isopropanol and after about 20
minutes the gels were hardened. The isopropanol was then removed resulting in a
4.5% stacking gel. A gel comb was then inserted at the top of the gel to create the
sample wells. The comb was removed after the gel has polymerised. The gel was
then inserted into a gel cassette containing the gel caster and the whole set up was
lowered into the electrophoresis chamber containing running buffer. The gel was
then loaded with the samples containing the appropriate loading buffer.
3.2.13.1 Preparation of the samples for gel electrophoresis
10 mg of acetone dried powder was added to 1.5 ml of the sample buffer and
denatured at 95°C for 10 minutes. The insoluble parts were separated by centrifuging
at 13,000 rpm (Biofuge fresco, Heraeus Instruments). For each gel run, 7.5 µl of the
sample solution and 2.5 µl of the standard low molecular weight marker were
together loaded into the gel wells. The proteins in the stacking gel were eventually
run at an initial voltage of 150 V and then later increased to 200 V. The
electrophoresis was run between 50 and 70 minutes until there was a clear separation
of the individual proteins.
3.2.13.2 Staining of polyacrylamide gels with Coomassie Brilliant Blue R
250
After the electrophoretic separation, the gel was immediately introduced into the
staining solution and left over-night under gentle agitation. By the action of the dye,
Coomassie Brilliant Blue R 250, the proteins become stained unspecifically and
these are visible as blue bands. The excess dye is later washed out by repeated
treatments with the destaining solution. This procedure is carried out until the blue
bands of the proteins are clearly and brightly captured under a light background.

43
4. Results Within the framework of this study, the results have been divided into three main
portions. The first part of the results deals with the study of various quality
parameters of different raw cocoa accessions. These are cocoa bean samples with
different characteristic features peculiar to their origins. An attempt is being made in
this study to find out the extent of correlation and/or comparability that might be
generated within cocoa bean samples originating from the same geographical
location and also between cocoa bean accessions produced from different cocoa-
growing areas.
The second part of the chapter contains results obtained from a study taken to
establish the extent of correlation between the formation of precursors of cocoa bean
aroma formation and the incubation processes. And the last portion of the results
section is devoted to both theoretical and practical approaches involving general
principles and concepts of agroforestry and for that matter cocoa agroforestry as a
means a of preserving biodiversity and the ecosystem. The benefits derived from the
incorporation of various trees and their combinations with each other would also be
discussed. A thorough outlook of these concepts would bring out an in-depth
information and discussion on new developments, regional concepts and approaches
in the agroforestry sector.
Most of the results in this section have been graphically presented in the form of
diagrams and tables to allow for easy observations and comparisons to be made.
4.1 Quality assessment tests of raw cocoa seeds
4.1.1 Sample structure of raw cocoa bean seeds
The 89 cocoa bean samples being used throughout this study have been put into
definite groups depending on their origin and the particular year in which these cocoa
beans were cultivated and brought to commerce as raw cocoa.
For instance, the first group is made up of raw cocoa bean samples from Ghana
obtained from two different cocoa-growing seasons (2007 and 2008). Therefore, raw
cocoa bean samples produced from Ghana in 2007 and 2008 have been labelled ‘Gha
07’ and ‘Gha 08’ respectively. This same preamble have also been used to classify
raw cocoa bean samples originating from the Ivory Coast and as well as Trinidad &
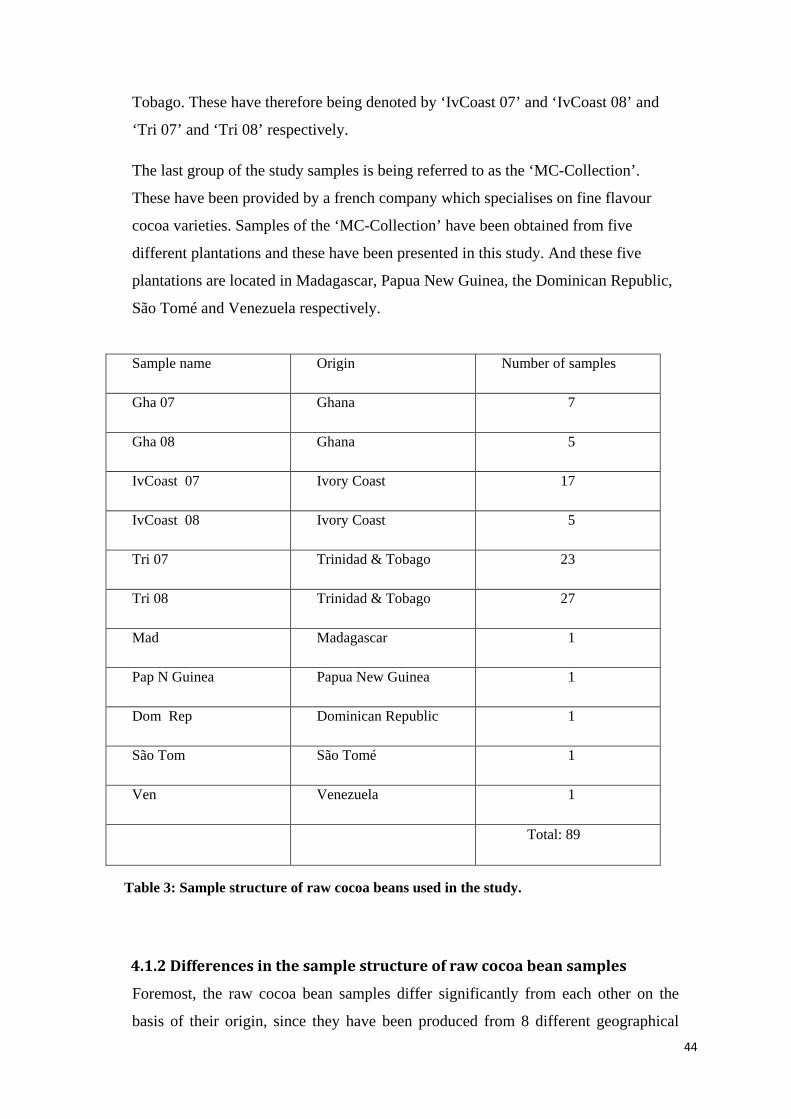
44
Tobago. These have therefore being denoted by ‘IvCoast 07’ and ‘IvCoast 08’ and
‘Tri 07’ and ‘Tri 08’ respectively.
The last group of the study samples is being referred to as the ‘MC-Collection’.
These have been provided by a french company which specialises on fine flavour
cocoa varieties. Samples of the ‘MC-Collection’ have been obtained from five
different plantations and these have been presented in this study. And these five
plantations are located in Madagascar, Papua New Guinea, the Dominican Republic,
São Tomé and Venezuela respectively.
Table 3: Sample structure of raw cocoa beans used in the study.
4.1.2 Differences in the sample structure of raw cocoa bean samples
Foremost, the raw cocoa bean samples differ significantly from each other on the
basis of their origin, since they have been produced from 8 different geographical
Sample name Origin Number of samples
Gha 07 Ghana 7
Gha 08 Ghana 5
IvCoast 07 Ivory Coast 17
IvCoast 08 Ivory Coast 5
Tri 07 Trinidad & Tobago 23
Tri 08 Trinidad & Tobago 27
Mad Madagascar 1
Pap N Guinea Papua New Guinea 1
Dom Rep Dominican Republic 1
São Tom São Tomé 1
Ven Venezuela 1
Total: 89
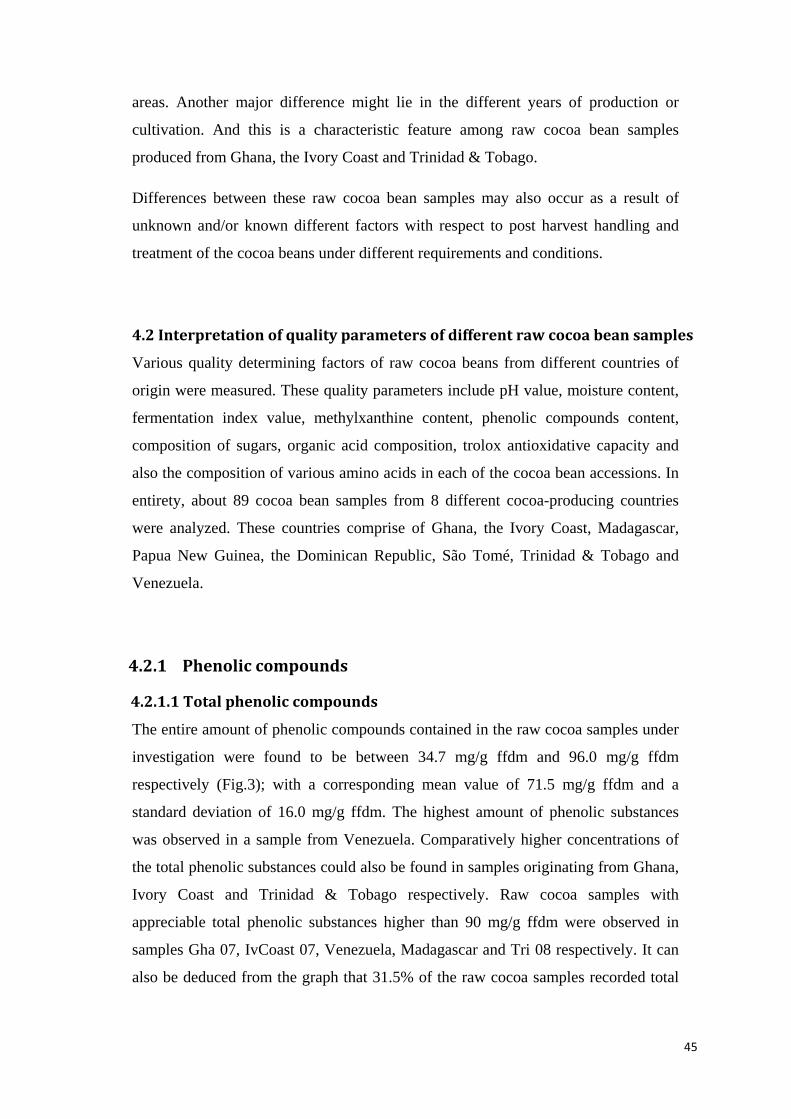
45
areas. Another major difference might lie in the different years of production or
cultivation. And this is a characteristic feature among raw cocoa bean samples
produced from Ghana, the Ivory Coast and Trinidad & Tobago.
Differences between these raw cocoa bean samples may also occur as a result of
unknown and/or known different factors with respect to post harvest handling and
treatment of the cocoa beans under different requirements and conditions.
4.2 Interpretation of quality parameters of different raw cocoa bean samples
Various quality determining factors of raw cocoa beans from different countries of
origin were measured. These quality parameters include pH value, moisture content,
fermentation index value, methylxanthine content, phenolic compounds content,
composition of sugars, organic acid composition, trolox antioxidative capacity and
also the composition of various amino acids in each of the cocoa bean accessions. In
entirety, about 89 cocoa bean samples from 8 different cocoa-producing countries
were analyzed. These countries comprise of Ghana, the Ivory Coast, Madagascar,
Papua New Guinea, the Dominican Republic, São Tomé, Trinidad & Tobago and
Venezuela.
4.2.1 Phenolic compounds
4.2.1.1 Total phenolic compounds
The entire amount of phenolic compounds contained in the raw cocoa samples under
investigation were found to be between 34.7 mg/g ffdm and 96.0 mg/g ffdm
respectively (Fig.3); with a corresponding mean value of 71.5 mg/g ffdm and a
standard deviation of 16.0 mg/g ffdm. The highest amount of phenolic substances
was observed in a sample from Venezuela. Comparatively higher concentrations of
the total phenolic substances could also be found in samples originating from Ghana,
Ivory Coast and Trinidad & Tobago respectively. Raw cocoa samples with
appreciable total phenolic substances higher than 90 mg/g ffdm were observed in
samples Gha 07, IvCoast 07, Venezuela, Madagascar and Tri 08 respectively. It can
also be deduced from the graph that 31.5% of the raw cocoa samples recorded total

46
phenol content above the mean value, whilst the remaining 68.5% were below the
mean value.
0
10
20
30
40
50
60
70
80
90
100
Tota
l phe
nolic
com
poun
ds (m
g/g
ffdm
)
Ghana
07
Ghana
08
Ivory Coast 07
Ivory Coast 08
Trinidad & Tobago 07
Trinidad & Tobago 08
Madagascar
PapuaN
ew G
uinea
Dom
inicanRepublic
São Tomé
Venezuela
Origin
Figure 3: Variation of the amount of total phenolic compounds in raw cocoa beans obtained from different countries.
Further observations from the results also show that about 33.7% of the raw cocoa bean
samples recorded total phenolic compounds between 70 and 96 mg/g ffdm, 43.8%
accounted for samples between 50 and 70 mg/g ffdm and finally the remaining 22.5%
were in the interval between 30 and 50 mg/g ffdm respectively. Some of these same
samples also showed average amounts of phenolic compounds, notably amongst them
include IvCoast 08 and the Dominican Republic. Raw cocoa bean samples with very
little amount of phenolic compounds were those from the IvCoast 08, Tri 07 and 08
respectively.
In order to assess the extent at which the varying amounts of total phenolic compounds
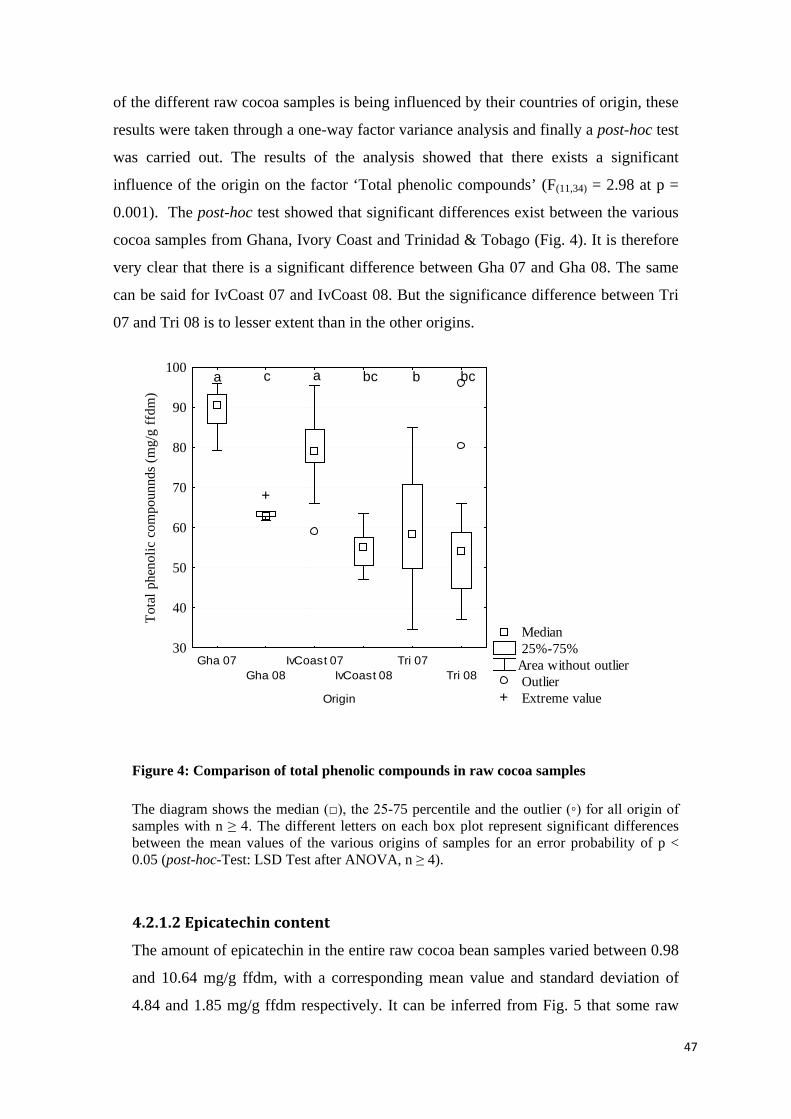
47
of the different raw cocoa samples is being influenced by their countries of origin, these
results were taken through a one-way factor variance analysis and finally a post-hoc test
was carried out. The results of the analysis showed that there exists a significant
influence of the origin on the factor ‘Total phenolic compounds’ (F(11,34) = 2.98 at p =
0.001). The post-hoc test showed that significant differences exist between the various
cocoa samples from Ghana, Ivory Coast and Trinidad & Tobago (Fig. 4). It is therefore
very clear that there is a significant difference between Gha 07 and Gha 08. The same
can be said for IvCoast 07 and IvCoast 08. But the significance difference between Tri
07 and Tri 08 is to lesser extent than in the other origins.
Median 25%-75% Area without outlier Outlier Extreme value
Gha 07Gha 08
IvCoast 07IvCoast 08
Tri 07Tri 08
Origin
30
40
50
60
70
80
90
100
Tota
l phe
nolic
com
poun
nds (
mg/
g ff
dm)
a a bc bcbc
Figure 4: Comparison of total phenolic compounds in raw cocoa samples
The diagram shows the median (□), the 25-75 percentile and the outlier (◦) for all origin of samples with n ≥ 4. The different letters on each box plot represent significant differences between the mean values of the various origins of samples for an error probability of p < 0.05 (post-hoc-Test: LSD Test after ANOVA, n ≥ 4).
4.2.1.2 Epicatechin content
The amount of epicatechin in the entire raw cocoa bean samples varied between 0.98
and 10.64 mg/g ffdm, with a corresponding mean value and standard deviation of
4.84 and 1.85 mg/g ffdm respectively. It can be inferred from Fig. 5 that some raw

48
cocoa bean samples from countries such as Trinidad & Tobago, Madagascar and
Venezuela contained very high epicatechin values. On the other hand, some samples
from these countries were also found to contain low epicatechin values and most
were below the mean epicatechin content. Samples from Papua New Guinea, the
Dominican Republic, and Sào Tomé showed very low epicatechin values and were
also found to be below the mean value. However one sample with the lowest
epicatechin value was obtained from the Ivory Coast.
0
2
4
6
8
10
12
Epic
atec
hin
cont
ent (
mg/
g ffd
m)
Ghana
07
Ghana
08
Ivory Coast 07
Ivory Coast 08
Trinidad & Tobago 07
Trinidad & Tobago 08
Madagascar
PapuaN
ew G
uinea
Dom
inicanR
epublic
São Tomé
Venezuela
Origin
Figure 5: Variation of epicatechin content of raw cocoa beans obtained from different countries.
In order to access the extent of influence the different sample origins have on the
various amounts of epicatechin, a one-way variance analysis in conjunction with a
post-hoc-test was carried out. The results from these analyses showed that there

49
exists significant difference between the epicatechin content and their origins,
namely, Ghana, Ivory Coast and Trinidad & Tobago (Fig. 6). Significant differences
exist between Gha 07 and Gha 08; and also for IvCoast 07 and IvCoast 08
respectively. However, samples from the Trinidad and Tobago showed no very
significant difference since Tri 07 and Tri 08 were very comparable to one another.
Gha 08 and IvCoast 07 also seem to show no significant difference between each
other.
Median 25%-75% Area without outlier Outlier Extreme value
Gha 07Gha 08
IvCoast 07IvCoast 08
Tri 07Tri 08
Origin
0
2
4
6
8
10
12
Epic
atec
hin
cont
ent (
mg/
g ff
dm)
a b bbc bc db
Figure 6: Comparison epicatechin content in raw cocoa samples
The diagram shows the median (□), the 25-75 percentile and the outlier (◦) for all origin of samples with n ≥ 4. The different letters on each box plot represent significant differences between the mean values of the various origins of samples for an error probability of p < 0.05 (post-hoc-Test: LSD Test after ANOVA, n ≥ 4).
4.2.1.3 Catechin content
The amount of catechin in the raw cocoa samples was found to be in the range of
0.03 and 0.41 mg/g ffdm respectively; with a mean value of 0.14 mg/g ffdm and a
standard deviation of 0.05 mg/g ffdm (Fig.7). IvCoast 08 and Gha 08 recorded the
lowest catechin amounts whilst the highest amounts were observed in most of
samples originating from Tri 08. In addition to this observation, relatively
appreciable amounts of catechin were also recorded in some of the samples from

50
IvCoast 07 and the Dominican Republic. Catechin content of most of the samples
from Ghana and Ivory Coast were also found to be lower than the mean amount. The
same can also be said of samples from Trinidad & Tobago.
0.00
0.05
0.10
0.15
0.20
0.25
0.30
0.35
0.40
0.45
Cat
echi
n co
nten
t (m
g/g
ffdm
)
Ghana
07
Ghana
08
Ivory Coast 07
Ivory Coast 08
Trinidad & Tobago 07
Trinidad & Tobago 08
Madagascar
PapuaN
ew G
uinea
Dom
inicanR
epublic
São Tomé
Venezuela
Origin
Figure 7: Variation of catechin content of raw cocoa beans obtained from different countries.
The variance analysis of these observations showed that there is a significant effect
between the various amount of catechin and their respective places of origin. And the
post-hoc test also showed that there are significant differences between the mean
catechin values and their places of origin with n ≥ 4 (Fig. 8). Differences exist
between samples from Ghana, Ivory Coast and Trinidad & Tobago, and also within
samples from the same origin.

51
Median 25%-75% Area without outlier Outlier
Gha 07Gha 08
IvCoast 07IvCoast 08
Tri 07Tri 08
Origin
0.00
0.05
0.10
0.15
0.20
0.25
0.30
0.35
0.40
0.45
Cat
echi
n co
nten
t (m
g/g
ffdm
)
Figure 8: Comparison of catechin content in raw cocoa samples
The diagram shows the median (□), the 25-75 percentile and the outlier (◦) for all origin of samples with n ≥ 4. The different letters on each box plot represent significant differences between the mean values of the various origins of samples for an error probability of p < 0.05 (post-hoc-Test: LSD Test after ANOVA, n ≥ 4).
4.2.2 Antioxidative capacity
The antioxidative capacity of the raw cocoa bean samples were determined by TEAC
tests and the values were quoted as trolox equivalence. The raw cocoa bean samples
were found to be between 0.25 and 4.91 µmol trolox equivalence (100 mg g-1 ffdm
ml-1)-1. Measured values of the antioxidative capacity were found to be very high in
samples from Ghana and Ivory Coast, whereas low amounts were observed in
samples from Trinidad & Tobago, Madagascar, Papua New Guinea, the Dominican
Republic, Sào Tomé and Venezuela (Fig.9).
b c b c b d a
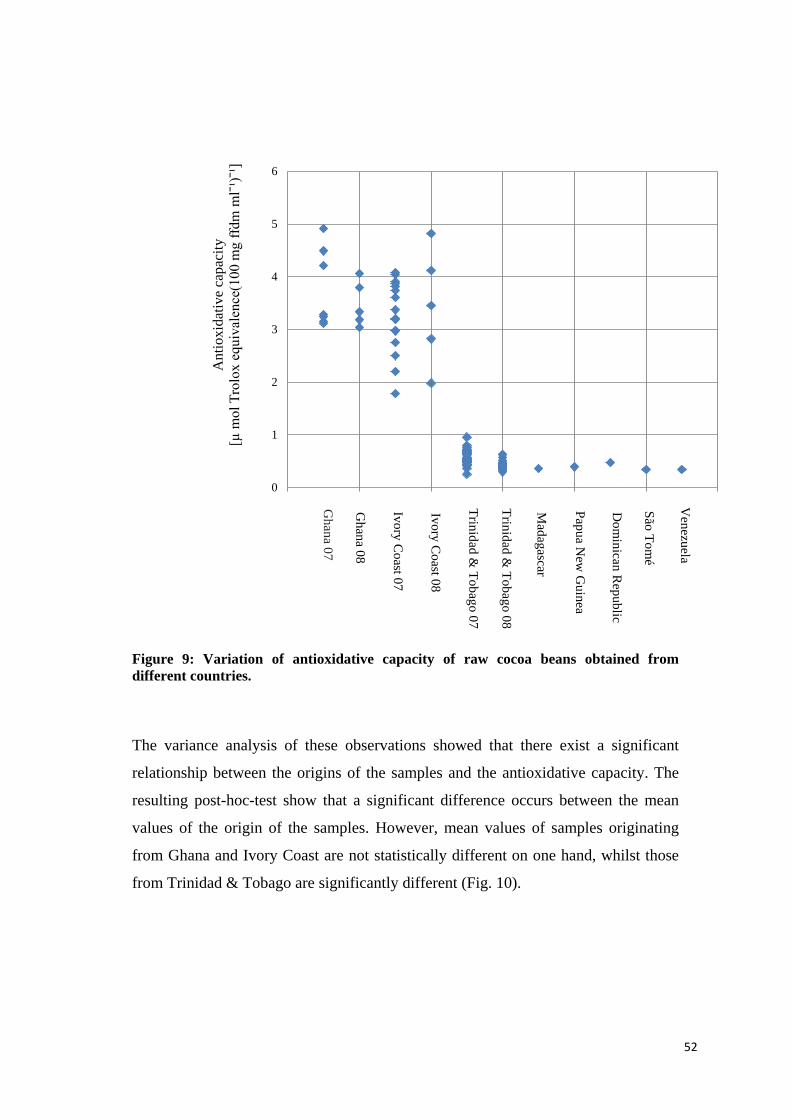
52
0
1
2
3
4
5
6
Ant
ioxi
dativ
e ca
paci
ty[µ
mol
Tro
lox
equi
vale
nce(
100
mg
ffdm
mlˉ¹
)ˉ¹]
Ghana
07
Ghana
08
Ivory Coast 07
Ivory Coast 08
Trinidad & Tobago 07
Trinidad & Tobago 08
Madagascar
PapuaN
ew G
uinea
Dom
inicanR
epublic
São Tomé
Venezuela
Figure 9: Variation of antioxidative capacity of raw cocoa beans obtained from different countries.
The variance analysis of these observations showed that there exist a significant
relationship between the origins of the samples and the antioxidative capacity. The
resulting post-hoc-test show that a significant difference occurs between the mean
values of the origin of the samples. However, mean values of samples originating
from Ghana and Ivory Coast are not statistically different on one hand, whilst those
from Trinidad & Tobago are significantly different (Fig. 10).

53
Median 25%-75% Area without outlier Outlier Extreme value
Gha 07Gha 08
IvCoast 07IvCoast 08
Tri 07Tri 08
Origin
0
1
2
3
4
5
6
Ant
ioxi
dativ
e ca
paci
ty [µ
mol
Tro
lox
equi
vale
nce
(100
mg
ffdm
ml-1
) -1]
a a a a b b
Figure 10: Comparison of antioxidative capacity in raw cocoa samples
The diagram shows the median (□), the 25-75 percentile and the outlier (◦) for all origin of samples with n ≥ 4. The different letters on each box plot represent significant differences between the mean values of the various origins of samples for an error probability of p < 0.05 (post-hoc-Test: LSD Test after ANOVA, n ≥ 4).
4.2.3 Methylxanthines
4.2.3.1 Theobromine content
The amount of theobromine measured in the raw cocoa samples were found to vary
between 15.07 and 34.24 mg/g ffdm, with a corresponding mean value of 28.60 and
a standard deviation of 2.56 respectively (Fig. 11). Trinidad & Tobago recorded the
highest and as well as the least amounts of theobromine content. In addition to this
observation, the theobromine content in the samples from Ghana could be observed
to be evenly dispersed as compared to those from Ivory Coast and Trinidad &
Tobago which showed a smaller degree of variation in the individual values.

54
0
5
10
15
20
25
30
35
Theo
brom
ine
cont
ent (
mg/
g ffd
m)
Ghana
07
Ghana
08
Ivory Coast 07
Ivory Coast 08
Trinidad & Tobago 07
Trinidad & Tobago 08
Madagascar
PapuaN
ew G
uinea
Dom
inicanR
epublic
São Tomé
Venezuela
Figure 11: Variation of the amount of theobromine content of raw cocoa beans obtained from different countries.
The variance analysis subsequently followed by an ANOVA test showed that there
exist significant differences between the origins of the samples and the theobromine
expression. The resulting post-hoc-test also reveal that there are significant
differences between the mean values of the origin of the samples. This then follows
that the samples originating from Ghana, Ivory Coast and Trinidad & Tobago are not
statistically comparable to each other (Fig.12).

55
Median 25%-75% Area without outlier Outlier Extreme value
Gha 07Gha 08
IvCoast 07IvCoast 08
Tri 07Tri 08
Origin
0
5
10
15
20
25
30
35
Theo
brom
ine
cont
ent (
mg/
g ffd
m)
a b ccc d
Figure 12: Comparison of theobromine content in raw cocoa samples
The diagram shows the median (□), the 25-75 percentile and the outlier (◦) for all origin of samples with n ≥ 4. The different letters on each box plot represent significant differences between the mean values of the various origins of samples for an error probability of p < 0.05 (post-hoc-Test: LSD Test after ANOVA, n ≥ 4).
4.2.3.2 Caffeine content
The amount of caffeine in all the raw cocoa samples were found to be between 2.0
and 6.9 mg/g ffdm, with a corresponding mean value of 3.79 mg/g ffdm and a
standard deviation of 1.01 mg/g ffdm respectively (Fig.13). Most of the samples
from Ghana and Ivory Coast showed low caffeine values, as most of these were
below the mean value of the samples. Samples from Venezuela, Papua New Guinea
and Trinidad and Tobago recorded relatively high amounts of caffeine. Samples
from Trinidad & Tobago showed the least degree of dispersion and variation in the
individual values as compared to samples from the others whose values were much
dispersed and varied.
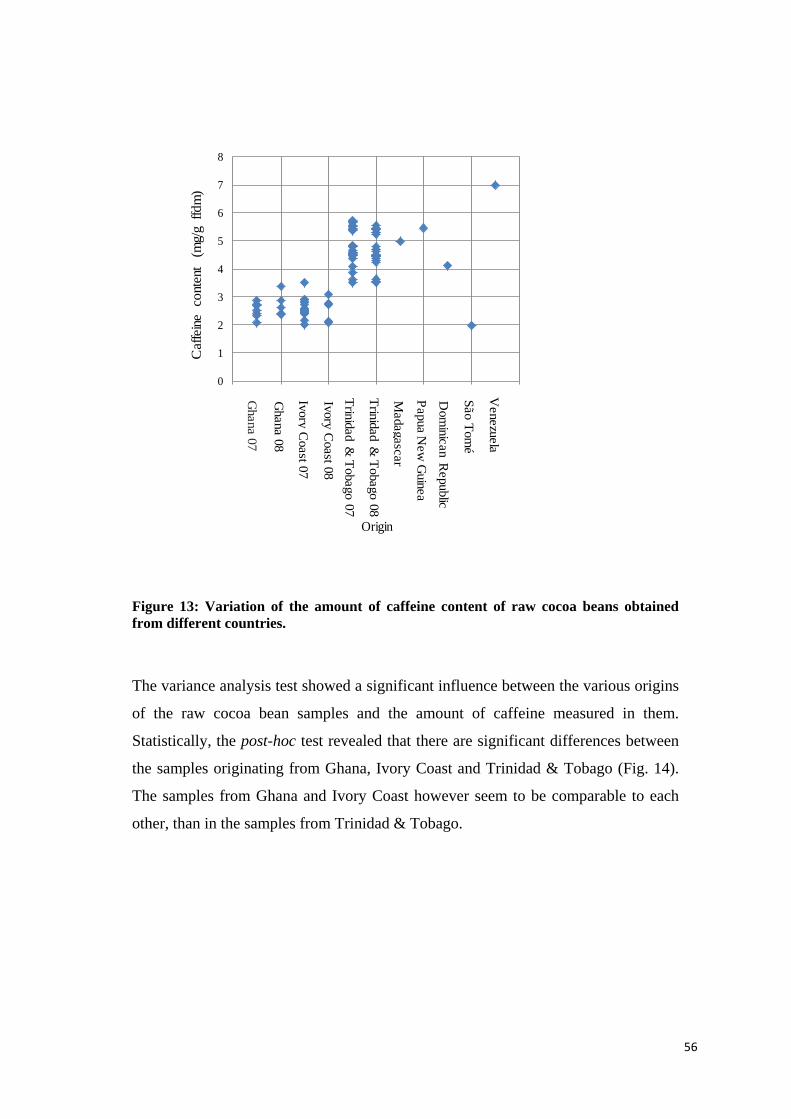
56
0
1
2
3
4
5
6
7
8
Caf
feine
con
tent
(m
g/g
ffdm
)
Ghana
07
Ghana
08
Ivory Coast 07
Ivory Coast 08
Trinidad & Tobago 07
Trinidad & Tobago 08
Madagascar
PapuaN
ew G
uinea
Dom
inicanR
epublic
São Tomé
Venezuela
Origin
Figure 13: Variation of the amount of caffeine content of raw cocoa beans obtained from different countries.
The variance analysis test showed a significant influence between the various origins
of the raw cocoa bean samples and the amount of caffeine measured in them.
Statistically, the post-hoc test revealed that there are significant differences between
the samples originating from Ghana, Ivory Coast and Trinidad & Tobago (Fig. 14).
The samples from Ghana and Ivory Coast however seem to be comparable to each
other, than in the samples from Trinidad & Tobago.

57
Median 25%-75% Area without outlierGha 07
Gha 08IvCoast 07
IvCoast 08Tri 07
Tri 08
0
1
2
3
4
5
6
Caffe
in c
onte
nt (m
g/g
ffdm
)
a ab b b b
Figure 14: Comparison of caffeine content in raw cocoa bean samples.
The diagram shows the median (□), the 25-75 percentile and the outlier (◦) for all origin of samples with n ≥ 4. The different letters on each box plot represent significant differences between the mean values of the various origins of samples for an error probability of p < 0.05 (post-hoc-Test: LSD Test after ANOVA, n ≥ 4).
4.2.3.3 Ratio of theobromine to caffeine (T/C) value
The ratio of the theobromine to caffeine value calculated in all the raw cocoa bean
samples were found to be between 2.9 and 15.6 mg/g ffdm with a corresponding
mean value of 7.79 and a standard deviation of 0.91 mg/g ffdm respectively (Fig.15).
Most of the samples from Ghana and Ivory Coast showed higher theobromine to
caffeine ratio, as most of these values were far above the mean value of the samples.
The sample from São Tomé also recorded a high value. Low values were recorded in
the samples from Trinidad & Tobago, Madagascar, Papua New Guinea and also
Venezuela.

58
Figure 15: Variation of the theobromine to caffeine ratio of raw cocoa beans obtained from different countries.
As expected, the variance analysis test showed a significant influence between the
various origins of the raw cocoa bean samples and the calculated theobromine to
caffeine ratios. Statistically, the post-hoc test revealed that there are significant
differences between the samples originating from Ghana, Ivory Coast and Trinidad
& Tobago (Fig. 16). Whereas the values obtained for the samples originating from
Ghana and Ivory Coast could be comparable statistically to some degree, the same
cannot be said for values for Trinidad & Tobago which showed a low representation.
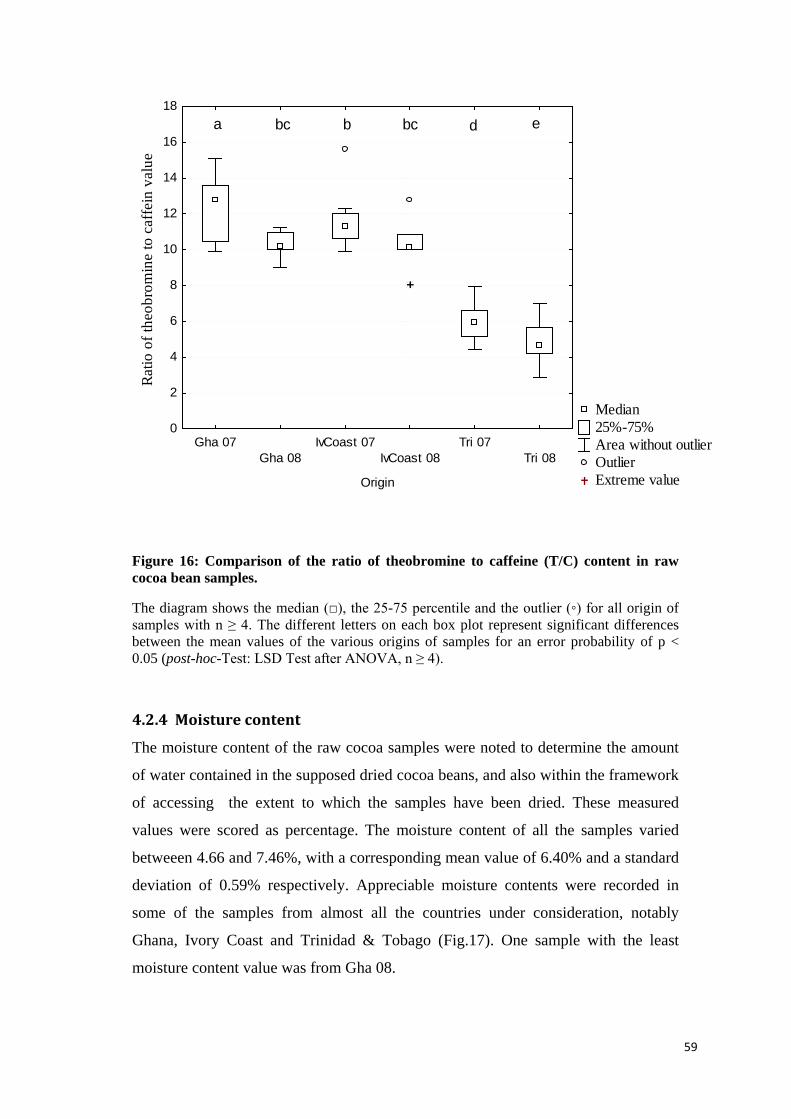
59
Median 25%-75% Area without outlier Outlier Extreme value
Gha 07Gha 08
IvCoast 07IvCoast 08
Tri 07Tri 08
Origin
0
2
4
6
8
10
12
14
16
18
Ratio
of t
heob
rom
ine
to c
affe
in v
alue
a bbc bc d e
Figure 16: Comparison of the ratio of theobromine to caffeine (T/C) content in raw cocoa bean samples.
The diagram shows the median (□), the 25-75 percentile and the outlier (◦) for all origin of samples with n ≥ 4. The different letters on each box plot represent significant differences between the mean values of the various origins of samples for an error probability of p < 0.05 (post-hoc-Test: LSD Test after ANOVA, n ≥ 4).
4.2.4 Moisture content
The moisture content of the raw cocoa samples were noted to determine the amount
of water contained in the supposed dried cocoa beans, and also within the framework
of accessing the extent to which the samples have been dried. These measured
values were scored as percentage. The moisture content of all the samples varied
betweeen 4.66 and 7.46%, with a corresponding mean value of 6.40% and a standard
deviation of 0.59% respectively. Appreciable moisture contents were recorded in
some of the samples from almost all the countries under consideration, notably
Ghana, Ivory Coast and Trinidad & Tobago (Fig.17). One sample with the least
moisture content value was from Gha 08.
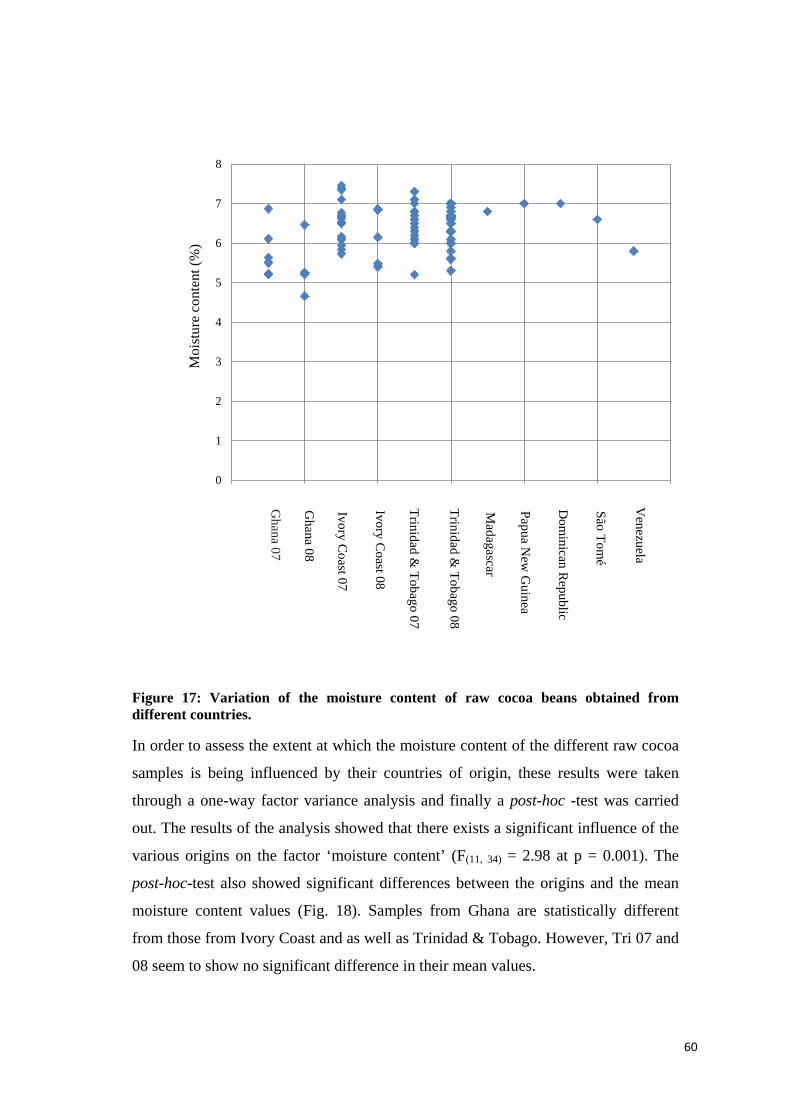
60
0
1
2
3
4
5
6
7
8
Moi
stur
e co
nten
t (%
)
Ghana
07
Ghana
08
Ivory Coast 07
Ivory Coast 08
Trinidad & Tobago 07
Trinidad & Tobago 08
Madagascar
PapuaN
ew G
uinea
Dom
inicanR
epublic
São Tomé
Venezuela
Figure 17: Variation of the moisture content of raw cocoa beans obtained from different countries.
In order to assess the extent at which the moisture content of the different raw cocoa
samples is being influenced by their countries of origin, these results were taken
through a one-way factor variance analysis and finally a post-hoc -test was carried
out. The results of the analysis showed that there exists a significant influence of the
various origins on the factor ‘moisture content’ (F(11, 34) = 2.98 at p = 0.001). The
post-hoc-test also showed significant differences between the origins and the mean
moisture content values (Fig. 18). Samples from Ghana are statistically different
from those from Ivory Coast and as well as Trinidad & Tobago. However, Tri 07 and
08 seem to show no significant difference in their mean values.

61
Median 25%-75% Area without outlier Outlier Extreme value
Gha 07Gha 08
IvCoast 07IvCoast 08
Tri 07Tri 08
Origin
0
1
2
3
4
5
6
7
8
Moi
sture
con
tent
(%)
a a abc d
Figure 18: Comparison of moisture content in raw cocoa bean samples.
The diagram shows the median (□), the 25-75 percentile and the outlier (◦) for all origin of samples with n ≥ 4. The different letters on each box plot represent significant differences between the mean values of the various origins of samples for an error probability of p < 0.05 (post-hoc-Test: LSD Test after ANOVA, n ≥ 4).
4.2.5 Fermentation index value
The fermentation index values of the various cocoa bean samples were measured as
values obtained from the ratios of the absorbances at 460 nm and 530 nm
respectively of the samples to provide information on the extent of the fermentation
process. Variations within these ratios were observed to be between 0.12 and 1.69,
with a corresponding mean value of 1.12 and a standard deviation of 0.29
respectively (Fig. 19). High fermentation index values could be traced to samples
from Trinidad & Tobago. Madagascar, Papua New Guinea, Dominican Republic,
Sào Tomé and Venezuela also recorded some high fermentation index values. A
sample with the least value was recorded in Ghana 07.
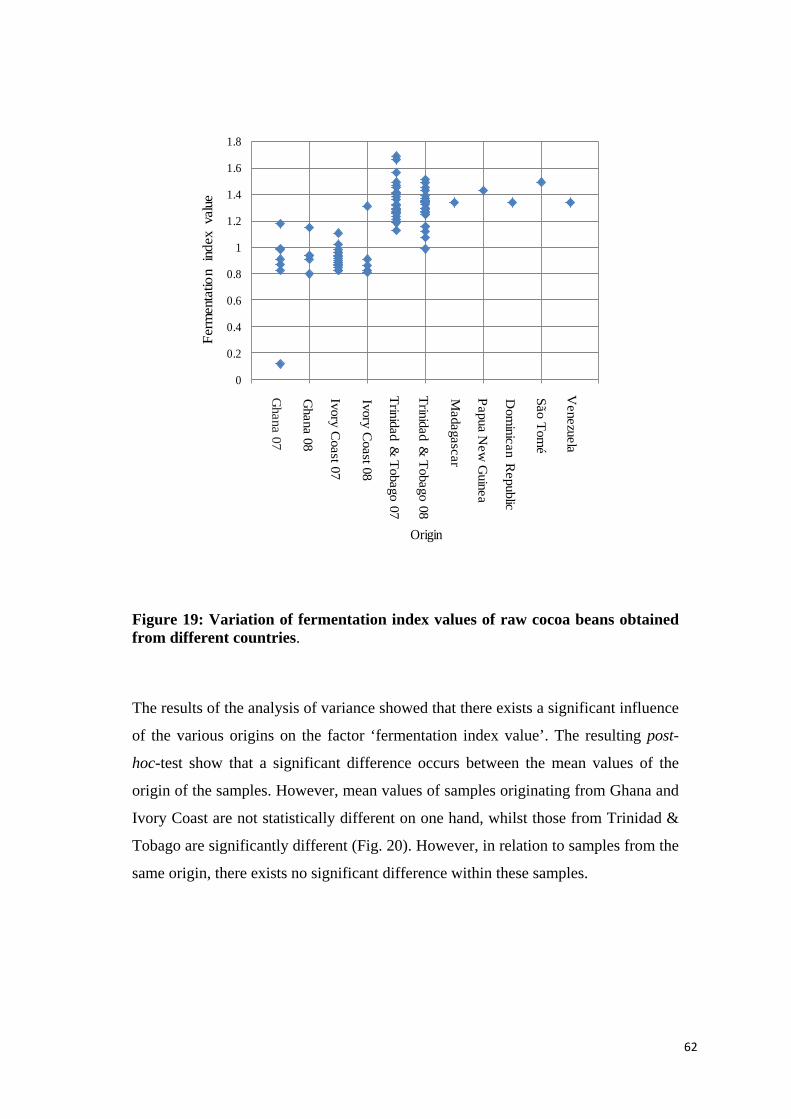
62
0
0.2
0.4
0.6
0.8
1
1.2
1.4
1.6
1.8
Ferm
enta
tion
inde
x va
lue
Ghana
07
Ghana
08
Ivory Coast 07
Ivory Coast 08
Trinidad & Tobago 07
Trinidad & Tobago 08
Madagascar
PapuaN
ew G
uinea
Dom
inicanR
epublic
São Tomé
Venezuela
Origin
Figure 19: Variation of fermentation index values of raw cocoa beans obtained from different countries.
The results of the analysis of variance showed that there exists a significant influence
of the various origins on the factor ‘fermentation index value’. The resulting post-
hoc-test show that a significant difference occurs between the mean values of the
origin of the samples. However, mean values of samples originating from Ghana and
Ivory Coast are not statistically different on one hand, whilst those from Trinidad &
Tobago are significantly different (Fig. 20). However, in relation to samples from the
same origin, there exists no significant difference within these samples.

63
Median 25%-75% Area without outlier Outlier Extreme value
Gha 07Gha 08
IvCoast 07IvCoast 08
Tri 07Tri 08
Origin
0.0
0.2
0.4
0.6
0.8
1.0
1.2
1.4
1.6
1.8Fe
rmen
tatio
n in
dex
valu
e a ab b b b
Figure 20: Comparison of fermentation index values in raw cocoa bean samples.
The diagram shows the median (□), the 25-75 percentile and the outlier (◦) for all origin of samples with n ≥ 4. The different letters on each box plot represent significant differences between the mean values of the various origins of samples for an error probability of p < 0.05 (post-hoc-Test: LSD Test after ANOVA, n ≥ 4).
4.2.6 pH value
Variations within the pH values for the different raw cocoa samples were observed to
be between 5.03 and 5.98, with a corresponding mean value of 5.60 and a standard
deviation of 0.21 respectively (Fig. 21). It is evident from the graph that most of the
measured pH values were above the mean mark. Notable among these samples with
high pH values are from Trinidad & Tobago. Some other individual samples with
high pH values could also be observed to Ghana, Ivory Coast, the Dominican
Republic and Venezuela. In relation to the samples with multiple representations,
variations within individual samples seem to be very much pronounced in Trinidad
& Tobago than in Ghana and Ivory Coast. Most of the samples from Ivory Coast
could also be seen with higher pH values than in Ghana.

64
0
1
2
3
4
5
6
7
8
pH v
alue
Ghana
07
Ghana
08
Ivory Coast 07
Ivory Coast 08
Trinidad & Tobago 07
Trinidad & Tobago 08
Madagascar
PapuaN
ew G
uinea
Dom
inicanR
epublic
São Tomé
Venezuela
Origin
Figure 21: Variation of pH values of raw cocoa beans obtained from different countries.
Comparing the mean pH values in a post-hoc test show that there exist significant
differences between the pH values of the samples and their place of origin (Fig. 22).
The samples from Ghana, Ivory Coast and Trinidad & Tobago cannot therefore be
statistically compared to each other.
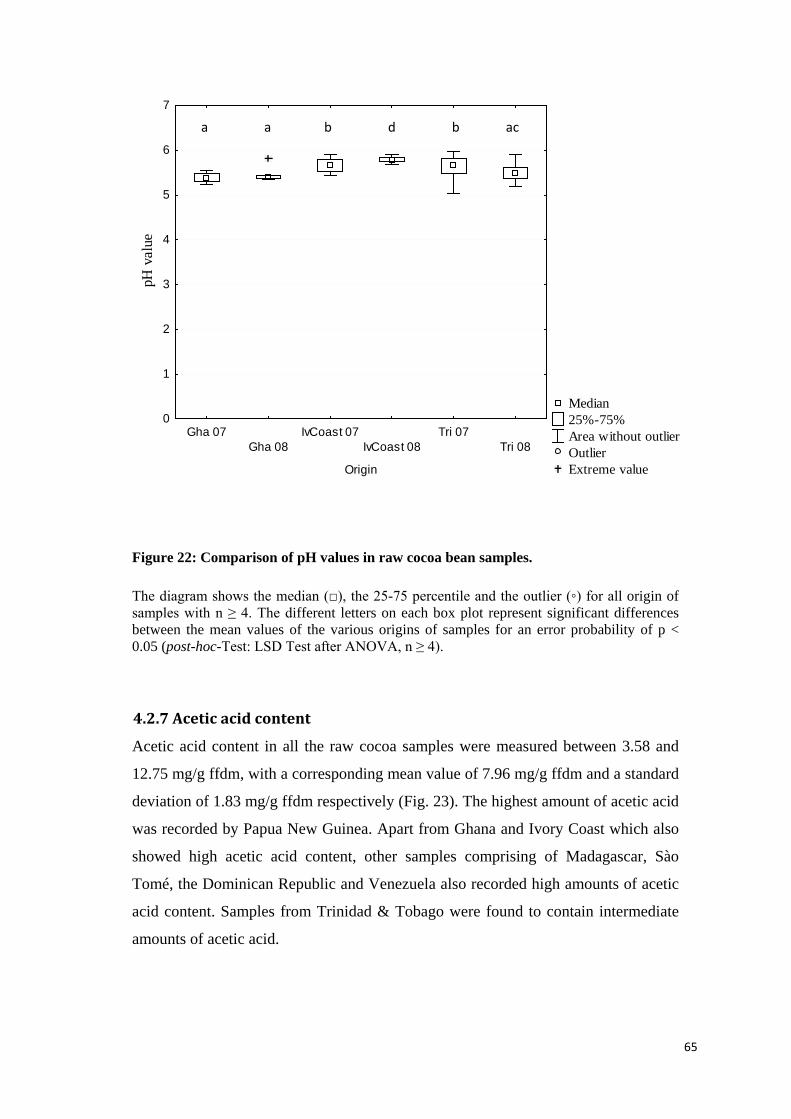
65
Median 25%-75% Area without outlier Outlier Extreme value
Gha 07Gha 08
IvCoast 07IvCoast 08
Tri 07Tri 08
Origin
0
1
2
3
4
5
6
7
pH
val
ue
Figure 22: Comparison of pH values in raw cocoa bean samples.
The diagram shows the median (□), the 25-75 percentile and the outlier (◦) for all origin of samples with n ≥ 4. The different letters on each box plot represent significant differences between the mean values of the various origins of samples for an error probability of p < 0.05 (post-hoc-Test: LSD Test after ANOVA, n ≥ 4).
4.2.7 Acetic acid content
Acetic acid content in all the raw cocoa samples were measured between 3.58 and
12.75 mg/g ffdm, with a corresponding mean value of 7.96 mg/g ffdm and a standard
deviation of 1.83 mg/g ffdm respectively (Fig. 23). The highest amount of acetic acid
was recorded by Papua New Guinea. Apart from Ghana and Ivory Coast which also
showed high acetic acid content, other samples comprising of Madagascar, Sào
Tomé, the Dominican Republic and Venezuela also recorded high amounts of acetic
acid content. Samples from Trinidad & Tobago were found to contain intermediate
amounts of acetic acid.
a a b d b ac

66
Figure 23: Variation of the amount of acetic acid content of raw cocoa beans obtained from different countries.
In order to assess the extent at which the varying amount of acetic acid in the
different raw cocoa samples is being influenced by their countries of origin, these
results were taken through a one-way factor variance analysis and finally a post-hoc -
test was carried out. The results of the analysis showed that there exists a significant
influence of the samples on the factor ‘acetic acid content’ (F(11, 34) = 2.98 at p =
0.001). The post-hoc test also showed a significant difference between the mean
acetic acid content and their origins. This implies that statistically, acetic acid content
in samples from Ghana, Ivory Coast and Trinidad & Tobago are significantly
different and hence incomparable to one another (Fig. 24). Tri 07 and Tri 08 could be
comparable to each other to some extent.
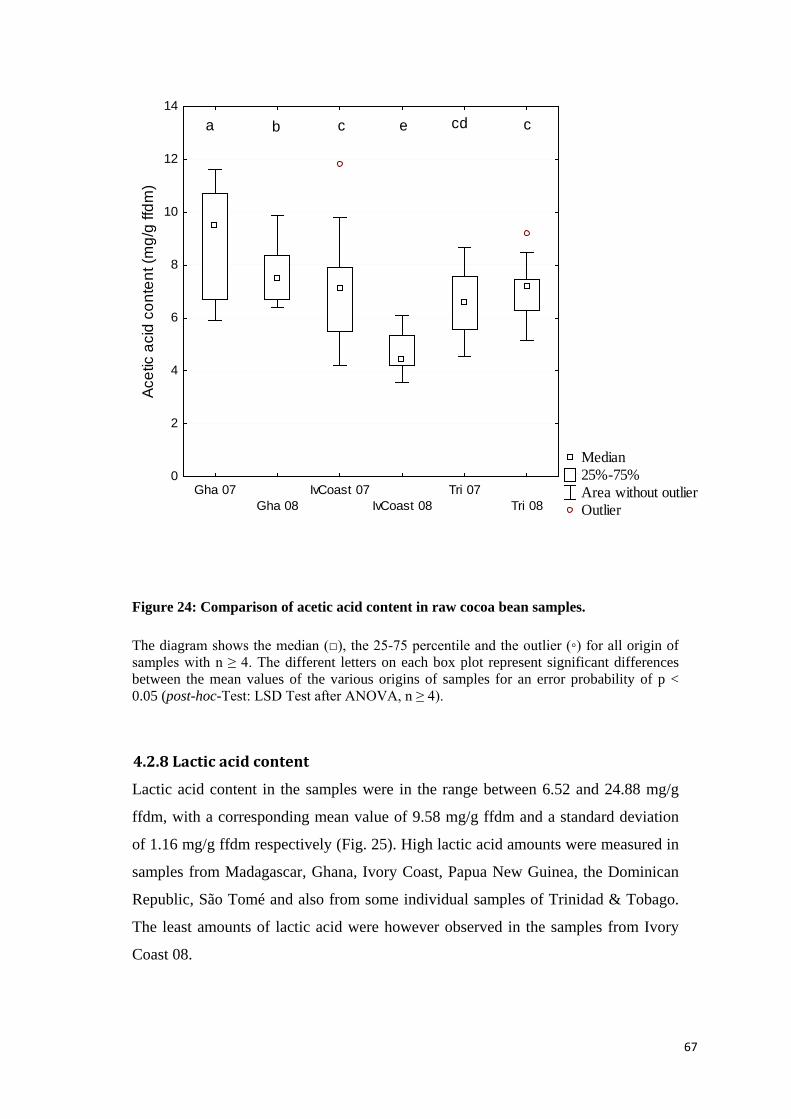
67
Median 25%-75% Area without outlier Outlier
Gha 07Gha 08
IvCoast 07IvCoast 08
Tri 07Tri 08
0
2
4
6
8
10
12
14
Acet
ic a
cid
cont
ent (
mg/
g ffd
m)
a b c ccde
Figure 24: Comparison of acetic acid content in raw cocoa bean samples.
The diagram shows the median (□), the 25-75 percentile and the outlier (◦) for all origin of samples with n ≥ 4. The different letters on each box plot represent significant differences between the mean values of the various origins of samples for an error probability of p < 0.05 (post-hoc-Test: LSD Test after ANOVA, n ≥ 4).
4.2.8 Lactic acid content
Lactic acid content in the samples were in the range between 6.52 and 24.88 mg/g
ffdm, with a corresponding mean value of 9.58 mg/g ffdm and a standard deviation
of 1.16 mg/g ffdm respectively (Fig. 25). High lactic acid amounts were measured in
samples from Madagascar, Ghana, Ivory Coast, Papua New Guinea, the Dominican
Republic, São Tomé and also from some individual samples of Trinidad & Tobago.
The least amounts of lactic acid were however observed in the samples from Ivory
Coast 08.

68
Figure 25: Variation of the amount of lactic acid content of raw cocoa beans obtained from different countries.
The mean values of the lactic acid content from the different origins reveal a
significant difference between the samples (Fig. 26). The results also show that the
samples from Ghana, Ivory Coast and Trinidad & Tobago are statistically different
from one another. The origins of the different samples therefore exert a significant
influence on the variable, ‘lactic acid content’.

69
Median 25%-75% Area without outlier
Gha 07Gha 08
IvCoast 07IvCoast 08
Tri 07Tri 08
Origin
0
2
4
6
8
10
12
14
16
18
20
22
24
Lact
ic a
cid
cont
ent (
mg/
g ffd
m)
a bc cde
Figure 26: Comparison of lactic acid content in raw cocoa bean samples.
The diagram shows the median (□), the 25-75 percentile and the outlier (◦) for all origin of samples with n ≥ 4. The different letters on each box plot represent significant differences between the mean values of the various origins of samples for an error probability of p < 0.05 (post-hoc-Test: LSD Test after ANOVA, n ≥ 4).
4.2.9 Free amino acid content
The sum of the different free amino acids in the samples were in the range between
11.1 and 29.8 mg/g ffdm, with a corresponding mean value of 17.58 mg/g ffdm and a
standard deviation of 1.9 mg/g ffdm respectively (Fig. 27). Samples from Trinidad &
Tobago showed relatively higher amino acid composition, as compared to samples
from Ghana and the Ivory Coast. The same can also be said of the supposed fine-
cocoa producing regions such as Venezuela, Papua New Guinea, the Dominican
Republic and Sào Tomé. Some samples from Trinidad & Tobago and Ivory Coast 07
were also found to contain least amounts of free amino acids; and Madagascar
recorded the lowest composition of free amino acids. Samples from Ghana and the
Ivory Coast showed average amounts of free amino acids between 12 and 18 mg/g
ffdm.

70
Figure 27: Sum of all free amino acids (excluding GABA) in raw cocoa bean samples.
In order to assess the extent at which the sum of the various free amino acids in the
different raw cocoa samples is being influenced by their countries of origin, these
results were taken through a one-way factor variance analysis and finally a post-hoc -
test was carried out (Fig. 28). The results of the analysis showed that there exists a
significant influence of the samples on the factor ‘sum of all free amino acid content’
(F(12, 36) = 2.98 at p = 0.001). The post-hoc test also showed a significant difference
between the sum of all free amino acid from Trinidad & Tobago on one hand and
those from the African origins namely Ghana and the Ivory Coast. Statistically, the
results did not show much significant difference between these two African cocoa
producing countries.

71
Median 25%-75% Area without outlierGha 07
Gha 08IvCoast 07
IvCoast 08Tri 07
Tri 08
0
5
10
15
20
25
30
35
Sum
of a
ll fre
e am
ino
acid
s, ex
clud
ing
GA
BA (m
g/g
ffdm
)abc ccd cd
Figure 28: Comparison of the sum of all free amino acid content in raw cocoa bean samples.
The diagram shows the median (□), the 25-75 percentile and the outlier (◦) for all origin of samples with n ≥ 4. The different letters on each box plot represent significant differences between the mean values of the various origins of samples for an error probability of p < 0.05 (post-hoc-Test: LSD Test after ANOVA, n ≥ 4).
4.2.9.1 Individual amounts of free amino acids
The content of the individual free amino acids showed varying values between a
minimum of 0 and a maximum of 4.49 mg/g ffdm. (Fig. 29). Free amino acids that
were found to be predominant in the raw cocoa samples were mainly leucine,
phenylalanine, lysine, aspartic acid and alanine. Free amino acids such as arginine
and histidine also seemed to be in appreciable proportions in the raw cocoa bean
samples. On the other hand minute proportions or traces of amino acids such as
glycine, methionine and threonine were also observed in the raw cocoa bean sample
lots.

72
Median 25%-75% Area without outlier
AlaArg
AsnAsp
GluGly
HisIle
LeuLys
MetPhe
SerThr
TrpTyr
Val-1
0
1
2
3
4
5Va
lue
of in
divi
dual
free
am
ino
acid
s co
nten
t (m
g/g
ffdm
)
Figure 29: Comparison of the individual free amino acids content in raw cocoa bean samples.
The diagram shows the median (□), the 25-75 percentile and the outlier (◦) for all origin of samples with n ≥ 4. The different letters on each box plot represent significant differences between the mean values of the various origins of samples for an error probability of p < 0.05 (post-hoc-Test: LSD Test after ANOVA, n ≥ 4).
4.2.9.2 Classification of free amino acids
In order to generate more characteristics and observations, the various free amino
acids were grouped according to the Kirchhoff´s system of classification (1989a).
That system of classification puts the various free amino acids into distinct groups as
follows:
Group 1: Hydrophobic amino acids; made up of alanine, leucine, phenylalanine,
valine, tyrosine and isoleucine.
Group 2: Asparagine, aspartic acid, glutamine, glutamic acid and histidine make up
the acidic amino acids.
c d d ef d g e e a d g b e ef g d d

73
Group 3: This group is made up of free amino acids that do not belong to either
group 1 or 2 and these are termed the ‘other free amino acids’ group. Tryptophan,
lysine, serine, glycine, arginine and threonine belong to this group.
The mean values of these free amino acids under this criterion of classification have
been graphically represented in Fig. 30 to Fig. 33.
0.00
2.00
4.00
6.00
8.00
10.00
12.00
14.00
16.00
18.00
Gha01/07
Gha02/07
Gha03/07
Gha04/07
Gha05/07
Gha06/07
Gha07/07
Gha01/08
Gha02/08
Gha03/08
Gha04/08
Gha05/08
Free
am
ino
acid
s con
tent
(mg/
g ff
dm)
Ile
Val
Tyr
Phe
Leu
Ala
Thr
Arg
Gly
Ser
Lys
Glu
Asn
Asp
Figure 30: Comparison of mean values of the individual free amino acid content in raw cocoa bean samples from Ghana. The acidic free amino acid group has been represented in black, the other free amino acid group in red and the hydrophobic group of free amino acids is designated in blue.
Legend:
Gha 01/07 denotes sample 1 of year 07
Gha 01/08 denotes sample 1 of year 08

74
0.00
2.00
4.00
6.00
8.00
10.00
12.00
14.00
16.00
18.00
IvCo
ast 0
3/07
IvCo
ast 0
6/07
IvCo
ast 0
7/07
IvCo
ast 0
8/07
IvCo
ast 0
9/07
IvCo
ast 1
0/07
IvCo
ast 1
1/07
IvCo
ast 1
2/07
IvCo
ast 1
3/07
IvCo
ast 1
4/07
IvCo
ast 1
5/07
IvCo
ast 1
6/07
IvCo
ast 1
7/07
IvCo
ast 0
1/08
IvCo
ast 0
2/08
IvCo
ast 0
3/08
IvCo
ast 0
4/08
IvCo
ast 0
5/08
Free
am
ino
acid
s con
tent
(mg/
g ffd
m)
Ile
Val
Tyr
Phe
Leu
Ala
Thr
Arg
Gly
Ser
Lys
Glu
Asn
Asp
Figure 31: Comparison of mean values of the individual free amino acid content in raw cocoa bean samples from the Ivory Coast. The acidic free amino acid group has been represented in black, the other free amino acid group in red and the hydrophobic group of free amino acids is designated in blue.
Legend:
IvCoast 03/07 denotes sample 3 of year 07
IvCoast 01/08 denotes sample 1 of year 08
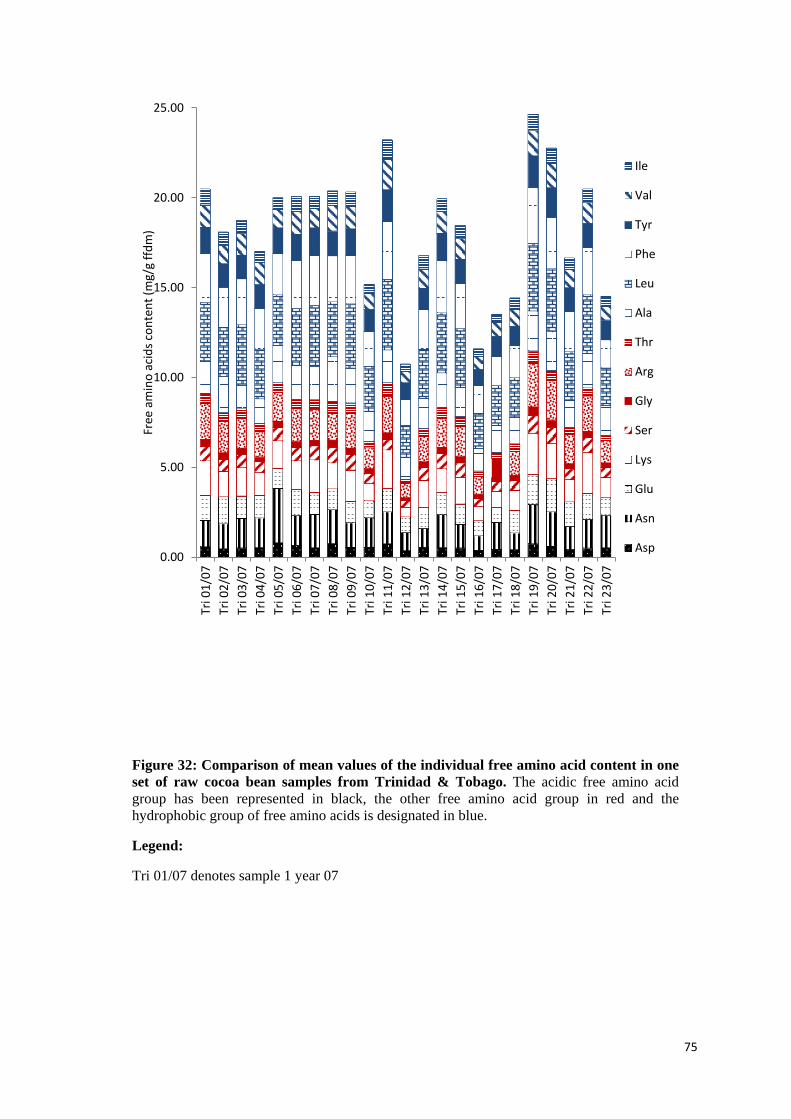
75
0.00
5.00
10.00
15.00
20.00
25.00
Tri 0
1/07
Tri 0
2/07
Tri 0
3/07
Tri 0
4/07
Tri 0
5/07
Tri 0
6/07
Tri 0
7/07
Tri 0
8/07
Tri 0
9/07
Tri 1
0/07
Tri 1
1/07
Tri 1
2/07
Tri 1
3/07
Tri 1
4/07
Tri 1
5/07
Tri 1
6/07
Tri 1
7/07
Tri 1
8/07
Tri 1
9/07
Tri 2
0/07
Tri 2
1/07
Tri 2
2/07
Tri 2
3/07
Free
am
ino
acid
s con
tent
(mg/
g ffd
m)
Ile
Val
Tyr
Phe
Leu
Ala
Thr
Arg
Gly
Ser
Lys
Glu
Asn
Asp
Figure 32: Comparison of mean values of the individual free amino acid content in one set of raw cocoa bean samples from Trinidad & Tobago. The acidic free amino acid group has been represented in black, the other free amino acid group in red and the hydrophobic group of free amino acids is designated in blue.
Legend:
Tri 01/07 denotes sample 1 year 07

76
0.00
10.00
20.00
30.00
40.00
50.00
60.00
Free
am
ino
acid
s con
tent
(mg/
g ffd
m)
Ile
Val
Tyr
Phe
Leu
Ala
Thr
Arg
Gly
Ser
Lys
Glu
Asn
Asp
Figure 33: Comparison of mean values of the individual free amino acid content in a second set of raw cocoa bean samples from Trinidad & Tobago. The acidic free amino acid group has been represented in black, the other free amino acid group in red and the hydrophobic group of free amino acids is designated in blue.
Legend:
Tri 01/08 denotes sample 1 year 08
There exists a fairly-balanced distribution of the mean content of individual free
amino acids in raw cocoa bean samples originating from Ghana (Fig.30). This
pattern of distribution can also be observed in raw cocoa bean samples from the
Ivory Coast (Fig. 31). Those from Trinidad & Tobago however show a slight

77
departure from this even distribution, as the content of the free amino acids begin to
show fluctuations in value (Fig. 32). And these fluctuations become even more
pronounced in the second lot of raw cocoa bean samples (Fig. 33), where there exists
an uneven distribution of free amino acid with some few samples having very high
values. An explanation for this irregularity is however not readily known.
4.2.9.3 Group 1: Hydrophobic amino acids-alanine, leucine, phenylalanine,
tyrosine, valine and isoleucine
Using leucine as an example, the characteristic of the hydrophobic amino acid group
was studied. Leucine content in the raw cocoa bean samples was found to be between
0.97 and 7.11 mg/g ffdm (Fig. 34). Higher leucine content was observed in samples
from Trinidad & Tobago. On the other hand, least amounts were also found in some
raw cocoa samples from the Dominican Republic and Sào Tomé.

78
0
1
2
3
4
5
6
7
8
Leuc
ine c
onte
nt (
mg/
g ffd
m)
Ghana
07
Ghana
08
Ivory Coast 07
Ivory Coast 08
Trinidad & Tobago 07
Trinidad & Tobago 08
Madagascar
PapuaN
ew G
uinea
Dom
inicanR
epublic
São Tomé
Venezuela
Origin
Figure 34: Variation of the amount of leucine in raw cocoa bean samples obtained from different countries.
The variance analysis test of these observations showed that there exist a significant
effect between the origins of the samples and the leucine content. The resulting post-
hoc-test show that a significant difference occurs between the mean values of the
origin of the samples. However, mean values of samples originating from Ghana and
Ivory Coast are not statistically different on one hand, whilst those from Trinidad &
Tobago are significantly different from these two neighbouring countries (Fig. 35
and 36). The variance analysis was also performed for the contents of the samples in
mmol/g ffdm. This range allows estimating the molecular percentage of the
respective free amino acids per storage protein.

79
Median 25%-75% Area without outlier Outlier
Gha 07Gha 08
IvCoast 07IvCoast 08
Tri 07Tri 08
0
1
2
3
4
5
6
7
8Le
ucin
e co
nten
t (m
g/g
ffdm
)aabb b b
Figure 35: Comparison of the leucine content (mg/g ffdm) in raw cocoa bean samples.
The diagram shows the median (□), the 25-75 percentile and the outlier (◦) for all origin of samples with n ≥ 4. The different letters on each box plot represent significant differences between the mean values of the various origins of samples for an error probability of p < 0.05 (post-hoc-Test: LSD Test after ANOVA, n ≥ 4).

80
Median 25%-75% Area without outlier Outlier
Gha 07Gha 08
IvCoast 07IvCoast 08
Tri 07Tri 08
0.00
0.01
0.02
0.03
0.04
0.05
0.06
Leuc
ine
cont
ent (
mm
ol/g
ffdm
)aab b b b
Figure 36: Comparison of the leucine content (mmol/g ffdm) in raw cocoa bean samples.
The diagram shows the median (□), the 25-75 percentile and the outlier (◦) for all origin of samples with n ≥ 4. The different letters on each box plot represent significant differences between the mean values of the various origins of samples for an error probability of p < 0.05 (post-hoc-Test: LSD Test after ANOVA, n ≥ 4).
4.2.9.4: Group 2: Acidic free amino acids-Asparagine, aspartic acid,
glutamine, glutamic acid and histidine
Asparagine was chosen to represent the second group of acidic free amino acids. The
content of this free amino acid was found to be between 0.61 and 4.46 mg/g ffdm
respectively (Fig. 37). High contents of asparagine were recorded in some samples
from Trinidad & Tobago; whiles least amounts were observed in samples from
Trinidad & Tobago and the Dominican Republic. Generally, all other samples were

81
observed to contain less than 2 mg/g ffdm asparagine content with a higher
frequency.
0
0.5
1
1.5
2
2.5
3
3.5
4
4.5
5
Asp
arag
ine
cont
ent (
mg/
g ffd
m)
Ghana
07
Ghana
08
Ivory Coast 07
Ivory Coast 08
Trinidad & Tobago 07
Trinidad & Tobago 08
Madagascar
PapuaN
ew G
uinea
Dom
inicanR
epublic
São Tomé
Venezuela
Origin
Figure 37: Variation of the amount of asparagine in raw cocoa bean samples obtained from different countries.
In order to assess the extent at which the varying amount of asparagine in the
different raw cocoa samples is being influenced by their countries of origin, these
results were taken through a one-way factor variance analysis and finally a post-hoc -
test was carried out. The results of the analysis showed that there exists a significant
influence of the samples on the factor ‘asparagine’ (F(11, 34) = 2.98 at p = 0.001). The
post-hoc test also showed a significant difference between the asparagine content and
their origins. Statistically, asparagine content in samples from Ivory Coast and Ghana
were not so significantly different from each other. However, these two countries
showed significant difference with Trinidad & Tobago and hence uncomparable to
these set of samples respectively (Fig. 38 and 39).

82
Median 25%-75% Area without outlier Outlier Extreme value
Gha 07Gha 08
IvCoast 07IvCoast 08
Tri 07Tri 08
Origin
0.0
0.5
1.0
1.5
2.0
2.5
3.0
3.5
4.0
4.5
5.0
Asp
arag
ine
cocn
tent
(mg/
g ffd
m)
aabb bb
Figure 38: Comparison of the asparagine content (mmol/g ffdm) in raw cocoa bean samples.
The diagram shows the median (□), the 25-75 percentile and the outlier (◦) for all origin of samples with n ≥ 4. The different letters on each box plot represent significant differences between the mean values of the various origins of samples for an error probability of p < 0.05 (post-hoc-Test: LSD Test after ANOVA, n ≥ 4).

83
Median 25%-75% Area without outlier Outlier
Gha 07Gha 08
IvCoast 07IvCoast 08
Tri 07Tri 08
0.000
0.005
0.010
0.015
0.020
0.025
0.030
0.035
0.040
Asp
arag
ine
cont
ent (
mm
ol/g
ffdm
)aab b b b
Figure 39: Comparison of asparagine content (mmol/g ffdm) in raw cocoa bean samples. The diagram shows the median (□), the 25-75 percentile and the outlier (◦) for all origin of samples with n≥ 4. The different alphabets on each box plot represents the significant difference between the mean values of the various origins of samples for an error probability of p< 0.05 (post-hoc-Test: LSD Test after ANOVA, n≥4).
4.2.9.5: Group 3: Other free amino acids-Tryptophan, lysine, serine, glycine,
arginine and threonine
Lysine was chosen to represent the third group of other free amino acids. Lysine
content in the raw cocoa bean samples was found to be between 0 and 2.83 mg/g
ffdm (Fig. 40). Higher lysine content was observed in samples from Trinidad &
Tobago and Ivory Coast. On the other hand, least amounts were also found in some
raw cocoa bean samples from Ivory Coast and Trinidad & Tobago.

84
0
0.5
1
1.5
2
2.5
3
3.5Ly
sine
con
tent
(mg/
g ff
dm)
Ghana
07
Ghana
08
Ivory Coast 07
Ivory Coast 08
Trinidad & Tobago 07
Trinidad & Tobago 08
Madagascar
PapuaN
ew G
uinea
Dom
inicanR
epublic
São Tomé
Venezuela
Figure 40: Variation of the amount of lysine in raw cocoa bean samples obtained from different countries.
The variance analyses test of these observations showed that there exists a significant
effect between the origins of the samples and the lysine content. The resulting post-
hoc-test shows that a significant difference occurs between the mean values of the
lysine content and the origin of the samples. However, mean values of samples
originating from Ghana and Trinidad & Tobago are not statistically different on one
hand, whilst those from Ivory Coast are significantly different from these two
countries (Fig. 41 & 42).

85
Median 25%-75% Area without outlier Outlier Extreme value
Gha 07Gha 08
IvCoast 07IvCoast 08
Tri 07Tri 08
Origin
0.0
0.5
1.0
1.5
2.0
2.5
3.0
3.5
Lysi
ne c
onte
nt (m
g/g
ffdm
)
Figure 41: Comparison of lysine content (mg/g ffdm) in raw cocoa bean samples.
The diagram shows the median (□), the 25-75 percentile and the outlier (◦) for all origin of samples with n ≥ 4. The different letters on each box plot represent significant differences between the mean values of the various origins of samples for an error probability of p < 0.05 (post-hoc-Test: LSD Test after ANOVA, n ≥ 4).
d d a a cd bd

86
Median 25%-75% Area without outlier Outlier
Gha 07Gha 08
IvCoast 07IvCoast 08
Tri 07Tri 08
0.000
0.002
0.004
0.006
0.008
0.010
0.012
0.014
0.016
0.018
0.020
0.022
Lysi
ne c
onte
nt (m
mol
/g ff
dm)
Figure 42: Comparison of lysine content (mmol/g ffdm) in raw cocoa bean samples.
The diagram shows the median (□), the 25-75 percentile and the outlier (◦) for all origin of samples with n ≥ 4. The different letters on each box plot represent significant differences between the mean values of the various origins of samples for an error probability of p < 0.05 (post-hoc-Test: LSD Test after ANOVA, n ≥ 4).
4.2.10 γ-Aminobutyric acid content (GABA value)
The amount of the non-amino acid, γ-aminobutyric acid observed in the raw cocoa
samples was found to be between 4.1 and 9.62% of the total sum of free amino acids
with a mean value of 3.6% and a standard deviation of 3.2% (Fig. 43). High amounts
of GABA values were recorded in the samples from Ghana and Ivory Coast. Even
though some samples from Trinidad and Tobago recorded low GABA values, the
over-all expression was within the average value.
d d a a cd bd

87
0
1
2
3
4
5
6
7
8
9
10A
mou
nt o
f γ-A
min
obut
yric
aci
d co
nten
t (%
)of
the
tota
l sum
of f
ree
amin
o ac
ids
Ghana
07
Ghana
08
Ivory Coast 07
Ivory Coast 08
Trinidad & Tobago 07
Trinidad & Tobago 08
Madagascar
PapuaN
ew G
uinea
Dom
inicanR
epublic
São Tomé
Venezuela
Figure 43: Variation of the amount of GABA (%) of the total sum of free amino acids in raw cocoa bean samples obtained from different countries.
The variance analysis test of these observations showed that there exist a significant
effect between the origins of the samples and the GABA values represented, for
example between Trinidad & Tobago and the samples from Ghana and Ivory Coast
(Fig. 44). The resulting post-hoc-tests show that a significant difference occurs
between the mean values of GABA and the origin of the samples as given before.
Therefore, GABA values obtained from the various samples cannot be comparable to
each other since there is a significant difference in the biosynthesis between GABA
and the proteinogenic free amino acids.
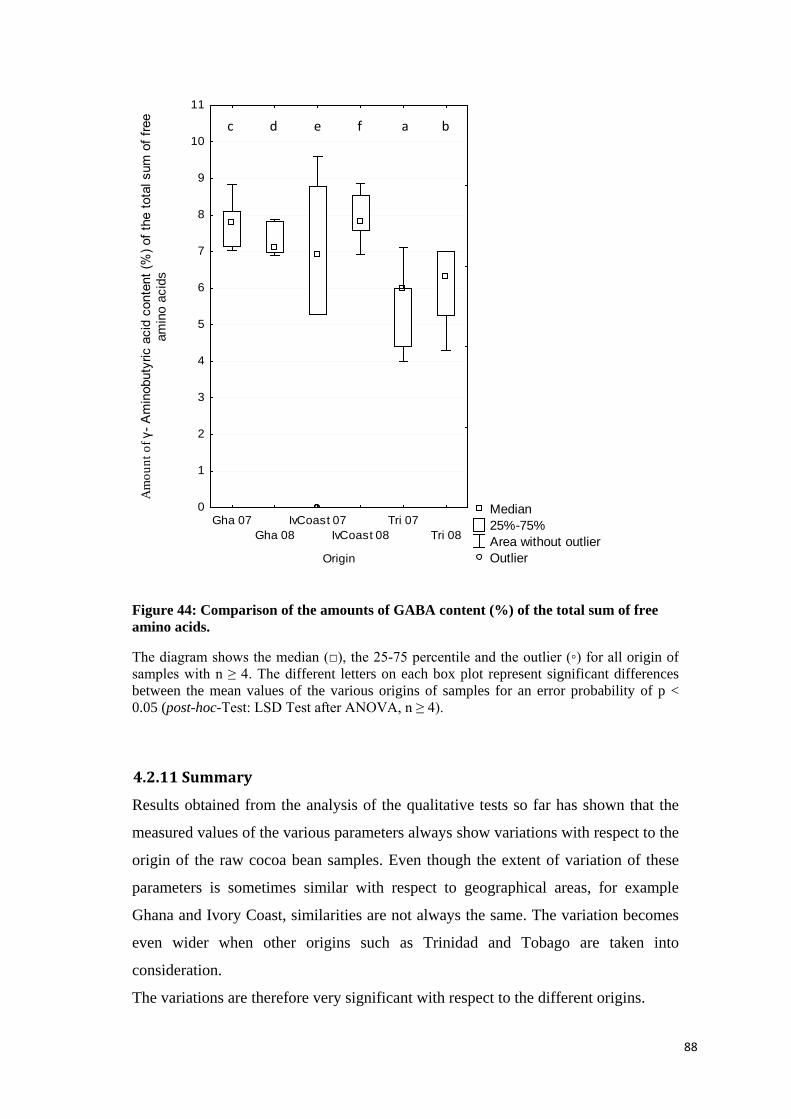
88
Median 25%-75% Area without outlier Outlier
Gha 07Gha 08
IvCoast 07IvCoast 08
Tri 07Tri 08
Origin
0
1
2
3
4
5
6
7
8
9
10
11
Am
ount
of γ
- Am
inob
utyr
ic a
cid
cont
ent (
%) o
f the
tota
l sum
of f
ree
amin
o ac
ids
Figure 44: Comparison of the amounts of GABA content (%) of the total sum of free amino acids.
The diagram shows the median (□), the 25-75 percentile and the outlier (◦) for all origin of samples with n ≥ 4. The different letters on each box plot represent significant differences between the mean values of the various origins of samples for an error probability of p < 0.05 (post-hoc-Test: LSD Test after ANOVA, n ≥ 4).
4.2.11 Summary
Results obtained from the analysis of the qualitative tests so far has shown that the
measured values of the various parameters always show variations with respect to the
origin of the raw cocoa bean samples. Even though the extent of variation of these
parameters is sometimes similar with respect to geographical areas, for example
Ghana and Ivory Coast, similarities are not always the same. The variation becomes
even wider when other origins such as Trinidad and Tobago are taken into
consideration.
The variations are therefore very significant with respect to the different origins.
c d e f a b
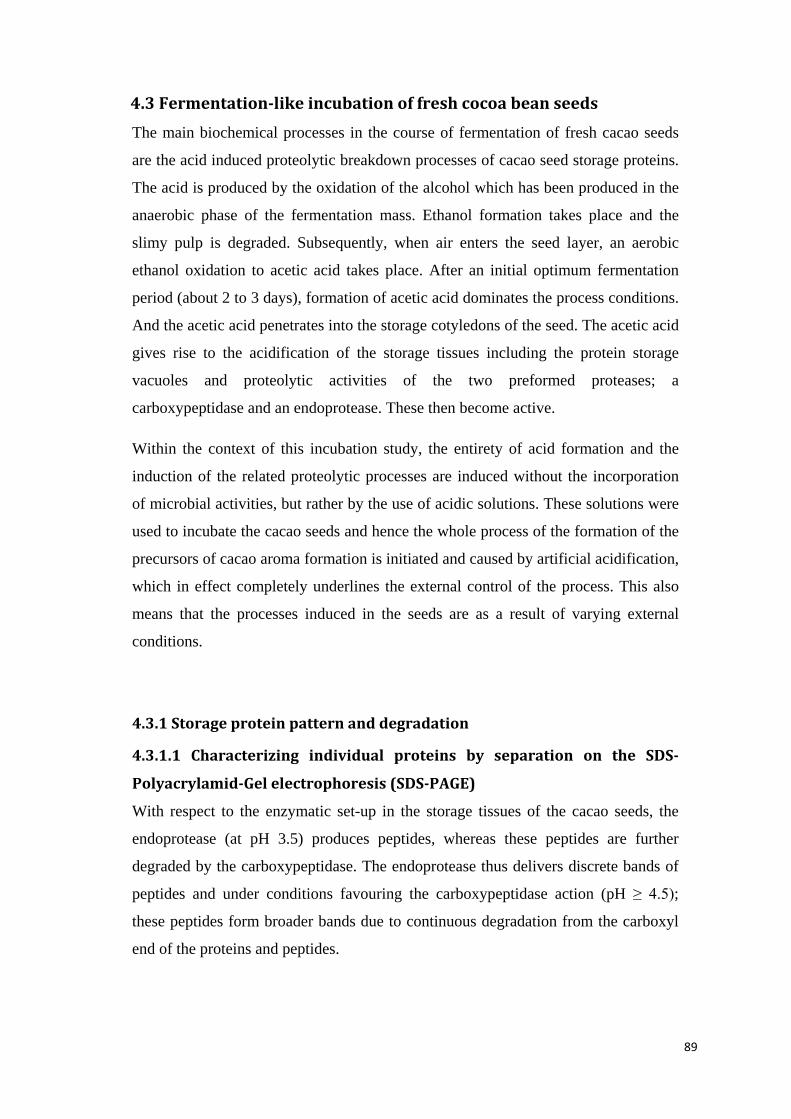
89
4.3 Fermentation-like incubation of fresh cocoa bean seeds The main biochemical processes in the course of fermentation of fresh cacao seeds
are the acid induced proteolytic breakdown processes of cacao seed storage proteins.
The acid is produced by the oxidation of the alcohol which has been produced in the
anaerobic phase of the fermentation mass. Ethanol formation takes place and the
slimy pulp is degraded. Subsequently, when air enters the seed layer, an aerobic
ethanol oxidation to acetic acid takes place. After an initial optimum fermentation
period (about 2 to 3 days), formation of acetic acid dominates the process conditions.
And the acetic acid penetrates into the storage cotyledons of the seed. The acetic acid
gives rise to the acidification of the storage tissues including the protein storage
vacuoles and proteolytic activities of the two preformed proteases; a
carboxypeptidase and an endoprotease. These then become active.
Within the context of this incubation study, the entirety of acid formation and the
induction of the related proteolytic processes are induced without the incorporation
of microbial activities, but rather by the use of acidic solutions. These solutions were
used to incubate the cacao seeds and hence the whole process of the formation of the
precursors of cacao aroma formation is initiated and caused by artificial acidification,
which in effect completely underlines the external control of the process. This also
means that the processes induced in the seeds are as a result of varying external
conditions.
4.3.1 Storage protein pattern and degradation
4.3.1.1 Characterizing individual proteins by separation on the SDS-
Polyacrylamid-Gel electrophoresis (SDS-PAGE)
With respect to the enzymatic set-up in the storage tissues of the cacao seeds, the
endoprotease (at pH 3.5) produces peptides, whereas these peptides are further
degraded by the carboxypeptidase. The endoprotease thus delivers discrete bands of
peptides and under conditions favouring the carboxypeptidase action (pH ≥ 4.5);
these peptides form broader bands due to continuous degradation from the carboxyl
end of the proteins and peptides.
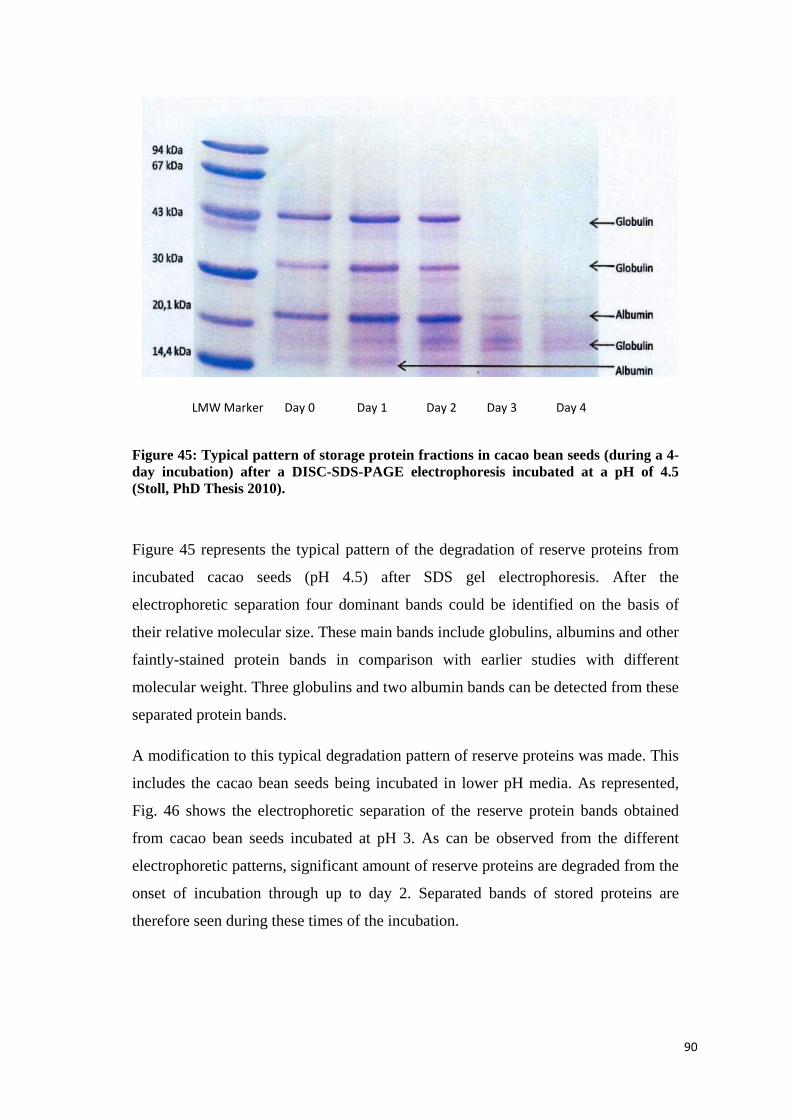
90
Figure 45: Typical pattern of storage protein fractions in cacao bean seeds (during a 4-day incubation) after a DISC-SDS-PAGE electrophoresis incubated at a pH of 4.5 (Stoll, PhD Thesis 2010).
Figure 45 represents the typical pattern of the degradation of reserve proteins from
incubated cacao seeds (pH 4.5) after SDS gel electrophoresis. After the
electrophoretic separation four dominant bands could be identified on the basis of
their relative molecular size. These main bands include globulins, albumins and other
faintly-stained protein bands in comparison with earlier studies with different
molecular weight. Three globulins and two albumin bands can be detected from these
separated protein bands.
A modification to this typical degradation pattern of reserve proteins was made. This
includes the cacao bean seeds being incubated in lower pH media. As represented,
Fig. 46 shows the electrophoretic separation of the reserve protein bands obtained
from cacao bean seeds incubated at pH 3. As can be observed from the different
electrophoretic patterns, significant amount of reserve proteins are degraded from the
onset of incubation through up to day 2. Separated bands of stored proteins are
therefore seen during these times of the incubation.
LMW Marker Day 0 Day 1 Day 2 Day 3 Day 4
LMW Marker Day 0 Day 1 Day 2 Day 3 Day 4

91
LMW Day 0 Day 1 Day 2 Day 3 Day 4 Day 5
Marker
Figure 46: Changes in the storage protein fractions in cacao bean seeds during a 5-day incubation at a pH of 3 (DISC-SDS-PAGE).
4.3.1.2 Polypeptide profile
Acidification during cacao fermentation is critical for final cacao quality since the
different pH optima of endoprotease and carboxypeptidase activities determine
efficiency and products of proteolysis. The outcome is a mixture of hydrophobic and
hydrophilic amino acids, of which the hydrophobic amino acids are important for the
formation of typical cacao aroma flavour notes. During fermentation, there is the
degradation of albumin and globulin species (Biehl and Passern, 1982). The globulin,
with two polypeptides of 47 and 31 kDa (Pettipher 1990; Spencer and Hodge 1992;
Voigt et al., 1993) are also degraded in fermentation. Cocoa-specific aroma
precursors can be generated in vitro from globulin in partially purified bean fractions
by aspartic endoprotease and carboxypeptidase activities (Voigt et al., 1994a).
4.3.1.3: Cotyledon protein degradation.
Cotyledons contain storage proteins which are degraded into peptides and free amino
acids which appear to form the central focus of flavour formation. The consensus is
that the combined action of two proteases, namely aspartic endopeptidase and serine
carboxy-(exo) peptidase lead to the complete degradation of the storage protein into
94 kDa 67 kDa
43 kDa
30 kDa
20.1 kDa
14.4 kDa
Globulin
Globulin
Globulin Albumin
Albumin

92
hydrophilic low molecular peptides and free amino acids. The vicilin (7S) class
globulin (VCG) storage polypeptide yield cocoa-specific precursors. The aspartic
endopeptidase hydrolyses peptide bonds in VCG at hydrophobic amino acid residues
and form hydrophobic oligopeptides, which serve as substrates for the serine
exopeptidase that removes carboxyl terminal hydrophobic amino acid residues (Biehl
et al., 1993; Biehl and Voigt, 1995; Biehl and Voigt, 1999; Voigt et al., 1994b).
Kirchhoff et al., (1989) observed a correlation between free amino acids
accumulation and the generation of specific aroma precursors, with pH-dependent
proteolytic processes. Activities in both key enzymes are pH-dependent, near to pH
3.8, the optimum for aspartic endopeptidase and hence more hydrophobic
oligopeptides and less free amino acids are produced. Whereas when the pH is close
to 5.8, the optimum for serine exopeptidase, there are increases in hydrophilic
oligopeptides and hydrophobic amino acids. Related storage proteins or alternative
peptidases both failed to produce appropriate flavour precursors. With a rapid fall to
low pH (< 4.5), reduction in flavour precursors is observed and a slow diffusion of
organic acids through cotyledons. Timing of initial entry, duration of the period of
optimum pH, and the final pH are crucial for final cacao flavour (Biehl and Voigt,
1999). Thus bean composition interacts with fermentation in the formation of cocoa
flavour quality.
4.3.1.4 Polypeptide spectrum of cacao bean seeds incubated at different
pH levels over a 7-day incubation process.
Hydrolysis of the storage proteins, catalysed by hydrolytic activity of the
aspartylendoprotease results in the production of oligopeptides.
Figure 47 shows the variations of the concentration of the various polypeptides
during the incubation at different pH levels. Variations and comparison of these
peaks are also observed within cacao bean seeds incubated at the same pH value
during the 7-day incubation process. By comparing the peaks obtained from the
HPLC chromatogram, it could be observed that at any particular time during the
incubation period, the relative amounts of polypeptides increase with increasing pH
values prevailing in the incubating media. For instance, after the second day of the
incubation, the amount of polypeptides obtained in cacao beans incubated at pH 3.5,
was observed to be relatively higher than that incubated at pH 3. At pH 5, the

93
concentration of the polypeptides is observed to be even more rapid than in those two
lower pH levels. The greatest amount of polypeptide was then observed in cacao
bean incubated at the pH of 5.5.
By observing the concentration of the polypeptide over the 7-day incubation period,
it also became evident that there was no appreciable amount of polypeptide at the
beginning of the incubation process. This phase is then followed by an initial and
slow build-up of polypeptides, as observed after the first day. After the second day
the buildup of the storage protein is very evident and characterized by an increment
in the amount of polypeptides. Between the second and third days of the incubation
show the greatest amounts of the formation of polypeptide. But then, it can be
established that the concentration of the polypeptides was at its peak only after the
second day, even though the third day of incubation may also seem to possess this
characteristic. Therefore the buildup of the polypeptides is evident between the
second and third days of the incubation process. After the third and subsequent days
of incubation, the buildup of the polypeptides was decreasing rapidly until it became
very insignificant after the sixth and seventh days respectively.
Peaks generated at values of 23.7 and between retention times of 30 and 32 seconds
are obviously resistant to proteolytic degradation. They are obviously not true
oligopeptides.

94
Day 0
AU
0,00
0,50
1,00
1,50
2,00
Minutes10,00 20,00 30,00 40,00 50,00 60,00 70,00
22,3
46
31,2
96
AU
0,00
0,50
1,00
1,50
2,00
Minutes10,00 20,00 30,00 40,00 50,00 60,00 70,00
15,7
51 17,5
48
22,2
34
AU
-0,10
0,00
0,10
0,20
0,30
Minutes10,00 20,00 30,00 40,00 50,00 60,00 70,00
30,9
52
33,9
35
39,1
35
AU
0,00
0,50
1,00
1,50
2,00
Minutes10,00 20,00 30,00 40,00 50,00 60,00 70,00
22,2
07
pH 3 pH 3.5
pH 5 pH 5.5

95
Day 1
AU
0,00
0,50
1,00
1,50
2,00
Minutes10,00 20,00 30,00 40,00 50,00 60,00 70,00
15,7
51 17,5
48
22,2
34
AU
0,00
0,50
1,00
1,50
2,00
Minutes10,00 20,00 30,00 40,00 50,00 60,00 70,00
22,1
38
25,4
01
31,1
51
35,3
07
AU
-0,10
0,00
0,10
0,20
0,30
0,40
0,50
Minutes10,00 20,00 30,00 40,00 50,00 60,00 70,00
18,7
23
21,6
87
22,3
08
23,3
84
23,6
99
29,3
07
30,9
48
32,3
92
33,9
23
34,8
34
39,1
18
AU
-0,10
0,00
0,10
0,20
0,30
0,40
0,50
0,60
Minutes10,00 20,00 30,00 40,00 50,00 60,00 70,00
18,6
64
19,1
10
22,7
25
23,4
76
23,7
16
25,6
15
28,0
99
28,6
46
29,2
64
30,9
63
31,2
37
33,9
17
pH 3 pH 3.5
pH 5 pH 5.5

96
Day 2
AU
0,00
0,20
0,40
0,60
Minutes10,00 20,00 30,00 40,00 50,00 60,00 70,00
18,6
35
19,0
85
22,6
28
23,3
77
23,6
52
25,5
72
28,0
94
28,6
43
29,2
67
30,9
75
31,2
64
33,9
44
39,1
27
AU
-0,10
0,00
0,10
0,20
0,30
0,40
0,50
Minutes10,00 20,00 30,00 40,00 50,00 60,00 70,00
18,2
28
18,5
11
19,0
63
19,4
45
19,9
94
20,3
16
20,5
51
22,4
77
22,8
33
23,4
35
23,9
11
24,1
62
25,5
48
28,0
23
29,0
17 3
0,6
88
32,1
31
33,4
02
34,0
26
35,3
72
38,3
08
AU
-0,10
0,00
0,10
0,20
0,30
0,40
0,50
0,60
Minutes10,00 20,00 30,00 40,00 50,00 60,00 70,00
17,7
49
17,9
18
18,1
31
18,6
46
19,1
13
19,8
78
20,2
00
21,2
01
22,2
93
22,5
97
22,9
33
23,3
57
23,6
06
24,2
17
25,1
79
25,5
44
28,1
06
28,5
37 2
9,2
70
30,9
62
31,2
31
32,3
62
33,9
37
34,2
86
34,8
47
35,8
05
38,5
01
39,1
58
AU
0,00
0,20
0,40
0,60
0,80
1,00
1,20
1,40
Minutes10,00 20,00 30,00 40,00 50,00 60,00 70,00
18,6
57
19,1
05
22,3
07
22,6
18
23,4
59
23,6
56
25,2
24
25,5
60
27,7
52
28,0
55
28,6
24
29,2
65
30,2
21
30,9
60
31,1
89
31,7
20
32,2
16
33,9
29
36,3
71
46,0
36
pH 3 pH 3.5
pH 5 pH 5.5

97
Day 3
AU
0,00
0,20
0,40
0,60
Minutes10,00 20,00 30,00 40,00 50,00 60,00 70,00
18,6
35
19,0
85
22,6
28
23,3
77
23,6
52
25,5
72
28,0
94
28,6
43
29,2
67
30,9
75
31,2
64
33,9
44
39,1
27
AU
0,00
0,50
1,00
1,50
Minutes10,00 20,00 30,00 40,00 50,00 60,00 70,00
18,6
26
19,0
81
22,2
67
22,6
15
23,4
45
23,6
64
25,2
48
25,5
76
27,7
71
28,0
78
28,6
38
29,2
71
30,0
17
30,2
18
30,9
65
31,2
07
31,7
40
32,2
22
33,9
44
36,3
53
36,6
94
39,1
04
45,9
52
AU
0,00
0,20
0,40
0,60
0,80
1,00
1,20
1,40
Minutes10,00 20,00 30,00 40,00 50,00 60,00 70,00
17,3
96
17,7
30
17,8
77
18,0
52 1
8,6
12
19,0
64
19,8
45
20,2
19
20,7
27
20,9
51
21,3
53 2
2,2
67
22,5
76
22,8
60
23,3
57
23,5
98
25,1
72
25,5
35
27,7
47
28,0
49
28,6
07
29,2
82
29,9
81
30,2
13
30,7
15 3
1,1
84
31,7
03
32,2
47
33,8
90
35,7
68
36,3
26
AU
0,00
0,20
0,40
0,60
0,80
1,00
Minutes10,00 20,00 30,00 40,00 50,00 60,00 70,00
16,4
02
17,3
83
17,7
04
17,8
11
18,0
72 1
8,6
58
19,1
38
19,9
27
20,3
57
20,8
58
21,0
97
21,4
79
21,8
59
22,3
44
22,7
67
23,0
74
23,5
95
23,8
57
25,4
49
25,8
09
26,2
26
27,1
12
27,7
17
28,0
86
28,4
23
28,9
70
29,6
32
30,3
32
30,6
06
31,3
01
31,5
84
32,1
04
32,6
58
33,2
05
33,3
30
33,6
82
34,1
43
34,6
05
34,7
71
35,0
97
36,0
94
36,5
96
36,8
79
39,2
44
pH 3 pH 3.5
pH 5 pH 5.5

98
Day 4
AU
0,00
0,20
0,40
0,60
0,80
Minutes10,00 20,00 30,00 40,00 50,00 60,00 70,00
16,3
94
17,4
31
17,7
43
17,8
83 18,6
99
19,1
83
20,0
02
20,3
42
21,1
65
21,4
15
22,4
39
22,8
35
23,1
52
23,6
29
23,8
55
25,4
91
25,8
43
28,0
44
28,3
61
28,8
83
29,5
44
31,3
68
31,6
75
32,7
36
34,3
01
36,1
90
36,7
17
38,7
93
AU
0,00
0,20
0,40
0,60
Minutes10,00 20,00 30,00 40,00 50,00 60,00 70,00
17,4
31
17,7
03
17,8
39
18,6
27
19,0
82
19,8
71
20,2
47
20,9
96
21,2
17
21,7
48
22,2
32
22,6
16
22,9
40
23,3
95
23,6
84
24,3
58
25,3
96
25,8
08
28,5
62
28,9
36 2
9,6
52 31,3
03
31,6
39
32,1
20 3
2,7
14
33,1
70
33,3
97
34,2
24
34,6
45
35,1
66
35,5
39
36,1
61
38,8
48
39,4
46
AU
0,00
0,20
0,40
0,60
0,80
1,00
Minutes10,00 20,00 30,00 40,00 50,00 60,00 70,00
16,3
13
17,3
15
17,6
09
17,7
39 1
8,5
41
18,9
98
22,1
60
22,5
47
22,8
55
23,3
26
23,5
74
25,2
00
25,5
22
27,7
63
28,0
71
28,5
84 29,2
10
30,0
07
30,9
27
31,2
19
31,7
43
32,3
31
33,9
03
34,3
29
34,8
58
35,8
09
36,3
60
38,4
56
39,0
93
AU
-0,20
0,00
0,20
0,40
0,60
0,80
1,00
1,20
1,40
Minutes10,00 20,00 30,00 40,00 50,00 60,00 70,00
17,3
48
17,6
45
18,6
87
19,2
21
19,8
86
21,2
47 2
2,4
81
22,9
03
23,2
01
23,6
99
23,9
57
25,5
46
25,9
03
28,2
04
28,5
63
29,1
04
29,7
63
30,4
18
30,6
52
31,3
13
31,5
88
32,1
36
32,7
08
34,2
51
36,1
81
39,5
17
40,2
95
pH 3 pH 3.5
pH 5 pH 5.5

99
Day 5
AU
0,00
0,20
0,40
0,60
0,80
1,00
1,20
Minutes10,00 20,00 30,00 40,00 50,00 60,00 70,00
18,6
64
19,1
15
22,3
10
22,6
25
23,4
60
23,6
64
25,2
32
25,5
63
27,7
59
28,0
66
28,6
45
29,2
87
30,9
81
31,2
23
33,9
29
36,3
56
AU
-0,10
0,00
0,10
0,20
0,30
0,40
0,50
Minutes10,00 20,00 30,00 40,00 50,00 60,00 70,00
17,4
51
17,8
27
18,1
20
18,6
80
19,1
03
19,8
98
20,2
74
21,0
08
21,2
45
22,2
17
22,9
80
23,3
90
23,7
10
24,2
05 2
5,2
79
25,5
87
28,2
19
28,6
23
29,3
30 30,9
48
31,3
59 32,3
96
33,9
23
34,4
11
34,9
36
35,9
59
AU
0,00
0,50
1,00
1,50
Minutes10,00 20,00 30,00 40,00 50,00 60,00 70,00
17,4
46
18,7
19
19,1
91
19,8
53
19,9
66
20,9
03
21,1
32
22,4
46
22,8
08
23,1
08
23,6
05
23,8
50
25,4
21
25,7
98
28,0
79
28,3
83
28,9
10
29,5
52
30,2
03
31,4
49
31,9
98
32,5
81
36,1
24
AU
0,00
0,20
0,40
0,60
Minutes10,00 20,00 30,00 40,00 50,00 60,00 70,00
17,8
08
17,9
64
18,2
08
18,7
63
19,2
49
20,0
28
20,3
60
21,1
95
21,4
20
22,4
58
22,8
51
23,1
80
23,6
34
23,8
88
24,4
9725,4
89
25,8
79
28,6
35
29,0
13 2
9,7
18
30,9
79
31,3
55
31,6
89
32,1
5632,7
52
33,1
97
33,4
13
34,2
17
34,6
49
35,1
42
35,5
47
36,1
29
38,7
91
39,4
19
pH 3 pH 3.5
pH 5 pH 5.5

100
Day 6
AU
-0,10
0,00
0,10
0,20
0,30
0,40
0,50
Minutes10,00 20,00 30,00 40,00 50,00 60,00 70,00
18,6
37
19,8
68
22,1
95
23,3
80
23,7
08
25,2
78
25,5
80
29,3
74 3
0,9
61
32,3
45
33,8
59
34,3
85
35,9
03
AU
-0,10
0,00
0,10
0,20
0,30
0,40
0,50
Minutes10,00 20,00 30,00 40,00 50,00 60,00 70,00
18,7
29
21,7
09
22,3
37
23,4
00
23,7
07
29,2
85
30,9
23
32,3
69
33,9
00
34,8
08
39,1
06
AU
0,00
0,20
0,40
0,60
0,80
1,00
1,20
Minutes10,00 20,00 30,00 40,00 50,00 60,00 70,00
17,3
67
17,6
95
17,8
38
18,0
33 1
8,5
98
19,0
56
19,7
15
19,8
39
20,2
25
20,7
23
20,9
49
21,3
42 2
2,2
49
22,5
87
22,8
77
23,3
87
23,6
36
25,2
22
25,5
86
27,9
47
28,2
59
28,8
67
29,5
59
30,2
96
30,6
15 3
1,5
10
32,0
28
32,5
69
36,0
61
AU
-0,10
0,00
0,10
0,20
0,30
0,40
Minutes10,00 20,00 30,00 40,00 50,00 60,00 70,00
18,7
78
22,4
07
23,5
86
23,9
24
25,8
61
31,3
11
31,7
04
34,7
72
pH 3 pH 3.5
pH 5 pH 5.5

101
Day 7
AU
-0,10
0,00
0,10
0,20
0,30
0,40
0,50
Minutes10,00 20,00 30,00 40,00 50,00 60,00 70,00
18,7
41
22,3
20
23,4
05
23,7
33
25,6
19
30,9
74
AU
-0,10
0,00
0,10
0,20
0,30
0,40
0,50
0,60
Minutes10,00 20,00 30,00 40,00 50,00 60,00 70,00
23,7
44
30,9
56
32,4
12
33,9
41
39,1
49
AU
-0,10
0,00
0,10
0,20
0,30
0,40
0,50
0,60
Minutes10,00 20,00 30,00 40,00 50,00 60,00 70,00
23,7
92
30,9
61
32,4
15
33,9
31
39,1
28
AU
-0,10
0,00
0,10
0,20
0,30
0,40
0,50
0,60
Minutes10,00 20,00 30,00 40,00 50,00 60,00 70,00
23,7
84
31,0
06
32,4
58 33,9
78
34,8
98
39,1
57
Figure 47: Polypeptide profile of cacao bean seeds incubated in different pH media during the course of a 7-day incubation period.
pH 3 pH 3.5
pH 5 pH 5.5

4.3.2 Changes in the free amino acids content
Figure 48: Free amino acid content obtained from defatted cacao seeds after a 7-day incubation period. Day 0 denotes fresh and un-incubated cacao seeds which were introduced into the media for 30 minutes.
Figure 49: Free amino acid content obtained from defatted cacao seeds after a 7-day incubation period in different pH media. Day 0 denotes fresh and un-incubated cacao seeds which were introduced into the media for 30 minutes.
The free amino acid content of the incubated cacao bean seeds was measured to be
between 2.9 and 12.5 mg/g ffdm (Fig. 48). On the onset of the incubation process
there was an initial slow build-up of free amino acids between day 0 and day 1. This
result is expected because the cacao seeds at this stage could be considered as either
un-incubated or at initial stage of the process and hence do not produce appreciable

103
amounts of free amino acids. There is therefore no significant difference in the
amount of free amino acids produced between these times of the incubation period.
There was however a major rise in the accumulation of free amino acid content after
day 1.This rise in the concentration of the free amino acids is seen as the steeper
slope shown between day 1 and day 2. And this rise continues through day 3 and up
to day 4. The highest amounts of free amino acids were produced between day 3 and
day 4 respectively. This trend in the amount of free amino acid contents is exhibited
in cacao seeds incubated in all the four different pH media. But on the basis of the
differing pH conditions relative amounts of free amino acids only seem to differ from
each other at each stage of the incubation period. At most stages of the incubation, it
is known that cacao seeds incubated at pH 3 produced the highest amounts of free
amino seeds, followed by seeds incubated in pH 3.5 (Fig.49). During the onset of
incubation, the free amino acid content of un-incubated raw cacao bean seeds (at day
0) was found to be a little over 4.2 mg/g ffdm for raw cacao beans incubated at pH 3.
During the same incubation period but at a pH of 3.5, the free amino acid content
was found to be reduced to about 4 mg/g ffdm. Increasing the pH level to 5 saw a
further reduction in the accumulation of free amino acid until a value of about 2.4
mg/g ffdm was recorded at a much increased pH of 5.5. This trend of results was
once again repeated after the third and fourth days (day 3 and day 4) respectively.
The greatest change in the amount of free amino acid throughout the entire
incubation period was recorded after the fourth day (day 4). Free amino acid
concentrations measured for this day were found to be relatively higher (at the
various pH levels under consideration) than in both the previous and subsequent days
respectively. This observation is also supported by the fact that the oligopeptide
spectrum for this day (day 4) shows an appreciable number of peaks at the different
pH levels of incubation. The amount of free amino acids produced on day 4 is about
four times that produced on the on-set of the incubation period; a fact that is found to
be consistent with results obtained from the four different pH media at almost every
stage of the experiment. The free amino acid content then begins to fall gradually
after the peak incubation stage (day 4), and continues also in the subsequent days.
In order to fully understand the specific roles played by the various free amino acids
during incubation and fermentation, the importance of the various proportions of
individual free amino acids that make up these acids cannot be ignored. The

104
composition of the individual free amino acids is therefore presented in Figure 50 (a
-d).
pH 3
Figure 50 (a): Individual free amino acid content obtained from defatted cacao seeds after a 4-day incubation period in a pH 3 media. Day 0 denotes fresh and un-incubated cacao seeds which were introduced into the media for 30 minutes.
pH 3.5
0
2
4
6
8
10
12
14
Free
am
ino
acid
con
tent
(mg/
g ff
dm)
IleValTyrPheLeuAlaThrArgGlySerLysGluAsnAsp
Figure 50(b): Individual free amino acid content obtained from defatted cacao seeds after a 4-day incubation period in a pH 3.5 media. Day 0 denotes fresh and un-incubated cacao seeds which were introduced into the media for 30 minutes.

105
pH 5
Figure 50(c): Individual free amino acid content obtained from defatted cacao seeds after a 4-day incubation period in a pH 5 media. Day 0 denotes fresh and un-incubated cacao seeds which were introduced into the media for 30 minutes.
pH 5.5
Figure 50(d): Individual free amino acid content obtained from defatted cacao seeds after a 4-day incubation period in pH 5.5 media. Day 0 denotes fresh and un-incubated cacao seeds which were introduced into the media for 30 minutes.

106
The amounts of the individual free amino acids were found between 0.01 and 1.31
mg/g ffdm respectively (Fig. 50 a-d). As previously discussed, the free amino acids
contents increase rapidly from day 0, through the subsequent days until it reaches its
peak at day 4. But the same cannot be said for the individual free amino acid
components, since the contents of some free individual amino acids were found to be
increasing in magnitude whilst others were decreasing with respect to the incubation
times. On the basis of the different pH media under investigation, it is also evident
that the concentration of individual free amino acids that were found to be reducing
with incubation time were further reduced as the pH level is increased. Using pH 3
medium as a preamble, it then follows that the acidic group of free amino acids
which are found to be increasing in concentration with respect to increasing
incubation days, but are reduced in pH 5, and much more reduced in pH medium 5.5.
The hydrophobic group of free amino acids was also found to be increasing with
increasing incubation times. But moving from a pH 3 medium into a slightly-less
acidic medium of pH 5.5, the amount of the various hydrophobic amino acids are
increased. Individual free amino acids that were found to be in greater proportions
include alanine, phenylalanine, leucine and valine. These make up the hydrophobic
group of free amino acids. The contents of these free amino acids were at their peak
values at day 4 of the incubation time. Appreciable concentrations were also
recorded by free amino acids such as tyrosine and isoleucine. Arginine was found to
be present only in traces and hence its proportions and contributions were assumed to
be negligible.
A representation of the relative amounts of the major free amino acid groups in
percentage (Fig.51 a-d) show that the acidic group of free amino acids shows a
steady increase in concentration from the beginning of incubation. This trend
continues until the maximum value is attained between days 3 and 4 respectively.
The peak value is maintained briefly before the concentration begins to fall after day
4 until it reaches a lower value at day 7. For the four different pH levels under
consideration, this phenomenon is evident. On the other hand, the hydrophobic group
of free amino acids at the beginning of incubation was at its maximum concentration
and this begins to decrease very rapidly as the incubation time increases. The third
group of free amino acids, otherwise called the ‘other free amino acid group’ showed
similarities in behavior just like the hydrophobic group. These other amino acid

107
group also show increases in content from the beginning of the incubation up to the
maximum concentration on day 4 and then begins to fall to a lower value on day 7.
pH 3
Figure 51(a): Percentage amount of free amino acid content obtained from defatted cacao seeds after a 4-day incubation period in a pH 3 media. Day 0 denotes fresh and un-incubated cacao seeds which were introduced into the media for 30 minutes.
pH 3.5
Figure 51(b): Percentage amount of free amino acid content obtained from defatted cacao seeds after a 4-day incubation period in a pH 3.5 media. Day 0 denotes fresh and un-incubated cacao seeds which were introduced into the media for 30 minutes.
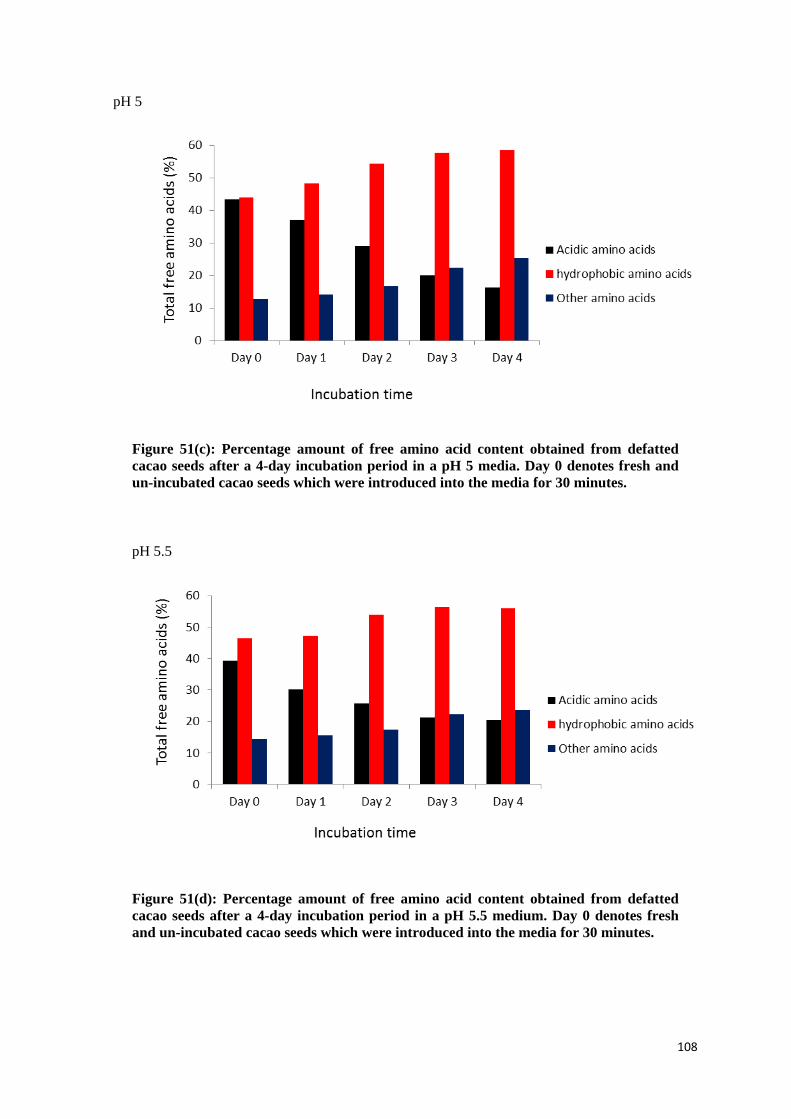
108
pH 5
Figure 51(c): Percentage amount of free amino acid content obtained from defatted cacao seeds after a 4-day incubation period in a pH 5 media. Day 0 denotes fresh and un-incubated cacao seeds which were introduced into the media for 30 minutes.
pH 5.5
Figure 51(d): Percentage amount of free amino acid content obtained from defatted cacao seeds after a 4-day incubation period in a pH 5.5 medium. Day 0 denotes fresh and un-incubated cacao seeds which were introduced into the media for 30 minutes.

109
4.3.3 Changes in the sugar content during incubation
4.3.3.1 Fructose content
During the first three days of the incubation process, there was no evidence of the
presence of fructose in the fresh cocoa bean seeds at the different pH levels. Fructose
only began to build up from the second day and increased in concentration up to the
fourth day in almost all the various pH levels under investigation (Fig.52). The
increase in fructose concentration was very rapid in cocoa bean seeds incubated at a
pH of 3, followed by pH 3.5, then pH 5 and finally pH 5.5 respectively. This trend
shows that the increase in concentration of fructose was rapid at the lower pH than in
higher pH levels.
Figure 52: Fructose contents of defatted cacao seeds after a 7-day incubation period. Day 0 denotes fresh and un-incubated cacao seeds which were introduced into the media for 30 minutes.
On the basis of the different pH levels, it follows the same trend, that the fructose
concentration of cacao seeds incubated at lower pH levels was always higher than
those in higher pH media (Fig. 53). Therefore in moving from a lower pH medium
into higher media, the fructose yields from incubated cacao seeds begin to decrease
gradually. In all the different pH levels, the fructose contents of the seeds were
always found to be at its maximum after day 4 of the incubation.

110
Figure 53: Fructose contents of defatted cacao seeds after a 7-day incubation period in different pH media. Day 0 denotes fresh and un-incubated cacao seeds which were introduced into the media for 30 minutes.
4.3.3.2 Glucose content
The concentration of glucose in the incubated cocoa bean seeds showed the same
pattern of results as observed in fructose. In this case, also glucose began to build up
only after the second day of incubation (Fig.54). And once again, the accumulation
of glucose was rapid at the lowest pH level and gradually becoming less rapid at the
highest pH level (Fig.55). It could also be observed that the accumulation of fructose
was slightly more rapid and higher than glucose in fresh cocoa bean seeds incubated
at the same pH level. Once again the greatest glucose concentration was achieved
after day four of the incubation.

111
Figure 54: Glucose contents of defatted cacao seeds after a 7-day incubation period. Day 0 denotes fresh and un-incubated cacao seeds which were introduced into the media for 30 minutes.
Figure 55: Glucose contents of defatted cacao seeds after a 7-day incubation period in different pH media. Day 0 denotes fresh and un-incubated cacao seeds which were introduced into the media for 30 minutes.
4.3.3.3 Sucrose content
The sucrose yield from the incubated cacao seeds was between 25.1 and 0.86 mg/g
ffdm respectively (Fig.56). The sucrose contents of the seeds were higher at the start
of the incubation and as the incubation process progressed, the concentration began
to fall rapidly until it recorded a value below 5 mg/g ffdm for all the pH levels.

112
Figure 56: Sucrose contents of defatted cacao seeds after a 7-day incubation period. Day 0 denotes fresh and un-incubated cacao seeds which were introduced into the media for 30 minutes.
Figure 57: Sucrose contents of defatted cacao seeds after a 7-day incubation period in different pH media. Day 0 denotes fresh and un-incubated cacao seeds which were introduced into the media for 30 minutes.
For the different pH media, the sucrose contents at the low pH levels were almost
and always higher than those from higher pH media. For example, at the start of
incubation, sucrose yield at pH 3 was 25.1 mg/g ffdm, and 20 mg/g ffdm at pH 3.5.

113
This yield was reduced to 17 mg/g ffdm at pH 5 and further reduced to about 15
mg/g ffdm at a much higher pH value of 5.5 respectively.
4.3.4 Changes in the amount of phenolic compounds
4.3.4.1 Epicatechin content
The epicatechin contents of incubated cacao seeds were between 31 and 3.1 mg/g
ffdm respectively (Fig.58). There is an initial build-up of epicatechin at the
beginning of the incubation and this concentration decreases very rapidly in the
subsequent days until it reaches the minimum yield after day 7.
Figure 58: Epicatechin contents of defatted cacao seeds after a 7-day incubation period. Day 0 denotes fresh and un-incubated cacao seeds which were introduced into the media for 30 minutes.
Under the different prevailing pH media, it can be seen that at almost every stage
during the incubation, the epicatechin yield of seeds incubated at higher pH levels
are mostly greater than from seeds incubated in lower pH media (Fig.59). Thus the
concentration of epicatechin in the incubated seeds increases with increasing pH
levels.

114
Figure 59: Epicatechin contents of defatted cacao seeds after a 7-day incubation period in different pH media. Day 0 denotes fresh and un-incubated cacao seeds which were introduced into the media for 30 minutes.
4.3.4.2 Catechin content
The catechin contents of incubated cacao seeds were between 0.1 and 0.9 mg/g ffdm
respectively (Fig.60). The catechin yield at the start of the incubation was much
higher but this begins to decrease at different stages for the different pH media until
the least yields are obtained after day 7. Catechin concentrations at higher pH media
were found to be greater than in lower pH media. Thus starting from pH 3, catechin
yield rises gradually with incubation time until the maximum yield is obtained at a
higher pH level of 5.5 (Fig.61).

115
Figure 60: Catechin contents of defatted cacao seeds after a 7-day incubation period. Day 0 denotes fresh and un-incubated cacao seeds which were introduced into the media for 30 minutes.
Figure 61: Catechin contents of defatted cacao seeds after a 7-day incubation period in different pH media. Day 0 denotes fresh and un-incubated cacao seeds which were introduced into the media for 30 minutes.

116
4.4 Agroforestry
4.4.1 Impact of agricultural production systems on quality formation in
raw cocoa
4.4.1.1 Short introduction to agroforestry
The common practice of cultivating agricultural crops with close association with
other trees on the same piece of land dates back many years ago. Agroforestry has
been practiced throughout the entire world in many different diverse forms. For
example in tropical America many farmers have simulated the forest conditions to
obtain the beneficial effects of the forest ecosystem (Nair, 1993). Farmers have
adopted a common traditional practice to plant an average of two dozen species of
plants on plots of land no larger than one-tenth of a hectare. Wilken (1977) states that
these North American farmers preferred a more complex layered configuration of
mixed tropical forest systems that incorporated the cultivation of coconuts or papaya
with a lower layer of bananas or citrus, a shrub layer of coffee or cacao plants,
annuals of different stature such as maize and finally a spreading ground cover of
crops such as squash. In Asia, the situation is not too different; for example in the
Philippines the people practice what could be best described as a shifting form of
cultivation. In clearing their land for agricultural purposes, farmers may deliberately
leave out certain trees, which by the end of the main rice-growing season would
provide a partial canopy of new foliage. They prevented the agricultural land from
being exposed to excessive sunlight, and hence make the soil richer for the next
growing season. These trees also provided the farmers with food, medicines,
cosmetics and also wood for construction purposes. In Africa, agroforestry was
practiced mainly for the purpose of food production. Thus farmers incorporated a
mixture of different food crops under a cover of scattered trees as a means of
conserving human energy and spending less resource on the farm management
practices. This system also derives maximum use of the agricultural land since every
available land space is covered with an extensive system of tree crops, cover crops,
shrubs and herbs. This system also has the added advantage of combating erosion,
nutrient leaching and hence maintains the soil fertility (Ojo, 1966). King (1987)
states that in Europe, until the Middle Ages it was a common practice for farmers to
clear degraded forest, burn the slash and cultivate new food crops. Trees could then
be planted before, along with or after the main agricultural crops. This system of

117
farming is no longer in existence in Europe, but was common in Finland up to the
end of the last century, and also in some few areas in Germany as late as the 1920s.
There are uncountable forms of traditional farming systems worldwide where
farmers cultivate agricultural crop species in close association with trees on the same
piece of land. Even though these trees became an integral part of agriculture, it did
not only support agriculture in the form of tree production but the ultimate objective
was for food production.
4.4.1.2 Diversity of planting systems in agroforestry
Agroforestry systems are very diverse and complex and may range from simple
forms of shifting cultivation to complex hedgerow intercropping system. All these
forms may however be grouped under the three principal types of agroforestry
systems. These are silvopastoral, agrisilvopastoral and agrisilvicultural agroforestry
systems (Nair, 1989).
Silvopastoral system involves raising livestock on improved pastures grown in
association with trees. Some commonly used systems are alley farming and trees
planted on plot boundaries to serve as live fences. This system is characterized by the
use of hard wood (sometimes nut trees) and/or pines being planted in single and
multiple rows and the livestock graze between them. Through the management of the
grazing behaviour of the livestock, this system provides income and other added
products since the trees are managed for high value sawlogs and at the same time,
provide shade and shelter for livestock and forage. This also has the added advantage
of reducing stress on the forage by increasing its production. Cattle, sheep and goats
are the most common livestock incorporated into this system. In such systems, multi-
purpose woody perennials are cultivated to compensate for the protein requirements
(protein bank) of the farm animals by fodder. These woody perennials may also be
utilized as living fences around the grazing perimeter of the land or may even be
retained as commercial shade or fruit trees on pasture lands (Nair, 1985a). Examples
of silvopastoral systems include trees in contour hedgerow, such as alley cropping,
alley farming or hedgerow cropping. This may also include homestead (home
gardens); a combination of crops, trees and livestock and also trees planted on plot
boundaries to serve as live fences. This agroforestry system is practiced in many
countries, particularly in lowland sub-humid tropics and almost all ecologically

118
viable zones of the world. Specifically, these systems could be observed in south-
eastern parts of Asia, tropical countries like highland Tanzania and lowland areas
like Nigeria. This system is also notably practiced in Latin America.
Agrisilvopastoral system of agroforestry involves the cultivation of trees over
pastures, but with the incorporation of farm animals. Living fences are then
constructed on the farmland to serve as a protective function. Agrisilvopastoral
systems may include trees and crops on pastures, fodder hedges, trees and crops on
or around farmlands or these may be fenced.
Agrisilvicultural system of agroforestry involves simultaneously growing crops and
trees including shrubs or vines on the same piece of land. Examples of this system
include alley cropping and hedgerow cropping.
This agrisilvicultural agroforestry is ideal for cocoa plantations because the cacao
tree is tolerant to other plants and can be combined with many crops.
4.4.2 Agroforestry: the functional basis for managed ecosystems
The ecosystem concept of Odum (1983) directed the theoretical steps in applied
biological research to the evaluation of functional aspects and mechanisms of plant
interaction. The functional contributions of selected crop plant combinations were
quantified and nutrient cycling within plants and between plants and the biotic and
abiotic factors became useful with the incorporation of shade or fruit trees on pasture
lands (Nair, 1985b and 1989).
4.4.3 The focus of modern production research in agroforestry: closing
cycles.
The idea used to describe ecosystems in the form of closed cycles of water, nutrients
and living organisms was further detailed in many studies (Fassbender, 1987). The
analysis of the role of perennial plants, especially coffee and cacao, which had been
studied in the projects of CATIE in Costa Rica (Fassbender, 1987) allows one to
define the impact of individual plants and their interactions to form ecosystem
cycling of matter (Figure 62).

119
Figure 62: Representation of a cocoa-banana-Erythrina poeppiggiana agroforestry system (Fassbender, 1987).

120
This scheme gives an overview of the role of diverse plants in the cycling of
nutrients and water and it points out the differences between selected plant groups in
the ecosystem processes. Agroforestry under this aspect can be defined as a group of
managed and enriched ecosystems, which is optimized with respect to productivity.
The plants combined in these systems can be described under the aspect of plant
functional types (Smith et al., 1997). Every plant functional type with its
morphological and physiological properties and with its flexibility will contribute to
stabilize the agroecosystems. The interaction of plants can be seen and evaluated by
a detailed study of typical factors. The flux of water in a given system has been
analysed quantitatively in a polyculture system in the Central Amazon region in
which Theobroma grandiflorum was combined with palm trees and other important
crop plants (Schroth et al., 1999), as depicted in (Fig. 63).
Figure 63: Transect section through a polycultural agroforestry plot showing total water input into the soil. Further detailed information on water and nutrient flow in multistrata agroforestry
systems have recently been reported for Australian rainforests by McJannet et al.
(2007) and for nutrient content of incident rainfall, throughfall and stemfall in a
Nigerian secondary lowland rainforest (Muoghalu and Oakhumen, 2009). The tree
species tested affected the quantities of the elements K, Ca, Mg as well as of

121
microelements. In a directed plant combination, the water flow and the nutrient
distribution can be managed using “water collectors” like palm trees or trees with
large canopies. These distributions are clearly proofed in the Amazon experiment
with multistrata agroecosystems (Schroth et al., 1999). In accordance with the
stabilization of soil humidity and water availability for the plants which are
combined with these functionally important factors, the impact of humidity or soil
microbiological development and on soil entomology were proven.
Another factor important for ecosystem stabilization is the shade management for the
well-known classical shade crops like cacao (Tscharntke et al., 2011). The economic
viability of shaded culture in cacao is delivered on the basis of model systems (Obiri
et al., 2007). In this study the input factors are compared to their costs and factors
like yield and loss of diversity. The study is based on long term evaluations of the
cash flow, in which yield is combined with the internal rate of return and the
development of land expectation value.
4.4.4 Ecophysiology of the cocoa tree and its variability
Development of stable productive planting systems for cocoa on poor tropical soils is
only possible when the physiological peculiarities of cocoa are known in detail and
when the interaction of cocoa trees with other plants combined in these agroforestry
systems are studied. For this reason a precise analysis of the growth processes of the
cocoa tree and the plant-soil-water relation has to be carried out. A recent review by
Tscharntke et al. (2011) provides an approach to the complexity of these systems.
The water relations of cocoa are presented in an overview given by Carr and
Lockwood (2011). Following the role of water in annual crop development and
related growth processes the rhythmic growth of the cocoa tree and the
interdependence of root, shoot, leaf and fruit formation must be considered as a
sequence of biomass production. The flush growth and development of leaves and
roots is partially triggered by the water availability with the onset of the rainy season
(Barlow, 1986). But according to Almeida and Valle (2007) this growth rhythm is
also controlled by endogenous regulation factors such as roots over the growth
period including root leachates and root hairs and other cell masses, which form the
rhizodeposition of the cocoa plant (Schroth et al., 1999).

122
Description of the phenological growth stages with respect to flush growth patterns
has been presented by Niemenak et al. (2009). Of special importance for the plant-
environment interaction is also the soil-root relation. Root formation and production
of young roots over the growth period including root leachates and root hairs and
other cell constituents, which form the rhizodeposition of the cocoa plant, are under
study (Schroth and Zech, 1995). A detailed approach to the study of root formation
and root distribution with special focus on fine roots in the genus Theobroma has
been carried out with Theobroma grandiflorum in polyculture systems in the
Amazon region (Emmerich, 2002). In this study the rhizodeposition with respect to
wet and dry seasons were quantified (Fig. 64).
Figure 64: Comparison of the rhizodeposition of root during the dry and wet seasons (Emmerich, 2002).
Detailed studies on new approaches to analyse the non-destructive in situ root
architecture for cocoa and to get more quantitative data on the root dynamics in
undisturbed environments in West Africa are needed and a methodology has been
recently developed by Isaac and Anglaaere (2013).
Root
mas
s
Dry season 1997 Wet season 1998
Below surface Dead roots Living roots

123
4.4.5 Phosphate acquisition in plant-microbe interactions
Despite high total phosphorous concentrations in the soil, these are only available as
insoluble Fe and Al phosphate-complexes in acidic tropical soils. Availability for the
plant is low and this deficiency in phosphate often limits plant growth. Productivity
of phosphates in crop plants may be increased by inoculation with mycorrhiza of the
vesicular-arbuscular type or with P-solubilizing microorganisms. In Theobroma
grandiflorum plantations, roost associated with bacteria and actinomycetes have been
isolated in which more than 70% were capable of growing in the presence of Fe and
Al phosphates as a sole phosphate source (Marschner et al., 2002). The
actinomycetes, Gordonia sp. and Pseudomonas fluorescens strains were able to
solubilize phosphate from inorganic complexes. The phosphate solubilization by
these microbes is obviously due to the excretion of organic acids (Hoberg et al.,
2005). This preliminary step into complex cultivation systems with managed plant-
microbe interactions demonstrates that using further studies, especially field studies
will help to stabilize cocoa production systems with low input characteristics.
Organic phosphate (liberated from plant material)
Mobile in soil
Inorganic phosphate (Complexes with Al and Fe ions)
Immobile in soil
Plant root associated with: Gordonia sp.
Pseudomonas fluorescence
Vesicular arbuscular mycorrhiza
Phosphates incorporated into plants as organic
phosphates
Figure 65: Flow diagram to show the impact of plant microbes on the quality of soil in an equilibrated agroforestry system.

124
4.4.6 Production factors and quality parameters of cocoa
Since the introduction of cocoa plants to Ghana before 1887 (Edwin and Master,
2005), the crop improvement was directed towards high yield and increased
productivity. The main objectives were production of better yielding varieties and the
introduction of high resistance to diseases and pests. The early introduction of cocoa
from Fernando Póo (now Bioko in Equatorial Guinea) involved seeds of the highly
uniform West African Amelonado of the Forastero group (Edwin and Masters,
2005). Later on Amazon genotypes (Forastero) and Trinitarios were introduced. In
the late 1990s, defined fine flavour cocoas from Trinidad were introduced into Ghana
by the COCOBOD; these activities have been documented by Daniels et al., (2012).
The Trinitarios introduced between 1900 and 1909 from Trinidad, Jamaica and
Venezuela obviously brought already genotypes which have been derived from
crossings between Criollo and Forastero cocoas and were already fine flavour cocoa,
but they were not used to produce fine flavour raw cocoa. Instead, these materials
together with later introductions were used to produce high disease resistance and
pest resistant plant mixtures. The Ghana cocoa was developed to become and deliver
a high standard quality bulk cocoa, characterized by good yield and high standard
raw cocoa variety.
The harvested quality and the post-harvest treatment were developed to deliver a
quality standard for a reproducible quality needed to form a typical chocolate
product. With the distribution of cocoa production to the entire tropical belt, the
Ghana cocoa was the unifying raw cocoa standard. Modifications of the raw cocoa
properties reached the market by enlarging the production areas, which presented
various modifications of post-harvest treatments. The consumer countries used
various processing techniques to diversify the end products which could be formed
on the basis of raw cocoa variations and new processing technologies (Wood and
Lass, 1989). Special fine flavour cocoas were produced in some countries selected on
the cocoa market according to the ICCO, 2010 (ICCO list).
As the fine flavour products received high attention in the cocoa market and received
special prices, a new attention was given to this quality sector in production and in
most harvest processes (Gockowski and Sonwa 2011).

125
In Ghana, the project “Reaching High-Value Markets: fine flavour cocoa in Ghana”
was carried out (Daniels et al., 2012) within the framework of “New Business
Models for Sustainable Trading Relationships”.
4.4.7 How to produce fine flavour cocoa in Ghana
The research on the origin of the fine flavour components in cocoa seeds reveals that
it involves a polyfactorial base to produce this type of raw cocoa. A comprehensive
approach to determine the physical, chemical and organoleptic parameters to
differentiate fine and bulk cocoa has been worked out by the ICCO (2007).
The criterion “fine or flavour cocoa” is due to a group of cocoa varieties which
produce special types of raw cocoa and which are put together by the international
cocoa markets. This decision is based mainly on the fact that the raw cocoa produced
from these genotypes delivers special types of flavours. The genetic origin of these
types varies considerably. Fine and flavour cocoa beans are produced from Criollo
varieties and from Trinitario varieties, bulk cocoa is produced from Forastero
varieties. But also within the Forestero group there are fine and flavour cocoas,
especially the Nacional varieties of Ecuador. In addition to the genetic diversification
there is a strong impact of post-harvest treatment for the formation of fine and
flavour characteristics. The basic processes to form a general “chocolate aroma”
have been shown to be based on the fermentation, which causes the acid induced
specific breakdown of highly conserved storage proteins in the cocoa seeds (Voigt,
2013). The breakdown products together with other factors form the precursors for a
typical bulk cocoa aroma formation.
Besides the formation of these breakdown products, there are also various other
components which may be combined to the chocolate aroma formation. These
additional components, for example linalool, terpenes and alkaloids are the basis for
the fine and flavour character. It is well known that the Criollo fine and flavour
cocoa is produced in a very short fermentation procedure of about three to four days,
whereas the Trinitario based fine and flavour cocoa needs a fermentation time of six
to seven days (ICCO, 2007). Unfortunately, the process of fermentation is not
understood in all steps. The key processes responsible for the expression of fine and
flavour character besides the formation of chocolate aroma are not known. For the

126
characterization of flowery components of the fine flavour cocoa, the presence of
linalool has been reported (Ziegleder, 1990, Amores, 2006 and Eskes et al., 2007).
They discussed that many of these special notes are produced in the pulp and
obviously are transferred from the pulp to the seed in the course of the fermentation
process.
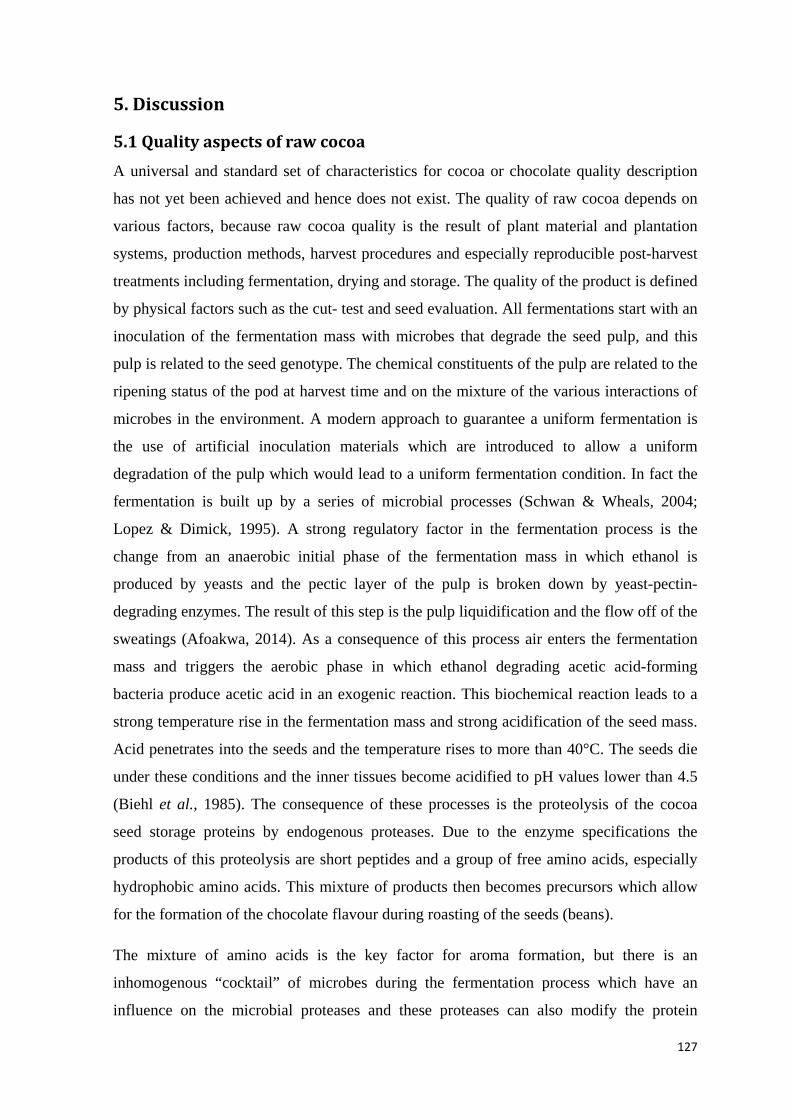
127
5. Discussion
5.1 Quality aspects of raw cocoa A universal and standard set of characteristics for cocoa or chocolate quality description
has not yet been achieved and hence does not exist. The quality of raw cocoa depends on
various factors, because raw cocoa quality is the result of plant material and plantation
systems, production methods, harvest procedures and especially reproducible post-harvest
treatments including fermentation, drying and storage. The quality of the product is defined
by physical factors such as the cut- test and seed evaluation. All fermentations start with an
inoculation of the fermentation mass with microbes that degrade the seed pulp, and this
pulp is related to the seed genotype. The chemical constituents of the pulp are related to the
ripening status of the pod at harvest time and on the mixture of the various interactions of
microbes in the environment. A modern approach to guarantee a uniform fermentation is
the use of artificial inoculation materials which are introduced to allow a uniform
degradation of the pulp which would lead to a uniform fermentation condition. In fact the
fermentation is built up by a series of microbial processes (Schwan & Wheals, 2004;
Lopez & Dimick, 1995). A strong regulatory factor in the fermentation process is the
change from an anaerobic initial phase of the fermentation mass in which ethanol is
produced by yeasts and the pectic layer of the pulp is broken down by yeast-pectin-
degrading enzymes. The result of this step is the pulp liquidification and the flow off of the
sweatings (Afoakwa, 2014). As a consequence of this process air enters the fermentation
mass and triggers the aerobic phase in which ethanol degrading acetic acid-forming
bacteria produce acetic acid in an exogenic reaction. This biochemical reaction leads to a
strong temperature rise in the fermentation mass and strong acidification of the seed mass.
Acid penetrates into the seeds and the temperature rises to more than 40°C. The seeds die
under these conditions and the inner tissues become acidified to pH values lower than 4.5
(Biehl et al., 1985). The consequence of these processes is the proteolysis of the cocoa
seed storage proteins by endogenous proteases. Due to the enzyme specifications the
products of this proteolysis are short peptides and a group of free amino acids, especially
hydrophobic amino acids. This mixture of products then becomes precursors which allow
for the formation of the chocolate flavour during roasting of the seeds (beans).
The mixture of amino acids is the key factor for aroma formation, but there is an
inhomogenous “cocktail” of microbes during the fermentation process which have an
influence on the microbial proteases and these proteases can also modify the protein

128
degradation process. Finally these reactions lead to a composition of various low molecular
weight compounds in the raw cocoa as a result of fermentation and subsequent drying.
The central objective of this study was to establish the quality description of traded raw
cocoa with the focus on the variability of quality parameters of the traded good. For this
comparative analysis samples of cocoa from two production years (2007 and 2008) from
Ghana and Ivory Coast were purchased and compared to a set of samples from Trinidad
and Tobago.
The samples were studied with respect to the methodology of the cocoa atlas and the
parameters analysed were compared with incubation experiments. The chemical
parameters revealed a country specific grouping of parameters, and the West African
samples differed from the Caribbean samples on the basis of the low molecular weight
products.
The most remarkable changes that occur during the course of cocoa seed fermentation is
the change in content of free amino acids (Rohsius et al. 2006) and the reduction of
polyphenol content, especially epicatechin and of procyanidin B2. In unfermented cocoa
seeds the content of free amino acids ranges from about 2 to 5 mg/g ffdm and the content
rises up to 25 mg/g ffdm (Rohsius et al., 2010. Comparing 108 commercially already
fermented and traded cocoa samples revealed that the content and distribution of free
amino acids varied within the above given range and the variations were due to the country
of origin and they were also regional specific. They were grown and harvested in locally
small- producer farms or in big estates, fermented and dried under local conditions. These
were then collected and transported, mixed by the intermediary handlers, purified, stored in
the harbours and finally prepared for export to the consumer countries. The comparison of
raw cocoa from Ghana, Ivory Coast and Trinidad & Tobago studied in the thesis delivered
good information on the variation of quality factors, especially on the aroma forming-
parameters but it was impossible to find out at which level of the cocoa provision chain the
quality determining factors have been influenced.
According to Rohsius et al., (2006) there are three groups of fermentation-based
characteristics, varying from “low fermented” (5.8 to 8.8 mg/g ffdm) free amino acids
content, medium fermented (8.0 to 14.0 mg/g ffdm) free amino acid content and high
fermented (15 to 24.3 mg/g ffdm) free amino acid content or even higher. Under this

129
scheme the samples from Ghana within 13 to 19 mg/g ffdm free amino acid content and
within 12 to 19 mg/g ffdm free amino acid content from Ivory Coast represent the product
range in the upper scale of medium fermented raw cocoa.
The raw cocoa from Trinidad & Tobago reveal a higher variability, exhibiting a lower
class of medium fermentation range to the highest range of high fermented material.
According to Cros (1995) the Trinidad genotypes from Madagascar contained doubled
amount of free amino acid in mg/g ffdm in the unfermented material. It may be assumed
that the genotype is highly specific for the initial amount of free amino acid content and
contributes to the final result. In addition to the genotypic aspect it may also be possible
that factors like degree of ripeness and fermentation type are important factors for the
outcome of free amino acid formation this may especially be true for genotypes that are
typically used in Trinidad & Tobago.
The genotypes in Ghana and Ivory Coast are probably made up of high amounts of West
African Amelonado, and Forastero varieties, but there are also reports of the introduction
of Trinitarios. It would therefore be very helpful to carry out a study of the free amino
acids content in unfermented cocoa seeds under the conditions applied in this study.
5.2 The role of the incubation process as a potential for quality formation Incubation experiments with cocoa seeds are aimed at the acidification of the seed tissue in
order to activate the two important proteases in the storage tissue, the aspartic endoprotease
and the carboxypeptidase (Voigt et al., 1994a). These proteases and their specific cleavage
pattern following an activity induced by the acid, the pH then becomes the precondition for
the aroma precursor production in cocoa seed fermentation. The other condition is the
highly conserved protein primary sequence of amino acids of the vicilin-like globulin
(Voigt et al., 1994b). The combination of both factors lead to a reproducible pattern of
aroma precursors during fermentation and / or incubation of the seeds. Some factors have
not been studied in detail, for example the variation of auxiliary factors during the course
of seed development, which are able to modify the fermentation process. The pulp
conditions at the harvest period are also important for the velocity of acetic acid formation
and the amount of acid produced. These factors depend on the yeast populations in the pulp
and on the amount of free sugars for ethanol formation by the yeasts. The incubation of
seeds in acid have been studied in various experiments, and it is known that not only acetic

130
acid or lactic acid are able to regulate the proteolysis, but also mineral acids are capable of
inducing the seed internal proteolysis process (Bahmann, 2014).
The cocoa storage protein degradation can easily be followed by electrophoretic control of
the seed storage protein pattern. Stoll (2010) compared protein degradation during the
course of fermentation with protein degradation during seed germination. The time needed
for protein degradation was in the range of four to five days for completion. The
germinated seeds did not completely degrade the storage compounds. Under acidic
incubation conditions the storage proteins were degraded within two days. It must be
assumed that the protein degradation under acid induced conditions is completed within 48
hours; whereas under fermentation conditions, about four days are necessary for this
process. Obviously it is the anaerobic initial phase of fermentation needed for the
production of the acidification condition; and after the pH shift in the seed the degradation
sequence can be directly compared with the incubation condition.
The degradation process in the acidified seeds depends on the activity of the proteases in
the storage cells. It is not known if cocoa seeds of different genotypes vary in the proteases
activity and if this factor could be solely responsible for different kinetics of seed protein
degradation. There is also no precise description of how the activities of the proteases vary
with age and environmental conditions for the main cocoa groups (Forastero, Criollo and
Trinitario).
5.3 Ecophysiological parameters for fine flavour cocoa production under
conditions in Ghana The demand for fine flavour cocoa has increased over the past twenty years. Only about
5% of the world total production of cocoa accounts for these aroma cocoa genotypes.
Ghana, a major producer of quality bulk cocoa has recently been found to be a potential
site for the production of fine flavour cocoa. This finding resulted in the Ghana Fine
Flavour Project - a collaboration between chocolate manufacturers, research institutes,
international nongovernmental organisations and farmer organisations. The objective of
this initiative was to establish a fine flavour cocoa value chain in Ghana which would help
the farmers to get access to high value markets (Daniels et al., 2012). Preliminary
investigations and tests have been taken and the results are promising for the production of
selected fine flavour genotypes in the future.

131
Since Ghana has already gained a good experience in the cultivation of bulk cocoa
genotypes there is therefore the need to consider the ecophysiological aspects of the cocoa
genotypes which would deliver fine flavour material. The ecophysiological demands of the
cocoa tree have been studied for many years (Almeida and Valle, 2007). A major
contribution will come from the use of effective agroforestry practices and principles.
Agroforestry systems practiced under an effective temporary or permanent shade
management would ensure that the soil fertility is maintained and conserved and hence
the functional biodiversity of the environment is supported. The various rhythmic
growth patterns of some of the tropical plants grown in a multi-functional combination
with the cocoa tree would also lead to resilience. Water distribution patterns between
plants and soil will help to lower hazards and environmental aspects like carbon
sequestration and nitrogen fixation will stabilize the production oriented ecosystems.
The development and application of polyculture systems is also important. And
generally, the new results obtained from all modern ecosystem oriented researches
should be included into the concepts of producing fine flavour cocoa in Ghana.

132
6. References
Afoakwa, E. O. (2010): Chocolate Science and Technology. Wiley-Blackwell.
Afoakwa, E. O. (2014): Cocoa production and processing technology. CRC Press,
Taylor & Francis Group.
Almeida, de A.A.F., Valle, R.R. (2007): Ecophysiology of the cacao tree. Brazilian
Journal of Plant Physiology. 19(4): 425-448.
Alverson, W.S., Whitlock, B.A., Nyffeler, R., Bayer, C., Baum, D.A. (1999):
Phylogeny of the core Malvales: Evidence from ndhF sequence data. American
Journal of Botany. 10: 1474-1486.
Amin, I., Jinap, S., Jamilah, B., Harikrisna, K., Biehl, B. (2002): Oligopeptide
patterns produced from Theobroma cacao L. of various genetic origins. Journal of
Science of Food and Agriculture. 82: 733-737.
Amores, F. (2006): Proyecto para estabelecer parametros fisicos, quimicos y
organolepticos que permitan diferenciar entre cacao fino y ordinario. Evaluacion de
parametros quimicos volatiles. Taller international para presentacion de resultados.
Guayaquil, Abril 3-5/ 2006.
Bahmann, C. (2014): Biotechnologie von Theobroma cacao L. Ph.D. thesis,
University of Hamburg.
Barlow, E.W.R. (1986): Water relations of expanding leaves. Australian Journal of
Plant Physiology. 13: 45-58.
Biehl, B., Passern, D. (1982): Proteolysis during fermentation like-incubation of
cocoa seeds. Journal of Science of Food and Agriculture. 33: 1280-1290.
133
Biehl, B., Adomako, D. (1983): Die Kakaofermentation (Steuerung, Azidation, Proteolyse). Lebensmittelchemie und Gerichtliche Chemie. 37: 57-63.
Biehl, B., Brunner, E., Passern, D., Quesnel, V.C., Adomako, D. (1985): Acidification,
Proteolysis and flavour potential in fermenting cocoa beans. Journal of Science of
Food and Agriculture. 36: 583-598.
Biehl, B., Heinrichs, H., Ziegeler-Berghausen, H., Srivastava, S., Xiong, Q., Passern,
D., Senyuk, V. I., Hammoor, M. (1993): The proteases of ungeminated cocoa seeds
and their role in the fermentation process. Angewandte Botanik 67: 59-65.
Biehl, B., Voigt, J. (1995): Nacherntebehandlung, Fermentation, Proteolyse und
Bildung der Aromavorstufen beim Kakao. Proceedings of the 1st Symposion on
useful plants of the tropics, Sep. 22-24 1995. Institut für Angewandte Botanik,
Hamburg. In: Berichte der Angewandten Botanik. 5: 124-137.
Biehl, B., Voigt, J. (1996): Biochemistry of chocolate flavour precursors.
International Cocoa Conference, Salvador, November 1996, Bahia.
Biehl, B., Voigt, J. (1999): Biochemistry of cocoa flavour precursors. In Proceedings
of the 12th International Cocoa Research Conference, Salvador, Brazil, 1996, pp.
929–938. Lagos, Nigeria: Cocoa Producers Alliance.
Carr, M.K.V., Lockwood, G. (2011): The water relations and irrigation requirements of cocoa (Theobroma cacao L.): a review. Experimental Agriculture 47(4): 653-676.
Cros, E. (1995): Cocoa aroma formation, Cocoa meetings: The various aspects of
quality, Seminar Proceedings, Montpellier, p. 169-179.
134
Daniels, S., Laderach, P., Paschall, M. (2012): Reaching high-value markets: fine flavour cocoa in Ghana. Project: New business models for sustainable trading relationships, Accra, Ghana.
Edwin, J., Masters, W.A. (2005): Genetic improvement and cocoa yields in Ghana. Experimental Agriculture 41: 491-503.
Emmerich, S.(2002): Die Feinwurzelsysteme von vier tropischen Nutzbäumen, ihre
Nährstoffaufnahmen und ihre Interaktion in einer agroforstlichen Mischkultur in
Zentral-Amazonien. Ph.D. thesis, Universität Düsseldorf.
Eskes, A.B., Guarda, D., Garcia, L., Garcia, P. (2007): Is genetic variation for sensory
traits of cocoa pulp related to fine flavour cocoa traits? Ingenic Newsletter. 11: 22-28.
Fassbender, H.W. (1987): Modelos Edafológicos de Sistemas Agroforestales.CATIE,
Turrialba, Costa Rica, pp. 475.
Fowler, M. S. (1995): Quality of cocoa powder producers. Seminar Proceedings. Cocoa Meeting, Montpellier. 147-153.
Fowler, M. S. (1999): Cocoa Beans: From Tree to Factory. In: Industrial Chocolate
Manufacture and Use. S. T. Beckett. Blackwell Science, Oxford. 3: 8-35.
Gockowski, J., Sonwa, D. (2011): Cocoa intensification scenarios and their predicted
impact on CO2 emissions, biodiversity conservation, and rural livelihoods in the Guinea
rain forest of West Africa. Journal of Environmental Management. 48: 307-321.
Hansen, C., Delolmo, M., Burri, C. (1998): Enzyme activities in cocoa beans during
fermentation. Journal of the Science of Food and Agriculture. 77(2): 273-281.

135
Hoberg, E., Marschner, P., Lieberei, R. (2005): Organic acid exudation and pH changes
by Gordonia sp. and Pseudomonas fluorescens grown with P adsorbed to goethite.
Microbiological Research. 160: 177–187.
ICCO (2007): Cocoa Resources in Consuming Countries. International Cocoa
Organisation, Market Committee. Tenth meeting, London.
ICCO (2010): Recommendations of the 2010 ICCO ad hoc panel on fine or flavour
cocoa.
Isaac, M.E., Anglaaere, L.C.N. (2013): An in situ approach to detect tree root
ecology: linking ground-penetrating radar imaging to isotope-derived water
acquisition zones. Journal of Ecology and Evolution 3(5): 1330-1339.
Iwaro, A.D., Singh, V., Barath, S., Jugmohan, N. (2001): Germpalsm evaluation at
the International Cocoa Genebank, Trinidad for resistance to Phytophthora pod rot.
CRU Annual Report 2000. 34-40.
King, K.F.S. (1987): The history of agroforestry. In: Steppler, H.A. and Nair, P.K.R.
(eds). Agroforestry - a decade of development, pp. 3-11, ICRAF, Nairobi.
Kirchhoff, P.-M., Biehl, B., Crone, G. (1989): Peculiarity of the accumulation of free
amino acids during cocoa fermentation. Food Chemistry. 31: 295-311.
Laemmli, U.K. (1970): Cleavage of structural proteins during the assembly of the
head of bacteriophage T4. Nature. 227: 680-685.

136
Linnaeus, C. (1753): Species Plantarum. Collection Highlight Summer 2007.
University of Aberdeen.
http://www.abdn.ac.uk/historic/Collection_highlight_summer07.shtml
Liebert, M., Licht, U., Bohm, V., Bitsch, R. (1999): Antioxidant properties and total
phenolics content of green and black tea under different brewing conditions. Zeitschrift
für Lebensmittel-Untersuchung und Forschung. 208: 217–220.
Lopez, A.S., Dimick, P.S. (1995): Cocoa Fermentation. Biotechnology Second,
Completely Revised Edition, G. Reed, T.W. Nagodawithana, VCH Verlagsgesellschaft
mbH: 561-577.
Marschner, P., Neumann, G., Kania, A., Weiskopf, L., Lieberei, R. (2002): Spatial and
temporal dynamics of the microbial community structure in the rhizosphere of cluster
roots of white lupin (Lupinus albus L.). Plant and Soil. 246: 167–174.
McJannet, D., Wallace, J., Reddell, P. (2007): Precipitation interception in Australian
tropical rainforests: I. measurement of stemflow, throughfall and cloud interception.
Hydrological Processes. 21: 1692-1702.
Miller, N.J., Rice-Evans, C.A., Davies, M.J., Gopinathan, V., Milner, A. (1993): A
novel method for measuring antioxidant capacity and its application to monitoring
the antioxidant status in premature neonates. Clinical Science. 84: 407-412.
Muoghalu, J.I., Oakhumen, A. (2000): Nutrient content of incident rainfall,
throughfall and stemflow in a Nigerian secondary lowland rainforest. Applied
Vegetation Science. 3: 181-188.
Nair, P.K.R. (1985a): Classification of agroforestry systems. Agroforestry Systems.
3:97-128.

137
Nair, P.K.R. (1985b): Agroforestry in the context of land clearing and development.
In: Tropical Land Clearing for Sustainable Agriculture, IBSRAM Proceedings. No.3,
IBSRAM, Bangkok, Thailand.
Nair, P.K.R. (1989): Agroforestry System in the Tropics. Kluwer Academic
Publishers, Boston, MA, USA.
Nair, P.K.R. (1993): An Introduction to Agroforestry. Kluwer Academic Publishers,
Dordrecht, the Netherlands.
Niemenak, N., Cilas, C., Rohsius, C., Bleiholder, H., Meier, U., Lieberei, R. (2009):
Phenological growth stages of cacao plants (Theobroma sp.): codification and
description according to the BBCH scale. Annals of Applied Biology. 156: 13-24.
Obiri, B.D., Bright, G.A., McDonald, M.A., Anaglaaere, L.C.N., Cobbina, J. (2007):
Financial analysis of shaded cocoa in Ghana. Agroforestry Systems. 71: 139-149.
Odum, H.T. (1983): Systems ecology: an introduction. Wiley, New York. 644: 1.
Ojo, G.J.A. (1966): Yoruba Culture. University of Ife and London Press, London,
UK. 7-10.
Pettipher, G.L. (1990): The extraction and partial purification of cocoa storage
proteins. Café Cacao Thé. 34: 23-26.

138
Rohsius, C., Matissek, R., Lieberei, R. (2006): Free amino acid amounts in raw
cocoas from different origins. European Food Research and Technology 222: 432-
438.
Rohsius, C., Elwers, S., Lieberei, R. (2010): Cocoa Atlas. DresenFunke GmbH.
Stiftung der Deutschen Kakao- und Schokoladen wirtschaft Corporation.
Schwan, R. F., Wheals, A. E. (2004). The microbiology of cocoa fermentation and its
role in chocolate quality. Critical Reviews in Food Science and Nutrition. 44: 205–221.
Schroth, G., Zech, W. (1995): Root length dynamics in agroforestry with Gliricidia
sepium as compared to sole cropping in the semi deciduous rainforest zone of West
Africa. Plant and Soil. 170: 297-306.
Schroth, G., da Silva, L.F., Wolf, M.A., Teixeira, W.G., Zech, W. (1999):
Distribution of throughfall and stemflow in multi-strata agroforestry, perennial
monoculture, fallow and primary forest in Central Amazonia, Brazil. Hydrological
processes. 13: 1423-1436.
Smith, P., Powlson, D.S., Glendining, M.J., Smith, J.U. (1997): Potential for carbon
sequestration in European soils: preliminary estimates for five scenarios using results
from long-term experiments. Global Change Biology. 3: 67-79.
Sounigo, O., Lachenaud, P., Bastide, P., Cilas, C., N’Goran, J., Lanaud, C. (2003):
Assessment of the value of doubled haploids as progenitors in cocoa (Thebroma
cacao L.) breeding. Journal of Applied Genetics. 44(3): 339-353.
Spencer, M.E., Hodge, R. (1992): Cloning and sequencing of a cDNA encoding the
major storage proteins of Theobroma cacao L. Planta 186: 567–576.

139
Stoll, L. (2010): Biochemische Indikatoren für Keimung und Fermentation in Samen
von Kakao (Theobroma cacao L.). PhD Thesis, University of Hamburg.
Tscharntke, T., Clough, Y., Bhagwat, S. A., Buchori, D., Faust, H., Hertel, D.,
Hölscher, D., Juhrbandt, J., Kessler, M., Perfecto, I., Scherber, C., Schroth, G.,
Veldkamp, E., Wanger, T.C. (2011): Multifunctional shade-tree management in
tropical agroforestry landscapes - a review. Journal of Applied Ecology. 84: 619-629.
Tomlins, K.I., Baker, D.M., McDowell, I.J. (1990): HPLC method for the analysis of
organic acids, sugars and alcohol in extracts of fermenting cocoa beans.
Chromatographia. 29: 557-561.
Torres, M.R., Momsen, H.J. (2011): Tourism and agriculture: New geographies of
consumption, production and rural restructuring. Routledge Publishers, New York,
NY 10016.
Voigt, J., Biehl, B., Wazir, S.K.S. (1993): The major seed proteins of Theobroma
cacao L. Food Chemistry. 47: 145-151.
Voigt, J., Biehl, B., Heinrichs, H., Kamaruddin, S., Gaim Marsoner, G., Hugi, A.
(1994a): In-vitro formation of cocoa-specific aroma precursors: aroma-related
peptides generated from cocoa-seed protein by co-operation of an aspartic
endoprotease and a carboxypeptidase. Food Chemistry. 49: 173-180.
Voigt, J., Heinrichs, H., Voigt, G., Biehl, B. (1994b): Cocoa-specific aroma
precursors are generated by proteolytic digestion of the vicilin-like globulin of cocoa
seeds. Food Chemistry, 50: 177-184.

140
Voigt, J. (2013): Chocolate and cocoa aroma. In: Chocolate in health and nutrition.
Pp. 89-101.
Wilken, G.C. (1977): Integrating forest and small-scale farm systems in Middle
America. Agro-Ecosystems. 3: 291-302.
Wood, G.A.R., Lass, R. A. (1989): Cocoa. Longman Scientific & Technical, Harlow,
Reprinted.
Ziegleder, G. (1990): Linalool contents as characteristic of some flavour grade cocoas.
Zeitschrift für Lebensmittel-Untersuchung und Forschung. 191: 306–309.

141
7. Abbreviations
% Percentage
∑ Total sum
≥ Greater than or equal to
< Less than
≤ Less than or equal to
± Plus or minus
°C Degree Celsius
µg Microgram
µm Micrometer
µl Microliter
λ Wavelength in nm
A Absorbance
ABTS 2,2-azino-di(3-ethyl-benzothiazolin-(6)-sulfonate
Ala Alanine
ANOVA Analysis of variance
Arg Arginine
Asn Asparagine
Asp Aspartic acid
bp Boiling point
cm Centimeter
Da Dalton
Dom. Rep. Dominican Republic
F Frequency
ffdm Fat free dry mass
Fig. Figure
g Gram
GABA γ-Aminobutyric acid
Gha Ghana
Gln Glutamine
Glu Glutamic acid
Gly Glycine

142
h Hour
HCl Hydrochloric acid
HPLC High Performance Liquid Chromatography
ICCO International Cocoa Organisation
ICRAF International Center for Research in Agroforestry
Ile Isoleucin
IvCoast Ivory Coast
kg Kilogramm
KOH Potassium hydroxide
l Liter
Leu Leucine
LMW marker Low Molecular Weight marker
LSD Least Significance Difference
Lys Lysine
m Meter
Max Maximum
mbar Millibar
mg Milligramm
min Minute
Min Minimum
ml Milliliter
mm Millimeter
mmol Millimol
mol Mole
n Number of samples
nm Nanometer
p Probability
pH pH value
Phe Phenylalanine
RP-HPLC Reversed-Phase High Performance Liquid Chromatography
rpm Revolutions per minute
s Second
T/C Ratio of theobromine to caffeine content

143
Tab. Table
Thr Threonine
Tri Trinidad and Tobago
Tyr Tyrosine
v Volume
Val Valine
VCG Vicilin(7S)-Class Globulin
144
ACKNOWLEDGEMENTS
I wish to express my profound thanks and gratitude to Prof. Dr. Reinhard Lieberei
for giving me the opportunity to work on such an interesting topic. Your supervision
has been an eye-opener for me. I will always remember the help you offered me
during my entire study period at the University of Hamburg. I am also thankful to
Prof. Dr. Selma for accepting to be my second supervisor of this thesis.
I will also want to thank Dr. Rohsius, Dr. Elwers, Dr. Kadow and Dr. Reissdorf for
the guidance and help offered me throughout this thesis. Your great patience and
careful criticisms have been sources of inspiration for me.
My sincere gratitude also goes to Prof. David Seigler of the University of Illinois for
being very instrumental in reading through my scripts, making the necessary
corrections and also offering very helpful criticisms and suggestions.
Mention must also be made of the entire members of the Plant Ecology and Useful
Plants Working Group, University of Hamburg for the friendly and supportive
atmosphere that you created for me during my studies. Thank you Dr. Bahman, Dr.
Müller, Mrs. Puttfarken, Janine, Franziska and Julia. Even though I was so many
miles away from home, you made my stay in Hamburg very comfortable.
Finally, I would like to thank all my friends and other people in my life who helped
me in diverse ways up to this end. To Dr. Niemenak, Dr. Acheampong, Tom and
Sidiki, I say thank you. Louisa and Lilian, you are always the best!