Embed Size (px)
Citation preview

Investor PresentationResults for the nine months ended 30 September, 2017
17 January, 2018
PROPRIETARY & CONFIDENTIAL

© Dubai Aerospace Enterprise
Disclaimer | Forward looking statements
IMPORTANT NOTICE
This Presentation contains information that is proprietary and/or confidential in nature. Each recipient agrees (i) to treat this Presentation and the information contained herein in a confidential manner, (ii) to use this Presentation and such information only in connection with an evaluation of Dubai Aerospace Enterprise (DAE) Ltd (the "Company" or “DAE") and/or its subsidiaries and affiliates, and (iii) that this Presentation and such information shall not be divulged to any person or entity or reproduced, disseminated or disclosed by the recipient, directly or indirectly, in whole or in part, without the prior written consent of the Company.
Each recipient agrees not to (i) purchase or sell securities in violation of United States securities laws which, among other things, restrict any person who has material, non‐public information about a company from purchasing or selling securities of such company (and options, warrants and rights relating thereto), or (ii) communicate such information to any other person under circumstances in which it is reasonably foreseeable that such person is likely to purchase or sell such securities.
This Presentation is not intended as an offer to sell, or the solicitation of an offer to purchase, any security, the offer and/or sale of which can only be made by definitive offering documentation which will contain material information that is not set forth herein.
Nothing in this Presentation should be construed as a recommendation to invest in any securities that may be issued by DAE and/or any of its subsidiaries or affiliates or as legal, accounting, financial, tax or other advice. DAE is not acting as an advisor or fiduciary in any respect in connection with providing this Presentation.
Neither DAE nor any subsidiary or affiliate of DAE makes any representation or warranty, express or implied, as to the accuracy or completeness of the information contained herein, including as to the accuracy of any estimates or projections. All opinions included in this Presentation constitute DAE's judgment as of the date of this Presentation and are subject to change at any time without notification and at the sole discretion of DAE. Although DAE reserves the right to modify, revise and reissue this Presentation, DAE undertakes no obligation to provide the recipient with access to any additional information or to update any information contained in this Presentation.
Cautionary Statement Concerning Forward-Looking Statements
Certain information contained in this Presentation may constitute "forward-looking statements" which can be identified by the use of forward-looking terminology such as "may", "will", "should", “could”, “continue”, "expect", "anticipate", “predict”, "project", “plan”, "estimate", “budget”, “assume”, “potential”, “future”, "intend" or "believe" or the negatives thereof or other comparable terminology. These statements reflect DAE’s current expectations regarding future events, results or outcomes and are not guarantees of future results or financial condition. Actual results, performance, achievements or conditions may differ materially from those in the forward‐looking statements as a result of a number of factors, many of which are beyond DAE’s control.
Non-IFRS Financial Information
This Presentation may include certain non-IFRS financial information, such as Adjusted EBITDA, not prepared in accordance with IFRS. Because of the limitations of Adjusted EBITDA, it should not be considered as a substitute for financial information prepared or determined in accordance with IFRS, as applicable. Where applicable, DAE compensates for these limitations by relying primarily on its IFRS results and using Adjusted EBITDA only for supplemental purposes.
2
© Dubai Aerospace Enterprise
Agenda
Financial Metrics
3
Summary Overview
Appendix

© Dubai Aerospace Enterprise
DAE At A Glance | September 2017
~$3.2bnFinancings during 2017
28 purchases of aircraft
22 sales of aircraft
Scale Competitor (1) $14bn+of assets
World Class Platform IntegrationTarget Completion : Feb 2018
~140 People (5)
Across 6 Locations
1. As of Q3 2017.
2. Combined fleet included owned, managed and committed aircraft.
3. Weighted by Net Book Value of the owned and managed aircraft only
4. Includes managed aircraft
5. Excludes DAE Engineering
6. Includes consolidated ICD ownership
55Countries of Client Presence
Long-standing
Global Customer
Relationships (4)
113Airline Customers
Balanced Portfolio (3)
55%Narrow
Bodies
39%Wide
Bodies
6%ATR 72-600
1
2
3
4
5
Strategic, Long-term
Ownership~95%
Owned by Investment Corporation of Dubai (6)
6
4
384Aircraft (2)
Combined Fleet
Based in DIFCRobust Legal Framework
Funding and transactions4
34%Asia
Pacific
33% 19%MEASA Europe
14%Americas
© Dubai Aerospace Enterprise
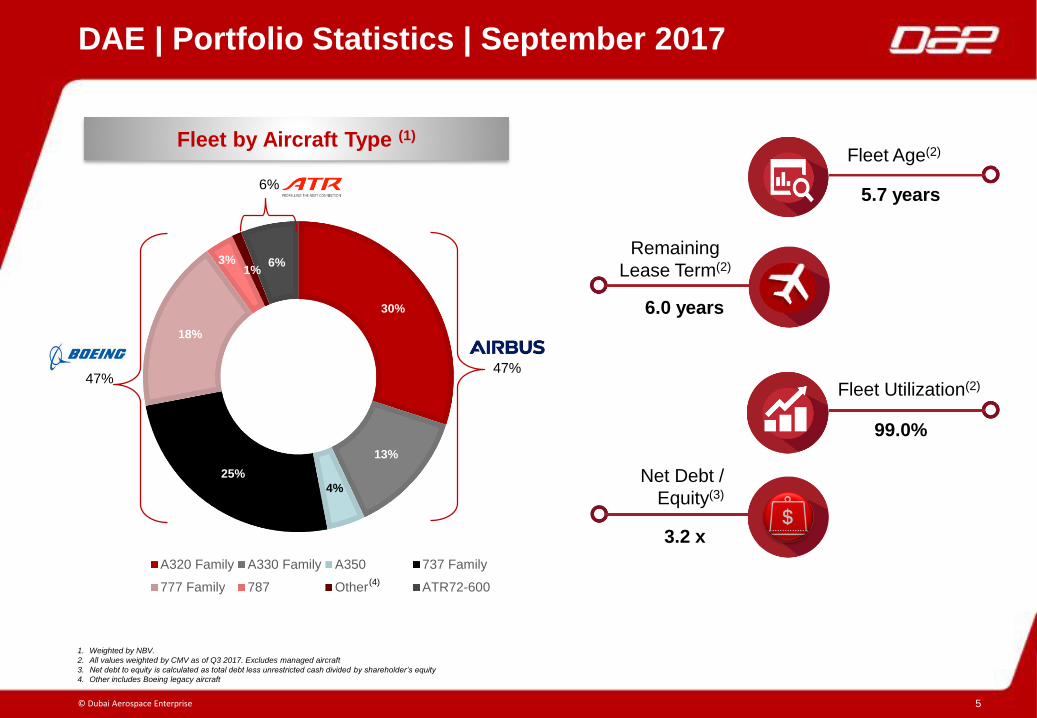
30%
13%
4%
25%
18%
3%1%
6%
A320 Family A330 Family A350 737 Family
777 Family 787 Other ATR72-600
DAE | Portfolio Statistics | September 2017
1. Weighted by NBV.
2. All values weighted by CMV as of Q3 2017. Excludes managed aircraft
3. Net debt to equity is calculated as total debt less unrestricted cash divided by shareholder’s equity
4. Other includes Boeing legacy aircraft
5
Fleet by Aircraft Type (1)
(4)
Fleet Age(2)
Remaining
Lease Term(2)
6.0 years
5.7 years
99.0%
Net Debt /
Equity(3)
3.2 x
Fleet Utilization(2)47%
47%
6%
© Dubai Aerospace Enterprise
Agenda
Financial Metrics
Summary Overview
6
Appendix
© Dubai Aerospace Enterprise
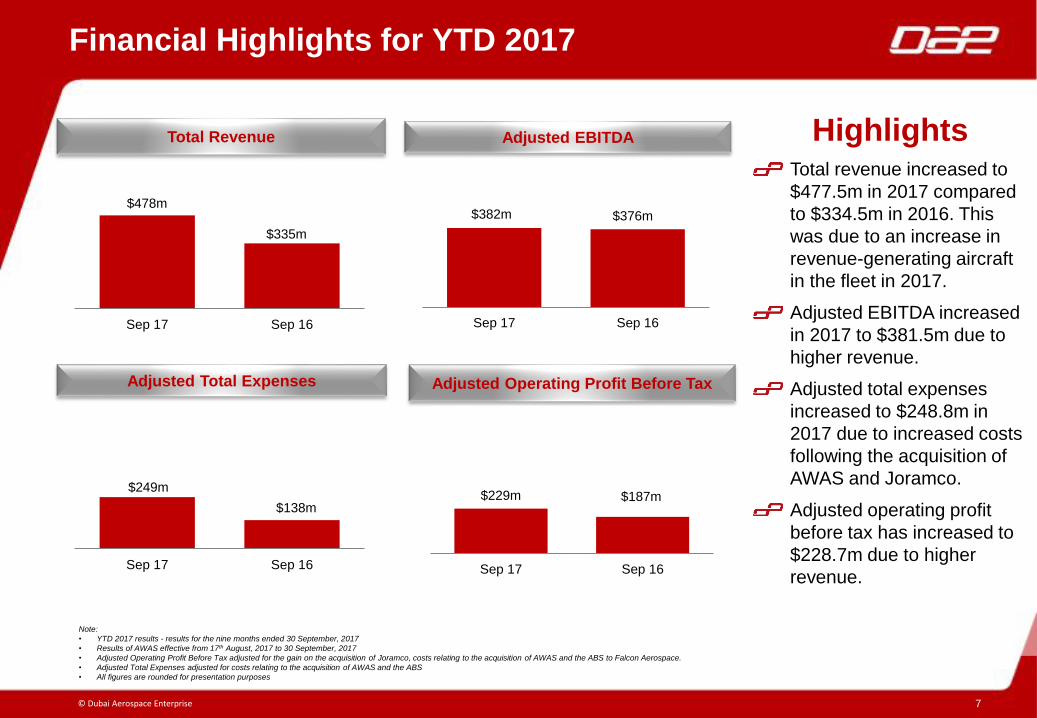
$382m $376m
Sep 17 Sep 16
$249m
$138m
Sep 17 Sep 16
7
Financial Highlights for YTD 2017
Note:
• YTD 2017 results - results for the nine months ended 30 September, 2017
• Results of AWAS effective from 17th August, 2017 to 30 September, 2017
• Adjusted Operating Profit Before Tax adjusted for the gain on the acquisition of Joramco, costs relating to the acquisition of AWAS and the ABS to Falcon Aerospace.
• Adjusted Total Expenses adjusted for costs relating to the acquisition of AWAS and the ABS
• All figures are rounded for presentation purposes
Adjusted Operating Profit Before Tax
Total Revenue
$229m $187m
Sep 17 Sep 16
$478m
$335m
Sep 17 Sep 16
Adjusted EBITDA HighlightsTotal revenue increased to
$477.5m in 2017 compared
to $334.5m in 2016. This
was due to an increase in
revenue-generating aircraft
in the fleet in 2017.
Adjusted EBITDA increased
in 2017 to $381.5m due to
higher revenue.
Adjusted total expenses
increased to $248.8m in
2017 due to increased costs
following the acquisition of
AWAS and Joramco.
Adjusted operating profit
before tax has increased to
$228.7m due to higher
revenue.
Adjusted Total Expenses

© Dubai Aerospace Enterprise 8
Revenue YTD 2017
Emirates, 37.2%
Vietnam Airlines,
7.1%
EVA Airways,
5.4%
Azul, 4.8%
Garuda , 4.7%
Note:
• YTD 2017 results - results for the nine months ended 30 September, 2017
• Results of AWAS effective from 17th August, 2017 to 30 September, 2017
• All figures are rounded for presentation purposes
Top 5 Lessee by Lease Revenue
$441m
$33m $4m
$325m
$0m $10m
Total leaserevenue
Service revenue -Joramco
Other income
Breakdown of Revenue
Total lease revenue increased due to a higher number of aircraft in the fleet and increased
maintenance revenue.
Joramco revenue amounted to $33 million in 2017 following the acquisition on 30 September, 2016.
Top 5 lessees represent 59.2% of the portfolio based on lease revenue. Excluding Emirates the next
top 5 lessees represent 25.3% of the portfolio based on lease revenue.
© Dubai Aerospace Enterprise 9
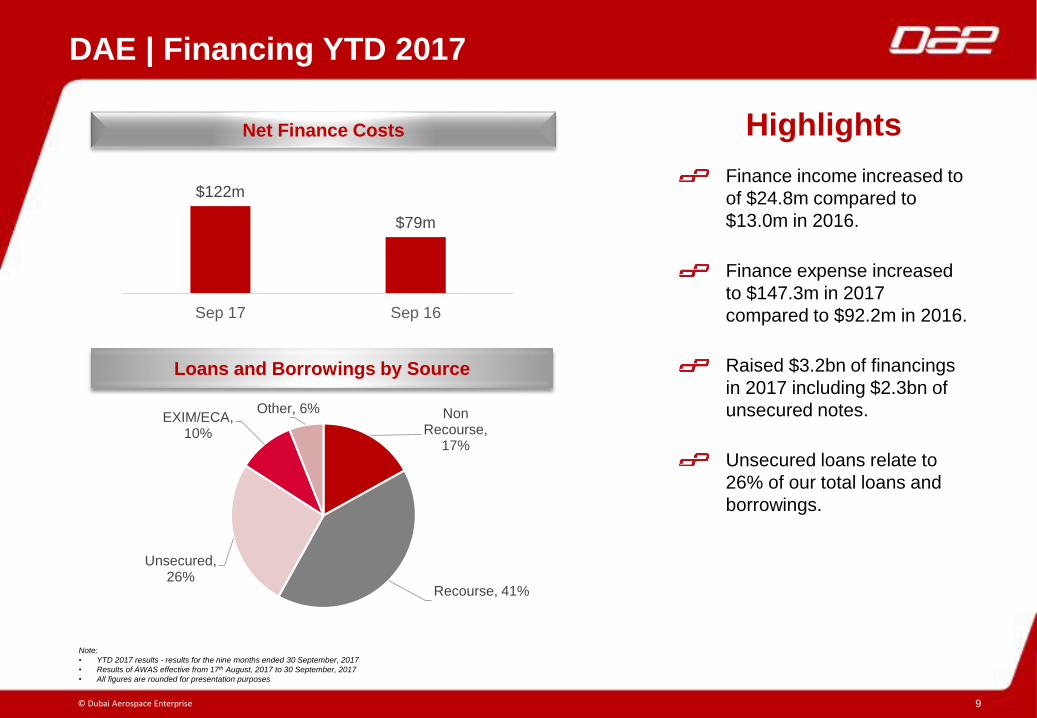
DAE | Financing YTD 2017
Loans and Borrowings by Source
Note:
• YTD 2017 results - results for the nine months ended 30 September, 2017
• Results of AWAS effective from 17th August, 2017 to 30 September, 2017
• All figures are rounded for presentation purposes
Non Recourse,
17%
Recourse, 41%
Unsecured, 26%
EXIM/ECA, 10%
Other, 6%
Highlights
Finance income increased to
of $24.8m compared to
$13.0m in 2016.
Finance expense increased
to $147.3m in 2017
compared to $92.2m in 2016.
Raised $3.2bn of financings
in 2017 including $2.3bn of
unsecured notes.
Unsecured loans relate to
26% of our total loans and
borrowings.
Net Finance Costs
$122m
$79m
Sep 17 Sep 16

© Dubai Aerospace Enterprise 10
DAE | Historical Financial Highlights
Note - Selected data above
• YTD 2017 results - results for the nine months ended 30 September, 2017
• Results of AWAS effective from 17th August, 2017 to 30 September, 2017
• All figures are rounded for presentation purposes
$2,768m $3,083m
$10,108m
Dec 2015 Dec 2016 Sep 2017
$4,863m $5,233m
$14,911m
Dec 2015 Dec 2016 Sep 2017
$230m $245m
$654m
Dec 2015 Dec 2016 Sep 2017
$1,573m $1,678m
$3,066m
Dec 2015 Dec 2016 Sep 2017
Total Loans and Borrowings
Total Assets Total Equity
Operating Cash Flow

© Dubai Aerospace Enterprise
Summary
11
2017 – Transformative year for DAE
Stage set for future growth over the next decade
Integration on track – expect no issues
Combined organization working as one, integrated platform
2018 Priorities set and cascaded to the organization
2018 Financing may include a 144a bond and sukuk issuance
Discussions progressing with OEMs about new aircraft order
Summary
© Dubai Aerospace Enterprise
Agenda
Appendix
Summary Overview
12
Financial Metrics
© Dubai Aerospace Enterprise
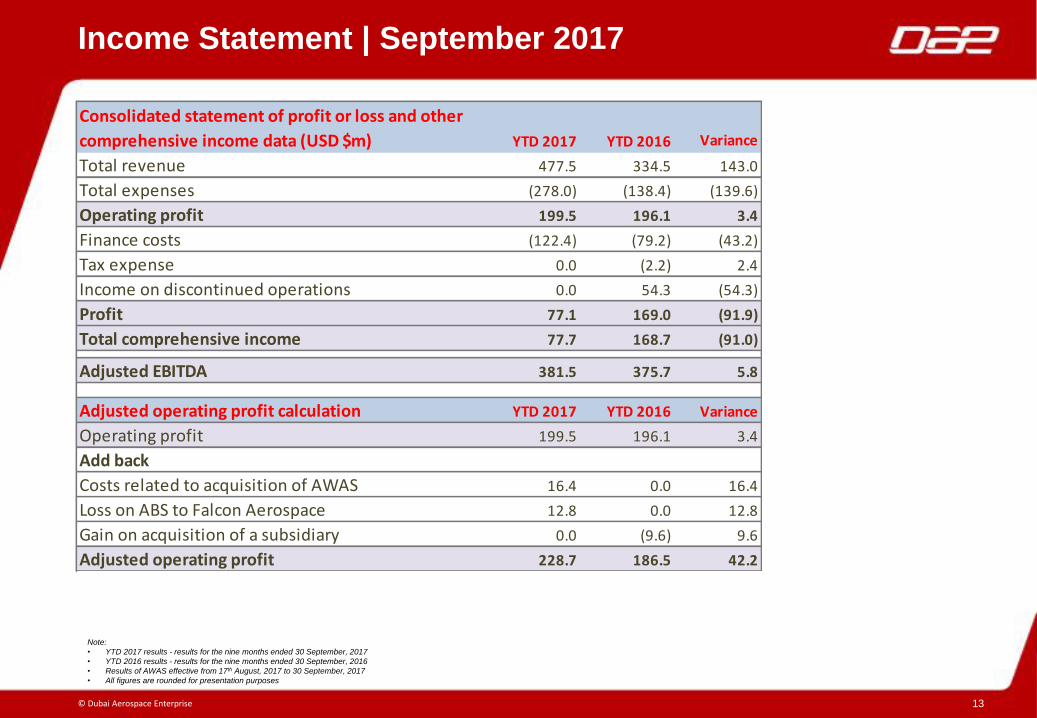
Income Statement | September 2017
13
Note:
• YTD 2017 results - results for the nine months ended 30 September, 2017
• YTD 2016 results - results for the nine months ended 30 September, 2016
• Results of AWAS effective from 17th August, 2017 to 30 September, 2017
• All figures are rounded for presentation purposes
Variance
Total revenue 477.5 334.5 143.0
Total expenses (278.0) (138.4) (139.6)
Operating profit 199.5 196.1 3.4
Finance costs (122.4) (79.2) (43.2)
Tax expense 0.0 (2.2) 2.4
Income on discontinued operations 0.0 54.3 (54.3)
Profit 77.1 169.0 (91.9)
Total comprehensive income 77.7 168.7 (91.0)
Adjusted EBITDA 381.5 375.7 5.8
Adjusted operating profit calculation YTD 2017 YTD 2016 Variance
Operating profit 199.5 196.1 3.4
Add back
Costs related to acquisition of AWAS 16.4 0.0 16.4
Loss on ABS to Falcon Aerospace 12.8 0.0 12.8
Gain on acquisition of a subsidiary 0.0 (9.6) 9.6
Adjusted operating profit 228.7 186.5 42.2
Consolidated statement of profit or loss and other
comprehensive income data (USD $m) YTD 2017 YTD 2016

© Dubai Aerospace Enterprise 14
Balance Sheet and Cash Flow Statement |September 2017
Note - Selected data above
• YTD 2017 results - results for the nine months ended 30 September, 2017
• YTD 2016 results - results for the nine months ended 30 September, 2016
• Results of AWAS effective from 17th August, 2017 to 30 September, 2017
• All figures are rounded for presentation purposes
Consolidated balance sheet data (USD $m) 30-Sep-17 31-Dec-16 Variance
Total cash and cash resources 624.5 559.5 65.0
Aircraft held for lease 11,955.3 3,674.0 8,281.3
Total assets held-for-sale 49.6 557.7 (508.1)
Total assets 14,911.0 5,232.7 9,678.3
Total equity 3,066.0 1,677.7 1,388.3
Total loans and borrowings 10,108.3 3,082.7 7,025.5
Total equity and liabilities 14,911.0 5,232.7 9,678.3
Comparative period 31 December, 2016
Cashflow data (USD $m) YTD 2017 YTD 2016 Variance
Net cash from operating activities 654.1 355.8 298.3
Net cash from investing activities (2,537.1) (238.7) (2,298.4)
Net cash used in financing activities 1,714.2 (331.4) 2,045.7
Net (decrease)/increase in cash and cash equivalents (168.8) (214.3) 45.5
Cash and cash equivalents at the beginning of the period 480.2 803.6 (323.4)
Cash and cash equivalents 311.4 589.3 (277.9)
As at
As at

© Dubai Aerospace Enterprise 15