Embed Size (px)
Citation preview
RATES OF FUEL CONSUMPTION IN THE MALDIVIAN POLE-AND-LINE TUNA FISHERYKelsey I. Miller, M. Shiham Adam, and Adam Baske

This report was prepared by Kelsey I. Miller1, M. Shiham Adam2 and Adam Baske1 for the International Pole & Line Foundation and the Maldives Marine Research Centre.
This paper has been peer reviewed and published in line with IPNLF’s Technical Series publishing guidelines, which includes an external peer review managed by IPNLF’s Editorial Board .
Editor: Dr. Charles Anderson
Author affiliations: 1International Pole & Line Foundation, London, United Kingdom2Marine Research Centre, Malé 20-025, Republic of Maldives
The report should be cited as follows:Miller KI, Adam MS, Baske A, (2017) Rates of Fuel Consumption in the Maldivian Pole-and-Line Tuna Fishery. International Pole & Line Foundation, London and Marine Research Centre, Maldives. 39 pages.
Keywords: Fuel use, Pole-and-line, Tuna fishery, Indian Ocean, Maldives
International Pole & Line FoundationThe International Pole & Line Foundation (IPNLF) works to develop, support and promote so-cially and environmentally responsible pole-and-line, handline and troll tuna fisheries around the world. IPNLF’s ambition is to contribute to thriving coastal fisheries, including the people, communities, businesses and seas connected with them. As a hub for sustainably-minded organ-isations, we use the influence of the market to forge change through practical fishery projects and stakeholder cooperation. IPNLF membership is open to organisations involved in the one-by-one caught tuna supply chain. Allied with our Members, IPNLF demonstrates the value of one-by-one caught tuna to consumers, policymakers and throughout the supply chain. We work across science, policy and the seafood sector, using an evidence-based, solutions-focused approach with guidance from our Scientific & Technical Advisory Committee and Board of Trustees. IPNLF was officially registered in the United Kingdom in 2012 (Charity 1145586), with branch offices in London and the Maldives, and a staff presence in Indonesia, France, South Africa and the United States.
Marine Research Centre of the MaldivesThe Marine Research Centre (MRC) of the Maldives, founded in 1984, is the research arm of the Ministry of Fisheries and Agriculture (MoFA). MRC is mandated to undertake research on living marine resources and to provide scientific advice on marine resource management and on the state of the marine environment to the Ministry of Fisheries and Agriculture, Maldives.
Cover image: Pole-and-line fishing for tuna in the Maldives. By Kelsey Miller, © IPNLF

3
Contents
Table of Contents
Contents 3
Acronyms 5
Executive Summary 6
Introduction 9
Fuel Use Intensity 11
The Republic of Maldives 11
Fishery Description 12
Fishing Vessels 14
Methods 15
Data Collection/Sources 16
Observer Data 16
Fuel Subsidy Data 17
Processor Data 17
Data Analysis 18
Results 19
Observer Data 20
Fuel Subsidy Data 21
Processor Data 22

4
Contents
Discussion 25
Factors Influencing Fuel Use Intensity 28
Stock Abundance /Annual Variation 28
Fishery target 28
Vessel Size 29
FADs 30
Other Factors 30
Limitations 31
Observer Data 31
Fuel Subsidy Data 31
Processor Data 32
Opportunities for Improvement 32
Fuel Use in Context 33
Conclusions 34
Acknowledgments 36
References 37
Acronyms
Acronyms
aFAD Anchored Fish Aggregating Device
dFAD Drifting Fish Aggregating Device
EEZ Exclusive Economic Zone
FAD Fish Aggregating Device
FUI Fuel Use Intensity, litres of fuel burned per landed wet weight tonne
ft Foot/feet (1ft = 30.48cm)
GHG Greenhouse gas
HP Horsepower (1 HP = 746 watts)
IOTC Indian Ocean Tuna Commission
IPNLF International Pole & Line Foundation
LOA Length overall
l/t Litres of fuel used per metric tonne of fish landed
KFC Kooddoo Fisheries Complex, Maldives
MFC Maandhoo Fisheries Complex, Maldives
MIFCO Maldives Industrial Fisheries Company Limited
MoFA Ministry of Fisheries and Agriculture, Maldives
MRC Maldives Research Centre, Maldives
MSC Marine Stewardship Council
MVR Maldivian Rufiyaa (during this study MVR15.42 = US$1.00)
nm Nautical mile (1nm = 1.852km)
t Metric tonne (1t = 1000kg)
VMS Vessel Monitoring System
5
1. Executive Summary
© IPNLF
Executive Summary
7
Executive SummaryMarine fisheries supply much of the world’s animal protein, but most are dependent on fossil fuels. Understanding the level of fuel use associated with capture fisheries is critical for two reasons. First, the cost of fuel affects profitability, which conse-quently may impact employment, food supply and food security. Secondly, fossil fuel use has environmental impacts, which are increasingly being evaluated as part of more comprehensive evaluations of sustainability. Fuel Use Intensity (FUI) is a common metric used to evaluate the amount of fuel used in capture fisheries, and is defined as litres of fuel burned per wet weight tonne of fish landed. So far, most FUI studies have been on large industrial European fisheries, while fisheries that are small-scale and/or in less developed countries have typically been overlooked (Parker and Tyedmers 2015).
This study evaluates FUI for the pole-and-line tuna fishery in the Republic of Mal-dives, a small archipelagic nation in the Indian Ocean. The fishery targets skipjack (Katsuwonus pelamis) and accounts for roughly one-fifth (21%) of all pole-and-line caught tuna in the world. Fuel use intensity for the Maldivian pole-and-line tuna fishery was assessed using three separate data sources:
1. Fishery observer data (fuel used and fish caught per trip), recorded by Interna-tional Pole & Line Foundation (IPNLF) and Marine Research Centre (MRC) ob-servers in 2014-2015;
2. Fuel subsidy records (logbooks and receipts for fish sales and fuel purchases), during 2012-2013 from the Ministry of Fisheries and Agriculture (MoFA); and
3. Fish processor receipts of landings and fuel sales from two of the largest fish processors in the nation, Maandhoo Fisheries Complex (2010-2014) and Kooddoo Fisheries Complex (2006 and 2010-2011).
Estimates of FUI from these three sources were: 328 litres of fuel per landed metric ton (l/t) from observer data, 322 l/t from fuel subsidy data, and 197 l/t from proces-sor data.
These values for Maldivian pole-and-line tuna fishery FUIs are between approxi-mately 30-50% of the FUI average for all fisheries with fuel use records, which is between 600 l/t and 639 l/t (Tyedmers et al. 2005; Parker and Tyedmers 2015). Maldivian pole-and-line FUI is slightly lower than that for purse-seine-caught tuna,
Executive Summary
8
and roughly 80% less than the only previous estimate of FUI for another pole-and-line tuna fishery, that for offshore albacore (Thunnus alalunga) and Atlantic bluefin tuna (Thunnus thynnus) in the Atlantic (Parker and Tyedmers 2015).
These FUI values of between 197 l/t to 328 l/t suggest that the Maldivian pole-and-line tuna fishery is relatively fuel-efficient. While FUI is only one facet of sustainabil-ity, the Maldivian pole-and-line tuna fishery also has low levels of bycatch, minimal impact on the marine environment and contributes towards social benefits, includ-ing food security and rural employment.
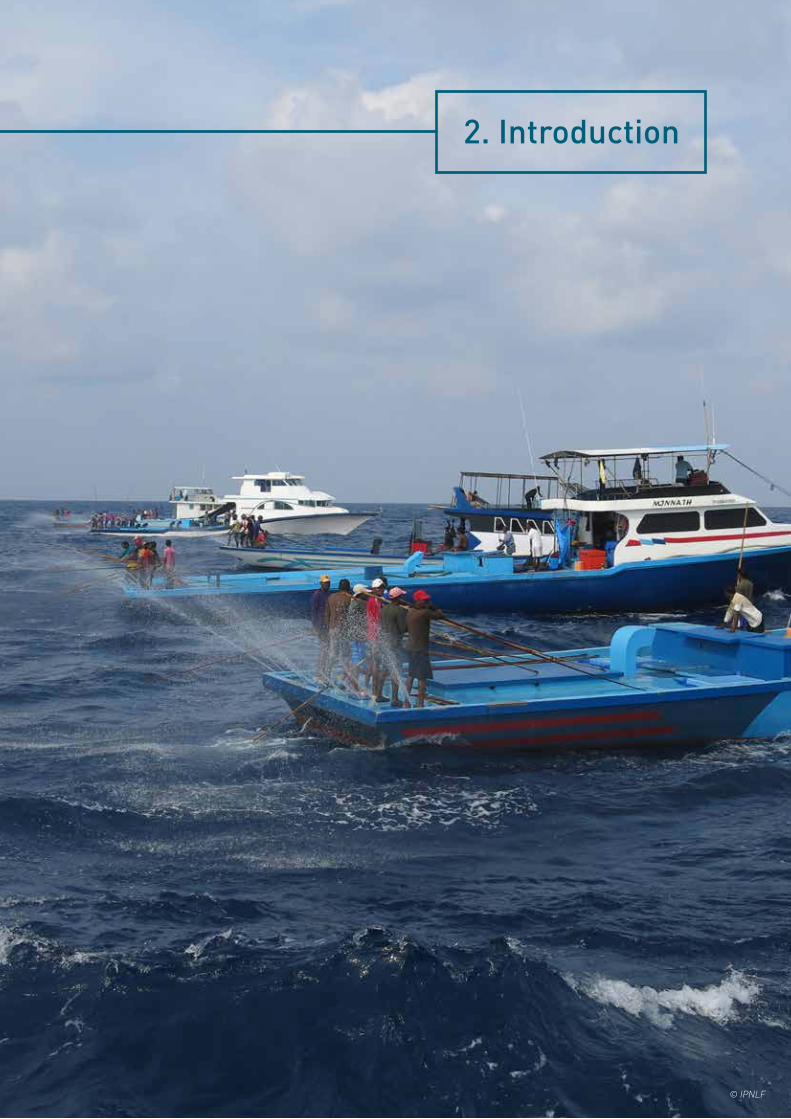
2. Introduction
© IPNLF

10
Introduction
IntroductionMarine capture fisheries are an essential source of animal protein worldwide, and are particularly critical in Republic of Maldives, where the per capita consumption of sea-food is the highest in the world (FAO 2014). Like most other fisheries in the world, Mal-divian fisheries are dependent on fossil fuels. Understanding levels of fuel use in marine capture fisheries is important for two reasons. First, fuel is typically among the largest costs in fishing operations. Cost of fuel can affect the ability of fishers to catch fish, with implications for fishery profitability and for food supply and security. Some have specu-lated that the fuel cost as a percentage of revenue is increasing worldwide (Pelletier et al. 2014). The relative cost of fuel to other operating costs is typically higher in Africa, and Central and South America (including the Caribbean) than in Europe, North America and Oceania, largely due to the high labour costs in the more developed regions (Lam et al. 2011). Under these circumstances, fuel prices and FUI are more closely linked to food security in developing countries. Pelletier et al. (2014) found that fishery food security risks were strongly associated with development status, and developing countries (such as the Maldives) were the most vulnerable to fuel price changes.
Secondly, fossil fuel use has environmental impacts, and these are increasingly under scrutiny across all sectors of food production (e.g. Weber and Matthews 2008). Consum-ers are increasingly assessing the total environmental impacts of food sources (Madin and Macreadie 2015), with evaluations in the seafood sector going beyond stock status, bycatch and habitat impacts. In addition to inter-fishery fuel use comparisons, cumula-tive emissions from marine capture fisheries worldwide have been compared against other industries. Roughly one third (32%) of the world’s global energy consumption is used in the food sector (Sims 2011). Marine capture fisheries used an estimated 42.4 mil-lion tonnes of fuel in 2005, at a cost of $22.5 billion annually (Willman et al. 2009); this equated to 1.2% of global fuel consumption (as of 2000), releasing 134 million tonnes of carbon dioxide (Tyedmers et al. 2005).
In capture fisheries, relatively few studies have evaluated fuel use (Avadí and Fréon 2013), and those that have focussed primarily on large industrial fisheries in Europe (Parker and Tyedmers 2015). In such fisheries, variation in fuel efficiency appears to be closely related to gear type (Tyedmers et al. 2005; Schau et al. 2009; Avadí and Fréon 2013; Parker and Tyedmers 2015). Purse-seine fisheries for small pelagics (e.g. anchovy, mackerel, sardine) are often more efficient than bottom trawl and trap fisheries (espe-cially for crustaceans), or some longline or troll fisheries (Parker and Tyedmers 2015).

11
Introduction
Small-scale fisheries are frequently assumed to be more fuel efficient than larger scale fisheries (e.g. Carvalho et al. 2011), but this generalisation does not take into account the high variation between fisheries. To date, small-scale fisheries and those in less devel-oped countries have largely been overlooked. As such, it was considered a priority to eval-uate the fuel use of pole-and-line fishing in the Maldives for comparison to larger-scale tuna fisheries (Parker and Tyedmers 2015). While Tyedmers and Parker (2012) provided preliminary estimates of fuel use across several tuna fisheries, only one example of tuna pole-and-line was represented in their study: the Atlantic albacore and bluefin fishery. That fishery is quite different from the Maldivian skipjack fishery in terms of the relative abundance of target species, distance travelled to catch fish and the value of landings. Both albacore (Thunnus alalunga) and Atlantic bluefin (Thunnus thynnus) are less abun-dant than skipjack but are more valuable; the high unit value of the catch allows the At-lantic pole-and-line fishery to maintain profitability despite high fuel usage.
Fuel Use IntensityFuel Use Intensity (FUI) is a common metric for evaluating the amount of fuel used in capture fisheries, and is defined as litres of fuel burned per landed wet weight tonne landed (Tyedmers 2004). Several studies have shown that actual fishing activities are the most energy-intensive step in seafood production (Ziegler et al. 2003; Thrane 2004). They are typically responsible for approximately 75-90% of total energy use and greenhouse gas emissions in the production of most sea-food (Tyedmers 2001,2004; Ziegler et al. 2016). A notable exception is for those fisheries which use post-harvest air-freight, which can account for over half of carbon emissions (Farmery et al. 2014).
The Republic of MaldivesThe Republic of Maldives is an archi-pelagic atoll chain in the central Indian Ocean, running north-south along 73°E from about 7°N to 1°S (Figure 1). There are some 1,200 islands, grouped across 26 natural atolls. The Maldives is tradition-ally a tuna fishing nation, with the fishery dating back at least 800 years (Anderson
Figure 1. Map of the Maldives, showing
exclusive economic zone (EEZ) boundary.
India
Sri Lanka
Male
105
0-5
70 75 80
Maandhoo
Kooddoo

12
Introduction
et al. 1998; Adam 2006). The primary fishing method is livebait pole-and-line. Histori-cally, fishing vessels were sail-powered, but most were motorized in the mid-1970s. The Maldivian fishery accounts for roughly one-fifth (21%) of all pole-and-line caught tuna in the world; Japan (37%) and Indonesia (14%) are the other major pole-and-line fishing nations (Miyake et al. 2010; Gillett 2016). Approximately 80,000 t were landed in the Maldives annually from 2010-2014 from pole-and-line, with the catch comprising rough-ly 80% skipjack, 18% yellowfin and 2% other tunas (Ahusan et al. 2016).
The Maldives has the highest per capita fish consumption in the world (FAO 2014), and much of the social fabric of the country, especially in its outer island communities, is closely linked with tuna fish and fishing. Maldivian pole-and-line tuna fishing is typically cited as environmentally friendly due to its highly selective nature, with virtually no by-catch and essentially no habitat impact (Miller et al. 2016; Miller et al. 2017). In recogni-tion of its environmental sustainability, the Maldives pole-and-line skipjack fishery was certified by the Marine Stewardship Council (MSC) in 2012 (MSC 2016).
The growing interest worldwide in the overall sustainability of fisheries, including con-trol of greenhouse gas (GHG) emissions resulting from harvest, highlights the need for a close examination of how fuel is used in the Maldivian pole-and-line tuna fishery. In 2013, a socio-economic study of the tuna fisheries provided a rough estimate of FUI of 233-398 l/t, with variation based on vessel size (Höhne-Sparboth et al. 2013). However, that study used average fuel and catch estimates from different years, and recognised that a larger-scale study was required. This report examines fuel use throughout the Mal-divian pole-and-line fishery using multiple data sources to estimate FUI, and to identify patterns and key influencing factors. This information can provide direct feedback to as-sess the environmental credentials of the fishery, to establish a baseline for comparison with other tuna fisheries, and to highlight areas for improvements.
Fishery DescriptionThe Maldivian tuna fisheries include pole-and-line, handline, troll and longline harvest methods. Pole-and-line and handline are the most important fishing methods as they contribute more than 90% of reported national tuna landings (MoFA unpublished data, Ahusan et al. 2016) (Figure 2). The three most important species, in order of tonnage landed are skipjack (Katsuwonus pelamis), yellowfin (Thunnus albacares) and bigeye tuna (Thunnus obesus), with combined annual pole-and-line catches of about 80,000 t (Adam et al. 2014a; Adam et al. 2014b; Ahusan et al. 2016). Bigeye tuna was not historically

13
Introduction
differentiated from yellowfin tuna in official records, and so few landings data are available prior to 2015. Small quantities of kawakawa (Euthynnus affinis) and frigate tuna (Auxis thazard) are also caught and landed, primarily by trolling and pole-and-line.
Pole-and-line fishing includes two separate components: fishing for live baitfish and fishing for tuna. Because these activities are generally conducted in the same trip, fuel use data include fishing for both. The most common bait species is silver sprat (Spratelloides gracilis) but blue sprat (S. delicatulus), several species of fusiliers (Cae-sionidae), an anchovy (Encrasicholina heteroloba) and cardinalfishes (Apogonidae) are also used (Anderson et al. 1998; Anderson 2009; Jauharee et al. 2015).
Tuna fishing occurs offshore, in the open ocean, typically within 20-130 km (10-70 nau-tical miles) of the atolls (Adam et al. 2013). Fishers locate schools of tuna most frequent-ly by the presence of seabirds or another fishing boat, or by association with a floating object (natural logs, drifting fish aggregating devices [dFADs] or anchored fish aggre-gating devices [aFADs]). The Maldivian Ministry of Fisheries and Agriculture (MoFA) maintains a network of some 50 aFADs deployed all around the archipelago, mostly within 22-28 km (12-15 nm) of the atolls (Adam et al. 2015). Approximately 50% of the Maldivian pole-and-line tuna catch is currently taken from these aFADs (Jauharee and Adam 2012), up from an estimated 44% in the early 1990s (Anderson et al. 1996).
Figure 2: Maldivian skipjack and yellowfin tuna catches by gear for 2010-2016 (Source:
MoFA Statistics, unpublished data). PL = pole-and-line, HL = handline, LL = longline,
and TR = troll.
TR
LL
HL
PL
80Skipjack
Tonn
es (0
00’s)
Year
Yellowfin
70
60
50
40
30
2010 20
1120
1220
1320
1420
1620
15
20
10
0
2010 20
1120
1220
1320
1420
1620
15
14
Introduction
Roughly 60% of tuna landings are exported, either frozen, canned, pouched, fresh or dried, with a total declared value of about US$160 million per year (Maldives Customs Services 2016). The tuna fisheries directly employ about 15,000 people, of which all of the fishers must be Maldivian, by law (MoFA 2013). Due to high fuel costs, fuel subsidies were given to commercial fishers between 2008 and 2013.
Fishing Vessels Maldivian pole-and-line fishing vessels (dhonis) are constructed locally. Currently, most new fishing vessels have fibreglass hulls, although there are many vessels with wooden hulls still in operation. Vessels are typically between 15-37 m (75-120 feet [ft]) length overall (LOA), with an average of approximately 26 m (85 ft) LOA. Vessels have a low deck, with bait wells and fish storage below deck. The low stern of the vessel allows for easy angling of tuna while standing on the transom. Most vessels in this fishery have inboard diesel engines ranging from about 370-750 kW (500-1000 horsepower [HP]), although some have much smaller engines.

3. Methods
© IPNLF
16
Methods
Methods Data Collection/SourcesFisheries catch and fuel use data were evaluated and compiled from three separate sourc-es: observer records, a government fuel subsidy program and private processing com-pany records. Limitations of the data are described in the Discussion. Fuel use intensity (FUI) was calculated as litres of fuel used in the catch of tuna and baitfish per metric ton of tuna landed, excluding bycatch and byproduct, which observer data suggest are ap-proximately equal to 0.65% of tuna landings (Miller et al. 2017).
Observer DataObserver trips (n=105) were conducted by experienced observers, including the prima-ry author (KM) and other experienced observers, Ibrahim Nadheeh and Riyaz Jauharee (Miller et al. 2017). They collected information on fuel use and landings by individual fish-ing trip from August 2014 to November 2015. Observed trips covered all regions of the Maldives during both monsoon seasons, with most effort in the south where pole-and-line fishing activities are concentrated. Vessels were chosen opportunistically and ranged from 16-35 m LOA, with 8-23 crew. Most fishing trips started in the late evening, included night baitfishing, a full day searching and fishing for tuna offshore, and a return to shore in the early evening (all but one trip included a single day of tuna fishing, one trip had two days).
Observers maintained detailed records of fishing activities. Effort data included vessel details, number of fishers/hooks, and the amount/type of bait used. Position, school as-sociation, sighting method and duration were recorded for each fishing event. Fishing events were defined as periods of active fishing that were separated by more than 10 min-utes. School association was recorded as one of six categories: aFAD, dFAD, natural log, floating man-made object, seamount or free school. Schools were defined as associated if the start of fishing was within roughly 1 nm (1.85 km) of any floating object, or within 5 nm (9 km) of a seamount (following Amandè et al. 2008). However, because dFADs and other floating objects are encountered randomly while searching for free schools or in transit, the fishing school target as defined in this study was considered to be the location the captain intended as the primary target, either aFAD, seamount, free school, or multiple, if more than one was visited in a day. A detailed description of observer sampling protocol is available in Miller et al. (2017).
Upon returning to shore, fuel purchases were typically used to verify the amount of fuel used, as larger vessels frequently refuel every time they return to port. If a vessel did not

17
Methods
purchase fuel between trips, the captain was asked to estimate the amount of fuel used (e.g. by checking the fuel tank).
Fuel Subsidy Data Fuel subsidies were given to commercial fishers during 2008-2010 and 2012-2013. It was re-ported that MVR100 million, or US$6.5 million, in fuel subsidies was budgeted for fishers in 2012 (Powell 2012). In 2012-2013, as part of this program, fishers were required to submit fuel purchase receipts and copies of their landing forms and/or logbooks to MoFA either biweekly or monthly in order to receive the subsidy. Thus, the data available include fuel purchases and fish landings during this time period, which are used here to estimate FUI. Vessel-specific fuel purchase and fish landings data were accessed from MoFA. Additional vessel data were accessed from MoFA to link the vessel name/registration number with vessel length and engine size from national vessel registration listings.
Receipts, logbooks and landing forms were collected by MoFA at the time of the subsidy program. These data were manually entered into Microsoft Excel by IPNLF and MRC staff. Forms that were incomplete, missing pages, or contained obvious discrepancies (e.g. pole-and-line fishery marked with only landings of yellowfin tuna) were excluded. Only vessels that fished exclusively by pole-and-line during the trip period were included. Processor DataPole-and-line tuna landings and fuel sales data were acquired from Kooddoo Fisheries Complex (KFC) and Maandhoo Fisheries Complex (MFC) (Figure 1), two tuna processing facilities in south-central Maldives. They are two of the three major purchasers of pole-and-line caught tuna in the Maldives. KFC in Gaafu Alifu Atoll is part of the state-run Maldives Industrial Fisheries Company Limited (MIFCO) and operates processing plants, collector vessels, landing docks and fuel depots. Similarly, MFC in Laamu Atoll operates process-ing plants, fishing vessels, collection vessels, landing docks and fuel depots.
Landings and associated fuel data from KFC were available in 2006, 2010 and 2011 only, and represented roughly 2.1-6.8% of national landings of tuna during those years. Landings and fuel purchase data from MFC were available for 2010-2014, and represented roughly 4.5%-11.1% of the Maldives’ annual tuna landings. These data on tuna landings and fuel sales, by month, from 2006 and 2010-2014 were analysed in this study, and for 2014 in-cluded vessel registration numbers. These registration numbers were matched with the MoFA database to determine vessel length and engine size for each vessel, which could
18
Methods
then be linked with landings and fuel sales. MFC managers were confident that fishers represented in their dataset rarely purchased fuel elsewhere or sold tuna to local markets or consumers (Abdul Razzak, General Manager, pers. comm., 2016). MRC has confirmed that there were no fuel depots other than the fish processing plants in Laamu or Gaafu Alifu Atolls during this time, suggesting that the fuel purchased can be reliably linked to the fish sold at MFC.
Data AnalysisAnalyses were conducted in Microsoft Excel and R statistical software (R Core Team 2012). Fuel use intensity (FUI) was calculated as fuel used in the catch of tuna and baitfish per metric ton of tuna landed. Few baitfish are landed, and it is not feasible to separate the fuel used to catch baitfish and the fuel used to catch tuna, as these were typically caught within a single trip. When average FUI was calculated for multiple vessels or trips, this was done using total fuel and total catch rather than averaging the FUI values for each vessel.

4. Results
© Woolworths SA

20
Table 1: Main features of the three datasets considered in the study.
Dataset No. unique vessels
Time Period
Length of vessel (m)
Engine size (HP) Coverage Compilation
Observer 17 2014 - 2015 15.5 - 35.0 39 - 830 National Individual trips
Fuel Subsidy 87 2012 - 2013 8.9 - 34.5 22 - 720 National Aggregated
Processor211 in 2014, unknown
other years
2006, 2010-2014 5.9 - 35.5 5 - 830 South Aggregated
Observer DataOne hundred and five fishing trips were observed on 17 different vessels, with 106 ob-served days (as one vessel stayed offshore overnight on one trip). These constituted 86 trips in which tuna fishing was conducted, on 87 days. On the other trips there was in-sufficient livebait or schools of tuna could not be located. Fuel burned during these trips where no tuna fishing occurred was included in our analysis, as non-productive trips are still part of the fishery. A total of 147 t of fish was landed (for comparison, this was equiv-alent to 0.17% of recorded national landings in 2014). During baitfishing and tuna fishing combined, these vessels burned 47,855 litres of fuel, giving an average of 328 litres of fuel per metric ton (l/t) of tuna landed. The 17 vessels observed ranged from 15.5-35 m in length, with engine sizes of 29–619 kW (39-830 HP). On two of these vessels, insuffi-cient bait was caught to go tuna fishing so only baitfishing was observed; data from these vessels were removed from per vessel analyses for FUI, but the fuel that they burned catching bait was included in total analyses (250 l).
Results
Figure 3. Fuel use intensity (FUI) for fishing on different school associations of tuna.
Derived from observer data, 2014-2015.
600
FUI (
l/t)
Primary Tuna School Association
500
400 n=55
n=5
n=15
n=12
300
200
100
aFAD Free school Seamount Multiple0

21
Communications with captains suggested that fishing for baitfish used approx-imately 15%-20% of the amount of fuel consumed on a fishing trip, although this could be highly variable. A lower FUI was estimated for the days fished on free schools (FUI=199 l/t, n=15) than on days identified as fished on aFADs (FUI=369 l/t, n=55), seamounts (FUI=528 l/t, n=5), or multiple targets (FUI=575 l/t, n=12) (Figure 3). Overall, smaller vessels had the lowest FUI; however, large vessels can also have a low FUI (Figure 4). Fuel Subsidy Data MoFA fuel subsidy data are of rather poor quality, with many data gaps and obvious errors. A subset of these data, for the period November 2012 to July 2013, was compiled, checked and analysed. Data forms with data missing or obvious mistakes were excluded from analysis. Of the usable data, 87 vessels reported both the fishing method of pole-and-line and also reported landing primarily skipjack in landings data and/or logsheets. Pole-and-line landings eval-uated here amounted to 2,515 t (equivalent to 2.7% of the national pole-and-line landings in 2013). Associated with these tuna landings, 809,560 l of fuel were pur-chased.
The fuel subsidy data demonstrate that vessels used an average of 322 l/t (although this applies only to tuna landings, not catches of non-tuna species). The short time frame of the subsidy did not allow for investigations into temporal variation. The relationship between FUI and engine power (Figure 5) is unclear. However, smaller vessels appeared to have a lower FUI than larger vessels (Figure 6).
Figure 4. Fuel use intensity (FUI) for 15 different sized fishing vessels, where each plot
represents an individual vessel. Derived from observer data, 2014-2015.
2,500FU
I (l/
t)
Length of vessel (m)
2,000
1,500
1,000
500
00 5 10 15 20 25 30 35 40
Results

22
Processor DataMFC processor data included records of 28,202 t of tuna caught between 2010 and 2014. Fuel purchases at this site amounted to 6,014,000 l during this time period. At KFC, 12,809 t were purchased in 2006, 2010 and 2011, with fuel sales of 2,074,455 l. Only pole-and-line caught skipjack, yellowfin, and bigeye are purchased at either site; no handline caught tuna were purchased. In 2014 at MFC, the only year in which individual vessel data were available, larger vessels tended to have a higher FUI than smaller vessels (Figure 7).
Analysis of fuel purchases and fish sales data from fishing vessels landing pole-and-line caught tuna at MFC from 2010-2014 show that vessels used an average of 213 l/t, which varied by year (Table 2). At KFC, the average FUI was 162 l/t for 2006, 2010
Figure 5. Fuel use intensity (FUI) of Maldivian pole-and-line vessels of different engine
sizes. Data derived from government fuel subsidy program, 2012-2013.
Figure 6. Fuel use intensity (FUI) of Maldivian pole-and-line vessels of different lengths.
Data derived from government fuel subsidy program, 2012-2013.
600FU
I (l/
t)
Engine Power (HP)
500
400
n=6n=14 n=22
n=17
n=14n=14
300
200
100
<100
100-19
9
200-29
9
300-39
9
400-499
500+0
450
FUI (
l/t)
Vessel Length (m)
400350
n=27
n=15
n=5
n=9n=31
200250150100
50
<1515-
19.9
20-24
.9
25-24
.9 >300
Results

23
and 2011. For 2010 and 2011, the FUIs calculated at each location were within 10% of each other. By far the lowest FUI was in 2006, with an FUI less than half of any other year.
With the exception of 2006, FUI varied only slightly between years. Within each year, there was high variability of FUI, but a suggestion of higher FUI during the height of the two monsoons (in February and August) (Figure 8). In southern Maldives, highest catch rates (i.e. lowest FUIs) have been observed during the inter-monsoons (March-May and October-November) (Anderson et al. 1998).
Figure 7. Fuel use intensity (FUI) of Maldivian pole-and-line vessels of different lengths.
Data derived from processor data sources, 2014.
300FU
I (l/
t)
Vessel Length (m)
250n=77
n=195
n=156n=288 n=83
n=20200
150
100
50
<1515-
19.9
20-24
.9
25-29
.9 >30
Unknown0
Table 2. Fuel use intensity (FUI) for vessels that landed pole-and-line caught tuna at
Kooddoo Fisheries Complex and Maandhoo Fisheries Complex from 2010-2014 and
percent of represented catch of the total national pole-and-line tuna landings (by weight).
Year Fuel (l) Tuna (kg) FUI (l/t) % of national catch
2006 (KFC) 290,237 3,432,102 85 2.1%
2010 (KFC) 902,277 4,952,293 182 5.6%
2010 (MFC) 889,248 4,469,453 199 5.0%
2011 (KFC) 881,941 4,425,244 199 6.8%
2011 (MFC) 537,446 2,968,812 181 4.5%
2012 (MFC) 867,703 4,310,991 201 6.8%
2013 (MFC) 2,417,847 10,324,183 234 11.1%
2014 (MFC) 1,301,763 6,128,423 212 7.0%
Total 8,088,462 41,011,501 197 -
Results

24
Results
Figure 8. Monthly Fuel use intensity (FUI) of the Maldivian pole-and-line tuna fishery, de-
rived from MFC processor data sources.
350
300
FUI (
l/t)
Month (2010-2014)
250
200
150
100
50
Jan Feb Mar AprMay Jun
JulAug
Sep OctNov
Dec0

5. Discussion
© IPNLF

26
Discussion
DiscussionThe FUIs estimated from the three separate data sources range from 197-328 l/t (Ta-ble 3). These estimates represent the best available data in the Maldives at present. The FUI derived from fuel subsidy and the observer data were 50% higher than those derived from processor data, and the processor data was found to be statistically dif-ferent (Subsidy v Processor Z = 6.47, p ≤ 0.00001, Observer v Processor Z = -2.26, p ≤ 0.024). As these were different, and the data were collected and compiled in different ways, these were not combined for a single FUI estimate. Several reasons may help explain the differences between estimates. The datasets may show differences that exist within the fleet (e.g. vessel size, region, temporal variation) or may be an artefact of small or irregular samples. For example, the processor dataset included smaller vessels, which use less fuel (34% were under 20 m, compared to 23% and 22% in the fuel subsidy dataset and the observer dataset, respectively). As well, for the processor dataset, non-tuna landings were excluded, and it is possible that some tuna landings were also excluded in the reporting due to poor quality, smaller size, or sub-optimal quantity for selling to processor. For the observer dataset, the percentage of vessels over 25 m was 56% compared to 46% for both the processor and fuel subsidy data-sets. However, as these three independent sources of data and calculations showed a similar estimate of FUI in this study, it is assumed that the true value of FUI for the Maldivian pole-and-line tuna fishery falls within the range of values estimated here.
The FUI values estimated here are similar to previous estimates of the Maldives (Höhne-Sparboth et al. (2013). However, those estimates were made using landings and fuel expenses based on different years (catch and fishing effort 2004/2005-2010, fuel consumption and price 2011). Interestingly, Höhne-Sparboth et al. (2013) also estimated vessels less than 13.7 m to have the lowest FUI (233 l/t), with vessels in the 19.8-25.9 m size range to have the highest (398 l/t), with moderate (13.7-19.8 m) and largest (>25.9 m) having FUIs in between (318 l/t and 354 l/t, respectively. This shows a similar trend as observed in the present study. While there is a two-fold difference among the values observed in this study, and other estimates of the Mal-dives (197-398 l/t), these differences are still relatively small compared to the differ-ences between major fishery types (roughly 300 l/t compared to over 1,000 l/t for longline or pole-and-line caught albacore or Atlantic bluefin).
One global review found the median FUI of all fisheries that had fuel use records since 1990 to be 639 l/t (Parker and Tyedmers 2015), while the FUI of all worldwide fisheries
27
Discussion
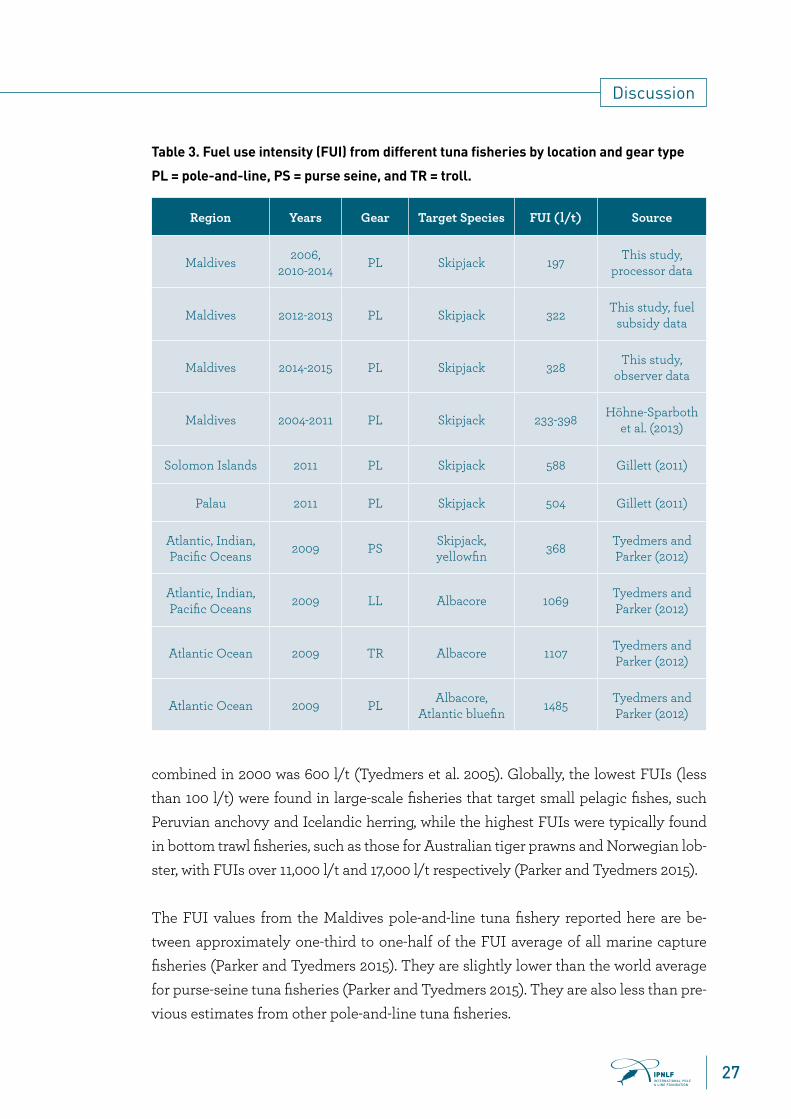
combined in 2000 was 600 l/t (Tyedmers et al. 2005). Globally, the lowest FUIs (less than 100 l/t) were found in large-scale fisheries that target small pelagic fishes, such Peruvian anchovy and Icelandic herring, while the highest FUIs were typically found in bottom trawl fisheries, such as those for Australian tiger prawns and Norwegian lob-ster, with FUIs over 11,000 l/t and 17,000 l/t respectively (Parker and Tyedmers 2015).
The FUI values from the Maldives pole-and-line tuna fishery reported here are be-tween approximately one-third to one-half of the FUI average of all marine capture fisheries (Parker and Tyedmers 2015). They are slightly lower than the world average for purse-seine tuna fisheries (Parker and Tyedmers 2015). They are also less than pre-vious estimates from other pole-and-line tuna fisheries.
Table 3. Fuel use intensity (FUI) from different tuna fisheries by location and gear type
PL = pole-and-line, PS = purse seine, and TR = troll.
Region Years Gear Target Species FUI (l/t) Source
Maldives 2006, 2010-2014 PL Skipjack 197 This study,
processor data
Maldives 2012-2013 PL Skipjack 322 This study, fuel subsidy data
Maldives 2014-2015 PL Skipjack 328 This study, observer data
Maldives 2004-2011 PL Skipjack 233-398 Höhne-Sparboth et al. (2013)
Solomon Islands 2011 PL Skipjack 588 Gillett (2011)
Palau 2011 PL Skipjack 504 Gillett (2011)
Atlantic, Indian, Pacific Oceans 2009 PS Skipjack,
yellowfin 368 Tyedmers and Parker (2012)
Atlantic, Indian, Pacific Oceans 2009 LL Albacore 1069 Tyedmers and
Parker (2012)
Atlantic Ocean 2009 TR Albacore 1107 Tyedmers and Parker (2012)
Atlantic Ocean 2009 PL Albacore, Atlantic bluefin 1485 Tyedmers and
Parker (2012)

28
Discussion
All three FUI estimates for Maldivian pole-and-line fishing vessels in this study are less than a quarter of that reported by Tyedmers and Parker (2012) for the European offshore pole-and-line albacore and bluefin tuna fishery. That North Atlantic fishery targets high value species (Macfadyen and Defaux 2016), and therefore can be prof-itable with higher FUI. This is not the case with most skipjack pole-and-line fisheries, which provide tuna to processors for canning. This is a lower-value product, and lower FUI contributes to the overall viability of operations. Previous studies of pole-and-line tuna fisheries estimate an FUI of 588 l/t in the Solomon Islands and approximately 504 l/t in Palau (Gillett 2011), suggesting that pole-and-line fisheries targeting skipjack may generally have FUIs lower than those fisheries that target higher value species.
Factors Influencing Fuel Use IntensityStock Abundance /Annual VariationWithin the Maldivian pole-and-line fishery, several factors may affect FUI, for example, changes in stock abundance and catchability. The highest catches of pole-and-line tuna in the Maldives were recorded in 2006, with landings of 166,000 t (Adam et al. 2015). Be-tween 2006 and 2010, nominal catch rates halved from 800 kg/trip to less than 400 kg/trip (Jauharee and Adam 2012). Data from KFC for 2006 suggest a FUI of 85 l/t, while the FUI for 2010-2011 was roughly double that (182 and 199 l/t, respectively).
In Swedish trawl fisheries, Ziegler and Hornborg (2014) found stock size was highly in-versely correlated with FUI. In Norway, Schau et al. (2009) also found inverse relation-ships between fuel consumption and annual catch rates. If catchability was to increase in the Indian Ocean, perhaps as a result of increased population abundance, then FUI would likely decrease. As such, working towards improved stock management and rebuilding of heavily exploited stocks should contribute towards reducing fuel usage in the Maldivian pole-and-line tuna fisheries. The Indian Ocean skipjack tuna stock, which is the primary target of the Maldivian pole-and-line fishery, is currently con-sidered to be healthy. However, the Indian Ocean yellowfin tuna stock is considered overfished and subject to overfishing at present. The yellowfin tuna is not the primary target in the pole-and-line fishery but makes up approximately 25% of these landings, leaving room for improvement.
Fishery TargetThe FUIs estimated here for the Maldivian skipjack pole-and-line fishery are much closer to the FUIs estimated for Western Pacific skipjack pole-and-line fisheries

29
Discussion
(Gillett 2011) than for an Atlantic albacore and bluefin pole-and-line fishery (Parker and Tyedmers 2015). This illustrates the importance of target species on FUI. Factors that influence species-specific catchability (e.g. biomass, schooling behaviour, depth in the water column, and size of schools) can dramatically affect landings and thus FUI. In a review of FUIs in global fisheries, Parker and Tyedmers (2015) found strong patterns re-lated to species class.
Vessel SizeA positive relationship between vessel size and FUI was seen across all datasets, with larger vessels typically having higher FUI. This relationship is most evident when all three datasets were combined (Figure 9). Vessels with small engines use less fuel, and can maintain a low FUI with smaller catches of fish. Although large vessels that caught large quantities of fish while using high amounts of fuel had low FUI, they tended to be less fuel efficient overall. When fish-ing is poor, captains of smaller vessels with lower fuel consumption, are more inclined to go out looking for tuna due to their low-er overheads, which can benefit employ-ment and food security, but at the cost of in-creased FUI. Conversely, larger vessels are more likely to go out only when fishing is known to be good. These biases may tend to weaken the relationship between FUI and vessel length. In recent years, there has been a trend towards building larger Maldivian fishing vessels, which have higher construction, maintenance and operating costs (Jauharee 2013). Many large vessels were constructed following the peak of tuna catches in 2006, however, due to declining catch rates, these vessels may be uneconomical to operate, and are frequently tied up at the dock, aban-doned, or switched to other fishing activities (Jauharee 2013). For example, some of these larger vessels have switched to handlining for large yellowfin tuna. It would be worth investigating the potential economic benefits of government-imposed size restrictions for pole-and-line vessels.
Figure 9. Fuel use intensity (FUI) of Mal-
divian pole-and-line vessels of different
lengths. Data derived from observer pro-
gram, 2014-2015; government fuel sub-
sidy program, 2012-2013; and processor
sources, 2014.
300
FUI (
l/t)
Vessel Length (m)
250
200
150
100
50
<1515-
19.9
20-24
.9
25-29
.9 >300
30
Discussion
In other fisheries, findings have been mixed. Ziegler and Hornborg (2014) found minimal differences in FUI between different sized vessels in Swedish trawl fisheries. However, data other from fisheries indicated that larger vessels have a higher FUI compared to smaller vessels (Thrane 2004). Similarly, the weight of a vessel could also affect FUI; this was not investigated in this study as weight estimates for vessels were not available.
FADsPole-and-line fishers in the Maldives employ two main fishing strategies: fishing on aF-ADs and fishing on free schools of tuna. Fishing on aFADs tends to yield smaller catches of tuna than fishing on free schools, but aFAD catches are more reliable because search-ing for free schools is not always successful (Miller et al. 2017). Thus, fishing on aFADs can reduce the amount of fuel used searching for tuna, and in addition fishers relying on aFADs do not need fast vessels (with large engines) to compete. In contrast, fishing on free schools can yield larger catches of tuna (Miller et al. 2017), but is less reliable, since fishers are not always able to locate schools. Vessels fishing on free schools should there-fore have greater variability in FUI between trips than vessels fishing on aFADs, and this trend is seen in the observer dataset, but a larger sample size would be needed for stron-ger conclusions. Furthermore, fishers searching for free schools believe that they need larger engines to cover more area and to chase down any schools seen. The limited data tend to suggest that fishing on free schools is more fuel efficient than fishing on aFADs (Fig.3), because catches can be high when schools are found. However, no definitive conclusions about the impacts of different fishing strategies on FUI could be deduced, mainly due to small sample sizes, and potential confounding of variables, and further research should be conducted. In purse seine fisheries, one study suggested that fishing on drifting FADs may be less fuel efficient than fishing on free schools, but again more research was recommended (Tyedmers and Parker 2012; Parker and Tyedmers 2015). In contrast, in Indonesia, the introduction of aFADs (known locally as rumpon) in the 1980s decreased fuel consumption by almost 50% (Monintja and Mathews 2000). In the Mal-dives, larger vessels are more likely than small vessels to fish on free schools, and more so when fishing is good; the relationship between fishing strategy and fuel use is therefore likely to be complex.
Other FactorsNo obvious relationship was found between month of the year or seasonality and FUI. Fishers may be less likely to go fishing and risk wasting fuel during times of relatively low fish availability, and may fish less intensely when they know fishing is poor. Availability
31
Discussion
of baitfish may also play a role, as fishers sometimes must travel long distances to catch baitfish. The cost of fuel can also influence fisher behaviour. Schau et al. (2009) found an inverse correlation between fuel consumption and oil prices in Norwegian fisheries. The distance to the fishing grounds is also a factor in FUI as much of each trip is spent steaming to/from the fishing grounds. If schools can be found close to the port of depar-ture, then FUI will be lower. In general, aFADs tend to be closer, with small, but reliable catches. The main seamounts fished in the Maldives are relatively far offshore, but could contribute towards low FUI if catches are high enough. In addition, the age and condition of the vessel and engine, as well as speed at which the vessel is driven, can also influence fuel use. If the vessel or engine are not maintained, they will be less efficient. High travel speeds will also increase FUI. In general, Maldivian vessels are not optimised for fuel efficiency.
LimitationsObserver Data The observer dataset was limited in scope, being based on relatively few vessels, which may have reduced accuracy of FUI estimation. On the other hand, these data were likely the most accurate due to direct quantification of fuel used and fish landed. The observed vessels were chosen opportunistically, but selection was biased towards larger vessels that were more willing to take observers; this may have resulted in a bias towards a higher estimate of FUI. Some vessels did target non-tuna species as well, which would not be included in the FUI analyses, and would show a higher FUI than if all species were included.
Fuel Subsidy Data As some of the data used in this analysis drew upon self-submitted logbooks and receipts, there was room for error in the data. Many receipts and logbooks had varying thorough-ness, perhaps related to the modification of the logbook system (during 2011-2012). Data on fuel used per trip were not available, therefore the amount of fuel and fish purchased during a period of time was used (i.e. two week period or month). In addition, individual vessel records did not cover the entire time period of the subsidy, with many only includ-ing one or two records of two weeks each. This would also not provide much precision for these vessels. If fishers purchased fuel and caught fish in different time periods, this could give either a positive or negative bias. Fishers, because of their reduced incentive to conserve fuel, may have burned more fuel (e.g. using different fishing strategies that burn

32
Discussion
more fuel or traveling further to sell fish) than when subsidies were not in place, thereby inflating FUI.
Processor Data This dataset also links the purchases of fuel and fish sales during a set period of time, rather than directly linking the fuel used to catch the fish. Because of the large size of the dataset and its relatively long temporal duration, there is the highest precision with this dataset; however, it may not be the most accurate. Fishing vessels can travel between atolls, and can sell fish (including non-tuna species not purchased by processors) to local people or resorts directly, or potentially buy fuel from other facilities. The latter is unlikely to be a significant component, as fuel is more expensive in other locations, and few places can sell large volumes of diesel to fishing vessels. Many fishers consume some fish on board, bring home catch to their families, and sell directly to their local islands, although this is typically small amounts, often including damaged, small, or species not accepted by the processors. This would cause an overestimation of FUI in this report. Similarly, if fishers purchased fuel in other areas, this would lower the estimation of FUI in this report. During this study, fish were observed to be sold to local islands, but fuel was not purchased in other areas.
Another potential issue could be that vessels with low or no catch would be the least like-ly to visit processing plants, and therefore the most likely to refill elsewhere. During this study, this was not observed, but the possibility cannot be completely removed.
This dataset only included fishing in the southern parts of the country, and is the only dataset that is not country-wide. As well, landings in the south are much higher than in the central or northern regions; if this is related to catchability, FUI may also show regional differences and this estimate may be artificially low. MFC and KFC also have purchasing facilities on numerous islands. This may lead to shorter distances from fish-ing grounds to where the fishers sell fish, lowering fuel use. Overall, this dataset may be biased in such a way as to underestimate FUI.
Opportunities for ImprovementPole-and-line fishing vessels in the Maldives may be able to improve their fuel efficiency, and this report provides a baseline for measuring such improvements. The Government of Maldives has discontinued the fuel subsidy program, which should encourage fish-ers to reduce fuel use. Fuel subsidies lower the cost of fuel, and thereby reduce fishers’

33
Discussion
motivation to conserve fuel. Methods for improving vessel-level fuel efficiency have been investigated in many countries, although this has not been widely studied in the Mal-dives. Few boat-building guides are available, and fishers typically select large engines to travel fast without regard to fuel efficiency or optimal size for their vessels. Further research into the relationship of vessel design and fishing strategy to fuel use may illumi-nate further opportunities to improve fuel efficiency, and reduce long-term running costs.
Tuna catchability might be increased (thus reducing FUI) through the use of technol-ogies that assist in locating fish. This practice is commonplace in purse seine fisheries using electronically-monitored dFADs. However, in the Maldives, where aFAD locations are common knowledge to fishers, most vessels already visit their nearest aFAD as part of their initial search strategy. Another strategy to enhance tuna catchability is the dissem-ination of information on potential fishery zones (PFZ). PFZs are identified by integrat-ing biological and physical oceanographic data with remotely sensed ocean-colour data and catch information from fishers. Information on PFZs in near-real time could reduce FUI in the Maldives, and a limited service is currently being provided by the Maldives Fishermen’s Association for south-central Maldives. An expanded service is likely to be introduced by the government under their plans for upgrading vessel monitoring sys-tem (VMS) service platforms. As an alternative approach, at the time of writing, IPNLF and Furuno USA are conducting a pilot study with bird radar to help fishers detect tuna schools more easily and efficiently.
Fuel Use in Context Fuel use intensity during harvest gives a first impression of the carbon footprint of fish-eries products, but this does not take account of fuel use or carbon footprints from stor-age, processing or transport, nor ancillary activities such as boat construction. In the Maldives, a substantial proportion of tuna goes to local markets, with small transport and processing footprints. Nevertheless, roughly 60% of the tuna catch is exported, with higher carbon footprints associated with processing and transport. Globally, interest in incorporating fuel use and carbon footprints into seafood sustainability assessments is growing (Pelletier and Tyedmers 2008; Madin and Macreadie 2015). More broadly, fuel consumption and associated carbon footprint is only one component of environmental sustainability, albeit a key one, but assessment of FUI should be incorporated into a more holistic evaluation of fishery sustainability. At the same time, it is important to recognise also impacts on fish stocks, bycatch, marine habitats, as well as to evaluate the social im-pact on livelihoods, food security, and human rights.
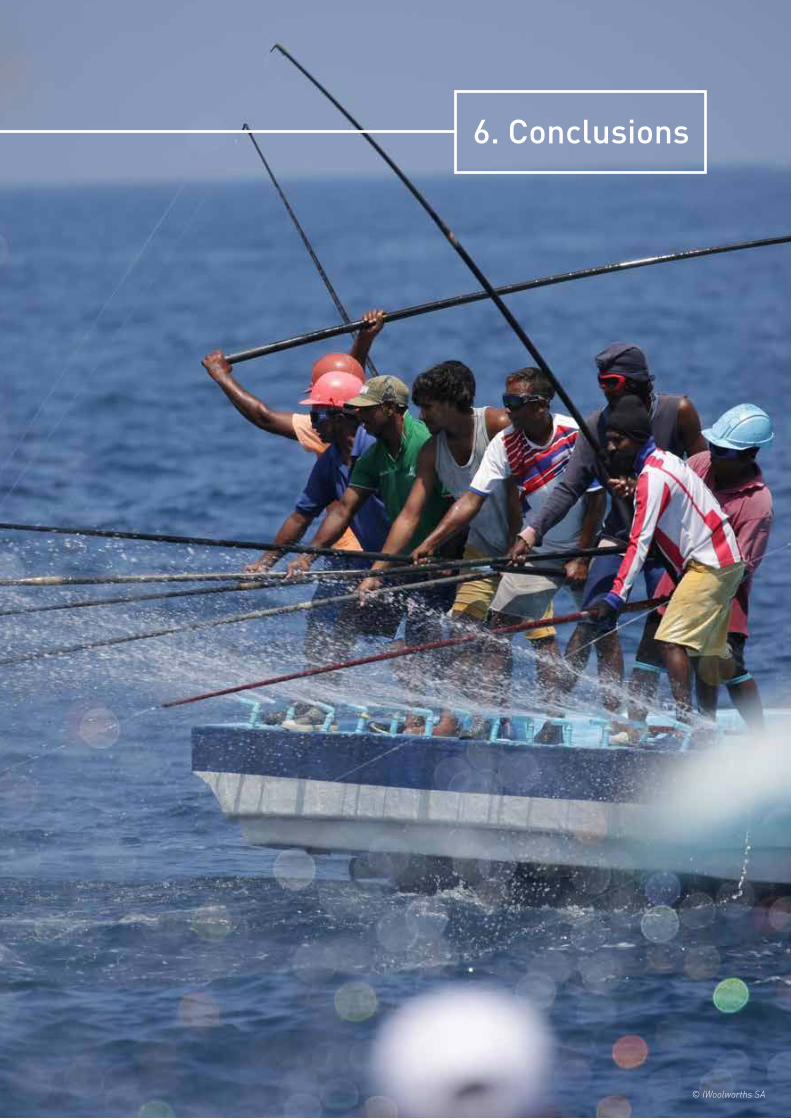
6. Conclusions
© IWoolworths SA

35
Conclusions
ConclusionsFuel use evaluations are essential to enhance understanding of fishery responses to fuel costs and the associated environmental impact from fuel combustion. In this study of the Maldivian pole-and-line tuna fishery, FUI was found to be between 197-328 litres of fuel per tonne of landed tuna. This is in the same order of magnitude as, but slightly lower than, purse seine tuna and roughly 30-80% less than estimates of FUI from other pole-and-line tuna fisheries. The FUI of the Maldivian pole-and-line tuna fishery is between one-third and one-half of the average FUI for global fishing fleets and as such can be considered to be relatively efficient. In combination with the low levels of bycatch, minimal impacts on the marine environment, and the strong so-cial contribution, this study further demonstrates the relative merits of the Maldivian pole-and-line tuna fishery.

36
Acknowledgments
AcknowledgmentsThis study was funded by IPNLF and MRC. The authors would like to thank the Min-istry of Fisheries and Agriculture, Maandhoo Fisheries Complex, and Kooddoo Fish-eries (Maldives Industrial Fisheries Company, MIFCO) for sharing data used in this report. Many thanks to John Burton and Emily Howgate for their support. Thanks also to the following people who helped collect and compile data: Riyaz Jauharee, Ibrahim Nadheeh, Mohamed Muththalib, Mohamed Nabeel Ahmed, Abdulla Solah, Abdulla Niyaz, Ismail Haleem, Mohamed Ahusan, Ahmed Saeed and Muawin Yoosuf. We are extremely grateful to the skippers and crew of all of the fishing vessels who provided us with tremendous help and cooperation. We would like to thank three anonymous reviewers who greatly improved this report as well as the IPNLF Editorial Board.
37
References
Adam MS (2006) Country review: Maldives. Review of the state of world marine capture fisheries management: Indian Ocean. Food and Agriculture Organization of United Nations, Rome, 383-391
Adam MS, Jauharee AR, Ahusan M (2014a) Notes on yellowfin / bigeye tuna ratio and size distribu-tion in the Maldivian tuna fishery. Indian Ocean Tuna Commission IOTC-2014-WPTT16-26:1-11
Adam MS, Sinan H, Jauharee AR, Ali K, Ziyad A, Shifaz A, Ahusan M (2014b) Maldives National Report to the Scientific Committee of the Indian Ocean Tuna Commission, 2014. Indian Ocean Tuna Commission IOTC-2014-SC17-NR17:1-16
Adam MS, Sinan H, Jauharee AR, Shifaz A, Ziyad A, Ahusan M, Abdulla R, Ali K (2013) Maldives Na-tional Report to the Scientific Committee of the Indian Ocean Tuna Commission, 2013. Indian Ocean Tuna Commission IOTC-2013-SC16-NR17:1-15
Adam MS, Ziyad A, Sinan H, Ali K, Shifaz A, Ahusan M, Jauharee AR (2015) Maldives National Re-port to the Scientific Committee of the Indian Ocean Tuna Commission, 2015. Indian Ocean Tuna Commission IOTC-2015-SC18-NR17:1-17
Ahusan M, Adam MS, Ziyad A, Ali K, Sinan H, Jauharee AR (2016) Maldives National Report to the Indian Ocean Tuna Commission Scientific Committee, 2016. Indian Ocean Tuna Commission IOTC-2016-SC19-NR17:1-17
Amandè JM, Ariz J, Chassot E, Chavance P, Delgado de Molina A, Gaertner D, Murua H, Pianet R, Ruiz J (2008) By-catch and discards of the European purse seine tuna fishery in the Indian Ocean. Estimation and characteristics for the 2003-2007 period. Indian Ocean Tuna Commission IOTC-2008-WPEB-12:1-26
Anderson RC (2009) Technical assistance to bait fisheries monitoring: final report. Maldives En-vironmental Management Project, Malé, Maldives 44270-MAL:33 Available from: http://www.mrc.gov.mv/assets/Uploads/20-December-2009-Technical-Assistance-to-Bait-Fisheries-Monitoring.pdf [Accessed August 2014]
Anderson RC, Adam MS, Waheed A (1996) Tuna tagging activities in the Maldives. Proceedings of the Expert Consultation on Indian Ocean Tunas, 6th Session, Colombo, Sri Lanka, 25-29 September 1995. A. A. Anganuzzi, K. A. Stobberup and N. J. Webb. Indo-Pacific Tuna Progamme, Colombo: 333-347.
Anderson RC, Waheed A, Adam MS (1998) The tuna fishery resources of the Maldives. Maldives Marine Research Bulletin No 3:180pp
Avadí A, Fréon P (2013) Life cycle assessment of fisheries: a review for fisheries scientists and man-agers. Fisheries Research 143:21-38
Carvalho N, Edwards-Jones G, Isidro E (2011) Defining scale in fisheries: Small versus large-scale fishing operations in the Azores. Fisheries Research 109:360-369
FAO (2014) State of World Fisheries and Aquaculture 2014 Opportunities and Challenges. Food and Agriculture Organization of the United Nations. Food and Agriculture Organization of the United Nations, Rome, 243pp
Farmery A, Gardner C, Green BS, Jennings S (2014) Managing fisheries for environmental perfor-mance: the effects of marine resource decision-making on the footprint of seafood. Journal of Clean-er Production 64:368-376
References

38
References
Gillett R (2011) The promotion of pole-and-line tuna fishing in the Pacific Islands: Emerging issues and lessons learned. International Seafood Sustainability Foundation. ISSF Technical Report 2011-08:1-46
Gillett R (2016) Pole-and-line tuna fishing in the world: Status and trends. International Pole & Line Foundation. IPNLF Technical Report No 6:1-17
Höhne-Sparboth T, Adam MS, Ziyad A (2013) A socio-economic assessment of the tuna fisheries of the Maldives. International Pole & Line Foundation. IPNLF Technical Report No 5: 1-44
Jauharee AR (2013) Challenges to the pole-and-line tuna fishery in the Maldives. Working Paper presented at the 15th Session of the IOTC-Working Party on Tropical Tuna, 23-28 October 2013, San Sebastian, Spain. 6pp. Indian Ocean Tuna Commission IOTC-2013-WPTT15-42:1-6
Jauharee AR, Adam MS (2012) The evolving Maldivian tuna fishery and its increasing dependence on the anchored FADs. Working paper presented at the 14th Session of the IOTC-Working Party on Tropical Tunas, Mauritius, 24-29 October 2012, 6pp. Indian Ocean Tuna Commission IOTC-2-12-WPTT14-10:10-6
Working paper presented at the 14th Session of the IOTC-Working Party on Tropical Tunas, Mauri-tius, 24-29 October 2012, 6pp.
Jauharee AR, Neal K, Miller KI (2015) Maldives Pole-and-line Tuna Fishery: Live Bait Fish Review. Centre for Marine and Coastal Studies Ltd (CMACS), Wirral, UK 60pp
Lam VW, Sumaila UR, Dyck A, Pauly D, Watson R (2011) Construction and first applications of a global cost of fishing database. ICES Journal of Marine Science: Journal du Conseil 68:1996-2004
Macfadyen G, Defaux V (2016) Estimate of the global sales values from tuna fisheries – Phase 2 Report. Poseidon Aquatic Resource Management Ltd1-31 Available from: http://www.pewtrusts.org/~/media/as-sets/2016/2005/estimate-of-global-sales-values-from-tuna-fisheries--phase-2012.pdf [Accessed Jun 2017]
Madin EMP, Macreadie PI (2015) Incorporating carbon footprints into seafood sustainability certifi-cation and eco-labels. Marine Policy 57:178-181
Maldives Customs Services (2016) Maldives Customs Statistics. Available from: https://www.cus-toms.gov.mv/statistics [Accessed 5 December 2016]
Miller KI, Jauharee AR, Nadheeh I, Adam MS (2016) Interactions with Endangered, Threatened and Protected (ETP) species in the Maldivian pole-and-line tuna fishery. International Pole & Line Foun-dation. IPNLF Technical Report No 7:1-28
Miller KI, Nadheeh I, Jauharee AR, Anderson RC, Adam MS (2017) Bycatch in the Maldivian pole-and-line tuna fishery. PLOS ONE 12(5): e0177391
Miyake M, Guillotreau P, Sun C-H, Ishimura G (2010) Recent developments in the tuna industry: stocks, fisheries, management, processing,trade and markets. Food and Agriculture Organization, Rome FAO Fisheries and Aquaculture Technical Paper No. 543:1-125
MoFA (2013) Basic Fisheries Statistics 2012. Fisheries Management Agency, Ministry of Fisheries and Agriculture, Male’, Maldives 1-21
Monintja D, Mathews C (2000) The skipjack fishery in Eastern Indonesia: distinguishing the effects of increasing effort and deploying rumpon FADs on the stock. Pêche thonière et dispositifs de con-centration de poissons, Caribbean-Martinique, 15-19 Oct 1999: :435-448 Available from http://archim-er.ifremer.fr/doc/00042/15320/ [Accessed 5 March 2016]
MSC (2016) Maldives pole & line skipjack & yellowfin tuna. Marine Stewardship Council https://www.msc.org/track-a-fishery/fisheries-in-the-program/certified/indian-ocean/maldives_pole_line_tuna. [Accessed March 2016]
39
References
Parker RW, Tyedmers PH (2015) Fuel consumption of global fishing fleets: current understanding and knowledge gaps. Fish and Fisheries 16:684-696
Pelletier N, Andre J, Charef A, Damalas D, Green B, Parker R, Sumaila R, Thomas G, Tobin R, Watson R (2014) Energy prices and seafood security. Global Environmental Change 24:30-41
Pelletier N, Tyedmers P (2008) Life cycle considerations for improving sustainability assessments in seafood awareness campaigns. Environmental Management 42:918-931
Powell L (2012) MVR 15.3 billion state budget might not last until end of next year: Finance Minister. 30 December 2012 Minivan News, Malé, Maldives. Available from https://minivannewsarchive.com/politics/mvr-15-3-billion-state-budget-might-not-last-until-end-of-next-year-finance-minister-50021. [Accessed 21 June 2017]
R Core Team (2012) R: A language and environment for statistical computing. R Foundation for Sta-tistical Computing, Vienna, Austria
Schau EM, Ellingsen H, Endal A, Aanondsen SA (2009) Energy consumption in the Norwegian fish-eries. Journal of Cleaner Production 17:325-334
Sims RE (2011) Energy-Smart food for people and climate: Issue Paper. Food and Agriculture Organi-zation, Rome: 78pp. Available from http://www.fao.org/docrep/014/i2454e/i2454e2400.pdf [Accessed January 2017]
Thrane M (2004) Energy consumption in the Danish fishery: identification of key factors. Journal of Industrial Ecology 8:223-239
Tyedmers P (2001) Energy consumed by North Atlantic fisheries. Fisheries Impacts on North Atlan-tic Ecosystems: Catch, Effort, and National/Regional Data Sets 9:12-34
Tyedmers P (2004) Fisheries and energy use. In: Cleveland CJ (ed) Encyclopedia of Energy, Volume 2. Elsevier Academic Press, Boston, 683-693
Tyedmers P, Parker R (2012) Fuel consumption and greenhouse gas emissions from global tuna fish-eries: a preliminary assessment. International Seafood Sustainability Foundation ISSF Technical Re-port 2012–03:1-15
Tyedmers PH, Watson R, Pauly D (2005) Fueling global fishing fleets. AMBIO: a Journal of the Hu-man Environment 34:635-638
Weber CL, Matthews HS (2008) Food-miles and the relative climate impacts of food choices in the United States. Environmental Science & Technology 42:3508–3513
Willman R, Kelleher K, Arnason R, Franz N (2009) The sunken billions: the economic justification for fisheries reform. The International Bank for Reconstruction and Development / The World Bank and the Food and Agriculture Organization, Washington DC, 130pp
Ziegler F, Hornborg S (2014) Stock size matters more than vessel size: the fuel efficiency of Swedish demersal trawl fisheries 2002–2010. Marine Policy 44:72-81
Ziegler F, Hornborg S, Green BS, Eigaard OR, Farmery AK, Hammar L, Hartmann K, Molander S, Parker RW, Skontorp Hognes E (2016) Expanding the concept of sustainable seafood using Life Cy-cle Assessment. Fish and Fisheries 17:1073-1093
Ziegler F, Nilsson P, Mattsson B, Walther Y (2003) Life cycle assessment of frozen cod fillets including fishery-specific environmental impacts. The International Journal of Life Cycle Assessment 8:39-47

UK Office
Postal Address: IPNLF, CAN Mezzanine, 7-14 Great Dover Street,
London, SE1 4YR, United Kingdom
Registered Address: 1 London Street, Reading,
United Kingdom, RG1 4QW
Registered Charity: 1145586 (England and Wales)
Web: www.ipnlf.org
Email: [email protected]
Twitter: www.twitter.com/IPNLF
Facebook: www.facebook.com/InternationalPoleandLineFoundation
LinkedIn: www.linkedin.com/company/international-pole-and-line-foundation
Instagram: www.instagram.com/ipnlf/


