Embed Size (px)
DESCRIPTION
Dr. Carlo Montani, pesquisador italiano, elabora anualmente um relatório sobre o panorama mundial da produção e comércio internacional do setor de rochas ornamentais. Designado Rapporto Marmo e Pietre nel Mondo (Report Marble and Stones in the World), em sua edição de 2013, além dos dados relativos à conjuntura mundial do setor, o XXIV Rapporto do Dr. Montani incluiu um capítulo especial, denominado “Brasil: líder ocidental da pedra” e com apresentação bilíngue (italiano/inglês).
Citation preview

Congiuntura internazionaleProduzione · Scambi · ConsumiTecnologie · Beni strumentali
Schede dei Paesi leader
XXV Rapportomarmo e pietre nel mondo
2014marble and stones in the world
XXV ReportInternational situation
Production · Interchange · ConsumptionTechnology · Tools
Profiles of leading countries
Carlo Montani
Carlo M
ontaniR
apporto marm
o e pietre nel mondo 2014
Report m
arble and stones in the world 2014
XX
V
Aldus
Bilingual
Bilingual
Bilingual
Bilingual
Bilingual
Euro 39,00

© 2014 Aldus Casa di Edizioni in CarraraTutti i diritti riservati
Carlo MontaniXXV Rapporto Marmo e Pietre nel Mondo 2014XXV World Marble and Stones Report 2014
Progetto editoriale Daniele Canali
Traduzione / Translation Effeemme Lingue e Didattica Centro Servizi of Mori Erika and Furia Federica, Aulla
La riproduzione è consentita per utilizzi didattici o scientifici
Carlo Montani
Casa di Edizioni in Carrara
Congiuntura internazionaleProduzione · Interscambio · Consumi
Tecnologie · Beni strumentaliSchede dei Paesi leader
XXV Rapportomarmo e pietre nel mondo
2014marble and stones in the world
XXV ReportInternational situation
Production · Interchange · ConsumptionTechnology · Tools
Profiles of leading countries
L’Editore ringrazia gli Enti patrocinatori della presente pubblicazione
COMUNE DI MASSADecorato di Medaglia d’Oro al Merito Civile COMUNE DI PIETRASANTA

Con la partnership
ASSOCIAÇÃO BRASILEIRADA INDÚSTRIA DE ROCHAS ORNAMENTAISSrtv Sul - Quadra 701 - Conjunto L - N.38Bloco 2 - Sala 601Cep 70340-906 - Brasilia, Df - BrasilTel/Fax +55 (11) 3253-9250E-mail: [email protected]://www.abirochas.com.br

Prefazione
di Ettore RielloPresidente di Veronafiere
La pietra naturale è legata strettamente alla storia dell’uomo, che in essa ha trovato risposte sia ai propri bisogni primari, come costruire un riparo duraturo, che all’esigen-za di esprimere il proprio genio, quando il marmo è diventato protagonista di capola-vori immortali della scultura o della moder-na architettura. La pietra nasconde questa doppia anima: da “commodity” nell’edilizia a bene di lusso per l’arte, il design e il mon-do del “contract”.Dalla solidità di una pietra angolare, alla leggerezza estrema di pannelli di marmo flessibili, dello spessore di qualche mil-limetro, fino a diventare montatura per occhiali: l’uomo ha da sempre sfruttato le potenzialità di questa materia, grazie ad ingegno e creatività. Non è un caso che il settore lapideo sia uno dei punti di forza del “made in Italy”.Italia, terra di poeti, santi, navigatori e…. marmisti, sarebbe da aggiungere. Il com-parto tricolore legato alla pietra, infatti, rappresenta ancora oggi una delle eccel-lenze industriali del Paese, con 3.340 azien-
de, 33.700 addetti ed un fatturato che sfio-ra i quattro miliardi di euro, tra materiali e tecnologie, ponendoci al quinto posto nella classifica mondiale.In un momento di recessione generale dell’economia, la filiera lapidea ha saputo resistere meglio delle altre ed i segnali fanno ben sperare in un prossimo ritorno ai livelli ante crisi. Merito, soprattutto, della pietra italiana e della sua idoneità ad es-sere vincente all’estero grazie al valore ag-giunto del “know how” nella lavorazione, del design applicato e della continua inno-vazione tecnologica, che non conoscono ri-vali. Lo dicono i numeri: nel 2013, la nostra quota dell’export è stata pari a oltre il 70 per cento della produzione, con un saldo commerciale in attivo per oltre 2,4 miliardi di euro. Per questo l’Italia del marmo deve essere al centro di politiche settoriali di sistema e sinergie per vincere sui mercati esteri. Fare squadra, quindi, ma anche utilizzare gli strumenti più efficaci per entrare in con-tatto con la domanda oltreconfine e saper

8 XXV Rapporto Marmo e Pietre nel Mondo 2014
Introduzione
Il Rapporto lapideo mondiale giunge alla venticinquesima edizione annuale, evi-denziando ulteriori crescite del settore nel momento produttivo, nella distribuzione e nel consumo: in questo periodo le cifre fon-damentali sono quintuplicate, permettendo di superare la stasi del 1998 e la crisi del 2009, e confermando lo stato di salute di marmi e pietre, ben oltre la congiuntura cri-tica che permane in diversi Paesi. Si tratta di risultati che bisogna sottolineare a più forte ragione, laddove si pensi al carattere relativamente elastico della domanda lapi-dea, ed al fatto che due terzi degli impieghi si riferiscono all’edilizia, la cui condizioni non sono affatto ottimali, soprattutto in Occidente.Il comparto, in buona sostanza, possiede tradizioni di ruolo e di cultura che si co-niugano felicemente con un rilievo socio-economico sempre più importante, la cui funzione, col passare degli anni, è diven-tata strategica, in conformità alle singolari potenzialità di sviluppo, poste in luce sin
dal 1964, quando venne fondata la Federa-zione dell’Industria Marmifera Europea, e definite in senso programmatico dieci anni dopo, quando l’Organizzazione delle Nazio-ni Unite, muovendo dall’idoneità del lapi-deo ad avviare politiche di sviluppo regio-nali e locali, si compiacque di sollecitare il momento politico ad agire in conseguenza.Ciò significa che le prospettive di ulteriore espansione, rivenienti dalle estrapolazioni delle serie storiche e corroborate da un mercato assai vivace, saranno tanto più ap-prezzabili nella misura in cui vengano so-stenute consapevolmente a livello istituzio-nale, come è già accaduto in diversi Paesi.In questo senso, il ruolo del Rapporto tra-scende la dimensione puramente statisti-ca, perché consente di impostare le scelte politiche, per non dire di quelle aziendali, in un’ottica conoscitiva di base, improntata ad esaustive ricerche di marketing.Queste considerazioni assumono specifica importanza a cinque anni dalla crisi del 2009, i cui effetti a lungo termine conti-
orientare le proprie scelte all’interno dello scenario globale. Strumenti come Marmo-macc, la più importante fiera internazionale di settore che quest’anno taglia a Verona il traguardo delle 49 edizioni, ed il XXV “Rap-porto Marmo e Pietre nel Mondo”.La presentazione di questa pubblicazione - una vera “Bibbia” del comparto attesa ogni anno dagli addetti ai lavori - avverrà in an-teprima proprio a Marmomacc 2014, in oc-casione della giornata inaugurale della ma-nifestazione, nata nel 1961 a Sant’Ambro-gio di Valpolicella, sito marmifero tra i più importanti d’Europa fin dai tempi romani. Così come Marmomacc ha accompagnato
quasi mezzo secolo di evoluzione dell’indu-stria lapidea, supportandone lo sviluppo e la promozione, il Rapporto di Carlo Monta-ni, da 25 anni, ne è fedele e preciso croni-sta per il mondo economico e per gli opera-tori specializzati. Come Marmomacc è il più grande punto d’incontro per il business e la formazione professionale di 57 mila buyer, designer ed architetti di oltre 140 Paesi, il “Rapporto Marmo e Pietre nel Mondo” si conferma quale guida ragionata, essenzia-le per capire ed interpretare i mercati inter-nazionali, consolidati ed emergenti.
Buona lettura

10 XXV Rapporto Marmo e Pietre nel Mondo 2014
nuano ad essere significativi in altri settori dell’aggregato edile, mentre sono stati prontamente elisi dal lapideo, in conco-mitanza con un nuovo aumento della sua quota di mercato, sia pure relativamente contenuta. Ciò vuol dire che i caratteri tec-nologici ed estetici del prodotto di natura sono oggetto di un apprezzamento non effimero, su cui è possibile costruire una politica di crescita industriale, e quindi di investimenti, sia nel campo produttivo che in quello strettamente promozionale.L’assunto deve essere esteso alle tecnolo-gie, con particolare riguardo alle strutture impiantistiche ed ai beni strumentali, cui il Rapporto dedica rinnovate ed approfondi-te attenzioni, ed il cui ruolo nello sviluppo di marmi e pietre è assolutamente fonda-mentale, grazie all’apporto decisivo della
ricerca e delle macchine italiane, nel qua-dro di una strategia di ottimizzazione della produttività, non disgiunta dalla sicurezza e dal perseguimento di livelli qualitativi sem-pre più avanzati.La crescita lapidea è collegata a quella dell’occupazione, in quanto la componente professionale continua ad avere un’inci-denza importante sui costi produttivi e di-stributivi. Anche a prescindere dalle stime più recenti, nell’ordine mondiale dei venti milioni di unità, quella del lapideo costitu-isce un fenomeno di evidente importanza socio-economica, capace di affermare nel-le cave, nelle segherie e nei cantieri la di-gnità di un nobile lavoro, cui si debbono, a più forte ragione, tutte le attenzioni di una vera politica, intesa come arte di operare nella vita associata per il bene comune.
XXVRapporto marmo e pietre nel mondo
2014
Quadro macro-economico
Il prodotto lordo mondiale ha raggiunto un nuovo massimo storico, superando 70 mila miliardi di dollari (tav. 1) e confermando la tradizionale concentrazione in un numero relativamente circoscritto di Paesi: i primi quindici esprimono i tre quarti del totale, lasciando agli altri, che sono oltre duecen-to, la cifra a saldo. Gli aumenti più signifi-cativi sono stati ascritti ancora una volta da Stati Uniti e Cina, il cui reddito nazionale costituisce un terzo di quello planetario, mentre le variazioni negative di maggiore rilievo hanno avuto riguardo all’Europa, coinvolgendo in misura apprezzabile anche il Brasile.L’attività edilizia, dopo il ristagno che aveva fatto seguito alla crisi del 2009, ha invertito la tendenza ed ha fatto registrare, nei mag-giori Paesi industriali, una prima ripresa significativa, nell’ordine medio del 5,1 per cento (tav. 2). Ciò, sebbene in Cina, primo Paese costruttore mondiale, nel 2013 sia stato sostanzialmente confermato il livello dell’anno precedente, mentre negli Stati Uniti l’aumento è stato a doppia cifra, a
fronte di un volume delle nuove costruzioni rimasto assai lontano, peraltro, dai massi-mi storici. Incrementi di rilievo si sono avuti anche in Giappone e soprattutto in Turchia, dove l’attività costruttiva, diversamente da quanto accaduto altrove, è pervenuta ad un nuovo record.Nel lungo periodo non sono molti i Paesi che abbiano ascritto consuntivi di segno favorevole, a conferma di una congiuntu-ra edile che continua ad essere vischiosa: come attestano gli indici, nel gruppo di ri-ferimento la crescita si è avuta soltanto per la stessa Turchia, seguita da Corea del Sud, Cina, Russia, Polonia e Germania (tav. 3): tutti Stati che, a vario titolo, hanno potuto contare su fattori congiunturali più favore-voli allo sviluppo.Con circa quattro milioni di unità residen-ziali costruite nel 2013, la Cina, nonostante la tendenza alla stasi di cui si è detto, resta il primo costruttore mondiale con largo van-taggio su Giappone, India, Russia e Turchia, che seguono nelle posizioni di graduatoria immediatamente successive (tav. 4). La concentrazione di cui si è detto a proposito del PIL trova conferma, secondo logica, an-

12 XXIV Rapporto Marmo e Pietre nel Mondo 2014 Carlo Montani 13
che nelle cifre dell’edilizia.Le correlazioni di queste cifre con i consu-mi lapidei sono di tutta evidenza: dove si costruisce di più, le potenzialità d’impiego sono proporzionalmente maggiori, sebbene vadano ponderate con altri fattori impor-tanti quali la disponibilità delle risorse lo-cali, la propensione ad investire nel prodot-to di qualità e la forza della concorrenza. Non a caso, Cina, India e Turchia figurano ai vertici della produzione e della trasforma-zione di marmi e pietre, mentre Giappone e Russia sono ottimi consumatori d’impor-tazione.L’edilizia europea, come si diceva, opera in condizioni quantitative largamente inferiori ma ciò non costituisce una strozzatura in-superabile per quanto concerne l’impiego lapideo, che anzi si colloca, per quanto con-cerne il livello pro-capite, a livelli mondiali competitivi, se non addirittura massimi, come nei casi del Belgio o della Svizzera. In altri termini, marmo e pietre debbono necessariamente contare sulla presenza di un’edilizia significativa sul piano quantita-tivo, ma nello stesso tempo, possono fare affidamento sul fattore qualitativo, sempre in grado di fare la differenza. Non a caso, anche in Brasile l’effetto negativo rivenien-te dalla riduzione del prodotto lordo è stato nullo in campo lapideo, grazie alla forza dell’export non disgiunta dallo sviluppo del consumo interno indotto dalla qualità.
Produzione mondiale
Il trend di crescita dell’escavazione di mar-mi e pietre è proseguito anche nel 2013,
mettendo a segno il quarto aumento conse-cutivo, che ha portato la quantità prodotta non lontano dai cento milioni di metri cubi lordi, con una maggiorazione in volume, ri-spetto all’anno precedente, nell’ordine dei cinque milioni, pari al 5,3 per cento (tav. 5). Il netto di competenza si è ragguagliato a 48,2 milioni di metri cubi, cui corrispondo-no 130 milioni di tonnellate.A sua volta, la produzione netta di mate-riali pronti per l’impiego, detratti gli scarti di segheria e di laboratorio, ha raggiunto 76,7 milioni di tonnellate, mentre la ripar-tizione merceologica fra calcarei, silicei ed ardesiaci ha sostanzialmente confermato le incidenze precedenti, che vedono la pre-valenza di marmo e travertino nella misura di tre quinti del totale (tav. 6). In effetti, an-che le quote del consumo si sono andate stabilizzando, pur nell’ambito di qualche maggiore preferenza per i calcarei, indotta da una disponibilità tuttora maggiore.La somma degli scarti di cava e di trasfor-mazione è pervenuta a 190 milioni di ton-nellate: un volume decisamente cospicuo, che induce un problema strategico certa-mente prioritario per il settore: quello della collocazione, e per quanto possibile, dell’i-donea valorizzazione di questi materiali. L’apporto dei Paesi asiatici alla produzione lapidea mondiale, ormai largamente preva-lente, continua ad esprimere maggiorazioni quantitative, grazie al contributo determi-nante di India e Cina, mentre quello euro-peo ha fatto registrare un ulteriore regres-so, che nel 2013 è stato pari ad un punto percentuale rispetto all’anno precedente (tav. 7). E’ da sottolineare, inoltre, il buon aumento dell’America Latina, indotto dalla
crescita brasiliana. Il volume dei manufatti lapidei è salito a 1.420 milioni di metri quadrati, riferiti allo spessore convenzionale di cm. 2, con una crescita di 70 milioni nei confronti del 2012, a cui hanno contribuito in maniera determinante i quattro maggiori protago-nisti del comparto: nell’ordine, Cina, India, Turchia e Brasile (tav. 8), che sono riusciti ad esprimere oltre il 61 per cento del tota-le. Per converso, è proseguito l’andamento riflessivo dei Paesi europei, e segnata-mente di quelli mediterranei: nell’Unione, il calo produttivo è stato comunque conte-nuto, essendosi limitato a mezzo milione di tonnellate ed al 3,3 per cento (tav. 9).Un cenno particolare compete all’Italia, la cui produzione estrattiva corrisponde ad un volume di prodotto finito pari a 76,5 milioni di metri quadrati equivalenti, con la Tosca-na in posizione di netto vantaggio sul Lazio e sulle altre Regioni (tav. 10); ma nello stes-so tempo, con quote notevolmente diverse rispetto a quelle dell’export, dove i due ter-zi del volume spedito sono appannaggio del Veneto e della stessa Toscana con apporti praticamente paritetici.A livello mondiale, il prodotto finito si è differenziato tra consumi edili ed impieghi diversi nelle proporzioni rispettive di tre quarti ed un quarto: nel primo caso, con destinazioni prioritarie a pavimenti, lavo-ri speciali e rivestimenti, e nel secondo, all’arte funeraria ed all’arredo urbano (tav. 11). Giova porre in evidenza che nel perio-do lungo la quota che ha fatto registrare il tasso di crescita più alto è stata quella dei lavori speciali, cui hanno contribuito in misura significativa l’avanzamento tecnolo-
gico e la diffusione ormai generalizzata del controllo numerico.
Scambi internazionali
Il trend di crescita dell’interscambio lapi-deo mondiale è proseguito anche nel 2013, ascrivendo il quarto aumento consecutivo annuale, dopo la battuta d’arresto fatta registrare con la crisi del 2009. Più speci-ficamente, i volumi globali dell’esportazio-ne e della corrispondente importazione si sono ragguagliati a 53,3 milioni di tonnel-late, con un incremento rispetto all’anno precedente che è stato pari ad un milione e mezzo di tonnellate, ed a circa tre punti percentuali: alla luce del dato produttivo, in crescita di cinque punti, ne consegue che lo sviluppo dei mercati interni è stato superio-re a quello degli scambi. Il modello input-output, strumento base del-la rilevazione incrociata, mette in evidenza come i calcarei grezzi abbiano dato luogo a movimenti internazionali per 15 milioni di tonnellate (tav. 12), con un aumento del 2,6 per cento, mentre nei silicei grezzi si sono raggiunti 13,1 milioni di tonnellate (tav. 13), cui corrisponde una lievitazione del 4,5 per cento. Mediamente, il progresso dei grez-zi, costituiti da blocchi e lastre a piano di sega, è stato del 3,5 per cento ed ha as-sorbito il 52,7 per cento dell’interscambio totale, proseguendo nella tendenza in atto da qualche anno, crescendo di circa mezzo punto rispetto alla quota rilevata nel 2012, e facendo registrare il nuovo massimo con 28,1 milioni di tonnellate. Il prodotto finito è stato oggetto di flussi

14 XXIV Rapporto Marmo e Pietre nel Mondo 2014 Carlo Montani 15
quantitativi internazionali per la quota a saldo, pari al 47,3 per cento ed a 25,2 milio-ni di tonnellate, evidenziando una crescita in cifra assoluta nell’ordine del mezzo mi-lione di tonnellate, mentre quella del grez-zo è stata sostanzialmente doppia. I lavora-ti semplici, con scambi pari a 2,9 milioni di tonnellate (tav. 14), hanno regredito del 6,3 per cento, mentre quelli con valore aggiun-to, che costituiscono la componente basi-lare dei flussi valutari, si sono attestati sul consuntivo di 21,1 milioni di tonnellate (tav. 15), con una crescita ponderale di quattro punti, tanto più significativa in quanto tri-pla nei confronti di quella ascritta nel 2012. In regresso, invece, hanno chiuso i lavorati di ardesia, con scambi per 1,2 milioni di tonnellate (tav. 16), ed una variazione ne-gativa del 6,5 per cento.Globalmente, i flussi dei volumi lapidei in entrata ed uscita, al netto della quota di scarto sul volume dei grezzi, hanno avuto riguardo ad un totale di 774 milioni di metri quadrati equivalenti, allo spessore conven-zionale di cm. 2, con un aumento di venti milioni in cifra assoluta (tav. 17) che si è tradotto in un progresso medio del 3,7 per cento. Il volume dei grezzi ragguagliato a lavorati ha iterato il consuntivo precedente, con circa due quinti del totale.In sintesi, si deve sottolineare come la crescita complessiva del 2013 sia stata in-feriore a quella del 2012, ma come abbia ulteriormente consolidato la ripresa, con il contributo maggioritario dei grezzi e dei lavorati ad alto valore aggiunto, e con ul-teriori potenziamenti delle quote di blocchi destinati alla trasformazione in Paesi terzi caratterizzati da livelli competitivi dei costi.
Si tratta, a tale riguardo, di una strategia che coinvolge in modo prioritario i grandi produttori asiatici, ed in primo luogo la Cina, massima importatrice di grezzi, se-gnatamente da Turchia, Egitto ed Iran per i calcarei, e dal Brasile per i silicei.L’interscambio, con il suo trend di crescita quasi costante, che negli ultimi 25 anni si è interrotta soltanto nel 1998 e nel 2009, costituisce un indubbio punto di forza del comparto lapideo, alla luce di una doman-da selettiva e di un conseguente impulso al perseguimento della qualità, fattore gene-ralmente imprescindibile sul mercato inter-nazionale; e nello stesso tempo, garanzia di ulteriore crescita civile.
Flussi aggregati dell’eximport
L’analisi dell’interscambio per grandi ag-gregati geografici è utile per fare il punto sui diversi comportamenti della congiun-tura e per trarne indicazioni significative circa le prospettive di sviluppo nel breve e medio termine, in una logica di marketing che intende trascendere il pur significativo linguaggio statistico delle cifre.Il consuntivo dell’Unione Europea, con 11,4 milioni di materiale esportato (tav. 18), con-ferma quello dell’anno precedente, mentre l’import ha evidenziato approvvigionamen-ti per 9,6 milioni di tonnellate (tav. 19), in ulteriore flessione di mezzo milione dopo quella più cospicua dell’anno precedente, sottolineando, da un lato, la tenuta delle spedizioni di grezzi mediamente qualifica-ti come quelli europei, e dall’altro, la per-manenza di un sostanziale ristagno delle
attività di cantiere nell’Unione medesima, sia nelle segherie che nei laboratori. Gli esportatori europei più forti sono sempre Italia, Spagna e Portogallo, mentre fra gli acquirenti si distinguono Germania, Francia e Belgio, unitamente alla stessa Italia.I movimenti che interessano gli altri Paesi europei hanno confermato una condizione di sostanziale marginalità, sia nell’export (tav. 20) che nell’import (tav. 21), il cui flusso quantitativo si è posto, in entrambi i casi, nell’ordine del milione di tonnellate, con un ruolo prioritario della Svizzera, so-prattutto negli approvvigionamenti, tanto del grezzo quanto del manufatto.Un ruolo sempre più determinante nell’in-terscambio lapideo è quello ascritto dai maggiori Paesi settoriali extra-europei, gui-dati con crescente vantaggio da Cina, India e Turchia, seguiti a distanza, ma con volumi ugualmente importanti, da Brasile ed Egitto (tav. 22), mentre negli acquisti, dove la Cina ha consolidato la propria leadership storica, si è registrata una buona ripresa degli Stati Uniti e la conferma di Corea del Sud e Tai-wan nella posizioni di rincalzo (tav. 23). Nuo-ve vischiosità, invece, si sono avute nell’ex-port dall’Iran e nell’import in Giappone. Gli altri Paesi del sud-est asiatico, pur re-stando lontani dai consuntivi dei massimi protagonisti, hanno confermato un ruolo complementare importante, iterando l’ex-port già contabilizzato nel 2012 con 1,7 mi-lioni di tonnellate (tav. 24), mentre l’import è decisamente aumentato portandosi a 2,5 milioni, grazie ai maggiori acquisti effet-tuati soprattutto da Hong - Kong, Singapo-re e Vietnam (tav. 25), con un significativo apporto prioritario del prodotto finito.
Il panorama mondiale si completa con una lunga serie di altri Paesi dei vari continenti extra europei, il cui singolo ruolo può di-ventare importante, come nel caso delle spedizioni da Giordania, Oman e Palesti-na (tav. 26) o degli approvvigionamenti di Libano ed Arabia Saudita, questi ultimi in forte e crescente tensione (tav. 27). In li-nea generale, si rileva un contributo rela-tivamente marginale ai flussi internazionali da parte di Africa ed America Latina, con le ovvie eccezioni di Brasile, Egitto e Suda-frica, mentre quello dell’Asia è ancora una volta significativo. Complessivamente, la sintesi per grandi aggregati conferma che i grandi protago-nisti extra europei hanno ulteriormente sviluppato il proprio primato esportatore, giungendo al 68,5 per cento del totale col guadagno di un ulteriore punto rispetto all’anno precedente (tav. 28), ed esprimen-do il 55,3 per cento anche nell’import (tav. 29), con una crescita di quasi cinque punti. E’ un ulteriore segnale della progressiva concentrazione da cui l’interscambio setto-riale continua ad essere caratterizzato.
Dinamica dell’interscambio
L’analisi di lungo periodo conferma che il trend di sviluppo del settore, con le naturali proiezioni in sede produttiva e negli inve-stimenti, è in atto da 25 anni, improntato ad una significativa costanza.Infatti, il volume degli scambi risulta sali-to dai 9,7 milioni di tonnellate del 1989 ai 53,3 milioni del 2013 (tav. 30): ciò, a fronte di incrementi annuali costanti, sia pure di

16 XXIV Rapporto Marmo e Pietre nel Mondo 2014 Carlo Montani 17
diversa quantificazione percentuale, con le sole eccezioni del 1998 e del biennio 2008-2009: quest’ultima, di particolare impatto nella congiuntura del settore (tav. 31). A conti fatti, nel lungo periodo il volume di marmi e pietre oggetto di scambi interna-zionali è cresciuto di cinque volte e mezza, con variazioni sostanzialmente identiche sia nei grezzi che nel prodotto finito, anche se nei rispettivi aggregati sono da sottoli-neare gli incrementi più che proporzionali dei materiali calcarei e dei lavorati con alto valore aggiunto (tav. 32).La ripartizione merceologica è rimasta pra-ticamente invariata rispetto a quella del 1989, ma nel periodo lungo, dopo la pro-gressiva riduzione del grezzo fino al minimo storico del 2007, pari al 42,6 per cento del totale, è stato ascritto un recupero di die-ci punti, fino al 52,7 per cento dello scorso esercizio (tav. 33). Per quanto riguarda la suddivisione tra calcarei e silicei, anche il 2013 ha confermato la tradizionale preva-lenza di marmi e travertini, con una ripresa sia pure marginale del granito, ed una nuo-va flessione dell’ardesia.Nella dinamica ventennale, la ripartizione geografica delle esportazioni vede la pre-senza di sette Paesi che hanno spedito ol-tre confine volumi complessivi per oltre un milione di tonnellate, con posizioni di largo vantaggio per Cina, India e Turchia, seguite a distanza da Italia, Spagna e Brasile (tav. 34); condizioni analoghe ma quantitati-vamente dissimili si rilevano nelle impor-tazioni dove otto Paesi hanno acquistato materiali per oltre un milione di tonnellate, ma con la Cina in vantaggio sempre più schiacciante sugli altri importatori, guidati
da Stati Uniti e Corea del Sud (tav. 35). Si deve aggiungere, peraltro, che nell’ambi-to di questi “top leader” sono ben dodici i Paesi che hanno fatto registrare nel 2013 una flessione dell’export, e dieci quelli che hanno regredito nell’ambito degli approvvi-gionamenti. A proposito dell’esportazione giova evi-denziare, a prescindere dall’evoluzione di valori e prezzi, cui si farà riferimento in seguito, che le spedizioni quantitative di marmi e pietre dalla Cina sono diminuite per il secondo anno consecutivo, con un de-cremento di un milione e mezzo di tonnel-late rispetto al massimo storico del 2011, e la perdita di quasi due punti percentuali (tav. 36); per converso, sono ulteriormente aumentate quelle dei maggiori concorren-ti, vale a dire della Turchia, e soprattutto dell’India, la cui crescita nel corso dell’ul-timo biennio si è ragguagliata a quattro milioni di tonnellate, riducendo in maniera quasi imprevedibile il distacco nei confronti della Cina, sceso a tre milioni di tonnellate contro gli 8,3 del 2011. Nel corrispondente ambito delle importazio-ni, invece, l’ulteriore progresso cinese ap-pare incontenibile, con un aumento di oltre quattro milioni di tonnellate nel corso dell’ul-timo biennio ed un flusso in entrata che nel solo 2013 è pervenuto a quasi 18 milioni di tonnellate, pari ad un terzo degli acquisti mondiali (tav. 37), tanto più ragguardevole se confrontato con i 3,6 milioni degli Stati Uniti, secondo Paese importatore mondiale: evidentemente, anche alla luce del raffronto con l’export, la dinamica dell’interscambio cinese, dove la quasi totalità dell’import è costituita da materiali grezzi, evidenzia un
forte sviluppo della trasformazione interna e del mercato domestico.
Analisi merceologica
L’esame disaggregato della congiuntura in-ternazionale per singole categorie merceo-logiche nel periodo lungo pone in evidenza comportamenti assai diversi delle varie ti-pologie e dei Paesi protagonisti. Nei calcarei grezzi, l’esportazione continua a registrare il crescente successo della Turchia, che con 5,7 milioni di tonnellate è giunta ad esprimere il 38,1 per cento del to-tale, contro il 4,4 per cento del 1995, segui-ta a forte distanza da Italia e Spagna (tav. 38), mentre le importazioni evidenziano il ruolo quasi monopolistico della Cina, forte di acquisti per 10,8 milioni di tonnellate, pari al 72,3 per cento degli acquisti globali sui mercati esteri (tav. 39).Per quanto concerne i silicei grezzi, l’India ha conquistato la maggioranza assoluta dei volumi esportati, con 6,7 milioni di tonnel-late, pari al 50,7 per cento (tav. 40), seguita dal Brasile con 1,4 milioni, pari al 10,7 per cento, anch’esso in crescita. Per converso, le importazioni sono ancora una volta ap-pannaggio prioritario della Cina, con 6,7 milioni di tonnellate, che corrispondono al 51 per cento degli approvvigionamenti planetari (tav. 41), mentre Taiwan segue in seconda posizione, con 1,1 milioni di ton-nellate, e con un forte ridimensionamento del volume precedente.Nei lavorati semplici, ferma restando la contrazione complessiva di cui si è detto, l’export prioritario risulta sempre quello
della Cina, con 1,1 milioni di tonnellate ed il 37,4 per cento del totale (tav. 42), mentre il Portogallo, forte di una vecchia tradizione specifica, difende con successo la seconda piazza. L’importazione di questi materia-li rimane prevalentemente europea, con Germania e Francia in testa alla rispettiva graduatoria (tav. 43).La tipologia merceologica di maggiore con-sistenza, soprattutto in valore, è quella dei lavorati con alto valore aggiunto, dove sono ben cinque i Paesi ad avere esportato ol-tre un milione di tonnellate: nell’ordine, la Cina - che domina la classifica dall’alto dei suoi 9,5 milioni - seguita a forte distanza da Turchia, India, Italia e Brasile (tav. 44). Le importazioni, al contrario, sono distri-buite in maniera più diffusa, con incidenze prioritarie di Stati Uniti, Corea del Sud ed Arabia Saudita (tav. 45) quasi a sottolinea-re il peso crescente dei Paesi extra-europei anche a livello di consumi.Resta da dire dell’ardesia, la cui esporta-zione vede la permanente leadership della Spagna, peraltro ulteriormente assottiglia-ta, e pari al 38,7 per cento del totale, ascrit-to nel 2013, con vantaggio ormai marginale sulla Cina, ed in posizione più defilata, sul Brasile (tav. 46). Il calo delle spedizioni globali di questo materiale è bilanciato da quello degli acquisti, dove i maggiori flussi in arrivo riguardano, come da tradizione, Francia, Regno Unito e Stati Uniti (tav. 47).In sostanza, i flussi decisivi nell’economia dell’interscambio lapideo riguardano da una parte i grezzi, e dall’altra i manufatti (cod. 68.02), mentre il mercato, al di là di quanto emerge dalla sintesi dei Paesi pro-tagonisti, prosegue nella sua espansione di
18 XXIV Rapporto Marmo e Pietre nel Mondo 2014 Carlo Montani 19
tipo globale: quando si pensi che nel 2013 l’esportazione cinese di lavorati con valore aggiunto ha raggiunto il record di 205 Paesi di tutti i continenti (cifra superiore a quel-la degli Stati presenti nell’Organizzazione delle Nazioni Unite), è facile comprendere come marmi e pietre siano diventati un pa-trimonio dell’umanità nel vero senso della parola, in quanto artefici di un progresso tecnologico e civile che non è azzardato definire universale.
Italia: una meta lontana
Un vecchio primato non è mai garanzia di continuità: il caso dell’Italia lapidea è una dimostrazione probante dell’assunto. A prescindere dall’involuzione produttiva, che vede la sua quota regredire anche in ambito europeo, pur rimanendo prossima ad un terzo del volume estratto nel Vecchio Continente, l’andamento dell’interscambio lo conferma in maniera incontestabile: nel 2013 l’export quantitativo italiano al netto dei sottoprodotti, pari a 3,2 milioni di tonnellate, è cresciuto nella misura di un punto e mezzo, largamente inferiore a quella mondiale (tav. 48), con un apporto del grezzo salito al 48,7 per cento, con ulteriore svantaggio del prodotto finito. A sua volta, l’importazione, in costante calo da sette anni con la sola eccezione del 2010, ha visto il volume dei grezzi, sempre largamente maggioritario, scendere sotto il milione di tonnellate (tav. 49), cosa che sottolinea in maniera icastica la perma-nente crisi delle attività di trasformazio-ne e del valore aggiunto. Basti dire che
nell’ultimo triennio il volume degli acquisti è diminuito di ben 27 punti.Per quanto riguarda l’esportazione di la-vorati, che resta la struttura portante del settore lapideo italiano, si deve porre in evidenza, quale fattore parzialmente posi-tivo, che se l’aumento del 2013 è stato del tutto marginale, quello in valore, e quindi del prezzo medio per unità di prodotto, si è incrementato di oltre sette punti percen-tuali (tav. 50). In particolare, la quotazione del manufatto esportato ha superato per la prima volta i 50 euro per metro quadrato equivalente (a spessore convenzionale di cm. 2), diversamente da quanto è accaduto in altri Paesi, anche europei.L’andamento disaggregato dell’esportazio-ne di lavorati per il 2013 conferma la con-centrazione di due terzi del volume d’affari in due sole Regioni: il Veneto e la Tosca-na, con valori complessivi quasi paritetici, nell’ordine dei 500 milioni di euro cadauna (tav. 51) ,e con buone progressioni superiori alla media, anche in Lombardia e Sicilia.L’esportazione lapidea italiana, pervenuta ad un valore totale di 1874 milioni, che costituiscono il risultato migliore del de-cennio (tav. 52), resta comunque inferiore, ed in misura significativa, rispetto a quella degli anni migliori, ma nei confronti della cifra globale di merci e servizi esportata dall’Italia ha proseguito nella tendenza al recupero inaugurata nel 2012, ascrivendo una quota del 4,8 per mille, peraltro assai lontana da quella del 7,5 rilevata nell’ormai lontano 2000: ciò significa che la propen-sione alla crescita, fatta salva la ripresa marginale dell’ultimo biennio, è notevol-mente inferiore a quella del sistema Italia,
pur caratterizzato dalla nota congiuntura critica. Ne derivano evidenti correlazioni distributive e promozionali, e l’urgenza di adeguati interventi.Sul piano strategico, i numeri dell’Italia sottolineano ulteriormente, oltre al rista-gno del mercato interno indotto da un’edi-lizia in condizioni da troppo tempo critiche, una struttura esportatrice orientata verso la preferenza per il grezzo, che assicura mag-giori livelli di redditività ai Soggetti interes-sati ma non consente uno sviluppo delle at-tività di segheria e di laboratorio conforme alla dinamica della domanda mondiale. In tutta sintesi, la meta di un pieno recupero dei consuntivi storici, strategicamente pos-sibile, rimane assai lontana.Questa situazione non è sostanzialmente difforme da quella rilevabile in altri Paesi europei a maggiore vocazione lapidea, con riguardo prioritario a quelli mediterranei, ed in primo luogo a Spagna e Grecia, ma sottintende una progressiva abdicazione della vecchia “leadership” trasformatri-ce a vantaggio precipuo dei nuovi grandi protagonisti asiatici (Cina, India e Turchia) e del maggior produttore e trasformatore dell’Occidente (Brasile). Le conseguenze di tale involuzione dal punto di vista strate-gico, e da quello socio-economico, sono di tutta evidenza e costituiscono un importan-te spunto di riflessione, in primo luogo per la volontà politica, e nello stesso tempo, per il momento imprenditoriale.
Spagna: ripresa complessa
Seconda produttrice lapidea europea, e
settima mondiale, la Spagna evidenzia una congiuntura tuttora critica ma nello stes-so tempo animata da spunti significativi di ripresa, cui contribuiscono un ventaglio produttivo assai variegato, la permanente “leadership” nell’ambito dell’ardesia ed una propensione agli investimenti sempre accentuata, in specie nella grande trasfor-mazione, dove la produttività ha raggiunto livelli molto avanzati, anche nei manufatti extra-seriali come i piani da cucina e l’ar-redo dei bagni.Questi fattori di competitività si comple-tano con la presenza delle riserve su gran parte del territorio ed una valorizzazione trasformatrice spesso intensa, anche per il marmo ed il granito. La forte contrazio-ne del mercato domestico ha dato luogo a decrementi proporzionali del consumo, parzialmente elisi dalla conferma dell’ex-port, quantitativamente più accentuata nel grezzo, ma notevole anche nei manufatti, le cui spedizioni all’estero hanno largamente superato, anche nel 2013, i venti milioni di metri quadrati equivalenti.La struttura esportatrice della Spagna è sta-ta caratterizzata da un vivace recupero, con un fatturato del 2013 nell’ordine dei 1200 milioni di euro (tav. 53), non lontano dal mas-simo storico del 2008; ciò, al pari di quanto è accaduto in Italia, con una quota grezza che nell’ultimo triennio ha interessato circa il 50 per cento dei volumi (tav. 54), ma nello stes-so tempo con l’ampia prevalenza del prodot-to finito quanto a valore, dove il suo peso ponderale si è ragguagliato a due terzi del totale. Dal canto loro, le quotazioni medie per unità di prodotto hanno progredito bene nella spedizione dei calcarei grezzi, pur ce-

20 XXIV Rapporto Marmo e Pietre nel Mondo 2014 Carlo Montani 21
dendo alcuni punti nel 2013, mentre hanno continuato a scendere quelle del granito, il cui prezzo è pressoché dimezzato rispetto al 2001; nei lavorati il calo è stato più conte-nuto, con un valore che, sempre nell’ultimo esercizio, è rimasto intorno agli 80 dollari per metro quadrato, di poco superiore a quello dell’ardesia, la cui flessione pondera-le è peraltro maggiore (tav. 55).Assai più accentuato è stato l’andamento riflessivo delle importazioni, sia nel lungo termine che nel breve periodo, con riguar-do prioritario a quello del grezzo, specchio di una politica del valore aggiunto che ha penalizzato le attività trasformatrici, al pari di quanto è accaduto negli altri maggiori Paesi europei, mentre la crisi del lavorato d’importazione, sia pure meno ampia, si pone in rapporto con la congiuntura nega-tiva dell’edilizia locale (tav. 56). La quota largamente maggioritaria dell’import, co-munque, resta quella del granito grezzo, sia in volume che in valore (tav. 57), dove ha raggiunto, rispettivamente, il 43 ed il 70,2 per cento del totale, con prezzi medi in flessione nei confronti del 2012 ma pur sempre maggiori, ed in alcuni casi signifi-cativamente, nei riguardi del 2001, con un ragguaglio a 39 dollari per metro quadrato equivalente nei manufatti, pari alla metà di quello corrispondente dell’export (tav. 58).In buona sostanza, la ripresa è difficile, ma conta su una struttura produttiva avanza-ta e sulla discreta propensione all’inve-stimento anche in campo promozionale, confermata, fra l’altro, dalla forte presen-za dell’industria lapidea iberica in molte fiere di riferimento, e dalla competitività di taluni costi distributivi, come quelli dei
noli: non a caso, il trasporto dalla Galizia alla Toscana risulta competitivo rispetto al cabotaggio italiano. Considerazioni ana-loghe valgono per i costi energetici e per quelli professionali, la cui capacità di fare la differenza, soprattutto nelle fasi di tra-sformazione, è suscettibile di contribuire attivamente a prove di ripresa che possono contare sulla cooperazione del momento imprenditoriale con quello politico, fattore certamente utile nei complessi confronti internazionali di settore.
Altri Paesi europei
Il primato produttivo e distributivo di Ita-lia e Spagna nell’ambito del Vecchio Con-tinente non esclude la presenza di altre significative realtà settoriali, talvolta di consolidata tradizione, ed in possesso di prestigiose esclusive. Si può anzi affermare che nell’Europa comunitaria la stragrande maggioranza dei Paesi abbia un ruolo di buon rilievo settoriale nella produzione, nell’interscambio e nel consumo.Valorizzare le risorse locali di marmo e pie-tra è una strategia preferenziale di Porto-gallo e Grecia: nel primo caso, con avanzate strutture di verticalizzazione, con una buo-na collaborazione della volontà politica, e con la leadership europea nella produzione e nell’export di lavorati semplici, in specie per uso stradale; nel secondo, con l’aval-lo di alte referenze, mutuate dall’antichità classica. Nondimeno, i marmi portoghesi ed ellenici si sono giovati in misura sostan-zialmente minima dei potenziali effetti po-sitivi rivenienti dalla crisi economica, che
nei rispettivi Paesi si è avvertita in maniera accentuata: la contrazione di alcuni costi e la maggior pressione dell’offerta non hanno avuto effetti importanti sull’export, rimasto quasi stazionario, con qualche cedenza più rilevante nei lavorati del Portogallo.Sul fronte dell’importazione, invece, si distinguono come in passato gli approv-vigionamenti dei Paesi mitteleuropei, se-gnatamente di manufatti, con particolare riguardo a quelli di Germania, Francia, ed in misura appena più circoscritta, di Olanda e Belgio: quest’ultimo Paese, anzi, rimane ai vertici mondiali del consumo pro-capite, non solo per il buon livello quantitativo del-le sue riserve e per la capacità di valoriz-zarle, ma nello stesso tempo, per la trasfor-mazione dei grezzi provenienti dall’estero. Un ruolo importante compete anche all’ac-quisto di prodotti finiti da parte del Regno Unito, dove ha trovato conferma la politica di potenziamento degli utilizzi lapidei d’im-portazione, in un Paese caratterizzato dal-la carenza storica di produzioni proprie, e quindi, della grande trasformazione.La congiuntura statica europea continua anche nei Paesi nordici, con particolare riguardo alla Finlandia ed alla Norvegia, dove le tipiche produzioni di granito grezzo, generalmente di alto pregio, hanno perduto qualche punto percentuale, con destinazio-ni ormai prevalenti al mercato cinese, cui è diretta una parte maggioritaria dell’ex-port calcareo grezzo anche da Portogallo e Grecia, ma quantitativamente integrativa, assieme alle quote di Italia e Spagna, dei grandi flussi di spedizione in Cina dai nuovi leader terzomondisti (Turchia, Egitto ed Iran per i calcarei; India e Brasile per i silicei).
Vale la pena di sottolineare come la Ger-mania, massimo acquirente europeo di set-tore, con una larga maggioranza di lavorati, si proponga anche quale discreta realtà esportatrice, grazie ad un’apprezzabile atti-vità produttiva che le consente di occupare il quinto posto assoluto nella graduatoria europea delle vendite quantitative. Si van-no ulteriormente rastremando, invece, le posizioni di alcuni Paesi orientali, con ri-guardo prioritario a Polonia e Repubblica Ceca, anche per quanto riguarda il consumo interno: non a caso, il 2013 ha coinciso con una forte riduzione degli acquisti polacchi di materiale grezzo, e conseguentemente, delle attività di segheria. Tra i Paesi di più recente ingresso nell’Unio-ne Europea, è da sottolineare il bilancio lar-gamente positivo della Croazia, grazie alla fiorente esportazione di materiali istriani e dalmati, in massima parte grezzi (anche per uso strutturale), mentre sono rimaste in li-sta d’attesa le potenzialità di Paesi come la Bulgaria, e soprattutto la Romania, sebbe-ne possano contare su riserve di notevole valore tecnologico e cromatico, in specie di marmi ed altri materiali calcarei.
Pianeta Cina
Nel 2013 ha trovato ulteriore conferma la fase di ripensamento strategico delle op-zioni di fondo da parte della politica econo-mica cinese, anche alla luce di un relativo rallentamento dello sviluppo, con tassi ad una sola cifra in cui diventano significativi anche i decimali.Il comparto lapideo non ha fatto eccezione,

22 XXIV Rapporto Marmo e Pietre nel Mondo 2014 Carlo Montani 23
con un livello produttivo non lontano dai 40 milioni di tonnellate, ed un’esportazione quantitativa che ha ascritto una seconda battuta d’arresto dopo quella del 2012, scendendo a 12,1 milioni di tonnellate (tav. 59), ma evidenziando tuttora una crescita di cinque volte e mezzo nel ragguaglio di periodo ventennale (tav. 60).La quota largamente maggioritaria dell’ex-port è rimasta quella dei prodotti finiti, con il 92 per cento del totale (tav. 61), confer-mando la tradizionale vocazione cinese per la politica del valore aggiunto ed il rinno-vato gradimento da parte dei mercati este-ri. In valore, invece, la crescita si è fatta ancora più ragguardevole, con un volume d’affari pervenuto a 6,2 miliardi di dollari (tav. 62), in crescita di circa un miliardo nei confronti del 2012, pari a ben venti punti percentuali.Il perseguimento di più alti livelli di red-ditività da parte degli esportatori cinesi è suffragato dall’ulteriore aumento del prez-zo medio dei manufatti, pervenuto a 32,4 dollari/mq. contro i 27,5 dell’anno prece-dente, per non dire dei 13 del 2003, anno di massima contrazione promozionale delle quotazioni (tav. 63). Il divario di prezzo ri-spetto ai livelli dei Paesi occidentali resta naturalmente competitivo, a tutto vantag-gio dell’export cinese.Le maggiori destinazioni del prodotto finito sono rimaste quelle tradizionali, con largo vantaggio per Corea del Sud, Giappone e Stati Uniti, ma nello stesso tempo con forti escursioni del prezzo medio, il cui li-vello più elevato continua a registrarsi sul mercato americano, mentre quelli minimi interessano, oltre alla stessa Corea, anche
alcuni Paesi europei, quali Germania e Bel-gio, dove sussiste un chiaro interesse per materiali d’importazione suscettibili d’ac-quisto a condizioni particolarmente conve-nienti (tav. 64). I primi tre importatori del materiale cinese, di cui sopra, esprimono oltre un terzo delle spedizioni in parola (tav. 65), ma ciò non si-gnifica che la capacità di penetrazione dei lavorati cinesi non abbia assunto caratteri assolutamente globali, essendosi diffusa, nel 2013, in un ventaglio di 205 Paesi di ogni continente, ed avendo evidenziato il carattere universale della domanda, assie-me ad una spiccata idoneità commerciale e distributiva.Resta da dire dell’importazione che, diver-samente dall’export, è costituita in misura quasi totalitaria da materiali grezzi desti-nati alla trasformazione nelle segherie e nei laboratori cinesi, con un valore com-plessivo che nel 2013 ha raggiunto il nuovo massimo, nella misura di oltre 2,9 miliardi di dollari (tav. 66), con una crescita di oltre undici punti rispetto all’anno precedente, ma nello stesso tempo con una sostanziale stasi dei prezzi medi d’acquisto, il cui livel-lo è inferiore di una buona metà, rispetto ai massimi storici degli anni novanta (tav. 67), mettendo in luce una spiccata capacità selettiva cinese anche nel campo degli ap-provvigionamenti.Le maggiori provenienze hanno avuto ri-guardo, come in precedenza, alla Turchia ed all’Egitto per quanto concerne i prodot-ti calcarei (tav. 68), nonché all’India ed al Brasile nell’ambito dei silicei (tav. 69): in entrambi i casi, circa tre quinti delle im-portazioni cinesi interessano due sole pro-
venienze, cosa che non esclude un ampio ventaglio di acquisti a saldo, ma sottolinea la consolidata prevalenza del rapporto d’af-fari con gli altri quattro Paesi leader del mercato mondiale.
Asia protagonista
Il consolidamento della leadership asiatica in campo lapideo non si deve soltanto alla Cina, perché l’importanza produttiva e di-stributiva di altre realtà fondamentali come l’India, la Turchia e l’Iran ha acquisito di-mensioni di livello assoluto, senza dire dei consumi nazionali, di grande rilievo anche in Paesi di minore capacità estrattiva come Corea del Sud e Giappone. La citazione prioritaria compete all’India, seconda forza mondiale del settore, il cui distacco dall’export cinese, anzi, si è note-volmente ridotto durante l’ultimo biennio. In particolare, le sue spedizioni di granito grezzo del 2013 hanno raggiunto un nuovo massimo, fatturando oltre 850 milioni di dollari, in larga maggioranza proprio alla Cina (tav. 70), ed anche quelle del prodotto finito hanno progredito alacremente, sfio-rando i due milioni di tonnellate, pari ad ol-tre 36 milioni di metri quadrati equivalenti, e superando 1,1 miliardi di dollari (tav. 71), pur nell’ambito di una contrazione non mar-ginale del prezzo, sceso a poco più di 30 dollari: ciò, con destinazioni notevolmente differenziate, ma con quella statunitense in posizione di notevole vantaggio rispetto ai mercati europei (tav. 72).Ancora più impetuoso è stato lo sviluppo della Turchia, con un’esportazione totale
per 8,3 milioni di tonnellate, in crescita di 18 volte nei confronti del 1999, sebbene il valore medio abbia ascritto una signifi-cativa contrazione, nell’ordine di 13 punti percentuali (tav. 73). Ciò si deve in misura assolutamente prioritaria all’esportazione di blocchi e lastre di marmo e travertino verso la Cina, che nel 2013 ha raggiunto 4,9 milioni di tonnellate, pari a quasi nove decimi del totale di riferimento (tav. 74); as-sai significativo, soprattutto nell’ambito del valore, è stato anche l’apporto dei lavorati, ed in primo luogo di quelli esportati negli Stati Uniti e nei Paesi arabi (tav. 75).Nell’ambito delle importazioni, un’atten-zione specifica deve essere sempre rivolta al mercato del Giappone, dove gli acquisti di materiale grezzo si sono quasi azzerati, confermando il ristagno delle attività pro-duttive locali, in essere da parecchi anni (tav. 76), a tutto vantaggio degli approv-vigionamenti di manufatti, in larghissima maggioranza cinesi (tav. 77), ma ugualmen-te cedenti sia nel breve che nel lungo perio-do, anche per quanto riguarda i valori medi per unità di prodotto, con la sola eccezione del 2013, speculare all’aumento del prezzo cinese di vendita dei lavorati (tav. 78).Le altre realtà asiatiche non mancano di contribuire in misura significativa allo sviluppo mondiale: non solo con gli alti consumi di Paesi come la Corea del Sud, largamente tributaria della Cina al pari del Giappone, e come Hong Kong e Singapore; ma soprattutto, con l’apporto produttivo di nuovi protagonisti dell’interscambio, come l’Iran, a prescindere da una tradizione do-mestica eccellente e dalla stasi delle sue vendite in Cina, o come il Pakistan, che nel

24 XXIV Rapporto Marmo e Pietre nel Mondo 2014 Carlo Montani 25
2013 ha raggiunto il milione di tonnellate estratte; e con il contributo industriale di Paesi trasformatori quale Taiwan, dove la capacità segante pro-capite si colloca in-torno ai massimi mondiali, ed in misura minore, come il Vietnam, l’Indonesia e la Thailandia, senza escludere alcuni Stati del Golfo, tra cui l’Oman, dove la valorizzazione della risorsa lapidea locale ha dato luogo a significativi investimenti, non soltanto in campo estrattivo.Non vanno trascurate, infine, le potenzialità offerte da Paesi certamente minori, tra cui si possono ricordare, a titolo di esempio, il Bhutan, le Maldive ed il Nepal, se non altro per l’utile integrazione settoriale con l’India; e gli Stati dell’interno, a cominciare da quelli dell’ex Unione Sovietica, guidati da un Kazakhstan in costante sviluppo, per finire con la Mongolia e la stessa Corea del Nord, che proprio nel 2013 hanno fatto registrare alcuni movimenti innovativi, sia pure marginali, nell’interscambio lapideo asiatico.
Stati Uniti: progresso graduale
Nella congiuntura lapidea mondiale, sia di breve che di lungo termine, il mercato sta-tunitense riveste un’importanza imprescin-dibile, soprattutto per la cifra leader del giro d’affari, riveniente in misura ampia-mente preponderante dall’import. Di qui, l’interesse con cui gran parte degli espor-tatori europei, asiatici e latino-americani guarda al rapporto commerciale con gli Stati Uniti.Nel 2013, gli acquisti nord-americani di
marmi e pietre, costituiti per la quasi to-talità da prodotti finiti, hanno raggiunto un valore pari a 3,1 miliardi di dollari, con un incremento del 19,5 per cento rispetto al 2012, che fa seguito a quelli del bien-nio precedente (tav. 79) ma rimane tuttora lontano dal primato del 2007. Vale la pena di sottolineare che la crescita dell’ultimo esercizio resta comunque soddisfacente anche nei confronti dei materiali concor-renti: infatti, l’import di ceramica per l’e-dilizia, pervenuto a 2,8 miliardi di dollari, è rimasto inferiore a quello dei lapidei, es-sendosi ragguagliato ad un pur lusinghiero 16 per cento.Gli approvvigionamenti di grezzi sono di-ventati assolutamente minimi, con una quota complessiva che nel 2013 è scesa sotto la soglia psicologica dell’uno per cento, mettendo in luce, anche da que-sto punto di vista, la scarsa propensione nord-americana ad investire nelle fasi di segheria e di grande trasformazione, con preferenza sempre più spiccata per gli approvvigionamenti del materiale finito. Naturalmente, ciò non significa che le at-tività di laboratorio, in specie nelle piccole e medie commesse, sia stata penalizzata: anzi, ha potuto fruire della ripresa, sia pure graduale, non meno di quanto sia accaduto nell’ambito dei lavori più importanti.Oltre quattro quinti degli acquisti di manu-fatti in marmi e pietre effettuati dagli Sta-ti Uniti nel corso del 2013 provengono da cinque soli Paesi: nell’ordine, Brasile, Cina, Italia, Turchia e India, avendo lasciato al resto del mondo il 15 per cento del totale (tav. 80), con quote ponderali relativamente stazionarie nel corso degli ultimi anni, fatta
eccezione per il notevole progresso brasi-liano, giunto ad esprimere il 28 per cento del valore complessivo (tav. 81).Nell’ambito delle forniture minori, è da por-re in evidenza il progressivo calo di quelle provenienti dai Paesi contigui, vale a dire da Canada e Messico: nonostante l’ovvia competitività dei loro costi di trasporto, la preferenza degli acquirenti ha premiato le produzioni transoceaniche, da un lato per l’apprezzamento qualitativo, come nel caso dei manufatti italiani, e dall’altro per la convenienza di quotazioni obiettivamen-te contenute, in specie per quanto attiene alle forniture dei marmi e travertini turchi, dei graniti indiani e dei materiali cinesi in genere.Si deve aggiungere che il successo più che proporzionale del Brasile deve essere attribuito al gradimento statunitense per il prodotto siliceo lavorato, con particolare ri-guardo ai graniti di colore acceso che costi-tuiscono, al pari dell’ardesia, un’esclusiva ormai affermata sui mercati internazionali. E’ importante sottolineare come il trend de-gli acquisti statunitensi sia improntato ad una crescita costante di lungo periodo, con la sola eccezione, peraltro molto ampia, del biennio 2008-2009, in cui venne perduto il 44 per cento del totale, dando luogo ad una crisi non meno rilevante degli investimenti produttivi (a differenza di quelli promozio-nali); e nello stesso tempo, come il con-sumo domestico abbia fatto registrare un andamento sostanzialmente proporzionale, anche se condizionato da un ristagno delle produzioni interne più accentuato di quel-lo verificatosi nell’import durante gli anni della crisi.
Globalizzazione lapidea
La dinamica della domanda, assieme allo sviluppo tecnologico ed alla velocizzazio-ne dei trasporti, ha ridotto le dimensioni del mondo ed ha promosso marmi e pietre nell’ottica globale, con la conseguenza che un numero crescente di Paesi ha potuto affacciarsi sul mercato con prospettive potenziali di buon interesse, sia dal punto di vista produttivo, sia sul piano dei consu-mi. Oggi, sono poche le realtà statuali che, all’uno od all’altro titolo, non siano parte-cipi dell’espansione mondiale del settore.In Africa, a parte l’Egitto, ormai leader in-discusso del continente grazie al grande flusso delle spedizioni di marmo e traverti-no grezzo verso la Cina, mentre ristagna la tipica produzione silicea dalle prestigiose tradizioni classiche, è da sottolineare la congiuntura del Sudafrica, dove i volumi estrattivi del granito si sono ridotti alla luce di talune difficoltà interne, ma soprattutto di una rigorosa politica di qualità in chiave oligopolistica, che ha condizionato l’export fino a determinarne, nel 2013, una flessio-ne di circa il 50 per cento nei confronti del 2008, e di oltre venti punti in quelli dell’an-no precedente (tav. 83). Nel contempo, pur restando minoritaria, è notevolmente au-mentata, sia nel breve che nel medio pe-riodo, la spedizione sudafricana di prodotti finiti, sulla base di prezzi medi piuttosto competitivi.Gli altri Paesi africani, fatta eccezione per quelli mediterranei, dove l’interscambio con-serva volumi apprezzabili sia in partenza che in arrivo, sono tuttora lontani dall’esprimere un ruolo significativo, anche se in talune oc-

26 XXIV Rapporto Marmo e Pietre nel Mondo 2014 Carlo Montani 27
casioni danno luogo a flussi dell’export sili-ceo grezzo di qualche rilievo, come nel caso del Mozambico e dello Zimbabwe.Una situazione di bassa congiuntura carat-terizza anche i Paesi latino-americani, con l’ovvia eccezione determinante del Brasi-le, laddove la stessa Argentina, un tempo protagonista, è ridotta su posizioni sostan-zialmente marginali, in specie nell’export, e con una produzione contenuta, destinata in parte maggioritaria al mercato interno.Fra i Paesi di seconda e terza fascia che hanno dato un contributo ragguardevole allo sviluppo del settore, ed in primo luogo a quello dell’interscambio, si collocano an-cora una volta quelli asiatici. A prescindere dai maggiori protagonisti, di cui si è detto in precedenza, è utile fare riferimento agli apporti, spesso innovativi, ma consistenti soprattutto nell’export, di Giordania e Pa-lestina: nel primo caso, anche a livello di approvvigionamenti e di attività trasforma-trici, e nel secondo, per l’alta incidenza del lapideo sul prodotto interno lordo, tanto da collocarsi ai massimi livelli mondiali. Del pari, sempre in Asia, non mancano altri Paesi dell’interno che sono diventati pro-duttori significativi, come nel caso dell’Af-ghanistan, e talvolta, anche importanti esportatori, come in quello del Kazakhstan.La globalizzazione non ha coinvolto in misura completa i prezzi, nel senso che, soprattutto per quanto riguarda i prodotti finiti, le quotazioni di acquisto e di vendi-ta rimangono naturalmente differenziate a seconda dei gradi di competitività e di industrializzazione dei Paesi interessati: per quanto riguarda i maggiori contesti produttivi e distributivi, si deve porre in
luce come gli adeguamenti più vivaci di lungo e breve periodo abbiano avuto luogo, nell’ordine, in Cina, Brasile e Turchia, ma anche in Spagna, Italia e Germania, mentre risultano in flessione i prezzi del Portogallo e della stessa India (tav. 84): ciò significa che la maggiore o minore propensione alla redditività non si pone in rapporto diretto con lo sviluppo economico generale dei Pa-esi interessati, ma coinvolge altre variabili importanti, a cominciare dagli investimenti produttivi e promozionali.
Andamento dei consumi
Gli impieghi del marmo e della pietra hanno fatto registrare incrementi diffusi, che nel lungo periodo sono praticamente genera-lizzati: a livello ventennale, nei maggiori Paesi protagonisti la crescita è stata co-spicua e talvolta impetuosa, come nel caso della Cina, che è leader anche in questo campo, e che nel ragguaglio al peso ha vi-sto decuplicare il volume del 1994, con un consuntivo del 2013 giunto a due milioni di tonnellate nette (tav. 85). Sono da rilevare, altresì, gli ottimi incrementi di India, Corea del Sud, Brasile e Turchia, e quindi, di tutti gli altri Paesi, con le sole eccezioni, sem-pre relative al periodo lungo, di Germania, Italia, Spagna, e soprattutto del Giappone. In termini di superficie netta, il consumo mondiale del 2013 si è riferito a 1,42 mi-liardi di metri quadrati equivalenti, riferiti allo spessore convenzionale di cm. 2, con quote maggioritarie in Cina e India, rispetti-vamente per 410 e per 105 milioni di metri quadrati, pari - da sole - al 36 per cento del
quantitativo mondiale (tav. 86). In terza e quarta posizione seguono Stati Uniti e Bra-sile, mentre il primo Paese europeo resta l’I-talia, che figura al sesto posto, superata in questa classifica anche dalla Corea del Sud.Il consumo lapideo mondiale è raddoppiato nei confronti del 2005, con indici di varia-zione largamente superiori alla media mon-diale soltanto per Cina, Brasile, India, Ara-bia Saudita e Regno Unito, mentre in tutti gli altri Paesi la crescita è stata inferiore rispetto alla predetta media, pur eviden-ziando discrete progressioni in Belgio, Stati Uniti, Francia, Taiwan e Svizzera (tav. 87).Resta da dire del consumo pro-capite, dove nel 2013 i Paesi capaci di superare l’im-portante obiettivo di un metro quadrato per abitante sono stati cinque: nell’ordine, Belgio, Arabia Saudita, Svizzera, Taiwan e Corea del Sud (tav. 88): ciò con un buon recupero nei confronti dell’ultimo biennio ma con qualche ritardo di medio termine, che ha penalizzato con maggiore evidenza Paesi quali Italia, Spagna, Portogallo e Gre-cia, non a caso caratterizzati da una con-giuntura critica anche per quanto riguarda l’andamento del reddito nazionale e di altre variabili fondamentali.L’annotazione più importante a proposito del consumo pro-capite riguarda, in ogni caso, l’ulteriore aumento della cifra mondiale, che nel 2013 è giunta a 226 metri quadrati per mille abitanti, contro i 215 dell’anno prece-dente ed i 117 del 2001; in effetti, questo parametro mette in luce come quello del consumo sia stato un trend di costante cre-scita mondiale, fatta eccezione per la mo-mentanea stazionarietà del 2009. I maggiori produttori lapidei, quali Cina, In-
dia e Brasile, figurano tuttora nelle retrovie della graduatoria pro-capite, cosa che sot-tintende la presenza di ampie e per taluni aspetti insospettate potenzialità di svilup-po, anche alla stregua degli importanti in-vestimenti produttivi e promozionali sempre all’ordine del giorno nei Paesi in questione. Del resto, condizioni analoghe sussistono anche in diversi Paesi della vecchia Europa, pur caratterizzati dalla presenza di maggio-ri tradizioni d’impiego, sia nell’edilizia che negli altri consumi, come nel caso di Regno Unito, Germania ed Olanda, dove il raggua-glio in questione si pone appena sopra la media mondiale, e non lontano da quelli acquisiti con forte progressione dalla Cina e dal Brasile. Quanto al Giappone, sceso quasi in coda alla graduatoria dei maggiori Paesi, pur potendo contare su importanti utilizzi alternativi come quello nell’arte fu-neraria, superiore alla media mondiale, si può dire che il regresso sia stato indotto dalla saturazione del mercato e dal sostan-ziale ristagno dell’attività edilizia.
Macchine e impianti produttivi
Nell’aggregato facente capo al settore lapi-deo, l’indotto di maggiore rilevanza econo-mica e strategica è quello della tecnologia impiantistica, il cui costante avanzamento costituisce il presupposto fondamentale per accrescere la produttività, contenere i costi, migliorare la qualità ed ottimizzare sicurezza e condizioni di lavoro. In questo campo, l’apporto della ricerca italiana e della sua specializzazione industriale conti-nua ad esercitare un ruolo trainante.

28 XXIV Rapporto Marmo e Pietre nel Mondo 2014 Carlo Montani 29
Nell’Europa dei Quindici, il primato dell’I-talia non è mai stato in discussione, anche se la crisi del 2009 ha lasciato qualche traccia, dando luogo ai successivi assesta-menti, culminati nella grande ripresa del 2011, e poi nel ritorno a medie produttivi conformi all’andamento storico: nel 2013, il volume esportato dall’Italia è stato pari ad oltre 660 mila quintali, che sale di due pun-ti rispetto all’anno precedente e costituisce il quinto miglior risultato degli ultimi 16 anni (tav. 89). L’import del gruppo invece, assomma ad un terzo dell’export e risulta notevolmente spalmato fra i vari Paesi, con livelli più elevati in Regno Unito, Germania e Francia (tav. 90).Gli indici di lungo periodo evidenziano le maggiori crescite percentuali dell’export europeo in Portogallo e Grecia, mentre l’im-port mantiene sostanzialmente le posizioni, con qualche maggiore progresso nei Paesi dell’Europa settentrionale (tav. 91).Estendendo l’analisi di breve termine all’Europa dei Ventisette è facile consta-tare, ferma restando la leadership italiana nell’export, che le spedizioni di gran lunga prevalenti di macchinari ed impianti sono state quelle extra-comunitarie (tav. 92), con una fenomenologia che, sia pure in scala ridotta sul piano quantitativo globale, si ri-pete nell’import (tav. 93).Il primato italiano in sede europea trova conferma, secondo logica, anche in sede di valore esportato, con un volume d’affari che nel 2013 è pervenuto al nuovo massi-mo, pari ad oltre 700 milioni di euro: una cifra che raddoppia quella del 1998, con un risultato che si itera nel valore medio per unità di prodotto, collocatosi per la prima
volta ben oltre i dieci euro/kg. (tav. 94), ed esprime una crescita del 60 per cento nel periodo lungo, concentrata soprattutto nell’ultimo biennio, a conferma del buon momento congiunturale.Sul fronte extra-europeo, sono da segnala-re il secondo regresso consecutivo dell’im-port cinese, speculare al rallentamento dell’export lapideo, con una penalizzazione mediamente più forte a carico delle vendite giapponesi (tav. 95); la buona ripresa de-gli acquisti statunitensi, meno concentrati e soprattutto meno consistenti rispetto a quelli dei grandi produttori lapidei (tav. 96); la nuova contrazione degli investimenti indiani in macchine di provenienza estera (tav. 97); ed il nuovo massimo dell’impor-tazione di macchine in Turchia, tanto più apprezzabile perché nella fattispecie si tratta di un Paese più che notevole anche nel campo delle produzioni tecnologiche (tav. 98).L’Italia ha ribadito la sua tradizionale pre-minenza anche a livello mondiale, dove guida la graduatoria esportatrice con largo vantaggio su Cina, Giappone e Germania, i soli Paesi ad avere effettuato spedizioni per oltre cento milioni di dollari (tav. 99), e dove ha ulteriormente accresciuto la propria quota di mercato, al pari di quanto è accaduto anche in ambito europeo (tav. 100), in analogia a quanto già detto per le quantità. Si deve aggiungere che in diversi Paesi leader la quota della tecnologia ita-liana sul totale delle rispettive importazioni si esprime a livello di maggioranza assolu-ta, come è accaduto in Brasile, Turchia ed Arabia Saudita (tav. 101), ma anche in Bul-garia, Grecia e Slovenia (tav. 102), a confer-
ma di un apprezzamento ormai consolidato.
Beni strumentali
L’ampliamento produttivo mondiale ed il po-tenziamento delle strutture industriali han-no indotto crescite altrettanto significative nei beni di consumo, ed in modo particolare negli abrasivi e negli utensili diamantati, la cui dinamica obbedisce, in prevalenza, alla logica degli approvvigionamenti domestici, senza trascurare le opportunità rese possi-bili dall’interscambio, compatibilmente coi necessari requisiti di produttività, durata e sicurezza.Non a caso, nell’ambito europeo il volume delle esportazioni è sensibilmente cresciu-to anche nel 2013, sia per quanto riguarda le destinazioni comunitarie, sia per ciò che attiene al resto del mondo (tav. 103), con apporti prioritari della Germania e dell’ Ita-lia. Considerazioni analoghe valgono per l’import, sebbene in questo campo la sola crescita del 2013 sia stata limitata alle pro-venienze dai Paesi extra-europei, e comun-que in misura tale da elidere il decremento, peraltro marginale, degli approvvigiona-menti in ambito comunitario (tav. 104).L’esame di medio periodo, relativo all’ul-timo quadriennio, mette in evidenza un costante incremento dell’export europeo complessivo, portatosi a circa 1570 milio-ni di euro, e concentrato per due terzi del totale in Germania, Italia ed Austria (tav. 105). Sul fronte opposto, le importazioni hanno fatto registrare differenze frizionali, con un volume d’affari per il 2013 pari a cir-ca 1060 milioni di euro, che ha eguagliato
quello dell’anno precedente (tav. 106), con posizioni prioritarie, ancora una volta, per gli acquisti di Germania ed Italia, ma con estensioni a tutti gli altri Paesi, conformi alle potenzialità delle rispettive attività trasformatrici del marmo e della pietra.Non mancano casi in cui l’interscambio è assai limitato, se non anche nullo, ma ciò non significa che le loro attività di labora-torio siano state azzerate, come potrebbe sembrare esaminando i consuntivi di Cipro, di Malta o dei Paesi baltici. Vuol dire, inve-ce, che anche nelle realtà minori non man-cano le possibilità di acquisti domestici in misura conforme a fabbisogni del resto contenuti.L’analisi disaggregata delle importazioni di beni strumentali dimostra che in questo campo, diversamente da quanto è accaduto per il prodotto lapideo, l’offensiva dei Pae-si terzi, ed in particolare di quelli asiatici, non ha conseguito risultati di particolare evidenza, sia perché la logica del mercato puntiforme, tipica dei materiali di con-sumo, elide i trasporti a lungo raggio, sia perché la necessità di assicurare la qualità del prodotto si traduce in acquisti selettivi dando la preferenza a merci capaci di offri-re garanzie tradizionalmente competitive, e più facilmente controllabili, anche per quanto riguarda l’opportunità di risolvere in modo agile e funzionale ogni possibile contestazione.Resta il fatto che nell’utilizzo degli abrasivi e degli utensili diamantati, al pari di quan-to accade per altri materiali complementari come lame, mastici e leganti, il comporta-mento dell’acquirente è determinato dalla diversa attenzione per le politiche di qua-

30 XXIV Rapporto Marmo e Pietre nel Mondo 2014 Carlo Montani 31
lità, e quindi per la riduzione, o meglio per l’azzeramento delle tolleranze, cosa che promuove un ricorso tendenzialmente mag-giore all’interscambio dei beni strumentali quando le priorità qualitative prevalgano, in una logica di servizio a favore della clientela, su quelle più strettamente eco-nomiche. In questo senso, è naturale che il commercio estero dei materiali di consumo abbia maggiori possibilità di espansione, come è accaduto anche nel 2013, nei Pa-esi europei caratterizzati da una maggiore attenzione per il problema della cosiddetta qualità totale.
Immagine promozione e sviluppo
I fattori di successo che sono in grado di valorizzare al meglio le tendenze positive della congiuntura, o di elidere gli effetti di quelle negative, hanno un ruolo importante anche nel comparto lapideo, la cui domanda, naturalmente non rigida, è più sensibile di altre ad elementi motivazionali, non escluse talune interferenze psicologiche. Alcuni di questi fattori, come la qualità del prodotto ed il suo rapporto con il prezzo ricorrono in tutti i settori, e quello di marmi e pietre non fa eccezione, come hanno posto in evidenza indagini ancora recenti di fonte latino-ame-ricana, sottolineandone il rilievo totalmente condiviso, al pari della ricerca di nuovi ma-teriali, in grado di soddisfare un ampio ven-taglio di esigenze estetiche, nonché di nuovi mercati, onde prevenire il rischio sempre latente di saturazione (tav. 107). Importanza non altrettanto totalitaria sem-bra essere riservata, invece, alla diversifi-
cazione, e soprattutto all’immagine: ecco una strozzatura che la teoria più avanzata di marketing non può accettare, ma che contribuisce a spiegare taluni ritardi promo-zionali, tuttora presenti nel sistema lapideo mondiale. Ciò, con correlazioni praticamen-te automatiche nella cooperazione, e so-prattutto negli investimenti, dove una logica preferenza compete a quelli per l’implemen-to della produttività, tramite innovazioni e tecnologia, mentre una giusta promozione sarebbe ritenuta indispensabile da non oltre un terzo degli operatori (tav. 108). E’ logico presumere che la soluzione di questi problemi in chiave più moderna e sistematica sarebbe in grado di conferire maggiore slancio allo sviluppo del settore lapideo, comunque suffragato dall’estra-polazione delle serie storiche e dalle pre-visioni di crescita della domanda mondiale, tali da ipotizzare il superamento dei cento milioni netti di tonnellate nella prospettiva del 2020, con un consumo non lontano dai due miliardi di metri quadrati equivalenti (tav. 109). Ciò, nell’ambito di un recupero della quota di mercato del lapideo, lento ma ormai continuo, anche nei confronti dei maggiori materiali concorrenti, quali cera-mica e grès porcellanato (tav. 110).La presunzione in parola è ulteriormente suffragata dalle previsioni di espansione demografica nel medio e lungo termine, se-condo cui la popolazione mondiale dovreb-be ragguagliarsi a 8,2 miliardi di persone nel 2025, ed a nove miliardi e mezzo nel 2050, con un’ampia maggioranza assoluta in Asia (tav. 111). In effetti, tali aumenti do-vranno indurre un incremento proporzionale dell’edilizia, anche di qualità, in specie per
quanto riguarda le finiture: di qui, un preci-so input per il comparto lapideo, anche nel segno della promozione, non soltanto sui mercati tradizionali, ma pure sui nuovi, tra i quali dovrebbero emergere, sebbene nel lungo periodo, quelli africani.In termini attuali, è interessante constatare come la quota della popolazione asiatica sia uguale a quella del mercato lapideo dell’interscambio, e soprattutto del con-sumo, anche se nel ragguaglio pro-capite, come si è detto in precedenza, permangono vistose sproporzioni. Sono buoni motivi in più per evitare la concentrazione promozio-nale in pochi contesti sviluppati, in specie dell’Occidente, pur dovendosi considerare la necessità di un’adeguata tutela dei livel-li d’impiego ivi conseguiti.La volontà politica e le scelte imprenditoria-li non potranno prescindere da queste valu-tazioni, con la necessaria cooperazione del momento creditizio, indispensabile a sup-portare al meglio ogni tipo di investimenti, e con quella delle forze sindacali, altrettan-to utile nel perseguimento degli obiettivi di crescita, di ovvia utilità generale.
Volume d’affari
L’ultimo parametro fondamentale a cui si debbono dedicare specifiche attenzioni nel consuntivo del settore, è quello del fattura-to, il cui ruolo propulsivo di ulteriori inve-stimenti per lo sviluppo è di tutta evidenza. Al riguardo, le sole informazioni disponibili sono relative all’interscambio, che tuttavia è in grado di valutare il giro d’affari sui mercati domestici, alla luce delle stime di
consumo interno nei vari Paesi.Nel 2013, il fatturato estero del settore si è ragguagliato ad oltre 22 miliardi di dol-lari, con un incremento del 14,9 per cento rispetto all’anno precedente (tav. 112), ed un differenziale attivo di circa dieci punti nei confronti di quello già rilevato per il vo-lume quantitativo: risultato indubbiamente lusinghiero, che conferma lo slancio acqui-sito dal comparto dopo la crisi del 2009. Un apporto determinante è venuto anche in questo campo dai sette Paesi leader, con incidenze maggioritarie, nell’ordine, per Cina, Italia, Turchia, India, Brasile, Spagna e Portogallo: quindi, con alcune signifi-cative variazioni rispetto alla graduatoria quantitativa, indotte dal diverso livello dei prezzi medi, e prima ancora, dal diverso “mix” merceologico che favorisce i Paesi esportatori di lavorato, penalizzando quelli più propensi alle spedizioni del grezzo. In particolare, è d’uopo mettere in evidenza il secondo posto conservato dagli esportatori italiani, sebbene con vantaggi ormai circo-scritti sui valori turchi e indiani.A far tempo dal 2001, l’aumento comples-sivo del fatturato mondiale è stato di oltre quattro volte rispetto al livello iniziale, con progressioni più elevate in Cina, Brasile, In-dia, e soprattutto in Turchia, dove il valore corrispondente è addirittura decuplicato, mentre nei Paesi europei la crescita è stata assai più contenuta (tav. 113). Ne consegue che le quote di mercato si sono andate am-pliando per i quattro Paesi extra-europei leader, con un incremento massimo in Cina, salita dal 17,4 per cento del 2001 al 27,9 per cento del 2013, mentre risultano parti-colarmente accentuate le flessioni di Italia

32 XXIV Rapporto Marmo e Pietre nel Mondo 2014 Carlo Montani 33
e Spagna, dove le quote di competenza si sono ridotte di due terzi (tav. 114).In base alle cifre esposte ed alla presumibi-le quota dei consumi nazionali di materiali domestici, è fondato ritenere che il volume d’affari complessivo del settore debba col-locarsi nell’ordine dei 40 miliardi di dollari: ciò, tenuto conto, fra l’altro, della naturale maggiorazione di prezzo per i materiali og-getto di interscambio, gravati da maggiori incidenze di trasporto e di intermediazioni, e caratterizzati da livelli qualitativi mas-simi. Il contributo di questo fatturato alla crescita di marmi e pietre nel mondo, anche per quanto riguarda i Paesi terzi, giunti ad esprimere circa il 30 per cento del totale, ne sottolinea l’ importante ruolo propulsivo dello sviluppo, anzitutto nel campo socio-economico.Il ruolo dell’indotto, a cominciare da quello di macchine ed impianti, è molto significa-tivo anche per quanto riguarda il fatturato: le informazioni disponibili nell’ambito mon-diale, già evidenziate a proposito dell’inter-scambio specifico, consentono di valutarlo prudenzialmente, per il 2013, in almeno tre miliardi di dollari, un terzo dei quali da attribuire all’export italiano di tecnolo-gie meccaniche. Si tratta di un valore non meno significativo, sia in cifra assoluta, sia nel ragguaglio al fatturato, che in relazione alle cifre esposte si ragguaglia al 7,5 per cento: ne emerge una quota d’investimen-to importante, ma non del tutto sufficien-te, soprattutto nelle economie mature, a coprire gli ammortamenti d’esercizio ed a compiere scelte conformi alle crescen-ti esigenze proposte dal rapido progresso tecnologico.
Conclusione
Il volume di marmi e pietre posti in opera nel mondo contemporaneo durante l’ultimo sessantennio è superiore a quello di tutti gli utilizzi precedenti, che si erano succedu-ti per circa 10 mila anni, da quando venne fondata Gerico, la prima città del cui im-piego lapideo si conservi memoria storica. L’assunto, proposto dal Dipartimento di Scienze della Terra dell’Università di Sie-na, sintetizza in maniera icastica l’ampiez-za dello sviluppo più recente, dovuto alla rinnovata fiducia nel prodotto naturale da parte della progettazione più avanzata, ma nello stesso tempo, ad un progresso tec-nico senza precedenti, e tuttavia idoneo a valorizzare al meglio le doti di creatività e di fantasia, tipiche del lavoro settoriale.E’ un punto di partenza importante, da cui muovere nelle strategie di ulteriore espan-sione a cura prioritaria della volontà politi-ca, e contestualmente, ad iniziativa di un vivace momento imprenditoriale, sempre pronto ad affrontare il rischio tipico dell’in-dustria lapidea, soprattutto nelle cave, ma tuttora lontano da rapporti internazionali di effettiva coesione cooperatrice. In effetti, sia a livello mondiale, sia nel contesto eu-ropeo, l’attività associativa appare impron-tata alle buone intenzioni, cui non hanno fatto seguito, solitamente, adeguate inizia-tive di investimento e di promozione.A mezzo secolo dall’avvento del diamante nelle lavorazioni della pietra, e trascorso un ventennio dalla diffusione generalizza-ta del controllo numerico computerizzato, i tempi sono maturi per conferire al settore una nuova dimensione industriale, in grado
di perseguire lo sviluppo a tutto campo, con una ripresa dei grandi lavori capace di coe-sistere con la componente artigiana, custo-de di valori espressivi ed estetici sempre attuali. Occorre una consapevolezza comu-ne degli obiettivi e dei mezzi, non soltanto finanziari, indispensabili a raggiungerli; e prima ancora, serve un reale convincimen-to del carattere irreversibile acquisito dalla globalizzazione.I nuovi grandi protagonisti lapidei, che appartengono non casualmente al mondo extra-europeo, sono pervenuti, non senza adeguamenti impegnativi, a comprendere il ruolo strategico di marmi e pietre, avvian-do e potenziando rapporti di collaborazione proficua, seppure al solo livello operativo. Altrove, non mancano esempi analoghi, ma resta evidente la necessità di superarne il carattere episodico e di rastremare il pur comprensibile tentativo di conservazione, più frequente nei Paesi di maggiori tradizio-ni settoriali, destinato ad annullarsi nella logica del mercato mondiale.
La civiltà della pietra, dopo avere contras-segnato i momenti essenziali di una lunga crescita tecnica, economica ed umana, ha tutte le carte in regola per presiedere ad ulteriori successi, ed in primo luogo, quella di una forte compatibilità ecologica, ben lontana dai conati punitivi di cave, seghe-rie e laboratori che si susseguono in taluni contesti, in specie dell’Occidente, incapaci di comprendere come ogni insediamento, sin dall’epoca delle palafitte, abbia coinci-so con una modifica estetica dell’ambiente. In questo senso, urgono strumenti di pro-grammazione in grado di effettuare scelte consapevoli, conformi agli interessi nazio-nali o regionali prevalenti, ma tenendo con-to, salvo eccezioni motivate, della priorità che spetta a quelli socio-economici.L’effetto moltiplicatore è dietro l’angolo an-che per marmi e pietre, ma sarà tanto più costruttivo e durevole nella misura in cui venga sostenuto da una reale ed efficace cooperazione.

34 XXIV Rapporto Marmo e Pietre nel Mondo 2014 Carlo Montani 35
Gli strumenti statistici posti a base del Rap-porto, al pari di quelli utilizzati nelle edizioni precedenti, rivengono da una complessa ricerca ad ampio spettro, basata integralmente su fon-ti ufficiali per quanto riguarda l’interscambio, mentre le produzioni ed i consumi sono valutati alla luce di stime ragionate (in alcuni casi con la fattiva collaborazione di Soggetti locali). Ciò, nell’ambito di criteri omogenei di rilevazione, elaborazione ed interpretazione, in modo da ga-rantire il carattere comparabile dei dati e delle rispettive aggregazioni.Le fonti da cui sono desunti, con ogni possibile aggiornamento, i dati propedeutici di caratte-re macro-economico, sono quelle degli Organi internazionali competenti, mentre le informa-zioni sulla congiuntura dell’attività edilizia nei maggiori Paesi industriali sono di analoga pro-venienza, con qualche verifica italiana di matri-ce ANCE (Associazione Nazionale Costruttori Edili).Per quanto si riferisce alla produzione estrattiva, le cifre dell’Europa rivengono dall’elaborazione di precedenti stime ufficiose di fonte Eurostat, calibrate in funzione dell’interscambio di mate-riali e di tecnologie, mentre quelle di altri Paesi leader, fermo restando il modulo illustrato, sono state utilmente confrontate con valutazioni di provenienza USGS (Servizio Geologico degli Stati Uniti): in diversi casi, le sole disponibili, in specie per taluni Stati del terzo mondo. I dati produttivi del Brasile, oggetto di appro-fondimento specifico nel “Dossier” allegato al Rapporto (alla luce di una propensione allo svi-luppo lapideo che si colloca al massimo livello occidentale) sono omogenei a quelli dei Rap-porti precedenti, previa indicazione collaterale delle maggiori quantità estratte, relative a ma-teriali per uso strutturale, di cui alle rilevazioni dell’Associazione brasiliana di settore (Abiro-
chas). La natura monografica del documento assume carattere esaustivo con una serie di rilevazioni esclusive circa l’interscambio di tec-nologie e di beni strumentali, una comparazione in linea di benchmark tra prezzi medi dei manu-fatti lapidei esportati, e l’analisi congiunturale di alcuni prodotti concorrenti (ceramica e pietre artificiali). Il volume globale dei lavorati è stato valuta-to sulla base di rilevazioni conformi a quelle storiche, con coefficienti invariati relativi alle perdite di lavorazione, pur essendo ragione-vole presumere un progressivo aumento della produttività media collegato alle recenti otti-mizzazioni tecnologiche: stante l’impossibilità di effettuarne un’elaborazione probante, si è confermata l’opzione per la formula più idonea dal punto di vista della comparabilità, iterando la tradizionale quota di perdita nella misura di due quinti del carico di segheria, al netto del rispettivo interscambio grezzo. Le cifre in quantità e valori riferite al traffico in-ternazionale del settore provengono, per quanto di competenza e salvo eccezioni, dall’Organiz-zazione statistica dell’ONU (Comtrade), e per l’Europa dei Ventisette, da Eurostat: in qualche caso, come quelli riguardanti alcuni Paesi asia-tici, con gli aggiustamenti resi necessari dalla diversa articolazione del calendario (al riguardo, si deve comunque aggiungere che i consuntivi dell’India, già dal 2012, sono stati utilmente pe-requati a quello occidentale). Come negli anni precedenti, stanti l’importanza determinante della Cina nel panorama lapideo mondiale, ed il livello decisivo delle sue quote di produzione, interscambio e consumo, i con-suntivi dell’export ed import di questo Paese sono stati verificati, tramite la collaborazione dell’ufficio ICE di Pechino, con i dati doganali di fonte locale. Anche per questo, in qualche caso
di significativa differenza negli incroci dell’in-terscambio, il dato cinese è stato oggetto di motivata preferenza.Si deve porre in evidenza che, proprio nel caso della Cina, sono emerse discrasie significative con i dati oggetto d’incrocio: ciò, con particola-re riguardo all’import di grezzi calcarei e silicei, dove il consuntivo doganale cinese è risultato no-tevolmente inferiore, nella misura media di circa un quarto, cosa che ha comportato la necessità di un proporzionale incremento perequativo. Do-vendosi escludere che il fenomeno sia attribui-bile ad errori di classificazione, non è azzardato presumerne l’origine in fattori contabili connessi al modulo di pagamento delle forniture.Il riferimento ai valori deve ritenersi comple-mentare, in specie nel giudizio di lungo periodo, mentre il dato quantitativo permette confronti omogenei e conseguenti valutazioni strategiche non influenzate dai problemi di cambio e dagli oneri extra-gestionali.Sulla base di una prassi consolidata, sono sta-ti espunti dai flussi di movimentazione, e dalle stesse stime produttive, volumi talvolta cospi-cui di materiali correnti, che in alcune situazioni raggiungono livelli di grande ampiezza ma di scarso valore unitario: ancora una volta, i casi più significativi in partenza riguardano Cina, Croazia, Danimarca, Indonesia, Malaysia, Nor-vegia, Pakistan, e per quanto concerne i consu-mi, Paesi Bassi, Regno Unito e Singapore, oltre a diverse realtà africane ed asiatiche. Del pari, nelle rilevazioni riguardanti l’Italia, diversamen-te dalla prassi seguita in altre fonti si è ritenuto di prescindere dalle cifre riguardanti i sotto-prodotti (granulati e polveri), che soprattutto nell’export sono di forte rilevanza quantitativa ma di apporto valutario marginale.I consuntivi aggregati dell’Unione Europea non comprendono la Croazia, in quanto il suo ingres-so in ambito comunitario ha avuto luogo col 1° luglio 2013.
Il modello standard nella rilevazione degli scam-bi lapidei, tanto più importante perché interessa la maggioranza del fatturato mondiale, resta il sistema input-output. Vi permangono notevoli problemi di elaborazione, interpretazione e pe-requazione dei dati, relativi ai tradizionali codici a quattro cifre (calcarei grezzi, silicei grezzi, la-vorati semplici, manufatti con valore aggiunto, ardesia lavorata): fatto salvo quanto riferito circa l’import grezzo cinese, nei casi non in-frequenti di escursioni apprezzabili si è optato, sempre in linea di omogeneità con le rilevazioni precedenti, per considerare prevalente il dato di maggiore affidabilità.Nelle classificazioni originarie del prodotto fini-to, ed in qualche caso anche del grezzo, come in quelli rispettivi di India e Sudafrica, esistono riferimenti a carattere disomogeneo suffragati dai valori medi: cosa che ha consentito di ap-portare i necessari correttivi, ferma restando la cifra complessiva dei volumi scambiati dal Paese in riferimento. Il fenomeno ha richiesto qualche aggiustamento anche nei casi, peraltro marginali, di escursioni abnormi da un esercizio all’altro.Differenze non del tutto trascurabili possono sussistere nei consuntivi in valore che si rife-riscono a flussi dell’interscambio tra un Paese esportatore ed un altro Paese importatore: al riguardo, casi di qualche consistenza sono tuttora rilevabili nell’import cinese di grezzi, a fronte del relativo export calcareo dalla Turchia e dall’Egitto, o di quello siliceo da India e Bra-sile, fermo restando il rispetto delle tendenze evolutive di base, nell’ambito di un trend in espansione. Le motivazioni di queste escursioni possono essere riferibili al diverso valore doga-nale di carico od all’attribuzione imprecisa del codice doganale di riferimento. Confermando la maggiore congruità comparativa dei dati in volume, nel caso di escursioni in valore tra dati corrispondenti di Paesi leader, cui si fa cenno
Appendice critica

36 XXIV Rapporto Marmo e Pietre nel Mondo 2014
nei testi e nei documenti statistici, si è preferito mantenere invariata l’informazione originaria, dando atto della differenza.Le schede dei maggiori Paesi settoriali, propo-ste a conclusione del Rapporto con la sintesi storica delle variabili essenziali di produzione, interscambio e consumo, sono conformi al mo-dulo in uso nei volumi pregressi. Al riguardo, l’astrazione più significativa riguarda, sin dal primo Rapporto del 1990, gli scarti di segheria e di laboratorio. In mancanza di riferimenti certi, detti scarti sono stati assunti in una quota percentuale unitaria, ri-veniente da esperienze storiche, dando luogo ad una sovrastima del prodotto a favore dei Paesi meno sviluppati dove la quota di cascami è vero-similmente più alta; ovvero, a qualche sottostima nel caso di quelli caratterizzati da livelli compe-titivi di produttività o dalla maggiore presenza di lavorati semplici, dove lo scarto è verosimilmen-te inferiore. Comunque sia, si tratta di escursioni contenute che non inficiano il giudizio di sintesi quale emerge dalle schede.L’utilizzazione del sistema input-output per le tecnologie, ed in particolare per macchine, im-pianti e beni strumentali, non risulta praticabile, tanto più che per molti Paesi le unità di misura quantitativa non hanno carattere omogeneo, in quanto sono riferite al numero di pezzi anziché al peso. In ogni caso, il numero dei Paesi mo-nitorati, compreso il controllo di quelli minori, è stato oggetto di un utile potenziamento com-parativo, in modo da ampliare anche per queste tipologie il ventaglio delle rilevazioni. Stante la sicura permanenza di una significativa leader-ship italiana in campo marmo-meccanico sono state introdotte nuove informazioni statistiche circa le sue quote di mercato nei Paesi setto-rialmente avanzati.
L’apporto dei Paesi di terza fascia aventi rile-vanza significativa ma complementare, è ripor-tato globalmente nella tradizionale definizione aggregata di “others”: ciò, iterando le maggio-razioni convenzionali applicate al subtotale dei Paesi rilevati singolarmente nei modelli input-output. Tali maggiorazioni, che in precedenza erano state ragguagliate, salvo eccezioni, al tre per cento del subtotale medesimo, sono state rivedute alla luce della crescente movimenta-zione fra Paesi terzi: mediamente, i nuovi tassi sono stati elevati al cinque per cento, fatta ec-cezione per l’ardesia, dove il modulo applicato nei precedenti Rapporti è rimasto invariato. I Paesi monitorati nel rispettivo interscambio quantitativo del 2013 sono pari a 108, supe-rando il precedente massimo già acquisito nel Rapporto per il 2012, con qualche importante in-tegrazione nell’ambito del terzo mondo, tra cui è congruo ricordare quelle di Giordania, Palesti-na e Togo, ferma restando la presenza di tutti i maggiori protagonisti, oggetto di rilevazione esaustiva sia nel breve che nel lungo periodo.Per quanto si riferisce ai dati macro-economici, si deve infine precisare che i consuntivi concer-nenti il prodotto interno lordo sono stati tratti dalle informazioni disponibili all’atto di predi-sposizione del testo (maggio 2014): pertanto, le cifre esposte sono suscettibili di qualche sco-stamento, peraltro marginale, rispetto ai cor-rettivi ufficiali apportati in tempi posteriori dai rispettivi Governi o dalle Istituzioni economiche competenti. Quanto ai problemi organizzativi e giuridici del lavoro, con riguardo prioritario a quello minorile nelle cave, ed alle prospettive di collaborazione internazionale di settore, anche a livello associativo, stante la carenza di fatti innovativi rilevanti, si rinvia alle considerazioni
dei Rapporti precedenti.
XXV Rapportomarmo e pietre nel mondo
2014marble and stones in the world
XXV Report
Preface
Ettore RielloPresident of Veronafiere
Natural stone has very strong bonds with the history of Mankind. It responds to many needs, such as building durable shelters and the expression of ideas, whereby marble became the material of choice for immortal masterpieces of sculpture or modern architecture. Stone embodies a dual soul: as a commodity for buildings and luxury goods for art, design and the contract world.The solidity of a cornerstone, the extreme lightness of flexible marble panels merely a few millimetres thick and even frames for eyewear: Man has always exploited the potential of this material, thanks to ingenuity and creativity. It is no coincidence that the stone industry is one of the strengths of Made in Italy.Italy, land of poets, saints, navigators and ... one might add, marble craftsmen. The Italian natural stone sector, in fact, is still today one of excellence in country’s industry, with 3,340 companies and 33,700 employees generating turnover close to 4 billion euros (materials and technologies), standing fifth
in the world ranking of manufacturers.At a time of generalised economic recession, the marble industry has managed to withstand resist better than others and the signs are hopeful for a return to pre-crisis levels in the near future. This merit for this lies above all in the capacity of the Italian stone industry to work abroad thanks to the added value of processing know-how, design and ceaseless, incomparable technological innovation. Facts and figures back this up: in 2013, Italian exports represented more than 70% of production, with a trade balance in the black by more than 2.4 billion euros. This is why the marble industry in Italy must be at the heart of sector-system policies and synergies to continue being successful on international markets. Teamwork is vital but also the use of the most effective tools to link up with overseas demand and an ability to direct choices within the global scenario. Tools such as Marmomacc, the most important international trade fair in the sector celebrating its 49th edition this

Introduction
The World Stone Report arrives at the 25th yearly Edition, highlighting additional growths in the sector as to production, distribution and consumption: in this period the fundamental figures are quintupled, allowing to overcome the lower stagnation of 1998 and the crisis of 2009, and confirming the state of health of marble and stone, well beyond the critical situation that persists in many countries. We must emphasize these results strongly where we think about the stone demand character as relatively elastic, and the fact that two thirds of the applications relate to building industry, whose conditions are not optimal, particularly in the Western economies.The sector, in short, has very important cultural and role traditions, that combine with an increasingly remarkable socio-economic survey, which, over the years, has become strategic, in accordance with the unique development capabilities in light since 1964, when it was founded the Federation of European Marble Industry, and
defined in programmatic sense ten years after, when the United Nations Organization, moving from stone to start local and regional development policies, was pleased to stress the political moment to act accordingly.This means that the perspectives for further expansion, coming from historical series extrapolations and corroborated by a very positive market, will be much more valuable to the extent that they are supported at the institutional level, as has already happened in different countries. In this sense, the role of the relationship transcends the dimension purely statistical, because it allows establishment of the political choices and the corporate ones, in a basic cognitive perspective, based on exhaustive marketing research.This input became important after five years from the 2009 crisis, where the long-term effects continue to be significant in other areas of building aggregate, but were promptly eliminated by stone simultaneously to a new increase in its market share, even
year in Verona, and the XXV “World Natural Stone Report”.The presentation of this publication - a genuine “Bible” in the sector and awaited every year by insiders - will be previewed during Marmomacc 2014, on the opening day of the show which was originally founded in 1961 in Sant’Ambrogio di Valpolicella, one of the most important marble-working centres in Europe since Roman times. Just as Marmomacc has accompanied, supported and promoted the development of the stone industry for almost half a century, the Report
by Carlo Montani - itself going back 25 years - is a faithful and precise observer of this economic world and its specialised operators. Where Marmomacc is the largest meeting place for business and professional training of 57,000 buyers, designers and architects from more than 140 countries, the “World Natural Stone Report” is still and deservedly an essential and rational guide for understanding and interpreting emerging and consolidated international markets alike.
Happy reading.

42 XXV Report World Marble and Stones 2014
if it is relatively contained. This means that the technological and aesthetic features of the natural product are subject to a non-ephemeral appreciation, on which it is possible to promote a policy of industrial growth and investments, either in production or in the field closely connected to the uses development. The assumption must be extended to technologies, particularly with regard to engineering structures and capital goods, where the Report dedicates extensive and renewed attention, and whose role in the development of marble and stone is absolutely essential, thanks to the decisive contribution of research and Italian machines, as part of a productivity not
separated from the security and pursuit of increasingly advanced levels of quality.Stone growth is tied to the employment one, as the professional component continues to have an important impact on the production and distribution costs. Even apart from the most recent estimates, in the world order of twenty million units, the stone is a phenomenon of obvious socio-economic importance, capable of asserting in quarries, in sawmills, and in the other cutting and processing structures by the dignity of a noble work, which we have to pay attention to, as a real policy, considered as work in the associated life for the common good and progress.
Macro-economic frame
The world gross product has reached a new historical peak, overcoming 70 billion dollars (table 1) and confirming the traditional concentration in a relatively limited number of countries: the first fifteen express three-quarters of the total, leaving to the others, which are over two hundred, the figure in balance. The most significant increases have been reached once again from United States and China, whose national income is a third of the Global one, while the most significant adverse changes have been in Europe, involving also Brazil in a relevant amount.Building activity, after the stagnation that had followed the crisis of 2009, has reversed the trend and registered, in the leading industrial Countries, a significant recovery before the middle of 5.1 per cent (table 2). This, though in China, the first builder country in 2013, has been basically confirmed by the level of the previous year, while in the United States the increase was in double figures, with a volume of a new
building, however, very far from historical highs. Significant increases have occurred in Japan and especially in Turkey, where building activity, unlike what happened elsewhere, has survived to a new record.In the long run there are many countries that have ascribed positive final balances, confirming a building situation that continues to be viscous: as evidenced by the indexes in the reference group the same growth has occurred only for Turkey, followed by South Korea, China, Russia, Poland and Germany (table 3): all States which, for various reasons, have been able to count on economic factors more development-friendly.With about four million residential units built in 2013, China, despite the tendency to the above mentioned standstill, is the first worldwide manufacturer with a wide lead over Japan, India, Russia and Turkey, which follow in the immediately following ranking positions (table 4). The concentration which has been said about the GDP is confirmed, according to logic, even in the building figures.
XXVWorld Marble and Stones Report
2014

44 XXV Report World Marble and Stones 2014 Carlo Montani 45
The correlation of these figures with the stone consumption are clear: where we build more, the potential uses are proportionately more, although should be weighted with other important factors such as the availability of local resources, the propensity to invest in the product quality and the strength of competition. Not surprisingly, China, India and Turkey are listed at the top of the production and processing of marble and stone, while Japan and Russia are great consumers of imported material, with special reference to finished product.European building, as above mentioned, works broadly lower in quantitative terms but this is not an insurmountable bottleneck regarding stone use that with regard to per capita level, places it at global and high competitive levels, as in the cases of Belgium or Switzerland. In other words, marble and stone musty rely on the presence of a significant building on the quantity, but at the same time, they can rely on qualitative factors, always able to make a difference. Not surprisingly, even in Brazil the negative effect coming from the reduction of gross product is really non-existent in the stone field, thanks to the export strength, not separated from the high development of the internal consumption, induced by a top quality.
World stone production
The trend of growth in marbles and stones excavation continued even in 2013, scoring the fourth consecutive increase, which brought the produced quantity not far from 100 million cubic meters with a
gross increase in volume, compared to the previous year, on the order of five million, or 5.3 per cent (table 5). The corresponding net of competence is equal to 48.2 million cubic metres, which is 130 million tons.In its turn, the net production of ready-to-use materials, deducted the wastes of cutting and processing moment, has reached 76.7 million tons, while the commodity breakdown among siliceous, limestone and slate has basically confirmed the previous incidences, which see the prevalence of marble and travertine to the extent of three-fifths on the total (table 6). In fact, even the shares of consumption have stabilized, while in some greater preference for calcareous materials, induced by a still greater availability.The global amount of the quarry waste and processing has reached 190 million tons: a very large volume, which induces a strong strategic problem, certainly a priority for the sector: that is one of the location, and for what is possible, of the suitable appreciation of these materials. The widely prevalent share of Asian countries in the world stone production continues to express quantitative increases, thanks to the decisive contribution of India and China, while Europe has recorded a further regression, which in 2013 was equal to one percentage point, compared to the previous year (table 7). We have also to underline the good increase in Latin America, led by Brazilian growth. The volume of stone products rose to 1,420 million square meters, referring to conventional thickness (cm. 2), with an increase of 70 million towards 2012, which was contributed in a decisive way by the four
protagonists of the sector: in order, China, India, Turkey and Brazil (table 8), which were able to express more than 61 percent of the total. On the contrary, the European countries and particularly the Mediterranean ones continued to have a reflexive trend: in the EU, however, the productive decline was still limited to half a million tonnes and 3.3 per cent (table 9).Concerning Italy, its quarrying production corresponds to a volume of finished product of 76.5 million square meters equivalent, with Tuscany advantaged over Lazio and other Regions (table 10); but at the same time, with remarkable different dimensions than those of exports, where two-thirds of the volume shipped are the prerogative of the Veneto and Tuscany with virtually equal shares.Globally, the finished product is differentiated between construction and different consumptions in the proportions of three quarters and a quarter: in the first case, with priority targets to floors, special works and covering, and in the second, to the funerary art and furniture (table 11). It should highlight that in the long term the share that has registered the highest growth rate was that of special works, which have contributed significantly to the technological advancement and the spread almost generalized of the numerical control.
International trade
The growth trend of the world stone interchange has continued even in 2013, signing the fourth consecutive annual
increase, after the setback which is recorded by the crisis of 2009. More specifically, the global export volumes and the corresponding import have reached 53.3 million tons, with an increase from the previous year that was equal to one and a half million tons, and about three percentage points: in the light of the production datum, increasing by five points, it follows that the development of internal markets has been greater, in front of the international trade. The input-output model, basic cross-detection tool, highlights how the raw calcareous stone have led to international movements for 15 million tons (table 12), with an increase of 2.6 per cent, while in raw siliceous have reached 13.1 million tons (table 13), corresponding to a rise of 4.5 percent. On average, the progress of raw, consisting of blocks and raw sawn slabs, was 3.5 per cent and has absorbed the 52.7 percent of the total interchange, continuing into the current trend in recent years, growing by about half a point than the detected in 2012, and then registering the new high with 28.1 million tons. The finished product was the subject of quantitative international flows for the balance share, which accounted for 47.3 percent and 25.2 million tons, showing a growth in absolute amount in the order of half a million tons, while that of raw was essentially double. The simple processed products with interchanges amounting to 2.9 million tonnes (table 14) have regressed of 6.3 per cent, while those with high added value, which are the basic component of currency flows, are attested on the balance sheet of 21.1 million tons (table 15), with

46 XXV Report World Marble and Stones 2014 Carlo Montani 47
a weight of four growth points, that is triple against the volume ascribed in 2012. In further regression, however, the slate processed products, which have closed with exchanges for 1.2 million tons (table 16), and a drop of 6.5 percent.Globally, the stone volumes input and output flows, at the net of wastes share on the raw volume, a total exchange for about 774 million square meters equivalent at the conventional thickness of cm. 2, with an increase of 20 million in absolute figure (table 17), in an average progress of 3.7 percent. The volume of processed products has iterated the previous final balance, with about two-fifths of the total.In few words, we must stress that the overall growth of 2013 has been lower than in 2012, but how it further consolidated the recovering with the main contribution of raw and processed products (especially materials with an high value-added), and with further upgrades of the blocks and intended for processing in third countries with competitive cost levels. It is a strategy that involves mainly the big Asian manufacturers, and first China, the greater importer of raw material, with leading shares from Turkey, Egypt and Iran for calcareous, and from Brazil for siliceous. The international exchange, with his almost constant growth trend, which over the past 25 years, interrupted only in 1998 and in 2009, is an undoubted strength of the stone sector, in the light of a selective application and a subsequent boost to the pursuit of quality, an essential factor on the international market; and at the same time, ensuring a further growth.
Dimension of export-import
The analysis of the interchange for large geographic clusters is useful hit it on the nail of the various economic behaviours and to draw meaningful information about the prospects for development in the short and medium term, in a logic of marketing that will transcend the significant statistical language but of the figures. The balance sheet of the European Union, with 11.4 million exported material (table 18), confirms the previous year result, while import showed supplies for 9.6 million tons (table 19), in the further decrease of half a million after the most conspicuous one of the previous year, emphasizing on the one hand, the tightness of raw products shipments on average qualified as European ones, and on the other hand, the permanence of a substantial stagnation of processing activities in the same Union. European exporters are always stronger in Italy Spain and Portugal, while among buyers the main performances are pursued in Germany, France and Belgium, as well as in Italy.The movements that affect other European countries have confirmed a substantial marginality condition, either in export (table 20) or in import (table 21), whose quantity flow, in both cases, is in the order of a million tons, with a priority role of Switzerland, mainly in supplies, either of raw or finished products.An increasingly decisive role in the international exchange of stone is ascribed by the leading sector extra-European Countries, led with increasing advantage from China, India and Turkey, followed from
far, but with equally important volumes, by Brazil and Egypt (table 22), while in the purchases, where China did consolidate its historic leadership, there was a good recovery of the United States and the confirmation of South Korea and Taiwan in the back positions (table 23). Some new problems occurred, instead, in export by Iran and in import to Japan. The other South-East Asian countries, even far from the final balances of the leading protagonists, confirmed an important complementary role, by iterating the export already accounted in 2012 with 1.7 million tons (table 24), while the import is considerably increased to 2.5 million, thanks to purchases especially from Hong Kong, Singapore and Vietnam (table 25), with a significant priority contribution of the processed product.The world landscape is completed with a number of other countries of the extra-European continents, whose single role can become important, as in the case of shipments from Jordan, Oman and Palestine (table 26) or of import to Lebanon and Saudi Arabia, the latter in strong and growing tension (table 27). Generally speaking, it is possible to remark a relatively marginal contribution to international flows from Africa and Latin America, with the obvious exceptions of Brazil, Egypt and South Africa, while the Asian contribution is once again essential. Altogether, the synthesis for large aggregates confirms that the extra-European leaders have further developed their own record as exporters, coming to 68.5 percent of the total with a further point gain over the
previous year (table 28), and expressing the 55.3 percent in import (table 29), with an increase of nearly five points. It is a further sign of increasing concentration from which sector world exchange continues to be characterized.
Stone exchange trend
The long term analysis confirms that the trend of sector development, with natural projections in investments and production, has been operating for 25 years, marked to a significant constancy. In fact, the volume of trade has risen from 9.7 million tons in 1989 to 53.3 million of 2013 (table 30): this, in front of annual constant increments although with a different percentage quantification, with the only exceptions of 1998 and 2008-2009 biennium: the latter, particularly in economic impact of the sector (table 31). After all, over the long period the marble and stone volume object of international trade has grown five times and half with variations substantially identical either in the raw or in the finished product, even if in their sub-aggregates we have to stress more than proportional increases as to calcareous materials and processed products with high added value (table 32).The allocation of goods remained virtually unchanged compared to the 1989 but in the long term, after the gradual reduction of raw up to the historical minimum of 2007, equal to 42.6 percent of the total, has been ascribed a ten-point recovery up to 52.7 per cent of the previous year (table 33). As regards the division between calcareous and

48 XXV Report World Marble and Stones 2014 Carlo Montani 49
siliceous, 2013 also confirmed the traditional prevalence of marble and travertine, with a rebound although marginal of granite, and a new decline of slate.In twenty years of activity the geographical distribution of exports shows that seven countries have shipped total volumes for over one million tons, with large advantage places for China, India and Turkey, followed by Italy, Spain and Brazil (table 34); similar but quantitatively dissimilar conditions are detected in imports where eight countries have purchased materials for over one million tons, but with China’s increasingly advantage on other importers, led the United States and South Korea (table 35). We should add, however, that within these “top leaders” are twelve countries which have registered an export decline in 2013, and ten of those that have regressed concerning supplies.Regarding export we have to put in evidence, regardless of price and values evolution which will be referenced later, that the quantitative shipments of marbles and stones from China decreased for the second consecutive year, with a drop of one and an half million tons compared to the top of 2011, and the loss of almost two percentage points (table 36); on the other hand, are further increased those of major competitors, namely of Turkey, and especially of India, whose growth during the last two years has reached four million tons, reducing almost unpredictably the detachment towards China, dropped to three million tons against the 8.3 million registered in 2011.In the corresponding field of imports, on
the other hand, the further progress of China appears irrepressible, rising of over four million tons during the last biennium and an incoming stream that in 2013 has reached almost 18 million tons, equal to a third of world purchases (table 37), all the more remarkable when compared with the 3.6 million of United States, the second importer country: obviously, in comparison with the export, the dynamics of Chinese interchange, where almost all import consists of raw materials, shows a further strong development of domestic transformation and market.
Commodity analysis
The disaggregated examination of the international economic situation for individual commodity categories in the long term, highlights a very different behaviour of various types, and of leader countries. In the raw calcareous stone (cod. 25.15), the export continues to record the growing success of Turkey: this country, with 5.7 million tons, came to 38.1 percent of the total, compared with 4.4 percent in 1995, followed with a big distance from Italy and Spain (table 38), whereas imports show the almost monopolistic role of China, strong in purchases for 10.8 million tons, representing 72.3 per cent of overall purchases in foreign markets (table 39).With regard to the raw siliceous (cod. 25.16), India clinched an absolute majority of the volumes exported, with 6.7 million tons, which is equal to 50.7 per cent (table 40), followed by Brazil with 1.4 million, or 10.7
per cent. Conversely, imports are once again dominated by China, with 6.7 million tons, which is equivalent to 51 per cent of global supplies (table 41), while Taiwan follows in second place, with 1.1 million tons, and with a strong drop of the previous volume.In simple processed products (cod. 68.01), it being understood that the overall contraction of whom it was said, the priority export is always China, with 1.1 million tons and 37.4 percent of the total (table 42), while Portugal, thanks to an old national tradition, may defend successfully the second place. The import of these materials is mainly European, with Germany and France leading in the respective ranking (table 43). The commodity typology of greater consistency, especially in value, is that one of processed products with high added value (cod. 68.02), where are the five countries which have exported more than a million tons: in order, China, which dominates the top ranking of its 9.5 million followed with a strong distance by Turkey, India, Italy and Brazil (table 44). Imports, on the contrary, are distributed more diffusely, with priority impacts of United States, South Korea and Saudi Arabia (table 45) almost to underline the growing weight of extra-European countries even at the level of consumption.It remains to be said about the slate (cod. 68.03), the export of which sees the permanent leadership of Spain, however further reduced, and equal to 38.7 percent of the total, ascribed in 2013, with an almost marginal advantage on China, and on Brazil (table 46). The drop in global shipments of this material is balanced by that of purchases, where the greater incoming
flows are, as usual, France, United Kingdom and United States (table 47).In essence, the decisive flows in economy of the stone international exchange found the main quantity in the raw ones, and a similar contribution in processed products; while the market continues its global expansion: when we think that in 2013 the export of Chinese stones with added value reached a record of 205 Countries from all continents (figure higher than the number of States present actually in the United Nations Organisation), it is easy to understand how marble and stone have become a world heritage site in the true sense of the word, as authors of technological and civil progress which we can consider as universal.
Italy: long-term strategy
An old record is never a guarantee of continuity: the case of stone in Italy is a probative evidence. Apart from production involution, which sees its share declining even at European level, while remaining close to a third of the whole volume extracted in the old continent, the trend of Italian international exchange confirms it indisputably: in 2013 the quantitative Italian export, at net of by-products, equal to 3.2 million tons, grew at the rate of one and an half point widely lower than the world one (table 48), with a share of raw rose to 48.7 percent, with the further drop of the finished product. In its turn, the import, which has been declining constantly for seven years with the only exception of 2010, saw the volume of raw, always widely greater,

50 XXV Report World Marble and Stones 2014 Carlo Montani 51
decrease under one million tons (table 49), underlining incisively the permanent crisis of the national processing activities and added value. We can remark that over the last three years the volume of purchases has declined by as much as 27 points.With regard to the export of processed products, which remains the first balance of Italian stone industry, a partial positive factor may be considered, in front of a marginal quantity variation, the increase in value, and especially in the average price per unit of product, by over seven percentage points (table 50). In particular, the price of the product exported has exceeded for the first time the psychological level of Euro 50 per square metre equivalent (at the conventional thickness of cm. 2), unlike what has happened in other countries, even in Europe.The disaggregated export trend of the processed products for the 2013 confirms the concentration of two thirds of the turnover in only two regions: Veneto and Tuscany, with global values almost equal, in the order of 500 million Euros each (table 51), and with good progressions above average also in Lombardy and Sicily.Italian stone export, which has reached a total value of 1874 million Euros, constituting the best result of the last ten years period (table 52), remains lower, especially if compared to that of the best historic years, but towards the global figure of goods and services exported from Italy has continued in the recovery trend opened in 2012, ascribing a share of 4.8 per thousand (anyway, very far from that of 7.5 detected back in 2000). It means that the tendency to growth,
except for the marginal recovery of the last two years, is significantly less than that of Italian system, even this is characterized by a critical situation. All of that, is the origin of obvious promotional and distribution relationships, and underlines, especially in stone sector, the urgency of an exhaustive and appropriate institutional support.Strategically, Italy numbers put in evidence, in addition to the stagnation of the internal market caused by building in critical conditions for too long, an export structure oriented towards the preference for raw stones, which ensures greater levels of profitability to stakeholders but does not allow the development of processing activities, conform to the dynamics of global demand. In summary, the goal of a full recovery of historical financial statements, strategically possible, remains far away.This situation is not substantially different from the other European countries with an higher stone vocation, as priority regard to Mediterranean ones, and first Spain and Greece, but implies a gradual abdication of leadership in primary advantage of new Asian leaders (China, India, Turkey) and the largest producer and processor of the West (Brazil). The consequences of such deterioration from a strategic perspective and socio-economic sectors, are in all evidence, and an important hint of reflection, firstly for the political and industrial will.
Spain: a complex objective
Spain, the second European stone producer and seventh in the world, highlights a still critical situation, but at the same time
enlivened by remarkable hints of recovery, which is supported by some important competitive factors: a very varied production range of marble and granite, the historical “leadership” in the slate field, and an high propensity to investments, particularly in the great transformation, where the Spanish productivity reached very advanced levels, even in non-serial items such as, for example, kitchen worktops, vanities and bathroom furniture.These factors are completed with the presence of important reserves on most part of the territory, and with a transformation development often intense. The strong drop in domestic building, and in financial credit, caused a proportional decreases in consumption of stone, partially recovered by a good confirmation of export, quantitatively more accentuated as to raw materials, but also notable in processed products, since deliveries and shipping abroad have largely passed, even in 2013, the level of twenty million square meters (thickness conventional cm. 2).The export situation of Spain in the short period was characterized by a strong recovery, with a turnover of 2013 on the order of 1200 million Euros (table 53), not far from the historical peak of 2008; this, just like what happened in Italy with a market raw share that over the last three years has affected about 50 per cent of volumes (table 54), but at the same time with the wide prevalence of the finished product as to value, where its weight has reached two-thirds of the total. On the other hand, the average price per unit of product did progress well in the shipment of raw
stone, while conceding some points in the only 2013, while continued to go down as to granite whose price of which is almost halved compared to 2001; in processed products the decrease was more contained, with a value that, always in the last year, remained around eighty dollars per square meter, slightly higher than the price of slate, whose bending is greater.The reflective trends of import was much more accentuated, both in the long term than in the short time, concerning mainly the raw material, mirror of an added value policy that penalized the processing activities, like what happened in other leading European countries, while the crisis of the import processed product, although less wide, arises as an effect of the negative situation in the local building industry (table 56). The share, widely a majority of import, however, remains that of raw granite, both in volume and in value (table 57), where it achieved respectively, 43 and 70.2 percent of the total, with average prices down towards 2012 but still more, and in some cases significantly, towards 2001, having reached 39 dollars per square meter equivalent in finished products, equal to half of exports one (Table 58).In short, the recovery is difficult, but relies on a productive advanced structure and on a fair propensity to investment also in the promotional field, confirmed, although, by the strong presence of Iberian stone industry in many reference trade fairs, and by the competitiveness of certain distribution costs, such as freight rates: not surprisingly, for example, transport from Galicia to Tuscany is competitive compared with the Italian
52 XXV Report World Marble and Stones 2014 Carlo Montani 53
domestic shipping. Similar considerations may be applied to energy costs and for labour, where the ability to make a difference, especially during processing stages, is well known everywhere; also as a factor which may contribute actively to a strategy of recoveries that can rely on the cooperation of business with the political moment, certainly, an useful factor in the international, complex stone comparison.
Other European Countries
The productive and distributive leadership of Italy and Spain as part of the old continent does not exclude the presence of other significant sector realities, sometimes of consolidated tradition, and holding some prestigious exclusives. We can indeed say that in Europe the vast majority of countries have a good role in the stone production sector, and a remarkable relief in the international exchange, and obviously, in consumption.Enhancing local resources of marble and stone is a preferred strategy of Portugal and Greece: in the first case, with advanced facilities of vertical organization, with good political will, cooperation and European leadership in the production and export of simple processed products, especially for external and structural uses; in the second, with the endorsement of high references, borrowed from classical antiquity. Nevertheless, Portuguese and Greek marbles have derived, as a minimum extent substantially positive, potential effects arising from the economic crisis, which in
their respective countries has warned, also with a strong financial drop: the contraction of some costs and the greater pressure of the offer had no important effects on export, which remained almost stationary, with some most significant surplus in the processed products of Portugal.Concerning import, however, we can distinguish like in the past the supplies of Central European countries, notably of manufactured goods, with particular regard to those of Germany, France, and for less quantities, of Holland and Belgium: the latter country, indeed, remains the world-leading per-capita consumption, not only for the good quantity level of its reserves and for its ability to enhance them, but at the same time, for the remarkable transformation of raw materials from abroad. An important role is also paid by import of finished products to the United Kingdom, where it was boosted by the strengthening policy of stone import uses in a country characterized by historical lack of its own production, and thus, of its great transformation. The European static situation continues even in the Nordic countries, with particular reference to Finland and Norway, where the raw granite typical productions, generally of high quality, have lost some percentage point, with destinations to the Chinese market, where a major part of raw calcareous stone export is addressed from Portugal and Greece too, but quantitatively supplementary, with Italy and Spain shares, of great streams of shipping to China by new developing leaders (Turkey, Egypt and Iran for calcareous; India and Brazil for siliceous). We have to highlight how Germany, the
first European buyer in the sector, with a large majority of processed products, also proposes itself as a good exporting reality thanks to an appreciable production activity, which allows the Federal Republic to occupy the fifth absolute place in the European ranking of quantitative sales. On the other hand, the positions of some Eastern countries, with main reference to Poland and Czech Republic, even concerning the internal consumption, are dropping: not surprisingly, the last year coincided with a strong reduction of Polish purchases of raw materials, and consequently, of the processing activities. Among the latest members of the European Union, we have to emphasize the largely positive report of Croatia, thanks to growing export of Istria and Dalmatia materials, mostly raw (also for structural use), while the capabilities of countries like Bulgaria and overall Romania remained on the waiting list, although they can rely on considerable technological and chromatic value reserves, especially of marble and other calcareous materials.
Planet China
During 2013, it was possible to find a further confirmation in the phase of strategic renovation of main strategic options by Chinese economic policy, also in the light of a relative slowdown in development, with rates at a single figure, where it becomes significant, as in the Western countries, also at the level of decimals.The stone sector was not an exception, with
a production level near to 40 million tons, and a quantitative export which has ascribed a second setback after 2012, decreasing to 12.1 million tons (table 59), but still showing a growth of five-and-a-half times in a twenty-year period information (table 60), which remains more than remarkable.The majority of export share is still a matter of finished products, with 92 percent of the total (table 61), confirming the traditional Chinese vocation for the policy of the added value and the renewed appreciation of foreign markets. On the contrary, value growth is even more appreciable, with a business volume coming to 6.2 billion dollars (table 62), and an increase of about one billion towards 2012, equal to twenty percentage points.The pursuit of higher profitability levels by Chinese exporters is supported by the further increase in the average price of the products, arrived to 32.4 dollars/sq. meter against the 27.5 dollars of the previous year and the 13 dollars of 2003, the year of greatest promotional contraction of shares (table 63). Anyway, the gap in price compared with Western countries remains competitive, of course, to the benefit of Chinese exports.The major targets of the finished product were traditional ones, with large advantage for South Korea, Japan and United States, but at the same time with high average price hikes, whose top level continues to register on the American market, while the least, in addition to Korea, are interesting even some European countries, such as Germany and Belgium, where there is a clear availability to import materials liable to buy with

54 XXV Report World Marble and Stones 2014 Carlo Montani 55
particularly favourable conditions (table 64). The top three importers of Chinese material, mentioned above, express more than a third of the shipments in question (table 65), but this does not mean that the ability to enter of Chinese products has taken absolutely global characters, being spread, in 2013, in a whole range of 205 Countries from every continent, and having highlighted the universality of the application, together with a strong commercial and distribution capacity.It remains to say that import, unlike export, consists in almost a totalitarian measure of raw materials intended for processing in China, with a total value that in 2013 reached a new high, to the extent of more than 2.9 billion dollars (table 66), and with an increase of more than eleven points from the previous year; but at the same time, with a substantial stagnation of purchasing prices, which is less of a good half, compared with the historical peaks of nineties, concerning supplies.The major provenances concerned, as before, Turkey and Egypt regarding the calcareous stone products (table 68), as well as India and Brazil in the context of siliceous (table 69): in both cases, about three-fifths of Chinese imports are only get from two sources, which does not exclude a broad range of purchases to balance, but stresses the consolidated priority of business relationship with the other leading Countries of the world stone market.
Asian leadership
The consolidation of the Asian leadership in the stone field is not only credit of China,
because the production and distribution importance of other fundamental realities such as India, Turkey and Iran has acquired an absolute level dimension, without talking about internal consumption of great importance even in countries with lower quarrying capacity as South Korea and Japan. The priority is given to India, second world force in the sector, whose posting from Chinese exports, indeed, was greatly reduced during the last two years. In particular, Indian shipments of raw granite in 2013 reached a new high, with over 850 million dollars, and a large majority to China (table 70); also those of the finished product have progressed rapidly, approaching two million tons, equal to more than 36 million square meters equivalent, and surpassing 1.1 billion dollars (table 71), while in a non-marginal contraction of price, dropped to a little over 30 dollars: this, with significantly different destinations, but with the United States in position of advantage with respect to European markets (table 72).Even more impetuous has been the development of Turkey, with a total export of 8.3 million tons, an increase of 18 times in front of 1999, although the average value has ascribed a significant contraction in the order of 13 percentage points (table 73). This is, absolutely, a priority measure in the export of blocks and slabs of marble and travertine to China, which in 2013 reached 4.9 million tons, equal to nearly nine-tenths of the total (table 74); very significant, especially in the context of the value, it was also the contribution of the processed products, and first of all, those exported to
the United States and Arabian countries (table 75).In the context of imports, a specific attention should always be paid to Japan’s market, where raw material purchases have almost cleared, confirming the stagnation of local production activities, by several years (table 76), to the benefit of supply of processed material, in very large Chinese majority (table 77), but equally dropping both in the short and in the long run, also as to the average values per product unit, with the only exception of 2013, bearing the increase of Chinese price of finished products sale (table 78).Other Asian realities contribute significantly to the world development: not only with other high consumptions of countries such as South Korea, largely tributary of China, like Japan, Hong Kong and Singapore; but above all, with the quarrying and processing production of new protagonists of the interchange, such as Iran, apart from its domestic use excellent tradition and the stasis of its sales in China, or Pakistan, which in 2013 reached one million tons quarried; and with the industrial contribution of transformer countries such as Taiwan, where the sawing capacity per capita ranks around the highest in the world, and to a lesser extent, such as Vietnam, Indonesia and Thailand, including some Gulf States, with priority to Oman, where the local stone resource exploitation is inducing significant investments, not only in the quarrying field.We should not neglect, finally, the opportunities offered by countries certainly minor, among which we can mention, for example, Bhutan, Maldives and Nepal, for
the useful sector integration with India; and internal states, beginning with those of the former Soviet Union, led by a constant development in Kazakhstan, ending with Mongolia and North Korea, which in 2013 recorded some innovative exchange, although marginal, in the Asian stone panorama.
USA: hard gradual progress
In the world stone situation both short and long term, the US market has an essential importance, especially for the leader figure of turnover, which is connected to domestic uses coming with a large majority from import. Hence, the interest with which a great part of European, Asian and Latin American exporters are looking to the future opportunities of development, is paid to the commercial relationship with the United States.In 2013, North American purchases of marbles and stones, made up almost entirely of finished products, have reached a value of 3.1 billion dollars, an increase of 19.5 per cent compared with 2012, which follows those ones of the previous biennium (table 79), but remains far from the primacy of 2007. We have to note that the growth of the last year remains satisfactory even to competing materials: in fact, the import of ceramic tiles for the building industry, come to 2.8 billion dollars, remained lower than that of stone, having reached a flattering 16 percent.Raw materials supplies have become absolutely minimal, with an overall share that

56 XXV Report World Marble and Stones 2014 Carlo Montani 57
in 2013 decreased under the psychological share of one percent, highlighting, even from this point of view, the lack of North American propensity to invest in the great transformation, with a stronger preference for supplies of finished material. Of course, this does not mean that laboratory activities, in particular in small and medium-sized orders, have been penalized: indeed, could benefit from the recovery, although gradual, not less of what happened for the most important works.Over four-fifths of the purchases of processed marble and stone, made by the United States during the 2013, originate from just five countries: in order, Brazil, China, Italy, Turkey and India, leaving to the rest of the world only a 15 per cent of the total (table 80), with relatively steady-state shares in recent years, except for the notable Brazilian progress, come to 28 per cent of the total value (table 81).In the context of smaller supplies, we have to highlight the progressive drop of those coming from contiguous countries, like Canada and Mexico: despite the obvious competitiveness of their transport costs, the buyers preference awarded transoceanic productions, on the one hand for the appreciation of quality, as in the case of Italian deliveries, and the other, for the convenience of shares objectively contained in particular as regards supplies of Turkish marble and travertine, Indian granite and Chinese materials in general.It should be added that the success more than proportional of Brazil should be attributed to US confirmed preference for the processed siliceous product, particularly with regard
to brightly colour granites which often are, like some types of slate, an exclusive almost established on the international markets. It is important to emphasize that the purchase trend of the US is based on a constant long-term growth, with the only exception, however very wide, the 2008-2009 biennium, in which 44 percent of the previous total was lost, resulting in a no less significant crisis of productive investment (unlike promotional ones); and at the same time, as internal consumption has registered a substantially proportional progression, although affected by stagnating internal productions more accentuated than occurred in import during the years of crisis.
Stone globalization
The dynamics of demand, together with technological development and the speeding up of transport, has reduced the size of the world and has promoted marble and stones in a global perspective, with the consequence that a growing number of countries could enter the market with good potential interest perspective, both in terms of production, both in terms of consumption. Today, there are few realities that to one or another title, do not take part to the worldwide expansion of the sector.In Africa, with the exception of Egypt, indisputable leader by this time of the continent due to the large flow of shipments of raw marble and travertine to China, while typical siliceous production is not still able to promote its prestigious classical traditions, we have to emphasize the stone economy
situation in South Africa, where the granite quarried volumes decreased in light of certain domestic difficulties, but above all to a strict quality policy in oligopolistic key, which has affected the export up to determine, in 2013, a drop of about 50 percent compared with 2008, and over twenty points in those of the previous year (table 83). At the same time, the South African shipping of finished products has greatly increased, both in the short and medium term on the basis of medium prices rather competitive, even if it remained a minority.Other African countries, with the exception of the Mediterranean ones, where the interchange preserves appreciable volumes both depart and arrival, are still far from making a significant role, although in certain cases could develop some important raw siliceous export flows, as in the case of Mozambique and Zimbabwe.A low economic situation also characterizes the Latin American countries, with the obvious exception of Brazil, where the same Argentina, once a leader, is reduced to positions substantially marginal, especially in export, and with a domestic production contained, addressed overall to the internal market.Between the countries of second and third band that gave a significant contribution to the development of the sector, and first to the interchange one, are once more the Asians. Apart from the leading countries, as mentioned earlier, it is useful to refer to contributions, often innovative, but consisting mainly in export, of Jordan and Palestine: in the first case, even at the level of supplies and processing activities, and
in the second one, for the high incidence of stone on the gross domestic product, to be placed at the highest levels in the world. Similarly, in Asia, there are other countries that have become significant producers, as happened in Afghanistan, and sometimes even good exporters, as in Kazakhstan.Globalization has not involved in full measure the prices, in the sense that, especially with regard to finished products, the quotations of buying and selling are naturally differentiated depending on the degrees of competitiveness and industrialization in the countries concerned: referring to the top production and distribution contexts, we must put into light as the most remarkable adaptations of long and short period have taken place in China, Brazil and Turkey, but also in Spain, Italy and Germany, while the Portugal and India prices are decreasing (table 84): this means that the greater or lesser propensity to profitability has not a direct relationship with the general economic development of the countries concerned, but also involves other important variables, starting from investments in production, and in the same promotion too.
Development in use
The uses of marble and stone have made records that in the long run became generalized: in twenty years in the major countries involved there was a substantial growth and sometimes impetuous, as in the case of China, which is a leader also in this field, and where the weight decoupled the volume of 1994 with a balance sheet of 2013

58 XXV Report World Marble and Stones 2014 Carlo Montani 59
which reached two net million tons (table 85). We have to underline the excellent increases in India, South Korea, Brazil and Turkey, and therefore, all the other countries, with the only exceptions, always related to the extended period of time, of Germany, Italy, Spain, and especially Japan.In terms of net surface, the world consumption of 2013 referred to about 1.42 billion square meters, equivalent to conventional thickness of cm. 2, with majority shares in China and India, respectively for 410 and for 105 million square meters, alone equal to 36 per cent of world quantity (table 86). In third and fourth position are following United States and Brazil, while the first European country is Italy, which is in sixth place, overtaken in this ranking also by South Korea.Stone world consumption has doubled compared with 2005, with widely variation indices higher than the world average only for China, India, Brazil, Saudi Arabia and United Kingdom, while in all other countries the growth was lower than the predicted average, although highlighting some good progression in Belgium, France, United States, Taiwan and Switzerland (table 87).We have still to talk about per capita consumption, where in 2013 the countries capable of overcoming the important goal of one square meter per inhabitant were five: in order, Belgium, Saudi Arabia, Switzerland, Taiwan and South Korea (table 88): this with a good recovery in the last two years, but with some delay in the medium term, which has penalized more countries such as Italy, Spain, Portugal and Greece, characterized by a critical situation with regard to the trend of national income
and other fundamental variables.The most important record about per capita consumption may be considered, in any case, the additional increase of the global figure that in 2013 has reached 226 square meters per 1,000 inhabitants, compared to 215 in the last year and 117 in 2001; in fact, this parameter shows like that of consumption has been a constant trend of global growth, only excepting the yearly stand-by of 2009.Leading stone producers such as China, India and Brazil, are still in the back of the per-capita ranking, which implies the presence of large and unexpected development potentialities, even as important productive investments and promotions always on the agenda of the countries in question. Moreover, similar terms also exist in several countries of the old Europe, characterized by the presence of an higher tradition, both in construction and other consumption, as in the case of United Kingdom, Germany and the Netherlands, where the relationship tax arises just above the world average, and not far from those obtained with a strong progression in China and Brazil. Concerning Japan, dropped almost at the end of the ranking of major countries, although relying on important alternative uses such as in the funerary art above the world average, it can be said that the regression has been caused by the market saturation and by a significant stagnation in building industry.
Machines and plants
In the macro-aggregate of stone, the satellite industries of a greater economic
and strategic importance are the sectors of plants and technology, whose steady progress is the necessary condition to increase the productivity, contain costs, improve quality and optimize security and working conditions. In this field, the contribution of the Italian research and its industrial specialization continues to be a driving force, according to consolidated traditions.In Europe, the primacy of Italy has never been questioned, although the crisis of 2009 did left several traces, creating the following adjustments, reaching anyway a great recovery in 2011, and finally coming back to productive averages conform to the historical trend: in 2013, the volume exported from Italy was equal to more than 660 thousand tons, up two points from the previous year, which is the fifth-best result of the last 16 years (tab. 89). The import of the fifteen European first countries, on the other hand, has one third of exports and is greatly spread among different buyers, with higher levels in the United Kingdom, Germany and France (tab. 90).Long-term indices show the biggest percentage growths of European exports in Portugal and Greece, while the import keeps positions substantially, with some better progress in the countries of Northern Europe (tab. 91).Extending the short-term analysis to Europe of twenty-seven, it is easy to establish, on the understanding that the Italian leadership in export, that the main shipments of machines and plants were directed extra-Community (tab. 92), with a phenomenology that, although in a reduced scale in terms of global
quantity, is repeated in import (tab. 93).The Italian primacy in Europe is naturally confirmed even in the exported value, with a turnover that in 2013 has reached a new high, amounting to over 700 million: a figure that doubles that one of 1998, with an high performance that could be iterated in the average value per product unit, positioned for the first time beyond ten Euro/kg. (tab. 94), and expresses an increase of 60 percent over the period, mainly concentrated in the last biennium, confirming a good economic recovery for the whole stone industry in the world.Concerning the extra-European side, we have to signal the second consecutive decline of Chinese imports, bearing the relative drop of the stone export, with a penalty moderately stronger for Japanese sales (tab. 95); the good recovery of the purchases from the United States, less focused and less consistent than those of stone producers (tab. 96); the new Indian investment contraction in machines coming from abroad (tab. 97); and the new high of machines import in Turkey, more appreciable because in this case the importing country is remarkable also in the field of technological production (tab. 98).Italy stressed its traditional leadership even globally, where it leads the export ranking with large advantage over China, Germany and Japan, the only countries which made shipments to over one hundred million dollars (tab. 99), and where has further increased its leading market share, as also happened in Europe (tab. 100), similarly to what was registered as to quantities. It should be added that in several countries

60 XXV Report World Marble and Stones 2014 Carlo Montani 61
the share of Italian technology on the total of the respective imports expresses in terms of an absolute majority, as in Brazil, Turkey and Saudi Arabia (tab. 101), but also in Bulgaria, Greece and Slovenia (table 102), confirming an appreciation by now consolidated in a global market dimension.
Technological goods
The global expansion in quarrying and processing, and the upgrade of industrial stone structures have brought equally significant growth in consumer goods, with a natural priority in diamond tools and abrasives, whose dynamics are mainly according the logic of domestic supplies, without neglecting the opportunities made possible by international exchange, compatibly with the necessary requirements of productivity, durability and safety.It is not a surprise, if in Europe the volume of technological goods exported is noticeably grown again in 2013, either for destinations to Union countries, or for what concerns the rest of the world (tab. 103), with main contributions of Germany and Italy. Similar considerations are applied to the import, although in this case the only growth of 2013 has been limited to the provenances from extra-European countries, eliding the decrease, however marginal, of supplies in the Community (tab. 104).The mid-term examination, for the last four years, highlights a steady increase of total European export, which reached about 1570 million, and focusing for two-thirds of the total in Germany, Italy and Austria (tab. 105).
On the opposite side, imports have registered frictional differences, with a turnover for the 2013 in the measure of about 1060 million, which equalled that of the previous year (tab. 106), with priority positions, once again, for purchases of Germany and Italy, but with remarkable extensions to all other countries, in accordance with their respective potential processing activities of marble and stone.There are cases of countries in which the exchange is quite limited, almost non-existent, but this fact does not mean that their processing activities have been reset, as it may seem considering the final balances of Cyprus, Malta or the Baltic States. On the contrary, it means that also in smaller realities there are the opportunities of domestic purchases and development, in accordance with their limited but consolidated needs.The disaggregated analysis of capital goods import shows that in this field, unlike what happened in the stone sector, the offensive of third countries, especially from Asia, has not achieved big results, either because the logic of local market typical of consumables, elides the long-range transports, or since the need to ensure the product quality translates into selective purchases by giving preference to materials able to offer guarantees traditionally competitive and more easily controllable, even regarding the opportunity to solve easily and functionally any possible commercial dispute.Considering the use of abrasive and diamond tools, like what happens to other complementary materials such as blades, mastics and similar, the behaviour of many buyers is determined by the different
attention for quality policies, and thus for the decrease, or rather for resetting of tolerances, which promotes an action basically greater than the exchange of capital goods when qualitative priorities prevail, in a service logic in favour of customers, on those more strictly economic. In this sense, it is natural that the foreign trade of consumables has more possibilities of expansion, as also happened in 2013, in European countries characterised by a greater attention to the problem of the total quality, which became really universal in stone sector too.
Image promotion and expansion
The success factors which are able to better enhance the positive economic trends, or elide the effects of negative ones, have an important role also in the stone sector, whose demand, of course not particularly strict, is more sensitive than other motivational elements, not excluding certain psychological reasons. Some of these factors, such as the product quality and its relationship with the price, are present in all sectors, and the marble and stone are not an exception, as highlighted by recent research investigations from Latin America, emphasizing the importance fully shared with the new materials policy, able to satisfy a wider range of aesthetic and new markets in order to prevent the risk always latent of saturation (tab. 107).An importance not so totalitarian seems to be reserved, however, to diversification, and especially to the image: this is a bottleneck
that the most advanced marketing theory cannot accept, but helps to explain some promotional delays still present in stone world system. A connection quite automatic must be underlined in the cooperation, and particularly in the investments, where a logical preference is belonging to an implementation of the productivity through innovation and technology, while a correct promotion effort would be considered indispensable by no more than a third of operators (tab. 108). It is logical to assume that the solution of these problems in a more systematic and modern key would be able to give greater impetus to the development of stone industry, still supported by extrapolation of historical series and forecasts of growth of world demand, which suggests the overcoming of 100 million tons, net of wastes, in the perspective of 2020, with consumption not far from two billion square meters equivalent (table 109). This development forecast has to be seen in a context of recovering the market share of stone, slow but continuous, even for the major competing materials, such as ceramic and vitrified stoneware (table 110).The presumption is further supported by the demographic growth forecasts in the medium and long term, according to which the world’s population should reach 8.2 billion people in 2025, and nine billion in 2050, with a large absolute majority in Asia (table 111). In fact, these increases will lead to a proportional increase in the construction industry, including quality, in particular regarding the finishing materials: hence, a specific input to the stone sector,

62 XXV Report World Marble and Stones 2014 Carlo Montani 63
even in the name of the promotion, not only on traditional markets, but also on new ones: among them, may be that important opportunities of development emerge, although in the long run, for those in Africa.In current terms, it is interesting to see how the share of the Asian population is equal to that of the stone market, and especially of consumption, although in per capita detail, as mentioned above, glaring disproportions are still remaining in the sector system. There are good reasons to avoid a dangerous promotional concentration in few developed countries, especially from the West, while considering the need for a correct protection of the sector employment, which is important in their economy too.The political will and the industrial choices must pay a special attention to these assessments, with a more necessary cooperation with finance and credit, indispensable to guarantee a better support for all types of investments, and with the labour union forces, equally useful in pursuing the objectives of growth, and obvious general utility.
World turnover
The last crucial parameter that needs a specific attention to regarding the balance sheet in the industry is turnover, whose propulsive role in view of further investments for the development is quite evident. Concerning that, the only available information is about the interchange able to assess the turnover of domestic markets, in light of estimates about internal
consumption in the various countries.In 2013, the foreign trade turnover has reached more than 22 billion dollars, with an increase of 14.9 percent over the previous year (table 112), and an active differential of about ten points against the already detected for the quantity: a flattering result with no doubts, confirming the good moment gained by the industry after the crisis of 2009. A decisive contribution came into this field by seven leading countries, with major implications, in order, to China, Italy, Turkey, India, Brazil, Spain and Portugal: so, with some significant difference compared with quantitative ranking, induced by different level of medium prices, and before that, from a different “mix” of production and deliveries that supports exporting countries of processed product, penalizing those most inclined to shipments of raw. In particular, it is necessary to underline the second place kept by Italian exporters, although with a lower difference on the Turkish and Indian values.Since 2001, the overall world turnover increase was more than four times on the initial level, with higher progressions in China, Brazil, India, and especially in Turkey, where its value is multiplied by ten, while in European countries the growth has been far more restrained (tab. 113). It follows that the market shares have been widening for the four non-European leader countries with a maximum increase in China, up from 17.4 percent in 2001 to 27.9 percent in 2013, while are particularly accentuated the drops of Italy and Spain, where the dimensions of export shares have been reduced by two thirds (table 114).According to the figures presented and
likely share of national consumption of internal materials, we have to stress that the total turnover of the sector must be placed in the order of 40 billion dollars: all that considering the natural increase of price for materials subjected to the international exchange, borne heavily on more incidences of transport and brokerages, and characterized by high levels of quality. The contribution of this turnover to the growth of marbles and stones in the world, including third countries, arrived to give about 30 percent of the total, underlining the important propulsive role of the development, first in the socio-economic field.The satellite industries, starting with that of machines and plants, has a very significant turnover: the available information in the world, concerning the specific interchange, allow a prudential evaluation for 2013 of about three billion dollars, a third of which has to be attributed to the Italian exports of mechanical plants and technologies. This is a value very important, both in absolute figure, whether in relationship to stone turnover, which in relation to exposed figures reaches 7.5 percent: an important investment share is emerging from these data, but not quite enough, especially in the mature economies, to cover the yearly official depreciations, and to make rational choices in view of a rapid, necessary technological progress.
Conclusion
The volume of marbles and stones processed in the contemporary world during the last
sixty years is higher than that of all previous usages that had succeeded for about 10 thousand years, ever since it was founded in Jericho, the first city where stone was used, as from its historical memory. The assumption, proposed by the Earth Sciences Department of Siena University (Italy), synthesizes incisively the most recent development, due to renewed confidence in the natural product from the most advanced design, but at the same time, such an unprecedented technical progress, and yet capable to enhance the qualities of creativity and imagination, typical of the sector work.It is an important starting point, from which to move further expansion strategies in priority care of political will, and at the same time, as an initiative of a modern entrepreneurial moment, always ready to face the risk of the stone industry, especially in the quarries, but still far from international reports of an effective cooperative cohesion. In fact, both globally and in the European context, the associative activities appear adapted to the good intentions, which have not followed, usually, by adequate investment and promotion initiatives.At a half-century since the advent of the diamond in the stone processing, and after twenty years from the general spread of the computerized numerical control, the times are really ready to give the industrial sector a new industrial dimension, capable of pursuing a great development, with a recovery of the great works that can co-exist with the artisan component, guardian of expressive and aesthetic values always modern. Our world needs a common awareness of the objectives and means, not

64 XXV Report World Marble and Stones 2014 Carlo Montani 65
only financial, indispensable to reach them, and before that, needs a real conviction of the irreversible nature acquired by globalization.The new great stone protagonists that belong not casually to the extra-European world, not without demanding adjustments, have understood the strategic role of marbles and stones, initiating and strengthening profitable collaborative relationships, although at an operational level. Elsewhere, there are similar examples, but it remains always evident the need to overcome the episodic and taper the preservation attempt, but understandably, more frequent in countries of major sector traditions, intended to reverse in the logic of the world market.The stone civilization, after having marked the essential moments of a long technical, economic and human growth, has all
the cards in order to preside over further successes, and first of all, that of a strong ecological compliance, far from punitive policies for the quarries, sawmills and workshops that occur in certain contexts, especially in the West, unable to understand how every site, since the time of stilts, has coincided with a change in aesthetics of environment. In this sense, programming efforts are needed to make awareness of choices, according to main national or regional interests, but considering, unless motivated exceptions, the priority for socio-economic problems and for manpower employment.The multiplier effect is just around the corner also for marble and stone, but it will be much more constructive and durable, as it will be supported by a genuine and effective cooperation.
Statistical instruments placed at the basis of the Report, like those used in previous editions, come from a complex spectrum research, based entirely on official sources regarding the interchange, while productions and consumptions are assessed in the light of reasoned estimates (in some cases with the active cooperation of local Subjects). This is in the context of homogeneous criteria for detection, processing and interpretation, in order to ensure the comparable character of data and their aggregations.The sources from which they are derived, with every possible update, as preparatory data of macro-economic character, are those of the main international Bodies, while the information on the construction situation in leading industrial Countries is of similar origin, with some control by Italian ANCE (National Association of Building Constructors) . With regard to quarrying production, Europe figures come from the processing of previous unofficial estimates of Eurostat source, calibrated according to the exchange of materials and technologies, while those of other leading countries, on the understanding that the form shown, have been usefully compared with ratings from USGS (Geological Service of the United States): in many cases the only available, in particular for some third world States. Production data for Brazil, object of a specific close examination in the special Dossier annexed to the Report (in the light of a propensity for development of stone which stands at the highest Western level) are homogeneous with those of previous Reports, subject to a collateral indication of major quarried quantity relating to materials for structural use, referred to surveys of the Brazilian Association of stone industry (Abirochas). The special nature of the document
is exhaustive with a series of exclusive detections about the international trade of technologies and capital goods, a comparison on the line of benchmark between medium prices of exported processed stones and the economic analysis of some competing products (ceramics and artificial stones).The overall volume of processed products has been evaluated on the basis of surveys that conform to historical ones, with the same coefficients relating to loss of production, despite assuming a gradual increase in average productivity linked to the recent technology optimizations: given the inability to perform an official process, the option for the formula most appropriate in terms of comparability was confirmed, by iterating the traditional share of loss at the rate of two fifths of the sawmill charge, net of the respective raw international exchange. The figures in quantities and values related to international traffic of the sector originate, according to competence and salvo exceptions, from statistical organization of the United Nations (Comtrade), and for the Europe of twenty-seven, Eurostat: in some cases, such as those relating to some Asian countries, with adjustments made necessary by the different calendar (concerning that, it is useful to add that the final balances of India, already from 2012, have been adjusted to the western system).As in previous years, given the importance of Chinese role in the world stone, and the decisive level of its shares in production, interchange and consumption, the final balance sheet of the import and export of this country were verified, through the collaboration of the ICE Office in Beijing, with customs data coming from the local Government source. For this reason, in some
Critical Appendix

66 XXV Report World Marble and Stones 2014 Carlo Montani 67
cases of significant difference in the crossings of the interchange, the Chinese datum has been object of motivated preference.We have to underline that, in the case of China, there were significant discrepancies with the data subject of intersection in the input-output model: this, in particular for the import of calcareous and siliceous raw, where the Chinese customs final balance was lower of about a quarter, which resulted in the need for a proportional increase of desk coordination. Since we have excluded that this phenomenon is attributable to errors of classification, it is not risky to presume the origin in accounting factors linked to the payment module of supplies.The values must be considered as complementary, especially in long-term rating, while the quantity datum allows homogeneous comparisons and consequent strategic evaluations not influenced by exchange problems and extra charges.On the basis of an established standard procedure, sometimes substantial volumes of current materials for structural use, that in some situations reach high levels but with a low unit value have been erased from handling flows, and from the same production estimates: once again, the most significant cases concern China, Croatia, Denmark, Indonesia, Malaysia, Norway, Pakistan, and with regard to the consumption, Netherlands, United Kingdom and Singapore, in addition to several African and Asian reality. Similarly, in surveys concerning Italy, unlike the standard procedure followed in other sources, the preference decided was to pay no consideration to the figures concerning the by-products (granules and powders), which especially in export have a strong quantitative importance but a marginal currency supply, as to final turnover.The final balances of EU aggregates do not include Croatia, since its entry into the European Community took place on July 2013.The standard model in the detection of the
stone trade, more important because it affects the majority of the world turnover, remains, as in all previous Reports, the input-output system. Significant problems of processing, interpretation and data adjustment concerning the traditional four-digit codes (raw calcareous, raw siliceous, simple processed products, value-added products, processed slate) remain always: except as reported about Chinese raw imports, not uncommon in cases of appreciable tours, in line of historic homogeneity, the datum of greater reliability was considered as a natural priority.In the original classifications of the finished product, and in some cases even of raw, like in those corresponding of India and South Africa, there are references with a not homogeneous character supported by average values: which made it possible to make the necessary corrections, on understanding that the overall figure of volumes traded by reference country. The phenomenon demanded some adjustments also in the cases, sometimes marginal, of large excursions from one year to another.Not entirely negligible differences can exist in final value balances that refer to an interchange flows between an exporter and another importer country: in this regard, some cases are still detectable in Chinese raw import against the corresponding calcareous export from Turkey and Egypt, or the siliceous one from India and Brazil, on understanding the respect of the basic evolution trends as part of a growing trend. The main reason of these excursions can be referred to the customs different value or to lacks in the attribution of customs reference code. Confirming the greater comparative consistency of data in volume, in the case of value excursions among the leader countries correspondent data, which are mentioned in the texts and in the statistical documents, the original information was maintained unchanged, showing the difference.The dossiers of greater sector countries,
proposed at the end of the Report with the historical synthesis of the essential variables of production, interchange and consumption, conform to the model used in the previous volumes. Concerning that, the most significant abstraction involves, since the first report of 1990, sawing and processing wastes.In the absence of reliable references, these wastes were hired in a unitary percentage share coming from historical experiences, resulting in an overstatement of the product in favour of the less developed countries where the share of waste is likely higher; that is, than some underestimation may be made in the case of those characterized by competitive levels of productivity or by the major presence of simple processed products, where the gap is lower. However, the matter involves contained excursions that do not invalidate the synthesis evaluation which emerges from the country files.The use of input-output system for technologies, and in particular for machines, plants and capital goods, does not appear feasible, especially since in many countries the quantitative units have no homogeneous character, as they are related to the number of machines or tools rather than by weight. In any case, the number of monitored countries, including the supervision of those smaller ones, was the subject of an useful comparative enhancement in order to expand the survey also for these typologies. Given the safe stay of a significant Italian leadership in the stone-mechanical field, a new statistical information about its market share in sector advanced countries was introduced in the Report.The contribution of third band countries having significant relevance but complementary, is
reported globally in the traditional aggregate definition of “others”: this, by iterating the conventional increases applied to the subtotal of countries detected singularly in the input-output models. These increases, which had reached previously, salvo exceptions, three per cent of the same subtotal, have been reviewed in the light of the increasing handling among third countries: on the average, new rates have been elevated at five percent, except for slate, where the module applied in the previous Reports remained unchanged.The monitored countries in the corresponding quantitative international exchange of 2013 are now 108, exceeding the previous maximum already acquired in the Report for 2012, with some important new entry in the third world, including Jordan, Palestine and Togo, on understanding the presence of all the leading protagonists, object of exhaustive detection both in the short and in the long run.With regard to macro-economic data, it is finally useful point out that the balances concerning the gross domestic product were taken from information available at the time when the text was closed (half May 2014): therefore, the figures presented are subject to some variation, however marginal, compared with official correction made in latter times by the respective countries Governments, or competent economic institutions. As regards the organisational and legal issues of the work, mainly concerning the child labour in the quarries and the perspectives of sector international cooperation, also at associative level, given the lack of important innovative facts, are always valid the previous
Reports.

Documentazionestatistica
Statistical tables
La documentazione statistica è stata chiusa in base ai dati disponibilidalle varie fonti a tutto il 16 maggio 2014.
Statistical tables are closed according to data available on 2014 May 16th.
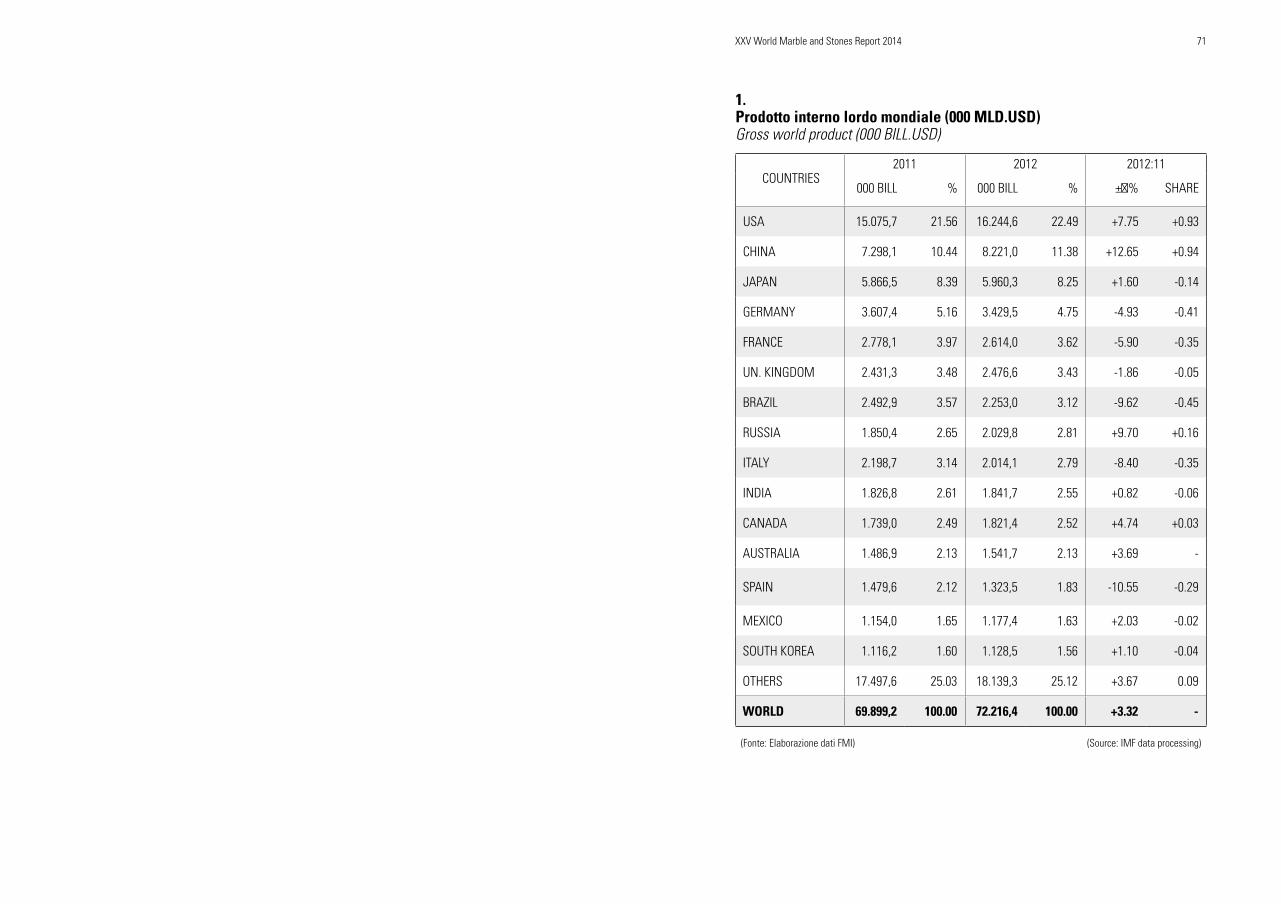
XXV World Marble and Stones Report 2014 71
1.Prodotto interno lordo mondiale (000 MLD.USD)Gross world product (000 BILL.USD)
COUNTRIES2011 2012 2012:11
000 BILL % 000 BILL % ±∆% SHARE
USA 15.075,7 21.56 16.244,6 22.49 +7.75 +0.93
CHINA 7.298,1 10.44 8.221,0 11.38 +12.65 +0.94
JAPAN 5.866,5 8.39 5.960,3 8.25 +1.60 -0.14
GERMANY 3.607,4 5.16 3.429,5 4.75 -4.93 -0.41
FRANCE 2.778,1 3.97 2.614,0 3.62 -5.90 -0.35
UN. KINGDOM 2.431,3 3.48 2.476,6 3.43 -1.86 -0.05
BRAZIL 2.492,9 3.57 2.253,0 3.12 -9.62 -0.45
RUSSIA 1.850,4 2.65 2.029,8 2.81 +9.70 +0.16
ITALY 2.198,7 3.14 2.014,1 2.79 -8.40 -0.35
INDIA 1.826,8 2.61 1.841,7 2.55 +0.82 -0.06
CANADA 1.739,0 2.49 1.821,4 2.52 +4.74 +0.03
AUSTRALIA 1.486,9 2.13 1.541,7 2.13 +3.69 -
SPAIN 1.479,6 2.12 1.323,5 1.83 -10.55 -0.29
MEXICO 1.154,0 1.65 1.177,4 1.63 +2.03 -0.02
SOUTH KOREA 1.116,2 1.60 1.128,5 1.56 +1.10 -0.04
OTHERS 17.497,6 25.03 18.139,3 25.12 +3.67 0.09
WORLD 69.899,2 100.00 72.216,4 100.00 +3.32 -
(Fonte: Elaborazione dati FMI) (Source: IMF data processing)

72 XXV Rapporto Marmo e Pietre nel Mondo 2014 XXV World Marble and Stones Report 2014 73
2.Attività edilizia residenziale nel mondo (medie mensili x 1000 abitazioni)Residential building in the world (monthly average x 1000 dwellings)
YEAR
Chin
a
USA
Japa
n
Russ
ia
Spai
n
Turk
ey
Fran
ce
Pola
nd
Germ
any
Aust
ralia
Portu
gal
Sout
h Ko
rea
Tota
l
‘00 ... 157 109 31 30,6 20,1 29,4 7,3 35,2 13,2 9,3 3,6 ...
‘01 ... 157 104 32 30,5 20,3 27,5 8,8 24,2 10,2 9,4 6,2 ...
‘02 ... 165 102 33 35,0 13,5 26,0 8,1 20,7 12,1 10,2 7,5 ...
‘03 ... 168 102 36 38,1 13,2 27,2 13,6 22,3 12,7 7,2 5,2 ...
‘04 289 184 104 40 41,4 13,6 31,1 9,1 19,7 13,5 5,2 3,8 754,4
‘05 333 161 108 43 43,7 20,1 34,9 9,5 17,6 13,7 5,2 3,2 792,9
‘06 360 165 112 51 48,7 20,6 36,1 9,6 18,0 12,1 4,5 4,4 842,0
‘07 396 125 83 60 53,4 25,7 36,4 11,1 13,1 12,7 6,0 6,1 828,5
‘08 398 93 95 64 51,2 41,9 30,7 13,8 12,6 12,1 6,1 6,4 824,8
‘09 481 66 63 58 33,1 32,4 29,2 12,7 12,5 11,6 7,1 6,1 809,7
‘10 368 55 67 60 19,3 28,8 28,4 9,3 13,8 10,7 4,7 5,2 656,2
‘11 399 48 69 47 14,1 39,5 32,8 10,1 16,7 12,5 3,5 8,1 700,3
‘12 325 53 73 48 7,6 43,9 28,1 11,3 15,8 12,2 2,1 8,5 627,9
‘13 322 60 80 57 6,5 53,7 27,4 11,7 22,2 11,4 1,7 7,8 660,4
(Fonte: ONU Monthly Bulletin) (Source: UNO Monthly Bulletin)
3.Attività edilizia residenziale nel mondo (indici 2004=100)Residential building in the world (index 2004=100)
YEAR
Chin
a
USA
Japa
n
Russ
ia
Spai
n
Turk
ey
Fran
ce
Pola
nd
Germ
any
Aust
ralia
Portu
gal
Sout
h Ko
rea
Tota
l
‘00 ... 85,3 104,8 77,5 73,9 147,8 94,5 80,2 178,7 97,8 178,8 94,7 ...
‘01 ... 85,3 100,0 80,0 73,7 749,3 88,4 96,7 122,8 75,6 180,8 163,2 ...
‘02 ... 89,7 98,1 82,5 84,5 99,3 83,6 89,0 105,1 89,6 196,2 197,4 ...
‘03 ... 91,3 98,1 90,0 92,0 97,1 87,5 149,5 113,2 94,1 138,5 136,8 ...
‘04 100,0 100,0 100,0 100,0 100,0 100,0 100,0 100,0 100,0 100,0 100,0 100,0 100,0
‘05 115,2 87,5 103,8 107,5 105,6 147,8 112,2 104,4 89,3 101,5 100,0 84,2 105,1
‘06 124,6 89,7 107,7 127,5 117,6 152,9 116,1 105,5 91,4 89,6 86,6 115,8 111,6
‘07 137,0 67,9 79,8 150,0 129,0 189,0 117,0 122,0 66,5 94,1 115,4 160,5 109,8
‘08 137,7 50,5 91,3 160,0 123,7 308,1 98,7 151,6 64,0 89,6 117,3 168,4 109,3
‘09 166,4 35,9 60,6 145,0 80,0 238,2 84,2 139,6 63,5 85,9 136,5 160,5 107,3
‘10 127,3 29,9 64,4 150,0 46,6 175,0 91,3 102,2 70,1 79,3 90,4 136,9 87,0
‘11 138,1 26,1 66,3 117,5 34,1 290,4 105,4 110,9 84,8 92,6 67,3 213,2 92,8
‘12 112,5 28.8 70.2 120.0 18.4 322.8 90.4 124.2 80.2 90.4 40.4 223.7 83.2
‘13 111,4 32,6 76,9 142,5 15,6 394,9 88,1 128,1 112,8 84,4 32,7 205,3 87,5
(Fonte: Elaborazione dati ONU) (Source: UNO data processing)

74 XXV Rapporto Marmo e Pietre nel Mondo 2014 XXV World Marble and Stones Report 2014 75
4.Attività edilizia residenziale nel mondo (2012-13)Residential building in the world (2012-13)
COUNTRIES000 DWELLINGS SHARES
2012 2013 2012 2013 2013:12
CHINA 3.900 3.860 51.7 48,8 -3.0
JAPAN 876 958 11.6 12.0 +0.4
INDIA 636 720 8.4 9.1 +0.7
RUSSIA 576 680 7.6 8.6 +1.0
TURKEY 527 644 7.0 8.1 +1.1
FRANCE 337 328 4.5 4.1 -0.4
GERMANY 190 267 2.5 3.4 +0.9
POLAND 136 140 1.8 1.8 -
AUSTRALIA 146 137 1.,9 1.7 -0.2
SOUTH KOREA 102 93 1.4 1.2 -0.2
SPAIN 91 78 1.2 1.0 -0.2
PORTUGAL 25 20 0.3 0.3 -
SUB-TOTAL 7.542 7.925 100.0 100.0 -
(Fonte: Elaborazione dati ONU) (Source: UNO data processing)
5. Industria lapidea mondiale: produzione nettaWorld stone industry: net production
PAR. YEAR GROSS QUARRYING
QUARRYING WASTE 1
RAW PRODUCTION
PROCESSING WASTE 1
PROCESSED PRODUCTION
000
tons
2003 153.750 78.750 75.000 30.750 44.250
2004 166.500 85.250 81.250 33.300 47.950
2005 174.750 89.500 85.250 34.950 50.300
2006 190.250 87.500 92.750 38.000 54.750
2007 212.000 108.500 103.500 42.500 61.000
2008 215.000 110.000 105.000 43.000 62.000
2009 213.750 100.250 104.500 42.850 61.650
2010 228.000 116.500 111.500 45.715 65.785
2011 237.200 121.200 116.000 47.560 68.440
2012 252.500 129.000 123.500 50.630 72.870
2013 265.800 135.800 130.000 53.300 76.700
000
cub.
mt.
2003 57.000 29.200 27.800 11.400 16.400
2004 61.650 31.550 30.100 12.300 17.800
2005 64.750 33.150 31.600 12.950 18.850
2006 70.450 36.100 34.350 14.100 20.250
2007 78.500 40.200 38.300 15.750 22.550
2008 79.600 40.700 38.900 15.950 22.950
2009 79.150 40.450 38.700 15.900 22.300
2010 84.450 43.150 41.300 12.350 28.950
2011 87.850 44.900 42.950 17.600 25.350
2012 93.500 47.800 45.700 18.700 27.000
2013 98.450 50.300 48.150 19.750 28.400
(Fonte: Elaborazione propria)
(1) - Compresi materiali di risulta destinati a sottoprodotti (granulati e polveri)
(Source: own data processing)
(1) - Waste material destined for granules, powders and similar uses is included

76 XXV Rapporto Marmo e Pietre nel Mondo 2014 XXV World Marble and Stones Report 2014 77
6.Industria lapidea mondiale: produzione storicaWorld stone industry: historical production outline
YEARSCALCAREOUS SILICEOUS OTHER TOTAL
000 tons % 000 tons % 000 tons % 000 tons %
1926 1.175 65.6 175 3.3 440 24.6 1.790 10.1
1976 13.600 76.4 3.400 19.1 800 4.5 17.800 100.0
1986 13.130 60.5 7.380 34.0 1.190 5.5 21.700 122.0
1990 26.450 56.8 17.625 37.9 2.425 5.2 46.500 261.2
1997 27.650 55.8 19.350 39.1 2.500 5.1 49.500 278.0
1998 29.400 57.6 19.000 37.3 2.600 5.1 51.000 286.5
1999 31.300 57.4 20.350 37.3 2.850 5.3 54.500 306.2
2000 34.500 57.3 21.700 36.3 3.450 5.9 59.650 335.1
2001 38.500 53.2 23.250 35.8 3.250 5.0 65.000 365.2
2002 39.000 57.8 25.000 37.0 3.500 5.2 67.500 379.2
2003 42.500 56.7 28.500 38.0 4.000 5.3 75.000 421.3
2004 43.750 53.9 33.000 40.6 4.500 5.5 81.250 456.5
2005 46.750 34.8 34.000 39.9 4.500 5.3 85.250 478.9
2006 53.350 37.5 34.300 37.5 4.600 5.0 92.750 521.1
2007 60.500 58.5 37.500 36.2 5.500 5.3 103.500 581.5
2008 62.000 58.0 38.000 36.5 5.700 5.5 105.000 589.9
2009 60.350 58.2 38.000 36.4 5.650 5.4 104.500 587.0
2010 63.230 58.5 40.500 36.3 5.750 5.2 111.500 626.4
2011 68.500 59.0 41.700 36.0 5.800 5.0 116.000 651.6
2012 72.250 58.5 45.750 37.0 5.500 4.5 123.500 693.8
2013 76.750 59.0 47.500 36.5 5.750 4.5 130.000 751.4
(Fonte: Elaborazione propria) (Source: own data processing)
7.Produzione mondiale e rese teoriche (2013)World quarrying production and theorical yield (2013)
ZONES000 tons mill. eq. sq. mt. / cm. 2
abs. figures shares total waste net
EU/27 22.000 16.9 407 167 240
OTHERS EUROPE 3.000 2.3 53 22 31
SUB-TOTAL 25.000 19.2 460 189 271
NORTH AMERICA 4.500 3.5 85 35 50
LATIN AMERICA 13.500 10.4 250 100 150
SUB-TOTAL 18.000 13.9 335 135 200
CHINA 39.500 30.4 730 300 430
INDIA 19.500 15.0 360 148 212
OTHERS ASIA 20.000 15.4 370 152 218
SUB-TOTAL 79.000 60.0 1.460 600 860
AFRICA 7.500 5.7 140 57 83
OCEANIA 500 0.4 10 4 6
WORLD 130.000 100.0 2.405 985 1.420
(Fonte: Elaborazione propria) (Source: own data processing)

78 XXV Rapporto Marmo e Pietre nel Mondo 2014 XXV World Marble and Stones Report 2014 79
8.Maggiori produzioni mondiali e rese teoriche (2013)Leading quarry production and theorical yield (2013)
COUNTRIES1996 2013 2013/96
000 tons shares 000 tons shares index
CHINA 7.500 16.1 39.500 30.4 526.7
INDIA 3.500 7.5 19.500 15.0 557.1
TURKEY 900 1.9 12.000 9.2 1333.0
BRAZIL 1.900 4.1 9.000 6.9 473.7
ITALY 8.250 17.7 7.000 5.4 84.8
IRAN 2.500 5.4 6.500 5.0 260.0
SPAIN 4.250 9.1 5.000 3.8 117.6
EGYPT 1.000 2.2 3.000 2.3 300.0
USA 1.350 2.9 2.750 2.1 203.7
PORTUGAL 1.950 4.2 2.650 2.0 135.9
GREECE 1.800 3.9 1.250 1.0 69.4
SAUDI ARABIA 250 0.5 1.200 0.9 480.0
FRANCE 1.150 2.5 1.050 0.8 91.3
PAKISTAN 200 0.4 1.000 0.8 500.0
SUB-TOTAL 36.500 78.5 111.400 85.7 305.2
OTHERS 10.000 21.5 18.600 14.3 186.0
WORLD 46.500 100.0 130.000 100.0 279.6
(Fonte: Elaborazione propria) (Source: own data processing)
9.Unione Europea: produzione di cava (000 tonn)European Union: quarrying production (000 tons)
COUNTRIES
QUANTITY SHARES
2001 2010 2011 2012 2013 2001 2013
AUSTRIA 400 450 400 350 400 1,7 1.8
BELGIUM 900 800 850 800 800 3,8 3.6
BULGARIA 200 250 250 250 250 0,8 1.1
CZECH REP. 500 200 150 150 200 2,1 0.9
FINLAND 600 600 650 600 600 2,5 2.7
FRANCE 1.250 1.150 1.250 1.100 1.050 5,2 4.6
GERMANY 700 650 750 650 700 2,9 3.2
GREECE 1.600 1.650 1.500 1.400 1.250 6,7 5.7
IRELAND 100 150 100 100 100 0,4 0.4
ITALY 8.400 7.800 7.500 7.250 7.000 35,0 31.8
POLAND 600 650 600 550 550 2,5 2.5
PORTUGAL 2.400 2.750 2.650 2.750 2.650 10,0 12.0
ROMANIA 100 200 150 150 150 0,4 0.7
SLOVAKIA 150 50 50 50 100 0,6 0.4
SLOVENIA 50 150 200 250 250 0,2 1.1
SPAIN 5.000 5.750 5.500 5.250 5.000 20,8 22.7
SWEDEN 350 350 250 200 200 1,5 0.9
UN.KINGDOM 200 300 300 250 300 0,8 1.4
OTHERS 400 350 400 400 450 1,7 2.0
TOTAL EU-27 24.000 24.250 23.500 22.500 22.000 100,0 100.0
(Fonte: Elaborazione propria) (Source: own data processing)

80 XXV Rapporto Marmo e Pietre nel Mondo 2014 XXV World Marble and Stones Report 2014 81
10.Italia: produzioni regionali di cava (2013)Italy: local quarrying stone production (2013)
COUNTRIES
ABS. FIGURES SHARES
000 tons mill. sq.mt/2
Production Export
PIEMONTE-VAL D’AOSTA 500 5.450 7.2 3.1
LOMBARDIA 550 6.000 7.9 9.0
LIGURIA 50 550 0.7 1,5
TRENTINO-ALTO ADIGE 750 8.200 10.7 4.3
VENETO 350 3.850 5.0 32.9
FRIULI-VENEZIA GIULIA 50 550 0.7 2.3
TOSCANA 1.750 19.100 25.0 32.8
MARCHE 100 1.100 1.4 1.2
LAZIO 1.200 13.100 17.2 2.4
CAMPANIA 200 2.200 2.8 1.1
PUGLIE 400 4.400 5.6 1.3
SICILIA 500 5.450 7.2 6.1
SARDEGNA 500 5.450 7.2 0.3
ALTRE 100 1.100 1.4 1.7
TOTALE 7.000 76.500 100.0 100.0
(Fonte: Elaborazione propria) (Source: own data processing)
11.Industria lapidea mondiale: produzione netta di lavorati e principali applicazioni del manufattoWorld stone industry: net finished production and main uses of processed material
Applications
‘000 sq. m/2 ‘000 net tons % Index
‘95 ‘13 ‘95 ‘13 ‘95 ‘13
PavimentiFloors and paving 175.750 454.400 9.500 24.500 38.0 32.0 258.5
Rivestimenti esterniExternal wall cladding 55.500 113.600 3.000 6.150 12.0 8.0 204.7
ScaleSteps 18.500 42.600 1.000 2.300 4.0 3.0 230.3
Rivestimenti interniInternal wall cladding 27.750 170.400 1.500 9.200 6.0 12.0 614.1
Lavori specialiSpecial works 46.250 284.000 2.500 15.350 10.0 20.0 614.8
Subtotale ediliziaSubtotal building 323.750 1.065.000 17.500 57.500 70.0 75.0 329.0
Arredo urbanoCivil external uses 46.250 71.000 2.500 3.850 10.0 5.0 153.5
Arte funerariaMemorial art 69.375 227.200 3.750 12.300 15.0 16.0 327.5
Altri impieghiOther uses 23.125 56.800 1.250 3.100 5.0 4.0 245.6
Subtotale usi diversiSubtotal other uses 183.750 355.000 7.500 19.250 30.0 25.0 193.2
TOTAL 462.500 1.420.000 25.000 76.750 100.0 100.0 307.0
(Fonte: Elaborazione propria) (Source: own data processing)

82 XXV Rapporto Marmo e Pietre nel Mondo 2014 XXV World Marble and Stones Report 2014 83
12.
Inpu
t-O
utpu
t del
l’int
ersc
ambi
o qu
antit
ativ
o ‘1
3 (‘0
00 to
nn.):
cal
care
i gre
zzi (
cod.
25.
15)
Inpu
t-Out
put o
f qua
ntity
trad
e ‘1
3 (‘0
00 to
ns):
raw
calca
reou
s pro
duct
s (co
de 2
5.15
)
IMPO
RTItaly
Germany
France
Spain
Portugal
Belgium
Netherlands
Un.Kingdom
Austria
Switzerland
S.Arabia
Jordan
Lebanon
India
Singapore
Hong-Kong
Taiwan
China
South Korea
Japan
Canada
USA
Others
Total
EXPO
RT
Italy
-2
48
525
04
11
1256
4532
03
1545
443
11
11
423
1416
Germ
any
0-
72
00
30
039
00
00
00
012
60
00
016
263
Fran
ce8
1-
01
20
10
80
00
00
00
90
00
03
33
Spai
n8
08
-4
00
10
061
315
00
790
920
02
00
242
1343
Portu
gal
129
1521
17-
00
40
03
01
00
68
421
21
01
1953
8
Belg
ium
30
180
0-
00
00
00
00
00
00
00
00
122
Gree
ce4
10
00
00
00
00
51
30
910
476
01
00
133
643
Turk
ey34
50
93
00
00
04
7421
153
023
9548
812
10
739
457
06
Egyp
t40
01
10
00
00
01
148
340
00
1849
00
00
135
2110
Indi
a14
03
10
00
00
00
03
-0
256
931
03
089
238
Iran
120
00
00
00
00
10
111
00
053
60
00
020
581
Chin
a6
11
00
10
10
00
01
62
562
-1
05
09
101
USA
10
00
00
00
00
00
00
00
00
00
32-
437
Mex
ico
50
01
00
00
00
00
00
00
072
00
03
586
Braz
il6
00
00
00
00
00
00
00
01
40
00
01
12
Othe
rs16
029
651
51
83
131
2426
2082
102
1591
81
21
143
518
41
TOTA
L32
054
128
4018
2811
142
7910
616
515
660
915
164
242
1081
88
842
1319
2914
970
(Fon
te: E
labo
razio
ne p
ropr
ia)
(Sou
rce:
ow
n da
ta p
roce
ssin
g)
13.
Inpu
t-O
utpu
t del
l’int
ersc
ambi
o qu
antit
ativ
o ‘1
3 (‘0
00 to
nn.):
sili
cei g
rezz
i (co
d. 2
5.16
)In
put-O
utpu
t of q
uant
ity tr
ade
‘13
(‘000
tons
): ra
w si
liceu
os p
rodu
cts (
code
25.
16)
IMPO
RT
Italy
Germany
France
Spain
Portugal
Belgium
Netherlands
Un.Kingdom
Austria
Switzerland
S.Arabia
Singapore
Hong-Kong
Taiwan
China
South Korea
Japan
Canada
USA
Australia
Others
Total
EXPO
RT
Italy
-28
245
83
1311
423
01
25
131
01
20
815
2
Germ
any
0-
20
03
470
539
00
00
00
00
00
2111
7
Fran
ce11
10-
10
10
00
50
00
00
00
00
016
44
Spai
n29
441
-13
10
02
08
10
06
21
10
00
3125
7
Portu
gal
719
4415
9-
20
10
00
00
011
00
10
00
935
2
Belg
ium
044
390
0-
51
00
00
00
00
00
00
2511
4
Net
herla
nds
07
00
018
-0
00
00
00
00
00
00
227
Nor
way
256
611
10
011
00
00
08
167
00
01
050
277
Swed
en4
92
00
00
00
00
00
04
00
00
019
521
4
Finl
and
202
15
00
00
00
00
24
294
00
00
051
379
Sout
h Af
rica
650
1418
031
00
00
00
012
410
03
70
625
1
Indi
a13
28
2625
010
316
300
22
111
016
146
9611
416
51
1307
6656
Chin
a3
113
10
1014
940
00
256
598
-13
114
94
5986
5
Cana
da2
00
00
00
00
00
00
620
00
-21
06
55
USA
160
01
01
00
00
00
10
470
039
-0
310
8
Braz
il13
41
813
07
00
00
00
4813
610
220
01
00
3914
09
Othe
rs21
856
105
863
411
207
922
252
118
228
82
461
2234
764
2241
TOTA
L66
620
531
532
514
322
096
170
1616
95
279
170
1112
6704
2821
125
6739
2646
1313
6(F
onte
: Ela
bora
zione
pro
pria
)(S
ourc
e: o
wn
data
pro
cess
ing)

84 XXV Rapporto Marmo e Pietre nel Mondo 2014 XXV World Marble and Stones Report 2014 85
14.
Inpu
t-O
utpu
t del
l’int
ersc
ambi
o qu
antit
ativ
o ‘1
3 (‘0
00 to
nn.):
lavo
rati
sem
plic
i (co
d. 6
8.01
)In
put-O
utpu
t of q
uant
ity tr
ade
‘13
(‘000
tons
): sim
ple
finish
ed p
rodu
cts (
code
68.
01)
IMPO
RT
Italy
Germany
France
Spain
Portugal
Belgium
Netherlands
Un.Kingdom
Austria
Switzerland
Hong-Kong
Taiwan
China
South Korea
Japan
Canada
USA
Others
Total
EXPO
RT
Italy
-33
321
00
30
625
00
00
10
135
137
Germ
any
1-
530
05
20
1052
00
00
10
019
143
Fran
ce1
10-
00
10
00
80
00
00
00
424
Spai
n1
27
-0
10
00
10
00
00
00
820
Portu
gal
411
510
53
022
2421
08
00
10
00
083
386
Belg
ium
138
510
0-
340
00
00
10
00
01
126
Net
herla
nds
03
10
030
-10
00
00
00
00
00
44
Czec
h Re
p.0
720
00
00
014
00
00
00
00
187
Pola
nd0
290
00
00
00
00
00
00
00
1645
Turk
ey2
01
00
00
00
00
00
00
00
1114
Indi
a5
2350
00
461
361
00
00
05
611
62
291
Chin
a42
415
705
010
161
5043
03
35-
1610
912
713
411
03
Cana
da0
00
00
00
00
00
00
00
-3
03
USA
00
00
00
00
00
00
00
03
-0
3
Braz
il12
66
00
11
01
00
00
08
00
540
Othe
rs4
3272
21
2517
021
20
70
5202
52
920
948
0
TOTA
L73
778
448
111
232
143
117
9696
342
268
149
2313
652
829
46
(Fon
te: E
labo
razio
ne p
ropr
ia)
(Sou
rce:
ow
n da
ta p
roce
ssin
g)
15.
Inpu
t-O
utpu
t del
l’int
ersc
ambi
o qu
antit
ativ
o ‘1
3 (‘0
00 to
nn.):
lavo
rati
spec
iali
(cod
. 68.
02)
Inpu
t-Out
put o
f qua
ntity
trad
e ‘1
3 (‘0
00 to
ns):
spec
ial p
roce
ssed
pro
duct
s (co
de 6
8.02
)
IMPO
RT
Italy
Germany
France
Spain
Portugal
Belgium
Netherlands
Un.Kingdom
Austria
Switzerland
S. Arabia
Kuwait
Lebanon
India
Singapore
Hong-Kong
Taiwan
China
South Korea
Japan
Canada
USA
Australia
Others
Total
EXPO
RT
Italy
-10
632
53
134
1431
9915
545
1119
1316
376
124
5928
214
492
1508
Germ
any
1-
53
06
41
1626
11
01
00
01
10
25
030
104
Fran
ce27
16-
20
122
43
120
00
00
00
11
01
100
1410
5
Spai
n11
1263
-14
43
223
528
63
02
20
145
14
783
392
675
Portu
gal
323
9232
-9
519
47
802
73
11
05
42
213
169
396
Belg
ium
161
212
2-
384
00
00
00
00
00
00
00
034
163
Gree
ce3
30
10
01
01
016
31
514
11
54
13
130
116
192
Turk
ey8
3589
110
910
5614
122
316
185
150
013
70
4751
545
971
2108
Egyp
t4
28
30
20
70
074
386
00
00
34
00
120
9029
8
Indi
a47
8226
81
4833
110
51
5115
24-
611
683
810
8233
718
968
1980
Iran
21
00
00
00
00
10
20
00
51
00
00
494
110
Taiw
an0
00
00
00
00
00
00
00
0-
10
24
260
236
Chin
a60
439
6520
118
851
5071
032
692
5564
8920
424
1-
2289
760
101
680
9336
4895
87
Cana
da0
00
00
20
00
00
00
00
00
00
0-
114
052
168
USA
31
00
00
01
00
00
00
00
23
47
265
-0
2631
2
Mex
ico
00
00
00
00
00
00
00
00
00
00
282
04
88
Braz
il3
81
21
21
30
01
00
20
00
20
1037
926
013
311
32
Othe
rs31
116
13
198
178
215
516
5285
7440
115
1048
517
095
973
521
56
TOTA
L20
479
041
890
2549
316
929
916
915
614
7223
529
217
318
023
727
321
823
8780
277
931
8818
778
7021
118
(Fon
te: E
labo
razio
ne p
ropr
ia)
(Sou
rce:
ow
n da
ta p
roce
ssin
g)

86 XXV Rapporto Marmo e Pietre nel Mondo 2014 XXV World Marble and Stones Report 2014 87
16.
Inpu
t-O
utpu
t del
l’int
ersc
ambi
o qu
antit
ativ
o ‘1
3 (‘0
00 to
nn.):
Ard
esia
(cod
. 68.
03)
Inpu
t-Out
put o
f qua
ntity
trad
e ‘1
3 (‘0
00 to
ns):
slate
(cod
e 68
.03)
IMPO
RT
Italy
Germany
France
Spain
Belgium
Netherlands
Un.Kingdom
Switzerland
Singapore
Hong-Kong
Taiwan
China
South Korea
Japan
Canada
USA
Australia
Others
Total
EXPO
RT
Italy
-0
20
00
41
00
00
00
02
01
10
Germ
any
0-
100
00
00
00
00
00
00
01
11
Fran
ce0
0-
10
00
10
00
00
00
10
03
Spai
n2
7218
9-
202
120
10
00
00
00
61
4045
3
Portu
gal
02
64
00
00
00
00
00
00
01
13
Belg
ium
04
10
-0
10
00
00
00
00
04
10
Nor
way
01
00
00
10
00
00
00
00
08
10
Turk
ey0
00
00
00
00
00
00
00
00
22
Indi
a0
11
10
02
00
00
01
01
340
142
Chin
a8
102
135
417
01
15
-2
107
628
271
426
Cana
da0
03
03
04
00
00
00
0-
60
420
USA
00
00
00
010
00
00
00
5-
01
7
Braz
il3
82
45
730
10
00
00
02
151
2510
3
Othe
rs2
02
11
06
41
10
20
20
22
3460
TOTA
L15
9821
824
3413
186
82
25
23
1215
128
1239
311
70
(Fon
te: E
labo
razio
ne p
ropr
ia)
(Sou
rce:
ow
n da
ta p
roce
ssin
g)
17.
Indu
stri
a la
pide
a m
ondi
ale:
and
amen
to s
tori
co e
tipo
logi
e de
ll’in
ters
cam
bio
Wor
ld st
one
indu
stry
: hist
orica
l out
line
and
type
s of i
mpo
rt-ex
port
1994
2000
2005
2010
2011
2012
2013
CODE
S00
0to
ns%
000
tons
%00
0to
ns%
000
tons
%00
0to
ns%
000
tons
%00
0to
ns%
GREZZI/RAW
25.15
1.39
09.
23.
071
13.5
6.26
517
.413
.334
27.5
13.8
1227
.914
.590
28.1
14.9
7028
.1
25.16
6.35
642
.17.
754
34.1
10.2
6628
.410
.531
21.7
10.9
4522
.112
.576
24.2
13.1
3624
.6
TOTA
L7.
746
51.3
10.8
2547
.616
.531
45.8
23.8
6549
.224
.757
50.0
27.1
6652
.328
.106
52.7
Mill.
eq. s
q. mt
.84
.5(3
4.8)
118.
1(3
4.9)
180.
4(3
3.3)
260.
5(3
6.4)
270.
2(3
7.1)
296.
5(3
9.4)
306.
839
.7
LAVORATI/PROCESSED
68.01
1.72
711
.42.
995
13.2
3.68
910
.23.
301
6.8
3.41
56.
93.
145
6.1
2.94
65.
5
68.02
5.02
933
.47.
845
34.5
14.5
8240
.520
.026
41.3
20.1
2440
.620
.306
39.1
21.1
1839
.6
68.03
581
3.9
1.08
64.
71.
256
3.5
1.30
62.
71.
254
2.5
1.25
12.
51.
170
2.2
TOTA
L7.
337
48.7
11.9
2652
.419
.527
54.2
24.6
3350
.824
.793
50.0
24.7
0247
.725
.234
47.3
Mill.
eq. s
q. mt
.13
5.7
(61.
6)22
0,6
(65.
1)36
1.2
(66.
7)45
5.7
(63.
6)45
8.7
(62.
9)45
7,0
(60.
6)44
6.8
60.3
GENE
RAL T
OTAL
15.0
8310
0.0
22.7
5110
0.0
36.0
5810
0.0
48.4
9810
0.0
49.5
5010
0.0
51.8
6810
0.0
53.3
4010
0.0
Mill.
eq. s
q. mt
.22
0.2
100.
033
8.7
100.
054
1.6
100.
071
6.2
100.
072
8.9
100.
075
3,5
100.
077
3.6
100.
0
(Fon
te: E
labo
razio
ne p
ropr
ia)
(Sou
rce:
ow
n da
ta p
roce
ssin
g)

88 XXV Rapporto Marmo e Pietre nel Mondo 2014 XXV World Marble and Stones Report 2014 89
18. Interscambio lapideo per Paesi e tipologie (000 tonn./2013): export UE/27Stone exchange for Countries and types (000 tons/2013): export EU/27
COUNTRIES 25.15 25.16 68.01 68.02 68.03 TOTAL
AUSTRIA 63 71 5 23 - 162
BELGIUM 22 114 126 163 10 435
BULGARIA 49 6 - 30 1 86
CYPRUS - - - - - -
CZECH REP. - 7 69 56 - 132
DENMARK - 4 1 7 - 12
ESTONIA - - - 3 - 3
FINLAND - 379 - 14 - 393
FRANCE 33 44 24 105 3 209
GERMANY 263 117 143 104 11 638
GREECE 643 11 1 192 3 850
HUNGARY - - 1 3 - 4
IRELAND - 11 - 17 5 33
ITALY 1.416 152 137 1508 10 3.223
LATVIA - - - 35 - 35
LITHUANIA - 1 - 5 - 6
LUXEMBOURG - - - 1 1 2
MALTA - - - - - -
NETHERLANDS 2 27 44 98 3 174
POLAND 1 150 45 35 - 231
PORTUGAL 538 352 386 396 13 1.685
ROMANIA 1 - 3 3 - 7
SLOVAKIA - 1 2 2 - 5
SLOVENIA 5 2 1 27 - 35
SPAIN 1343 257 20 675 453 2.748
SWEDEN - 214 - 2 - 216
UNITED KINGDOM - 9 7 5 18 39
TOTAL EU-27 4.379 1.929 1.015 3.509 531 11.363
(Fonte: Elaborazione propria) (Source: own data processing)
19. Interscambio lapideo per Paesi e tipologie (000 tonn./2013): import UE/27Stone exchange for Countries and types (000 tons/2013): import EU/27
COUNTRIES 25.15 25.16 68.01 68.02 68.03 TOTAL
AUSTRIA 2 16 96 169 4 287
BELGIUM 28 220 232 493 34 1007
BULGARIA 14 1 - 27 - 42
CYPRUS 1 - 1 25 1 28
CZECH REP. 1 9 12 27 3 52
DENMARK 1 38 73 25 6 143
ESTONIA - - 2 6 1 9
FINLAND - 12 19 19 1 51
FRANCE 128 315 448 418 218 1527
GERMANY 54 205 778 790 98 1925
GREECE 93 36 3 39 - 171
HUNGARY 2 7 6 24 1 40
IRELAND - 10 12 41 24 87
ITALY 320 666 73 204 15 1278
LATVIA - 1 4 7 - 12
LITHUANIA - 59 8 19 - 86
LUXEMBOURG 2 39 23 20 5 89
MALTA 3 1 - 13 - 17
NETHERLANDS 11 96 143 169 13 432
POLAND 2 205 36 221 8 472
PORTUGAL 18 143 1 25 2 189
ROMANIA 4 5 20 81 1 111
SLOVAKIA 5 6 22 33 1 67
SLOVENIA 1 4 10 33 2 50
SPAIN 40 325 11 90 24 490
SWEDEN - 16 55 31 2 104
UNITED KINGDOM 14 170 117 299 186 786
TOTAL EU-27 744 2.605 2.205 3.348 650 9.552
(Fonte: Elaborazione propria) (Source: own data processing)

90 XXV Rapporto Marmo e Pietre nel Mondo 2014 XXV World Marble and Stones Report 2014 91
20. Interscambio lapideo per Paesi e tipologie (000 tonn./2012): export altri EuropaStone exchange for Countries and types (000 tons/2012): export other Europe
COUNTRIES 25.15 25.16 68.01 68.02 68.03 TOTAL
ALBANIA 4 58 - 13 - 75
ARMENIA 2 6 - 16 - 24
BELARUS - - - 1 - 1
BOSNIA 1 2 2 7 - 12
CROATIA 370 2 7 7 - 386
GEORGIA - 1 - - - 1
GREENLAND - - - - - -
ICELAND - - - - - -
MACEDONIA 49 1 1 5 - 56
MOLDOVA - - - - - -
MONTENEGRO 7 2 - 3 - 12
NORWAY 1 277 2 1 10 291
SERBIA 1 1 - 5 - 7
SWITZERLAND 1 35 1 6 - 43
UKRAINE - 15 58 53 - 126
TOTAL 436 100 71 117 10 1034
(Fonte: Elaborazione propria) (Source: own data processing)
21. Interscambio lapideo per Paesi e tipologie (000 tonn./2013): import altri EuropaStone exchange for Countries and types (000 tons/2013): import other Europe
COUNTRIES 25.15 25.16 68.01 68.02 68.03 TOTAL
ALBANIA 21 4 - 9 - 34
ARMENIA - 1 - 16 - 17
BELARUS 13 33 3 27 1 77
BOSNIA 8 13 - 25 - 46
CROATIA 1 4 1 25 - 31
GEORGIA - 5 3 16 1 25
GREENLAND - - 1 1 - 2
ICELAND - - - 1 - 1
MACEDONIA 3 - - 18 - 21
MOLDOVA - - 1 12 - 13
MONTENEGRO 2 2 - 12 - 16
NORWAY 1 20 - 52 4 77
SERBIA 3 36 1 24 - 64
SWITZERLAND 79 169 96 156 8 508
UKRAINE 3 3 - 46 1 53
TOTAL 134 296 106 440 15 985
(Fonte: Elaborazione propria) (Source: own data processing)

92 XXV Rapporto Marmo e Pietre nel Mondo 2014 XXV World Marble and Stones Report 2014 93
22. Interscambio lapideo per Paesi e tipologie: extra-europei leader (000 tonn./2013). ExportStone exchange for Countries and types: leading extra-european (000 tons/2013). Export
COUNTRIES 25.15 25.16 68.01 68.02 68.03 TOTAL
AUSTRALIA 2 53 - 3 - 58
BRAZIL 12 1409 40 1132 103 2696
CANADA 7 55 3 167 20 252
CHINA 101 865 1103 9587 426 12082
EGYPT 2110 4 - 298 - 2412
INDIA 238 6.656 291 1980 21 9186
IRAN 581 5 - 110 - 696
JAPAN - 48 - 2 - 50
SOUTH AFRICA 1 251 - 48 1 301
SOUTH KOREA - 1 - 4 - 5
TAIWAN 5 3 - 36 1 45
TURKEY 5706 473 14 2108 2 8303
USA 37 108 3 312 7 467
TOTAL 8800 9931 1454 15787 581 36553
(Fonte: Elaborazione propria) (Source: own data processing)
23. Interscambio lapideo per Paesi e tipologie: extra-europei leader (000 tonn./2013). ImportStone exchange for Countries and types: leading extra-european (000 tons/2013). Import
COUNTRIES 25.15 25.16 68.01 68.02 68.03 TOTAL
AUSTRALIA - 39 66 187 12 304
BRAZIL 26 2 - 80 - 108
CANADA 42 125 23 779 15 984
CHINA 10818 6704 2 218 2 17744
EGYPT 65 2 - 26 - 93
INDIA 609 48 1 173 1 832
IRAN 1 3 - 158 - 162
JAPAN 8 21 149 802 12 992
SOUTH AFRICA 8 35 - 56 5 104
SOUTH KOREA 8 28 68 2387 3 2494
TAIWAN 242 1112 42 273 5 1674
TURKEY 12 59 6 392 2 471
USA 13 67 136 3188 128 3532
TOTAL 11852 8245 493 8719 185 29494
(Fonte: Elaborazione propria) (Source: own data processing)

94 XXV Rapporto Marmo e Pietre nel Mondo 2014 XXV World Marble and Stones Report 2014 95
24. Interscambio lapideo per Paesi e tipologie: altri Sud-Est asiatico (000 tonn./2013). ExportStone exchange for Countries and types: others South-East Asia (000 tons/2013). Export
COUNTRIES 25.15 25.16 68.01 68.02 68.03 TOTAL
AFGHANISTAN - - 29 - - 29
BHUTAN - 24 - 3 - 27
HONG-KONG 5 15 - 25 - 45
INDONESIA 133 252* 10 103 - 498
MACAO - - - - - -
MALAYSIA 2 24 14 6 - 46
MALDIVES - 2 - - - 2
NEPAL - - - 7 - 7
NORTH KOREA - - - - - -
PAKISTAN 472 1 - 107 - 580
PHILIPPINES 28 - - 29 - 57
SINGAPORE - 3 - 20 - 23
THAILAND 2 13* 2 170 - 187
VIETNAM 4 - 129 118 - 251
TOTAL 646 334 184 588 - 1752
(Fonte: Elaborazione propria)
* Non è compreso l’export di silicei correnti a Singapore
(Source: own data processing)
* Current siliceous stone export to Singapore is not included
25. Interscambio lapideo per Paesi e tipologie: altri Sud-Est asiatico (000 tonn./2013). ImportStone exchange for Countries and types: others South-East Asia (000 tons/2013). Import
COUNTRIES 25.15 25.16 68.01 68.02 68.03 TOTAL
AFGHANISTAN 1 1 - 20 - 22
BHUTAN 12 - - 3 - 15
HONG-KONG 164 170 3 237 2 576
INDONESIA 86 26 14 82 1 209
MACAO 1 1 - 27 - 29
MALAYSIA 19 1 7 44 3 74
MALDIVES - 38 - 3 - 41
NEPAL 33 2 - 6 - 41
NORTH KOREA - - - 2 - 2
PAKISTAN 5 1 - 41 - 47
PHILIPPINES - 4 - 120 2 126
SINGAPORE 15 279* - 180 2 476
THAILAND 22 36 1 126 3 188
VIETNAM 6 61 - 585 5 657
TOTAL 364 620 25 1476 18 2503
(Fonte: Elaborazione propria)
*Non è compreso l’importo di silicei correnti
(Source: own data processing)
* Current siliceous stone import is not included

96 XXV Rapporto Marmo e Pietre nel Mondo 2014 XXV World Marble and Stones Report 2014 97
26. Interscambio lapideo per Paesi e tipologie: altri extra-europei (000 tonn./ 2013). ExportStone exchange for Countries and types: others extra-european (000 tons/2012). Export
COUNTRIES 25.15 25.16 68.01 68.02 68.03 TOTALALGERIA 1 - - - - 1BOTSWANA - - - - - -CAPE VERDE - - - - - -MALAWI - - - - - -MAURITIUS - - - - - -MOROCCO 32 1 - 2 - 35MOZAMBIQUE - 65 - - - 65NAMIBIA 32 33 - 8 - 73SUDAN - - - - - -TANZANIA 3 - - - - 3TOGO 302 - - - - 302TUNISIA 103 27 - 10 - 150UGANDA 1 - - - - 1ZAMBIA - - - - - -ZIMBABWE - 81 - - - 81ARGENTINA 6 3 4 9 1 23BERMUDA - - - - - -CHILE - - - - - -COLOMBIA - - - 3 - 3ECUADOR - - - - - -GUATEMALA 3 3 - 6 - 12MEXICO 86 101 1 88 - 276PARAGUAY - - - - - -SALVADOR - - - - - -URUGUAY - 5 - - - 5BRUNEI - - - - - -JORDAN 6 3 - 297 - 306LEBANON 12 1 - 17 - 30KAZAKHSTAN - 12 - 144 - -MONGOLIA - - - - - -OMAN 78 124 3 194 4 403PALESTINA 12 - - 146 - 158SAUDI ARABIA - 62 67 59 3 191N. CALEDONIA - - - - - -N. ZEALAND - - - 1 - 1SAMOA - - - - - -SUB-TOTAL 677 521 75 994 8 2275OTHERS 32 21 147 123 40 363TOTAL 709 542 222 1117 48 2638
(Fonte: Elaborazione dati Comtrade) (Source: Comtrade data processing)
27. Interscambio lapideo per Paesi e tipologie: altri extra-europei (000 tonn./ 2013). ImportStone exchange for Countries and types: others extra-european (000 tons/2013). Import
COUNTRIES 25.15 25.16 68.01 68.02 68.03 TOTALALGERIA 113 5 - 123 - 241BOTSWANA 1 1 - 1 - 3CAPE VERDE - - - 3 - 3MALAWI - - - 1 - 1MAURITIUS - - - 6 2 8MOROCCO 19 12 10 195 1 237MOZAMBIQUE 1 1 - 3 - 5NAMIBIA - 5 - 1 - 6SUDAN - - - 16 - 16TANZANIA - 1 - 5 - 6TOGO 327 - - - - 327TUNISIA 72 8 - 44 - 124UGANDA - - - 3 - 3ZAMBIA - 2 - 1 - 3ZIMBABWE - 1 - 1 - 2ARGENTINA - 8 - 40 2 50BERMUDA - - 1 1 - 2CHILE 3 1 1 59 11 75COLOMBIA 16 1 - 53 3 73ECUADOR 1 5 - 33 2 41GUATEMALA - - - 5 - 5MEXICO 9 32 - 162 2 205PARAGUAY - 1 - 4 1 6SALVADOR 4 - - 3 - 7URUGUAY - - 1 8 2 11BRUNEI 1 3 - 12 - 16JORDAN 175 8 - 116 - 299LEBANON 156 8 2 292 1 459KAZAKHSTAN 32 1 6 1 1 41MONGOLIA - - 1 5 1 7OMAN 3 4 1 65 7 80PALESTINA 12 25 1 98 - 136SAUDI ARABIA 106 5 38 1472 19 1640N. CALEDONIA 109 - - 1 - 110N. ZEALAND - 1 2 21 2 26SAMOA - - - 1 - 1SUB-TOTAL 1160 139 64 2854 57 4274OTHERS 716 1237 53 4279 245 6532TOTAL 1876 1376 117 7133 302 10806
(Fonte: Elaborazione dati Comtrade) (Source: Comtrade data processing)

98 XXV Rapporto Marmo e Pietre nel Mondo 2014 XXV World Marble and Stones Report 2014 99
28.Interscambio lapideo mondiale (000 tonn./2013): exportWorld stone exchange (000 tons/2013): export
PAR. COUNTRIES/ZONES
RAW PROCESSED TOTAL
25.15 25.16 68.01 68.02 68.03
ABS.
FIG
URES
EUROPE/27 4379 1929 1015 3509 531 11363
OTHERS EUROPE 436 400 71 117 10 1034
LEADING EXTRA/EU 8800 9931 1454 15787 581 36553
SOUTH EAST ASIA 646 334 184 588 - 1752
OTHERS EXTRA/EU 709 542 222 1117 48 2638
TOTAL 14970 13136 2946 21118 1170 53340
SHAR
ES
EUROPE/27 29.2 14.7 34.5 16.6 45.4 21.3
OTHERS EUROPE 2.9 2.9 2.4 0.5 0.8 1.9
LEADING EXTRA/EU 58.8 75.6 49.3 74.8 49.7 68.5
SOUTH EAST ASIA 4.3 2.5 6.2 2.8 - 3.3
OTHERS EXTRA/EU 4.8 4.3 7.6 5.3 4.1 5.0
TOTAL 100.0 100.0 100.0 100.0 100.0 100.0
(Fonte: Elaborazione propria) (Source: own data processing)
29.Interscambio lapideo mondiale (000 tonn./2013): importWorld stone exchange (000 tons/2013): import
PAR. COUNTRIES/ZONES
RAW PROCESSED TOTAL
25.15 25.16 68.01 68.02 68.03
ABS.
FIG
URES
EUROPE/27 744 2605 2205 3348 650 9552
OTHERS EUROPE 134 290 106 440 15 985
LEADING EXTRA/EU 11852 8245 493 8719 185 29494
SOUTH EAST ASIA 364 620 25 1476 18 2503
OTHERS EXTRA/EU 1876 1376 117 7133 302 10806
TOTAL 14970 13136 2946 21118 1170 53340
SHAR
ES
EUROPE/27 5.0 19.8 74.8 15.9 55.6 17.9
OTHERS EUROPE 0.9 2.1 0.7 2.0 1.2 1.8
LEADING EXTRA/EU 79.2 62.8 16.7 41.3 15.8 55.3
SOUTH EAST ASIA 2.4 4.7 0.8 7.0 1.5 4.7
OTHERS EXTRA/EU 12.5 10.6 4.0 33.8 25.9 20.3
TOTAL 100.0 100.0 100.0 100.0 100.0 100.0
(Fonte: Elaborazione propria) (Source: own data processing)

100 XXV Rapporto Marmo e Pietre nel Mondo 2014 XXV World Marble and Stones Report 2014 101
31. Interscambio lapideo mondiale: variazioni storicheWorld stone trade: historical outline
YEARS
Raw materials Processed materialsGENERAL
TOTALCalcareous Siliceous Total Simple Special Slate Total
1990 -7.4 +9.2 +6.0 +5.3 +4.2 +5.4 +4.6 +5.3
1995 +0.5 -5.2 -4.2 +10.2 +11.5 +10.8 +11.1 +3.2
1996 +9.8 +8.9 +9.1 +19.7 +11.8 +8.7 +13.4 +11.3
1997 +29.6 +14.5 +17.4 -1.4 +6.5 +9.9 +4.8 +10.7
1998 +4.3 -9.3 -6.8 -4.6 +2.9 +6.0 +1.4 -2.7
1999 +11.9 +16.4 +15.4 +16.0 +5.1 +8.8 +7.8 -11.4
2000 +32.4 -1.9 +5.9 +20.6 +8.7 +22.4 +12.7 +9.4
2001 +5.4 +10.6 +9.1 -10.8 +10.3 -11.0 +3.0 +5.9
2002 +17.6 -1.7 +3.5 -0.4 +11.1 -9.0 +7.0 +5.3
2003 +36.8 -0.9 +10.8 +20.6 +22.4 +21.6 +21.9 +16.6
2004 +4.3 +22.6 +15.6 -15.0 +12.3 +17.0 +7.1 +11.0
2005 +15.4 +0.3 +5.5 +35.3 +10.5 +0.3 +13.7 +9.8
2006 +19.6 +2.9 +9.2 +3.1 +24.3 +9.0 +19.4 +14.7
2007 +10.4 +8.2 +9.1 +0.3 +16.6 +14.5 +13.8 +11.8
2008 +13.5 -5.4 +2.5 -2.9 -6.4 -4.3 -5.8 -2.2
2009 -0.9 -17.6 -9.0 -11.9 -8.0 -17.2 -9.2 -9.1
2010 +40.9 +18.2 -29.8 +1.2 +10.0 +5.1 +8.5 +18.1
2011 +3.6 +3.9 +3.7 +3.5 +0.5 -4.0 +0.6 +2.2
2012 +5.6 +14.9 +9.7 -7.9 +0.9 -0.2 -0.4 +4.7
2013 +2.6 +4.4 +3.5 -6.3 +4.0 -6.5 +2.2 +2.8
(Fonte: Elaborazione propria) (Source: own data processing)
30. Interscambio lapideo mondiale: quantità (000 tonn.) World stone trade: quantity (000 tons)
YEARS
Raw materials Processed materialsGENERAL
TOTALCalcareous Siliceous Total Simple Special Slate Total
1989 988 4.140 5.128 1.260 2.904 425 4.589 9.717
1990 915 4.519 5.434 1.327 3.025 448 4.800 10.234
1995 1.396 6.024 7.420 1.903 5.606 644 8.153 15.573
1996 1.533 6.562 8.095 2.278 6.267 700 9.245 17.340
1997 1.987 7.515 9.502 2.245 6.675 769 9.689 19.191
1998 2.073 6.785 8.858 2.142 6.866 815 9.823 18.681
1999 2.319 7.901 10.220 2.484 7.214 887 10.585 20.805
2000 3.071 7.754 10.825 2.995 7.845 1.086 11.926 22.751
2001 3.237 8.576 11.813 2.671 8.651 967 12.289 24.102
2002 3.806 8.426 12.232 2.659 9.610 880 13.149 25.381
2003 5.206 8.346 13.552 3.206 11.758 1.070 16.034 29.586
2004 5.430 10.237 15.667 2.726 13.202 1.252 17.180 32.847
2005 6.265 10.266 16.531 3.689 14.582 1.256 19.527 36.058
2006 7.495 10.562 18.057 3.804 18.138 1.369 23.311 41.368
2007 8.271 11.429 19.700 3.814 21.150 1.568 26.532 46.232
2008 9.384 10.816 20.200 3.702 19.791 1.500 24.993 45.193
2009 9.466 8.909 18.375 3.262 18.199 1.242 22.703 41.078
2010 13.334 10.531 23.865 3.301 20.026 1.306 24.633 48.498
2011 13.812 10.945 24.757 3.415 20.124 1.254 24.793 49.550
2012 14.590 12.576 27.166 3.145 20.306 1.251 24.702 51.868
2013 14.970 13.136 28.106 2.946 21.118 1.170 25.234 53.340
(Fonte: Elaborazione propria) (Source: own data processing)

102 XXV Rapporto Marmo e Pietre nel Mondo 2014 XXV World Marble and Stones Report 2014 103
33. Interscambio lapideo mondiale: quoteWorld stone trade: shares
YEARS
Raw materials Processed materialsGENERAL
TOTALCalcareous Siliceous Total Simple Special Slate Total
1989 10.2 42.6 52.8 13.0 29.9 4.3 47.2 100.0
1990 8.9 44.1 53.0 13.0 31.8 4.2 47.0 100.0
1995 9.0 38.7 47.7 12.2 36.0 4.1 52.3 100.0
1996 8.8 37.8 46.6 13.1 36.1 4.2 53.4 100.0
1997 10.3 39.2 49.5 11.7 34.8 4.0 50.5 100.0
1998 11.0 36.3 47.3 11.5 36.8 4.4 52.7 100.0
1999 11.1 38.0 49.1 11.9 34.7 4.3 50.9 100.0
2000 13.5 34.1 47.6 13.2 34.5 4.7 52.4 100.0
2001 13.4 35.6 49.0 11.1 35.9 4.0 51.0 100.0
2002 15.0 33.2 48.2 10.5 37.9 3.4 51.8 100.0
2003 17.6 28.2 45.8 10.8 39.7 3.6 54.2 100.0
2004 16.5 31.2 47.7 8.3 40.2 3.8 52.3 100.0
2005 17.4 28.4 45.8 10.2 40.5 3.5 54.2 100.0
2006 18.1 25.5 43.6 9.2 43.8 3.4 56.4 100.0
2007 17.9 24.7 42.6 8.2 45.8 3.4 57.4 100.0
2008 20.8 23.9 44.7 8.2 43.8 3.3 55.3 100.0
2009 23.0 21.7 44.7 7.9 44.3 3.1 55.3 100.0
2010 27.5 21.7 49.2 6.8 41.3 2.7 50.8 100.0
2011 27.9 22.1 50.0 6.9 40.6 2.5 50.0 100.0
2012 28.1 24.2 52.3 6.1 39.1 2.5 47.7 100.0
2013 28.1 24.6 52.7 5.5 39.6 2.2 47.3 100.0
(Fonte: Elaborazione propria) (Source: own data processing)
32. Interscambio lapideo mondiale: indiciWorld stone exchange: index
YEARS
Raw materials Processed materialsGENERAL
TOTALCalcareous Siliceous Total Simple Special Slate Total
1989 100.0 100.0 100.0 100.0 100.0 100.0 100.0 100.0
1990 92.6 109.2 106.0 105.3 104.2 105.4 104.6 105.3
1995 141.3 145.5 144.7 151.0 193.0 151.5 177.7 160.3
1996 155.2 158.5 157.8 180.8 215.8 164.7 201.5 178.5
1997 201.1 181.5 185.3 178.2 229.9 108.9 211.1 197.5
1998 209.8 163.9 172.7 170.0 236.4 191.8 214.1 192.3
1999 234.7 190.8 199.3 197.1 248.4 208.7 230.7 214.1
2000 310.8 187.3 211.1 237.6 270.1 255.5 259.9 234.1
2001 327.6 207.1 230.4 212.0 297.9 227.5 267.8 248.0
2002 385.2 203.5 238.5 211.0 330.9 207.1 286.5 261.2
2003 526.9 201.6 264.3 254.4 404.9 251.8 349.4 304.5
2004 549.6 247.3 305.5 216.3 454.6 294.6 374.4 338.0
2005 634.1 248.0 322.4 292.8 502.1 295.5 425.5 371.1
2006 758.6 255.1 352.1 301.9 624.6 322.1 508.0 425.7
2007 837.1 276.1 384.2 302.7 728.3 368.9 573.2 475.8
2008 949.8 261.3 393.9 293.8 681.5 352.9 544.6 465.1
2009 958.1 215.2 358.3 258.9 626.9 292.2 494.7 422.7
2010 1349.6 254.4 465.4 262.0 689.6 307.3 530.8 499.1
2011 1398.0 264.4 482.8 271.0 693.0 295.1 540.3 510.0
2012 1476.7 303.8 529.8 249.6 699.2 294.4 538.3 533.8
2013 1515.2 317.3 548.1 233.8 727.2 275.3 549.8 548.9
(Fonte: Elaborazione propria) (Source: own data processing)

104 XXV Rapporto Marmo e Pietre nel Mondo 2014 XXV World Marble and Stones Report 2014 105
34. Interscambio di lungo periodo. Maggiori esportazioni quantitative: top leaders (000 tonn.) Long period exchange. Leading quantity stone exports: top leaders (000 tons)
COUNTRIES 1994 2001 2010 2011 2012 2013
AUSTRALIA 19 18 52 41 45 58
AUSTRIA 75 125 224 224 148 162
BELGIUM 320 585 590 591 566 435
BRAZIL 637 1.222 2.226 2.170 2.218 2.696
CANADA 130 510 234 240 263 252
CHINA 1.983 4.692 12.496 13.507 12.597 12.082
FINLAND 306 325 331 430 416 393
FRANCE 179 248 257 350 201 209
GERMANY 285 348 731 814 664 638
GREECE 196 277 748 812 879 850
INDIA 1.197 2.294 5.005 5.200 7.580 9.186
ITALY 3.101 3.550 3.144 3.062 3.180 3.223
JAPAN 2 20 49 48 22 50
NORWAY 255 315 412 369 335 291
POLAND 265 335 164 200 1-98 231
PORTUGAL 1.002 1.205 1.381 1.411 1.673 1.685
RUSSIA 32 12 25 27 35 20
SPAIN 1.409 1.861 2.468 2.697 2.733 2.748
SOUTH AFRICA 538 903 403 406 391 301
SOUTH KOREA 300 69 13 7 8 5
TAIWAN 40 78 59 96 67 45
TURKEY 214 985 6.603 7.175 8.000 8.303
USA 266 253 749 475 561 467
(Fonte: Elaborazione propria) (Source: Own data processing)
35. Interscambio di lungo periodo. Maggiori importazioni quantitative: top leaders (000 tonn.) Long period exchange. Leading quantity stone imports: top leaders (000 tons)
COUNTRIES 1994 2001 2010 2011 2012 2013
AUSTRALIA 45 63 210 296 255 304
AUSTRIA 97 254 327 326 296 287
BELGIUM 357 649 1.218 1.326 1.198 1.007
BRAZIL 9 51 71 104 98 108
CANADA 140 178 547 932 1.081 984
CHINA 118 2.196 12.312 13.312 16.303 17.744
FINLAND 8 37 42 22 57 51
FRANCE 782 1.049 1.256 1.280 1.456 1.527
GERMANY 1.864 2.416 1.962 2.339 1.914 1.925
GREECE 8 72 328 217 139 171
INDIA 11 39 458 586 802 832
ITALY 1.683 2.324 1.698 1.629 1.375 1.278
JAPAN 2.241 1.805 1.037 1.015 1.032 992
NORWAY 40 81 181 185 82 77
POLAND 112 305 520 779 733 472
PORTUGAL 44 203 109 113 178 189
RUSSIA 46 131 464 493 644 496
SPAIN 378 1.073 829 717 458 490
SOUTH AFRICA 4 9 78 67 71 104
SOUTH KOREA 205 705 2.518 2.653 2.263 2.494
TAIWAN 837 1.459 1.587 2.169 2.263 1.674
TURKEY 12 88 346 349 361 471
USA 731 2.151 3.389 2.929 3.196 3.532
(Fonte: Elaborazione propria) (Source: Own data processing)

106 XXV Rapporto Marmo e Pietre nel Mondo 2014 XXV World Marble and Stones Report 2014 107
36.
Vari
azio
ni d
ell’i
nter
scam
bio
quan
titat
ivo
nei p
rinc
ipal
i Pae
si e
spor
tato
riQu
antit
y exc
hang
e va
riatio
n in
lead
ing
expo
rter C
ount
ries
1994
2000
2005
2010
2011
2012
2013
COUN
TRIES
000
tons
%00
0to
ns%
000
tons
%00
0to
ns%
000
tons
%00
0 to
ns%
000
tons
%
ITAL
Y3.
121
20.7
3.63
516
.0
3.12
2 8.
7 3.
144
6.5
3.06
26.
23.
180
6.1
3.22
36.
0
GERM
ANY
285
1.9
411
1.8
749
2.1
731
1.5
814
1.6
664
1.3
638
1.2
F RAN
CE
179
1.2
241
1.1
225
0.6
257
0.5
354
0.7
210
0.4
2069
0.4
GREE
CE19
61.
333
11.
5 34
9 1.
0 74
81.
581
21.
687
91.
785
01.
6
SPAI
N1.
409
9.3
2.02
88.
9 2.
442
6.8
2.46
85.
12.
597
5.2
2.73
35.
32.
748
5.2
P ORT
UGAL
1.00
26.
61.
217
5.3
1.23
5 3.
4 1.
381
2.8
1.41
12.
81.
673
3.2
1.68
53.
2
T URK
EY21
41.
465
82.
9 3.
045
8.4
6.60
313
.67.
165
14.5
8.00
015
.48.
303
15.6
FIN
LAN
D30
62.
034
01.
5 38
5 1.
1 33
10.
743
10.
841
60.
839
30.
7
NOR
WAY
255
1.7
297
1.3
365
1.0
412
0.8
369
0.7
335
0.6
291
0.5
CHIN
A2.
218
14.7
4.09
518
.0
8.89
6 24
.7
12.4
9625
.813
.507
27.3
12.5
9724
.312
.082
22.7
INDI
A1.
197
7.9
2.30
710
.1
4.04
4 11
.2
5.00
510
.35.
200
10.5
7.58
014
.69.
186
17.2
SOUT
H AF
RICA
520
3.4
960
4.2
660
1.8
403
0.8
406
0.8
391
0.8
301
0.6
USA
266
1.8
243
1.1
364
1.0
449
0.9
475
0.9
561
1.1
467
0.9
BRAZ
IL63
74.
21.
084
4.8
2.15
7 6.
0 2.
226
4.6
2.17
04.
42.
218
4.3
2.69
65.
1
OTHE
RS3.
278
21.7
4.90
421
.6
8.02
0 22
.2
11.8
4424
.610
.777
21.7
10.4
3120
.110
.268
19.3
TOTA
L15
.083
100.
022
.751
100.
0 36
.058
10
0.0
48.4
9810
0.0
49.5
5010
0.0
51.8
6810
0.0
53.3
4010
0.0
(Fon
te: E
labo
razio
ne p
ropr
ia)
(Sou
rce:
ow
n da
ta p
roce
ssin
g)
37.
Vari
azio
ni d
ell’i
nter
scam
bio
quan
titat
ivo
nei p
rinc
ipal
i Pae
si im
port
ator
iQu
antit
y exc
hang
e va
riatio
n in
lead
ing
impo
rter C
ount
ries
1994
2000
2005
2010
2011
2012
2013
COUN
TRIE
S00
0to
ns%
000
tons
%00
0to
ns%
000
tons
%00
0to
ns%
000
tons
%00
0 to
ns%
ITAL
Y1.
683
11.2
2.35
910
.42.
483
6.9
1.69
83.
51.
629
3.3
1.37
52.
71.
278
2.4
GERM
ANY
1.86
412
.42.
223
9.8
1.79
55.
01.
762
3.6
2.33
94.
71.
914
3.7
1.92
53.
6
FRAN
CE78
25.
21.
082
4.8
1.09
33.
01.
256
2.6
1.33
72.
71.
456
2.8
1.52
72.
9
SPAI
N37
72.
584
33.
71.
430
4.0
829
1.7
717
1.4
458
0.9
490
0.9
PORT
UGAL
440.
315
30.
715
60.
410
90.
211
30.
217
80.
318
90.
4
UN. K
INGD
OM25
11.
734
11.
599
42.
81.
238
2.6
1.18
62.
466
61.
378
61.
4
SWIT
ZERL
AND
372
2.5
456
2.0
539
1.5
516
1.1
502
1.0
490
0.9
508
0.9
JAPA
N2.
241
14.9
1.73
87.
61.
735
4.8
1.03
72.
11.
015
2.0
1.03
32.
099
21.
9
TAIW
AN83
75.
51.
471
6.4
1.89
65.
31.
597
3.3
2.16
94.
42.
293
4.4
1.67
43.
1
CHIN
A11
80.
81.
741
7.7
4.55
412
.612
.312
25.4
13.5
8227
.416
.303
31.4
17.7
4433
.3
SOUT
H KO
REA
205
1.4
444
2.0
1.83
35.
12.
518
5.2
2.65
35.
32.
263
4.4
2.49
44.
7
SIN
GAPO
RE18
41.
216
40.
727
60.
839
60.
819
60.
430
80.
647
60.
9
CAN
ADA
140
0.9
190
0.8
423
1.2
547
1.1
932
1.9
1.07
12.
198
41.
8
USA
731
4.8
1.81
58.
03.
727
10.3
3.38
97.
02.
929
5.9
3.19
66.
23.
532
6.6
OTHE
RS5.
254
34.8
7.72
133
.813
.124
36.4
19.2
9439
.818
.251
36.8
18.8
6436
.418
.741
35.1
TOTA
L15
.083
100.
022
.751
100.
036
.058
100.
048
.498
100.
049
.550
100.
051
.868
100.
053
.340
100.
0
(Fon
te: E
labo
razio
ne p
ropr
ia)
(Sou
rce:
ow
n da
ta p
roce
ssin
g)

108 XXV Rapporto Marmo e Pietre nel Mondo 2014 XXV World Marble and Stones Report 2014 109
39.
Inte
rsca
mbi
o m
ondi
ale
di c
alca
rei g
rezz
i (co
d. 2
5.15
): im
port
(000
tonn
.) W
orld
exc
hang
e of
raw
calca
reou
s sto
nes (
code
25.
15):
impo
rt (0
00 to
ns)
1995
19
99
2000
20
05
2010
2011
2012
2013
COUN
TRIE
S00
0to
ns%
000
tons
%00
0to
ns%
000
tons
%00
0to
ns%
000
tons
%00
0to
ns%
000
tons
%
CHIN
A 65
4.
7 36
2 5.
6 74
6 24
.3
2.41
3 38
.5
8.52
463
.98.
100
65.9
10.0
8069
-110
818
72.3
FRAN
CE
32
2.3
54
2.3
73
2.4
21
0.3
200.
124
0.2
250-
228
0.2
GERM
ANY
45
3.2
70
3.0
62
2.0
32
0.5
600.
473
0.5
580-
454
0.4
GREE
CE
6 0.
4 44
1.
9 59
1.
9 23
6 3.
8 14
11.
111
70.
864
0-4
930.
6
HON
G-KO
NG
42
3.0
113
4.9
114
3.7
112
1.8
168
1.3
155
1.1
760-
516
41.
1
ITAL
Y 26
1 18
. 31
0 13
.4
368
12.0
47
0 7.
5 42
73.
235
12.
531
72.
232
02.
1
LEBA
NON
15
3 11
.0
154
6.6
106
3.5
96
1.5
138
1.0
970.
716
71.
115
61.
0
NET
HERL
ANDS
54
3.
9 98
4.
2 72
2.
3 18
0.
3 66
0.5
440.
332
0.2
110.
1
SPAI
N
96
6.9
112
4.8
153
5.0
206
3.3
540.
465
0.5
340.
240
0.3
SWIT
ZERL
AND
79
5.7
103
4.4
94
3.1
120
1.9
900.
755
0.4
520.
435
0.2
TAIW
AN
131
9.4
169
7.3
129
4.2
186
3.0
261
2.0
249
1.8
292
2.0
242
1.6
UNIT
ED S
TATE
S 19
1.
4 63
2.
7 68
2.
2 38
0.
6 18
0.1
100.
127
0.2
130.
1
OTHE
RS
413
29.5
66
7 28
1.
027
33.4
2.
317
37.0
33
6725
.334
7225
.133
6623
.129
9620
.0
TOTA
L 1.
396
100.
0 2.
319
100.
0 3.
071
100.
0 6.
265
100.
0 13
.334
100.
013
.812
100.
014
590
100.
014
970
100.
0
(Fon
te: E
labo
razio
ne p
ropr
ia)
(Sou
rce:
ow
n da
ta p
roce
ssin
g)
38.
Inte
rsca
mbi
o m
ondi
ale
di c
alca
rei g
rezz
i (co
d. 2
5.15
): ex
port
(000
tonn
.) W
orld
exc
hang
e of
raw
calca
reou
s sto
nes (
code
25.
15):
expo
rt (0
00 to
ns)
1995
19
99
2000
20
05
2010
2011
2012
2013
COUN
TRIE
S00
0to
ns%
000
tons
%00
0to
ns%
000
tons
%00
0to
ns%
000
tons
%00
0to
ns%
000
tons
%
Aust
ria
70
5.0
92
4.0
74
2.4
72
1.1
103
0.8
740.
561
0.4
630.
4
Belg
ium
15
1.
1 10
8 4.
6 11
9 3.
9 75
1.
2 18
0.1
230.
221
0.1
220.
1
Croa
tia
32
2.3
110
4.7
50
1.6
74
1.2
129
1.0
100
0.7
365
2.5
386
2.6
Germ
any
26
1.9
47
2.0
49
1.6
78
1.2
234
1.8
327
2.4
214
1.5
263
1.8
Gree
ce
34
2.4
93
4.0
174
5.7
230
3.7
411
3.1
470
3.4
525
3.6
643
4.3
Indi
a 54
3.
9 59
2.
5 80
2.
6 11
7 1.
9 16
61.
265
0.5
229
1.6
238
1.6
Iran
21
1.5
101
44
107
3.5
364
5.8
817
6.1
850
6.2
617
4.2
581
3.9
Italy
58
8 42
.1
616
26.5
76
9 25
.0
786
12.5
13
219.
912
879.
313
799.
514
169.
5
Phili
ppin
es
68
4.9
62
2.7
40
1.3
31
0.5
100.
18
0.1
170.
128
0.2
Portu
gal
106
7.6
75
3.2
87
2.8
169
2.7
478
3.6
481
3.5
522
3.6
538
3.6
Spai
n 94
6.
7 35
9 15
.5
454
14.8
98
5 15
.7
1117
8.4
1340
9.7
1364
9.3
1343
9.0
Turk
ey
62
4.4
124
5.3
187
6.1
1.56
9 25
.0
4680
35.1
5012
36.3
5227
35.8
5706
38.1
Othe
rs
226
16.2
47
3 20
.3
881
31.8
1.
715
27.4
38
5028
.937
7527
.340
4927
.837
4325
.0
T OTA
L 1.
396
100.
0 2.
319
100.
0 3.
071
100.
0 6.
265
100.
0 13
334
100.
013
812
100.
014
590
100.
014
970
100.
0
(Fon
te: E
labo
razio
ne p
ropr
ia)
(Sou
rce:
ow
n da
ta p
roce
ssin
g)

110 XXV Rapporto Marmo e Pietre nel Mondo 2014 XXV World Marble and Stones Report 2014 111
40.
Inte
rsca
mbi
o m
ondi
ale
di s
ilice
i gre
zzi (
cod.
25.
16):
expo
rt (0
00 to
nn.)
Wor
ld e
xcha
nge
of ra
w ca
lcare
ous s
tone
s (co
de 2
5.15
): ex
port
(000
tons
)
1995
19
99
2000
20
05
2010
2011
2012
2013
COUN
TRIE
S00
0to
ns%
000
tons
%00
0to
ns%
000
tons
%00
0to
ns%
000
tons
%00
0to
ns%
000
tons
%
BRAZ
IL
604
10.0
83
1 10
.5
804
10.4
1.
044
10.2
11
8211
.211
8110
.811
429.
114
0910
.7
CAN
ADA
65
1.1
228
2.9
245
3.2
189
1.8
760.
758
0.5
700.
655
0.4
C HIN
A 72
2 12
.0
818
10.4
91
6 11
.8
1.56
9 15
.3
588
5.6
1310
12.0
1413
11.2
865
6.6
FIN
LAN
D 26
5 4.
4 35
2 4.
5 31
4 4.
0 34
2 3.
3 30
82.
941
33.
839
93.
237
92.
9
GERM
ANY
214
3.6
157
2.0
147
1.9
337
3.3
229
2.2
154
1.4
171
1.4
117
0.9
I NDI
A 1.
077
17.9
1.
437
18.2
1.
762
22.7
2.
492
24.3
37
2035
.339
7036
.355
3744
.066
5650
.7
ITAL
Y 17
8 3.
0 19
3 2.
4 13
1 1.
7 20
5 2.
0 17
51.
716
21.
515
81.
315
21.
1
NOR
WAY
18
1 3.
0 23
5 3.
0 26
5 3.
4 35
1 3.
4 39
53.
834
43.
131
92.
527
72.
1
PORT
UGAL
14
1 2.
3 21
6 2.
7 19
9 2.
6 38
0 3.
7 21
22.
024
82.
337
43.
035
22.
7
S OUT
H AF
RICA
67
8 11
.3
921
11.7
93
7 12
.1
637
6.2
363
3.4
352
3.2
355
2.8
251
1.9
S PAI
N
574
9.5
353
4.5
375
4.8
311
3.0
296
2.8
271
2.5
250
2.0
257
2.0
UNIT
ED S
TATE
S 61
1.
0 19
8 2.
5 15
8 2.
0 19
3 1.
9 12
21.
213
01.
210
10.
810
80.
8
O THE
RS
1.26
4 21
.0
1.96
2 24
.8
1.50
1 19
.4
2.21
6 21
.6
2865
27.2
2352
21.5
2287
18.2
2258
17.2
TOTA
L 6.
024
100.
0 7.
901
100.
0 7.
754
100.
0 10
.266
10
0.0
10.5
3110
0.0
1094
510
0.0
1257
610
0.0
1313
610
0.0
(Fon
te: E
labo
razio
ne p
ropr
ia)
(Sou
rce:
ow
n da
ta p
roce
ssin
g)
41.
Inte
rsca
mbi
o m
ondi
ale
di s
ilice
i gre
zzi (
cod.
25.
16):
impo
rt (0
00 to
nn.)
Wor
ld e
xcha
nge
of ra
w ca
lcare
ous s
tone
s (co
de 2
5.15
): im
port
(000
tons
)
1995
19
99
2000
20
05
2010
2011
2012
2013
COUN
TRIE
S00
0to
ns%
000
tons
%00
0to
ns%
000
tons
%00
0to
ns%
000
tons
%00
0to
ns%
000
tons
%
BELG
IUM
31
8 5.
3 27
0 3.
4 20
9 2.
7 27
4 2.
7 18
01.
725
82.
425
22.
022
01.
7
CHIN
A 53
0.
8 59
6 7.
5 83
4 10
.8
2.07
9 20
.3
3.73
635
.539
7936
.457
7345
.967
0451
.0
FRAN
CE
244
4.1
269
3.4
332
4.3
196
1.9
297
2.8
330
3.0
460
3.7
315
2.4
GERM
ANY
407
6.8
416
5.3
349
4.5
187
1.8
186
1.8
308
2.8
167
1.3
205
1.6
ITALY
1.
698
28.2
1.
701
21.5
1.
830
23.6
1.
547
15.1
88
38.
486
87.
972
65.
866
65.
1
JAPA
N 81
8 13
.6
362
4.6
267
3.4
54
0.5
180.
216
0.1
430.
321
0.2
NETH
ERLA
NDS
176
2.9
125
1.6
142
1.8
358
3.5
420.
492
0.1
840.
796
0.7
SOUT
H KO
REA
203
3.4
140
1.8
67
0.9
50
0.5
800.
831
0.3
740.
635
0.3
SPAI
N 27
2 4.
5 50
2 6.
4 52
7 6.
8 89
0 8.
7 48
54.
632
93.
029
72.
432
52.
5
SWITZ
ERLA
ND
117
1.9
183
2.3
151
1.9
154
1.5
179
1.7
164
1.5
162
1.3
169
1.3
TAIW
AN
736
12.2
1.
426
18.0
1.
146
14.8
1.
262
12.3
99
09.
416
0114
.61.
704
13.5
1112
8.5
UNITE
D ST
ATES
45
0.
7 26
3 3.
3 31
5 4.
1 30
3 3.
0 21
52.
015
51.
410
40.
867
0.5
OTHE
RS
937
15.6
1.
648
20.9
1.
585
20.4
2.
912
28.4
32
4030
.828
1425
.727
3021
.732
0124
.4
TOTA
L 6.
024
100.
0 7.
901
100.
0 7.
754
100.
0 10
.266
10
0.0
10.5
3110
0.0
1094
510
0.0
1257
610
0.0
1313
610
0.0
(Fon
te: E
labo
razio
ne p
ropr
ia)
(Sou
rce:
ow
n da
ta p
roce
ssin
g)

112 XXV Rapporto Marmo e Pietre nel Mondo 2014 XXV World Marble and Stones Report 2014 113
43.
Inte
rsca
mbi
o m
ondi
ale
di la
vora
ti se
mpl
ici (
cod.
68.
01):
impo
rt (0
00 to
nn.)
Wor
ld e
xcha
nge
of si
mpl
e pr
oces
sed
ston
es (c
ode
68.0
1): i
mpo
rt (0
00 to
ns)
1995
19
99
2000
20
05
2010
2011
2012
2013
COUN
TRIE
S00
0to
ns%
000
tons
%00
0to
ns%
000
tons
%00
0to
ns%
000
tons
%00
0to
ns%
000
tons
%
AUST
RIA
25
1.3
65
2.6
76
2.5
110
3.0
952.
999
2.9
622.
096
3.3
BELG
IUM
10
6 5.
6 11
2 4.
5 13
0 4.
3 30
6 8.
3 34
410
.435
410
.435
111
.223
27.
9
DEN
MAR
K 50
2.
6 61
2.
5 90
3.
0 16
0 4.
3 10
13.
111
53.
482
2.6
732.
5
FRAN
CE
98
5.1
186
7.5
240
8.0
314
8.5
357
10.8
314
9.2
412
13.1
448
15.2
GERM
ANY
865
45.5
1.
019
41.0
1.
124
37.5
73
5 19
.9
615
18.6
930
27.2
735
23.4
778
26.4
ITAL
Y 25
1.
3 56
2.
2 55
1.
8 21
1 5.
7 13
24.
013
64.
094
3.0
732.
5
JAPA
N
296
15.6
21
4 8.
6 21
0 7.
0 21
0.
6 13
44.
113
64.
015
14.
814
95.
1
NET
HERL
ANDS
13
4 7.
0 22
1 8.
9 24
1 8.
0 58
6 15
.9
391
11.8
317
9.3
235
7.5
143
4.9
NOR
WAY
43
2.
3 45
1.
8 54
1.
8 88
2.
4 12
23.
7...
...82
2.6
--
SWED
EN
26
1.4
43
1.7
56
1.9
53
1.4
451.
464
1.9
511.
655
1.9
SWIT
ZERL
AND
86
4.5
95
3.8
98
3.3
124
3.4
107
3.2
116
3.4
103
3.3
963.
2
TAIW
AN
9 0.
5 89
3.
6 97
3.
2 15
3 4.
1 58
1.8
371.
125
0.8
421.
4
OTHE
RS
140
7.4
278
11.2
52
4 17
.5
828
22.4
80
024
.279
723
.376
224
.276
125
.8
TOTA
L 1.
903
100.
0 2.
484
100.
0 2.
995
100.
0 3.
689
100.
0 3.
301
100.
034
1510
0.0
3145
100.
029
4610
0.0
(Fon
te: E
labo
razio
ne p
ropr
ia)
(Sou
rce:
ow
n da
ta p
roce
ssin
g)
42.
Inte
rsca
mbi
o m
ondi
ale
di la
vora
ti se
mpl
ici (
cod.
68.
01):
expo
rt (0
00 to
nn.)
Wor
ld e
xcha
nge
of si
mpl
e pr
oces
sed
ston
es (c
ode
68.0
1): e
xpor
t (00
0 to
ns)
1995
19
99
2000
20
05
2010
2011
2012
2013
COUN
TRIE
S00
0to
ns%
000
tons
%00
0to
ns%
000
tons
%00
0to
ns%
000
tons
%00
0to
ns%
000
tons
%
BELG
IUM
13
6 7.
1 21
6 8.
7 15
5 5.
2 43
8 11
.9
179
5.4
200
5.9
199
6.3
126
4.3
BRAZ
IL
8 0.
4 33
1.
3 40
1.
3 13
0 3.
5 10
13.
110
23.
070
2.2
401.
4
C HIN
A 41
8 22
.0
354
14.3
77
0 25
.7
250
6.8
1.03
831
.410
332
.31.
041
33.1
1.10
337
.4
CZEC
H RE
P. 10
4 5.
5 18
8 7.
6 20
8 6.
9 73
2.
0 57
1.7
651.
983
2.6
692.
3
FRAN
CE
5 0.
3 16
0.
6 20
0.
7 20
0.
5 34
1.0
320.
924
0.8
240.
8
G ERM
ANY
26
1.4
79
3.2
137
4.6
209
5.7
149
4.5
205
6.0
147
4.7
143
4.8
INDI
A 31
1.
6 99
4.
0 12
3 4.
1 48
5 13
.2
......
30.
133
310
.629
19.
8
ITAL
Y 23
2 12
.2
213
8.6
231
7.7
198
5.4
160
4.8
153
4.5
149
4.7
137
4.7
NET
HERL
ANDS
58
3.
0 12
2 4.
9 78
2.
6 26
7 7.
2 21
56.
518
05.
310
53.
344
1.5
P OLA
ND
152
8.0
245
9.9
236
7.9
45
1.2
912.
847
1.4
782.
545
1.5
PORT
UGAL
49
0 25
.7
598
24.1
66
5 22
.2
397
10.8
35
910
.936
810
.840
012
.738
613
.1
S PAI
N
11
0.6
15
0.6
33
1.1
12
0.3
210.
628
0.8
80.
320
0.7
OTHE
RS
232
12.2
30
6 12
.3
299
10.0
1.
165
31.5
89
727
.292
927
.250
816
.251
817
.6
T OTA
L 1.
903
100.
0 2.
484
100.
0 2.
995
100.
0 3.
689
100.
0 3.
301
100.
034
1510
0.0
3145
100.
029
4699
.9
(Fon
te: E
labo
razio
ne p
ropr
ia)
(Sou
rce:
ow
n da
ta p
roce
ssin
g)

114 XXV Rapporto Marmo e Pietre nel Mondo 2014 XXV World Marble and Stones Report 2014 115
44.
Inte
rsca
mbi
o m
ondi
ale
di la
vora
ti sp
ecia
li (c
od. 6
8.02
): ex
port
(000
tonn
.) W
orld
exc
hang
e of
pro
cess
ed st
ones
(cod
e 68
.02)
: exp
ort (
000
tons
)
1995
19
99
2000
20
05
2010
2011
2012
2013
COUN
TRIE
S00
0to
ns%
000
tons
%00
0to
ns%
000
tons
%00
0to
ns%
000
tons
%00
0to
ns%
000
tons
%
BELG
IUM
48
0.
9 10
8 1.
6 12
5 1.
6 20
6 1.
4 21
31.
122
11.
121
11.
016
30.
8
BRAZ
IL
55
1.0
104
1.4
168
2.1
767
5.3
778
3.9
761
3.8
886
4.4
1.13
25.
4
C AN
ADA
46
0.8
153
2.1
178
2.3
160
1.1
126
0.6
154
0.8
170
0.8
167
0.8
CHIN
A 1.
203
21.5
1.
878
26.0
2.
297
29.3
6.
908
47.4
1037
851
.810
577
526
9663
47.6
9587
45.4
FRAN
CE
92
1.6
117
1.6
114
1.5
78
0.5
128
0.6
110
0.5
170
0.5
105
0.5
G REE
CE
155
2.8
153
2.1
150
1.9
113
0.8
322
1.6
327
1.6
341
1.7
192
0.9
INDI
A 16
8 3.
0 26
7 3.
7 31
2 4.
0 83
9 5.
8 10
655.
311
465.
714
607.
219
809.
4
ITAL
Y 2.
357
42.0
2.
370
32.9
2.
471
31.5
1.
912
13.1
1478
7.4
1450
7.2
1484
7.3
1508
7.1
MEX
ICO
115
2.1
103
1.4
112
1.4
140
1.0
870.
412
50.
685
0.4
880.
4
P ORT
UGAL
21
3 3.
8 24
2 3.
4 26
3 3.
4 28
5 2.
0 32
31.
630
31.
536
31.
839
61.
9
SPAI
N
371
6.6
396
5.5
448
5.7
502
3.4
525
2.6
554
2.8
614
3.0
675
3.2
T URK
EY
123
2.2
238
3.3
290
3.7
1.28
1 8.
8 1.
677
8.4
1772
8.8
1928
9.5
2108
10.0
OTHE
RS
660
11.8
1.
085
15.0
91
7 11
.7
1.39
1 9.
5 2.
926
14.6
2624
13.0
2994
14.7
3017
14.3
T OTA
L 5.
606
100.
0 7.
214
100.
0 7.
845
100.
0 14
.582
10
0.0
20.0
2610
0.00
2012
410
0.0
2030
610
0.0
2111
810
0.0
(Fon
te: E
labo
razio
ne p
ropr
ia)
(Sou
rce:
ow
n da
ta p
roce
ssin
g)
45.
Inte
rsca
mbi
o m
ondi
ale
di la
vora
ti sp
ecia
li (c
od. 6
8.02
): im
port
(000
tonn
.) W
orld
exc
hang
e of
pro
cess
ed st
ones
(cod
e 68
.02)
: im
port
(000
tons
)
1995
19
99
2000
20
05
2010
2011
2012
2013
COUN
TRIE
S00
0to
ns%
000
tons
%00
0to
ns%
000
tons
%00
0to
ns%
000
tons
%00
0to
ns%
000
tons
%
BELG
IUM
96
1.7
215
3.0
218
2.8
451
3.1
630
3.1
644
3.2
532
2.6
493
2.3
CHIN
A 15
92.
824
13.
313
91.
860
0.4
480.
249
92.
544
52.
221
81.
0
FRAN
CE14
1 2.
516
82.
314
31.
824
51.
730
91.
535
41.
832
21.
641
82.
0
GERM
ANY
754
13.4
738
10.2
540
6.9
734
5.0
809
4.0
905
4.5
842
4.1
790
3.7
HON
G-KO
NG
306
5.5
323
4.5
211
2.7
238
1.6
265
1.3
260
1.3
183
0.9
237
1.1
ITAL
Y57
1.0
126
1.7
100
1.3
240
1.6
243
1.2
255
1.3
221
1.1
204
0.9
JAPA
N98
717
.61.
135
15.7
1.22
215
.61.
628
11.2
869
4.3
846
4.2
826
4.1
802
3.8
NET
HERL
ANDS
951.
712
11.
714
51.
833
22.
324
21.
231
71.
624
21.
216
90.
8
SAUD
I ARA
BIA
365
6.5
353
4.9
391
5.0
426
2.9
513
2.6
807
4.0
973
4.8
1472
7.0
SOUT
H KO
REA
661.
212
51.
735
84.
61.
715
11.8
2340
11.7
2487
12.4
2170
10.7
2387
11.3
S PAI
N10
81.
917
02.
414
41.
827
01.
921
41.
126
21.
388
0.4
900.
4
UNIT
ED S
TATE
S79
114
.11.
217
16.9
1.43
816
.74.
180
23.0
3004
15.0
2581
12.8
2840
14.0
3188
15.1
OTHE
RS
1.68
130
.02.
282
31.6
2.91
437
.05.
163
35.4
10.5
4052
.699
0749
.210
622
52.3
1065
050
.4
TOTA
L5.
606
100.
07.
214
100.
07.
845
100.
014
.582
100.
020
.026
100.
020
124
100.
020
306
100.
021
118
100.
0
(Fon
te: E
labo
razio
ne p
ropr
ia)
(Sou
rce:
ow
n da
ta p
roce
ssin
g)

116 XXV Rapporto Marmo e Pietre nel Mondo 2014 XXV World Marble and Stones Report 2014 117
46.
Inte
rsca
mbi
o m
ondi
ale
di a
rdes
ia (c
od. 6
8.03
): ex
port
(000
tonn
.) W
orld
exc
hang
e of
pro
cess
ed sl
ates
(cod
e 68
.03)
: exp
ort (
000
tons
)
1995
19
99
2000
20
05
2010
2011
2012
2013
COUN
TRIE
S00
0to
ns%
000
tons
%00
0to
ns%
000
tons
%00
0to
ns%
000
tons
%00
0to
ns%
000
tons
%
BRAZ
IL
12
1.9
50
5.6
69
6.4
203
16.2
16
012
.212
09.
611
08.
810
38.
8
CAN
ADA
8 1.
2 25
2.
8 30
2.
8 35
2.
8 26
2.0
221.
815
1.2
201.
7
C HIN
A 35
5.
4 69
7.
8 70
6.
4 10
3 8.
2 41
231
.540
232
.136
228
.942
636
.4
FRAN
CE
9 1.
4 6
0.7
4 0.
4 4
0.3
20.
25
0.4
10.
13
0.3
GERM
ANY
7 1.
1 10
1.
1 13
1.
2 10
0.
8 13
1.0
151.
214
1.1
110.
9
I NDI
A 5
0.8
26
2.9
30
2.8
111
8.8
524.
016
1.3
211.
742
3.6
ITAL
Y 36
5.
6 37
4.
2 33
3.
0 21
1.
7 10
0.8
100.
810
0.8
100.
9
NOR
WAY
16
2.
5 10
1.
1 18
1.
7 5
0.4
70.
512
1.0
110.
910
0.9
S PAI
N
464
72.0
53
6 60
.4
718
66.1
63
2 50
.3
509
39.0
504
40.2
497
39.7
453
38.7
TAIW
AN
10
1.6
45
5.1
18
1.7
25
2.0
20.
21
0.1
10.
1-
-
UN. K
INGD
OM
10
1.6
15
1.7
15
1.4
25
2.0
211.
615
1.2
131.
018
1.5
U NIT
ED S
TATE
S 5
0.8
26
2.9
15
1.4
12
1.0
60.
58
0.6
80.
67
0.6
OTHE
RS
27
4.2
32
3.6
53
4.9
70
5.6
866.
512
49.
918
815
.067
5.7
T OTA
L 64
4 10
0.0
1.08
6 10
0.0
967
100.
0 1.
369
100.
01.
306
100.
012
5410
0.0
1251
100.
011
7010
0.0
(Fon
te: E
labo
razio
ne p
ropr
ia)
(Sou
rce:
ow
n da
ta p
roce
ssin
g)
47.
Inte
rsca
mbi
o m
ondi
ale
di a
rdes
ia (c
od. 6
8.03
): im
port
(000
tonn
.) W
orld
exc
hang
e of
pro
cess
ed sl
ates
(cod
e 68
.03)
: im
port
(000
tons
)
1995
19
99
2000
20
05
2010
2011
2012
2013
COUN
TRIE
S00
0to
ns%
000
tons
%00
0to
ns%
000
tons
%00
0to
ns%
000
tons
%00
0to
ns%
000
tons
%
BELG
IUM
50
7.
8 47
5.
3 38
3.
5 43
3.
4 42
3.2
413.
334
2.7
342.
9
CAN
ADA
6 0.
9 11
1.
2 14
1.
3 16
1.
3 24
1.8
231.
817
1.4
151.
3
FRAN
CE
229
35.6
26
7 30
.1
294
27.1
31
7 25
.2
273
20.9
258
20.6
237
18.9
218
18.6
GERM
ANY
155
24.1
14
3 16
.1
158
14.5
10
7 8.
5 92
7.0
123
9.8
112
9.0
988.
4
IREL
AND
10
1.6
33
3.7
37
3.4
48
3.8
171.
318
1.4
131.
024
2.1
NET
HERL
ANDS
18
2.
8 12
1.
4 19
1.
7 14
1.
1 17
1.3
231.
812
1.0
131.
1
SAUD
I ARA
BIA
--
32
3.6
10
0.9
7 0.
6 -
-17
1.3
151.
218
1.5
SOUT
H AF
RICA
-
-10
1.
1 11
1.
0 2
0.2
100.
87
0.6
60.
55
0.4
SWIT
ZERL
AND
4 0.
6 5
0.6
9 0.
8 8
0.6
80.
67
0.6
60.
58
0.7
TAIW
AN
11
1.7
18
2.0
15
1.4
15
1.2
70.
67
0.6
80.
65
0.4
UN. K
INGD
OM
51
7.9
62
7.0
95
8.7
218
17.4
19
114
.618
714
.916
913
.518
615
.9
UNIT
ED S
TATE
S 50
7.
8 92
10
.4
99
9.1
170
13.5
13
410
.313
010
.413
210
.612
810
.9
OTHE
RS
60
9.3
155
17.5
28
7 26
.4
291
23.2
49
137
.641
332
.949
039
.241
735
.6
TOTA
L 64
4 10
0.0
887
100.
0 1.
086
100.
0 1.
256
100.
0 1.
306
100.
012
5410
0.0
1251
100.
011
7010
0.0
(Fon
te: E
labo
razio
ne p
ropr
ia)
(Sou
rce:
ow
n da
ta p
roce
ssin
g)

118 XXV Rapporto Marmo e Pietre nel Mondo 2014 XXV World Marble and Stones Report 2014 119
48. ITALIA: export lapideo (000 tonn.) ITALy: stone export (000 tons)
YEARS Raw Processed TOTAL
25.15 25.16 Total 68.01 68.02 68.03 Total Vol. Index Δ %
1997 596 204 800 224 2.503 36 2.763 3.563 100.0 -
1998 635 217 852 205 2.415 36 2.656 3.508 98.5 - 1.5
1999 616 193 809 213 2.370 37 2.620 3.429 96.2 - 2.3
2000 769 131 900 231 2.471 33 2.735 3.635 102.0 6.0
2001 755 185 940 221 2.356 33 2.610 3.550 99.6 - 2.3
2002 706 155 861 223 2.076 31 2.330 3.191 89.5 - 10.1
2003 688 175 863 208 1.976 24 2.208 3.071 86.2 - 3.8
2004 490 216 706 210 2.150 23 2.383 3.089 86.7 0.6
2005 786 205 991 198 1.912 21 2.131 3.122 87.6 1.1
2006 885 189 1.074 201 1.965 21 2.187 3.261 91.5 4.5
2007 971 197 1.168 208 1.948 18 2.174 3.342 93.8 2.5
2008 1.007 170 1.177 180 1.784 13 1977 3.154 88.5 - 5.6
2009 1.075 162 1.237 168 1.420 10 1.598 2.853 79.6 -10.1
2010 1.321 175 1.496 160 1.478 10 1.648 3.144 88.2 10.9
2011 1.287 162 1.449 153 1.450 10 1.613 3.062 85.9 -2.6
2012 1.379 158 1.537 149 1.484 10 1.643 3.180 89.3 +3.8
2013 1.416 152 1.568 137 1.508 10 1.655 3.223 90.5 +1.4
(Fonte: Elaborazione dati Eurostat) (Source: Eurostat data processing)
49. ITALIA: import lapideo (000 tonn.) ITALy: stone import (000 tons)
YEARS Raw Processed TOTAL
25.15 25.16 Total 68.01 68.02 68.03 Total Vol. Index Δ %
1997 334 1.692 2.026 46 68 4 118 2.144 100.0 -
1998 317 1.692 2.009 49 69 5 123 2.132 99.4 - 0.6
1999 310 1.701 2.011 56 126 3 185 2.196 102.4 3.0
2000 368 1.830 2.198 55 100 6 161 2.359 110.0 7.4
2001 431 1.726 2.157 69 91 7 167 2.324 108.4 - 1.5
2002 368 1.608 1.976 97 90 7 194 2.170 101.2 - 6.6
2003 431 1.589 2.020 115 126 10 251 2.271 105.9 4.7
2004 495 1.800 2.295 124 248 14 386 2.681 125.0 18.1
2005 470 1.547 2.017 211 240 15 466 2.483 115.8 - 7.4
2006 608 1.660 2.268 151 302 17 470 2.738 127.7 10.3
2007 678 1.538 2.216 140 275 24 439 2.655 123.8 - 3.0
2008 664 1.187 1.851 161 272 23 456 2.307 107.6 - 13.1
2009 402 784 1.186 156 234 18 408 1.594 74.3 -30.9
2010 427 883 1.310 132 243 13 388 1.698 79.2 6.5
2011 351 868 1.219 136 255 19 410 1.629 76.0 -4.1
2012 317 726 1.043 94 221 17 332 1.375 64.1 -15.6
2013 320 666 986 73 204 15 292 1.278 59.6 -7.1
(Fonte: Elaborazione dati Eurostat) (Source: Eurostat data processing)

120 XXV Rapporto Marmo e Pietre nel Mondo 2014 XXV World Marble and Stones Report 2014 121
50. ITALIA: export lapideo di lavorati (cod. 68.02) ITALy: processed stone export (cod. 68.02)
YEARSQuantity Value Average price
000 tons Index mill. e Index e/ton e/sq.mt./2 Index
2000 2.471 100.0 1.668,9 100.0 675,4 36,50 100.0
2001 2.356 95.3 1.584,5 94.9 672,5 36,35 99.6
2002 2.076 84.0 1.548,8 92.8 746,1 40,33 110.5
2003 1.976 80.0 1.661,5 99.6 840,8 45,45 124.5
2004 2.150 87.0 1.530,3 91.7 711,8 38,47 105.4
2005 1.912 77.4 1.452,0 87.0 759,4 41,05 112.5
2006 1.965 79.5 1.566,2 93.8 797,0 43,08 118.0
2007 1.948 78.8 1.564,0 93.7 802,9 43,90 118.9
2008 1.784 72.2 1.447,7 86.7 811,5 43,84 120.2
2009 1.420 57.5 1.116,9 66.9 786,5 42,52 116.5
2010 1.478 59.8 1.187,5 73.5 829,5 43,42 119.0
2011 1.450 58.7 1.224,6 73.4 844,6 45,65 125.1
2012 1.484 60.1 1.364,0 81.7 919,1 49,68 136.1
2013 1.508 61.0 1.460,1 87.5 968,2 52,34 143.4
(Fonte: Elaborazione dati Eurostat) (Source: Eurostat data processing)
51.ITALIA: export disaggregato di lavorati lapidei (cod. 68.01/02/03)ITALy: disaggregated export of processed stones (cod. 68.01.02.03)
REGIONI
2011 2012 2013 ∆ %
mill. Euro
% mill. Euro
% mill. Euro
% ‘13:’11 ‘13:’12
VENETO 424,8 33.3 459,7 32.7 493,3 32.9 +16.1 +7.3
TOSCANA 396,5 31.2 455,3 32.4 492,1 32.8 +24.1 +8.1
LOMBARDIA 110,0 8.6 122,3 8.7 135,1 9.0 +22.8 +10.5
SICILIA 79,0 6.2 84,9 6.0 92,1 6.1 +16.6 +8.5
TRENTINO-A.A. 60,6 4.8 67,9 4.8 64,1 4.3 +5.8 -5.6
PIEMONTE-V.A. 44,6 3.5 43,3 3.1 46,2 3.1 +3.6 +6.7
LAZIO 30,6 2.4 39,8 2.8 36,6 2.4 +19.6 -8.0
FRIULI-V.G. 34,4 2.7 33,6 2.4 36,2 2.3 +5.2 +7.7
EMILIA-ROMAGNA 28,7 2.3 29,6 2.1 34,9 23 +21.6 +17.9
LIGURIA 16,7 1.3 17,1 1.2 22,1 1.5 +32.3 +29.2
PUGLIA 16,8 1.3 20,0 1.4 19,5 1.3 +16.1 -2.5
SARDEGNA 3,0 0.2 3,0 0.2 4,5 0.3 +50.0 +50.0
ALTRE 26,8 2.2 29,3 2.2 23,6 1.7 -11.9 -19.5
TOTALE 1.272,5 100.0 1.405,8 100.0 1.500,3 100.0 +17.9 +6.7
(Fonte: Elaborazione dati Veronafiere) (Source: Veronafiere data processing)

122 XXV Rapporto Marmo e Pietre nel Mondo 2014 XXV World Marble and Stones Report 2014 123
52. ITALIA: export lapideo ed export totale (Valore) ITALy: stone and total export (Value)
YEARSStone Codes Sector export Global export
25.15 25.16 68.01 68.02 68.03 Stone Index Total Stone sh.
2000 157,4 56,8 45,4 1.668,9 21,2 1.949,7 100.0 260.413 0.75
2001 153,5 46,3 43,6 1.584,5 21,7 1.849,6 94.9 272.990 0.69
2002 162,6 46,2 42,6 1.548,8 22,3 1.822,5 93.5 269.064 0.68
2003 162,9 57,5 45,3 1.661,5 17,9 1.945,1 99.8 264.616 0.73
2004 164,6 68,4 40,4 1.530,3 14,7 1.818,4 93.3 284.413 0.64
2005 151,6 55,3 37,6 1.452,0 13,0 1.709,5 87.7 299.923 0.57
2006 172,5 49,2 37,9 1.566,2 13,1 1.838,9 94.3 332.013 0.55
2007 188,6 46,5 40,8 1.564,0 11,1 1.851,0 94.9 364.744 0.51
2008 198,4 45,3 35,5 1.447,7 8,7 1.735,6 89.0 369.016 0.47
2009 204,4 38,8 32,6 1.116,9 6,2 1.398,9 71.7 290.800 0.47
2010 259,9 41,8 32,3 1.187,5 6,8 1.528,3 78.4 336.750 0.45
2011 288,3 39,5 34,9 1.224,6 6,7 1.594,0 81,8 375.829 0.42
2012 305,1 40,9 35,2 1.364,0 6,6 1.751,8 89.8 389.725 0.45
2013 333,4 40,0 33,1 1.460,1 7,0 1.873,6 96.1 389.834 0.48
(Fonte: Elaborazione propria) (Source: own data processing)
53.SPAGNA: export lapideo (000 USD)SPAIN: stone export (000 USD)
PAR. YEAR 25.15 25.16 68.01 68.02 68.03 TOTAL
ABS.
FIG
URES
2001 182,4 39,9 8,2 295,9 281,7 808,1
2008 324,6 61,9 12,6 452,5 422,5 1.274,1
2009 224,8 38,5 9,4 360,5 349,3 982,5
2010 267,9 35,1 9,1 356,0 351,9 1.020,0
2011 311,9 44,5 15,7 405,8 381,1 1.159,0
2012 312,4 42,7 8,1 415,2 345,1 1.123,5
2013 334,0 49,0 14,2 464,5 322,2 1.183,9
INDE
X
2001 100.0 100.0 100.0 100.0 100.0 100.0
2008 178.0 155.1 153.7 152.9 150.0 157.7
2009 123.2 96.5 114.6 121.8 124.0 121.6
2010 146.9 88.0 111.0 120.3 124.9 126.2
2011 171.0 111.5 191.5 137.1 135.3 143.4
2012 171.3 107.0 98.8 140.3 122.5 139.0
2013 183.1 122.8 173.2 157.0 114.4 146.5
(Fonte: Elaborazione dati Comtrade) (Source: Comtrade data processing)
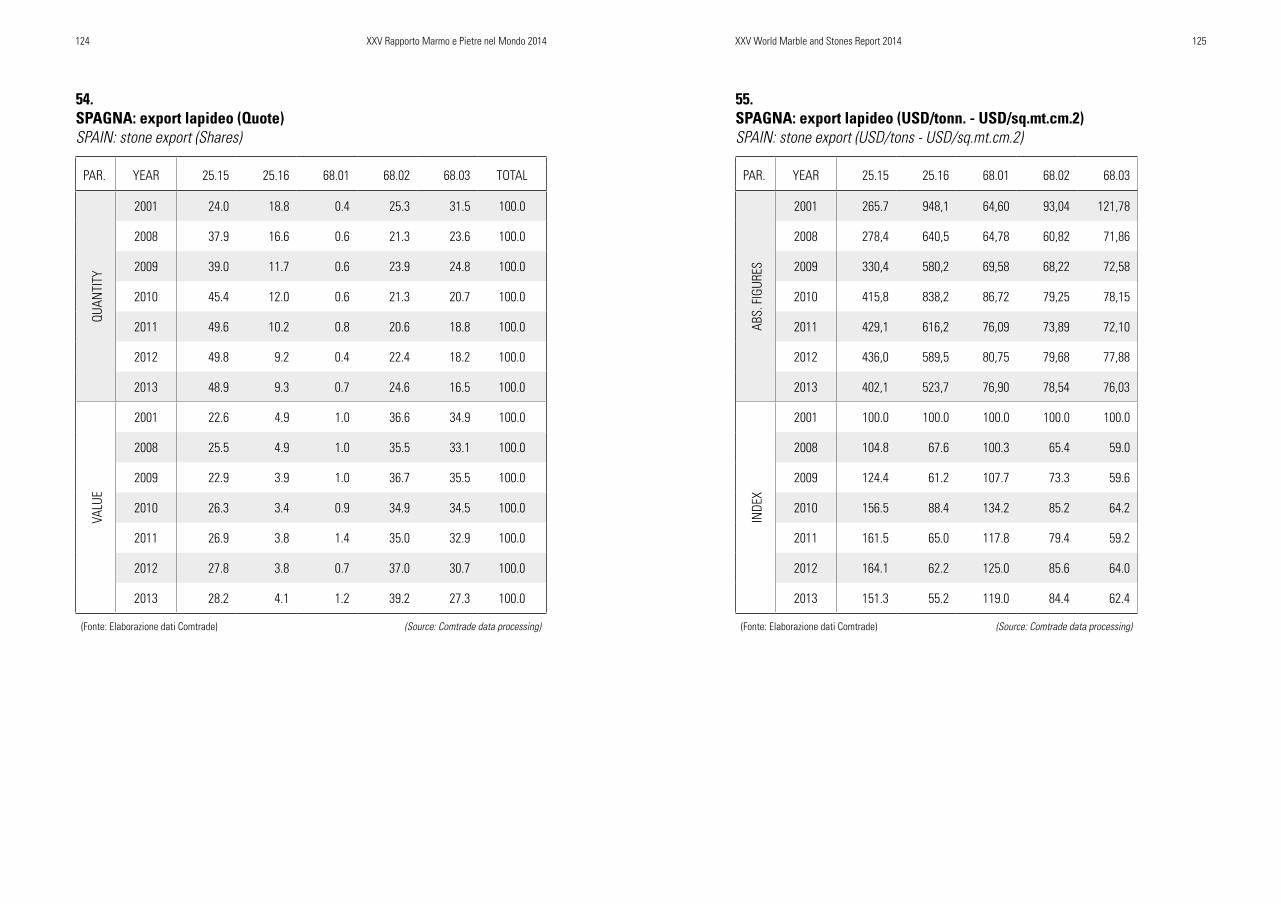
124 XXV Rapporto Marmo e Pietre nel Mondo 2014 XXV World Marble and Stones Report 2014 125
54.SPAGNA: export lapideo (Quote)SPAIN: stone export (Shares)
PAR. YEAR 25.15 25.16 68.01 68.02 68.03 TOTAL
QUAN
TITY
2001 24.0 18.8 0.4 25.3 31.5 100.0
2008 37.9 16.6 0.6 21.3 23.6 100.0
2009 39.0 11.7 0.6 23.9 24.8 100.0
2010 45.4 12.0 0.6 21.3 20.7 100.0
2011 49.6 10.2 0.8 20.6 18.8 100.0
2012 49.8 9.2 0.4 22.4 18.2 100.0
2013 48.9 9.3 0.7 24.6 16.5 100.0
VALU
E
2001 22.6 4.9 1.0 36.6 34.9 100.0
2008 25.5 4.9 1.0 35.5 33.1 100.0
2009 22.9 3.9 1.0 36.7 35.5 100.0
2010 26.3 3.4 0.9 34.9 34.5 100.0
2011 26.9 3.8 1.4 35.0 32.9 100.0
2012 27.8 3.8 0.7 37.0 30.7 100.0
2013 28.2 4.1 1.2 39.2 27.3 100.0
(Fonte: Elaborazione dati Comtrade) (Source: Comtrade data processing)
55.SPAGNA: export lapideo (USD/tonn. - USD/sq.mt.cm.2)SPAIN: stone export (USD/tons - USD/sq.mt.cm.2)
PAR. YEAR 25.15 25.16 68.01 68.02 68.03
ABS.
FIG
URES
2001 265.7 948,1 64,60 93,04 121,78
2008 278,4 640,5 64,78 60,82 71,86
2009 330,4 580,2 69,58 68,22 72,58
2010 415,8 838,2 86,72 79,25 78,15
2011 429,1 616,2 76,09 73,89 72,10
2012 436,0 589,5 80,75 79,68 77,88
2013 402,1 523,7 76,90 78,54 76,03
INDE
X
2001 100.0 100.0 100.0 100.0 100.0
2008 104.8 67.6 100.3 65.4 59.0
2009 124.4 61.2 107.7 73.3 59.6
2010 156.5 88.4 134.2 85.2 64.2
2011 161.5 65.0 117.8 79.4 59.2
2012 164.1 62.2 125.0 85.6 64.0
2013 151.3 55.2 119.0 84.4 62.4
(Fonte: Elaborazione dati Comtrade) (Source: Comtrade data processing)

126 XXV Rapporto Marmo e Pietre nel Mondo 2014 XXV World Marble and Stones Report 2014 127
56.SPAGNA: import lapideo (000 USD)SPAIN: stone import (000 USD)
PAR. YEAR 25.15 25.16 68.01 68.02 68.03 TOTAL
ABS.
FIG
URES
2001 39,6 112,2 2,6 67,7 3,4 225,5
2008 61,6 61,9 14,4 170,4 20,9 329,2
2009 31,5 84,2 11,6 105,0 13,6 245,9
2010 20,8 35,1 13,6 110,9 16,6 197,0
2011 21,6 73,2 8,6 78,9 16,7 199,0
2012 14,4 61,7 8,1 57,2 14,1 155,5
2013 13,4 61,2 5,5 50,3 12,0 142,4
INDE
X
2001 100.0 100.0 100.0 100. 100.0 100.0
2008 155.5 55.2 553.8 251.7 614.7 146.0
2009 79.5 75.0 446.1 155.1 400.0 109.0
2010 52.5 31.3 523.1 163.8 488.2 87.4
2011 54.5 65.2 330.8 116.5 491.2 88.2
2012 36.4 55.0 311.5 84.5 414.7 69.0
2013 33.8 54.5 211.5 74.2 352.9 63.1
(Fonte: Elaborazione dati Comtrade) (Source: Comtrade data processing)
57.SPAGNA: import lapideo (Quote)SPAIN: stone import (Shares)
PAR. YEAR 25.15 25.16 68.01 68.02 68.03 TOTAL
VALU
E
2001 17.6 49.8 0.2 30.0 0.4 100.0
2008 18.7 18.8 4.4 51.8 6.3 100.0
2009 12.8 34.2 4.7 42.7 5.6 100.0
2010 10.6 17.8 6.9 56.3 8.4 100.0
2011 10.9 36.8 4.3 39.6 8.4 100.0
2012 9.3 39.7 5.1 36.8 9.1 100.0
2013 9.4 43.0 3.9 35.3 8.4 100.0
QUAN
TITY
2001 17.3 66.1 0.1 16.5 - 100.0
2008 28.1 35.6 2.7 29.8 3.8 100.0
2009 8.4 53.5 2.6 32.4 3.1 100.0
2010 8.4 46.1 6.6 33.6 5.3 100.0
2011 8.8 56.7 4.7 24.3 5.5 100.0
2012 7.6 65.1 2.6 19.3 5.4 100.0
2013 8.2 70.2 2.4 15.0 4.2 100.0
(Fonte: Elaborazione dati Comtrade) (Source: Comtrade data processing)

128 XXV Rapporto Marmo e Pietre nel Mondo 2014 XXV World Marble and Stones Report 2014 129
58.SPAGNA: import lapideo (USD/tonn. - USD/sq.mt.cm.2)SPAIN: stone import (USD/tons - USD/sq.mt.cm.2)
PAR. YEAR 25.15 25.16 68.01 68.02 68.03
ABS.
FIG
URES
2001 208,0 154,1 14,18 22,55 21,00
2008 196,5 156,1 26,40 27,68 26,61
2009 372,7 157,6 24,78 17,53 23,36
2010 376,4 119,2 17,51 28,00 26,33
2011 420,2 220,2 16,51 30,00 28,04
2012 417,1 207,6 36,12 35,10 30,78
2013 350,3 188,1 28,28 39,07 33,13
INDE
X
2001 100.0 100.0 100.0 100.0 100.0
2008 94.5 101.3 186.2 122.7 126.7
2009 179.2 102.3 174.7 77.8 111.2
2010 181.0 77.4 123.5 124.2 125.4
2011 202.0 142.9 116.4 133.0 133.5
2012 200.5 134.7 254.7 155.6 146.6
2013 168.4 122.1 199.4 173.3 157.8
(Fonte: Elaborazione dati Comtrade) (Source: Comtrade data processing)
59. CINA: export lapideo. Cifre assolute (000 tonn.)CHINA: stone export. Absolute figures (000 tons)
YEARS 25.15 25.16 68.01 68.02 68.03 TOTAL
1994 13 925 375 870 22 2.205
1995 15 722 418 1.203 35 2.393
1996 39 875 732 1.398 51 3.095
1997 49 1.006 489 1.540 49 3.130
1998 35 709 274 1.477 73 2.568
1999 37 818 354 1.878 69 3.156
2000 42 916 770 2.297 70 4.095
2001 25 1.289 205 3.098 75 4.692
2002 55 801 591 4.167 86 5.700
2003 112 776 852 5.167 85 6.992
2004 66 1.279 198 5.871 120 7.534
2005 66 1.569 250 6.908 103 8.896
2006 86 960 419 8.727 146 10.338
2007 96 942 558 9.775 162 11.533
2008 69 713 846 9.756 409 11.793
2009 68 379 1.442 9.504 340 11.733
2010 80 588 1.038 10.378 412 12.496
2011 115 1.310 1.103 10.577 402 13.507
2012 118 1.413 1.041 9.663 362 12.597
2013 101 865 1.103 9.587 426 12.082
(Fonte: Elaborazione dati ICE) (Source: ICE data processing)

130 XXV Rapporto Marmo e Pietre nel Mondo 2014 XXV World Marble and Stones Report 2014 131
60. CINA: export lapideo. Indici (quantità)CHINA: stone export. Index (quantity)
YEARS 25.15 25.16 68.01 68.02 68.03 TOTAL
1994 100.0 100.0 100.0 100.0 100.0 100.0
1995 115.4 78.1 111.5 138.3 159.1 108.5
1996 300.0 95.0 195.2 160.7 231.8 140.4
1997 376.9 108.8 129.6 177.0 222.7 142.0
1998 269.2 76.6 73.1 169.8 331.8 116.5
1999 284.6 88.4 94.4 215.9 313.6 185.7
2000 323.1 99.0 205.3 264.0 318.2 185.7
2001 192.3 139.4 54.7 356.1 340.9 212.8
2002 423.1 86.6 157.6 479.0 390.9 258.5
2003 861.5 83.9 227.2 593.9 386.4 317.1
2004 507.7 138.3 52.8 674.8 545.5 341.7
2005 507.7 169.6 66.7 794.0 468.2 403.4
2006 661.5 103.8 111.7 1003.1 663.6 468.8
2007 738.5 101.8 148.8 1123.6 736.4 523.0
2008 530.8 77.1 225.6 1121.4 1859.1 534.8
2009 523.1 41.0 384.5 1092.4 1545.5 532.1
2010 615.4 63.6 276.8 1192.8 1872.7 566.7
2011 884.6 141.6 294.1 1215.7 1827.3 612.6
2012 907.7 152.8 277.6 1110.7 1645.4 571.3
2013 776.9 93.5 294.1 1102.0 1936.4 547.8
(Fonte: Elaborazione dati ICE) (Source: ICE data processing)
61. CINA: export lapideo. Quote per tipologie (%)CHINA: stone export. Shares for types (%)
YEARS 25.15 25.16 68.01 68.02 68.03 TOTAL
1994 0.59 41.95 17.00 39.45 1.01 100.0
1995 0.63 30.17 17.47 50.27 1.46 100.0
1996 1.26 28.27 23.65 45.17 1.65 100.0
1997 1.56 32.14 15.53 49.20 1.57 100.0
1998 1.36 27.61 10.67 57.52 2.84 100.0
1999 1.17 25.92 11.21 59.50 2.20 100.0
2000 1.03 22.37 18.80 56.09 1.71 100.0
2001 0.53 27.47 4.37 66.03 1.60 100.0
2002 0.96 14.05 10.36 73.11 1.52 100.0
2003 1.60 11.10 12.19 73.93 1.21 100.0
2004 0.88 16.98 2.63 77.93 1.58 100.0
2005 0.74 17.64 2.81 77.65 1.16 100.0
2006 0.83 9.29 4.04 84.42 1.42 100.0
2007 0.83 8.17 4.83 84.76 1.41 100.0
2008 0.59 6.05 7.17 82.73 3.46 100.0
2009 0.58 3.23 12.29 81.00 2.90 100.0
2010 0.64 4.71 8.31 83.05 3.29 100.0
2011 0.85 9.70 8.16 78.31 2.98 100.0
2012 0.93 11.22 8.26 76.71 2.88 100.0
2013 0.84 7.16 9.13 79.35 3.52 100.0
(Fonte: Elaborazione dati ICE) (Source: ICE data processing)

132 XXV Rapporto Marmo e Pietre nel Mondo 2014 XXV World Marble and Stones Report 2014 133
62. CINA: export lapideo (mill. USD)CHINA: stone export (mill. USD)
YEARS 25.15 25.16 68.01 68.02 68.03 TOTAL
1994 3,4 68,9 15,8 341,2 5,8 435,1
1995 4,2 57,9 21,2 528,4 13,9 625,6
1996 6,2 65,4 19,7 597,1 17,9 706,3
1997 4,8 49,5 28,2 639,0 18,8 740,3
1998 3,1 43,9 23,9 568,1 22,6 661,6
1999 3,8 39,2 16,4 608,4 21,0 688,8
2000 4,7 49,5 53,8 708,6 20,2 836,8
2001 3,8 38,7 15,7 849,1 18,8 926,1
2002 10,2 43,1 32,2 1.031,9 21,6 1.139,0
2003 9,4 40,1 11,6 1,249,6 20,7 1.331,4
2004 8,8 42,2 15,2 1.535,6 27,9 1.627,7
2005 8,8 52,1 17,1 2.064,9 28,7 2.171,6
2006 10,4 51,8 22,6 2.654,1 48,5 2.787,4
2007 12,6 34,3 16,0 3.160,5 111,8 3.335,2
2008 11,3 32,2 27,0 3.648,7 124,6 3.843,8
2009 10,4 19,9 48,7 3.380,7 102,8 3.562,5
2010 8,8 24,8 61,2 3.870,6 131,6 4.097,0
2011 9,7 28,6 67,6 4.762,8 139,3 5.008,0
2012 9,6 35,3 91,9 4.920,9 151,3 5.209,0
2013 18,8 97,7 168,9 5.752,1 168,8 6.206,3
(Fonte: Elaborazione dati ICE) (Source: ICE data processing)
63. CINA: prezzi medi dell’interscambio lapideo (export) CHINA: stone exchange average prices (export)
YEARS
25.15 25.16 68.01 68.02 68.03 TOTAL USD/
cub.mt. index USD /
cub.mt. index USD/
sq.mt.index USD/
sq.mt. index USD /
sq.mt. index USD/
ton. index
1994 700,6 100.0 201,2 100.0 2,28 100.0 21,19 100.0 14,24 100.0 197,3 100.0
1995 751,7 107.3 216,8 107.8 2,74 120.2 23,74 112.0 21,52 151.1 261,5 132.5
1996 429,3 61.3 202,0 100.4 1,46 64.1 23,09 109.0 19,02 133.5 228,2 115.7
1997 262,2 37.4 132,8 66.0 3,12 136.8 22,43 105.9 20,75 145.7 236,5 119.9
1998 237,9 34.0 167,4 83.2 4,71 206.6 20,79 98.1 16,74 117.6 257,7 130.6
1999 274,1 39.1 129,6 64.4 2,51 110.1 17,51 82.6 16,42 115.3 218,3 110.6
2000 305,1 43.5 145,8 72.5 3,78 165.8 16,68 78.7 15,61 109.6 204,3 103.5
2001 413,6 59.0 121,3 60.3 4,15 182.0 14,82 70.0 13,57 95.3 197,4 100.1
2002 498,9 71.2 145,2 72.2 2,94 128.9 13,38 63.1 13,55 95.2 199,8 101.2
2003 225,6 32.2 139,6 69.4 0,73 32.1 13,07 61.7 13,17 92.5 190,4 96.5
2004 358,4 51.2 89,1 44.3 4,16 182.4 14,13 66.6 12,57 88.3 216,3 109.6
2005 361,1 51.5 89,6 44.5 3,70 162.3 16,15 76.2 15,04 105.6 261,4 132.5
2006 327,2 46.7 145,6 72.4 2,91 127.7 16,44 77.5 17,96 126.1 269,6 136.7
2007 354,5 50.6 98,3 48.9 1,55 67.9 17,48 82.5 37,32 262.1 289,2 146.5
2008 442,1 63.1 122,0 60.6 1,72 75.4 20,22 95.4 16,47 115.6 325,9 165.2
2009 419,5 58.7 141.7 70.5 1.82 79.8 19.23 90.8 16.34 114,7 303.6 153.9
2010 297,0 42,4 113,9 56,6 3,19 139,9 20,16 95,1 17,26 121,2 327,8 166,1
2011 277,7 32.5 59,0 29.3 3,31 145.3 24,34 114.8 18.73 131.5 370.7 187.9
2012 219,6 31.3 67,5 33.5 4,25 186.5 27,52 129.9 22.58 158.6 413,5 209.6
2013 186,1 26.5 112,9 56.1 8,28 363.0 32,43 153.1 21,42 150.4 513,7 260,3
(Fonte: Elaborazione propria) (Source: own data processing)

134 XXV Rapporto Marmo e Pietre nel Mondo 2014 XXV World Marble and Stones Report 2014 135
64.CINA: export disaggregato di lavorati speciali (cod. 68.02)CHINA: diosaggregated export of processed stones (code 68.02)
COUNTRIES
2011 2012 2013
000 USD mill.tons.
USD/sq.mt.
000 USD mill.tons.
USD/sq.mt.
000 USD mill.tons.
USD/sq.mt.
SOUTH KOREA 829.245 2.193,8 20,43 789.593 2.080,0 20,52 831.970 1.976,3 22,73
JAPAN 660.319 1.024,7 34,83 695.316 962,9 39,03 727.294 915,8 42,93
USA 617.612 449,1 74,33 541.837 481,6 60,80 620.557 543,2 61,75
HONG-KONG 84.316 223,3 20,41 136.159 232,7 31,63 208.911 203,6 55,46
SAUDI ARABIA 110.923 311,9 19,23 133.128 354,3 20,31 202.100 378,8 28,84
GERMANY 201.574 665,7 16,37 192.039 549,4 18,90 182.931 490,3 20,16
VIETNAM 126.362 514,6 13,27 112.045 392,8 15,42 178.950 462,4 20,92
TAIWAN 139.179 250,4 30,04 111.375 236,4 25,47 138.302 241,2 31,00
EMIRATES 108.449 208,8 28,07 101.608 185,5 29,61 136.936 194,1 38,13
NETHERLANDS 117.645 379,9 16,74 118.992 335,5 30,45 127.924 310,2 22,29
RUSSIA 87.584 210,4 22,50 106.854 235,9 24,48 112.485 231,1 26,31
BELGIUM 110.921 471,1 12,73 102.913 366,8 15,17 110.645 305,1 19,60
OTHERS 1.568.689 3.673,3 23,08 1.779.042 3.250,0 29,58 2.173.075 3.332,8 35,24
TOTAL 4.762.818 10.577,0 24,34 4.920.901 9.663,8 27,52 5.752.074 9.586,9 32,43
(Fonte: Elaborazione dati ICE) (Source: ICE data processing)
65.CINA: export disaggregato (cod. 68.02). Quote e variazioni prezzi.CHINA: disaggregated export (code 68.02). Shares and price difference.
COUNTRIES
2011 2012 2013
value quantity value quantity value quantity
SOUTH KOREA 17.41 20.74 16.05 21.52 14.46 20.64
JAPAN 13.86 9.69 14.12 9.96 12.64 9.55
USA 12.97 4.25 11.01 4.98 10.79 5.67
HONG-KONG 1.77 2.11 2.77 2.41 3.63 2.12
SAUDI ARABIA 2.33 2.95 2.71 3.67 3.51 3.95
GERMANY 4.23 6.29 3.90 5.68 3.18 5.11
VIETNAM 2.65 4.87 2.28 4.06 3.11 4.82
TAIWAN 2.92 2.37 2.26 2.45 2.40 2.52
EMIRATES 2.28 1.97 2.06 1.92 2.38 2.02
NETHERLANDS 2.47 3.59 2.42 3.47 2.22 3.24
RUSSIA 1.84 1.99 2.17 2.44 1.96 2.41
BELGIUM 2.33 4.45 2.09 3.80 1.92 3.18
OTHERS 32.94 34.76 36.15 33.63 37.78 34.76
TOTAL 100.0 100.0 100.0 100.0 100.0 100.0
(Fonte: Elaborazione propria) (Source: own data processing)
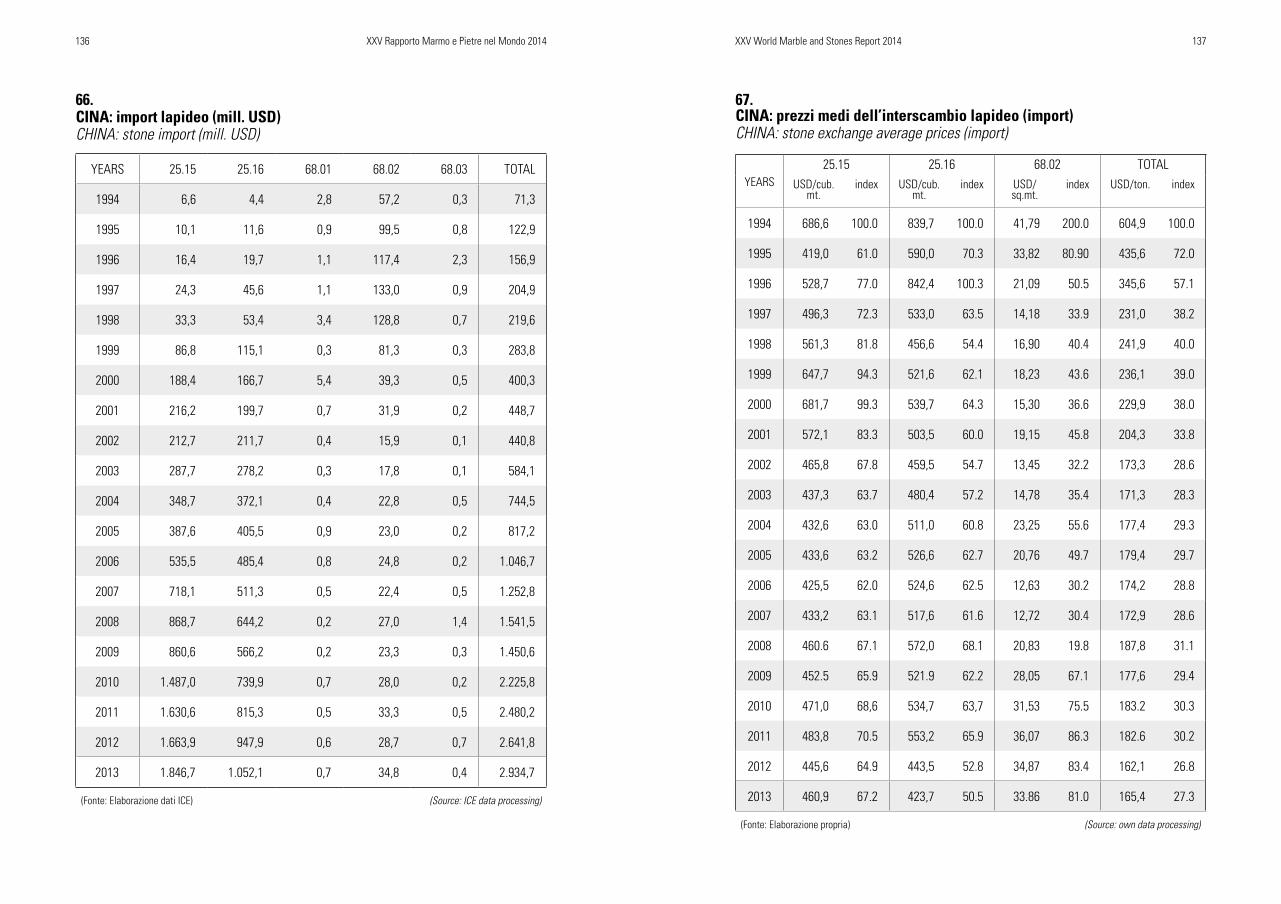
136 XXV Rapporto Marmo e Pietre nel Mondo 2014 XXV World Marble and Stones Report 2014 137
66. CINA: import lapideo (mill. USD)CHINA: stone import (mill. USD)
YEARS 25.15 25.16 68.01 68.02 68.03 TOTAL
1994 6,6 4,4 2,8 57,2 0,3 71,3
1995 10,1 11,6 0,9 99,5 0,8 122,9
1996 16,4 19,7 1,1 117,4 2,3 156,9
1997 24,3 45,6 1,1 133,0 0,9 204,9
1998 33,3 53,4 3,4 128,8 0,7 219,6
1999 86,8 115,1 0,3 81,3 0,3 283,8
2000 188,4 166,7 5,4 39,3 0,5 400,3
2001 216,2 199,7 0,7 31,9 0,2 448,7
2002 212,7 211,7 0,4 15,9 0,1 440,8
2003 287,7 278,2 0,3 17,8 0,1 584,1
2004 348,7 372,1 0,4 22,8 0,5 744,5
2005 387,6 405,5 0,9 23,0 0,2 817,2
2006 535,5 485,4 0,8 24,8 0,2 1.046,7
2007 718,1 511,3 0,5 22,4 0,5 1.252,8
2008 868,7 644,2 0,2 27,0 1,4 1.541,5
2009 860,6 566,2 0,2 23,3 0,3 1.450,6
2010 1.487,0 739,9 0,7 28,0 0,2 2.225,8
2011 1.630,6 815,3 0,5 33,3 0,5 2.480,2
2012 1.663,9 947,9 0,6 28,7 0,7 2.641,8
2013 1.846,7 1.052,1 0,7 34,8 0,4 2.934,7
(Fonte: Elaborazione dati ICE) (Source: ICE data processing)
67. CINA: prezzi medi dell’interscambio lapideo (import) CHINA: stone exchange average prices (import)
YEARS 25.15 25.16 68.02 TOTAL
USD/cub.mt.
index USD/cub.mt.
index USD/sq.mt.
index USD/ton. index
1994 686,6 100.0 839,7 100.0 41,79 200.0 604,9 100.0
1995 419,0 61.0 590,0 70.3 33,82 80.90 435,6 72.0
1996 528,7 77.0 842,4 100.3 21,09 50.5 345,6 57.1
1997 496,3 72.3 533,0 63.5 14,18 33.9 231,0 38.2
1998 561,3 81.8 456,6 54.4 16,90 40.4 241,9 40.0
1999 647,7 94.3 521,6 62.1 18,23 43.6 236,1 39.0
2000 681,7 99.3 539,7 64.3 15,30 36.6 229,9 38.0
2001 572,1 83.3 503,5 60.0 19,15 45.8 204,3 33.8
2002 465,8 67.8 459,5 54.7 13,45 32.2 173,3 28.6
2003 437,3 63.7 480,4 57.2 14,78 35.4 171,3 28.3
2004 432,6 63.0 511,0 60.8 23,25 55.6 177,4 29.3
2005 433,6 63.2 526,6 62.7 20,76 49.7 179,4 29.7
2006 425,5 62.0 524,6 62.5 12,63 30.2 174,2 28.8
2007 433,2 63.1 517,6 61.6 12,72 30.4 172,9 28.6
2008 460.6 67.1 572,0 68.1 20,83 19.8 187,8 31.1
2009 452.5 65.9 521.9 62.2 28,05 67.1 177,6 29.4
2010 471,0 68,6 534,7 63,7 31,53 75.5 183.2 30.3
2011 483,8 70.5 553,2 65.9 36,07 86.3 182.6 30.2
2012 445,6 64.9 443,5 52.8 34,87 83.4 162,1 26.8
2013 460,9 67.2 423,7 50.5 33.86 81.0 165,4 27.3
(Fonte: Elaborazione propria) (Source: own data processing)

138 XXV Rapporto Marmo e Pietre nel Mondo 2014 XXV World Marble and Stones Report 2014 139
68. CINA: importazioni disaggregate di grezzi calcarei (cod. 25.15)CHINA: disaggregated import of calcareous raw stones (cod. 25.15)
COUNTRIES 2009 2010 2011 2012 2013
mill.USD
share mill.USD
share mill. USD
share mill.USD
share mill.USD
share
TURKEY 336,99 39.2 659,81 44.4 658,05 40.4 760,20 45.7 894,78 48.5
EGYPT 129,31 15.0 177,60 11.9 206,60 12.7 227,69 13.7 231,54 12.5
ITALY 85,98 10.0 125,99 8.5 143,54 8.8 133,70 8.0 153,95 8.3
SPAIN 79,02 9.2 122,51 8.2 163,02 10.0 146,48 8.8 130,37 7.1
IRAN 71,30 8.3 118,83 8.0 102,27 6.3 111,13 6.7 98,37 5.3
PAKISTAN 13,01 1.5 28,34 1.9 58,89 3.6 64,32 3.9 91,30 4.9
PORTUGAL 31,96 3.7 52,98 3.6 56,08 3.4 64,33 3.9 55,75 3.0
GREECE 45,68 5.3 81,43 5.5 81,36 5.0 42,40 2.5 44,43 2.4
GERMANY 5,92 0.7 23,63 1.6 43,52 2.7 23,75 1.4 31,29 1.7
INDONESIA 13,76 1.6 19,23 1.3 26,42 1.6 16,55 1.0 21,32 1.2
INDIA 10,85 1.3 17,61 1.2 16,69 1.0 4,02 0.2 3,08 0.2
OTHERS 36,98 4.3 59,02 4.0 74,19 4.5 69,29 4.2 90,54 4.9
TOTAL 860,76 100.0 1.486,98 100.0 1.630,63 100.0 1.663,63 100.0 1.846,72 100.0
(Fonte: Elaborazione dati ICE) (Source: ICE data processing)
69. CINA: importazioni disaggregate di grezzi silicei (cod. 25.16)CHINA: disaggregated import of calcareous raw stones (cod. 25.16)
COUNTRIES 2009 2010 2011 2012 2013
mill.USD
share mill.USD
share mill. USD
share mill.USD
share mill.USD
share
INDIA 258,42 45.7 340,65 46.0 378,96 46.5 458,32 48.3 479,01 45.5
BRAZIL 112,60 19.9 180,34 24.4 165,11 23.9 211,15 22.3 254,91 24.2
FINLAND 21,64 3.8 37,39 5.1 52,91 6.5 60,73 6.4 61,30 5.8
NORWAY 43,59 7.7 53,81 7.3 46,54 5.7 50,54 5.3 49,60 4.7
PORTUGAL 12,60 2.2 23,15 3.1 25,28 3.1 34,52 3.6 37,13 3.5
SAUDI ARABIA 30,49 5.4 12,06 1.6 21,20 2.6 21,47 2.3 27,89 2.7
USA 9,73 1.7 10,19 1.4 12,89 1.6 9,01 1.0 17,43 1.7
SOUTH AFRICA 15,06 2.7 17,30 2.3 13,69 1.7 13,40 1.4 13,01 1.2
ANGOLA 6,31 1.1 7,27 1.0 7,99 1.0 21,13 2.2 12,18 1.2
SPAIN 7,51 1.3 9,91 1.3 16,39 2.0 17,24 1.8 12,10 1.2
AUSTRALIA 3,95 0.7 6,95 0.9 7,82 1.0 9,05 1.0 10,02 1.0
OTHERS 43,91 7.8 40,88 5.5 36,53 4.5 41,40 14.0 77,55 7.4
TOTAL 565,81 100.0 739,90 100.0 815,31 100.0 947,96 100.0 1.052,13 100.0
(Fonte: Elaborazione dati ICE) (Source: ICE data processing)

140 XXV Rapporto Marmo e Pietre nel Mondo 2014 XXV World Marble and Stones Report 2014 141
70. INDIA: esportazione di silicei grezzi (cod. 25.16) INDIA: raw siliceous stone export (cod. 25.16)
COUNTRIES 2005 2006 2007 2008 2009 2010 2011 2012 2013
CHINA 125.644 193.893 223.497 244.612 219.252 257.852 381.114 474.995 533.030
UN. KINGDOM 42.803 74.934 98.166 33.813 52.432 52.862 62.977 75.009 106.883
TAIWAN 21.641 28.616 32.435 25.118 19.679 20.438 33.902 29.715 32.719
ITALY 70.037 90.140 90.709 70.330 24.324 35.005 29.394 29.706 26.657
BELGIUM 18.624 19.682 24.939 18.891 14.529 17.707 26.775 25.195 19.664
HONG-KONG 22.409 32.230 32.980 39.832 35.376 30.513 34.700 33.737 19.051
USA 18.810 9.537 18.506 18.778 12.352 8.016 14.840 14.251 13.598
FRANCE 4.000 4.566 6.206 4.769 3.185 4.383 5.886 7.649 9.359
GERMANY 5.854 8.115 10.484 4.963 6.307 6.832 8.069 6.956 8.171
SPAIN 19.315 20.486 19.851 17.953 4.585 7.906 7.321 4.728 5.323
NETHERLANDS 4.260 5.089 6.670 3.873 4.534 4.159 3.926 3.212 3.519
OTHERS 42.388 83.759 88.810 49.886 78.150 60.905 71.126 67.181 74.887
TOTAL 395.785 571.047 653.253 532.818 474.705 506.578 680.030 772.334 852.861
(Fonte: Elaborazione dati Comtrade) (Source: Comtrade data processing)
71. INDIA: esportazione di lavorati speciali (cod. 68.02) INDIA: processed special stone export (cod. 68.02)
YEARQUANTITY VALUE AV. PRICE
000 tons index mill. USD index USD/sq.mt./2 index
2005 770 100.0 575,0 100.0 40,37 100.0
2006 979 127.1 700,8 121.8 38,70 95.8
2007 1.038 134.8 772,1 134.3 40,21 99.6
2008 1.114 144.7 785,2 136.6 38,10 94.4
2009 1.064 138.2 683,0 118.8 34,70 86.0
2010 1.145 148.7 842,2 146.5 39,76 98.4
2011 1.600 207.8 840,3 146.1 28,39 70.3
2012 1.460 189.6 901,0 156.7 33,36 82.6
2013 1.980 257.1 1121,2 195.0 30,62 75.8
(Fonte: Elaborazione dati Comtrade) (Source: Comtrade data processing)
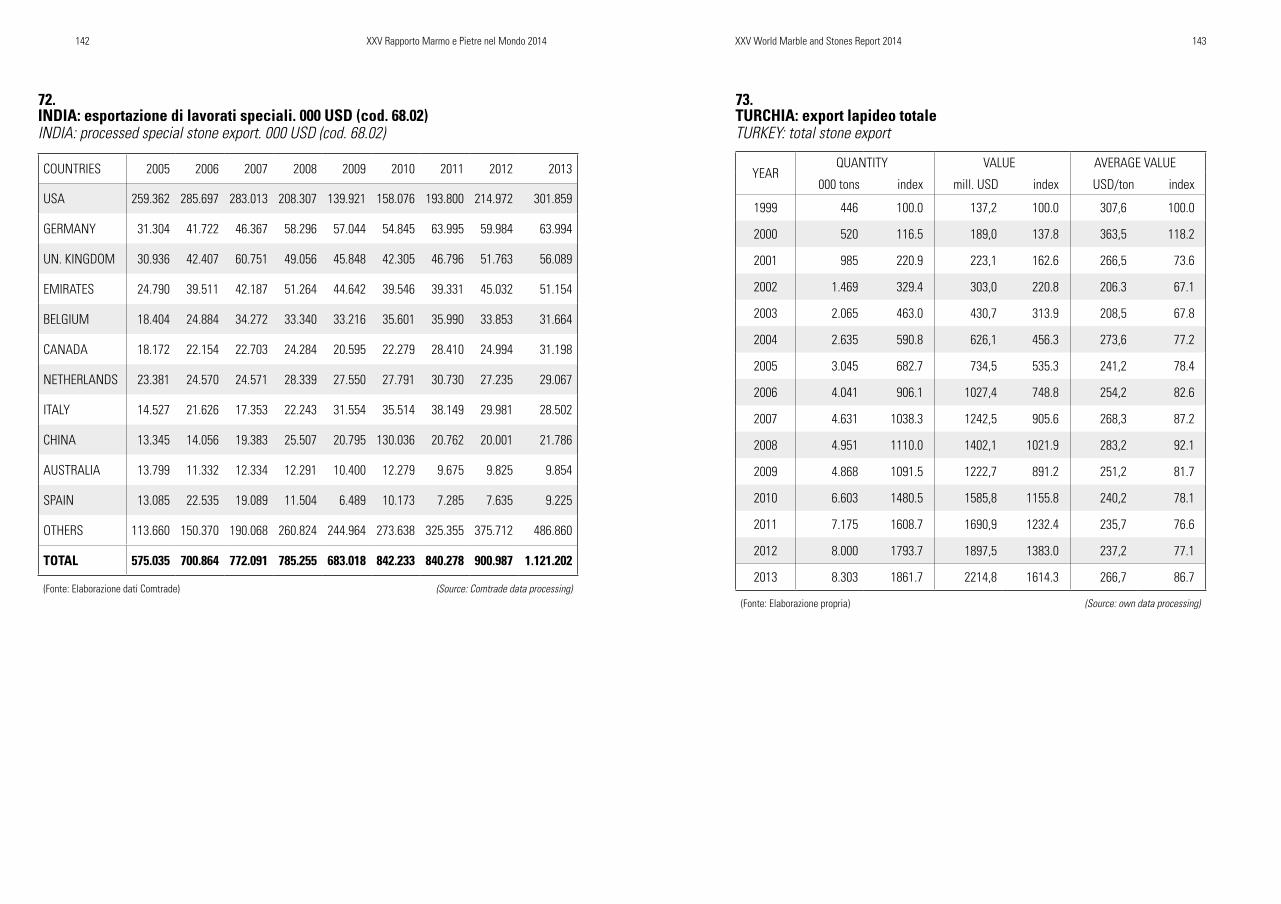
142 XXV Rapporto Marmo e Pietre nel Mondo 2014 XXV World Marble and Stones Report 2014 143
72. INDIA: esportazione di lavorati speciali. 000 USD (cod. 68.02) INDIA: processed special stone export. 000 USD (cod. 68.02)
COUNTRIES 2005 2006 2007 2008 2009 2010 2011 2012 2013
USA 259.362 285.697 283.013 208.307 139.921 158.076 193.800 214.972 301.859
GERMANY 31.304 41.722 46.367 58.296 57.044 54.845 63.995 59.984 63.994
UN. KINGDOM 30.936 42.407 60.751 49.056 45.848 42.305 46.796 51.763 56.089
EMIRATES 24.790 39.511 42.187 51.264 44.642 39.546 39.331 45.032 51.154
BELGIUM 18.404 24.884 34.272 33.340 33.216 35.601 35.990 33.853 31.664
CANADA 18.172 22.154 22.703 24.284 20.595 22.279 28.410 24.994 31.198
NETHERLANDS 23.381 24.570 24.571 28.339 27.550 27.791 30.730 27.235 29.067
ITALY 14.527 21.626 17.353 22.243 31.554 35.514 38.149 29.981 28.502
CHINA 13.345 14.056 19.383 25.507 20.795 130.036 20.762 20.001 21.786
AUSTRALIA 13.799 11.332 12.334 12.291 10.400 12.279 9.675 9.825 9.854
SPAIN 13.085 22.535 19.089 11.504 6.489 10.173 7.285 7.635 9.225
OTHERS 113.660 150.370 190.068 260.824 244.964 273.638 325.355 375.712 486.860
TOTAL 575.035 700.864 772.091 785.255 683.018 842.233 840.278 900.987 1.121.202
(Fonte: Elaborazione dati Comtrade) (Source: Comtrade data processing)
73. TURCHIA: export lapideo totaleTURkEy: total stone export
YEAR QUANTITY VALUE AVERAGE VALUE
000 tons index mill. USD index USD/ton index
1999 446 100.0 137,2 100.0 307,6 100.0
2000 520 116.5 189,0 137.8 363,5 118.2
2001 985 220.9 223,1 162.6 266,5 73.6
2002 1.469 329.4 303,0 220.8 206.3 67.1
2003 2.065 463.0 430,7 313.9 208,5 67.8
2004 2.635 590.8 626,1 456.3 273,6 77.2
2005 3.045 682.7 734,5 535.3 241,2 78.4
2006 4.041 906.1 1027,4 748.8 254,2 82.6
2007 4.631 1038.3 1242,5 905.6 268,3 87.2
2008 4.951 1110.0 1402,1 1021.9 283,2 92.1
2009 4.868 1091.5 1222,7 891.2 251,2 81.7
2010 6.603 1480.5 1585,8 1155.8 240,2 78.1
2011 7.175 1608.7 1690,9 1232.4 235,7 76.6
2012 8.000 1793.7 1897,5 1383.0 237,2 77.1
2013 8.303 1861.7 2214,8 1614.3 266,7 86.7
(Fonte: Elaborazione propria) (Source: own data processing)

144 XXV Rapporto Marmo e Pietre nel Mondo 2014 XXV World Marble and Stones Report 2014 145
75.TURCHIA: export lapideo di lavorati (cod. 68.02)TURkEy: processed stone export (cod 68.02)
COUNTRIES
2011 2012 2013
000USD
mill.USD
USD/ton.
000USD
mill.USD
USD/ton.
000USD
mill.USD
USD/ton.
USA 423,9 236,0 30,09 448,9 251,4 30,27 515,2 295,2 30,97
IRAK 297,3 78,3 14,24 356,2 97,1 14,73 397,1 112,1 15,26
SAUDI ARABIA 173,3 61,9 19,31 222,1 84,9 20,66 222,7 93,3 22,65
FRANCE 77,4 41,7 29,12 82,2 41,5 27,29 89,3 44,7 27,06
AZERBAIJAN 29,6 24,1 44,00 37,0 25,6 37,40 50,5 44,2 47,31
EMIRATES 52,4 29,0 29,92 66,1 41,3 33,77 73,5 44,1 32,43
CANADA 51,0 43,2 45,79 43,1 36,5 45,78 47,0 40,4 46,46
UN.KINGDOM 67,8 45,0 35,88 65,7 45,1 37,10 55,8 37,6 36,42
ISRAEL 84,9 34,7 22,09 86,4 34.0 21,27 94,5 37,1 21,22
RUSSIA 31,6 21,2 36,26 28,5 22,6 42,86 40,7 33,8 44,89
LYBIA 13,5 6,3 25,22 44,9 18,5 22,27 82,4 33,1 21,71
AUSTRALIA 37,8 22,1 31,60 42,9 24,6 31,00 44,8 24,9 30,04
TURKMENISTAN 20,8 15,2 39,50 17,3 12,3 38,43 19,0 19,0 54,05
GERMANY 32,1 16,3 27,45 37,7 16,6 23,80 35,0 15,3 23,63
GEORGIA 9,6 5,4 30,41 9,4 10,1 58,07 6,1 3,9 34,56
OTHERS 364,6 183,4 27,19 339,7 180,0 28,64 334,5 192,7 31,14
TOTAL 1.767,6 863,8 26,42 1.928,1 942,1 26,41 2.108,1 1.071,4 27,47
(Fonte: Elaborazione dati Comtrade) (Source: Comtrade data processing)
74.TURCHIA: export lapideo di calcarei grezzi (cod. 25.15)TURkEy: raw calcareous stone export (cod 25.15)
COUNTRIES
2011 2012 2013
000USD
mill.USD
USD/ton.
000USD
mill.USD
USD/ton.
000USD
mill.USD
USD/ton.
CHINA 3.547,5 630,4 177,7 4.180,9 779,9 186,5 4.881,4 977,4 200,2
INDIA 119,3 31,9 267,4 176,4 47,4 268,7 153,3 42,3 275,9
TAIWAN 79,3 17,0 214,4 103,3 22,6 218,8 95,1 19,9 209,3
ITALY 40,8 10,4 254,9 30,4 9,3 305,9 33,7 10,0 296,7
INDONESIA 19,7 5,3 269,0 29,0 6,9 237,9 31,4 8,7 277,1
EGYPT 74,6 4,7 63,0 98,6 6,1 61,9 92,4 7,5 81,2
HONG-KONG 25,1 5,9 235,1 29,1 6,5 223,4 22,6 5,2 230,1
BRAZIL 8,4 4,0 476,2 6,5 3,1 476,9 7,9 3,4 430,4
SYRIA 697,6 24,9 35,7 323,3 9,9 30,6 116,3 3,2 27,5
THAILAND 21,5 5,1 237,2 15,9 4,1 257,9 13,0 3,2 246,2
GREECE 52,5 4,9 93,3 27,8 2,9 93,5 29,2 3,2 109,6
VIETNAM 8,8 2,0 22,7 8,0 2,2 21,3 13,3 3,1 233,1
LEBANON 22,1 3,2 144,8 32,8 4,8 146,3 21,2 2,7 127,4
JORDAN 50,0 1,7 34,0 64,3 2,6 34,2 56,0 2,1 37,5
SPAIN 13,3 3,2 240,6 13,9 2,9 208,6 9,4 2,0 212,8
OTHERS 88,3 15,7 177,8 86,7 1,7 211,0 129,9 26,8 206,3
TOTAL 4.868,8 770,3 158,2 5.226,9 18,3 177,6 5.706,1 1.120,7 196,4
(Fonte: Elaborazione dati Comtrade) (Source: Comtrade data processing)

146 XXV Rapporto Marmo e Pietre nel Mondo 2014 XXV World Marble and Stones Report 2014 147
76.GIAPPONE: importazioni di grezzi silicei. Provenienze degli acquisti in quantità (000 tonn.)JAPAN: imports of siliceous raw materials. Origin of purchases by quantity (000 tons)
COUNTRIES ‘70 ‘80 ‘90 ‘95 ‘00 ‘05 ‘10 ‘11 ‘12 ‘13
CHINA 2,1 61,4 254,1 255,1 57,4 16,9 5,3 4.2 4,6 11,5
INDIA 8,7 171,8 232,7 118,9 44,6 11,6 7,3 4,3 5,5 4,0
BRAZIL 3,0 22,7 19,3 16,3 9,0 0,5 0,1 0,3 0,4 0,5
CANADA 0,2 3,7 48,9 46,7 25,5 3,8 0,2 0,4 0,4 0,5
SOUTH KOREA 4,6 129,1 266,0 128,1 22,4 6,7 0,5 0,5 0,8 0,4
FINLAND 0,3 1,3 24,6 22,9 9,2 1,8 0,2 0,2 0,3 0,4
SOUTH AFRICA 44,8 64,5 93,2 93,9 43,4 4,4 0,3 1,0 0,2 0,2
PORTUGAL 0.9 17,1 63,1 36,9 6,5 2,2 0,6 0,5 0,5 0,2
UNITED STATES - 29,0 32,0 26,2 4,1 0,3 0,1 1,1 2,0 0,1
OTHERS 20,9 41,1 123,2 62,5 44,7 6,1 3,7 3,2 2,5 3,6
TOTAL 85,5 541,8 1.157,1 807,5 266,8 53,9 18,3 15,7 17,2 21,4
(Fonte: Elaborazione dati ICE/Comtrade) (Source: ICE/Comtrade data processing)
77.GIAPPONE: importazioni di lavorati speciali. Provenienze degli acquisti in quantità (000 tonn.)JAPAN: import of special finished products. Origin of purchases by quantity (000 tons)
COUNTRIES ‘89 ‘95 ‘00 ‘10 ‘11 ‘12 ‘13
CHINA 40,6 683,6 1.084,8 1.132,0 813,1 788,8 760,8
INDIA 6,5 30,5 12,9 6,5 7,1 8,6 9,9
ITALY 76,5 46,7 41,7 5,0 5,2 5,0 4,4
PORTUGAL 1,1 6,7 5,9 1,5 1,5 1,8 2,1
SPAIN 5,0 10,4 13,6 1,7 1,9 2,2 2,0
TAIWAN 2,4 6,9 8,2 1,1 0,9 1,1 1,0
SOUTH KOREA 158,1 86,2 14,7 1,1 0,8 0,5 0,3
OTHERS 6,8 20,5 40,6 16,5 15,0 17,7 21,2
TOTAL 297,0 891,5 1.222,4 868,9 845,5 825,7 801,7
(Fonte: Elaborazione dati ICE/Comtrade) (Source: ICE/Comtrade data processing)

148 XXV Rapporto Marmo e Pietre nel Mondo 2014 XXV World Marble and Stones Report 2014 149
78. GIAPPONE: maggiori importazioni di prodotti lapidei (quantità, valori e prezzi)JAPAN: leading imports of stone products (quantity, value and prices)
Siliceous raw materials Special processed products
YEARS ‘000 tons mill. yen yen/ton pr./ind. ‘000 tons mill. yen yen/ton pr./ind.
1989 1.191,8 31.083 26.080 100.0 297,0 50.468 169.925 100.0
1990 1.157,1 34.509 29.824 114.3 305,8 55.533 181.600 106.9
1991 1.160,4 33.601 28.956 111.0 358,5 59.262 165.305 97.3
1992 1.0474 28.815 27.521 105.5 414,3 55.140 133.092 78.3
1993 1.011,2 22.693 22.442 86.1 450,6 44.591 98.960 58.2
1994 1.078,1 24.550 22.771 87.3 593,5 50.632 85.310 50.2
1995 807,5 18.201 22.540 86.4 891,5 63.752 71.510 42.1
1996 683,6 16.433 25.732 98.7 969,8 71,876 74.114 43.6
1997 574,1 17.019 31.108 119.3 1.091,4 82.958 76.010 44.7
1998 416,2 11.895 28.580 109.6 930,3 71.983 77.376 45.5
1999 361,8 7.763 21.457 82.3 1.135,3 75.433 66.443 39.1
2000 266,8 5.930 22.226 85.2 1.222,4 77.377 63.300 37.2
2001 230,7 5.021 21.764 83.5 1.321,6 92.177 69.747 41.0
2002 135,8 3,422 25,200 96,6 1.383,0 97.252 70.320 41.4
2003 84,4 2.137 25.310 97.0 1.377,6 85.843 62.312 36.7
2004 68,7 1,730 25.180 96.5 1.540,0 80.850 52.500 30.9
2005 53,9 2.156 40.000 153.4 1.628,0 87.148 53.530 31.5
2006 45,0 1.951 43.397 166.4 1.307,3 84.098 64.330 37.9
2007 48,2 2.024 41.995 161.0 1.203,5 83.170 69.170 40.6
2008 30,1 1.178 39.145 150.1 1.034,0 92.672 89.625 52.7
2009 21,0 733 34.891 133.8 911,9 85,073 93.292 54.9
2010 18,3 669 36.570 140.2 868,9 84,478 97,223 57.2
2011 15,7 548 34.912 133.8 845,5 82.202 92.285 54.6
2012 17,2 477 27,697 106,2 825,7 71.727 86.868 51.1
2013 21,4 425 19.860 76.1 801,7 74.393 92.794 54.6
(Fonte: Elaborazione dati ICE/Comtrade) (Source: ICE/Comtrade data processing)
79. USA. Import di marmi e pietre (000 USD)USA: total stone import (000 USD)
par. codes 2007 2008 2009 2010 2011 2012 2013
ABS.
FIG
URES
25.15 14.857 8.226 4.131 3.518 4.651 7.757 4.180
25.16 60.116 50.022 23.149 24.023 22.673 22.366 18.640
68.01 18.371 17.911 12.932 8.392 10.260 18.367 24.864
68.02 3.635.053 3.072.005 1.945.882 2.160.842 2.230.816 2.471.059 2.972.668
68.03 154.705 123.271 75.209 75.365 74.563 74.199 79.095
TOTAL 3.883.102 3.271.435 2.061.303 2.272.140 2.342.963 2.593.748 3.099.447
SHAR
ES
25.15 0.38 0.25 0.20 0.15 0.20 0.30 0.14
25.16 1.55 1.53 1.12 1.06 0.97 0.86 0.60
68.01 0.47 0.55 0.63 0.37 0.44 0.71 0.80
68.02 93.61 93.90 94.40 95.10 95.21 95.27 95.91
68.03 3.99 3.77 3.65 3.32 3.18 2.86 2.55
TOTAL 100.00 100.00 100.00 100.00 100.00 100.00 100.00
INDE
X
25.15 100.00 55.37 27.81 23.68 31.31 52.21 28.13
25.16 100.00 83.21 38.51 39.96 37.72 37.20 31.00
68.01 100.00 97.50 70.39 45.68 55.85 99.98 135.35
68.02 100.00 84.51 53.53 59.45 61.35 67.98 81.76
68.03 100.00 79.68 48.61 48.72 48.20 47.96 51.13
TOTAL 100.00 84.24 53.09 58.50 60.32 66.80 79.81
(Fonte: Elaborazione dati Comtrade) (Source: Comtrade data processing)

150 XXV Rapporto Marmo e Pietre nel Mondo 2014 XXV World Marble and Stones Report 2014 151
81. USA: importazioni di lavorati (cod. 68.02). Paesi di origine (quote di mercato) USA: import of processed stones (code 68.02). Origin Countries (shares)
COUNTRIES 2001 2005 2006 2007 2008 2009 2010 2011 2012 2013
BRAZIL 7.9 16.9 19.6 19.7 18.5 15.8 25.6 25.3 25.7 27.9
CHINA 5.7 12.4 13.7 15.7 17.5 20.9 19.3 18.4 18.9 19.3
ITALY 37.9 22.9 20.5 19.0 19.2 20.3 14.0 14.3 15.0 16.4
TURKEY 6.3 13.7 13.5 13.7 12.9 13.2 12.9 13.6 13.0 12.3
INDIA 7.1 9.8 9.9 9.2 9.7 9.6 10.8 11.1 11.2 10.1
CANADA 7.3 3.4 3.1 3.2 3.5 4.0 3.5 3.6 3.7 2.9
SPAIN 8.1 5.6 4.8 4.1 3.6 3.2 2.8 3.0 2.9 2.6
MEXICO 7.3 4.9 4.8 4.5 3.9 3.3 3.2 3.2 2.6 2.2
TAIWAN 1.7 1.7 1.9 1.6 1.4 1.6 1.5 1.3 1.3 1.0
GREECE 1.3 0.8 0.7 0.8 0.8 0.8 0.4 0.5 0.5 0.8
PORTUGAL 0.9 0.7 0.6 0.7 1.0 0.8 0.7 0.8 0.6 0.6
PERU 0.5 0.8 0.9 1.0 1.0 0.7 0.6 0.6 0.5 0.5
FRANCE 1.9 0.8 0.6 0.7 0.8 1.0 0.5 0.5 0.5 0.4
ISRAEL 1.5 1.3 1.2 1.3 1.3 0.9 0.6 0.6 0.5 0.4
GERMANY 0.8 0.3 0.3 0.3 0.4 0.2 0.2 0.3 0.2 0.2
OTHERS 3.8 4.0 4.1 4.3 4.4 3.7 3.3 2.8 2.8 2.4
TOTAL 100.0 100.0 100.0 100.0 100.0 100.0 100.0 100.0 100.0 100.0
(Fonte: Elaborazione dati Comtrade) (Source: Comtrade data processing)
80. USA: importazioni di lavorati (cod. 68.02). Paesi di origine (mill. USD) USA: import of processed stones (code 68.02). Origin Countries (mill. USD)
COUNTRIES 2001 2005 2006 2007 2008 2009 2010 2011 2012 2013
BRAZIL 104,4 451,1 617,0 631,8 507,0 308,2 553,7 564,6 634,6 828,0
CHINA 75,6 330,4 432,0 507,4 479,9 406,4 416,4 411,0 467,7 573,6
ITALY 499,2 611,5 644,3 617,1 524,8 394,1 303,1 320,7 371,6 486,4
TURKEY 83,2 364,3 424,3 441,8 352,2 257,5 278,6 304,4 321,5 366,4
INDIA 93,3 261,2 310,6 297,1 266,3 186,5 232,8 247,7 276,6 300,0
CANADA 95,9 90,0 96,9 102,6 96,9 77,0 75,3 79,9 91,6 85,9
SPAIN 106,5 149,4 149,9 133,1 98,3 62,4 60,1 67,0 63,6 77,0
MEXICO 96,0 130,1 149,4 145,2 107,9 65,1 69,4 70,9 71,3 66,1
TAIWAN 22,1 46,4 58,3 52,3 37,8 30,6 32,7 29,6 31,4 31,0
GREECE 16,8 21,1 21,6 25,6 23,0 16,3 9,7 11,1 12,0 23,6
PORTUGAL 12,5 18,7 19,5 22,2 27,4 15,4 15,1 17,1 15,7 17,4
PERU 6,4 22,5 28,2 30,1 27,4 14,2 13,8 13,2 13,3 15,4
FRANCE 24,7 22,4 18,3 23,2 22,5 20,4 11,0 11,5 12,7 12,4
ISRAEL 19,3 33,3 36,2 42,2 34,7 17,8 13,2 13,3 15,1 10,8
GERMANY 9,9 8,3 10,7 10,8 11,7 4,8 4,1 6,6 3,8 6,0
OTHERS 50,5 106,7 127,4 142,4 119,1 69,2 71,8 62,2 68,6 72,7
TOTAL 1.316,1 2.667,2 3.144,8 3.224,9 2.736,9 1.945,9 2.160,8 2.230,8 2.471,1 2.972,7
(Fonte: Elaborazione dati Comtrade) (Source: Comtrade data processing)

152 XXV Rapporto Marmo e Pietre nel Mondo 2014 XXV World Marble and Stones Report 2014 153
82. USA: importazioni di lavorati (cod. 68.02). Evoluzione storica USA: import of processed stones (code 68.02). Historical outline
Mill. USD Yearly variation Domestic use
YEARS abs. fig. index abs. fig. ± Δ% mill.
sq.mt. ± Δ% Index
1992 376,6 100.0 – – 20,50 – 100.0
1993 372,5 98.9 -4,1 -1.1 20,35 -0.7 99.3
1994 414,7 110.1 42,2 11.3 22,57 10.9 110.1
1995 458,2 121.7 43,5 10.5 28,84 27.8 140.7
1996 517,6 137.5 59,4 13.0 25,29 -12.3 123.4
1997 631,5 167.7 113,9 21.9 32,10 26.9 156.6
1998 825,2 219.1 193,7 30.7 35,41 10.3 172.7
1999 958,4 254.4 133,2 16.1 41,92 18.4 204.5
2000 978,7 259.8 20,3 2.1 46,63 11.2 227.5
2001 1.316,1 349.5 337,4 34.4 53,45 14.6 260.7
2002 1.456,7 386.7 40,6 10.7 58,46 9.4 285.2
2003 1.723,3 457.6 266,6 18.3 70,89 21.3 345.8
2004 2.201,3 584.5 478,0 27.7 79,12 11.6 386.0
2005 2.667,2 708.2 465,9 21.2 87,97 11.2 429.1
2006 3.144,8 835.1 477,6 17.9 107,35 22.0 523.7
2007 3.224,9 856.3 80,1 2.5 115,14 7.2 561.6
2008 2.736,9 726.7 -488,0 -15.1 88,02 -23.5 429.4
2009 1.945,9 516.7 -791,0 -28.9 70,91 -19.4 345.9
2010 2.160,8 573.7 214,9 11,0 74,17 4.6 361.8
2011 2.230,8 592.3 70,0 3.2 71,20 -4.0 347.3
2012 2.471,1 656.2 240,3 10.8 76,90 8.0 375.1
2013 2.972,7 789.4 501,6 20.3 87,23 13,4 425.5
(Fonte: Elaborazione propria) (Source: own data processing)
83.SUDAFRICA: maggiori esportazioni di pietraSUDAFRICA: leading stone exports
value quantity av. value/ton.sq.mt.
COD. YEAR 000 USD index tons index USD index
25.1
6
2008 90.241 100.0 464.112 100.0 194.44 100.0
2009 58.818 65.2 337.839 72.8 174.10 89.5
2010 65.159 72.2 363.225 78.3 179,40 92.3
2011 72.207 80.0 373.291 80.4 193,43 99.5
2012 65.734 72.8 355.045 76.5 185,14 95.2
2013 45.056 49.9 251.023 54.1 179,49 92.3
68.0
2
2008 15.015 100.0 44.637 100.0 18,18 100.0
2009 17.819 118.7 38.323 85.9 25,20 138.6
2010 14.962 99.6 37.489 84.0 21,58 118.7
2011 14.147 94.2 26.418 59.2 28,95 159.2
2012 19.180 127.7 34.767 77.9 29,82 164.0
2013 23.762 158.3 48.022 107.6 26,75 147.1
(Fonte: Elaborazione dati Comtrade) (Source: Comtrade data processing)

154 XXV Rapporto Marmo e Pietre nel Mondo 2014 XXV World Marble and Stones Report 2014 155
84. Esportazioni di lavorati in pietra (cod.68.02). Indici di variazione del prezzo medio.Special processed stone export (cod. 68.02). Average prices historical variation
YEAR USD/sq. mt.2 Euro/sq. mt.2
BRAZIL CHINA INDIA TURKEY ITALY GERMANY SPAIN PORTUGAL
2005 100.0 100.0 100.0 100.0 100.0 100.0 100.0 100.0
2006 112.7 101.8 95.8 105.4 104.9 126.4 108.7 103.5
2007 120.9 108.2 99.6 111.2 105.7 114.4 106.0 94.3
2008 123.9 125.2 94.4 117.4 106.8 116.4 136.7 100.7
2009 117.1 119.1 86.0 104.2 103.6 124.5 136.6 88.4
2010 119.8 124.8 98.5 99.6 105.8 113.8 123.9 82.1
2011 125.8 150.7 95.0 97.8 111.2 120.7 1254.1 87.1
2012 122.4 170.4 82.6 98.4 121.0 122.7 154.7 78.2
2013 121.7 200.8 75.8 110.5 127.4 128.1 157.1 83.8
(Fonte: Elaborazione propria) (Source: own data processing)
85. Paesi leader: evoluzione del consumo (000 tonn.)Leading countries: net consuption trend (000 tonn.)
COUNTRIES 1994 2001 2009 2010 2011 2012 2013
AUSTRALIA 104 131 325 367 453 429 460
AUSTRIA 296 389 442 441 399 388 409
BELGIUM 411 567 871 1.090 1.184 1.048 998
BRAZIL 779 668 2.274 2.313 2.688 2.767 3294
CANADA 171 104 595 618 867 963 925
CHINA 2.238 3.964 11.601 14.533 16.537 19.354 22180
FINLAND 113 184 208 189 141 151 163
FRANCE 1.103 1.415 1.410 1.586 1.601 1.728 1788
GERMANY 1.837 2.328 1.670 1.503 2.008 1.700 1750
GREECE 833 775 744 642 422 268 273
INDIA 983 1.997 4.459 4.712 5.106 5.656 5708
ITALY 2.700 3.231 3.205 3.232 3.084 2.676 2425
JAPAN 2.054 1.862 1.352 1.149 1.095 1.148 1120
NORWAY 90 169 234 244 300 252 246
POLAND 72 262 584 683 821 729 563
PORTUGAL 314 507 632 601 532 434 366
RUSSIA 338 400 447 701 696 858 879
SINGAPORE 132 125 315 286 280 221 334
SOUTH AFRICA 62 294 275 322 276 338 302
SOUTH KOREA 767 1.371 2.585 2.679 2.838 2.401 2621
SPAIN 1.479 2.437 2.135 2.113 1.764 1.348 1198
TAIWAN 656 1.041 1.035 1.242 1.495 1.588 1284
TURKEY 221 578 1.821 1.611 1.551 1.592 1753
USA 1.220 2.889 3.835 4.009 3.849 4.157 4715
(Fonte: Elaborazione propria) (Source: own data processing)

156 XXV Rapporto Marmo e Pietre nel Mondo 2014 XXV World Marble and Stones Report 2014 157
86. Consumo lapideo mondiale (mill. mq. eq./2) World stone use (mill. sq. mt./2)
2001 2007 2010 2011 2012 2013
COUNTRIES Vol. % Vol. % Vol. % Vol. % Vol. % Vol. %
CHINA 73,3 10.3 163,6 14.5 268,9 22.1 305,9 24.2 358,0 26.5 410,3 28.9
INDIA 36,9 5.2 70,9 6.2 87,2 7.2 94,5 7.5 104,6 7.7 105,6 7.4
USA 50,8 7.2 111,9 9.9 74,2 6.1 71,2 5.6 76,9 5.7 87,2 6.1
BRAZIL 12,3 1.7 26,1 2.4 42,8 3.5 49,7 3.9 51,2 3.8 60,9 4.3
SOUTH KOREA 25,4 3.6 50,4 4.5 49,6 4.1 52,5 4.2 44,4 3.3 48,5 3.4
ITALY 59,8 8.4 63,9 5.7 59,8 4.9 57,2 4.5 49,5 3.7 44,9 3.2
SAUDI ARABIA 14,9 2.1 15,4 1.4 18,0 1.5 20,4 1.6 28,9 2.1 40,5 2.9
FRANCE 26,2 3.7 30,8 2.7 29,3 2.4 29,6 2.3 32,0 2.4 33,1 2.3
GERMANY 43,1 6.1 42,1 3.7 27,8 2.3 37,2 2.9 31,5 2.3 32,4 2.3
TAIWAN 19,3 2.7 22,8 2.0 22,9 1.9 27,6 2.2 29,4 2.2 23,8 1.7
SPAIN 45,1 6.4 49,2 4.4 39,1 3.2 32,6 2.6 24,9 1.8 22,2 1.6
JAPAN 34,5 4.9 28,6 2.5 21,3 1,8 20,3 1.6 21,2 1.6 20,7 1.5
BELGIUM 10,5 1.5 18,9 1.7 20,2 1.7 21,9 1.7 19,4 1.4 18,5 1.3
UN. KINGDOM 8,5 1.2 23,3 2.1 20,9 1.7 19,2 1.5 15,9 1.2 18,4 1.3
SWITZERLAND 10,6 1.5 12,7 1.1 11,3 0.9 11,8 0.9 11,3 0.8 11,6 0.8
PORTUGAL 9,4 1.3 12,1 1.1 11,1 0.9 9,9 0,8 8,0 0.6 6,8 0.5
NETHERLANDS 8,5 1.2 12,8 1.1 6,1 0.5 5,4 0.4 7,7 0.6 5,7 0.4
GREECE 14,3 2.0 17,6 1.5 11,9 1,0 7,8 0.6 5,0 0.4 5,1 0.4
OTHERS 206,4 29.1 356,9 31.5 394,6 32.4 390,3 30.8 430,2 31.8 423,8 29.8
WORLD 709,5 100.0 1.129,7 100.0 1.217,0 100.0 1.265,0 100.0 1.350,0 100.0 1.420,0 100.0
(Fonte: Elaborazione propria) (Source: own data processing)
87. Consumo lapideo mondiale (2001=100) World stone use (2001=100)
COUNTRIES 2005 2006 2007 2008 2009 2010 2011 2012 2013
CHINA 158,7 175.6 223.2 243.0 292.3 366.8 417.3 488.4 559.8
BRAZIL 147.2 192.7 212.2 337.4 342.3 348.0 404.1 416.2 495.1
INDIA 149.6 136.4 192.1 225.2 223.6 236.3 256.1 283.4 286.2
SAUDI ARABIA 94.6 120.0 103.4 112.1 106.7 120.8 136.9 194.0 271.8
UN. KINGDOM 209.4 268.2 274.1 238.8 200.0 245.9 225.9 187.1 216.5
SOUTH KOREA 157.5 172.0 198.4 197.2 188.2 195.3 206.7 174.8 190.9
BELGIUM 135.2 176.2 180.0 151.4 153.3 192.4 208.6 184.8 176.2
USA 173.2 211.4 220.3 173.2 139.7 146.1 140.2 151.4 171.7
FRANCE 110.7 121.4 117.6 111.5 99.6 111.8 113.0 122.1 126.3
TAIWAN 135.2 137.8 118.1 112.4 99.5 118.6 143.0 152.3 123.3
SWITZERLAND 107.5 116.0 119.8 117.9 114.2 106.6 111.3 106.6 109.4
GERMANY 75.4 94.4 97.7 74.9 71.7 64.5 86.3 73.1 75.2
ITALY 104.2 108.4 106.9 109.4 99.2 100.0 95.7 82.8 75.1
PORTUGAL 114.9 133.0 128.7 123.4 124.5 118.1 105.3 85.1 72.3
NETHERLANDS 158.8 162.4 150.6 154.1 109.4 71.8 64.7 90.5 67.1
JAPAN 99.1 89.6 82.9 70.2 72.5 61.7 58.8 61.4 60.0
SPAIN 115.1 114.4 109.1 99.5 87.6 86.7 72.3 55.2 49.3
GREECE 106.3 111.9 123.1 110.5 96.5 83.2 54.5 35.0 35.7
OTHERS 135.7 141.4 172.9 184.9 187.1 191.2 189.1 208.4 205.3
WORLD 131.1 142.7 159.2 161.5 160.6 171.5 178.3 190.0 200.1
(Fonte: Elaborazione propria) (Source: own data processing)

158 XXV Rapporto Marmo e Pietre nel Mondo 2014 XXV World Marble and Stones Report 2014 159
88. Consumo lapideo mondiale pro-capite (mq. eq./2 x 1000 abitanti) World stone use per capita (sq.mt./2 x 1000 inh.)
COUNTRIES 2001 2007 2008 2009 2010 2011 2012 2013
BELGIUM 1.029 1.802 1.518 1.537 1.929 2.102 1.862 1.775
SAUDI ARABIA 779 662 716 682 375 871 1.233 1.727
SWITZERLAND 1.493 1.708 1.681 1.627 1.519 1.585 1.518 1.558
TAIWAN 891 1.002 953 843 1.005 1.205 1.283 1.040
SOUTH KOREA 556 1.023 1.017 970 889 1.098 928 1.013
ITALY 1.040 1.088 1.113 1.010 1.055 985 852 875
PORTUGAL 938 1.147 1.102 1.112 1.018 943 840 714
FRANCE 447 505 480 429 482 489 529 547
SPAIN 1.147 1.119 1.021 898 1.006 757 578 516
GREECE 1.367 1.583 1.426 1.245 1.073 702 450 459
GERMANY 525 511 392 375 337 450 381 392
NETHERLANDS 543 786 803 570 772 340 485 360
UN. KINGDOM 144 387 338 283 348 322 308 356
BRAZIL 78 142 225 228 232 267 275 327
CHINA 60 125 137 165 206 227 265 304
USA 190 377 297 240 251 230 238 270
JAPAN 273 223 189 195 166 159 166 162
INDIA 38 65 76 75 79 86 113 115
OTHERS 72 137 140 139 142 140 154 152
WORLD 117 184 187 186 195 202 215 226
(Fonte: Elaborazione propria) (Source: own data processing)
89. Interscambio di tecnologie per la pietra: esportazioni UE/15: quantità (tonn.) International exchange of stone technology: EU/15 export : quantity (tons)
COUNTRIES 1998 2000 2002 2004 2006 2008 2010 2011 2012 2013
AUSTRIA 1.196 1.743 1.509 2.369 2.085 3.076 1.484 2.633 1.798 1.705
BELGIUM 3.843 1.872 1.664 1.999 674 756 943 819 2.551 1.963
DENMARK 74 183 369 337 253 289 229 244 353 297
FINLAND 141 108 165 221 306 157 19 64 117 103
FRANCE 1.592 2.115 1.404 1.922 2.645 4.022 758 811 554 655
GERMANY 3.912 6.349 5.065 7.247 7.105 19.184 5.725 6.541 5.981 5.158
GREECE 164 378 1.267 382 1.158 316 359 576 384 1.057
IRELAND – 56 38 23 22 - 89 90 32 7
ITALY 52.035 57.304 48.920 69.345 60.464 64.459 68.251 82.739 64.946 66.217
NETHERLANDS 760 949 701 919 685 3.289 987 1.299 1.609 1.028
PORTUGAL 167 559 520 614 1.897 4.557 1.136 1.070 740 2.186
SPAIN 2.657 3.729 3.565 5.217 3.454 8.112 9.349 8.080 11.924 10.101
SWEDEN 201 277 1.173 580 860 843 1.210 1.302 1.456 1.050
UN. KINGDOM 810 609 606 1.177 1.095 2.521 1.087 844 907 1.020
Total EU/15 67.552 76.231 66.966 92.352 82.703 111.581 91.626 107.112 93.352 92.547
(Fonte: Elaborazione dati Eurostat) (Source: Eurostat data processing)

160 XXV Rapporto Marmo e Pietre nel Mondo 2014 XXV World Marble and Stones Report 2014 161
90. Interscambio di tecnologie per la pietra: importazioni UE/15: quantità (tonn.) International exchange of stone technology: EU/15 import : quantity (tons)
COUNTRIES 1998 2000 2002 2004 2006 2008 2010 2011 2012 2013
AUSTRIA 915 1.381 835 764 792 3.0 1.025 1.113 1.269 1.158
BELGIUM 1.876 3.082 1.802 2.855 2.244 6.9 1.948 883 953 961
DENMARK 256 360 367 894 1.210 0.8 509 601 714 619
FINLAND 336 253 275 211 298 3.1 209 376 362 294
FRANCE 2.758 3.738 3.032 4.362 4.126 17.4 3.494 5.000 4.712 3.865
GERMANY 4.772 5.711 4.023 4.336 5.364 12.7 4.217 5.516 5.079 5.438
GREECE 1.286 739 933 1.086 1.466 6.4 1.456 420 186 479
IRELAND 290 462 284 675 347 0.2 85 174 116 190
ITALY 1.584 1.647 1.370 1.892 1.873 6.1 5.305 4.887 5.611 3.146
NETHERLANDS 1.207 782 1.070 1.188 911 2.4 1.423 844 1.440 909
PORTUGAL 2.789 2.601 2.090 1.230 1.202 2.3 645 550 1.032 887
SPAIN 8.132 6.089 4.380 3.985 2.421 16.2 2.305 1.844 1.492 3.801
SWEDEN 362 814 268 436 619 2.6 1.008 954 1.063 933
UN. KINGDOM 2.770 2.557 2.039 4.456 3.175 19.9 1.268 9.388 5.918 8.424
Total EU/15 29.333 30.216 22.768 28.370 26.048 100.0 24.897 32.550 29.947 31.104
(Fonte: Elaborazione dati Eurostat) (Source: Eurostat data processing)
91. Interscambio di tecnologie per la pietra: UE/15 (Index 1998=100) International exchange of stone technology: EU/15 (Index 1998=100)
COUNTRIESEXPORT IMPORT
2010 2011 2012 2013 2010 2011 2012 2013
AUSTRIA 124.1 220.2 150.3 142.5 112.0 121.6 138.7 126.5
BELGIUM 24.5 21.3 66.3 51.0 103.7 47.0 5.07 51.2
DENMARK 309.5 329.7 477.0 401.3 198.8 234.8 278.9 241.8
FINLAND 13.5 45.4 83.0 73.0 62.2 111.9 107.7 87.5
FRANCE 47.6 50.9 34.8 41.2 126.7 181.3 170.8 140.1
GERMANY 146.3 167.2 152.9 131.8 88.4 115.6 106.4 114.0
GREECE 218.9 351.2 234.1 644.5 113.2 32.7 14.5 37.2
IRELAND - - - - 29.3 60.0 40.0 65.5
ITALY 131.2 159.0 124.8 127.3 334.9 308.5 354.2 198.6
NETHERLANDS 129.9 170.9 211.7 135.3 117.9 69.9 119.3 75.3
PORTUGAL 680.2 640.7 443.1 1309.0 23.1 19.7 37.0 31.8
SPAIN 351.9 304.1 448.8 353.6 28.3 22.7 18.3 46.7
SWEDEN 602.0 647.8 724.4 522.4 278.5 263.5 293.6 257.8
UNITED KINGDOM 134.2 104.2 112.0 125..9 45.8 338.9 213.6 304.1
TOTAL EU/15 135.6 158.6 138.2 137.0 84.9 110.9 102.1 106.0
(Fonte: Elaborazione dati Eurostat) (Source: Eurostat data processing)

162 XXV Rapporto Marmo e Pietre nel Mondo 2014 XXV World Marble and Stones Report 2014 163
92. Esportazione di tecnologie per la pietra (UE/27): tonn. 2013 Export of stone technology (EU/27): tons 2013
COUNTRIES INTRA EXTRA TOTAL SHARE
AUSTRIA 577 1128 1705 1.75
BELGIUM 358 1605 1963 2.02
BULGARIA 38 283 321 0.33
CYPRUS - - - -
CZECH REP. 550 86 636 0-65
DENMARK 119 178 297 0.31
ESTONIA 4 31 43 0.04
FINLAND 26 77 103 0.10
FRANCE 442 213 655 0.67
GERMANY 1995 3163 5158 5.31
GREECE 46 1011 1057 1.09
HUNGARY 412 53 465 0.47
IRELAND - 7 7 0.01
ITALY 10000 56217 66217 68.19
LATVIA 28 107 135 0.13
LITHUANIA 8 387 395 0.41
LUXEMBOURG 2 5 7 0.01
MALTA - - - -
NETHERLANDS 445 583 1028 1.06
POLAND 740 594 1334 1.37
PORTUGAL 462 1724 2186 2.25
ROMANIA 173 52 225 0.23
SLOVAKIA 280 255 535 0.55
SLOVENIA 72 387 459 0.47
SPAIN 1984 8117 10101 10.40
SWEDEN 473 577 1050 1.08
UN. KINGDOM 468 552 1020 1.05
TOTAL EU/27 19702 77400 97102 100.00
(Fonte: Elaborazione propria) (Source: own data processing)
93. Importazione di tecnologie per la pietra (UE/27): tonn. 2013 Import of stone technology (EU/27): tons 2013
COUNTRIES INTRA EXTRA TOTAL SHARE
AUSTRIA 378 780 1158 3.08
BELGIUM 210 751 961 2.55
BULGARIA 205 1244 1449 3.85
CYPRUS 10 10 20 0.05
CZECH REP. 52 341 393 1.04
DENMARK 114 505 619 1.64
ESTONIA 21 58 79 0.21
FINLAND 90 204 294 0.78
FRANCE 1516 2349 3865 10.27
GERMANY 2232 3206 5438 14.45
GREECE 42 437 479 1.27
HUNGARY 6 948 954 2.53
IRELAND 22 168 190 0.50
ITALY 563 2583 3146 8.36
LATVIA 11 107 118 0.31
LITHUANIA 45 158 193 0.51
LUXEMBOURG 21 53 82 0.22
MALTA 6 13 19 0.05
NETHERLANDS 889 20 909 2.41
POLAND 1098 1045 2043 5.43
PORTUGAL 19 868 887 2.36
ROMANIA 107 437 544 1.45
SLOVAKIA 11 171 182 0.48
SLOVENIA 36 125 461 1.22
SPAIN 963 2838 3801 10.09
SWEDEN 667 266 933 2.48
UN. KINGDOM 592 7832 8424 23.38
TOTAL EU/27 10124 27517 37641 100.0
(Fonte: Elaborazione propria) (Source: own data processing)

164 XXV Rapporto Marmo e Pietre nel Mondo 2014 XXV World Marble and Stones Report 2014 165
95.
CHIN
A: i
mpo
rt d
i tec
nolo
gie
setto
rial
i (co
d. 8
4.64
) C H
INA:
ston
e te
chno
logy
impo
rt (co
d. 8
4.64
)
2007
2008
2009
2010
2011
2012
2013
COUN
TRIE
S00
0 US
DSh
are
000
USD
Shar
e00
0 US
DSh
are
000
USD
shar
e00
0 US
Dsh
are
000
USD
shar
e00
0 US
Dsh
are
JAPA
N11
1.18
223
.414
4.18
830
.959
.702
18.8
76.2
0416
.825
8.71
331
.627
7,06
945
.917
1.65
035
.9
TAIW
AN33
.681
7.1
45.3
979.
723
.610
7.5
27.9
506.
286
.578
10.6
101.
766
16.9
97.2
4620
.3
SOUT
H KO
REA
45.4
459.
525
.678
5.5
20.8
336.
611
.222
2.5
72.5
978.
996
,477
16.0
65.8
2213
.8
GERM
ANY
62.1
9413
.138
.059
8.1
35.8
9811
.310
.518
2.3
68.0
898.
334
.650
5.7
46.0
009.
6
ITAL
Y30
.255
6.4
31.7
586.
819
.420
6.2
85.4
8518
.852
.835
6.5
31.5
105.
226
.337
5.5
USA
11.8
732.
514
.482
3.1
8.53
72.
73.
400
2.1
13.4
011.
611
.809
2.0
14.7
023.
1
SWIT
ZERL
AND
145.
843
30.7
142,
840
30.6
134.
188
42.3
106.
113
23.4
228.
696
27.9
16.2
852.
714
.425
3.0
SPAI
N17
60.
141
40.
199
...12
.150
2.7
205
...67
60.
165
10.
2
AUST
RALI
A2.
462
0.5
136
...45
...13
70.
31.
275
0.2
1.07
70.
244
20.
1
CAN
ADA
7...
--
6...
20...
329
...40
...83
-
OTHE
RS31
.178
6.7
24.3
865.
214
.394
4.5
114.
245
24.5
35.9
244.
432
.068
5.3
40.5
598.
5
T OTA
L47
4.29
610
0.0
467.
343
100.
031
6.89
010
0.0
453.
624
100.
081
8.64
210
0.0
603.
427
100.
047
7.91
710
0.0
(Fon
te: E
labo
razio
ne d
ati C
omtra
de)
(Sou
rce:
Com
trade
dat
a pr
oces
sing)
94. ITALIA: export di tecnologie settoriali ITALy: stone technology export
Quantity Value Av. Price
YEAR 000 kg. Index 000 € Index €/ kg. Index
1998 52.035 100.0 344.712 100.0 6,63 100.0
1999 48.888 94.0 339.398 98.5 6,94 104.7
2000 57.304 110.1 414.476 120.2 7,23 109.0
2001 56.756 109.1 408.677 118.5 7,20 108.6
2002 48.920 94.0 360.838 104.7 7,38 111.3
2003 68.141 131.0 460.174 133.5 6,75 101.8
2004 69.345 133.3 504.457 146.3 7,27 109.7
2005 65.070 125.0 503.267 146.0 7.73 116.6
2006 60.464 116.2 501.091 145.4 8,29 125.0
2007 63.004 121.0 549.967 159.5 8,73 131.7
2008 64.459 123.9 593.279 172.1 9,20 138.7
2009 45.203 83.0 393.400 114.1 8,70 131.3
2010 68.251 131.2 613.147 177.8 8,98 135.4
2011 82.739 159.0 669.776 194.3 8,10 122.1
2012 64.946 124.8 632.532 183.5 9,74 146.9
2013 66.217 127.3 700.712 203.3 10,58 159.6
(Fonte: Elaborazione dati Eurostat) (Source: Eurostat data processing)

166 XXV Rapporto Marmo e Pietre nel Mondo 2014 XXV World Marble and Stones Report 2014 167
96.
USA
: im
port
di t
ecno
logi
e se
ttori
ali (
cod.
84.
64)
USA:
ston
e te
chol
ogy i
mpo
rt (co
d. 8
4.64
)
2007
2008
2009
2010
2011
2012
2013
COUN
TRIE
S 00
0 US
DSh
are
000
USD
Shar
e00
0 US
DSh
are
000
USD
Shar
e00
0 US
DSh
are
000
USD
Shar
e00
0 US
DSh
are
CHIN
A77
.820
24.2
61.7
0321
.540
.601
25.0
43.9
6428
.945
.821
23.1
55.8
6327
.170
.262
31.9
ITAL
Y92
.856
28.9
70.1
9024
.530
.393
18.7
19.4
8912
.833
.257
16.7
47.8
4223
.255
.312
25.1
GERM
ANY
51.1
0515
.933
.736
11.8
18.8
1511
.610
.553
6.9
25.9
5213
.118
.445
8.9
23.7
0810
.8
TAIW
AN17
.095
5.3
16.3
115.
723
.284
14.3
23.0
5715
.120
.259
10.2
15.2
187.
410
.863
4.9
JAPA
N24
.614
7.7
28.8
6310
.18.
977
5.5
12.2
228.
025
.915
13.0
18.0
468.
810
.675
4.8
SPAI
N2.
177
0.7
1.75
90.
61.
918
1.2
14.1
369.
31.
295
0.7
3.00
21.
59.
442
4.3
SWIT
ZERL
AND
15.3
344.
834
.439
12.0
19.8
8812
.22.
627
1.7
7.96
84.
010
.655
5.2
7.14
23.
2
SWED
EN2.
690
0.8
2.53
90.
92.
538
1.6
4.91
43.
25.
258
2.6
5.31
52.
64.
976
2.3
SOUT
H KO
REA
1.25
10.
456
20.
21.
630
1.0
2.97
82.
01.
811
0.9
2.52
01.
23.
522
1.6
ISRA
EL2.
597
0.8
4.78
21.
71.
866
1.1
3.26
12.
14.
589
2.3
4.90
32.
43.
090
1.4
UNIT
ED K
INGD
OM6.
005
1.9
2.34
90.
81.
258
0.8
2.89
01.
94.
823
2.4
3.92
81.
91.
316
0.7
UKRA
INE
1.48
20.
53.
307
1.2
1.10
20.
73.
374
2.2
5.61
02.
83,
003
1.5
93-
OTHE
RS25
.874
8.1
26.3
539.
010
.016
6.3
8.76
05.
916
.074
8.2
17.4
838.
319
.809
9.0
TOTA
L32
0.90
010
0.0
286.
893
100.
016
2.28
610
0.0
152.
225
100.
019
8.63
210
0.0
206.
223
100.
022
0.21
010
0.0
(Fon
te: E
labo
razio
ne d
ati C
omtra
de)
(Sou
rce:
Com
trade
dat
a pr
oces
sing)
97. INDIA: import di tecnologie settoriali (cod. 84.64). 000 USDINDIA: stone techology import (cod. 84.64). 000 USD
COUNTRIES 2007 2008 2009 2010 2011 2012 2013
CHINA 18.635 40.919 13.342 21.088 38.855 32.226 34.647
ITALY 31.680 40.407 12.119 31.343 44.294 29.625 26.295
SPAIN 105 271 16 337 521 2.016 7.873
GERMANY 7.704 6.161 17.312 6.329 12.634 5.852 7.335
ISRAEL 3.665 2.276 2.051 4.608 4.830 7.864 3.601
JAPAN 371 2.659 4.365 2.084 1.615 3.271 2.075
USA 2.224 1.321 176 3.191 3.009 2.343 1.296
SWITZERLAND 3.009 1.319 1.077 2.717 599 983 603
BELGIUM 735 205 177 65 1.019 2.874 107
NETHERLANDS - 135 860 16 36 1.133 26
OTHERS 5.651 8.818 4.538 6.936 6.116 5.323 3.465
TOTAL 73.797 104.491 56.033 78.714 113.528 93.510 87.323
(Fonte: Elaborazione dati Comtrade) (Source: Comtrade data processing)

168 XXV Rapporto Marmo e Pietre nel Mondo 2014 XXV World Marble and Stones Report 2014 169
98. TURCHIA: import di tecnologie settoriali (cod. 84.64) 000 USDTURkEy: stone techology import (cod. 84.64) 000 USD
COUNTRIES 2007 2008 2009 2010 2011 2012 2013
ITALY 42.797 36.365 16.205 21.008 71.719 38.688 64.691
CHINA 7.513 12.496 3.602 7.633 15.411 17.514 20.729
GERMANY 19.482 10.752 9.025 2.030 8.738 3.164 4.567
AUSTRIA 1.859 4.927 785 1.132 637 1.316 3.221
FRANCE 6.657 1.338 985 1.347 1.722 1.309 2.301
SWITZERLAND 868 477 236 225 815 262 1.198
SPAIN 2.567 1.781 962 1.508 989 895 822
JAPAN 2.200 1.182 465 810 664 305 470
SOUTH KOREA 465 511 219 447 798 795 351
USA 273 1.751 371 823 1.116 2.559 350
OTHERS 2.624 1.315 797 2.172 1.569 1.401 6.711
TOTAL 87.305 72.895 33.652 39.135 104.178 68.208 105.411
(Fonte: Elaborazione dati Comtrade) (Source: Comtrade data processing)
99. Tecnologie per marmi e pietre: Paesi esportatori leaderStone equipment and technology: export leading countries
COUNTRIES2012 2013
000 USD Shares 000 USD Shares
ITALY 812.198 36.3 959.974 37.1
CHINA 431.658 19.3 635.388 24.6
JAPAN 248.412 11.1 240.471 9.3
GERMANY 213.255 9.5 199.008 7.7
SPAIN 76.778 3.4 98.493 3.8
USA 85.297 3.8 84.990 3.3
SWITZERLAND 99.287 4.4 74.426 2.9
AUSTRIA 52.426 2.3 64.743 2.5
SOUTH KOREA 69.158 3.1 62.229 2.4
NETHERLANDS 40.037 1.8 40.357 1.6
SWEDEN 38.298 1.7 38.211 1.5
BELGIUM 27.464 1.2 29.081 1.1
UNITED KINGDOM 17.376 0.8 17.254 0.7
FRANCE 10.706 0.5 16.528 0.6
MALAYSIA 5.079 0.2 14.124 0.5
TURKEY 12.397 0.6 11.420 0.5
SUB-TOTAL 2.239.826 100.0 2.586.643 100.0
(Fonte: Elaborazione dati Comtrade) (Source: Comtrade data processing)

170 XXV Rapporto Marmo e Pietre nel Mondo 2014 XXV World Marble and Stones Report 2014 171
100. Tecnologie per marmi e pietre: export in valore dall’Unione EuropeaStone equipment and technology: value export from EU/27 countries
COUNTRIES2012 2013
000 USD Shares 000 USD Shares
ITALY 812.199 60.9 959.974 62.9
GERMANY 213.255 16.0 199.008 13.0
SPAIN 76.778 5.8 98.493 6.6
AUSTRIA 52.426 3.9 64.743 4.2
NETHERLANDS 40.037 3.0 40.357 2.7
SWEDEN 38.298 2.9 38.211 2.6
BELGIUM 27.464 2.1 29.081 1.9
UNITED KINGDOM 17.376 1.3 17.254 1.1
FRANCE 10.706 0.8 16.528 1.1
PORTUGAL 5.304 0.4 11.306 0.7
CZECH. REPUBLIC 11.262 0.8 10.395 0.7
BULGARIA 2.850 0.2 6.950 0.5
POLAND 4.668 0.3 6.803 0.4
LITHUANIA 3.680 0.3 6.262 0.4
DENMARK 1.972 0.1 4.720 0.3
FINLAND 3.945 0.3 3.114 0.2
GREECE 1.383 0.1 2.981 0.2
HUNGARY 4.560 0.3 2.691 0.2
SLOVENIA 1.451 0.1 2.085 0.1
ROMANIA 1.380 0.1 1.415 0.1
ESTONIA 322 - 904 0.1
LUXEMBOURG 1.124 0.1 711 -
LATVIA 806 0.1 684 -
SLOVAKIA 467 - 568 -
IRELAND 498 - 60 -
CYPRUS 7 - 19 -
MALTA 13 - - -
TOTAL EU/27 1.334.231 100.0 1.525.317 100.0
(Fonte: Elaborazione dati Comtrade) (Source: Comtrade data processing)
101. Tecnologie per marmi e pietre: Paesi importatori leader extra-UE (2013)Stone equipment and technology: import leading countries extra-EU (2013)
COUNTRIES000 USD FROM ITALY
Total Shares 000 USD Shares Benchmark
CHINA 477.917 35.0 26.337 7.1 5.5
USA 220.210 16.1 55.312 14.9 25.1
BRAZIL 148.097 10.8 93.234 25.1 62.9
TURKEY 105.411 7.7 64.692 17.4 61.4
INDIA 87.323 6.4 26.295 7.1 30.1
CANADA 64.402 4.7 18.321 4.9 28.4
SAUDI ARABIA 53.041 3.9 38.944 10.5 73.4
SOUTH KOREA 46.467 3.4 3.504 0.9 7.5
SWITZERLAND 35.448 2.6 6.680 1.8 18.8
AUSTRALIA 27.336 2.0 12.710 3.4 46.5
ALGERIA 21.055 1.5 6.948 1.9 33.0
JAPAN 20.280 1.5 629 0.2 3.1
MALAYSIA 19.241 1.4 2.668 0.7 13.9
SOUTH AFRICA 16.872 1.2 7.201 1.9 44.0
CHILE 13.180 1.0 4.073 1.1 30.9
COLOMBIA 10.138 0.7 3.936 1.1 38.8
SUB-TOTAL 1.366.418 100.0 371.484 100.0 27.2
(Fonte: Elaborazione dati Comtrade) (Source: Comtrade data processing)

172 XXV Rapporto Marmo e Pietre nel Mondo 2014 XXV World Marble and Stones Report 2014 173
102. Tecnologie per marmi e pietre: import in valore nell’Unione Europea (2013)Stone equipment and technology: value import in EU/27 countries (2013)
COUNTRIES000 USD FROM ITALY
Abs. fig. Shares 000 USD % : total
GERMANY 97.380 20.7 36.508 37.5
FRANCE 63.686 13.5 24.343 38.2
UNITED KINGDOM 40.937 8.7 11.046 27.0
POLAND 32.512 6.9 9.008 27.7
ITALY 31.122 6.6 - -
AUSTRIA 30.760 6.5 4.168 13.5
BELGIUM 29.057 6.2 11.778 40.5
SPAIN 26.274 5.6 8.865 33.7
NETHERLANDS 18.954 4.0 2.444 12.9
BULGARIA 16.369 3.5 8.595 52.5
SWEDEN 14.245 3.0 1.842 12.9
CZECH REPUBLIC 12.775 2.7 3.078 24.1
PORTUGAL 11.360 2.4 5.078 44.7
GREECE 7.759 1.6 4.654 60.0
DENMARK 7.112 1.5 1.047 14.7
ROMANIA 6.185 1.3 2.569 41.5
LITHUANIA 5.144 1.1 2.113 41.1
HUNGARY 4.863 1.0 1.349 27.7
FINLAND 4.855 1.0 808 16.6
SLOVENIA 2.412 0.5 1.591 66.0
IRELAND 2.089 0.4 74 3.5
ESTONIA 1.690 0.4 736 43.6
LATVIA 1.291 0.3 164 12.7
LUXEMBOURG 1.178 0.2 37 3.1
MALTA 240 0.1 105 43.8
SLOVAKIA 214 - 11 5.1
CYPRUS 92 - 3 3.2
TOTAL EU/27 470.555 100.0 142.014 32.3
(Fonte: Elaborazione dati Comtrade) (Source: Comtrade data processing)
103. Beni strumentali per la pietra: export UE (mill. euro)Instrumental goods for stone: export EU (mill. euros)
EXTRA-EU INTRA-EU
COUNTRIES 2010 2011 2012 2013 2010 2011 2012 2013
AUSTRIA 56,9 71,7 76,2 74,6 125,5 153,9 153,3 159,5
BELGIUM 4,0 3,6 4,3 4,9 18,6 21,8 21,3 23,6
BULGARIA 2,5 2,7 3,2 3,2 -1,3 1,9 1,8 2,2
CYPRUS - - - - - - - -
CZECH REP. 2,7 3,8 4,3 5,8 15,8 16,3 23,3 28,1
DENMARK 1,4 0,8 1,2 1,1 5,9 1,4 1,4 1,5
ESTONIA 0,1 0,1 0,2 0,2 0,2 0,3 0,3 0,3
FINLAND 2,8 3,1 3,3 3,9 2,7 3,2 3,5 1,4
FRANCE 10,2 10,4 14,1 12,4 37,3 38,8 38,2 41,9
GERMANY 176,3 203,4 219,3 231,9 260,4 288,4 283,8 276,9
GREECE 2,2 1,3 0,3 0,3 0,6 0,4 0,2 0,2
HUNGARY 1,8 1,5 1,9 1,8 2,8 2,9 4,4 5,8
IRELAND 5,7 4,0 4,7 3,2 19,1 15,6 16,8 14,0
ITALY 126,2 128,6 140,7 166,0 95,0 104,9 102,8 102,8
LATVIA 0,3 0,2 0,9 0,1 0,6 0,7 0,6 1,1
LITHUANIA 1,7 1,6 2,4 2,5 0,3 0,4 0,2 1,0
LUXEMBOURG 1,5 1,4 1,4 1,4 13,6 11,2 7,7 7,6
MALTA - - - - - - - -
NETHERLANDS 16,6 28,6 30,4 27,6 47,7 60,7 59,6 64,8
POLAND 28,4 30,2 34,5 36,2 46,0 49,9 52,2 52,3
PORTUGAL 3,4 3,6 6,5 8,6 4,6 5,7 5,8 5,7
ROMANIA 0,2 0,2 0,2 0,2 0,8 0,5 0,6 0,8
SLOVAKIA 0,2 0,3 0,3 0,3 0,7 0,5 0,7 0,7
SLOVENIA 30,6 36,2 37,8 35,9 27,1 29,8 29,3 28,7
SPAIN 12,8 16,7 16,3 19,7 39,9 43,5 44,8 42,4
SWEDEN 23,6 25,4 22,8 19,2 17,8 18,4 17,7 14,0
UN.KINGDOM 11,0 11,8 10,6 10,0 16,7 18,9 14,7 18,1
TOTAL EU/27 523,1 591,2 639,8 670,9 800,8 889,8 885,0 897,5
(Fonte: Elaborazione propria) (Source: own data processing)

174 XXV Rapporto Marmo e Pietre nel Mondo 2014 XXV World Marble and Stones Report 2014 175
104. Beni strumentali per la pietra: import UE (mill. euro)Instrumental goods for stone: import EU (mill. euro)
EXTRA-EU INTRA-EU
COUNTRIES 2010 2011 2012 2013 2010 2011 2012 2013
AUSTRIA 19,5 29,2 29,6 32,4 32,3 38,8 39,3 44,0
BELGIUM 8,6 11,7 11,8 13,2 26,9 30,1 28,0 26,4
BULGARIA 1,3 1,3 1,6 1,8 3,9 4,7 4,8 4,6
CYPRUS 0,1 0,1 0,1 - 0,8 0,9 0,6 0,6
CZECH REP. 5,0 5,5 6,4 5,8 30,1 3,53 37,7 38,0
DENMARK 1,8 1,6 1,8 2,0 12,1 9,3 11,2 10,2
ESTONIA 0,5 0,6 0,6 0,6 3,4 2,4 2,4 2,8
FINLAND 3,4 3,2 3,0 3,2 12,7 13,4 13,6 13,3
FRANCE 23,9 22,6 21,6 19,7 85,1 88,7 87,3 86,4
GERMANY 114,8 118,9 123,4 116,2 136,2 158,0 154,6 148,9
GREECE 1,0 0,7 0,2 0,2 8,7 7,5 6,0 6,2
HUNGARY 2,8 3,3 3,3 6,4 12,7 15,2 15,5 14,3
IRELAND 2,2 4,8 2,3 1,6 3,5 5,6 4,4 4,3
ITALY 25,7 24,8 24,3 21,0 65,4 66,6 61,5 63,9
LATVIA 0,5 0,5 0,5 0,4 1,8 2,6 3,1 2,8
LITHUANIA 1,3 1,5 1,6 1,3 2,7 3,1 3,4 4,6
LUXEMBOURG 5,1 4,2 2,5 2,5 5,1 5,8 4,4 4,2
MALTA 0,1 0,7 0,5 0,4 0,4 0,7 0,6 1,0
NETHERLANDS 16,6 20,5 22,5 24,0 32,7 37,8 39,5 43,2
POLAND 17,9 15,6 17,7 16,3 35,6 44,2 39,6 34,4
PORTUGAL 1,6 1,6 1,7 1,6 18,9 15,7 17,2 16,1
ROMANIA 3,3 3,3 3,1 3,2 18,0 18,9 19,7 18,6
SLOVAKIA 0,7 0,9 1,0 0,8 14,4 16,5 16,5 15,2
SLOVENIA 1,3 1,4 1,8 1,9 6,1 6,8 6,3 5,3
SPAIN 15,8 15,7 16,2 14,3 46,0 51,4 48,7 49,0
SWEDEN 10,0 10,6 11,0 9,8 24,1 25,9 23,8 23,4
UN.KINGDOM 18,4 19,7 19,3 20,9 35,3 40,7 38,4 41,7
TOTAL EU/27 303,3 329,4 329,4 336,1 674,8 746,5 728,1 723,4
(Fonte: Elaborazione propria) (Source: own data processing)
105. Beni strumentali per la pietra: export totale UE (valore)Instrumental goods for stone: export total EU (value)
2010 2011 2012 2013
COUNTRIESmill. Euro share
mill. Euro share
mill. Euro share
mill. Euro share
AUSTRIA 182,4 13.8 225,6 15.2 229,5 15.1 234,1 14.9
BELGIUM 22,6 1.7 25,4 1.7 25,6 1.7 28,5 1.6
BULGARIA 3,8 0.3 4,6 0.3 5,0 0.3 5,4 0.3
CYPRUS - - - - - - - -
CZECH REP. 18,5 1.4 20,1 1.4 27,6 1.8 33,9 2.2
DENMARK 7,3 0.6 2,2 0.1 2,6 0.2 2,6 0.2
ESTONIA 0,3 ... 0,4 ... 0,5 ... 0,5 -
FINLAND 5,5 0.4 6,3 0.4 6,8 0.4 5,3 0.3
FRANCE 47,5 3.6 49,2 3.3 52,3 3.4 54,3 3.5
GERMANY 436,7 33.0 491,8 33.2 503,1 33.0 508,8 32.4
GREECE 2,8 0.2 1,7 0.1 0,5 ... 0,5 -
HUNGARY 4,6 0.3 4,4 0.3 6,3 0.4 7,6 0.3
IRELAND 24,8 1.9 19,6 1.3 21.5 1.4 17,2 1.1
ITALY 221,2 16.7 233,5 15.8 243,5 16.0 268,8 17.1
LATVIA 0,9 0.1 0,9 0.1 1.5 0.1 1,2 0.1
LITHUANIA 2,0 0.2 2,0 0.1 2,6 0.2 3,5 0.2
LUXEMBOURG 15,1 1.1 12,6 0.9 9,1 0.6 9,0 0.5
MALTA - - - - - - - -
NETHERLANDS 64,3 4.8 89,3 6.0 90,0 5.9 92,4 5.9
POLAND 74,4 5.6 80,1 5.4 86,7 5.7 88,5 5.6
PORTUGAL 8,0 0.6 9,3 0.6 12,3 0.8 14,3 0.9
ROMANIA 1,0 0.1 0,7 ... 0,8 0.1 1,0 0.1
SLOVAKIA 0,9 0.1 0,8 0.1 1,0 0.1 1,0 0.1
SLOVENIA 57,8 4.4 66,0 4.5 67,1 4.4 64,6 4.1
SPAIN 52,7 4.0 60,2 4.1 61,1 4.0 62,1 4.0
SWEDEN 41,4 3.1 43,8 3.0 40,5 2.7 33,2 2.1
UN.KINGDOM 27,7 2.1 30,7 2.1 25,3 1.7 28,1 1.8
TOTAL EU/27 1.323,9 100.0 1.481,0 100.0 1.524,8 100.0 1.568,4 100.0
(Fonte: Elaborazione dati Eurostat) (Source: Eurostat data processing)

176 XXV Rapporto Marmo e Pietre nel Mondo 2014 XXV World Marble and Stones Report 2014 177
106. Beni strumentali per la pietra: import totale UE (valore)Instrumental goods for stone: import total EU (value)
2010 2011 2012 2013
COUNTRIESmill. Euro share
mill. Euro share
mill. Euro share
mill. Euro share
AUSTRIA 51,8 5.3 68,0 6.3 68,9 6.5 76,4 7.2
BELGIUM 35,5 3.6 41,8 3.9 39,8 3.8 39,6 3.7
BULGARIA 5,2 0.5 6,0 0.6 6,4 0.6 6,4 0.6
CYPRUS 0,9 0.1 1,0 0.1 0,7 0.1 0,6 0.1
CZECH REP. 35,1 3.6 40,8 3.8 44,1 4.2 43,8 4.1
DENMARK 13,9 1.4 10,9 1.0 13,0 1.2 12,2 1.2
ESTONIA 3,9 0.4 3,0 0.3 3,0 0.3 3,4 0.3
FINLAND 16,1 16.5 16,6 1.5 16,6 1.6 16,5 1.6
FRANCE 109,0 11.1 111,3 10.4 108,9 10.3 106,1 10.0
GERMANY 251,0 25.7 276,9 25.9 278,0 26.3 265,1 25.0
GREECE 9,7 1.0 8,2 0.8 6,2 0.6 6,8 0.6
HUNGARY 15,5 1.6 18,5 1.7 18,8 1.8 20,7 2.0
IRELAND 5,7 0.6 10,4 1.0 6,7 0.6 5,9 0.6
ITALY 91,1 9.3 91,4 8.5 85,8 8.1 84,9 8.0
LATVIA 2,3 0.2 3,1 0.3 3,6 0.3 5,9 0.6
LITHUANIA 4,0 0.4 4,6 0.4 5,0 0.5 5,9 0.6
LUXEMBOURG 10,2 10.4 10,0 0.9 6,9 0.7 6,7 0.6
MALTA 0,5 ... 1,4 0.1 1,1 0.1 1,4 0.1
NETHERLANDS 49,3 5.0 58,3 5.4 62,0 5.9 67,2 6.3
POLAND 53,5 5.5 59,8 5.6 57,3 5.4 50,7 4.8
PORTUGAL 20,5 2.1 17,3 1.6 18,9 1.8 17,7 1.7
ROMANIA 21,3 2.2 22,2 2.1 22,8 2.2 21,8 2.1
SLOVAKIA 15,1 1.5 17,4 1.6 17,5 1.7 16,0 1.5
SLOVENIA 7,4 0.8 8,2 0.8 8,1 0.8 7,2 0.7
SPAIN 61,8 6.3 67,1 6.3 64,9 6.1 63,3 6.0
SWEDEN 34,1 3.5 36,5 3.4 34,8 3.3 33,2 3.1
UN.KINGDOM 53,7 5.5 60,4 5.6 57,7 5.5 62,6 5.9
TOTAL EU/27 978,1 100.0 1.071,1 100.0 1.057,5 100.0 1.059,5 100.0
(Fonte: Elaborazione dati Eurostat) (Source: Eurostat data processing)
107. Fattori di successo nell’industria lapideaSuccess factors in stone industry
FACTORS Very important(a)
Important(b)
Sub- total(a+b)
Not important(c)
Qualità del prodottoProduct quality 89.2 10.8 100.0 -
Prezzo medio di venditaSales average price 75.7 21.6 97.3 2.7
Nuovi mercatiNew markets 54.0 43.2 97.2 2.8
R.M. e promozioneMarketing/promotion 59.5 32.4 91.9 8.1
Nuovi materialiNew materials 37.8 48.6 86.4 13.6
DiversificazioneDiversification 51.4 29.7 81.1 19.9
Immagine e DesignImages/Design 32.4 27.0 59.4 40.6
(Fonte: Rochas de Qualidade) (Source: Rochas de Qualidade)
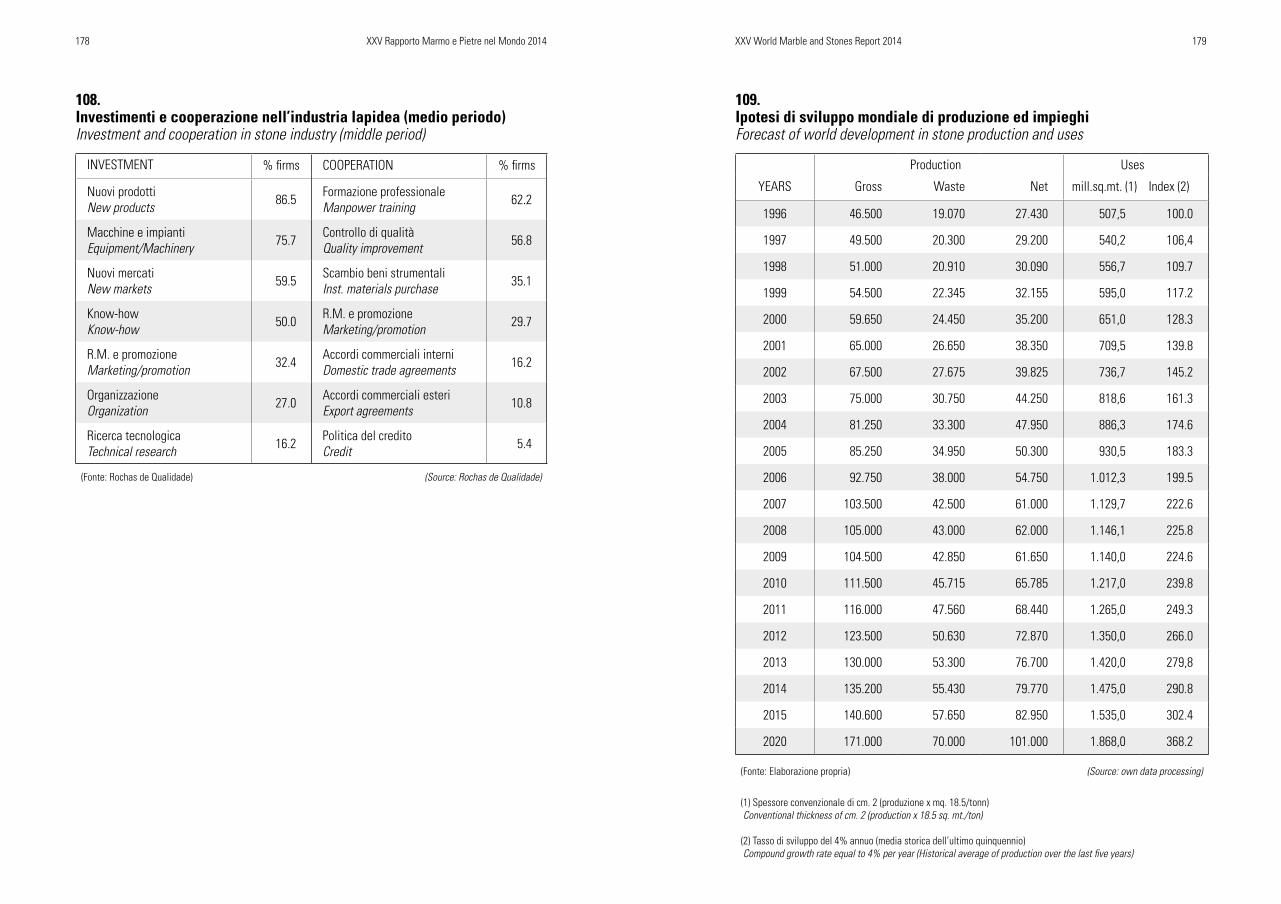
178 XXV Rapporto Marmo e Pietre nel Mondo 2014 XXV World Marble and Stones Report 2014 179
108. Investimenti e cooperazione nell’industria lapidea (medio periodo)Investment and cooperation in stone industry (middle period)
INVESTMENT % firms COOPERATION % firms
Nuovi prodottiNew products 86.5 Formazione professionale
Manpower training 62.2
Macchine e impiantiEquipment/Machinery 75.7 Controllo di qualità
Quality improvement 56.8
Nuovi mercatiNew markets 59.5 Scambio beni strumentali
Inst. materials purchase 35.1
Know-howknow-how 50.0 R.M. e promozione
Marketing/promotion 29.7
R.M. e promozioneMarketing/promotion 32.4 Accordi commerciali interni
Domestic trade agreements 16.2
OrganizzazioneOrganization 27.0 Accordi commerciali esteri
Export agreements 10.8
Ricerca tecnologicaTechnical research 16.2 Politica del credito
Credit 5.4
(Fonte: Rochas de Qualidade) (Source: Rochas de Qualidade)
109. Ipotesi di sviluppo mondiale di produzione ed impieghi Forecast of world development in stone production and uses
Production Uses
YEARS Gross Waste Net mill.sq.mt. (1) Index (2)
1996 46.500 19.070 27.430 507,5 100.0
1997 49.500 20.300 29.200 540,2 106,4
1998 51.000 20.910 30.090 556,7 109.7
1999 54.500 22.345 32.155 595,0 117.2
2000 59.650 24.450 35.200 651,0 128.3
2001 65.000 26.650 38.350 709,5 139.8
2002 67.500 27.675 39.825 736,7 145.2
2003 75.000 30.750 44.250 818,6 161.3
2004 81.250 33.300 47.950 886,3 174.6
2005 85.250 34.950 50.300 930,5 183.3
2006 92.750 38.000 54.750 1.012,3 199.5
2007 103.500 42.500 61.000 1.129,7 222.6
2008 105.000 43.000 62.000 1.146,1 225.8
2009 104.500 42.850 61.650 1.140,0 224.6
2010 111.500 45.715 65.785 1.217,0 239.8
2011 116.000 47.560 68.440 1.265,0 249.3
2012 123.500 50.630 72.870 1.350,0 266.0
2013 130.000 53.300 76.700 1.420,0 279,8
2014 135.200 55.430 79.770 1.475,0 290.8
2015 140.600 57.650 82.950 1.535,0 302.4
2020 171.000 70.000 101.000 1.868,0 368.2
(Fonte: Elaborazione propria) (Source: own data processing)
(1) Spessore convenzionale di cm. 2 (produzione x mq. 18.5/tonn) Conventional thickness of cm. 2 (production x 18.5 sq. mt./ton)
(2) Tasso di sviluppo del 4% annuo (media storica dell’ultimo quinquennio) Compound growth rate equal to 4% per year (Historical average of production over the last five years)

180 XXV Rapporto Marmo e Pietre nel Mondo 2014 XXV World Marble and Stones Report 2014 181
110. Consumi mondiali di ceramica e lapideiWorld uses of ceramic tiles and stone
ceramic tiles stone stone/tiles
YEAR mill. sq. mt. index mill. sq. mt./2 index %
1990 2.150 100.0 285 100.0 13.2
1995 3.650 170.0 462 162.1 12.7
2000 5.320 247.4 651 228.4 12.2
2005 6.500 302.3 930 326.3 14.3
2006 7.090 329.8 1.012 355.1 14.2
2007 7.800 362.7 1.130 396.5 14.5
2008 8.150 379.1 1.150 403.5 14.1
2009 8.510 395.8 1.140 400.0 13.4
2010 8.640 401.7 1.217 427.0 14.0
2011 8.750 407.0 1.265 443.9 14.5
2012 9.250 430.2 1.350 473.7 14.6
2013 9.500 441.9 1.420 498.2 14.9
(Fonte: Elaborazione propria da fonti varie) (Source: own processing on various sources)
111. Popolazione mondiale: dati storici e prospettive (mill.)World population: historical outline and possible development
PAR. AREA 1950 1975 2000 2025 2050
ABS.
FIG
URES
ASIA 1.402 2.406 3.672 4.853 5.459
AFRICA 221 406 794 1.408 2.020
LATIN AMERICA 167 322 519 684 769
EUROPE 547 676 727 768 757
NORTH AMERICA 172 243 314 415 484
OCEANIA 13 21 31 44 55
WORLD 2.522 4.074 6.057 8.172 9.544
SHAR
ES
ASIA 55.6 59.0 60.6 59.4 57.2
AFRICA 8.8 10.0 13.1 17.2 21.2
LATIN AMERICA 6.6 7.9 8.6 8.4 8.1
EUROPE 21.7 16.6 12.0 9.4 7.8
NORTH AMERICA 6.8 6.0 5.2 5.1 5.1
OCEANIA 0.5 0.5 0.5 0.5 0.6
WORLD 100.0 100.0 100.0 100.0 100.0
(Fonte: Elaborazione dati ONU) (Source: UNO data processing)

182 XXV Rapporto Marmo e Pietre nel Mondo 2014 XXV World Marble and Stones Report 2014 183
112. Export lapideo mondiale: valore (mill. USD)Stone world export: value (mill. USD)
YEARS China Italy Turkey India Brazil Spain Portugal Others TOTAL
2001 926,1 1.603,4 223,1 424,5 227,6 808,1 220,0 897,2 5.330
2005 2.171,5 2.150,4 734,5 882,7 776,7 1.136,1 257,1 1.241,0 9.350
2006 2.787,4 2.206,6 1.027,4 991,6 911,5 1.191,2 303,3 1.641,0 11.060
2007 3.335,2 2.537,6 1.242,5 1.363,0 1.093,0 1.356,0 369,5 1.903,2 13.200
2008 3.843,8 2.551,2 1.402,1 1.455,1 954,5 1.274,1 399,7 3.389,5 15.270
2009 3.562,5 1.902,5 1.222,7 1.367 715,7 982,5 301,7 4.025,0 14.080
2010 4.097,0 2.023,6 1.585,8 1.182,4 955,2 1.020,0 390,0 5.096,0 16.350
2011 5.008,0 2.218,8 1.690,9 1.380,8 996,4 1.159,0 420,0 5.086,1 17.960
2012 5.209,0 2.274,1 1.897,5 1.926,9 1.057,8 1.123,5 414,5 5.455,7 19.360
2013 6.206,3 2.566,8 2.214,8 2.026,4 1.285,2 1.183,9 500,0 6.269,0 22.250
(Fonte: Elaborazione dati Comtrade) (Source: Comtrade data processing)
113. Export lapideo mondiale: valore (index)Stone world export: value (index)
YEARS China Italy Turkey India Brazil Spain Portugal Others TOTAL
2001 100.0 100.0 100.0 100.0 100.0 100.0 100.0 100.0 100.0
2005 234,5 134,1 329.2 207.9 341,3 140.6 116.9 138.3 175.4
2006 301,0 137.6 460.5 233,6 400.5 147.4 137.7 182.9 207.5
2007 360,1 158.3 556.9 321.0 480.2 167.8 168.0 212.1 247.6
2008 415.1 159.1 628.5 342.8 419.3 157.7 181.7 377.8 286.5
2009 384.7 118.7 548.1 322.2 314.5 121.6 137.1 448.6 264.2
2010 442.4 126.2 710.8 278.5 419.7 126.2 177.3 567.5 306.8
2011 540.8 138.4 757.9 325.3 437.8 143.4 190.9 566.9 337.0
2012 562.5 141.8 850.5 453.9 464.8 139.0 188.4 608.1 363.2
2013 670.2 160.1 992.7 477.4 564,7 146.5 227.3 698.7 417.5
(Fonte: Elaborazione dati Comtrade) (Source: Comtrade data processing)

184 XXV Rapporto Marmo e Pietre nel Mondo 2014
114. Export lapideo mondiale: valore (shares)Stone world export: value (shares)
YEARS China Italy Turkey India Brazil Spain Portugal Others TOTAL
2001 17.4 30.1 4.2 8.0 4.3 15.2 4.1 16.7 100.0
2005 23.2 23.0 7.8 9.4 8.3 12.1 2.7 13.5 100.0
2006 25.2 20.0 9.2 9.0 8.2 10.8 2.7 14.9 100.0
2007 25.2 19.2 9.4 10.3 8.3 10.3 2.8 14.5 100.0
2008 25.1 16.7 9.2 9.5 6.3 8.3 2.6 22.3 100.0
2009 25.3 13.5 8.7 9.7 5.1 7.0 2.1 28.6 100.0
2010 25.1 12.4 9.7 7.3 5.8 6.2 2.4 31.2 100.0
2011 27.9 12.4 9.4 7.7 5.5 6.5 2.3 28.3 100.0
2012 26.9 11.7 9.8 9.9 5.5 5.8 2.1 28.3 100.0
2013 27.9 11.5 10.0 9.1 5.8 5.3 2.2 28.2 100.0
(Fonte: Elaborazione dati Comtrade) (Source: Comtrade data processing)
Alla stregua di quanto proposto in prece-denti edizioni del Rapporto, nelle tavole che seguono vengono evidenziati, per quanto attiene al loro andamento storico venten-nale, i parametri essenziali di produzione, interscambio e consumo, con riferimento ai 24 Paesi leader in campo estrattivo, distri-butivo ed utilizzatore. Si tratta di schede improntate ad un modulo di facile approccio e di agevole consultazione anche nell’ottica comparativa, e nel contempo, tale da con-sentire l’estrapolazione di valutazioni at-tendibili circa le potenzialità di sviluppo in ciascun Paese.La fotografia che emerge da questa sintesi deve considerarsi esauriente, perché si rife-risce ad un aggregato pari ad oltre quattro quinti della produzione lapidea mondiale, mentre il volume del corrispondente inter-scambio è ancora più significativo.Questo ventaglio di Paesi può essere suddi-viso in tre sottogruppi ugualmente importan-ti. Il primo riguarda i maggiori protagonisti dell’escavazione: nell’ordine, Cina, India, Turchia, Brasile, Italia, Spagna, Portogallo,
Francia. Nel secondo trovano spazio quelli che hanno evidenziato i volumi più rilevan-ti di consumo, con particolare riguardo ai materiali d’importazione: sempre in ordine quantitativo, si tratta di Stati Uniti, Corea del Sud, Germania, Taiwan, Giappone, Ca-nada. Nell’ultimo, trovano spazio altri nove Paesi di notevole consistenza produttiva o distributiva: Australia, Belgio, Finlandia, Norvegia, Polonia, Russia, Singapore, Su-dafrica. Naturalmente, ciò non esclude che altri Paesi dei vari continenti abbiano una rilevanza settoriale degna di attenzione, sia in chiave attuale, sia dal punto di vista delle potenzialità di sviluppo.L’esame comparativo delle cifre dimostra che l’evoluzione congiunturale di medio e lungo termine è stata più favorevole nei Paesi extra-europei, con riguardo prioritario a quelli asiatici. Tuttavia, anche nelle realtà caratterizzate da ricorrenti fenomeni vischio-si, si è registrata una significativa propen-sione a fronteggiare le situazioni critiche, come è accaduto più intensamente nel 2009, con apprezzabile forza reattiva, superiore a
Schede dei maggiori Paesi lapidei
1994-2013

186 XXIV Rapporto Marmo e Pietre nel Mondo 2014
quella dei comparti contigui.Le produzioni di cava e di trasformazio-ne sono stimate in base ai criteri illustrati nell’Appendice critica, mentre i consuntivi dell’interscambio hanno carattere general-mente ufficiale, con gli adeguamenti in sede di input-output, di cui si è dato parimenti ragione. Il dato finale di ciascuna tavola, espresso sia in unità di peso che di super-ficie a spessore convenzionale, riguarda i consumi nazionali, con possibili minusva-lenze reali in qualche Paese dove l’impie-go nell’arte funeraria risulta superiore alla media, come accade nel Regno Unito, nella Mitteleuropa ed in Giappone.Del resto, la ripartizione di questi Paesi per macro-aggregati continentali continua a
proporre una prevalenza numerica di quelli europei, che sono pari a undici, seguiti da sette asiatici e tre americani, mentre gli ul-timi tre appartengono al resto del mondo. D’altro canto, in Asia si collocano le prime potenze settoriali, con vantaggio ormai ir-raggiungibile.Nei volumi del consumo non si è tenuto conto dei materiali correnti per uso strut-turale, che possono alimentare taluni flussi importanti, non solo nella produzione, dove hanno rilevanza piuttosto generalizzata, se non altro per l’esigenza di smaltire le secon-de scelte sui mercati domestici, ma anche nell’interscambio, i cui riferimenti sono ri-portati nel testo e nell’Appendice critica.
Files of the leading Countries
1994-2013
As what was proposed in the previous editions of the Report, in the tables that follow we highlight, in relation to their historical twenty trends, the essential parameters of production, consumption and international exchange, with reference to the 24 leader Countries in extraction, distribution and user field. We are talking about dossiers with an easy approach and consultation also in comparative perspective, and at the same time, allowing the extrapolation of reliable assessments about the development potentialities and opportunities in each country.The picture that emerges from this synthesis must be exhaustive, because referred to an aggregate of over four-fifths of the world stone production, while the volume of the corresponding exchange is even more significant.This range of countries can be divided into three equally important sub-groups. The first concerns the leading States in stone quarrying: in order, China, India, Turkey, Brazil, Italy, Spain, Portugal, and France.
The second are the countries with the most relevant volumes of consumption, with special reference to imported materials: always in the order of quantity, United States, South Korea, Germany, Taiwan, Japan and Canada. In the last one, there are nine other countries of considerable size of distribution or production: Australia, Belgium, Finland, Norway, Poland, Russia, Singapore and South Africa. Of course, this does not mean that other countries of various continents have a sector standard worthy of attention, both in a contemporary key, both in terms of development opportunity.A comparative examination of the figures shows that the economic development in the medium and long term was more favourable in extra-European countries, with priority to Asian. However, even in realities characterized by recurring viscous phenomena, there has been a significant propensity to deal with critical situations, as happened more intensively in 2009, with appreciable reactive force, higher than in contiguous sectors of building materials.

188 XXV Report World Marble and Stones 2014
Schede analitiche
Analytical files
Quarrying and processing productions are estimated on the basis of the criteria outlined in appendix, while the final balances of the interchange are generally official, with adjustments in the input-output, which we agree with. The final datum of each table, expressed either in units of weight or in conventional thickness surface (cm. 2) , concerns national whole consumption, with possible real losses in any country where the funerary art is superior than the average, as in the United Kingdom, in some Central European countries and in Japan.Moreover, the allocation of these countries for continental macro-aggregates continues to offer a numerical prevalence of European
ones, followed by seven Asian and three Americans, while the last three belong to the rest of the world. On the other hand, the first sector powers are now collocated in Asia, with an advantage which may be considered by now unattainable.In the volumes of consumption we did not consider the current materials for structural use, which can fuel some important flows, not only in manufacturing, where they have rather generalized significance, because of the need to dispose of the second choices on internal markets, but also in the international exchange, whose references are given, as usually, in the text and in the critical appendix.

190 XXV Rapporto Marmo e Pietre nel Mondo 2014 XXV World Marble and Stones Report 2014 191
115. AUSTRALIA (000 tons)PARAMETERS 1994 1995 2000 2009 2010 2011 2012 2013
Produzione di cavaQuarry production
125 125 200 300 325 350 350 350
Import grezzo Raw import
4 5 12 8 331 36 10 39
Disponibilità grezzoRaw availability
129 130 212 308 331 386 360 389
Export grezzo Raw export
14 17 56 34 48 50 40 55
Carico di lavoro Work load
115 113 156 274 283 336 320 334
Sfrido di lavoro Processing waste
47 46 64 112 116 138 131 136
Produzione manufatti Finished production
68 67 92 162 467 198 189 198
Import lavorati Finished import
41 40 49 166 204 260 245 265
Disponibilità finitiFinished availability
109 107 141 328 371 458 434 463
Export lavorati Finished export
5 5 7 3 4 5 5 3
Consumo interno Internal uses
104 102 134 325 367 453 429 460
Ragguaglio a 000 mq. Equiv. in 000 sq.mt.
1.920 1.890 2.480 6.010 6.790 8.380 7.940 8510
(Fonte: Elaborazione propria) (Source: own data processing)
116. AUSTRIA (000 tons)PARAMETERS 1994 1995 2000 2009 2010 2011 2012 2013
Produzione di cavaQuarry production 250 250 400 500 450 400 350 400
Import grezzo Raw import 87 86 34 54 39 39 47 18
Disponibilità grezzoRaw availability 337 336 434 554 489 439 397 418
Export grezzo Raw export 65 72 110 252 185 185 128 134
Carico di lavoro Work load 272 264 324 302 304 254 269 284
Sfrido di lavoro Processing waste 112 108 133 124 125 104 110 116
Produzione manufatti Finished production 160 156 191 178 179 150 159 168
Import lavorati Finished import 146 141 196 325 288 288 249 269
Disponibilità finitiFinished availability 306 297 387 503 467 438 408 437
Export lavorati Finished export 10 14 29 62 39 39 20 28
Consumo interno Internal uses 296 283 358 441 428 399 388 409
Ragguaglio a 000 mq. Equiv. in 000 sq.mt. 5.470 5.240 6.620 8.160 7.920 7.380 7.180 7.560
(Fonte: Elaborazione propria) (Source: own data processing)

192 XXV Rapporto Marmo e Pietre nel Mondo 2014 XXV World Marble and Stones Report 2014 193
117. BELGIUM (000 tons)PARAMETERS 1994 1995 2000 2009 2010 2011 2012 2013
Produzione di cava Quarry production 650 700 850 750 800 850 800 800
Import grezzo Raw import 180 190 227 203 202 286 279 248
Disponibilità grezzo Raw availability 830 890 1.077 953 1002 1.136 1.079 1048
Export grezzo Raw export 157 162 237 311 176 161 147 136
Carico di lavoro Work load 673 728 840 642 826 975 932 912
Sfrido di lavoro Processing waste 276 298 344 263 338 400 382 374
Produzione manufatti Finished production 397 430 496 379 488 575 550 538
Import lavorati Finished import 177 252 386 888 1.016 1.039 917 759
Disponibilità finiti Finished availability 574 682 882 1.267 1.504 1.614 1.467 1297
Export lavorati Finished export 163 186 285 396 414 430 419 299
Consumo interno Internal uses 411 496 597 871 1.090 1.184 1.048 998
Ragguaglio a 000 mq. Equiv. in 000 sq.mt. 7.600 9.180 11.040 16.110 20.160 21.900 19.390 18.470
(Fonte: Elaborazione propria) (Source: own data processing)
118. BRAZIL (000 tons)PARAMETERS 1994 1995 2000 2009 2010 2011 2012 2013
Produzione di cava Quarry production
1.980 1.950 2.250 6.000 6.750 7.250 7.500 9.000
Import grezzo Raw import
2 2 4 16 3 24 26 27
Disponibilità grezzo Raw availability
1.982 1.952 2.254 6.016 6.753 7.274 7.526 9.027
Export grezzo Raw export
584 620 807 792 1.187 1.187 1.155 1.423
Carico di lavoro Work load
1.398 1.332 1.447 5.224 5.566 6.087 6.371 7.604
Sfrido di lavoro Processing waste
573 546 593 2.142 2.282 2.496 2.612 3.118
Produzione manufatti Finished production
825 786 854 3.082 3.284 3.591 3.759 4.486
Import lavorati Finished import
7 9 47 51 68 80 72 81
Disponibilità finiti Finished availability
832 795 901 3.133 3.352 3.671 3.831 4.567
Export lavorati Finished export
53 62 277 859 1.039 983 1.066 1.275
Consumo interno Internal uses
779 733 624 2.274 2.313 2.688 2.765 3.292
Ragguaglio a 000 mq. Equiv. in 000 sq.mt.
14.410 13.560 11.540 42.070 42.800 49.730 51.200 60.940
(Fonte: Elaborazione propria) (Source: own data processing)
N.B. Nella produzione non sono compresi materiali correnti per uso strutturale (1,5 mill. tons nel consuntivo 2013, cui corrispondono 18 mill. sq. mt. nel ragguaglio a prodotto finito).
Production data do not include current materials for structure use (1,5 mill. tons in 2013, which mean about 18 mill. in equivalent sq. mt.)

194 XXV Rapporto Marmo e Pietre nel Mondo 2014 XXV World Marble and Stones Report 2014 195
119. CANADA (000 tons)PARAMETERS 1994 1995 2000 2009 2010 2011 2012 2013
Produzione di cava Quarry production
250 250 550 500 550 400 350 400
Import grezzo Raw import
66 61 97 99 125 150 224 167
Disponibilità grezzo Raw availability
316 311 647 599 675 550 574 567
Export grezzo Raw export
98 65 246 69 78 60 74 62
Carico di lavoro Work load
218 246 401 530 597 610 500 505
Sfrido di lavoro Processing waste
89 101 163 218 245 246 205 207
Produzione manufatti Finished production
129 145 238 312 352 364 295 298
Import lavorati Finished import
74 44 93 443 422 782 857 817
Disponibilità finiti Finished availability
203 189 331 755 774 1.046 1.152 1.115
Export lavorati Finished export
32 56 209 160 156 179 189 190
Consumo interno Internal uses
171 133 122 595 618 867 963 925
Ragguaglio a 000 mq. Equiv. in 000 sq.mt.
3.160 2.460 2.260 11.000 11.430 16.040 17.800 17.120
(Fonte: Elaborazione propria) (Source: own data processing)
120. CHINA (000 tons)PARAMETERS 1994 1995 2000 2009 2010 2011 2012 2013
Produzione di cava Quarry production
6.500 7.250 10.250 31.000 33.000 36.000 38.000 39.500
Import grezzo Raw import
40 118 1.580 8.062 12.260 13.079 15.853 17.522
Disponibilità grezzo Raw availability
6.540 7.368 11.830 39.062 45.260 49.079 53.853 57.022
Export grezzo Raw export
938 737 958 447 668 1.425 1.531 966
Carico di lavoro Work load
5.602 6.631 10.872 38.615 44.592 47.654 52.322 56.056
Sfrido di lavoro Processing waste
2.297 2.719 4.458 15.832 18.283 19.538 21.452 22.982
Produzione manufatti Finished production
3.350 3.912 6.414 22.783 26.309 28.116 30.870 33.074
Import lavorati Finished import
78 164 161 104 52 503 450 222
Disponibilità finiti Finished availability
3.383 4.076 6.575 22.887 26.361 28.619 30.420 33.296
Export lavorati Finished export
1.045 1.656 3.137 11.286 11.828 12.082 11.066 11.116
Consumo interno Internal uses
2.238 2.420 3.438 11.601 14.533 16.537 19.354 22.180
Ragguaglio a 000 mq. Equiv. in 000 sq.mt.
43.250 44.770 63.600 214.620 268.860 305.930 358.000 410.300
(Fonte: Elaborazione propria (Source: own data processing)

196 XXV Rapporto Marmo e Pietre nel Mondo 2014 XXV World Marble and Stones Report 2014 197
121. FINLAND (000 tons)PARAMETERS 1994 1995 2000 2009 2010 2011 2012 2013
Produzione di cava Quarry production
500 550 600 500 600 650 600 600
Import grezzo Raw import
3 2 12 2 7 5 18 12
Disponibilità grezzo Raw availability
503 552 612 502 607 655 618 612
Export grezzo Raw export
285 265 314 207 308 413 399 379
Carico di lavoro Work load
218 287 298 295 299 242 219 233
Sfrido di lavoro Processing waste
89 118 123 120 122 100 90 95
Produzione manufatti Finished production
129 169 175 175 177 142 129 138
Import lavorati Finished import
5 5 18 67 35 17 39 39
Disponibilità finiti Finished availability
134 174 193 242 212 159 168 177
Export lavorati Finished export
21 22 26 34 23 18 17 14
Consumo interno Internal uses
113 152 167 208 189 141 151 163
Ragguaglio a 000 mq. Equiv. in 000 sq.mt.
2.090 2.810 3.090 3.850 3.500 2.610 2.790 3.020
(Fonte: Elaborazione propria (Source: own data processing)
122. FRANCE (000 tons)PARAMETERS 1994 1995 2000 2009 2010 2011 2012 2013
Produzione di cava Quarry production
1.050 1.100 1.200 1.100 1.150 1.250 1.100 1.050
Import grezzo Raw import
369 276 405 319 317 354 485 443
Disponibilità grezzo Raw availability
1.419 1.376 1.605 1.419 1.467 1.604 1.585 1.493
Export grezzo Raw export
78 80 103 103 93 207 78 77
Carico di lavoro Work load
1.341 1.296 1.502 1.316 1.374 1.393 1.507 1.416
Sfrido di lavoro Processing waste
550 531 616 589 563 571 618 580
Produzione manufatti Finished production
791 765 886 777 811 822 889 836
Import lavorati Finished import
413 468 677 776 939 926 971 1.084
Disponibilità finiti Finished availability
1.024 1.233 1.563 1.553 1.750 1.748 1.860 1.920
Export lavorati Finished export
101 106 138 143 164 147 132 132
Consumo interno Internal uses
1.103 1.127 1.425 1.410 1.586 1.601 1.728 1.788
Ragguaglio a 000 mq. Equiv. in 000 sq.mt.
20.400 20.850 26.360 26.080 29.340 29.620 31.970 33.080
(Fonte: Elaborazione propria) (Source: own data processing)

198 XXV Rapporto Marmo e Pietre nel Mondo 2014 XXV World Marble and Stones Report 2014 199
123. GERMANY (000 tons)PARAMETERS 1994 1995 2000 2009 2010 2011 2012 2013
Produzione di cava Quarry production
650 700 750 600 650 750 650 700
Import grezzo Raw import
514 452 411 242 246 381 225 259
Disponibilità grezzo Raw availability
1.164 1.152 1.161 842 896 1.131 875 959
Export grezzo Raw export
207 240 196 452 463 481 385 380
Carico di lavoro Work load
957 912 965 390 433 650 490 579
Sfrido di lavoro Processing waste
392 374 395 160 178 267 200 237
Produzione manufatti Finished production
565 538 570 230 255 383 290 342
Import lavorati Finished import
1.350 1.774 1.822 1.725 1.516 1.958 1.689 1.666
Disponibilità finiti Finished availability
1.915 2.312 2.392 1.955 1.771 2.341 1.979 2.008
Export lavorati Finished export
78 92 215 285 268 333 279 258
Consumo interno Internal uses
1.837 2.220 2.177 1.670 1.503 2.008 1.700 1.750
Ragguaglio a 000 mq. Equiv. in 000 sq.mt.
33.980 41.070 40.270 30.900 27.810 37.150 31.450 32.380
(Fonte: Elaborazione propria) (Source: own data processing)
124. GREECE (000 tons)PARAMETERS 1994 1995 2000 2009 2010 2011 2012 2013
Produzione di cava Quarry production
1.700 1.750 1.700 1.250 1.650 1.500 1.400 1.250
Import grezzo Raw import
7 6 82 284 209 161 91 129
Disponibilità grezzo Raw availability
1.707 1.756 1.782 1.534 1.859 1.661 1.491 1.379
Export grezzo Raw export
51 34 175 245 424 483 535 654
Carico di lavoro Work load
1.656 1.722 1.607 1.289 1.435 1.178 956 725
Sfrido di lavoro Processing waste
679 706 659 528 588 483 392 298
Produzione manufatti Finished production
977 1.016 948 761 847 695 564 427
751Import lavorati Finished import
1 2 59 114 119 56 48 42
Disponibilità finiti Finished availability
978 1.018 1.007 875 966 751 612 469
Export lavorati Finished export
145 155 156 131 324 329 344 196
Consumo interno Internal uses
833 863 851 744 642 422 268 273
Ragguaglio a 000 mq. Equiv. in 000 sq.mt.
15.410 15.960 15.750 13.760 11.880 7.810 4.960 5.050
(Fonte: Elaborazione propria) (Source: own data processing)

200 XXV Rapporto Marmo e Pietre nel Mondo 2014 XXV World Marble and Stones Report 2014 201
125. INDIA (000 tons)PARAMETERS 1994 1995 2000 2009 2010 2011 2012 2013
Produzione di cava Quarry production
3.000 3.250 5.200 13.200 13.250 14.000 17.500 19.500
Import grezzo Raw import
11 19 18 286 374 474 622 657
Disponibilità grezzo Raw availability
3.011 3.269 5.218 13.486 13.624 14.474 18.122 20.157
Export grezzo Raw export
985 1.131 1.842 4.163 3.886 4.035 5.766 6.894
Carico di lavoro Work load
2.026 2.138 3.376 9.323 9.738 10.439 12.356 13.263
Sfrido di lavoro Processing waste
831 877 1.384 3.822 3.993 4.280 5.066 5.438
Produzione manufatti Finished production
1.195 1.261 1.992 5.501 5.745 6.159 7.290 7.825
Import lavorati Finished import
– 1 1 106 86 112 180 175
Disponibilità finiti Finished availability
1.195 1.262 1.993 5.607 5.831 6.271 7.470 8.000
Export lavorati Finished export
212 199 465 1.148 1.119 1.165 1.814 2.292
Consumo interno Internal uses
983 1.063 1.528 4.459 4.712 5.106 5.656 5.708
Ragguaglio a 000 mq. Equiv. in 000 sq.mt.
18.190 19.670 28.270 82.500 87.170 94.460 104.600 105.600
(Fonte: Elaborazione propria) (Source: own data processing)
126. ITALY (000 tons)PARAMETERS 1994 1995 2000 2009 2010 2011 2012 2013
Produzione di cava Quarry production
7.650 8.000 8.500 7.500 7.800 7.500 7.250 7.000
Import grezzo Raw import
1.624 1.959 2.198 1.186 1.310 1.219 1.043 986
Disponibilità grezzo Raw availability
9.274 9.959 10.698 8.686 9.110 8.719 8.293 7.986
Export grezzo Raw export
659 766 900 1.237 1.496 1.449 1.537 1.568
Carico di lavoro Work load
8.615 9.193 9.798 7.449 7.614 7.270 6.756 6.418
Sfrido di lavoro Processing waste
3.532 3.769 4.018 3.054 3.122 2.980 2.769 2.630
Produzione manufatti Finished production
5.083 5.424 5.780 4.395 4.492 4.290 3.987 3.788
Import lavorati Finished import
59 85 161 408 388 410 332 292
Disponibilità finiti Finished availability
5.142 5.509 5.941 4.803 4.880 4.700 4.319 4.080
Export lavorati Finished export
2.442 2.625 2.735 1.598 1.648 1.613 1.643 1.655
Consumo interno Internal uses
2.700 2.884 3.206 3.205 3.232 3.084 2.676 2.425
Ragguaglio a 000 mq. Equiv. in 000 sq.mt.
49.950 53.350 59.310 59.300 59.800 57.150 49.500 44.870
(Fonte: Elaborazione propria) (Source: own data processing)

202 XXV Rapporto Marmo e Pietre nel Mondo 2014 XXV World Marble and Stones Report 2014 203
127. JAPAN (000 tons)PARAMETERS 1994 1995 2000 2009 2010 2011 2012 2013
Produzione di cava Quarry production
500 550 350 300 250 200 250 250
Import grezzo Raw import
1.171 875 300 40 25 23 45 48
Disponibilità grezzo Raw availability
1.671 1.425 650 340 275 223 295 298
Export grezzo Raw export
- 2 11 43 47 47 21 29
Carico di lavoro Work load
1.671 1.423 639 297 228 176 274 269
Sfrido di lavoro Processing waste
685 583 262 122 93 72 113 110
Produzione manufatti Finished production
986 840 377 175 135 104 161 159
Import lavorati Finished import
1.070 1.298 1.438 1.183 1.012 992 988 963
Disponibilità finiti Finished availability
2.056 2.138 1.815 1.358 1.147 1.096 1.149 1.122
Export lavorati Finished export
2 1 5 6 2 1 1 2
Consumo interno Internal uses
2.054 2.137 1.810 1.352 1.149 1.095 1.148 1.120
Ragguaglio a 000 mq. Equiv. in 000 sq.mt.
38.000 39.530 33.480 25.010 21.250 20.260 21.240 20.720
(Fonte: Elaborazione propria) (Source: own data processing)
128. NORWAY (000 tons)PARAMETERS 1994 1995 2000 2009 2010 2011 2012 2013
Produzione di cava Quarry production
350 350 450 500 550 600 650 600
Import grezzo Raw import
7 10 16 40 29 29 25 21
Disponibilità grezzo Raw availability
357 360 466 540 579 629 675 621
Export grezzo Raw export
247 186 270 337 397 346 320 278
Carico di lavoro Work load
110 174 196 203 182 283 355 343
Sfrido di lavoro Processing waste
45 72 80 83 75 116 145 140
Produzione manufatti Finished production
65 102 116 120 107 167 210 203
Import lavorati Finished import
33 46 61 127 152 156 57 56
Disponibilità finiti Finished availability
98 148 177 247 259 323 267 259
Export lavorati Finished export
8 22 27 13 15 23 15 13
Consumo interno Internal uses
90 126 150 234 244 300 252 246
Ragguaglio a 000 mq. Equiv. in 000 sq.mt.
1.670 2.330 2.780 4.320 4.510 5550 4.670 4.550
(Fonte: Elaborazione propria)
N. B. Nella produzione e nell’interscambio non sono compresi materiali per uso strutturale
(Source: own data processing)
Production and international exchange do not include material for structural use

204 XXV Rapporto Marmo e Pietre nel Mondo 2014 XXV World Marble and Stones Report 2014 205
129. POLAND (000 tons)PARAMETERS 1994 1995 2000 2009 2010 2011 2012 2013
Produzione di cava Quarry production
400 450 550 550 650 600 550 550
Import grezzo Raw import
100 113 237 240 218 381 433 207
Disponibilità grezzo Raw availability
500 563 787 790 868 981 983 757
Export grezzo Raw export
45 49 57 76 80 108 115 151
Carico di lavoro Work load
455 514 730 714 788 873 868 606
Sfrido di lavoro Processing waste
185 210 300 293 323 358 356 248
Produzione manufatti Finished production
270 304 430 421 465 515 512 378
Import lavorati Finished import
12 15 45 253 302 398 300 265
Disponibilità finiti Finished availability
292 319 475 674 767 913 812 643
Export lavorati Finished export
220 241 270 90 84 92 83 80
Consumo interno Internal uses
72 78 205 584 683 821 729 563
Ragguaglio a 000 mq. Equiv. in 000 sq.mt.
1330 1450 3790 10800 12640 15190 13.500 10.420
(Fonte: Elaborazione propria) (Source: own data processing)
130. PORTUGAL (000 tons)PARAMETERS 1994 1995 2000 2009 2010 2011 2012 2013
Produzione di cava Quarry production
2.000 1.950 2.500 2.450 2.750 2.650 2.750 2.650
Import grezzo Raw import
34 49 82 92 79 81 143 161
Disponibilità grezzo Raw availability
2.034 1.999 2.582 2.542 2.829 2.731 2.890 2.811
Export grezzo Raw export
259 247 286 451 690 729 896 890
Carico di lavoro Work load
1.775 1.752 2.296 2.091 2.139 2.002 1.994 1.921
Sfrido di lavoro Processing waste
728 718 942 857 877 820 818 788
Produzione manufatti Finished production
1.047 1.034 1.354 1234 1.262 1.182 1.176 1.133
Import lavorati Finished import
10 19 71 36 30 32 35 28
Disponibilità finiti Finished availability
1.057 1.053 1.425 1.270 1.292 1.214 1.211 1.161
Export lavorati Finished export
743 707 931 638 691 682 777 795
Consumo interno Internal uses
314 346 494 632 601 532 434 366
Ragguaglio a 000 mq. Equiv. in 000 sq.mt.
5.810 6.400 9.140 11.690 11.120 9.850 8.030 6.780
(Fonte: Elaborazione propria) (Source: own data processing)

206 XXV Rapporto Marmo e Pietre nel Mondo 2014 XXV World Marble and Stones Report 2014 207
131. RUSSIA (000 tons)PARAMETERS 1994 1995 2000 2009 2010 2011 2012 2013
Produzione di cava Quarry production
650 650 500 500 500 450 500 600
Import grezzo Raw import
15 50 55 15 89 98 129 133
Disponibilità grezzo Raw availability
665 700 555 515 589 548 629 733
Export grezzo Raw export
22 16 8 8 9 9 15 6
Carico di lavoro Work load
643 684 547 507 580 539 614 727
Sfrido di lavoro Processing waste
264 280 224 207 238 220 251 298
Produzione manufatti Finished production
379 404 323 300 342 319 363 429
Import lavorati Finished import
31 45 54 154 375 395 515 463
Disponibilità finiti Finished availability
348 449 377 454 717 714 878 892
Export lavorati Finished export
10 8 8 7 16 18 20 13
Consumo interno Internal uses
338 441 369 447 701 696 858 879
Ragguaglio a 000 mq. Equiv. in 000 sq.mt.
6.250 8.160 6.830 8.270 12.970 12.870 15.870 16.260
(Fonte: Elaborazione propria)
N.B. I dati dell’interscambio 2013 rivengono dai movimenti coi maggiori partner (UE, CSI, Cina, India, Turchia)
(Source: own data processing)
Exchange data for 2013 draw from the leading partner correspondance (EU, ISC, China, India, Turkey)
132. SINGAPORE (000 tons)PARAMETERS 1994 1995 2000 2009 2010 2011 2012 2013
Produzione di cava Quarry production
- - - - - - - -
Import grezzo Raw import
56 31 37 317 240 243 167 294
Disponibilità grezzo Raw availability
56 31 37 317 240 243 167 294
Export grezzo Raw export
4 8 3 5 3 4 3 3
Carico di lavoro Work load
52 23 34 312 237 239 164 291
Sfrido di lavoro Processing waste
21 9 14 128 97 98 67 119
Produzione manufatti Finished production
31 14 20 184 140 141 97 172
Import lavorati Finished import
128 146 127 143 156 153 141 182
Disponibilità finiti Finished availability
159 160 147 327 296 294 238 354
Export lavorati Finished export
27 30 7 12 10 14 17 20
Consumo interno Internal uses
132 130 140 315 286 280 221 334
Ragguaglio a 000 mq. Equiv. in 000 sq.mt.
2.440 2.410 2.590 5.830 5.290 5.180 4.090 6.180
(Fonte: Elaborazione propria)
Non sono compresi materiali per uso strutturale
(Source: own data processing)
Material for structural uses is not included

208 XXV Rapporto Marmo e Pietre nel Mondo 2014 XXV World Marble and Stones Report 2014 209
133. SOUTH AFRICA (000 tons)PARAMETERS 1994 1995 2000 2009 2010 2011 2012 2013
Produzione di cava Quarry production
650 850 1.350 800 850 800 750 700
Import grezzo Raw import
2 2 – 9 9 5 6 43
Disponibilità grezzo Raw availability
652 852 1.350 809 859 805 756 743
Export grezzo Raw export
518 678 937 339 363 353 355 252
Carico di lavoro Work load
134 174 413 470 496 452 401 491
Sfrido di lavoro Processing waste
54 71 170 192 203 185 164 201
Produzione manufatti Finished production
80 103 243 278 293 267 237 290
Import lavorati Finished import
2 5 23 41 69 62 65 61
Disponibilità finiti Finished availability
82 108 266 319 362 329 302 351
Export lavorati Finished export
20 30 23 64 40 53 36 49
Consumo interno Internal uses
62 78 243 275 322 276 266 302
Ragguaglio a 000 mq. Equiv. in 000 sq.mt.
1.150 1.450 4.490 5.090 5.950 5.100 4.930 5.590
(Fonte: Elaborazione propria) (Source: own data processing)
134. SOUTH kOREA (000 tons)PARAMETERS 1994 1995 2000 2009 2010 2001 2012 2013
Produzione di cava Quarry production
1.450 1.400 1.400 300 350 350 300 250
Import grezzo Raw import
164 204 82 125 90 41 81 36
Disponibilità grezzo Raw availability
1.614 1.604 1.482 425 440 391 381 286
Export grezzo Raw export
179 122 25 12 10 5 6 1
Carico di lavoro Work load
1.435 1.482 1.457 413 430 386 375 285
Sfrido di lavoro Processing waste
588 608 597 169 176 158 154 118
Produzione manufatti Finished production
847 874 860 244 254 228 221 167
Import lavorati Finished import
41 73 362 2.345 2.428 2.612 2.182 2.458
Disponibilità finiti Finished availability
888 947 1.222 2.589 2.682 2.840 2.403 2.625
Export lavorati Finished export
121 94 27 4 3 2 2 4
Consumo interno Internal uses
767 853 1.195 2.585 2.679 2.838 2.401 2.621
Ragguaglio a 000 mq. Equiv. in 000 sq.mt.
14.190 15.780 22.100 47.820 49.620 52.500 44.420 48.490
(Fonte: Elaborazione propria) (Source: own data processing)

210 XXV Rapporto Marmo e Pietre nel Mondo 2014 XXV World Marble and Stones Report 2014 211
135. SPAIN (000 tons)PARAMETERS 1994 1995 2000 2009 2010 2011 2012 2013
Produzione di cava Quarry production
4.050 4.200 5.850 5.200 5.750 5.500 5.250 5.000
Import grezzo Raw import
321 368 680 518 539 394 331 365
Disponibilità grezzo Raw availability
4.371 4.568 6.530 5.718 6.289 5.894 5.581 5.365
Export grezzo Raw export
616 668 829 952 1.414 1.611 1.614 1.600
Carico di lavoro Work load
3.755 3.900 5.701 4.766 4.875 4.283 3.967 3.765
Sfrido di lavoro Processing waste
1.540 1.600 2.337 1.955 1.998 1.756 1.627 1.544
Produzione manufatti Finished production
2.215 2.300 3.364 2.811 2.877 2.527 2.340 2.221
Import lavorati Finished import
57 114 163 340 290 323 127 125
Disponibilità finiti Finished availability
2.272 2.414 3.527 3.151 3.167 2.850 2.467 2.346
Export lavorati Finished export
793 846 1.199 1.016 1.054 1.086 1.119 1.148
Consumo interno Internal uses
1.479 1.568 2.328 2.135 2.113 1.764 1.348 1.198
Ragguaglio a 000 mq. Equiv. in 000 sq.mt.
27.360 29.000 43.070 39.500 39.100 32.630 24.940 22.160
(Fonte: Elaborazione propria) (Source: own data processing)
136. TAIWAN (000 tons)PARAMETERS 1994 1995 2000 2009 2010 2011 2012 2013
Produzione di cava Quarry production
300 300 300 300 350 300 300 350
Import grezzo Raw import
778 867 1.275 961 1.251 1.850 1.996 1.354
Disponibilità grezzo Raw availability
1.078 1.167 1.575 1.261 1.601 2.150 2.296 1704
Export grezzo Raw export
2 17 48 5 7 9 7 8
Carico di lavoro Work load
1.076 1.150 1.527 1.256 1.608 2.141 2.289 1.696
Sfrido di lavoro Processing waste
441 470 626 515 660 878 938 695
Produzione manufatti Finished production
635 680 901 741 948 1.263 1.351 1.001
Import lavorati Finished import
59 88 196 351 346 319 267 320
Disponibilità finiti Finished availability
694 768 1.097 1.092 1.294 1.582 1.648 1.321
Export lavorati Finished export
38 42 79 57 52 87 60 37
Consumo interno Internal uses
656 726 1.018 1.035 1.242 1.495 1.588 1.284
Ragguaglio a 000 mq. Equiv. in 000 sq.mt.
12.140 13.430 18.840 19.150 22.980 27.650 29.380 23.750
(Fonte: Elaborazione propria) (Source: own data processing)
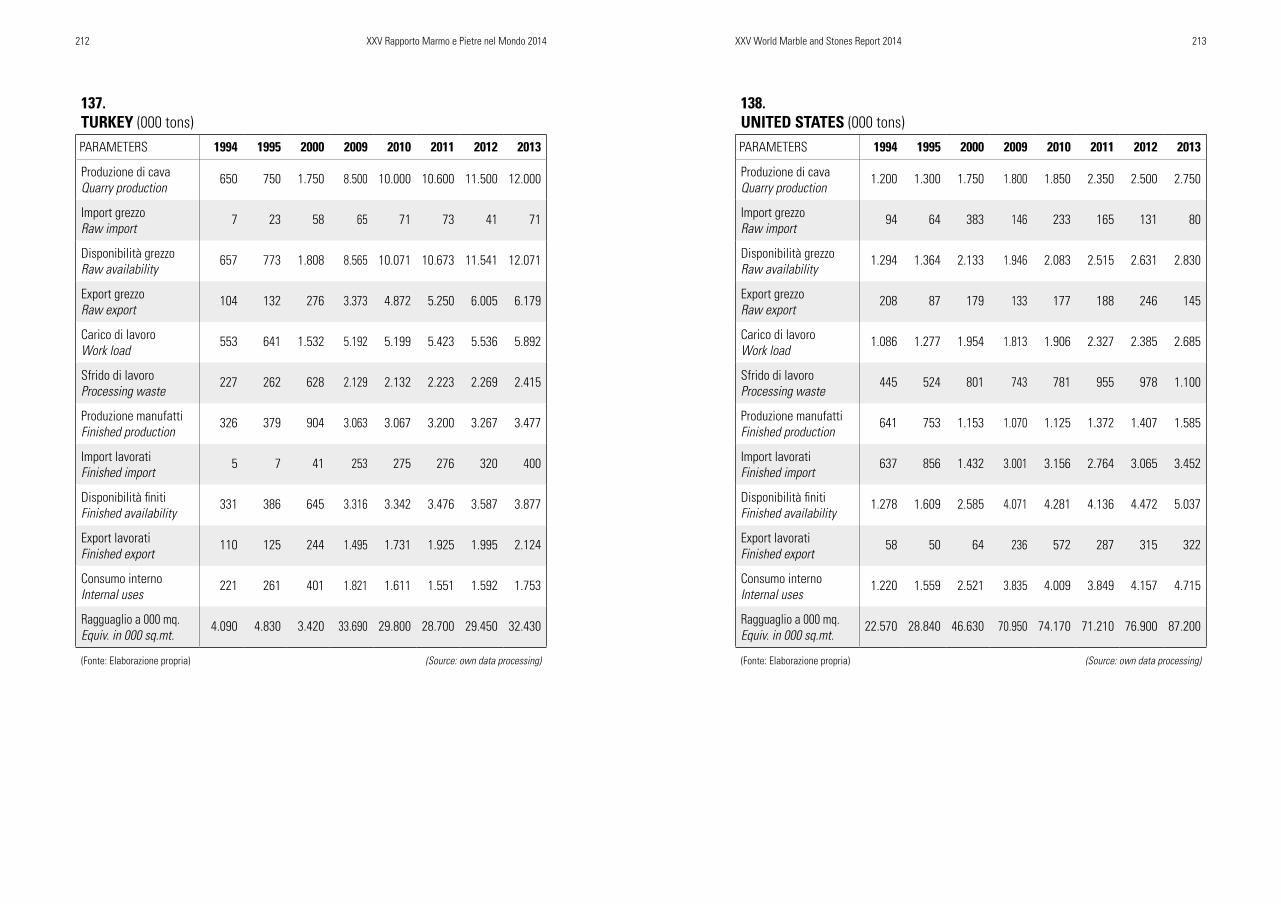
212 XXV Rapporto Marmo e Pietre nel Mondo 2014 XXV World Marble and Stones Report 2014 213
137. TURkEY (000 tons)PARAMETERS 1994 1995 2000 2009 2010 2011 2012 2013
Produzione di cava Quarry production
650 750 1.750 8.500 10.000 10.600 11.500 12.000
Import grezzo Raw import
7 23 58 65 71 73 41 71
Disponibilità grezzo Raw availability
657 773 1.808 8.565 10.071 10.673 11.541 12.071
Export grezzo Raw export
104 132 276 3.373 4.872 5.250 6.005 6.179
Carico di lavoro Work load
553 641 1.532 5.192 5.199 5.423 5.536 5.892
Sfrido di lavoro Processing waste
227 262 628 2.129 2.132 2.223 2.269 2.415
Produzione manufatti Finished production
326 379 904 3.063 3.067 3.200 3.267 3.477
Import lavorati Finished import
5 7 41 253 275 276 320 400
Disponibilità finiti Finished availability
331 386 645 3.316 3.342 3.476 3.587 3.877
Export lavorati Finished export
110 125 244 1.495 1.731 1.925 1.995 2.124
Consumo interno Internal uses
221 261 401 1.821 1.611 1.551 1.592 1.753
Ragguaglio a 000 mq. Equiv. in 000 sq.mt.
4.090 4.830 3.420 33.690 29.800 28.700 29.450 32.430
(Fonte: Elaborazione propria) (Source: own data processing)
138. UNITED STATES (000 tons)PARAMETERS 1994 1995 2000 2009 2010 2011 2012 2013
Produzione di cava Quarry production
1.200 1.300 1.750 1.800 1.850 2.350 2.500 2.750
Import grezzo Raw import
94 64 383 146 233 165 131 80
Disponibilità grezzo Raw availability
1.294 1.364 2.133 1.946 2.083 2.515 2.631 2.830
Export grezzo Raw export
208 87 179 133 177 188 246 145
Carico di lavoro Work load
1.086 1.277 1.954 1.813 1.906 2.327 2.385 2.685
Sfrido di lavoro Processing waste
445 524 801 743 781 955 978 1.100
Produzione manufatti Finished production
641 753 1.153 1.070 1.125 1.372 1.407 1.585
Import lavorati Finished import
637 856 1.432 3.001 3.156 2.764 3.065 3.452
Disponibilità finiti Finished availability
1.278 1.609 2.585 4.071 4.281 4.136 4.472 5.037
Export lavorati Finished export
58 50 64 236 572 287 315 322
Consumo interno Internal uses
1.220 1.559 2.521 3.835 4.009 3.849 4.157 4.715
Ragguaglio a 000 mq. Equiv. in 000 sq.mt.
22.570 28.840 46.630 70.950 74.170 71.210 76.900 87.200
(Fonte: Elaborazione propria) (Source: own data processing)

Ringraziamenti
L’Editore sente il dovere di ringraziare tutti i Soggetti che hanno contribuito alla rea-lizzazione di questo XXV Rapporto, sia in campo scientifico che promozionale. Ciò, con particolare riguardo alle Istituzioni da cui proviene la massima parte delle in-formazioni statistiche di base: da un lato, l’Unione Europea, tramite i propri servizi di Eurostat, e dall’altro, l’Organizzazione delle Nazioni Unite, attraverso Comtrade. In tal senso, un ringraziamento specifico compete anche ad Abirochas, l’Associa-zione brasiliana del comparto lapideo, per la fornitura dei dati ufficiali concernenti la produzione estrattiva di competenza, utiliz-zati nell’annesso dossier.A livello integrativo, utili informazioni sono state mutuate dal Fondo Monetario Internazionale, per quanto concerne i dati macro-economici, da Confindustria Marmo Macchine e dalla stampa specializzata di categoria.Un ringraziamento speciale deve essere riservato all’Ente Fiere di Verona ed alla
manifestazione settoriale specializzata Marmomacc, leader nel mondo, per la sua fondamentale partnership e per il forte sup-porto allo sviluppo ed alla promozione del Rapporto.Accanto a quelli riservati al momento pub-blico ed alle Istituzioni, ringraziamenti non meno importanti debbono essere espressi al contesto privato, ed in particolare, alle Aziende che riservano al Rapporto signifi-cative attenzioni di sponsorizzazione, atte-stando la congruità scientifica e funzionale della ricerca e curando la sua diffusione si-stematica nel mondo dei rispettivi clienti e fornitori. Si tratta di un supporto altrettanto decisivo ai fini della continuità editoriale di un’iniziativa che si colloca nell’ottica pruio-ritaria di servizio.Infine, un ringraziamento non formale si deve all’Autore, che da 25 anni mette a di-sposizione del mondo lapideo una compe-tenza straordinaria, felicemente coniugata con un lungo apprezzamento per i valori umani e civili, tipici della pietra.

The Publisher feels a duty to thank all those who have contributed to this XXV Report, either in science or a promotional field. This, in particular with regard to the institutions from which most of the basic statistical information was obtained: on the one hand, the European Union, through its services of Eurostat, and on the other hand, the United Nations, through Comtrade. In this respect, particular thanks also competes with Abirochas, Brazilian Association of the stone sector, for provision of official data concerning the production of mining used in the dossier.At an integrative level, useful information was borrowed from the International Monetary Fund, with regard to the macro-economic data, by Confindustria Marmo Macchine, and by specialized printing of category.A very special thank must be reserved to Ente Fiere Verona and to its leading specialized
stone and equipment trade fair Marmomacc, for the fundamental partnership, and for an yearly strong support in the exhaustive development and promotion of this Report. Next to those reserved to the public moment and official institutions, no less important thanks must be expressed in the private context, and in particular, to companies that have significant attention to the relationship of sponsorship, witnessing the scientific appropriateness and functional research and caring for his systematic dissemination throughout the world with their customers and suppliers. This is the decisive support for the purposes of editorial continuity of an initiative which is, first of all, in terms of service.Finally, non-formal thanks are due to the Author of the Report, since 25 years, for a long-term special competence in stone marketing, and for a long appreciation in human and civil values, typical of the stone.
Acknowledgements

Sintesi del Rapporto
Nel settore lapideo, la congiuntura innesca-ta nel 2009 dalla crisi della grande finanza e dal regresso industriale, dopo lo straor-dinario superamento che aveva dato luogo ad ulteriori massimi produttivi, ha trovato un ulteriore sbocco positivo nel 2013, nono-stante le sacche di ristagno che permango-no in alcuni Paesi. Infatti, sia in estrazione e trasformazione, sia nell’interscambio e nei consumi, sono stati conseguiti ulteriori progressi mondiali, consentendo di porre le basi per ulteriori sviluppi conformi ad un trend di crescita ultra-ventennale.Marmi e pietre, in effetti, si erano già di-stinti per un’espansione notevolmente su-periore a quella dell’economia mondiale, ed avevano sofferto la tendenza al rista-gno in misura meno ampia della media. Lo confermano i consuntivi di lungo periodo: nell’ultimo decennio, la produzione netta è aumentata di circa sette punti in ragione annua e l’interscambio globale è cresciuto mediamente di oltre il dieci per cento.Nel 2013 il volume estratto e quello trasfor-
mato sono aumentati di circa cinque punti rispetto all’esercizio precedente, mentre l’esportazione e l’importazione in volume si sono incrementate del 2,8 per cento nei confronti del 2012, evidenziando una mag-giore espansione proporzionale dei mercati domestici.Si deve aggiungere che nel 2013 export ed import hanno bilanciato in oltre 53 milioni di tonnellate: anche alla luce di queste ci-fre, e della loro evoluzione storica, il con-suntivo del lapideo risulta competitivo nei confronti degli altri settori ad esso conti-gui. Nondimeno, va detto che l’aggregato mondiale ha potuto ascrivere un nuovo risultato di segno positivo grazie ai Paesi asiatici, cui compete oltre il 60 per cento della produzione.In assoluto, la produzione del 2013 è stata pari a 265 milioni di tonnellate al lordo del-le perdite di cava e dei cascami di trasfor-mazione ed ha indotto un consumo pari a 1,420 miliardi di metri quadrati equivalenti, riferiti allo spessore convenzionale di cm.

220 XXIV Rapporto Marmo e Pietre nel Mondo 2014 Carlo Montani 221
2. L’impiego pro-capite, dal canto suo, è salito a 226 metri quadrati per mille unità, a fronte dei 215 dell’anno precedente e dei 135 del 2003.Il ruolo più importante nel quadro della mondializzazione è stato svolto ancora una volta dall’interscambio: tenuto conto degli apporti di grezzo e lavorato, a detta cifra corrispondono oltre 770 milioni di metri quadrati equivalenti. Giova precisare che la quota del grezzo è ulteriormente cresciuta, con il 52,7 per cento del totale, ed eviden-ziando la continuità di una modificazione strategica che non privilegia il prodotto finito. Dalle cifre indicate emerge un’altra realtà significativa del lapideo: la mag-gioranza assoluta dei consumi mondiali si riferisce a materiali estratti e spesso tra-sformati in Paesi diversi da quello di posa in opera.I primi cinque produttori (nell’ordine: Cina, India, Turchia, Brasile, Italia) hanno espres-so oltre due terzi dell’estrazione mondiale, superando di oltre un punto la corrispon-dente quota complessiva del 2012 e di oltre venti quella del 1996. Ciò conferma la tendenza storica ad una progressiva concentrazione, generalmente estesa alle fasi trasformatrici ed alla distribuzione. In particolare, la Cina, con circa 40 milioni di tonnellate estratte, ha consolidato il prima-to produttivo, ma non ha incrementato la quota. I prezzi, nei mercati maggiori, sono stati caratterizzati da una buona resistenza, ed in molti casi da una discreta crescita. La stessa Cina, dove la quotazione media del prodotto finito ha fatto registrare una co-stante ripresa dal 2003 in poi, per accusare
una flessione di qualche rilievo soltanto nel 2009, è pervenuta al nuovo massimo di 32,40 dollari per metro quadrato esportato, contro 27,50 dell’anno precedente, per non dire dei 24,30 del 2011 e 13 del 2003. Il fe-nomeno, cui non è del tutto estranea la di-namica dei cambi, conferma che l’avvento di una ragionevole strategia di redditività è diventato ricorrente anche nei Paesi ter-zi, pur dovendosi confrontare, in regime di prezzi competitivi, con mutevoli equilibri di offerta e domanda, ma senza compromet-tere un differenziale di notevole ampiezza nei confronti delle economie mature, ed in particolare dell’Europa occidentale, dove la quotazione media del lavorato italiano, con circa 70 dollari per metro quadrato, resta più che doppia rispetto a quella cinese.Sul piano merceologico, il 2013 ha visto un nuovo recupero del prodotto siliceo, sia pure marginale, ferma restando la preva-lenza quantitativa del calcareo, la cui inci-denza sul consumo mondiale si colloca in-torno a tre quinti del totale. La destinazione prevalente è sempre quella dell’edilizia, con quote importanti destinate all’arredo urbano ed alla funeraria.A proposito della Cina, va aggiunto che la sua esportazione in volume, costituita in larghissima prevalenza da prodotti finiti, lasciando ai grezzi quote marginali, è scesa a 12,1 milioni di tonnellate, confermando il primo ridimensionamento del 2012, a fronte di una tendenza storica ampiamen-te positiva: il regresso è stato di 500 mila tonnellate, pari al quattro per cento. L’ex-port cinese, costituito per quattro quinti da prodotti finiti, ha confermato posizioni prioritarie e sostanzialmente monopolisti-
che in Corea del Sud ed in Giappone, con importanti presenze anche negli Stati Uniti e nell’Unione Europea. Diversamente dal volume, il fatturato estero delle spedizio-ni cinesi è pervenuto ad un nuovo primato, con oltre 6,2 miliardi di dollari ed una cre-scita di quasi venti punti, contro il quattro per cento dell’anno precedente.Nell’ambito dei maggiori Paesi lapidei il consuntivo dell’Italia è stato sostanzial-mente stazionario, con una flessione pro-duttiva marginale ed un recupero dell’ex-port in quantità - netto da sottoprodotti - pari ad un punto e mezzo, contro il 3,9 per cento ascritto nel 2012; resta un calo di ol-tre dieci punti rispetto al massimo storico del 2000. L’apporto determinante è venuto dal grezzo, il cui export italiano è salito di un ulteriore due per cento, mentre quello dei prodotti finiti ha fatto registrare un au-mento marginale, pari allo 0,6 per cento, con una quota sul totale delle spedizioni che è scesa al 51,4 per cento. Ciò con-ferma l’esistenza di permanenti difficoltà strutturali nel momento di lavorazione ed una crisi del valore aggiunto che si pone in controtendenza rispetto allo sviluppo della domanda mondiale.Il disaggregato regionale italiano confer-ma il primato del Veneto, con un fatturato estero di 493 milioni ed il 32,9 per cento dell’export in valore, ma con un recupero più accentuato della Toscana, che è perve-nuta al 32,8 per cento. In cifra assoluta, gli aumenti più significativi sono stati conse-guiti da Lombardia e Sicilia, mentre un bi-lancio riflessivo si è registrato in Trentino-Alto Adige, Lazio e Puglie.Un ruolo settorialmente fondamentale re-
sta quello dell’indotto ed in particolare delle tecnologie di lavorazione (macchine e beni strumentali). Per quanto riguarda l’impiantistica, il 2013 si è chiuso con una produzione mondiale stimabile in circa tre milioni di quintali, oggetto d’interscambio nella misura di due terzi, e la conferma del primato italiano, forte di un’esportazione in valore che assomma al 68,2 per cento di quella europea e copre la maggioranza assoluta della domanda in diversi Paesi extra-europei di rilevanza lapidea fonda-mentale, quali Turchia, Brasile ed Arabia Saudita.L’export italiano di macchine per marmi e pietre ha interessato spedizioni per circa 660 mila quintali con un volume d’affari per oltre 700 milioni di euro, ed aumenti rispettivi del 2,1 e del 10,8 per cento ri-spetto al 2012. Il valore medio per unità di prodotto, invece, è salito a 1058 euro a quintale contro i 974 dell’anno precedente, ascrivendo una maggiorazione di circa nove punti, dopo i venti dell’anno precedente, ed il nuovo prezzo medio massimo.Il consuntivo della tecnologia italiana è completato dai beni strumentali, fra cui pri-meggiano abrasivi e utensili diamantati, le cui esportazioni in valore hanno dato luogo ad un fatturato di 269 milioni di euro, con una crescita di 25 milioni rispetto al 2012, pari al 10,2 per cento, che si aggiunge al 4,3 del 2012 ed al 5,9 per cento del 2011.La movimentazione internazionale è stata caratterizzata, come in passato, da una lar-ga e logica prevalenza dei mezzi navali. Si è confermato il recupero dei trasporti fer-roviari, sia a breve che a lungo raggio (ad esempio, nei cospicui approvvigionamenti

222 XXIV Rapporto Marmo e Pietre nel Mondo 2014 Carlo Montani 223
cinesi di grezzi silicei provenienti dall’Eu-ropa settentrionale), mentre il numero di quelli su strada, spesso complementari ai primi due, è cresciuto in misura sostan-zialmente proporzionale alle produzioni di grezzi e manufatti, con una stima pari a cir-ca 48 milioni di carichi e scarichi. Quanto ai prodotti concorrenti, guidati dalla ceramica e dal gres porcellanato, la loro disponibilità complessiva in termini quantitativi (9,5 miliardi di metri quadrati) ha superato di circa sette volte quella dei lapidei, senza apprezzabili variazioni pon-derali nei confronti degli anni precedenti, ma sottolineando la permanenza di notevo-li prospettive di crescita per marmi e pietre, in specie se supportate da un’adeguata po-litica promozionale capace di ottimizzarne il consumo, tuttora limitato nel riferimento pro-capite nonostante talune iniziative di buon impatto come quelle del Marchio eu-ropeo di qualità e dei premi di architettura.Va aggiunto che, nel periodo lungo, l’impie-go mondiale di marmi e pietre è cresciuto in misura superiore a quello della ceramica, incrementandosi dal 12 per cento del 2000 ai circa 15 punti attuali.L’esame differenziato per Paesi dimostra che lo sviluppo del mondo lapideo è go-vernato da processi assai variabili: se gli aumenti maggiori di estrazione e trasfor-mazione sono stati conseguiti dalla Cina e dagli altri produttori asiatici, con riguardo prioritario all’India, anche in Europa non sono mancati apprezzabili recuperi come quelli nelle attività settoriali, ed in primo luogo nell’interscambio, segnatamente nei Paesi mediterranei, dove il settore lapideo, sia pure con talune sacche vischiose, ha
dimostrato una specifica idoneità ad elide-re gli effetti di una congiuntura economica che resta comunque difficile.Consuntivi di segno positivo sono stati regi-strati anche in Brasile, grazie ad una forte politica di valorizzazione delle pietre locali, con particolare riferimento al granito, ed alla loro incisiva distribuzione sui mercati ameri-cani; ed in Turchia, sebbene la sua crescita sia stata indotta soprattutto dalle spedizio-ni di grezzi calcarei verso il mercato cinese (con notevole prevalenza di lastre a piano di sega nei confronti dei blocchi), mentre la ripresa dell’export di manufatti in quello sta-tunitense è stata relativamente circoscritta, restando lontana dai massimi storici. Al pari di quanto è accaduto in Italia, in Egitto ed in altri Paesi produttori, la domanda del grezzo turco da parte della Cina è aumen-tata in modo impetuoso condizionando la politica del massimo valore aggiunto, ma permettendo all’export globale del Paese di raggiungere 8,3 milioni di tonnellate contro gli otto dell’anno precedente, per non dire dei 7,2 del 2011 e del milione e mezzo del 2002; e di consolidare il secondo posto nella graduatoria mondiale.Un caso di politica conservatrice illumina-ta è quello del Sudafrica, dove i caratteri cromatici del granito domestico e quelli della domanda internazionale propensa all’acquisizione di colori accesi ed a ritro-vate attenzioni per marmi e travertini si sono coniugati con la tradizionale strategia di valorizzazione della qualità e dei volu-mi estratti, le cui destinazioni prevalenti, diversamente da quanto accade altrove, hanno continuato ad interessare l’Europa ed in modo particolare l’Italia, con volumi
complessivi dell’export in sensibile regres-so, cui ha fatto riscontro un buon incremen-to del consumo interno.I prezzi del manufatto continuano ad essere notevolmente diversi da un Paese all’altro, con quotazioni medie dell’export che, in sintesi, vanno dai 52 euro/mq. dell’Italia ai 22 della Cina (previa conversione dal dolla-ro in base al cambio medio dell’esercizio). La tendenza generale, come si è detto, re-sta quella improntata al perseguimento di una redditività più competitiva, nei limiti consentiti da una concorrenza sempre più vivace. Debbono essere esaminate, infine, le pro-spettive di sviluppo del settore. Al riguar-do, le previsioni produttive, pur impron-tate a criteri opportunamente prudenziali rivenienti dall’estrapolazione delle serie storiche e da uno scontato incremento de-mografico seguito da quello dell’edilizia, sono favorevoli, tanto che nel 2020 il volu-me dei lapidei di pregio estratti nel mondo dovrebbe salire a circa 170 milioni di ton-nellate lorde, con un impiego nell’ordine di 1,9 miliardi di metri quadrati equivalenti, mentre il quantitativo oggetto di scambio internazionale andrebbe a definirsi in mi-sura proporzionale, e quindi, intorno ad un miliardo di metri. È fondato presumere che il trend del com-parto lapideo mondiale, superata la stroz-zatura indotta dalle residue situazioni di
ristagno, possa riprendere con un tasso conforme a quello di lungo periodo; si por-ranno, tuttavia, maggiori problemi di crea-zione delle infrastrutture, di adeguamento impiantistico e di collocazione dei cascami, a tutti i livelli nazionali e regionali, e prima di tutto in un’ottica globale. Sono problemi da affrontare tenendo conto del ruolo deci-sivo degli investimenti - e quindi del credito - e della necessità di potenziarli sul piano aziendale attraverso adeguati incentivi: ciò, sia per il momento produttivo sia per quello della comunicazione e della promozione, con attenzioni particolari per la questione degli scarti, le cui difficoltà di stoccaggio e di compatibilità ambientale vanno creando ostacoli alla logica dello sviluppo.Il settore lapideo possiede contenuti pro-fessionali molto alti e la possibilità di creare posti di lavoro con mezzi finanziari limitati, tanto che da oltre un trentennio è stato ritenuto ufficialmente idoneo ad av-viare processi di espansione laddove altri comparti non potrebbero esprimere analo-ghe capacità strategiche e tattiche. Se non altro per questo, ha diritto ad essere ogget-to di consapevoli attenzioni, sia nei Paesi terzi, dove costituisce un’occasione impor-tante di incremento del valore aggiunto, sia in quelli maturi, dove si traduce in aggrega-ti di notevole importanza dal punto di vista economico e sociale.

Synthesis of the Report
In the stone industry, the economy situation triggered in 2009 by the crisis of big finance and industrial production decline, after the extraordinary crossing which was pursued in more productive highs during the following years, has found an additional positive balance in 2013, despite the pockets of stagnation, still remaining in some countries. In fact, both in quarrying and processing, both in the interchange and consumption, a further progress has been achieved in the world, allowing a further development, according to a growth trend over twenty years.Marbles and stones, in fact, had already been distinguished for an expansion considerably higher than that of the world economy, and had suffered from the stagnation in a less wide extent than the average. The long-term final balances confirm it: looking back over the past ten years, the net production increased by about seven points in annual reason, and the global stone international exchange has grown on average by more than ten per cent.
In 2013, the volume quarried and that transformed in the world increased by about five points compared to the previous year, while the export and import volume, on the other hand, were increased by 2.8 percent in front of 2012, highlighting a greater proportional expansion of domestic markets.Always during the last year, import and export of stone have balanced in more than 53 million tons: even in light of these figures, and their historical evolution, the sector final balance is competitive towards other similar and competitive sectors. Nevertheless, it must be said that the world of marble, granite and other stones could ascribe a new positive result thanks to Asian countries, responsible for more than 60 percent of production.The whole sector production of 2013 amounted to 265 million tons at gross of losses for quarrying and processing waste and involved a consumption of 1.420 billion square meters equivalent, referring to conventional thickness of cm. 2. The per capita use, meanwhile, has risen to 226

Carlo Montani 227226 XXV Report World Marble and Stones 2014
square meters per thousand units, against 215 meters of the previous year, and 135 meters of 2003.The most important role in the context of globalization was held once again by the international exchange: considering the contributions of raw and processed products, according to the above mentioned figures, the total input-output balances in more than 770 million square meters equivalent. It should be noted that the share of raw is further expanded, with 52.7 percent of the total, and highlighting the continuity of a strategic modification that, from several years, gives no preference to the finished product. The figures show another significant stone reality: an absolute majority of world consumption refers to the materials quarried and often processed in countries different from that of setting-up.The top five manufacturers (in order: China, India, Turkey, Brazil, Italy) have expressed more than two-thirds of the world quarrying, and overcame more than a point the corresponding total share of 2012 and beyond twenty that of 1996. This confirms the historical trend to an increasing concentration, generally extended to processing and distribution phases. In particular, China, with about 40 million tons extracted from its quarries, has consolidated the primacy of production, but did not increase its share. Prices, in the major markets were characterized by a good resistance, and in many cases by a remarkable growth. The same China, where the average price of the finished product has recorded a steady recovery from 2003 onwards, to show an
important drop only in 2009, has reached the new maximum of 32.40 dollars per square meter exported, against 27.50 dollars of the previous year, not to say of the 24.30 dollars registered in 2011 and 13 dollars, obtained in 2003. The phenomenon, which is not entirely out of the dynamics of exchange rates, confirms that the advent of reasonable profitability strategies became applicant in third countries, while having to compare, at competitive prices, with the changing balance of supply and demand, but without compromising a large differential in front of the mature economies, particularly in Western Europe, where the average price of Italian processed product, with about 70 dollars per square meter, remains more than twice if compared with the Chinese one.On the commodity level, 2013 saw a new recovery of siliceous product, although marginal, on understanding that the quantitative prevalence of calcareous, as its impact on global consumption, is around three-fifths of the total. The main target is always that of the building, with important shares for the urban external furniture and the funerary art.About China, it should be added that its export volume, made up in very large prevalence of finished products, leaving to the blocks and raw slabs only some marginal shares, fell to 12.1 million tons, confirming the first drop of 2012, against an historical trend largely positive: the regression involved about 500 thousand tons, equal to four per cent. Chinese exports made up for four-fifths of finished products, confirmed priority positions and basically monopolistic in South Korea and in Japan,
with notable presences also in the United States and in the European Union. Unlike the volume, the foreign turnover of Chinese shipments reached a new record with over 6.2 billion dollars and a growth of almost twenty points, against four percent of the previous year.Concerning the leading stone countries, the final balance of Italy was basically stationary, with a marginal decrease in production and a recovery of exports in quantities, net from by-products, equal to one and a half point against the 3.9 percent ascribed in 2012; just a drop of more than 10 points compared to the historical peak of 2000. The decisive contribution came from the raw materials, whose Italian exports rose by a further two per cent, while that of finished products registered a marginal increase of 0.6 per cent, with a total share of their shipments that fell to 51.4 percent. This confirms the existence of permanent structural difficulties in processing time and a crisis of the added value that does not correspond to the development of world demand.The Italian regional disaggregated data of export confirm the primacy of Veneto, with a foreign turnover of 493 million and 32.9 percent of the total value, but with a more pronounced recovery in Tuscany, which has reached 32.8 percent. In absolute figures, the most significant increases were achieved by Lombardy and Sicily, while a thoughtful balance sheet recorded also in the province of Trento (for porphyry), Lazio and Puglia.A role fundamental in the stone macro-aggregate remains that of the satellite industries and in particular processing
technologies (machines and capital goods). With regard to the plant, the 2013 ended with a global production estimated in about three million tons, object of interchange to the extent of two-thirds, and the confirmation of the Italian primacy in value exported, that reaches 68.2 per cent of the European one, and covers the absolute majority of the demand in several non-European countries of stone high importance such as Turkey, Brazil and Saudi Arabia.Italian exports of machinery for marble and stone affected shipments for about 660 thousand tons with an annual turnover of over 700 million Euros and respective increases of 2.1 and 10.8 percent compared to 2012. The average value per product unit, however, rose to 1058 Euros per quintal against 974 of the previous year, ascribing an increase of about nine points, after the twenty points of the previous year, and the new maximum average price.The balance of Italian technology is complemented by capital goods, among which abrasive and diamond tools excel, whose exports in value have resulted in a turnover of 269 million Euros, with an increase of 25 million compared to 2012, representing 10.2 per cent, which is added to the previous 4.3 per cent, and to the 5.9 percent which had been registered in 2011.The international movement was characterised, as in the past, by a large and logistical prevalence of naval shipping. Anyway, was confirmed a good recovery of rail transports, both short-term and long-range (for example, in Chinese supplies of siliceous raw materials coming from Northern Europe), while the number of those

228 XXV Report World Marble and Stones 2014 Carlo Montani 229
on the road, complementary to the first two, has grown to an extent substantially proportional to raw and manufactured productions, with an estimate of about 48 million loads and unloads. As to competing products, guided by the ceramics tiles and vitrified stoneware, their total availability in quantitative terms (9.5 billion square meters) exceeded by about seven times that of stone, without any appreciable changes with respect to the previous years, but stressing the permanence of considerable growth perspectives for marbles and stones, especially if supported by an adequate promotion policy able to optimise their use, still limited in per-capita reference despite some good impact initiatives such as the European Trade Mark of Quality and several Architectural Awards.Anyway, it should be added that, in the long term, the use of marble and stone has grown to an extent greater than that of the ceramic sector, increasing from 12 percent in 2000 to about 15 current points.The differentiated examination by countries shows that the development of stone world is governed by processes very changeable: if the major increases of quarrying and processing were obtained from China and other Asian producers, with regard overall to India, even in Europe there have been appreciable recoveries like those of sector activities, and first in the interchange, especially in the Mediterranean countries where the stone industry, although with certain sticky pockets, showed a specific suitability to elide the effects of the economic general conditions, that remain difficult.
Positive balance sheets were recorded also in Brazil, thanks to a strong policy of improvement for the local stone, with priority to granite, and their incisive distribution in American markets; and in Turkey, although its growth has been driven primarily by shipments of raw calcareous stones to the Chinese market (with a considerable prevalence of a sawn slabs if compared with blocks), while the recovery of Turkish exports of manufactured goods in the United States was relatively circumscribed, staying away from historical highs. Just like what happened in Italy, in Egypt and in other producing countries, the Turkish raw demand from China has increased so fast, affecting the policy of maximum added value, but allowing the country global exports reaching 8.3 million tons against the eight of the previous year, not to say of 7.2 million in 2011 and 1.5 million in 2002; and to consolidate the second place in the global ranking.A case of enlightened conservative policy is that of South Africa, where chromatic characters of domestic granite, and those of international demand inclined to the acquisition of bright colours and renewed attention for marble and travertine, have been conjugated with the traditional strategy of enhancing quality and extracted volumes, whose main destinations, unlike elsewhere, continued to affect Europe and particularly Italy, with total export volumes declining sensitively, which followed a good increase of domestic consumption too.The prices continue to be significantly different from one country to another, with an average export quotation which, in
summary, range from 52 Euro/square meters in Italy to 22 in China (after conversion from dollars based on average exchange tax of the year). The general trend, as above mentioned, follows a more competitive profitability, within the space of an always more bright competitiveness. Finally, we have to examine the development perspectives of the sector. In this regard, the production forecasts, even if they have prudential criteria arising from the extrapolation of historical series and from a predictable population growth, followed by the construction one, are favourable, so much so that in 2020 the volume of valuable stone quarried worldwide is expected to rise to about 170 million gross tons, with an use in the order of 1.9 billion square meters equivalent, while the quantity object of international exchange would be defined in connected proportion, and then, around one billion meters.We have to assume that the trend of the world stone sector, overcoming the bottleneck caused by residual situations of stagnation, could recover a rate conforms to that of the long term; however, it is natural to provide higher problems of infrastructure availability, plant investment
and waste placement, at all national and regional levels, and first of all, in a global perspective. These problems must be aboard considering the crucial role of investment, therefore of credit, and the need to upgrade them on business plan through appropriate incentives, all that either for the productive moment or for the communication and promotion, with particular attention to the issue of waste, whose difficulties in storage and environmental sustainability are creating some remarkable obstacles to the logic of development.The stone industry has very high professional contents and the ability to create jobs with limited financial means: for over thirty years it was considered officially eligible to start expansion processes, also where other sectors are not able to express similar strategic and tactical skills. If nothing else, that is a good reason to remark that stone has the right to be a subject of conscious attention, both in third countries, where is an important opportunity to increase the added value and the gross national product, and in mature economies, where may involve many aggregates of great importance, as to the further economic and social development.

A
Africa 15, 25, 47, 56, 57, 62, 66, 187, 228
America 12, 15, 44, 47, 61
Arabia Saudita 15, 17, 27, 28, 221
Argentina 26, 57
Asia 15, 23, 26, 30, 57, 60, 61, 186, 188
Australia 185, 187
B
Belgio 12, 15, 21, 22, 27, 185
Belgium 44, 46, 52, 53, 58, 187
Brasile 11, 12, 13, 14, 15, 16, 17, 19, 21, 22, 24, 25, 26, 27, 28, 31, 34, 35, 185, 220, 221, 222
Brazil 43, 44, 45, 46, 47, 48, 49, 50, 52, 54, 56, 57, 58, 60, 62, 65, 66, 184, 187, 226, 227, 228
Bulgaria 21, 28, 53, 60
C
Canada 25, 56, 185, 187
China 43, 44, 45, 46, 47, 48, 49, 50, 52, 53, 54, 55, 56, 57, 58, 59, 62, 66, 187, 226, 228
Cina 11, 12, 13, 14, 15, 16, 17, 19, 21, 23, 24, 25, 26, 27, 28, 31, 34, 35, 185, 220, 222, 223
Corea del Nord 24
Corea del Sud 11, 15, 16, 17, 22, 23, 26, 27, 185, 221
Croatia 53, 66
Croazia 21, 35
Czech Republic 53
D
Danimarca 35
Denmark 66
E
Egitto 14, 15, 21, 22, 25, 35, 222
Egypt 46, 47, 52, 54, 56, 66, 82, 85, 228
Europa 8, 11, 20, 27, 28, 34, 220, 222
Europe 40, 43, 44, 50, 52, 58, 59, 60, 65, 226, 227, 228
European Union 46, 53, 217, 227
F
Finland 52, 187
Finlandia 21, 185
France 46, 49, 52, 58, 59, 187
Francia 15, 17, 21, 27, 28, 185
G
Germania 11, 15, 17, 21, 22, 26, 27, 28, 29, 185
Germany 43, 46, 49, 52, 53, 57, 58, 59, 60, 187
Giappone 11, 12, 15, 22, 23, 26, 27, 28, 185, 186, 221
Grecia 19, 20, 21, 27, 28
Greece 50, 52, 58, 59, 60
H
Hong - Kong 15
Indice dei nomi geografici
Geographical Names Index

232 XXV Rapporto Marmo e Pietre nel Mondo 2014 XXV World Marble and Stones Report 2014 233
I
India 11, 12, 13, 15, 16, 17, 19, 21, 22, 23, 24, 26, 27, 31, 34, 35, 43, 44, 45, 46, 48, 49, 50, 52, 54, 55, 56, 57, 58, 62, 65, 66, 185, 187, 220, 222, 226, 228
Indonesia 24, 35, 55, 66
Iran 14, 15, 21, 23, 46, 47, 52, 54, 55
Italia 7, 13, 15, 16, 17, 18, 19, 20, 21, 24, 26, 27, 28, 29, 31, 35, 185, 220, 221, 222, 223
Italy 7, 39, 45, 46, 48, 49, 50, 51, 52, 56, 57, 58, 59, 60, 62, 63, 66, 187, 226, 227, 228, 229
J
Japan 43, 44, 47, 53, 54, 55, 58, 59, 187, 188, 226
K
Kazakhstan 24, 26, 55, 57
L
Lazio 13, 45, 221, 227
Lebanon 47
Libano 15
M
Malaysia 35, 66
Malta 29, 60
Mongolia 24, 55
N
Netherlands 58, 66
North Korea 55
Norvegia 21, 35, 185
Norway 52, 66, 187
O
Oman 15, 24, 47, 55
P
Paesi Bassi 35
Pakistan 23, 35, 55, 66
Palestina 15, 26, 36
Pechino 34
Poland 43, 53, 187
Polonia 11, 21, 185
Portogallo 15, 17, 20, 21, 26, 27, 28, 31, 185
Portugal 46, 49, 52, 57, 58, 59, 62, 187
Puglie 221
R
Regno Unito 17, 21, 27, 28, 35, 186
Repubblica Ceca 21
Romania 21, 53
Russia 11, 12, 43, 44, 185, 187
S
Saudi Arabia 47, 49, 58, 60, 227
Siena 32, 63
Singapore 15, 23, 35, 47, 55, 66, 185, 187
Slovenia 28, 60
South Africa 47, 57, 66, 187, 228
South Korea 43, 47, 48, 49, 53, 54, 55, 58, 187, 226
Spagna 15, 16, 17, 19, 20, 21, 26, 27, 31, 32, 185
Spain 46, 48, 49, 50, 51, 52, 57, 58, 62, 187
Stati Uniti 11, 15, 16, 17, 22, 23, 24, 27, 34, 185, 221
Sudafrica 15, 25, 35, 185, 222
Svizzera 12, 15, 27
Switzerland 44, 46, 58
T
Taiwan 15, 17, 24, 27, 47, 49, 55, 58, 185, 187
Thailand 55
Thailandia 24
Toscana 13, 18, 20, 221
Turchia 11, 12, 13, 14, 15, 16, 17, 19, 21, 22, 23, 24, 26, 28, 31, 35, 185, 220, 221, 222
Turkey 43, 44, 45, 46, 48, 49, 50, 52, 54, 56, 57, 58, 59, 60, 62, 66, 187, 226, 227, 228
Tuscany 45, 50, 51, 227
U
Unione Europea 14, 21, 35, 215, 221
United Kingdom 49, 52, 58, 59, 66, 188
United States 43, 47, 48, 49, 53, 54, 55, 56, 58, 59, 65, 187, 227, 228
USA 55
V
Veneto 13, 18, 45, 50, 221, 227
Verona 8, 40, 215, 217
Vietnam 15, 24, 47, 55
N.B. - Non sono elencati i nomi geografici delle tavole fuori testo.
R. - The geographical names reported in the statistical tables are not listed.

Sommario
XXV RAPPORTO MARMO E PIETRE NEL MONDO 2014
Prefazione 7
Introduzione 9
Quadro macro-economico 11Produzione mondiale 12Scambi internazionali 13Flussi aggregati dell’ex-import 14Dinamica dell’interscambio 15Analisi merceologica 17Italia: una meta lontana 18Spagna: ripresa complessa 19Altri Paesi europei 20Pianeta Cina 21Asia protagonista 23Stati Uniti: progresso graduale 24Globalizzazione lapidea 25Andamento dei consumi 26Macchine e impianti produttivi 27Beni strumentali 29Immagine promozione e sviluppo 20Volume d’affari 31
Conclusione 32
Appendice critica 33Documentazione statistica 69Schede dei maggiori Paesi 1994-2013 185
Ringraziamenti 215Sintesi del Rapporto 219Indice dei nomi geografici 231

Table of contents
XXV WORLD MARBLE AND STONES REPORT 2014
Preface 39
Introduction 41
Macro-economic frame 43World stone production 44International trade 45Dimension of export-import 46Stone exchange trend 47Commodity analysis 48Italy: long-term strategy 49Spain: a complex objective 50Other European countries 52Planet China 53Asian leadership 54USA: hard gradual progress 55Stone globalization 56Development in use 57Machines and plants 58Technological goods 60Image promotion and expansion 61World turnover 62
Conclusion 63
Critical Appendix 64Statistical tables 69Files of the leading Countries 1994-2013 187
Acknowledgements 217Synthesis of the Report 225Geographical Names Index 231

Aziende sponsor del XXV Rapporto
Companies sponsoring the XXV Report
Il XXV Rapporto Marmi e Pietre nel Mondo 2014è su World Stone Magazine e su MarbleintheWorld Data Bank
www.marbleintheworld.com
XXV World Marble and Stones Report 2014is on World Stone Magazine and on MarbleintheWorld Data Bank
www.worldstonemagazine.comLa rivista internazionale del settore lapideo
The international magazine of the stone sector
Aldus CAsA di Edizioni in CArrArA
Vicolo agli Orti, 54030 Sorgnano [email protected]
Finito di stampare nel settembre 2014presso la tipografia
Mori Metello, Massa

R.E.D. Graniti S.p.A.
Via Dorsale, 12 · 54100 Massa (MS) Italy · tel. +39 0585 88471 · fax +39 0585 884848 · [email protected] · www.redgraniti.com
Datemi della materia e con essa io creerò un mondo
(Immanuel Kant)
paginapubblicitariared17x24.indd 1 08/09/10 11:28

Oltre ad inventare il filo diaman-tato e le lame diamantate per telai di segagione, siamo stati pionieri anche nella produzione di fili dia-mantati per macchine multifilo. Fedele all’orgoglioso retaggio, Diamant Boart è oggi il marchio leader nello sviluppo, nella pro-duzione e nella commercializza-zione di utensili per l’industria lapidea con una gamma comple-ta di soluzioni professionali.
We invented the diamond gang saw blades and the diamond wire, and we were a pioneer in the production of wires for multi-wire machines. True to its proud past, Diamant Boart is today the leading brand for the deve lopment, production and marketing of a complete range of tools for the stone industry.
www.diamantboart.com
GASPARIMENOTTI
Discover the Gaspari World
Gaspari Menotti S.p.A. | Viale Zaccagna, 18/F | 54033 - CARRARA (MS) - IT | Tel.: +39 0585 64551 | Fax.: +39 0585 645555 | [email protected]
MADE IN ITALY
The Gaspari World
InnovationMoreTechnologyMore
DesignMoreCustomer CareMore
www.gasparimenotti.com
26/29 VERONA SETTEMBRE 2012 | | ITALY
Visit us at
HALL 2 | STAND C6/D6
ww
w.th
etis
.tv
wabrasives.com
Milgrandi S.p.A.Via Parco, 47 - 20853 Biassono (MB)Phone : +39 039 22 00 913 - Fax : +39 039 22 00 963Exp Dept Phone : +39 039 22 00 904 - Fax : +39 039 22 00 954
Think Premium Steel grit and shot for granite cutting and blasting
Premium_verona-2014.indd 1 30/07/14 18:04
Crema Marfil Coto®
C
M
Y
CM
MY
CY
CMY
K
Autovia Madrid – Alicante s/n 03660. Novelda (Alicante) Spaint +34 965 609 184 f +34 965 609 109
[email protected] www.levantina.com
®
C
M
Y
CM
MY
CY
CMY
K

Our fantastic natural world,
unchanged over time
CALACATTA LINCOLN
STATUARIO COLORADO
CALACATTA GOLDEN
t h e e x c e l l e n c e o f A m e r i c a n m a r b l eColorado Stone Quarries Inc.Marble Colorado U.S.A. ph. +1 970 7049002 - [email protected]
CALACATTA LINCOLN
alta
mira
-ad.
it
Ph:
Ron
Bai
ley

54033 Carrara (MS) Italy, Via del Bravo 12Ph. 0039 0585 74420 Cell. 0039-335 5347796Fax. 0039 0585 74647Website: www.maxmarmicarrara.itE-mail: [email protected]
Una grande esperienza al vostro servizio

DAZZINIMACCHINEDAZZINIMACCHINECARRARA-ITALY
Viale Zaccagna, 6 - 54036 Carrara - Italy Tel. +39 0585/50226 - Fax. +39 0585/855874 [email protected]
Dazzini Macchine srl
QS6000DQS4000D
TCI360VH
QS6000DQS4000D
TCI360VH
www.dazzinimacchine.com

F U R R E R S P A - V I A C O V E T T A , 2 - 5 4 0 3 3 C A R R A R A I T A L Y - T E L . + 3 9 . 0 5 8 5 . 8 5 8 4 9 4 - F U R R E R @ F U R R E R . I T
ALL YOUR PROJECTS COME TRUE WITH OUR BRAND.
C A R R A R A
FURRER
La FURRER nasce nel 1939 per escavare, lavorare, trasformare e commercializzare in tutto il mondo i prodotti lapidei di produzione nazionale ed estera.Sino ad oggi l'azienda FURRER non ha conosciuto soluzioni di continuità nella fornitura di materiali grezzi, semilavorati e a misura d'architetto.
Furrer was established in 1939 to operate in the stone industry from the quarrying up to the finished transformed product and the trading all over the world. Until nowadays Furrer has carried on the supply of rough, semi-finished and cut-to-size stones.
C A R R A R A - R O M A - AT E N A L U C A N A - L E C C E - C I V I TA N O VA M A R C H E
Estrazione
Extraction
LavorazioneProcessing
DistribuzioneDistribution
Cut-to-size
Cut-to-size
Posa in opera
Installation
www.gmcspa.com

Associazione italiana Costruttori e Utilizzatori di macchinee attrezzature varie per la lavorazione delle pietre naturali
Associazione Italiana MARMOMACCHINE:Corso Sempione, 30 - 20154 Milano (Italy) - Tel. +39 02 31 53 60 r.a.
www.assomarmomacchine.com
Italian Association of manufacturers and users of machineryand other equipment for natural stone processing
q g
marmomacc.com
Verona, ITALY24/27 SEPTEMBER 2014
STONE + DESIGN + TECHNOLOGY INTERNATIONAL TRADE FAIR
organized by
MARMO INFO MARMISTA 21x28,7.indd 1 03/04/14 10.24


