Embed Size (px)
Citation preview
The author(s) shown below used Federal funds provided by the U.S. Department of Justice and prepared the following final report: Document Title: Rapid STR Prescreening of Forensic Samples at
the Crime Scene Author: Micah Halpern, Dr. John Gerdes, Dr. Joan Habb,
Anahita Kiavand, Dr. Jack Ballantyne, Dr. Erin Hanson
Document No.: 236434
Date Received: November 2011 Award Number: 2008-DN-BX-K012 This report has not been published by the U.S. Department of Justice. To provide better customer service, NCJRS has made this Federally-funded grant final report available electronically in addition to traditional paper copies.
Opinions or points of view expressed are those
of the author(s) and do not necessarily reflect the official position or policies of the U.S.
Department of Justice.

Rapid STR Prescreening of Forensic Samples at the Crime Scene
Final Report
Project Duration:
September 1, 2008 to February 28, 2010
Submitted to: National Institute of Justice Grant No. 2008-DN-BX-K012
Submitted by:
Mr. Micah Halpern - Midwest Research Institute Dr. John Gerdes, Dr. Joan Habb, Ms. Anahita Kiavand - Micronics, Inc.
Dr. Jack Ballantyne, Dr. Erin Hanson – National Center for Forensic Science
February 10, 2011

1
ABSTRACT
Technological advances in DNA analysis including STR (Short Tandem Repeat) profiling have led to improved investigation and prosecution of crimes and have now become standard procedure in forensic laboratories. Extraction and amplification improvements combined with microfluidic processing will soon permit rapid onsite prescreening of probative crime scene samples and will potentially reduce the number of samples requiring more detailed laboratory analysis. Incorporation of STR genotyping comprises the next stage of development. A combined system would provide an invaluable tool for crime scene investigators by allowing real-time pre-analysis of probative samples, eliminating downstream laboratory analysis of non-probative samples and providing on-site information to aid in the investigation.
The goals of this project were to continue development of a unique melt-based
approach to STR genotyping (dpFRET), integrate and test that approach for compatibility with existing microfluidic extraction, amplification and melt subcircuits and determine applicability for forensic applications. The benefit to this approach is the simplification of converting laboratory protocols for portability, mainly by eliminating the many challenges associated with capillary electrophoresis (CE) size-based analysis. These can include biological/technological artifacts, added sample processing steps and complex equipment demands required for portability. Some of the advantages not possible with CE-based protocols demonstrated through the validation phase of this project include: higher sensitivity (5-25 picograms); elimination of pre-quantification; minimal or no apparent biological artifacts including stutter; applicability to smaller amplicons not possible with current assays; the ability to detect microvariants (SNPs); and transfer compatibility to a microfluidic platform.
Through development and testing of the optimized assay with a microfluidic
platform, successful sample extraction from blood, PCR amplification and melt-based allele detection was demonstrated using a microfluidics-based subcircuit design approach. It is the transfer of this approach to a fully integrated microfluidic lab-on-a-card format that will permit processing and analysis of samples in an enclosed environment; thereby minimizing the chances for cross contamination and more importantly providing a means for post-analysis archiving of DNA extracts for follow-on laboratory testing of probative samples. Results from this project have demonstrated successful generation of a classic CE profile 18 months following archiving of extracted DNA. This will not only provide a preliminary profile at the scene to determine victim versus non-victim samples but will also permit post-scene laboratory analysis of the probative samples without the need for additional sample extraction. Successful microfluidic processing of 5-10 µl blood spots dried on a subcircuit surface was also demonstrated; providing high confidence for application to crime scene samples.
The overall objective achieved during this project was to overcome difficulties
associated with CE-based STR profiles that act as a barrier to rapid objective prescreening of probative samples at the crime scene. This was accomplished through
This document is a research report submitted to the U.S. Department of Justice. This report has not been published by the Department. Opinions or points of view expressed are those of the author(s) and do not necessarily reflect the official position or policies of the U.S. Department of Justice.

2
development, testing and validation of a unique melt-based genotyping protocol in a microfluidic based system. Collaborative efforts during this project produced convincing evidence that with further development and validation, a platform for on-site STR based prescreening of probative samples in a rapid cost effective manner is possible.
This document is a research report submitted to the U.S. Department of Justice. This report has not been published by the Department. Opinions or points of view expressed are those of the author(s) and do not necessarily reflect the official position or policies of the U.S. Department of Justice.

3
Table of Contents ABSTRACT .........................................................................................................................1 EXECUTIVE SUMMARY .................................................................................................4 INTRODUCTION .............................................................................................................14
Project Goal ...................................................................................................................14 Current Technologies for Sample Analysis at the Crime Scene ....................................16 dpFRET Hybridization-based STR Genotyping ............................................................17 Microfluidics ..................................................................................................................18
METHODS ........................................................................................................................19 Aim 1—Design and Test STR Genotyping Assays .......................................................19 Aim 2—Design and Test Microfluidic Extraction and Archiving Cards ......................20 Aim 3—Design and Test PCR and DNA Melt Cards....................................................20 Aim 4—Develop and Validate System for Forensic Applications ................................20
RESULTS AND DISCUSSION ........................................................................................20 Aim 1—Design and Test STR Genotyping Assays .......................................................20
Original dpFRET Protocol Development ..............................................................20 Enhanced dpFRET Protocol Development ............................................................23
Aim 2—Design and Test Microfluidic Extraction and Archiving Cards ......................26 Aim 3—Design and Test PCR and DNA Melt Cards....................................................28
Microchannel PCR Card ........................................................................................28 DNA Melt (Hybridization) Card ............................................................................30 On-card Lambda Exonuclease Reaction ................................................................30
Aim 4—Develop and Validate System for Forensic Applications ................................31 ESB-FRET Assay ..................................................................................................31 Microfluidic Extraction Card Evaluation ...............................................................33 PCR Amplification Card Evaluation .....................................................................34
CONCLUSIONS................................................................................................................34 Implications for Policy and Practice ..............................................................................34 Implications for Further Research .................................................................................35
REFERENCES ..................................................................................................................37 DISSEMINATION OF RESEARCH FINDINGS.............................................................39 FIGURES ...........................................................................................................................40 TABLES ............................................................................................................................89
This document is a research report submitted to the U.S. Department of Justice. This report has not been published by the Department. Opinions or points of view expressed are those of the author(s) and do not necessarily reflect the official position or policies of the U.S. Department of Justice.
4
EXECUTIVE SUMMARY
There is no genotypic approach for determining the probative value of crime scene samples in situ currently in use. There is a need for efficient nucleic acid extraction, short tandem repeat (STR) prescreening analysis and archiving of DNA extracts at the crime scene, which would enable investigators to more objectively categorize evidence as originating from the victim vs. non-victim, mixtures vs. single source, etc.; thus impacting which samples are fully analyzed by the laboratory. Currently, crime scene investigators have to use their professional judgment in deciding which biological items to recover from the scene for subsequent analysis. In other words, they have to decide which crime scene items have the best chance of providing probative information. In many instances, they have a conundrum: if they take too few samples from the scene they run the risk of failing to recover crucial evidence, while if they take too many samples, they run the risk of overwhelming the resources of the laboratory processing the potential evidence. Prescreening of samples at the crime scene would permit the crime scene examiner to spend more time locating more probative stains that originated from individual(s) other than the deceased.
The most discriminatory markers currently used in forensic laboratory analysis are
the extensively validated collection of STRs comprising the CODIS loci. The standard approach for analysis of these markers is multiplex amplification followed by capillary electrophoresis (CE) size separation. A variety of known experimental artifacts are possible with CE-based STR genotyping attributed to either biological (stutter peaks, non-template 3’ nucleotide addition) or technological (matrix artifacts, electronic spikes or dye ‘blobs’) causes. Data interpretation of CE-analyzed samples can be a challenge for highly trained laboratory analysts in a controlled setting. These challenges would only be expected to be exacerbated in a crime scene setting. Additionally, multiple steps are required for sample preparation prior to CE analysis including extraction, quantification, amplification, sample clean-up, injection, electrophoresis and fragment detection. Transfer of all these steps to a single truly hand-held portable system results in a complex design with multiple potential points of failure. Ultimately, detection of fragments by CE with sufficient resolution requires complex optical systems in the laboratory (lasers, filters, cameras) that are expensive and difficult to ruggedize. A unique approach is required to overcome these technical and logistical hurdles to facilitate STR analysis transfer for crime scene investigation.
The goal of this project was to develop and test a unique STR genotyping method
based on DNA hybridization/melt analysis (dpFRET) that incorporates microfluidic-based processing and avoids many of the challenges of CE-based analysis. This would markedly reduce the complexity of the system (eliminating pre-quantification, sample injection, electrophoresis, etc.), thus reducing overall cost and footprint of the system. Unlike CE-based technology, this type of system would require only basic technology (LED, filters, CCD camera) to accumulate data that has already been incorporated into existing ruggedized systems. The existing dpFRET protocol originally developed prior to the initiation of this project utilized an increased concentration of PCR primer to produce a template strand for hybridization (i.e., asymmetric PCR) that was combined with a set
This document is a research report submitted to the U.S. Department of Justice. This report has not been published by the Department. Opinions or points of view expressed are those of the author(s) and do not necessarily reflect the official position or policies of the U.S. Department of Justice.
5
of probes comprised of each allele at each locus. Each 5’ fluorophore labeled probe consisted of a defined repeat number and partial flanking sequence (5’ and 3’) that subsequently hybridized with the template produced from the sample and through melt analysis determined presence/absence of each allele. Through strategic design, the probe will hybridize differentially to a matched or mismatched template depending on the allele(s) present in a sample. Although proven to be a successful approach for STR genotyping it was determined over the course of this project that the original dpFRET protocol could be further enhanced and simplified for subsequent transfer to the microfluidic environment.
There are a number of benefits to a melt-based approach for STR genotyping as
compared to CE-based genotyping such as no need for pre-quantification and extremely high sensitivity. This is primarily due to the amplification scheme that is possible with hybridization based detection as opposed to end-point amplification schemes. Through CE detection of amplification products, cycle number is limited (30-35 cycles) to prevent amplification of detectable non-specific products in later cycles. Alternatively, hybridization-based detection provides the added benefit of non-detection of most or all non-specific amplification in later cycles due to non-complementarity between probe and spurious amplification. This allows for additional cycles of amplification (50 cycles) to be used in melt-based approaches that are not compatible with current CE-based amplification protocols. This high number of cycles results in production of equivalent amounts of PCR product irrespective of the starting amount of template. Whether starting with a single copy or thousands of copies, the same amount of final product is produced during the plateau phase of amplification giving equivalent peak heights regardless of starting concentration of test material. Not only does this negate the need for pre-quantification prior to amplification but more importantly provides a significantly more sensitive threshold of detection. Preliminary testing prior to this project showed equivalent peak heights, no loss of heterozygosity and no allelic dropout using decreasing amounts of sample. A preliminary determination of the sensitivity of the assay was examined during this project through validation exercises that further supported these conclusions.
The aim of this project was to develop and test a microfluidic lab-on-a-card system
incorporating melt-based genotyping of STR loci for implementation in prescreening analysis of probative samples at the crime scene. This goal was accomplished through implementation of the following specific aims:
Aim 1—Design and Test STR Genotyping Assays Aim 2—Design and Test Microfluidic Extraction and Archiving Cards Aim 3—Design and Test PCR and DNA Melt Cards Aim 4—Develop and Validate System for Forensic Applications The goal of Aim 1 was to develop a protocol for melt-based STR genotyping though
enhancement of the dpFRET approach. Preliminary assay designs were completed for eleven loci including CSF1PO, THO1, TPOX, D3S1358 (D3), D5S818 (D5), D7S820 (D7), D8S1179 (D8), D13S317 (D13), D16S539 (D16), D18S51 (D18) and Amelogenin
This document is a research report submitted to the U.S. Department of Justice. This report has not been published by the Department. Opinions or points of view expressed are those of the author(s) and do not necessarily reflect the official position or policies of the U.S. Department of Justice.

6
using the original design strategy as proposed. All probe designs correlated with CE genotypes except D5, which resulted in an unexpected match for samples containing thirteen repeat alleles when tested using an eleven repeat probe. At this stage in development it was hypothesized that this result was most likely due to imperfect repetitive sections in the flanking sequence directly adjacent to the core repeat section (i.e., microvariants). Amelogenin, CSF1PO, THO1 and TPOX loci showed the best correlation with CE-based genotyping while all other loci resulted in select samples that were discordant with CE genotypes similar to what was observed for D5 in preliminary testing.
Considering dpFRET is a sequenced-based genotyping approach (as opposed to CE
size-based genotyping), it was hypothesized that microvariants with sequence-based differences in either the repeat region and/or sequence flanking the repeat region encompassed by the probe could be responsible for the apparent difference between CE and dpFRET. These types of results have been seen with other technologies that rely on sequence-based genotyping such as mass spectrometry. These results have significant implications for improved resolution between samples interrogated with a limited number of loci when using a sequence specific approach such as melt curve analysis.
Following assay development work, the National Center for Forensic Science
(NCFS) proceeded with an evaluation of the optimized dpFRET assay designs. The transferred protocols were used to evaluate TPOX, TH01, D7, D16, CSF1PO using 30 samples. Reference STR genotypes generated by CE for the samples were obtained prior to dpFRET analysis using standard methods. For TPOX and TH01, all 30 samples were typed correctly resulting in match melt peaks for the probes corresponding to the alleles in the donor genotype. For CSF1PO, correct genotypes were obtained for 29 of the 30 samples. The peaks for the probes that should have been positive for this sample were shifted to a slightly lower temperature and were therefore designated as mismatch peaks. While TPOX, TH01 and CSF1PO performed quite well using the provided protocol, a larger number of incorrect genotypes were obtained for D7 and D16. For D16, 49 out of 60 alleles (81.7%) were genotyped correctly. For D7, 51 out of 60 alleles (85%) were genotyped correctly when compared with CE genotypes. For the alleles that were not genotyped correctly, the peaks for the probes that should have been positive were shifted to a slightly lower temperature (~1°). As previously stated, sequencing analysis of these samples revealed that all shifts/mismatches were due to sequence variation (SNPs) further supporting the existence of microvariants and the detection capabilities of a melt-based approach
It was also noted during initial testing by NCFS that stutter peaks occurred relatively
infrequently and only for certain loci. No stutter peaks were observed for TPOX, TH01 or CSF1PO. Three possible stutter peaks were observed for D16 and eight possible stutter peaks were observed for D7. In an effort to determine stutter frequency, the amount of stutter observed using the dpFRET protocol was compared to the amount of stutter obtained for the same samples using COFiler (standard CE autosomal STR genotyping). A reduction in the amount of stutter was observed using the dpFRET protocol for both D7 (23% for COFiler and 19% for dpFRET) and D16 (51% for COFiler and 5% for
This document is a research report submitted to the U.S. Department of Justice. This report has not been published by the Department. Opinions or points of view expressed are those of the author(s) and do not necessarily reflect the official position or policies of the U.S. Department of Justice.

7
dpFRET). This reduction in the amount of stutter could provide an advantage over standard autosomal STR genotyping for forensic samples particularly in cases of mixed samples.
Following fulfillment of the original specific aim of developing an allele specific
genotyping protocol, it was determined that alternative options for certain portions of the approach could be further optimized for subsequent transfer to a microfluidic subcircuit. The first step in protocol optimization focused primarily on simplifying the type and number of amplification reactions with the goal of transferring a more simplistic approach to the microfluidic subcircuit. As opposed to CE analysis, probe hybridization strategies require the availability of a ‘template’ strand for probe interaction through asymmetric generation of amplification products. There are a number of approaches to achieve this goal but not all are readily transferable to a microfluidic environment. The most successful approach developed during this project was based on 5’ phosphorylation of the primer responsible for generation of the non-template strand followed by treatment with lambda exonuclease to degrade the strand competing for probe hybridization. Using this method, samples are amplified using a single 50 cycle PCR reaction. This is then followed by brief incubation (30 minutes) with lambda exonuclease to eliminate the strand that competes for probe hybridization.
Following simplification of the step used to generate amplified template for probe
hybridization, it was determined that sufficient resources were available to explore an alternative approach to utilize a single probe to genotype all alleles at a locus as opposed to the more reagent intensive allele-specific probe method. To achieve this goal, a number of single probe modifications were explored including the use of a limited number of modified nucleotides (amino dA, inosine, etc.) and numerous designs of both fluorophore labeled and unlabeled probes. Although incremental successes were achieved with variations of a single probe system, it was ultimately determined that a “blocker” probe approach produced the highest levels of required resolution. This method uses an unlabeled “blocker” probe consisting of the smallest number of common repeats (i.e., five repeats for TPOX) for all alleles at a locus. The blocker probe is designed with a higher relative annealing temperature to partially block hybridization of a second fluorophore labeled probe denoted as a “signal” probe. Higher resolution between alleles is achieved through size reduction of the signal probe/template complex. This approach proved superior to both the allelic probe system as well as other single probe alternatives investigated during development.
Although successful, this two probe (blocker-signal) approach resulted in low signal
to noise sometimes complicating genotype designations. An improvement to the method was successfully designed and tested that included what is termed an “enhancer” probe. The enhancer probe consisted of an unlabeled probe that hybridized directly upstream of the signal probe and resulted in an increased melt peak signal through intercalation of additional SYBR Green dye that acts as an energy donor. It is hypothesized that through the use of an unlabelled enhancer probe, additional intercalated dye donated additional FRET energy to the acceptor fluorophore on the signal probe increasing overall melt peak signal. The Enhancer-Signal-Blocker FRET (ESB-FRET) method was demonstrated to
This document is a research report submitted to the U.S. Department of Justice. This report has not been published by the Department. Opinions or points of view expressed are those of the author(s) and do not necessarily reflect the official position or policies of the U.S. Department of Justice.

8
be a superior approach to the original proposed dpFRET chemistry by simplifying both the number of reactions and reagents required to genotype a sample. However, the enhanced genotyping approach necessitated relocating the original PCR primers to accommodate either the blocker or enhancer probe. This was accomplished in a locus specific manner by either relocating the forward or reverse primer further upstream from the original sequence. To balance any effects on assay efficiency, primers were relocated closer to the internal repeat section when possible. All design resulted in new mini-STRs that have to date demonstrated successful amplification for all samples tested. The capability to have alleles from different loci that overlap in size is another strong benefit to a melt-based (as opposed to size-based) approach. This means that the smallest possible amplicons can be generated for all loci without the limitation imposed by CE-based protocols.
It was apparent that by using this new approach it was possible to reduce assay cost
and complexity and simplify transfer of the chemistry to a microfluidic environment. Results and subsequent ESB-FRET design strategies proven successful for TPOX were applied and tested on four other loci including CSF1PO, D5, D7 and D13. The assays were transferred to both NCFS and Micronics and showed good reproducibility between laboratories. During the process of developing and testing these new probe designs it was again noticed that a limited number of samples for D5, D7 and D13 resulted in genotypes by melt curve analysis that did not match CE based genotypes. Similar to microvariant detection with the original dpFRET protocol, it was determined following sequencing that samples that exhibited microvariation could also be detected by the new enhanced ESB-FRET approach. SNPs either internal or directly adjacent to the repetitive region that were undetectable by CE were easily detected using this new method. This result suggests that a melt-based approach to STR genotyping has the potential to detect additional alleles based on SNPs within STR loci that is currently undetectable by CE. However, considering the stage of development for this technology and to simplify analysis an approach was used to mask the detection of these microvariant SNPs by incorporation of the universal base inosine at probe positions with known variants. This proved successful for generating good correlation with CE based genotyping for both microvariant and non-microvariant samples using a single probe set. Future development work beyond the current effort could incorporate more complex design and analysis strategies to include detection of these additional microvariant alleles thus increasing the power of resolution for loci that exhibit this phenomenon.
Aim 2 development work proceeded concurrently with Aim 1 assay design and
testing, with the objective to develop an extraction protocol that eliminated carry over inhibitors following nucleic acid extraction from whole blood using the Micronics microfluidic extraction subcircuit card and to examine the capability of archiving extracted DNA on card. This was accomplished through testing the efficiency of the extraction protocol when dried blood is collected and rehydrated on a cotton swab and dried again to simulate collected evidence. To determine whether extracted DNA could be stored on the capture membrane of the microfluidic extraction subcircuit for later use (i.e., archiving), an 18 month stability study was also developed to test the viability of stored DNA after increasing periods of storage.
This document is a research report submitted to the U.S. Department of Justice. This report has not been published by the Department. Opinions or points of view expressed are those of the author(s) and do not necessarily reflect the official position or policies of the U.S. Department of Justice.
9
A series of experiments were undertaken to optimize the extraction of nucleic acid
from whole blood samples without carryover inhibitors that affected downstream processing. Once protocol optimization was complete, two blood samples were extracted in triplicate on both the Micronics extraction subcircuit card and the commercially available Qiagen whole blood extraction kit in order to directly compare the extraction efficiency of each method. When analyzed by qPCR using the ABI Quantifiler kit, on-card extractions yielded similar amplification curves to extractions performed using the Qiagen kit. The average calculated concentration of nucleic acid obtained from the Micronics extraction card was slightly attenuated compared with the Qiagen extraction kit, but remained well within the observable range of the reaction. When analyzed by qPCR using the ABI Quantifiler kit, it was also observed that on-card extractions yielded similar amplification curves to extractions performed using the Qiagen kit when extracting dried blood. Again, the average calculated quantity of nucleic acid obtained from the Micronics subcircuit card was slightly attenuated compared with Qiagen, but remained well within the observable range of the reaction.
During the archiving studies, DNA was eluted from stored membranes at
approximately 1 month intervals and analyzed using the commercial Quantifier qPCR reaction kit. An increase in Ct value between the initial measurements to the 3-month time point indicated an approximately 10-fold reduction in the amount of DNA recovered from the capture filter after storage. However, the data points obtained between months 3 through 18 of storage indicated that the samples reached a point of relative stability indicated by consistent Ct measurements by qPCR. In an effort to determine the quality of the recovered nucleic acid, DNA eluted at all storage time points was analyzed for their ability to produce a DNA profile. This work performed at NCFS according to standard laboratory protocols produced identical DNA profiles for all storage times, thereby confirming that DNA extracted, bound and dried onto silica as employed by the Micronics’ extraction cartridge is an effective means to stabilize and archive DNA for later analysis by crime laboratories.
The microfluidic extraction and archiving subcircuit testing proved successful. The
next specific Aim required that assay designs that demonstrated sufficiently acceptable results in Aim 1 be transferred to Micronics following the initial evaluation performed by NCFS. Using the TPOX assay protocol and reagents, Micronics performed PCR amplification on its pre-existing PCR microfluidic cartridge. Following amplification, the PCR product was removed from the cartridge and post-amplification processing (lambda exonuclease treatment, melt curve analysis) was performed on the bench using the provided protocol. Allele peaks were observed for all bench-top and card-amplified reactions. It is important to note that the microfluidic cartridge amplified products yielded equivalent results to bench top amplified products, demonstrating the feasibility of the microfluidic PCR subcircuit. Additional feasibility studies for the PCR microfluidic cartridge were conducted to examine the effects of the microfluidic environment on different Taq polymerase enzymes and shortening of the amplification protocol to a two-step protocol. Overall, it was demonstrated that successful
This document is a research report submitted to the U.S. Department of Justice. This report has not been published by the Department. Opinions or points of view expressed are those of the author(s) and do not necessarily reflect the official position or policies of the U.S. Department of Justice.

10
amplification was achieved with minimal alterations to the current microfluidic PCR subcircuit.
Following amplification it is necessary to lambda exonuclease treat the product and
perform a standard melt curve. Although trivial for laboratory analysis, it was necessary to demonstrate that the existing portable, mains or battery-powered PanNAT™ microfluidic system previously developed by Micronics could achieve these goals. Although no changes to the PanNAT system were required for lambda exonuclease testing, minor modifications were necessary to adapt the instrument to process and detect a standard DNA melt curve. The PanNAT instrument was originally designed for end point molecular beacon detection. Although the detection zone contains a heater, melt curves have not been previously generated with the system. Using this system for proof of principle, Micronics was able to measure representative melt curves for homozygous and heterozygous samples. This data supported the conclusion that the current PanNAT optical system is capable of being modified with both hardware and software enhancements to function for ESB-FRET melt curve detection. To demonstrate that the exonuclease reaction could be capable of functioning on-cartridge the enzyme was dried down, stored and reactions were processed on card. Following two weeks of storage the enzyme still maintained activity. For generation of more rapid results (sample-to-answer) shortening of the incubation time for the enzyme (30 minutes) would be optimal. It has been demonstrated that typical enzyme incubation times can often be reduced in a microchannel environment. Micronics has shown in other studies (data not shown) that the microchannel exonuclease reaction can most likely be shortened to approximately two minutes providing a quicker sample to answer. Overall, it was demonstrated that with additional development both enzymatic treatment of the sample and optical detection (i.e., melt curve analysis) are highly amendable to the PanNAT microfluidic system.
With successful results achieved for Aim1 assay designs, Aim 2 extraction subcircuit
testing and Aim 3 PCR subcircuit testing, Aim 4 studies were initiated that involved NCFS conducting a more in-depth evaluation of the optimized ESB-FRET protocol. Primers and probes were evaluated for TPOX, CSF1PO, D5, D13, D7 and Amelogenin. Similar to results achieved with previous versions of the assay, there was a sufficient separation of smaller alleles. However, as the allele number increased the separation between alleles ranges decreased. For some loci, the allele ranges for some of the larger alleles overlapped making correct genotyping of these alleles difficult. Once the allele ranges were determined, each individual sample was examined to ensure that the correct genotypes were obtained. Again it was noted that it was difficult to genotype heterozygote samples with (n, n+1) genotypes. It was determined that the inability to correctly determine heterozygote (n, n+1) genotypes with the larger alleles is a limitation of the current assay. The reproducibility of the assay between runs was also examined with a limited number of samples. For several of the loci there was a 0.5 – 2.0° shift in temperatures between runs. It was determined that while this would not be problem for the smaller alleles with sufficient differences in allele temperature ranges, this might be a problem for the larger alleles where there might not be enough separation between different alleles.
This document is a research report submitted to the U.S. Department of Justice. This report has not been published by the Department. Opinions or points of view expressed are those of the author(s) and do not necessarily reflect the official position or policies of the U.S. Department of Justice.

11
Following reproducibility studies, the sensitivity of the ESB-FRET assay was tested
with a range of input DNA amounts (5pg, 25pg, 50pg, 100pg, 250pg, 500pg, and 1ng). This range was used to evaluate genotype recovery at each of the five loci (TPOX, D5, CSF1PO, D13 and D7) and Amelogenin. Three males were included for the evaluation of each STR locus in order to evaluate all possible individual genotype possibilities ((homozygote, heterozygote (n,n+1 consecutive alleles), heterozygote (non-consecutive alleles)). Genotypes were obtained at all loci using as little as 25pg of input DNA. The strength of the melt curve signal obtained did not appear to diminish as lower input amounts were amplified indicating the possible suitability of use of the ESB-FRET assays with low template DNA samples. Additionally, partial and complete genotypes were obtained for several loci using 5pg of input DNA. However, with the exception of CSF1PO, consistent results across the three genotype types were not obtained using such a small amount of input DNA. It should be noted that with further optimization, it is possible that 5pg of input DNA may be reproducibly amplified. A sensitivity range of 5-25pg would be an improvement over STR amplification kits using standard amplification conditions.
Upon successful completion of sensitivity studies, mixture samples were evaluated
with all 5 loci: TPOX, D5, CSF1PO, D13 and D7. Three samples were tested for each locus: 1) two homozygotes (non-overlapping alleles); 2) two heterozygotes (one allele shared between donors), 3) two heterozygotes (non-overlapping alleles). For each locus that was evaluated, the mixture samples consisted of 1:1 and 3:1 ratios using a total of 2 nanograms for each amplification. In general, most of the two homozygote non-overlapping samples worked fairly well for all loci tested. For some of the 3:1 mixtures it was possible to detect the difference in signal intensity between the major and minor alleles. Three allele patterns were observed for some of the heterozygote over-lapping samples however, melt patterns became increasingly complicated for heterozygotes with non-overlapping alleles.
Stutter frequently impacts genotype determinations for mixed samples. It was
determined through the original dpFRET evaluations that stutter was markedly reduced when compared to CE generated profiles. With a limited number of samples tested, stutter peaks were observed even less (or not at all) using the enhanced ESB-FRET protocol. However, given the difficulty with discerning (n, n+1) genotypes using the ESB-FRET assay, it is not clear yet whether stutter peaks are truly absent or whether they simply fail to be detected due to the particular samples used and the confounding effects of the aforementioned (n, n+1) genotypes. It is recognized that the elimination of observed stutter peaks would result in an improved ability to identify and interpret true admixed DNA samples frequently encountered in forensic casework but additional future developmental studies would be required to ascertain the true potential for elimination of stutter using the ESB-FRET genotyping protocol.
After evaluation of the chemistry, NCFS proceeded to examine the feasibility of the
on-card DNA extraction. In order to initially test the on-card extraction protocols, bloodstains of various sizes (0.2µl, 1µl, 5µl and 10µl) from 10 donors were used. Liquid
This document is a research report submitted to the U.S. Department of Justice. This report has not been published by the Department. Opinions or points of view expressed are those of the author(s) and do not necessarily reflect the official position or policies of the U.S. Department of Justice.

12
blood from each donor was deposited onto stain cards using the four different volumes. As expected, an increase in DNA yield was observed for both approaches as the size of the bloodstain increased. For each bloodstain volume a higher yield was obtained from the samples extraction with the Qiagen DNA Investigator kit. Based on the current on-card extraction protocol, it appeared that 5 – 10 µl bloodstains would provide sufficient results for on-card extraction when genotyped using the Identifiler kit. The extracted blood stains were subsequently tested with the ESB-FRET assay in order to demonstrate the ability to obtain genotypes from on-card extracted samples. TPOX and D5 were the loci selected for this study. Genotypes were successfully recovered from all 5 and 10 µl bloodstains extracted with both the on-card protocol and the Qiagen DNA Investigator kit using the ESB-FRET protocol demonstrating true applicability for crime scene samples.
The ability to provide crime scene investigators with a simple, rapid, and
inexpensive system for preliminary STR-based prescreening of multiple samples at the scene would be an invaluable tool for the determination of the probative value of crime scene evidence (victim vs. non-victim) and could potentially contribute to the effectiveness of the investigation. Source identification of samples at the crime scene would not only reduce the number of samples sent to the lab by eliminating samples derived from the victim, but can also provide immediate information to the investigator concerning the source of each stain. This approach would contribute timely information at the scene that could accelerate the pace of an investigation through sample source attribution and simultaneously provide a smaller more effective subset of samples to the forensic laboratory for complete analysis. The limitations of current technologies for crime scene genotyping include complexity, cost, speed and most importantly the need for extensively trained personnel. Development of a microfluidic system that incorporates ESB-FRET melt-based analysis has the potential to overcome many of these obstacles and aid in the transfer of rapid forensic DNA prescreening capabilities to crime scene investigators.
Successful completion of this Phase I project aimed at development and validation of
a crime scene instrument based on a melt-based STR genotyping assay combined with a microfluidic platform has demonstrated the feasibility of the methodology and subcircuit designs. The next phase (Phase II) would integrate all steps within an injection molded cartridge and modest software modifications and manufacture of the instrument. Based on current production estimates, it is anticipated that the selling price for this system would be under $10,000 for the field portable instrument and approximately $10 per disposable card. The next phase of development would entail optimization of the ESB-FRET protocol to resolve large alleles, integration of all protocol steps shown to operate in the existing subcircuit cartridges into a single injection molded cartridge and revisions as needed to the PanNAT field portable instrument. The instrument is battery and/or AC powered, portable (weight ~ 4 kg) and provides all of the software for processing the assay, with qualitative result detection, and graphic presentation to the screen. Fluidic movement, reagent presentation, heat cycling, and optical detection would be accomplished by the interface of the cartridge and instrument. The instrument is Wi-Fi-enabled and operates on a .net framework. It can be powered by battery for up to eight hours of testing and re-charged from power mains, car battery or solar power cells. The
This document is a research report submitted to the U.S. Department of Justice. This report has not been published by the Department. Opinions or points of view expressed are those of the author(s) and do not necessarily reflect the official position or policies of the U.S. Department of Justice.

13
final stages of assay development and subcircuit integration comprise the final steps to produce a truly portable system for crime scene investigators that could significantly impact criminal justice.
This document is a research report submitted to the U.S. Department of Justice. This report has not been published by the Department. Opinions or points of view expressed are those of the author(s) and do not necessarily reflect the official position or policies of the U.S. Department of Justice.

14
INTRODUCTION Project Goal
There currently is no accepted genotypic approach for determining the probative value of crime scene samples in situ. The lack of on-site genetic analysis necessitates crime scene investigators to prioritize samples for detailed laboratory analysis resulting in an approach that increases the likelihood that non-probative samples are processed at the laboratory and more importantly, potentially probative samples can be overlooked. Additionally, sample processing frequently does not occur for several months following collection and can result in potential loss of evidence integrity due to DNA degradation within unprocessed samples. Although current guidelines for sample storage are adequate, it would be advantageous to extract and stabilize DNA from a sample as soon as possible while removing potential degradative substances and providing enhanced DNA stability for follow-on laboratory analysis. There is a need for efficient nucleic acid extraction, short tandem repeat (STR) prescreening analysis and archiving of DNA extracts at the crime scene which would enable investigators to more objectively categorize evidence as originating from the victim vs. non-victim, mixtures vs. single source, etc. thus impacting which samples are fully analyzed by the laboratory.
Currently, crime scene investigators have to use their professional judgment in
deciding which biological items to recover from the scene for subsequent analysis. In other words, they have to decide which crime scene items have the best chance of providing probative information. In many instances they have a conundrum: if they take too few samples from the scene they run the risk of failing to recover crucial evidence, while if they take too many samples, they run the risk of overwhelming the resources of the laboratory processing the potential evidence. Some of the deciding factors influencing a crime scene examiner’s decision as to how much and what to recover are case specific and based on the nature of the crime ( was biological evidence deposited or transferred), the number of potential items that could be recovered (are there two bloodstains visible or are there several hundred), the number of participants (as victims, culprits, innocent bystanders or individuals having legitimate prior access to the scene) and the location of the crime (in a confined area such as a single room or outside in a large wooded area). Prescreening of samples would provide a significant aid in triaging biological evidence recovered at the scene. If a discriminatory genetic profile of the stain donor could be obtained at the scene in real time, it would be possible to distinguish the deceased’s blood from blood deposited by a second party. If the circumstances dictated that the deceased had bled at the scene (e.g. the deceased was still in situ and was obviously bleeding from a wound), the finding of the deceased’s blood in many (but not all) locations would not be very probative. Prescreening of samples at the crime scene would permit the crime scene examiner to spend more of their time locating more probative stains that originated from individual(s) other than the deceased (who may or may not be the culprit(s)).
The goal for this project was to initiate preliminary development and testing of DNA
extraction and field forward genotyping microfluidic cartridges that would provide a means for prescreening evidence at the crime scene while simultaneously stabilizing the
This document is a research report submitted to the U.S. Department of Justice. This report has not been published by the Department. Opinions or points of view expressed are those of the author(s) and do not necessarily reflect the official position or policies of the U.S. Department of Justice.

15
extracted DNA for subsequent laboratory analysis of samples deemed probative. As opposed to the current approach, crime scene investigators would be able to prescreen samples at the scene to provide preliminary and timely information concerning the source (victim vs. non-victim) of each sample. Follow-on laboratory analysis would then focus on only probative samples eliminating the need to analyze samples chosen by the investigator that match the victim. Implementing this approach would not only allow for more effective on-site crime scene analysis but more importantly would potentially provide a smaller and better subset of samples for full laboratory analysis thus helping to reduce backlog.
The most discriminatory markers currently used in forensic laboratory analysis are
the extensively validated collection of STRs comprising the CODIS loci. The standard approach for analysis of these markers is multiplex amplification followed by capillary electrophoresis (CE) size separation. Additional methods for size discrimination including array based hybridization1, 2, 3 and mass spectrometry4 have been explored, but all current approaches are subject to weakness in one or more of the following categories: interpretation, portability, ease-of-use, cost and speed. Recent advances in technology5, 6 provide the potential to process and analyze samples at the crime scene utilizing different portable versions of current CE-based laboratory protocols. The development of these portable systems is reflective of the need for such tools at the crime scene; however, the systems are subject to the same limitations encountered with laboratory STR analysis including the need for highly trained personnel, multiple complex processing steps and sensitivity/complexity of equipment required for CE analysis.
A variety of known experimental artifacts are possible with CE-based STR
genotyping including stutter peaks, non-template 3’ nucleotide addition, matrix artifacts and electronic spikes or dye ‘blobs’. Data interpretation of CE-analyzed samples can be a challenge for highly trained laboratory analysts in a controlled setting. These challenges would only be expected to be exacerbated in a crime scene setting. Additionally, multiple steps are required for sample preparation prior to CE analysis including extraction, quantification, amplification, sample clean-up, injection, electrophoresis and fragment detection. Transfer of all these steps to a single truly portable system results in a complex design with multiple potential points of failure. Finally, detection of fragments by CE with sufficient resolution requires complex optical systems in the laboratory (lasers, filters, cameras) that are expensive and difficult to ruggedize. A unique approach is required to overcome these technical and logistical hurdles to facilitate STR analysis transfer for crime scene investigation.
The purpose of this project was to develop and test a unique STR genotyping method
based on DNA melt analysis and incorporating microfluidic processing that avoids many of the challenges of CE-based analysis. The use of this particular melt-based approach does not suffer from many of the biochemical (stutter, 3’ additions) or technological (spikes, blobs) artifacts that can complicate profile interpretation making it more amendable for personnel with minimal training. Due to the use of a melt-based approach and incorporation of microfluidic processing, this reduces the complexity of the system (no pre-quantification, injection, electrophoresis, etc.) thus reducing overall cost and
This document is a research report submitted to the U.S. Department of Justice. This report has not been published by the Department. Opinions or points of view expressed are those of the author(s) and do not necessarily reflect the official position or policies of the U.S. Department of Justice.

16
footprint of the system. Unlike CE-based technology, this approach requires only basic technology (light source and sensors) to accumulate data that have already been ruggedized successfully in other systems. In essence, objective genotypes are generated through automated analysis with a sensitive system that can withstand the pressures of portability. Prior to the start of this project, successful application of STR melt curve analysis at the laboratory scale was demonstrated and successfully reproduced CE profiles using nothing more than a real-time thermal cycler and commercially available reagents. Further development and testing of this protocol on a microfluidic lab card encompassed the next development step toward crime scene application.
Microfluidic cards for DNA extraction and amplification had been produced by Micronics, Inc and shown to be a robust method for automated processing of blood, feces, and vaginal specimens prior to commencing development work on the current project. These microfluidic devices utilize a plurality of microfluidic channels, inlets, valves, filters, pumps, liquid barriers and other elements arranged in various configurations to manipulate the flow of a fluid sample in order to reproduce laboratory protocols and prepare a sample for analysis in an automated fashion. Fluid logic within cartridge circuits is a function of uniquely designed channel geometry, mixing chambers and valves. Micronics currently manufactures a commercially available fluidic workstation (microFlow®) and software to provide computer controlled fluid motion within a cartridge. The incorporation of a unique and objective melt-based STR genotyping technology with Micronics’ microfluidic platform provides the potential opportunity to objectively assess the probative value of biological materials through prescreening samples at the crime scene using proven markers.
A critical element to the success of this project involved evaluation by a group with
intimate knowledge of the needs and considerations dictated by forensic DNA analysis. The National Center for Forensic Science at the University of Central Florida (NCFS) routinely evaluates novel forensic techniques and provided developmental validation studies on the optimized melt-based chemistry and rudimentary evaluation of the components of the portable microfluidic system. The outcome of their analysis identified certain inefficiencies in the original approach and initiated development work ultimately resulting in more efficient assays than initially proposed. Through validation of the melt-based chemistry and system components by NCFS a crucial component was provided that increased the efficiency of the system and provided the confidence required for determining the applicability to crime scene investigations. Current Technologies for Sample Analysis at the Crime Scene
The adoption of PCR-based methods heralds a significant enhancement in the capacity for successful typing of biological crime scene samples. There is, however, no current validated capability to perform genetic prescreening of probative samples at the crime scene. Samples are selected by the crime scene investigator for laboratory processing based on evaluation of the scene. Conversion of current laboratory testing methods to a portable, rapid and cost effective crime scene typing system is hampered by complicated extraction, amplification and analysis protocols7 necessary for CE analysis.
This document is a research report submitted to the U.S. Department of Justice. This report has not been published by the Department. Opinions or points of view expressed are those of the author(s) and do not necessarily reflect the official position or policies of the U.S. Department of Justice.
17
Although accurate to less than a single base pair, there are certain known
inaccuracies with the interpretation of CE-based STR profiles. Specifically, methods have been established to ascertain whether a peak in an electropherogram is a true allele or a possible artifact of the analytical process itself. This necessitates an extensive post-analysis evaluation of experimental parameters by a trained DNA analyst typically with specialized analysis software. This post-analysis evaluation involves a number of parameters including peak shape and height, evidence of locus degradation or dropout, alignment with the allelic ladder and extra or unbalanced alleles. After the initial evaluation, there are a number of experimental artifacts that need to be accounted for including stutter peaks, non-template 3’ nucleotide addition, matrix artifacts and electronics spikes or dye blobs. These analytical limitations are inherent to any approach that is based upon amplimer CE size-based separation including more recently developed microfluidic systems. It is also important to note that in addition to the technical disadvantages discussed above, another limitation to the application of a portable CE-based system concerns the intellectual property landscape that could block the commercialization of electrophoretic detection of STRs. This includes the STR claims of Caskey (US patent 5,364,759), claims on electrophoresis within microchips (Caliper US patents 5,965,001 and 5,800,690 and Agilent US patent 7,243,670), and Promega claims on multiplex STR (US 7,008,771). Taken together, both the technical and legal hurdles surrounding CE application to STR genotyping at the crime scene are quite extensive.
As an alternative, hybridization analysis has shown to be a promising alternative
approach for more objective allelic discrimination using a dual-hybridization FRET probe-based chemistry8, however, its use has been limited by sequence-specific design constraints, limitations on probe size and costs associated with a multi-probe system. A unique approach loosely based on dual-hybridization probes has been developed that alleviates many of these shortcomings by replacing the donor probe with a DNA intercalating dye. This technology termed dye-probe FRET (dpFRET) requires only an acceptor probe and can be designed against almost any sequence. It is important to note that following developmental testing the original dpFRET protocol was further enhanced and simplified for transfer to the microfluidic platform. For both the original and enhanced protocols, the extraction and amplification methodologies are similar to current forensic laboratory protocols. Different forms of STR allele detection (melt versus CE) comprise the major difference from laboratory practices.
dpFRET Hybridization-based STR Genotyping
The original dpFRET protocol originally developed prior to the initiation of this
project used an increased concentration of primer to produce a template strand for hybridization (i.e., asymmetric PCR) and included a set of probes for each allele at every locus. Following asymmetric amplification, a 5’ fluorophore labeled probe with a defined repeat number and partial flanking sequence (5’ and 3’) is added to the reaction. Through strategic design, the probe will hybridize differentially to a matched or mismatched template depending on the allele(s) present in a sample. This results in a differential melting temperature that is monitored through a FRET reaction between the fluorophore
This document is a research report submitted to the U.S. Department of Justice. This report has not been published by the Department. Opinions or points of view expressed are those of the author(s) and do not necessarily reflect the official position or policies of the U.S. Department of Justice.

18
and the intercalating dye. The temperature at which the probe dissociates provides an objective means of determining whether that particular allele is present in the sample and at what approximate concentration. An example is depicted in Figure 1 in which a probe containing 9 repeat units is hybridized to samples containing 9, 10 or 8 repeats. In the case of a mismatched template (10 and 8 repeats), the melt temperature for the probe/template hybrid is lowered due to incomplete hybridization at the 5’ end. Using this approach, both homozygotes and heterozygotes can be typed for each allele with minimal deviation from current protocols. Although proven to be a successful approach for STR genotyping over the course of this project the original dpFRET protocol was further enhanced and simplified and will be further described in the results section of this report.
Among the benefits to a melt-based approach for STR genotyping as compared to
CE-based genotyping are the elimination of pre-quantification and resultant extremely high sensitivity. This is primarily due to the amplification scheme that is possible with hybridization based detection as opposed to end-point amplification schemes. Through CE detection of amplification products cycle number is limited (30-35 cycles) to prevent amplification of detectable non-specific products in later cycles. Alternatively, hybridization based detection provides the added benefit of non-detection of most or all non-specific amplification in later cycles due to non-complementarity between probe and spurious amplification. This allows for additional cycles of amplification (50 cycles) to be used in melt-based approaches that is not possible with current CE-based amplification protocols. This high number of cycles results in production of similar amounts of PCR product irrespective of the starting amount of template. Whether starting with a single copy or thousands of copies, the same amount of final product is produced during the plateau phase of amplification giving equivalent peak heights regardless of starting concentration of test material. Not only does this negate the need for pre-quantification prior to amplification but more importantly provides a significantly more sensitive threshold of detection. Preliminary testing prior to this project showed no loss of heterozygosity or allelic dropout using varying amounts of sample (Figure 2) and this was further examined through validation exercises incorporated into the specific aims of this project to look at sensitivity and mixed samples.
Microfluidics
In addition to development of the dpFRET chemistry for STR genotyping, the other
critical component to this proposal was development and testing of this chemistry using patented microfluidic technology to both miniaturize and integrate DNA extraction, and perform microchannel nucleic acid amplification, melt curve analysis and DNA archiving in a disposable device read by a portable instrument. The benefits associated with miniaturization of bioanalytical techniques are well known9, 10, 11 and include the reduction of the size of equipment, faster analysis, shorter reaction times, parallel operation for multiple analyses and the possibility of portable devices. Prior to this project, Micronics had developed cartridges that integrate fluidic and pneumatic logic and has been producing a commercially available microfluidic workstation used for assay optimization to nanoliter volumes. Previous assays transferred to their platform have been
This document is a research report submitted to the U.S. Department of Justice. This report has not been published by the Department. Opinions or points of view expressed are those of the author(s) and do not necessarily reflect the official position or policies of the U.S. Department of Justice.

19
integrated on cartridges using proven, scaleable and proprietary microfluidic methods12,
13, 14, 15, 16, 17, 18, 19, 20, 21, 22, 23. The individual assay steps are performed in the subcircuitry of a three-dimensional disposable cartridge using fluidic movement and valving logic, with sample-to-result performance enabled through integration of the subcircuits. This approach offers technological advantages as compared to most macro-scale methods because it (1) reduces and /or eliminates user manipulations, and training beyond sample introduction, and apparatus activation; (2) enables complete analysis to be performed on disposable cartridges (cards); (3) utilizes laminar flow diffusion-based microfluidics to miniaturize the volumes and diffusion events to accelerate reaction kinetics and thereby reduce assay performance time; (4) reduces sample and reagent volumes required to obtain results at reduced cost; (5) utilizes unidirectional, positive pressure assay flow, which eliminates cross-contamination and reduces potential for false positives; and (6) sequesters all steps and waste in a closed system disposable to prohibit cross-contamination and increase laboratory safety.
Over the course of this project, Phase I developmental studies aimed at producing a
platform for STR genotyping that can be used by minimally trained personnel at the crime scene has been accomplished. This included development of the detection chemistry, testing and development of the microfluidic subcircuits and validation at each step in the process. Through completion of this project and future studies to integrate the final system it is envisioned that a genotypic approach for determining the probative value of crime scene samples will be an obtainable goal in the near future. The ability to analyze these samples at the scene will result in an approach that decreases the likelihood that non-probative samples are processed at the laboratory assisting in backlog reduction and more importantly, will likely reduce the possibility that probative samples are overlooked. METHODS
The overall goal of this project was to develop a framework for a microfluidic lab-on-a-card system incorporating dpFRET melt based genotyping of STR loci for implementation in prescreening analysis of probative samples at the crime scene. This goal was accomplished through implementation of the following specific aims:
Aim 1—Design and Test STR Genotyping Assays
Four CODIS loci with the highest discriminatory potential, low intra-locus sequence
variation and simplest conversion to hybridization analysis were adapted according to design strategies that had proven successful with the TPOX locus and were subsequently validated by NCFS.
Initial testing examined all loci amendable to dpFRET genotyping. These included
TH01, TPOX, D7S820, D5S818, D16S539, D13S317, CSF1P0, D3S1358, and D8S1179. A combination of four of these loci would provide a minimal discrimination level of approximately 1 in 10,000 individuals for the most common alleles at each locus. The
This document is a research report submitted to the U.S. Department of Justice. This report has not been published by the Department. Opinions or points of view expressed are those of the author(s) and do not necessarily reflect the official position or policies of the U.S. Department of Justice.

20
Amelogenin locus was also included for sex determination using a similar design strategy.
Optimized autosomal and Amelogenin assay designs and protocols were transferred
to NCFS and subjected to developmental validation. The purpose of these studies were to assess the ability of the dpFRET method to obtain reliable results, determine the conditions under which such results could be obtained and define the limitations of the procedure. In addition to determining the accuracy, precision, and reproducibility of the method, sensitivity, stability, PCR parameters and simulated casework studies were performed. It was through data generated by these validation studies that led to the successful development of an enhanced melt-based protocol.
Aim 2—Design and Test Microfluidic Extraction and Archiving Cards
Microfluidic extraction subcircuits were tested using mock forensic blood evidence
that included extraction of either fresh wet or blood specimens dried on a surface. The DNA generated during this series of testing was used as the input DNA for validation of the PCR subcircuit described in Aim 3. Additional samples were extracted using the extraction subcircuit and tested for archiving stability of the extracts over a time period of 18 months.
Aim 3—Design and Test PCR and DNA Melt Cards
Optimized and validated protocols developed in Aim 1 were transferred to
microfluidic subcircuits for PCR amplification and DNA melt curve analysis and tested with extract from the extraction subcircuit developed in Aim 2.
Aim 4—Develop and Validate System for Forensic Applications
In addition to validation testing of the dpFRET chemistry in Aim 1, both the
extraction and microchannel PCR subcircuits were tested for use in a forensic context. The archived DNA samples generated in Aim 2 using the extraction subcircuit were also tested for stability (both quantity and quality) using standard laboratory STR analysis. RESULTS AND DISCUSSION Aim 1—Design and Test STR Genotyping Assays Original dpFRET Protocol Development Assay Designs
Preliminary dpFRET assay designs were completed for eleven loci including
CSF1PO, THO1, TPOX, D3S1358 (D3), D5S818 (D5), D7S820 (D7), D8S1179 (D8), D13S317 (D13), D16S539 (D16), D18S51 (D18) and Amelogenin using the original design strategy as proposed. This strategy involved designing and synthesizing
This document is a research report submitted to the U.S. Department of Justice. This report has not been published by the Department. Opinions or points of view expressed are those of the author(s) and do not necessarily reflect the official position or policies of the U.S. Department of Justice.

21
individual probes for every allele at each locus. To determine whether initial design strategies for TPOX would be transferable to other loci in a cost effective manner, only a single allele at each loci was designed and synthesized. Resulting melt curves for loci tested using this approach are shown in Figure 3 through Figure 12. Each figure depicts the melt curves generated for a single allelic probe at the designated locus tested against five samples with variable genotypes. Genotypes generated by standard CE protocols are listed in the table next to each graph. Homozygotes are denoted by a cross, heterozygotes by a triangle and samples lacking the allele are smooth. All probe designs correlated with CE genotypes except D5 (Figure 7) which resulted in an unexpected match for samples containing thirteen repeat alleles when tested using an eleven repeat probe. At this stage in development it was hypothesized that this result was most likely due to imperfect repetitive sections in the flanking sequence directly adjacent to the core repeat section.
Following successful testing of preliminary dpFRET probe designs against a single
allele at each locus, optimized probes were designed and commercially synthesized for all major alleles for CSF1PO, THO1, TPOX, D3S1358 (D3), D5S818 (D5), D7S820 (D7), D8S1179 (D8), D13S317 (D13), D16S539 (D16) and Amelogenin. All probes were tested against a larger sample set (n=16) to provide increased confidence in assay performance. Results for both preliminary testing on a limited sample set (n=5) with a limited number of probes and follow-on optimized testing are listed in Table 1. Amelogenin, CSF1PO, THO1 and TPOX loci showed good correlation with CE-based genotyping. All other loci resulted in select samples that were discordant with CE genotypes similar to what was observed for D5 in preliminary testing.
Microvariant Detection using dpFRET
Considering dpFRET is a sequenced-based genotyping approach (as opposed to CE
size-based genotyping), it was hypothesized that microvariants with sequence-based differences in either the repeat region and/or sequence flanking the repeat region encompassed by the probe could be responsible for the apparent difference between CE and dpFRET. In an effort to minimize costs, only discordant samples were sequenced for the D7 locus by standard methods without the use of cloning to separate alleles within each sample. Additionally, dpFRET probes designed lacking the repeat region and complementary to only the flanking regions contained within the original allelic probe were used to distinguish single nucleotide polymorphisms (SNP) within regions both upstream and downstream of the repeat region of the probe. Figure 13 shows the results for the D7 8 repeat allele probe (upper middle panel) tested against two samples both determined to be a D7 8,10 genotype by CE. Samples tested included JCCL 10 (triangle – null) and JCCL 13 (smooth – allele present). JCCL 13 resulted in the expected match peak with JCCL 10 resulting in the unexpected no match peak. Sequence for JCCL 10 is shown (center panel) with a mixed based position in the upstream flank sequence highlighted. This position showed both a wild type “C” and variant “T” at a position six base pairs from the 5’ end of the probe. Wild type flank probes lacking the repeat section confirmed results seen by standard sequencing by producing two peaks for JCCL 10 with a single peak for JCCL 13 for the upstream flank (bottom left panel) and a single melt peak for the downstream flank (bottom right panel) for both samples.
This document is a research report submitted to the U.S. Department of Justice. This report has not been published by the Department. Opinions or points of view expressed are those of the author(s) and do not necessarily reflect the official position or policies of the U.S. Department of Justice.
22
The same experimental approach was applied to two additional samples (Figure 14)
both determined to be a D7 8,11 genotype by CE. JCCL 12 (triangle – null) and JCCL 13 (smooth – allele present) showed similar results for the D7 8 repeat allele probe with a missing match peak for JCCL 12. Sequencing (center panel) confirmed JCCL 12 had the same upstream flank SNP as JCCL 10 but also had an additional SNP in the downstream flank at a position five base pairs from the 3’ end of the probe. Again, both upstream (bottom left panel) and downstream (bottom right panel) flank probes confirmed the microvariant results for D7. These same two SNPs were detected in a number of samples for the D7 locus and it is hypothesized that microvariant SNPs are most likely the cause of the discordant results seen for all other loci tested. These results have significant implications for improved resolution between samples interrogated with a limited number of loci when using a sequence specific approach such as melt curve analysis.
Validation Testing of the Original dpFRET Design
Initial work was conducted by NCFS in order to evaluate the provided dpFRET STR
typing protocol based on the original design strategy. The protocol as developed involved two amplifications: 1) double stranded amplification (50 cycles) using forward and reverse primers specific for an individual STR locus (TPOX, TH01, D7, D16, CSF1PO or Amelogenin); and 2) follow-on single stranded amplification (30 cycles) using either the forward or reverse template generating primer. Aliquots of the second amplification were then used in the subsequent melt curve reaction. This protocol was used to evaluate TPOX, TH01, D7, D16, CSF1PO using 30 samples. Reference STR genotypes generated by CE for the samples were obtained prior to dpFRET analysis (COFiler amplification, Applied Biosystems).
For TPOX and TH01, all 30 samples were typed correctly using the above described
protocols. Match melt peaks were observed for the probes corresponding to the alleles in the donor genotype. Amplification blanks were also tested with each of these loci in order to determine if contamination would be an issue due to the high number of amplification cycles used (80 cycles total). For TPOX, two amplification blanks were amplified and no contamination was observed. For TH01, three amplification blanks were amplified and contamination was detected in one of the blank samples.
For CSF1PO, correct genotypes were obtained for 29 of the 30 samples. For one
sample, the correct genotype was not obtained. The peaks for the probes that should have been positive for this sample were shifted to a slightly lower temperature and were therefore designated as mismatch peaks. It was initially thought that sequence variation (SNP) may have been causing the shift in these peaks. However, no SNPs were identified after sequencing this sample. The genotype for the discordant sample was a 7,8 and it was thought that the smaller size of the probe for these alleles was responsible for the shift in temperature. No contamination was observed in the three amplification blanks tested with CSF1PO.
This document is a research report submitted to the U.S. Department of Justice. This report has not been published by the Department. Opinions or points of view expressed are those of the author(s) and do not necessarily reflect the official position or policies of the U.S. Department of Justice.

23
While TPOX, TH01 and CSF1PO performed quite well using the provided protocol, a larger number of incorrect genotypes were obtained for D7 and D16. For D16, 49 out of 60 alleles (81.7%) were genotyped correctly. For D7, 51 out of 60 alleles (85%) were genotyped correctly. For the alleles that were not genotyped correctly, the peaks for the probes that should have been positive were shifted to a slightly lower temperature (~1°). As previously stated, sequencing analysis of the D7 samples revealed that all shifts/mismatches were due to sequence variation (SNPs).
During the initial evaluation of the loci by NCFS, several “false” match peaks were
observed. These minor match peaks appeared much lower in intensity and did not have the same appearance as a true match peak. These few false match peaks were typically observed for homozygous samples, occurring with the probe matching one allele less than the true allele. It was determined that the small match peaks were likely stutter peaks. These stutter peaks occurred relatively infrequently and only for certain loci. No stutter peaks were observed for TPOX, TH01 or CSF1PO. Three possible stutter peaks were observed for D16 and eight possible stutter peaks were observed for D7. The amount of stutter observed using the dpFRET protocol was then compared to the amount of stutter obtained for the same samples using COFiler (standard CE autosomal STR genotyping). A reduction in the amount of stutter was observed using the dpFRET protocol for both D7 (23% for COFiler and 19% for dpFRET) and D16 (51% for COFiler and 5% for dpFRET). This reduction in the amount of stutter could provide an advantage over standard autosomal STR genotyping for forensic samples (i.e. mixtures).
The original dpFRET genotyping strategy using allelic probes was also examined for
the ability to amplify multiple loci in a single reaction (i.e., multiplex) followed by successful probe hybridization for each individual locus. Figure 15 shows the results for singleplex (left panels) and multiplex reactions (right panels) for a combination of Amelogenin, TPOX and THO1. CE genotypes generated for each sample are listed in tables to the right of each figure set. The allelic probe used for testing is listed above each table with corresponding samples containing that allele highlighted. Melt curves appear to be highly reproducible for multiple markers amplified in a single reaction as compared to singleplex reactions. Similar results were also observed for a second multiplex consisting of combined loci D7, CSF1PO and D8 (Figure 16).
Enhanced dpFRET Protocol Development
Following fulfillment of the original specific aim of developing an allele specific
genotyping protocol, it was determined that alternative options for certain portions of the approach could be further optimized with subsequent transfer to a microfluidic subcircuit as a driving tenant. A number of parameters were explored including examination of the effect of different intercalating dyes, assay designs and additives that affect oligonucleotide probe melting and most importantly amplification protocol optimization. It was the results from this stage of exploratory work that contributed to the enhanced melt-based protocol significantly increasing the likelihood of transfer to the microfluidic subcircuits.
This document is a research report submitted to the U.S. Department of Justice. This report has not been published by the Department. Opinions or points of view expressed are those of the author(s) and do not necessarily reflect the official position or policies of the U.S. Department of Justice.

24
Amplification Protocol - Single Stage Conversion
The first step in protocol optimization focused primarily on simplifying the type and
number of amplification reactions with the goal of transferring a more simplistic approach to the microfluidic subcircuit. As opposed to CE analysis, probe hybridization strategies require the availability of a ‘template’ strand for probe interaction through asymmetric generation of amplification products. There are a number of approaches to achieve this goal but not all are easily transferable to a microfluidic environment. Some of the methods that were examined included dual stage amplification (one double stranded amplification followed by one single stranded amplification), a single asymmetric reaction, streptavidin coated beads and capture of biotinylated template strands and a number of other approaches (data not shown). Although various amplification strategies proved somewhat successful, the most optimal approach proved to be an enhanced version of the existing protocol.
The most successful optimized approach was based on 5’ phosphorylation of the
primer responsible for generation of the non-template strand followed by treatment with lambda exonuclease to degrade the strand competing for probe hybridization. Representative results for this approach applied to the TPOX locus for a homozygote (cross), heterozygotes (triangle) and a sample lacking the allele (smooth) are shown in Figure 17 for both lambda exonuclease treated and untreated samples. Using this approach, samples are amplified using a single 50 cycle three step amplification. This is then followed by brief incubation (30 minutes) with lambda exonuclease to eliminate the strand that competes for probe hybridization. ESB-FRET Alternative Probe Strategy – Allelic to Locus Probes
Following successful completion of allelic probe design and testing, it was determined that sufficient resources were available to explore an alternative approach for utilizing a single probe to genotype all alleles at a locus. Proceeding with an alternative design was supported by allelic probe results that displayed unique melt peaks for unmatched alleles (Figure 18 - peaks left of the hashed line). It became apparent that additional development would be required to increase resolution between allele melt peaks to generate successful genotypes using a single locus probe system.
To achieve this goal, a number of single probe modifications were explored
including the use of a limited number of modified nucleotides (amino dA, inosine, etc.) and numerous designs of both fluorophore labeled and unlabeled probes. Although incremental successes were achieved with variations of a single probe design, it was ultimately determined that a “blocker” probe approach produced the highest levels of required resolution. This method (Figure 19) utilizes an unlabeled blocker probe consisting of the smallest number of common repeats (i.e., five repeats for TPOX) for all alleles at a locus. The blocker probe is designed with a higher relative annealing temperature to partially block hybridization of a second fluorophore labeled probe denoted as a “signal” probe. Higher resolution between alleles is achieved through size
This document is a research report submitted to the U.S. Department of Justice. This report has not been published by the Department. Opinions or points of view expressed are those of the author(s) and do not necessarily reflect the official position or policies of the U.S. Department of Justice.
25
reduction of the signal probe/template complex. This approach proved superior to both the allelic probe system as well as other single probe alternatives investigated during development. Representative results are shown for TPOX in Figure 20.
Additional work on protocol development included optimization of reaction
components including primers, probes, SYBR Green I, etc. It was noticed during this development that the signal to noise ratio for the melt peaks was markedly reduced as compared to the results for individual allelic probes. An initial assessment by NCFS of the new two probe protocol using the reagents provided for the TPOX assay also resulted in marginally successful reduced signal. To initially evaluate the new TPOX protocol, NCFS selected eight samples that had been previously analyzed using the original dpFRET assay using individual allelic probes. A blank sample was also included to assess potential contamination issues that could arise from using 50 amplification cycles. From this limited set of samples only a few alleles were present amongst the genotypes (TPOX 8, 9, and 11) but appeared to be reproducible with each allele separated by approximately 2 degrees.
Although successful, the two probe (blocker-signal) approach resulted in low signal
to noise sometimes complicating genotype designations. An improvement to this approach was successfully designed and tested that included what is termed an “enhancer” probe (Figure 21). The enhancer probe consisted of an unlabeled probe that hybridized directly upstream of the signal probe and resulted in an increased melt peak signal for all samples tested through intercalation of additional SYBR Green dye. It is hypothesized that this additional dye subsequently donated additional FRET energy to the acceptor fluorophore on the signal probe increasing overall melt peak signal. Representative results for the optimized three probe (enhancer-signal-blocker) design for TPOX are shown in Figure 22. Initial reproducibility results for the approach were demonstrated by NCFS (Figure 23) and determined the optimized assay was sufficient to warrant further development.
Enhancer-Signal-Blocker FRET (ESB-FRET) was demonstrated to be a superior
approach to the original proposed dpFRET chemistry. However, the new three probe design required a redesigning of the original forward PCR primer to accommodate the enhancer probe (PowerPlex from Promega). This was accomplished by relocating the primer further upstream from the original sequence. In an effort to demonstrate more efficient amplification, the reverse primer was also redesigned and relocated further upstream from the original sequence resulting in a new mini-STR (Figure 24) that has shown successful amplification for all samples tested. Due to the small size of the amplification product (~ 200 bp), the amplification protocol was reduced from a three-step to a two-step amplification eliminating the extension step. This resulted in significant time savings with no discernable negative impact on signal strength.
Assay development work on the TPOX locus demonstrated an alternative approach
for genotyping all alleles at a locus using a single probe set, as opposed to the initial proposed approach of using multiple allele specific probes. The differences between the new ESB-FRET protocol (locus probe) and the original dpFRET protocol (allelic probes)
This document is a research report submitted to the U.S. Department of Justice. This report has not been published by the Department. Opinions or points of view expressed are those of the author(s) and do not necessarily reflect the official position or policies of the U.S. Department of Justice.
26
are detailed in Figure 25. It was apparent that by using this new approach it was possible to reduce assay cost and complexity and simplify transfer of the chemistry to a microfluidic environment. Results and subsequent design strategies proven successful for TPOX were applied and tested on four other loci including CSF1PO, D5, D7 and D13. Representative results for all five loci and Amelogenin are shown in Figures 26 through 31. The assays were transferred to both NCFS and Micronics and showed good reproducibility between laboratories (Figure 32) using different real-time PCR platforms. Additional work was also accomplished on protocol reagent optimization (Lambda exonuclease reaction, SYBR Green I and EDTA concentrations, etc.) resulting in enhanced assay performance (data not shown).
During the process of developing and testing probe designs for the four new loci a
limited number of samples for D5, D7 and D13 resulted in genotypes by melt curve analysis that did not match CE based genotypes. Similar to microvariant detection with the original dpFRET protocol, it was determined following sequencing that samples that exhibited microvariation could also be detected by the new enhanced ESB-FRET approach. SNPs either internal or directly adjacent to the repetitive region that were undetectable by CE were easily detected using the new method (Figures 33 and 34). This result suggests that a melt-based approach to STR genotyping has the potential to detect additional alleles based on SNPs within STR loci that is currently undetectable by CE. However, considering the stage of development for this technology and to simplify analysis an approach was used to mask the detection of these microvariant SNPs by incorporation of the universal base inosine at probe positions with known variants. This proved successful for generating good correlation with CE based genotyping for both microvariant and non-microvariant samples using a single probe set. Future development work beyond the current effort could incorporate more complex design and analysis strategies to include detection of these additional microvariant alleles thus increasing the power of resolution for loci that exhibit microvariation.
Aim 2—Design and Test Microfluidic Extraction and Archiving Cards
The objective of this specific aim was to develop an extraction protocol that eliminates carry over inhibitors following nucleic acid extraction from whole blood using the Micronics extraction subcircuit card and to examine the capability of archiving extracted DNA on card. A diagram of the extraction subcircuit card is shown in Figure 35. An optimized protocol was first compared to a commercial DNA extraction kit (Qiagen) and then used to demonstrate efficiency of DNA extraction from 50 microliters of whole blood dried on plastic. This was followed by testing the efficiency of the extraction protocol when dried blood is collected and rehydrated on a cotton swab and dried again to simulate collected evidence. To determine whether extracted DNA may be stored on the capture membrane of the extraction card for later use (i.e., archiving), a stability study was developed to test the viability of stored DNA after increasing periods of storage.
This document is a research report submitted to the U.S. Department of Justice. This report has not been published by the Department. Opinions or points of view expressed are those of the author(s) and do not necessarily reflect the official position or policies of the U.S. Department of Justice.

27
A series of experiments were undertaken to optimize the extraction of nucleic acid from whole blood samples without carryover inhibitors that affect downstream processing. Once protocol optimization was complete, two blood samples were extracted in triplicate on both the Micronics extraction subcircuit card and the commercially available Qiagen whole blood extraction kit in order to directly compare the extraction efficiency of each method. On-card extraction was performed according to protocols developed in-house and extractions performed with the Qiagen kits were performed according to the manufacturer’s protocol. Following extraction, samples were analyzed by qPCR using the ABI Quantifiler kit according to the published protocol and compared with the kit-provided standards.
When analyzed by qPCR using the ABI Quantifiler kit, on-card extractions yielded
similar amplification curves to extractions performed using the Qiagen kit. The average calculated concentration of nucleic acid obtained from the Micronics extraction card was slightly attenuated (~2 Cts) compared with the Qiagen extraction kit, but remained well within the observable range of the reaction (Table 2). Replicate data for all samples using either extraction condition were consistent.
In order to determine extraction efficiency of Micronics extraction card on dried
blood specimens, parallel extractions were performed on each of three days using the Qiagen QIAamp kit for comparison. Results were again analyzed using the ABI Quantifiler Kit and the following protocol:
• Dry 50 μl of blood on plastic surface overnight • Rehydrate blood with a cotton swab dipped in PBS • Extract on card using optimized protocol (see above) • Compare Quantifiler results to control extractions of fresh blood • Repeat same protocol for three consecutive days When analyzed by qPCR using the ABI Quantifiler kit, on-card extractions yielded
similar amplification curves to extractions performed using the Qiagen kit when extracting dried blood. Again, the average calculated quantity of nucleic acid obtained from the Micronics subcircuit card was slightly attenuated compared with Qiagen, but remained well within the observable range of the reaction. Replicate data for all samples using either extraction condition on each of three days were consistent. Results are shown in Figure 36.
In order to determine the extraction efficiency of Micronics’ extraction card on
blood specimens dried onto cotton swabs, parallel extractions were performed using Qiagen kits on each of three days using an optimized protocol performed in triplicate to assess reproducibility. The protocol consisted of the following:
• Dry 50 μl of blood on plastic surface for 24 hours • Soak a cotton swab in water and reabsorb dried blood • Dry swab overnight • Agitate swab in 150 μl diH2O
This document is a research report submitted to the U.S. Department of Justice. This report has not been published by the Department. Opinions or points of view expressed are those of the author(s) and do not necessarily reflect the official position or policies of the U.S. Department of Justice.
28
• Extract on card using optimized protocol • Extract parallel swabs using Qiagen (QIAamp DNA micro) • Analyze by qPCR using Quantifiler kit • Repeat same protocol for three consecutive days When analyzed by qPCR using the ABI Quantifiler kit, on-card extractions of blood
dried on a swab were further attenuated compared to extractions performed using the Qiagen kit when extracting blood dried on plastic alone. Both the Qiagen and on-card protocols yielded slightly varied quantities of total DNA with different blood samples, but all results remained well within the observable range of the reaction. Results are shown in Figure 37.
To determine whether extracted DNA may be stored on the capture membrane of the
extraction card for follow-on analysis, a stability study was developed to test the viability of stored DNA after increasing periods of storage. The following protocol was used to examine archiving efficiency:
• Micronics’ capture filters were fitted into Qiagen columns following removal of
original Qiagen filters • DNA was extracted from 50 ul replicate samples of whole blood by centrifugation
using Micronics’ extraction solutions and refitted Qiagen columns • Sufficient columns were loaded to provide for the following time points: 0 hours,
24 hours, 1 week, 2 weeks, 4 weeks and 2-18 months. • Time point 0 hour samples were eluted off the column immediately • Following the second wash step, the remaining columns were stored under
ambient conditions • At appropriate timepoints, DNA was eluted in triplicate and analyzed by qPCR DNA eluted off of the stored columns at each timepoint was analyzed using the
commercial Quantifier qPCR reaction kit. As shown in Figure 38, the increase in Crossing Threshold (Ct) value between the initial measurements (~27.5-28.5) to the 3-month value (~32) indicates an approximately 10-fold reduction in the amount of DNA recovered from the capture filter after storage. However, the data points obtained between months 3 and 18 of storage indicated that the samples are relatively stable, with the Ct measurement consistently obtained at ~31-32.
DNA eluted at all storage time points was analyzed for quality by DNA profiling
performed at NCFS according to standard laboratory protocol. Identical DNA profiles were obtained for all storage times (Figure 39), thereby confirming that DNA extracted and bound dry onto silica as employed by the Micronics’ extraction cartridge is an effective means to stabilize and archive DNA for later analysis.
Aim 3—Design and Test PCR and DNA Melt Cards Microchannel PCR Card
This document is a research report submitted to the U.S. Department of Justice. This report has not been published by the Department. Opinions or points of view expressed are those of the author(s) and do not necessarily reflect the official position or policies of the U.S. Department of Justice.

29
The two probe (Signal-Blocker) system that had demonstrated sufficiently acceptable results in Aim 1 were transferred to Micronics following the initial evaluation performed by NCFS. Using the TPOX assay protocol and reagents, Micronics performed PCR amplification on the pre-existing PCR microfluidic cartridge. Following amplification, the PCR product was removed from the cartridge manually and post-amplification processing (lambda exonuclease treatment, melt curve analysis) was performed on the bench using the provided protocol.
Allele peaks were observed for all bench-top and card-amplified reactions. It was
noted during early testing that the temperature at which the peak of interest was observed was shifted by as much as 6°C between the on-card and bench top reactions and peak signal to noise was low similar to results seen by NCFS for the two-probe (Signal-Blocker) system. Representative data for both bench top and on-card amplification is shown in Figure 40. Potential explanations for the shift between on-card and bench top reactions were not explored at this stage due to the transfer of the final optimized ESB-FRET protocol that demonstrated superior results.
Using the final ESB-FRET protocol and reagents, PCR reactions were performed on
the pre-existing PCR microfluidic cartridge. Following amplification, the PCR product was removed from the cartridge and post-amplification processing (lambda exonuclease, melt curve analysis) was performed on the bench-top. To confirm successful transfer of the protocol, initial work was completed to confirm the reproducibility of bench top results with those obtained by the two other collaborating groups. Representative data from these experiments are shown in Figure 41. A negative sample was also analyzed for all reactions (blue trace in each graph). Following bench top protocol testing, microfluidic cartridge-amplified products for the Amelogenin locus were subjected to exonuclease treatment and fluorescent probe analysis for comparison to the bench top data (Figure 42). The microfluidic cartridge amplified products yielded equivalent results to bench top amplified products demonstrating the feasibility of the microfluidic PCR subcircuit.
Additional feasibility studies for the PCR microfluidic cartridge were conducted to
examine the effects of the microfluidic environment on different Taq polymerase enzymes and shortening of the amplification protocol. Although sufficient results were demonstrated for transfer of the ESB-FRET protocol to the microfluidic subcircuit, the reactions were occasionally less intense relative to those observed for the bench top protocol. It has been previously observed that when reactions are transferred to the microfluidic domain, the specific Taq polymerase enzyme utilized is critical (unpublished data). Therefore, several alternative enzymes were screened to provide preliminary evidence that sourcing the best enzyme would enable more robust results once optimized in the next phase of development. New England Biolabs (NEB) formulations were identified as a promising candidate that showed more robust amplification within current microfluidic cartridges. In several cases, alleles that were weak or variable using the current enzyme amplified in sufficient quantities and generated stronger signals using the NEB formulation.
This document is a research report submitted to the U.S. Department of Justice. This report has not been published by the Department. Opinions or points of view expressed are those of the author(s) and do not necessarily reflect the official position or policies of the U.S. Department of Justice.
30
Additional feasibility studies performed examined the potential of using an alternative heating system for microfluidic PCR amplification. At the time that this project was initiated Micronics performed PCR by placing cartridges onto a peltier (TCU) heated surface. During the course of the project, and under an independent development effort, Micronics developed a method of performing PCR by fluidic transfer between two heated zones (two-zone amplification). This method has been incorporated into the current commercial instrument. Preliminary results showed that the two-zone protocol is compatible with the ESB-FRET protocol and will most likely significantly shorten the time for sample processing.
DNA Melt (Hybridization) Card
In an effort to demonstrate the capabilities of the existing microfluidic PanNAT
system previously developed by Micronics, minor modifications were necessary to adapt the instrument to process and detect a standard DNA melt curve. The PanNAT instrument was originally designed for end point molecular beacon detection. Although the detection zone contains a heater, melt curves have not been previously generated with the system. To modify the PanNAT instrument for melt curve analysis of ESB-FRET amplified product, this required changing of the instrument optical filter sets to match the excitation and emission requirements for the ESB-FRET probes (Figure 43). Micronics cartridges were constructed of low auto-fluorescent material and were embedded with a thermocouple to measure on-cartridge temperature. Micronics’ engineers wrote PC-based instrument data acquisition and analysis programs to collect and analyze temperature and fluorescence readings for subsequent melt curve analysis. Since the PanNAT instrument was originally designed with only a 35 second data acquisition time it was necessary to perform three thermal ramps to cover the full allelic range of 45° to 95°C. Data generated from these separate ramps were spliced together during the data analysis to form a single graph. Using this system for proof of principle, Micronics was able to measure representative melt curves for homozygous (Figure 44) and heterozygous (Figure 45) samples. This data supports the conclusion that the current PanNAT optical system is capable of being modified with both hardware and software enhancements to function for ESB-FRET melt curve detection.
On-card Lambda Exonuclease Reaction
During the ESB-FRET STR genotyping protocol amplified product is treated with
lambda exonuclease to generate single stranded template for probe hybridization and subsequent melt curve detection. In order to integrate all steps of the protocol in future development, it was necessary to demonstrate that the exonuclease reaction could be capable of functioning on-cartridge and that the enzyme could be dried down, stored and still maintain enzymatic activity. This was accomplished by combining the enzyme and amplified double stranded product to PCR microfluidic cartridge channels and incubation according to the existing protocol. Melt curves were then generated according to the standard bench top protocol using a real-time thermal cycler. Initial experiments utilized liquid enzyme and showed it to be functional and reactive within the channels (data not shown). Following these experiments, the enzyme was dehydrated using six alternative
This document is a research report submitted to the U.S. Department of Justice. This report has not been published by the Department. Opinions or points of view expressed are those of the author(s) and do not necessarily reflect the official position or policies of the U.S. Department of Justice.

31
formulations. After one and two week storage periods at ambient conditions, samples were tested for enzyme function following rehydration. The results indicated that the enzyme can be dried and stored for a minimum of two weeks and remain functional. For generation of more rapid results (sample-to-answer) shortening of the current incubation time for the enzyme (30 minutes) would also be optimal. It has been demonstrated that typical enzyme incubation times can often be reduced in a microchannel environment. Micronics has shown in other studies (unpublished data) that the microchannel exonuclease reaction can most likely be shortened to approximately two minutes. Additional studies would be required to support this conclusion. Aim 4—Develop and Validate System for Forensic Applications ESB-FRET Assay Precision
NCFS conducted an initial evaluation of the optimized ESB-FRET protocol that
included the use of inosine nucleotides for D7, D13 and D5 microvariant positions. Primers and probes for the following loci were evaluated: TPOX, CSF1PO, D5, D13, and D7. Amelogenin was also evaluated although no significant changes to this assay were made from the previous evaluation conducted using the original dpFRET designs. For each of the loci, a range of different genotypes from a set of previously typed 100 samples (genotypes determined by standard STR profiling using the Identifiler amplification kit) were chosen. The samples were amplified using the ESB-FRET protocol and expected genotypes compared. Any samples where a genotype was not recovered or did not appear to have worked properly were re-amplified. Initially, the melt temperatures were recorded for each of the obtained alleles and precision graphs constructed in order to determine the temperature range for each allele (Figures 46 through 50).
As with previous versions of the assay, there was a sufficient separation of smaller
alleles. However, as the allele number increased the separation between alleles ranges decreased. For some loci, the allele ranges for some of the larger alleles overlapped making correct genotyping of these alleles difficult. Once the allele ranges were determined, each individual sample was examined to ensure that the correct genotypes were obtained. Again it was noted that it was difficult to genotype heterozygote samples with (n, n+1) genotypes. Each of the (n, n+1) genotypes was graphed next to homozygote or heterozygote samples containing each of the alleles to examine peak morphology and genotype recovery (Figure 51). For most of the loci, two alleles were successfully called by the software for genotypes that contained the smaller alleles. However, as the size of the alleles increased, the peak morphology changed to a broader peak with a small shoulder. This indicated that possibly another allele was present since the peak morphology was sufficiently different from a true homozygote. The software does not call these “shoulders” and therefore the sample would have to be manually called. As the allele size got even larger, the peak became broad and no shoulder could be identified.
This document is a research report submitted to the U.S. Department of Justice. This report has not been published by the Department. Opinions or points of view expressed are those of the author(s) and do not necessarily reflect the official position or policies of the U.S. Department of Justice.

32
The inability to correctly determine heterozygote (n, n+1) genotypes with the larger alleles is a limitation of the current assay.
We also examined the reproducibility of the same samples between runs with a
number of limited samples. For several of the loci there was a 0.5 – 2.0° shift in temperatures between the two runs. While this would not be problem for the smaller alleles with sufficient differences in allele temperature ranges, this might be a problem for the larger alleles where there is not much separation between different alleles. More detailed reproducibility studies would be needed to determine the extent of any potential typing problems.
Sensitivity
In order to evaluate the sensitivity of the ESB-FRET assay, a range of input DNA
amounts (5pg, 25pg, 50pg, 100pg, 250pg, 500pg, and 1ng) was amplified. This range of input amounts was used to evaluate genotype recovery at each of the five loci (TPOX, D5, CSF1PO, D13 and D7) and Amelogenin. Three males were included for the evaluation of each STR locus in order to evaluate all possible individual genotype possibilities ((homozygote, heterozygote (n,n+1 consecutive alleles), heterozygote (non-consecutive alleles)).
Genotypes were obtained at all loci using as little as 25pg of input DNA (Figure 52
and Table 3). The strength of the melt curve signal obtained did not appear to diminish as lower input amounts were amplified (Figure 52) indicating the possible suitability of use of the ESB-FRET assays with low template DNA samples. Additionally, partial and complete genotypes were obtained for several loci using 5pg of input DNA. However, with the exception of CSF1PO, consistent results across the three genotype types were not obtained using this small amount of input DNA. With further optimization, it is possible that 5pg of input DNA may be reproducibly amplified. Additional studies would also need to be performed using a larger sample set (n=3 for each locus tested in this study) in order to demonstrate the reproducibility of the observed sensitivity level. A sensitivity range of 5-25pg would be an improvement over STR amplification kits using standard amplification conditions.
Despite the observed sensitivity of the ESB-FRET assay, the genotypes were still
affected by the inability to resolve consecutive allele genotypes (n,n+1) at several loci (TPOX, CSF1PO, D7, and D13), Additional assay optimization would be required for these loci in order to allow for successful recovery of (n,n+1) genotypes. The successful recovery of (n,n+1) genotypes for D5 indicate the potential to improve the resolution of (n,n+1) genotypes (Figure 52). Both alleles of an 11,12 genotype were successfully detected across the full input range, including 5pg of input DNA.
Mixtures
Mixture samples were evaluated with all 5 loci: TPOX, D5, CSF1PO, D13 and D7.
Three samples were tested for each locus: 1) two homozygotes (non-overlapping alleles);
This document is a research report submitted to the U.S. Department of Justice. This report has not been published by the Department. Opinions or points of view expressed are those of the author(s) and do not necessarily reflect the official position or policies of the U.S. Department of Justice.

33
2) two heterozygotes (one allele shared between donors), 3) two heterozygotes (non-overlapping alleles). For each locus that was evaluated, the mixture samples consisted of 1:1 and 3:1 ratios using a total of 2 nanograms for each amplification.
Representative mixture data for TPOX is illustrated in Figure 53 with the 1:1 and
3:1 ratio for each sample type. The alleles that were called are indicated. For some samples it appeared the allele was present but was not necessarily called by the software. In general, most of the two homozygote non-overlapping samples worked fairly well for all loci tested. For some of the 3:1 mixtures you can see the difference in signal intensity between the major and minor alleles. Three allele patterns were observed for some of the heterozygote over-lapping samples. Melt patterns became increasingly complicated for heterozygotes with non-overlapping alleles.
Stutter
A comprehensive stutter study was not performed using the ESB-FRET protocol as
was done with the original dpFRET assay. Stutter peaks were not as readily observable using this assay design as was previous found with the original assay. However, given the difficulty with discerning (n, n+1) genotypes using the ESB-RET assay, it is not clear yet whether stutter peaks are truly absent or whether they simply fail to be detected due to the particular samples used and the confounding effects of the aforementioned (n, n+1) genotypes. It is recognized that the elimination of observed stutter peaks would result in an improved ability to identify and interpret true admixed DNA samples frequently encountered in forensic casework. The nature and incidence of stutter encountered with the ESB-FRET assay warrants further detailed study. Microfluidic Extraction Card Evaluation
In order to initially test the on-card extraction protocols, we tested bloodstains of
various sizes (0.2µl, 1µl, 5µl and 10µl) from 10 donors. Liquid blood from each donor was deposited onto stain cards using the four different volumes. One bloodstain of each volume size was extracted from each of the 10 donors using both the Micronics on-card extraction and also the Qiagen DNA Investigator kit (silica-column based) for comparison. All samples were quantitated with the Quantifiler Human Real-Time PCR kit (Applied Biosystems). The total average DNA yield was determined per bloodstain size (Figure 54). As expected, an increase in DNA yield was observed for both approaches as the size of the bloodstain increased. For each bloodstain volume a higher yield was obtained from the samples extraction with the Qiagen DNA Investigator kit. It was decided that extracts from both the on-card and Qiagen extractions for five donors (four bloodstain sizes each) would be amplified using the Identifiler kit (Applied Biosystems) in order to compare genotype recovery from both extraction types. Attempts were made to use 350-500pg per amplification reaction. For those samples with low or no detectible DNA quantities, the maximum volume of extract was used (5µl). For all bloodstain volumes, full profiles were obtained for the Qiagen extracts. While full profiles were not always obtained from the on-card extracted samples, partial and some full profiles were obtained using 1 µl – 10 µl bloodstains. Based on the current on-card
This document is a research report submitted to the U.S. Department of Justice. This report has not been published by the Department. Opinions or points of view expressed are those of the author(s) and do not necessarily reflect the official position or policies of the U.S. Department of Justice.

34
extraction protocol, it appeared that 5 – 10 µl bloodstains would provide sufficient results for on-card extraction when genotyped using the Identifiler kit.
The extracted blood stains were subsequently tested with the ESB-FRET assay in
order to demonstrate the ability to obtain genotypes from on-card extracted samples. TPOX and D5 were the loci selected for this study. Genotypes were successfully recovered from all 5 and 10 µl bloodstains extracted with both the on-card protocol and the Qiagen DNA Investigator kit (Table 4). This is consistent with the genotypes recovered from these samples after amplification with the Identifiler kit (see above). While genotypes were still recovered from some of the 0.2 and 1 µl samples using the on-card extraction protocol, there was more variability in recovery and accuracy of the genotypes (Table 4).
Further optimization of the on-card extraction protocol could improve the results
obtained from smaller bloodstains. The current ESB-FRET protocol utilizes 2 µl of extract to be added to the amplification. However, for many of the 0.2 and 1 µl bloodstains extracted with the on-card protocol, the quantity was below the detection limits of the Quantifiler Human assay. Therefore, it may be possible to improve genotype recovery from these samples if increased extract volumes were used in the ESB-FRET assay. Additionally, the on-card extraction protocol used in this study did not include an optimized initial lysis step. The DNA investigator kit includes an initial lysis at 56°C for at least one hour. This step of the on-card extraction protocol has not been optimized in terms of temperature or length of extraction. Therefore, there is potential to possibly significantly improve the amount of DNA recovered from dried bloodstains using the developed on-card extraction protocol with further optimization.
PCR Amplification Card Evaluation
The work conducted by NCFS was focused on testing and evaluation of the developed dpFRET and ESB-FRET protocols. Sufficient time was not available to permit an evaluation of the on-card PCR amplification protocol by NCFS. All on-card amplification work was therefore performed by Micronics and is detailed in the Aim 3 results section. CONCLUSIONS Implications for Policy and Practice
The ability to provide crime scene investigators with a simple, rapid, and cost effective system for preliminary STR-based prescreening of multiple samples at the scene would be an invaluable tool for the determination of the probative value of crime scene evidence (victim vs. non-victim) and could potentially contribute to the effectiveness of the investigation. Source identification of samples at the crime scene would not only reduce the number of samples sent to the lab by eliminating samples derived from the victim, but could also provide immediate information to the investigator concerning the source of each stain. This approach would contribute timely information at the scene that
This document is a research report submitted to the U.S. Department of Justice. This report has not been published by the Department. Opinions or points of view expressed are those of the author(s) and do not necessarily reflect the official position or policies of the U.S. Department of Justice.

35
could accelerate the pace of an investigation through sample source attribution and simultaneously provide a smaller more effective subset of samples to the forensic laboratory for complete analysis. The limitations of current technologies for crime scene genotyping include complexity, cost, speed and most importantly the need for extensively trained personnel. Development of a microfluidic system that incorporates ESB-FRET melt-based analysis has the potential to overcome many of these obstacles and aids in the transfer of rapid forensic DNA prescreening capabilities to crime scene investigators.
Development and preliminary validation work accomplished through this phase of
funding has provided an assay with minimal potential for artifacts, increased sensitivity and ease of transfer to a microfluidic platform. The ESB-FRET sequence-based approach to STR genotyping was also demonstrated to be able to detect microvariants that have the potential to increase the power of discrimination for loci that display this characteristic. This is primarily due to the ability to detect SNPs in alleles that are equal in size and hence undetectable by CE. The ability to use the same chemistry, melt approach and developed platform for both STR and SNP genotyping provides a capability not currently demonstrated by any other approach.
Successful microfluidic processing of the assay steps (extraction, amplification and
melt curve analysis) provides a high confidence that integration of these steps within a single cartridge is possible. This will permit a minimized amount of additional training for crime scene analysts (as compared to extensive training necessary for laboratory personnel) beyond basic evidentiary sampling strategies already in place. Demonstration of the archiving capabilities of the system (signature stability for a minimum of 18 months) heralds a new concept for crime scene analysis. By stabilizing extracted samples on-card, this expedites follow-on laboratory analysis by eliminating the need for sample re-extraction while maintaining strict transfer of evidence protocols. Overall, the success of the research demonstrated in this first developmental and pre-validation phase of funding has provided an exciting new development in forensic biology by potentially providing a capability not currently available to crime scene investigators. Implications for Further Research
Successful completion of Phase I aimed at development and validation of a crime scene instrument based on a melt-based STR genotyping assay combined with a microfluidic platform has demonstrated the feasibility of the methodology and subcircuit designs. The next phase (Phase II) would integrate all steps within an injection molded cartridge and modest modifications to and manufacture of the instrument. Micronics is already developing similar systems for infectious disease diagnostics (HIV, respiratory disease panel, fever diagnosis from blood, enteric pathogen panel) that will provide valuable experience for the next phase of development. For the fever panel, for example, Micronics participated in a $15.4 million development effort funded by the Bill and Melinda Gates Foundation. For this project, Micronics partnered with Invetech Pty Ltd (a Danaher company) for instrument design and manufacturing, and transferred the integrated cartridge design that incorporates DNA extraction, PCR, and optical detection to a tooled disposable. Fully functional alpha prototype tooled cartridges and base
This document is a research report submitted to the U.S. Department of Justice. This report has not been published by the Department. Opinions or points of view expressed are those of the author(s) and do not necessarily reflect the official position or policies of the U.S. Department of Justice.

36
instrument are already in production for this effort. Additionally, Micronics is advancing the PanNAT system; a unique point of care nucleic acid assay-based system for infectious disease diagnosis. Based on current production estimates we anticipate that the selling price for this system would be under $10,000 for the field portable instrument and approximately $10 per disposable card.
The next phase of development would entail integrating all steps that were shown to
fluidically operate in the existing subcircuit cartridges into a single injection molded cartridge. It would also entail revisions as needed to the PanNAT field portable instrument (Figure 55), including software modifications to enable autonomous melt curve analysis, and testing of the integrated cartridges on this point of care system. The PanNAT instrument is presently in beta stage (TRL-5) development and is uniquely configured to permit crime scene testing as point of care with system modifications for the ESB-FRET forensic assay. The PanNAT instrument is being developed independently by Micronics for clinical PCR-based infectious disease testing. It includes an integrated cartridge design that processes all of the reagents and steps of nucleic acid extraction, PCR amplification, and end point fluorescence signal detection. In order to enable battery-powered operation in the field, Micronics invented a low power, two-zone method for PCR. The instrument is battery and/or AC powered, portable (weight ~ 8 pounds) and provides all of the software for processing the assay, qualitative result detection, and graphic presentation to the screen. Fluidic movement, reagent presentation, heat cycling, and optical detection are accomplished by the interface of the cartridge and instrument. The instrument is Wi-Fi-enabled and operates on a .net framework. It can be powered by battery for up to eight hours of testing. The battery can be re-charged from power mains, car battery or solar power cells. After the user has applied the sample to the cartridge, the cartridge is inserted into the instrument. The user presses “start” and is guided through an easily followed screen of instructions. The software architecture for the instrument has built-in controls, including barcode read and other system checks, data analysis and service. The final stages of assay development and subcircuit integration comprise the final step to produce a truly portable system for crime scene genotyping.
This document is a research report submitted to the U.S. Department of Justice. This report has not been published by the Department. Opinions or points of view expressed are those of the author(s) and do not necessarily reflect the official position or policies of the U.S. Department of Justice.

37
REFERENCES 1. Pourmand N, Caramuta S, Villablanca A, Mori S, Karhanek M, Wang SX, Davis RW.
Branch migration displacement assay with automated heuristic analysis for discrete DNA length measurement using DNA microarrays. Proc Natl Acad Sci U S A. 2007 Apr 10;104(15):6146-51.
2. Kemp JT, Davis RW, White RL, Wang SX, Webb CD. A novel method for STR-based DNA profiling using microarrays. J Forensic Sci. 2005 Sep;50(5):1109-13.
3. Radtkey R, Feng L, Muralhidar M, Duhon M, Canter D, DiPierro D, Fallon S, Tu E, McElfresh K, Nerenberg M, Sosnowski R. Rapid, high fidelity analysis of simple sequence repeats on an electronically active DNA microchip. Nucleic Acids Res. 2000 Apr 1;28(7):E17.
4. Butler JM, Li J, Shaler TA, Monforte JA, Becker CH. Reliable genotyping of short tandem repeat loci without an allelic ladder using time-of-flight mass spectrometry. Int J Legal Med. 1999;112(1):45-9.
5. Yeung SH, Greenspoon SA, McGuckian A, Crouse CA, Emrich CA, Ban J, Mathies RA. Rapid and high-throughput forensic short tandem repeat typing using a 96-lane microfabricated capillary array electrophoresis microdevice. J Forensic Sci. 2006 Jul;51(4):740-7.
6. Liu P, Seo TS, Beyor N, Shin KJ, Scherer JR, Mathies RA. Integrated portable polymerase chain reaction-capillary electrophoresis microsystem for rapid forensic short tandem repeat typing. Anal Chem. 2007 Mar 1;79(5):1881-9.
7. Horsman KM, Bienvenue JM, Blasier KR, Landers JP. Forensic DNA analysis on microfluidic devices: a review. J Forensic Sci. 2007 Jul;52(4):784-99. Review.
8. Dietmaier W, Hofstädter F. Detection of microsatellite instability by real time PCR and hybridization probe melting point analysis. Lab Invest. 2001 Oct;81(10):1453-6.
9. Kartalov EP, Anderson WF, Scherer A. The analytical approach to polydimethylsiloxane microfluidic technology and its biological applications. J Nanosci Nanotechnol. 2006 Aug;6(8):2265-77. Review.
10. Yager P, Edwards T, Fu E, Helton K, Nelson K, Tam MR, Weigl BH. Microfluidic diagnostic technologies for global public health. Nature. 2006 Jul 27;442(7101):412-8. Review.
11. Whitesides GM. The origins and the future of microfluidics. Nature. 2006 Jul 27;442(7101):368-73. Review.
12. Weigl BH, Bardell RL, Kesler N, Morris CJ. Lab-on-a-chip sample preparation using Laminar Fluid Diffusion Interfaces - Computational Fluid Dynamics Model Results and Fluidic Verification Experiments. SPIE BIOS 2001, 4265-02, 2001.
13. Weigl BH. Microfluidics-based lab-on-a-chip systems. IVD Technology Nov/Dec 2000, vol 6: pp.47-53, 2000.
14. Kamholz A, Weigl BH, Finlayson BA, Yager P. Quantitative Analysis of Molecular Interaction in a Microfluidic Channel: the T-Sensor. Anal. Chem. Vol 71, part 23, Dec 15, 1999.
15. Weigl BH, Bardell RL, Schulte TH, Battrell CF, Hayenga J. Design and Rapid Prototyping of Thin-Film Laminate-Based Microfluidic Devices. Biomedical Microdevices 2001, Vol. 3:4 pp 267-274, 2001, Kluwer Academic Publishers.
This document is a research report submitted to the U.S. Department of Justice. This report has not been published by the Department. Opinions or points of view expressed are those of the author(s) and do not necessarily reflect the official position or policies of the U.S. Department of Justice.

38
16. Weigl BH, Yager P. Microfluidic Diffusion-Based Separation and Detection. Science,15:346-347, January 1999.
17. Weigl BH, Hixon GT, Kenny MA, Zebert D, Dwinnel S, Buj T, Yager P. Fluorescence and absorption analyte sensing in whole blood based on diffusion separation in silicon-microfabricated flow structures (T-SensorsTM). Biomedical Optics, Vol. 6, No.1, 1997.
18. Weigl BH, Bardell RL, Cabrera CR. Lab-on-a-chip for drug development. Adv Drug Deliv Rev. 2003 Feb 24;55(3):349-77. Review.
19. Schulte TH, Bardell RL, Weigl BH. Microfluidic technologies in clinical diagnostics. Clin Chim Acta. 2002 Jul;321(1-2):1-10. Review.
20. Weigl BH, Bardell RL, Kesler N, Morris CJ. Lab-on-a-chip sample preparation using laminar fluid diffusion interfaces--computational fluid dynamics model results and fluidic verification experiments. Fresenius J Anal Chem. 2001 Sep;371(2):97-105.
21. Lancaster, C., Kokoris, M. Nabavi, M., Clemmens, J., Maloney, P., Capadanno, J., Gerdes, J., Battrell, C.F. Rare Cancer Cell Analyzer for Whole Blood Applications : microcytometer cell counting and sorting subcircuits. Methods, Vol. 37, Issue 1, Sept 2005, pgs 120-127.
22. Kokoris, M., Nabavi, M., Lancaster, C., Clemmens, J., Maloney, P., Capadanno, J., Gerdes, J., Battrell, C.F. Rare cancer cell analyzer for whole blood applications: automated nucleic acid purification in a microfluidic disposable card. Methods. 2005. Sep;37(1):114-9.
23. Gerdes, J.C. Near patient microfluidic rare cell detection : a paradigm shift in flow cytometry. 2006. Clinical Laboratory International June; 30: 16-18.
This document is a research report submitted to the U.S. Department of Justice. This report has not been published by the Department. Opinions or points of view expressed are those of the author(s) and do not necessarily reflect the official position or policies of the U.S. Department of Justice.

39
DISSEMINATION OF RESEARCH FINDINGS
Early developmental work using the dpFRET allele-specific approach was published in the Journal of Forensic Sciences under the following citation:
Halpern MD, Ballantyne J. An STR Melt Curve Genotyping Assay for Forensic Analysis Employing an Intercalating Dye Probe FRET. J Forensic Sci. 2010 Sep 14. doi: 10.1111/j.1556-4029.2010.01549.x. [Epub ahead of print] Posters detailing different stages of the research were presented at the NIJ 2009 and
NIJ 2010 annual conferences (Arlington, Virginia). A poster was also presented at the 20th International Symposium on Human Identification 2009 in Las Vegas, Nevada. A presentation was given at the European Network of Forensic Science Institutes (ENFSI) DNA Working Group meeting 2010, the Hague, Netherlands.
This document is a research report submitted to the U.S. Department of Justice. This report has not been published by the Department. Opinions or points of view expressed are those of the author(s) and do not necessarily reflect the official position or policies of the U.S. Department of Justice.

40
FIGURES
Figure 1. Original dpFRET Design Strategy. An example of dpFRET STR hybridization-based genotyping of a TPOX 9 repeat allele is shown. Mismatches result from incomplete hybridization causing a shift in the template/probe melting temperature. Heterozygotes result in two melt peaks composed of both matched and mismatched alleles.
This document is a research report submitted to the U.S. Department of Justice. This report has not been published by the Department. Opinions or points of view expressed are those of the author(s) and do not necessarily reflect the official position or policies of the U.S. Department of Justice.

41
Figure 2. dpFRET Results for a Serially Diluted Sample. Serial 10-fold dilutions of buccal swab extract for a homozygote and heterozygote were tested with a TPOX 8 repeat probe and showed equivalent fluorescent signal across the dilution series. Little difference in signal intensity between dilutions was observed for both alleles (match and mismatch) within the heterozygote sample (red).
This document is a research report submitted to the U.S. Department of Justice. This report has not been published by the Department. Opinions or points of view expressed are those of the author(s) and do not necessarily reflect the official position or policies of the U.S. Department of Justice.

42
Figure 3. CSF1PO (12 allele probe)
Figure 4. THO1 (9.3 allele probe)
Figure 5. TPOX (8 allele probe)
This document is a research report submitted to the U.S. Department of Justice. This report has not been published by the Department. Opinions or points of view expressed are those of the author(s) and do not necessarily reflect the official position or policies of the U.S. Department of Justice.

43
Figure 6. D3 (18 allele probe)
Figure 7. D5 (11 allele probe)
Figure 8. D7 (12 allele probe)
This document is a research report submitted to the U.S. Department of Justice. This report has not been published by the Department. Opinions or points of view expressed are those of the author(s) and do not necessarily reflect the official position or policies of the U.S. Department of Justice.

44
Figure 9. D8 (13 allele probe)
Figure 10. D13 (11 allele probe)
Figure 11. D18 (12 allele probe)
This document is a research report submitted to the U.S. Department of Justice. This report has not been published by the Department. Opinions or points of view expressed are those of the author(s) and do not necessarily reflect the official position or policies of the U.S. Department of Justice.

45
Figure 12. AMELOGENIN (Y allele probe)
This document is a research report submitted to the U.S. Department of Justice. This report has not been published by the Department. Opinions or points of view expressed are those of the author(s) and do not necessarily reflect the official position or policies of the U.S. Department of Justice.

46
Figure 13. D7 8 allele microvariant 6C>T detected by dpFRET. Two samples determined to be an 8,10 genotype by CE, JCCL 10 (triangle) and JCCL 13 (smooth), were tested by dpFRET with a D7 8 repeat allele probe (upper panel). JCCL 10 showed no match and was subsequently sequenced (center panel) and a mixed position was detected in the flank. Probes specific for the upstream (lower left panel) and downstream flank (lower right panel) showed a mismatch with the 8 allele probe in the upstream flank.
This document is a research report submitted to the U.S. Department of Justice. This report has not been published by the Department. Opinions or points of view expressed are those of the author(s) and do not necessarily reflect the official position or policies of the U.S. Department of Justice.

47
Figure 14. D7 8 allele microvariant C>T and T>A detected by dpFRET. Two samples determined to be an 8,11 genotype by CE, JCCL 12 (triangle) and JCCL 8 (smooth), were tested by dpFRET with a D7 8 repeat allele probe (upper panel). JCCL 10 showed no match and was subsequently sequenced (center panel) and two mixed positions were detected in the flank sequences. Probes specific for the upstream (lower left panel) and downstream flank (lower right panel) both showed a mismatch for tested flank probes.
This document is a research report submitted to the U.S. Department of Justice. This report has not been published by the Department. Opinions or points of view expressed are those of the author(s) and do not necessarily reflect the official position or policies of the U.S. Department of Justice.

48
Figure 15. Multiplex 1: Amelogenin + TPOX + THO1. Loci were amplified in either singleplex (left panels) or multiplex (right panels) reactions and alleles specified above each table were detected according to standard dpFRET protocol.
This document is a research report submitted to the U.S. Department of Justice. This report has not been published by the Department. Opinions or points of view expressed are those of the author(s) and do not necessarily reflect the official position or policies of the U.S. Department of Justice.

49
Figure 16. Multiplex 2: D7 + CSF1PO + D8. Loci were amplified in either singleplex (left panels) or multiplex (right panels) reactions and alleles specified above each table were detected according to standard dpFRET protocol.
This document is a research report submitted to the U.S. Department of Justice. This report has not been published by the Department. Opinions or points of view expressed are those of the author(s) and do not necessarily reflect the official position or policies of the U.S. Department of Justice.

50
Figure 17. Generation of single stranded template for hybridization by lambda exonuclease treatment. Protocol consisted of a 50 cycle standard PCR amplification utilizing a 5’ phosphate labeled primer for the non-template strand. This was followed by treatment both with (top panel) and without (bottom panel) lambda exonuclease and standard dpFRET allele detection.
This document is a research report submitted to the U.S. Department of Justice. This report has not been published by the Department. Opinions or points of view expressed are those of the author(s) and do not necessarily reflect the official position or policies of the U.S. Department of Justice.

51
Figure 18. dpFRET TPOX 11 Repeat Probe Differential Mismatch Peak Profiles Samples containing genotypes (8,8), (8,9), (8,10), (8,12), (10,12), (8,11), and (9,11) were tested with a TPOX 11 repeat probe. Melt curves generated in the mismatched region of the graph (left of the hashed line) appear to be indicative of allelic content. Generalized regions for mismatch melting of each allele are indicated above the graph.
This document is a research report submitted to the U.S. Department of Justice. This report has not been published by the Department. Opinions or points of view expressed are those of the author(s) and do not necessarily reflect the official position or policies of the U.S. Department of Justice.

52
Figure 19. TPOX Combined “Blocker” and “Signal” Probe Design Approach.
This document is a research report submitted to the U.S. Department of Justice. This report has not been published by the Department. Opinions or points of view expressed are those of the author(s) and do not necessarily reflect the official position or policies of the U.S. Department of Justice.

53
Figure 20. TPOX Combined “Blocker” and “Signal” Probe Results for Individual Genotypes (8,9), (8,10), (8,11), and (8,12).
This document is a research report submitted to the U.S. Department of Justice. This report has not been published by the Department. Opinions or points of view expressed are those of the author(s) and do not necessarily reflect the official position or policies of the U.S. Department of Justice.

54
Figure 21. TPOX Combined “Enhancer,” “Signal,” and “Blocker” Probe Design
This document is a research report submitted to the U.S. Department of Justice. This report has not been published by the Department. Opinions or points of view expressed are those of the author(s) and do not necessarily reflect the official position or policies of the U.S. Department of Justice.
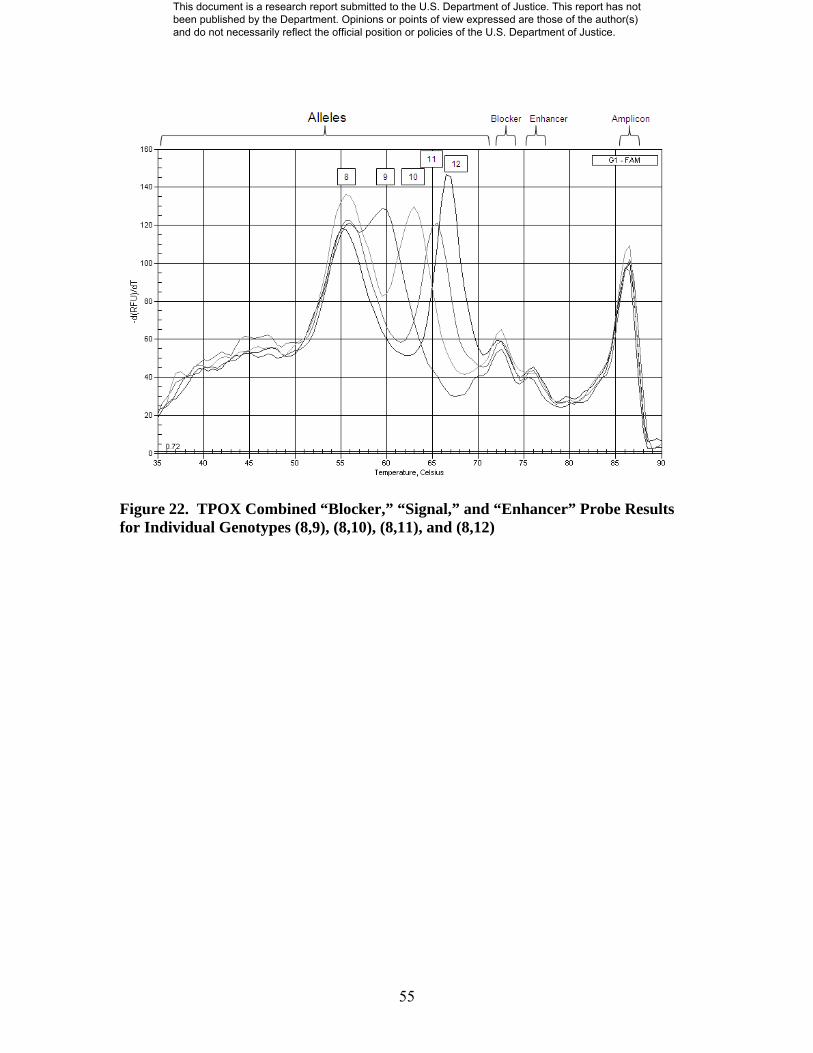
55
Figure 22. TPOX Combined “Blocker,” “Signal,” and “Enhancer” Probe Results for Individual Genotypes (8,9), (8,10), (8,11), and (8,12)
This document is a research report submitted to the U.S. Department of Justice. This report has not been published by the Department. Opinions or points of view expressed are those of the author(s) and do not necessarily reflect the official position or policies of the U.S. Department of Justice.

56
Figure 23. Initial Reproducibility for TPOX Combined “Blocker,” “Signal,” and “Enhancer” Probe Results for Genotypes 2 x (8,8), 2 x (8,10), and 3 x (8,11)
This document is a research report submitted to the U.S. Department of Justice. This report has not been published by the Department. Opinions or points of view expressed are those of the author(s) and do not necessarily reflect the official position or policies of the U.S. Department of Justice.

57
Figure 24. TPOX Mini-STR Primer Designs Original CODIS primers taken from the PowerPlex system (designated as “CODIS”), new mini-STR primer and probe designs are illustrated.
This document is a research report submitted to the U.S. Department of Justice. This report has not been published by the Department. Opinions or points of view expressed are those of the author(s) and do not necessarily reflect the official position or policies of the U.S. Department of Justice.

58
Figure 25. Assay development and optimization from allele specific genotyping (dpFRET) to locus specific genotyping (ESB-FRET). Multiple improvements to the protocol were implemented to improve both workflow and facilitate transfer to the microfluidic platform.
This document is a research report submitted to the U.S. Department of Justice. This report has not been published by the Department. Opinions or points of view expressed are those of the author(s) and do not necessarily reflect the official position or policies of the U.S. Department of Justice.

59
Figure 26. Representative melt curve data for the TPOX locus. Anonymous buccal swabs representing a suite of many of the potential alleles showed equivalent results with standard CE genotyping (ABI AmpFlSTR COFiler). Peaks for homozygotes (cross) and heterozygotes (smooth) are shown. Approximate melt peak positions for select alleles (6, 8, 9, 10, 11 and 12) are labeled.
This document is a research report submitted to the U.S. Department of Justice. This report has not been published by the Department. Opinions or points of view expressed are those of the author(s) and do not necessarily reflect the official position or policies of the U.S. Department of Justice.

60
Figure 27. Representative melt curve data for the CSF1PO locus. Anonymous buccal swabs representing a suite of many of the potential alleles showed equivalent results with standard CE genotyping (ABI AmpFlSTR COFiler). Peaks for homozygotes (cross) and heterozygotes (smooth) are shown. Approximate melt peak positions for select alleles (7 through 14) are labeled.
This document is a research report submitted to the U.S. Department of Justice. This report has not been published by the Department. Opinions or points of view expressed are those of the author(s) and do not necessarily reflect the official position or policies of the U.S. Department of Justice.

61
Figure 28. Representative melt curve data for the D5S818 locus. Anonymous buccal swabs representing a suite of some potential alleles showed equivalent results with standard CE genotyping (ABI AmpFlSTR COFiler). Peaks for homozygotes (cross) and heterozygotes (smooth) are shown. Approximate melt peak positions for select alleles (11 through 13) are labeled.
This document is a research report submitted to the U.S. Department of Justice. This report has not been published by the Department. Opinions or points of view expressed are those of the author(s) and do not necessarily reflect the official position or policies of the U.S. Department of Justice.

62
Figure 29. Representative melt curve data for the D7S820 locus. Anonymous buccal swabs representing a suite of many potential alleles showed equivalent results with standard CE genotyping (ABI AmpFlSTR COFiler). Peaks for homozygotes (cross) and heterozygotes (smooth) are shown. Approximate melt peak positions for select alleles (8 through 12) are labeled.
This document is a research report submitted to the U.S. Department of Justice. This report has not been published by the Department. Opinions or points of view expressed are those of the author(s) and do not necessarily reflect the official position or policies of the U.S. Department of Justice.

63
Figure 30. Representative melt curve data for the D13S317 locus. Anonymous buccal swabs representing a suite of many potential alleles showed equivalent results with standard CE genotyping (ABI AmpFlSTR COFiler). No homozygotes were available for testing and heterozygotes (smooth) are shown. Approximate melt peak positions for select alleles (8 through 14) are labeled.
This document is a research report submitted to the U.S. Department of Justice. This report has not been published by the Department. Opinions or points of view expressed are those of the author(s) and do not necessarily reflect the official position or policies of the U.S. Department of Justice.

64
Figure 31. Representative melt curve data for the Amelogenin locus. Anonymous buccal swabs for both male (cross) and female (smooth) samples showed equivalent results with standard CE genotyping (ABI AmpFlSTR COFiler).
This document is a research report submitted to the U.S. Department of Justice. This report has not been published by the Department. Opinions or points of view expressed are those of the author(s) and do not necessarily reflect the official position or policies of the U.S. Department of Justice.

65
Figure 32. Lab to lab assay reproducibility. Representative melt curve data for D13S317 generated by Micronics (Top panels) and D5S818 generated by NCFS (Bottom panels) using bench top protocols is shown. Platforms used for melt curve analysis included the Rotorgene 6000 (Micronics) and the Bio-Rad MyiQ (NCFS). Micronics data (Top panels) include both sample and no template control melt curves.
This document is a research report submitted to the U.S. Department of Justice. This report has not been published by the Department. Opinions or points of view expressed are those of the author(s) and do not necessarily reflect the official position or policies of the U.S. Department of Justice.
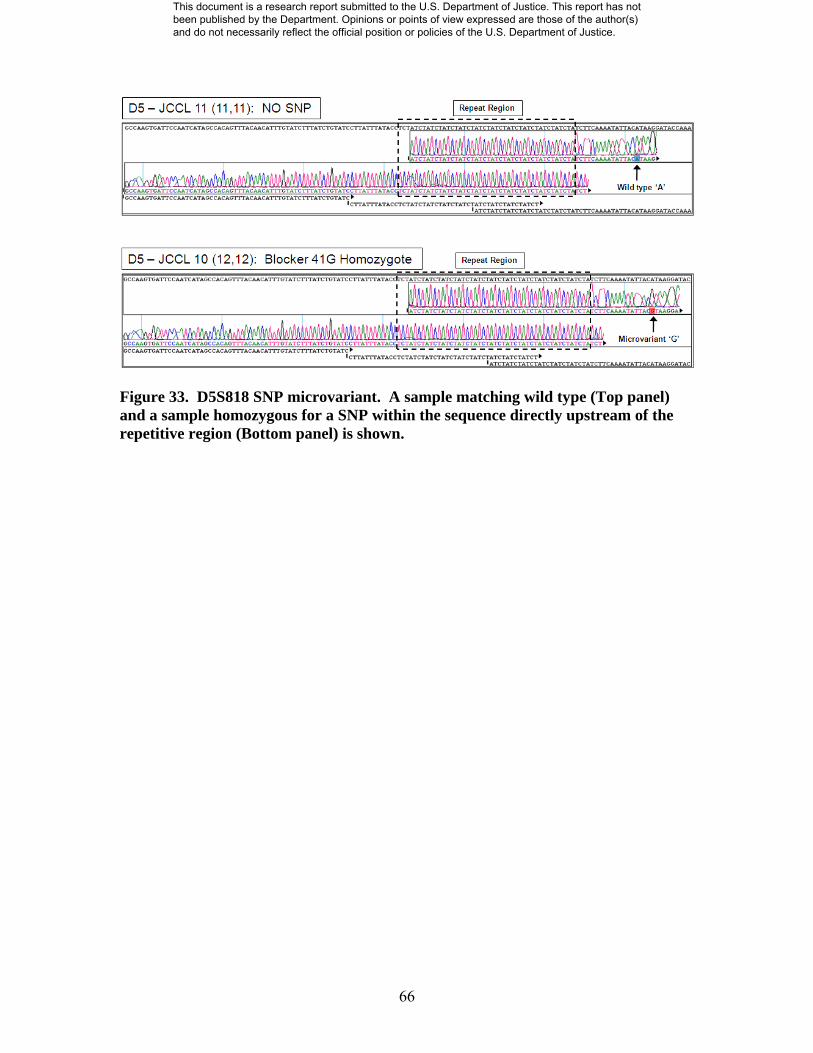
66
Figure 33. D5S818 SNP microvariant. A sample matching wild type (Top panel) and a sample homozygous for a SNP within the sequence directly upstream of the repetitive region (Bottom panel) is shown.
This document is a research report submitted to the U.S. Department of Justice. This report has not been published by the Department. Opinions or points of view expressed are those of the author(s) and do not necessarily reflect the official position or policies of the U.S. Department of Justice.
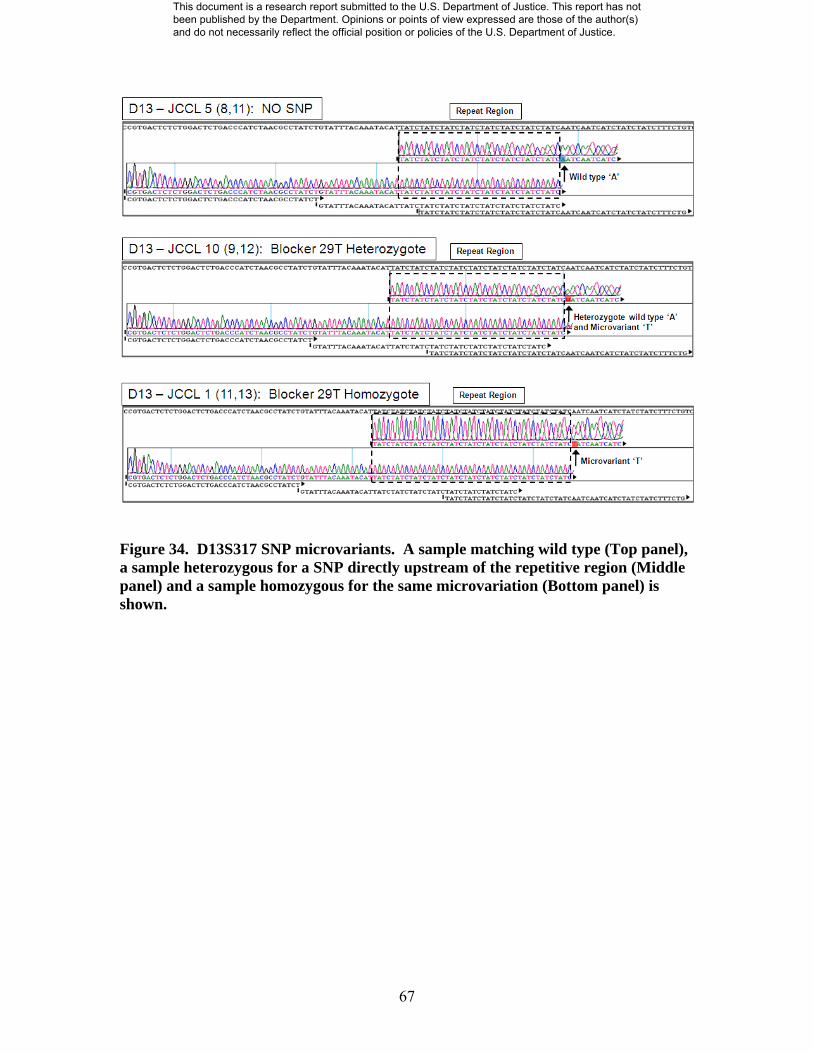
67
Figure 34. D13S317 SNP microvariants. A sample matching wild type (Top panel), a sample heterozygous for a SNP directly upstream of the repetitive region (Middle panel) and a sample homozygous for the same microvariation (Bottom panel) is shown.
This document is a research report submitted to the U.S. Department of Justice. This report has not been published by the Department. Opinions or points of view expressed are those of the author(s) and do not necessarily reflect the official position or policies of the U.S. Department of Justice.

68
Figure 35. Key features of the Micronics nucleic acid extraction subcircuit card
This document is a research report submitted to the U.S. Department of Justice. This report has not been published by the Department. Opinions or points of view expressed are those of the author(s) and do not necessarily reflect the official position or policies of the U.S. Department of Justice.

69
Figure 36. Demonstration of extraction efficiency from blood dried onto plastic
This document is a research report submitted to the U.S. Department of Justice. This report has not been published by the Department. Opinions or points of view expressed are those of the author(s) and do not necessarily reflect the official position or policies of the U.S. Department of Justice.

70
Figure 37. Demonstration of extraction efficiency from blood dried onto plastic followed by drying on cotton swab overnight.
This document is a research report submitted to the U.S. Department of Justice. This report has not been published by the Department. Opinions or points of view expressed are those of the author(s) and do not necessarily reflect the official position or policies of the U.S. Department of Justice.

71
Figure 38. Analysis of DNA eluted from Micronics’ capture filter cartridges after storage for the indicated amount of time.
This document is a research report submitted to the U.S. Department of Justice. This report has not been published by the Department. Opinions or points of view expressed are those of the author(s) and do not necessarily reflect the official position or policies of the U.S. Department of Justice.

72
Figure 39. Extraction archived DNA quality. No change in profile was detected over an 18 month storage period.
This document is a research report submitted to the U.S. Department of Justice. This report has not been published by the Department. Opinions or points of view expressed are those of the author(s) and do not necessarily reflect the official position or policies of the U.S. Department of Justice.

73
Figure 40. Bench Top and On-Card Melt Curves for the Two Probe Protocol for Four Individuals. Flagged lines depict allelic melt peaks.
This document is a research report submitted to the U.S. Department of Justice. This report has not been published by the Department. Opinions or points of view expressed are those of the author(s) and do not necessarily reflect the official position or policies of the U.S. Department of Justice.

74
Figure 41. Representative results from Micronics’ bench top analysis of MRI protocol (Samples – red and green; No Template Control (NTC) - blue). Flagged lines depict allelic melt peaks.
This document is a research report submitted to the U.S. Department of Justice. This report has not been published by the Department. Opinions or points of view expressed are those of the author(s) and do not necessarily reflect the official position or policies of the U.S. Department of Justice.
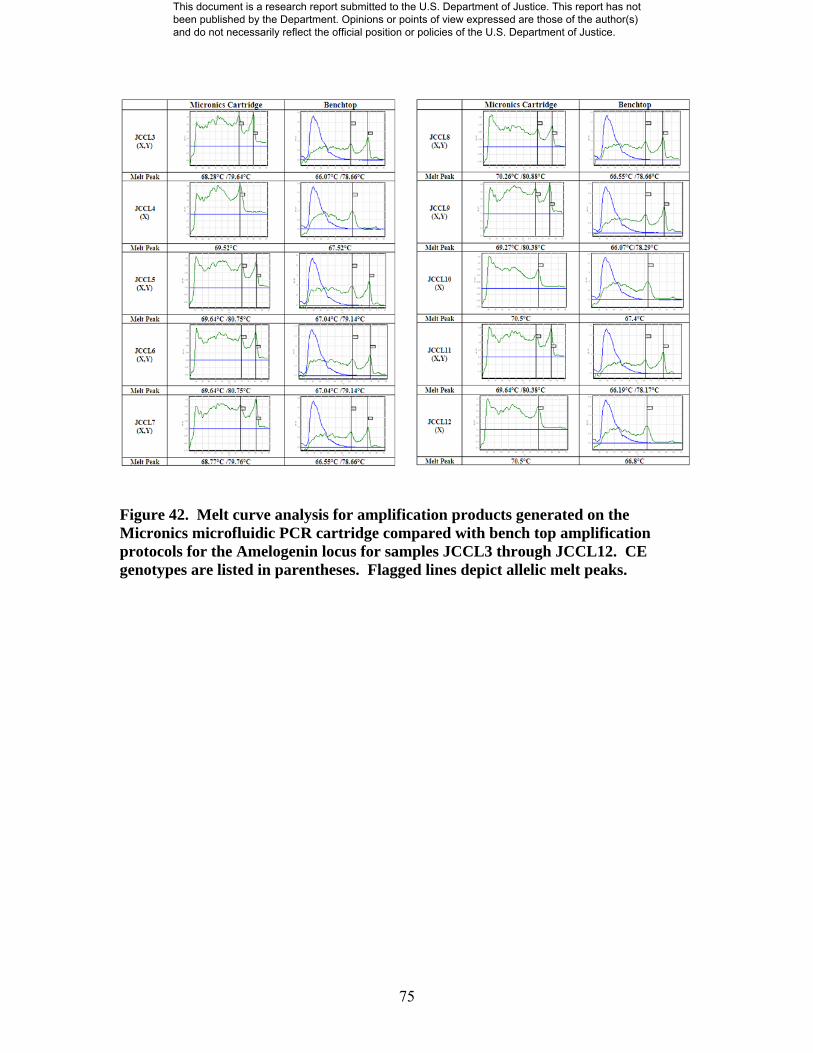
75
Figure 42. Melt curve analysis for amplification products generated on the Micronics microfluidic PCR cartridge compared with bench top amplification protocols for the Amelogenin locus for samples JCCL3 through JCCL12. CE genotypes are listed in parentheses. Flagged lines depict allelic melt peaks.
This document is a research report submitted to the U.S. Department of Justice. This report has not been published by the Department. Opinions or points of view expressed are those of the author(s) and do not necessarily reflect the official position or policies of the U.S. Department of Justice.

76
Figure 43. PanNAT Filter Set to Approximate Bio-Rad EX and EM Filters. Abbreviations used: Light Emitting Diode (LED), PanNAT Excitation Filter (EX), PanNAT High Pass Filter (DC), PanNAT Emission Filter (EM), Bio-Rad Excitation Filter (iQ5-490-20) and Bio-Rad Emission Filter (iQ5-625-20).
This document is a research report submitted to the U.S. Department of Justice. This report has not been published by the Department. Opinions or points of view expressed are those of the author(s) and do not necessarily reflect the official position or policies of the U.S. Department of Justice.

77
Figure 44. Demonstration of on-card melt for a homozygote sample.
This document is a research report submitted to the U.S. Department of Justice. This report has not been published by the Department. Opinions or points of view expressed are those of the author(s) and do not necessarily reflect the official position or policies of the U.S. Department of Justice.

78
Figure 45. Demonstration of on-card melt for a heterozygote sample. Two heterozygote samples (TPOX 8, 12) were melted using a bench top thermal cycler (Top Panel) and compared against a single sample (TPOX 8, 12) and a No Template Control (blue line) using a microfluidic card melt (Bottom Panel).
This document is a research report submitted to the U.S. Department of Justice. This report has not been published by the Department. Opinions or points of view expressed are those of the author(s) and do not necessarily reflect the official position or policies of the U.S. Department of Justice.

79
Figure 46. dpFRET TPOX assay precision. Alleles are listed by color.
This document is a research report submitted to the U.S. Department of Justice. This report has not been published by the Department. Opinions or points of view expressed are those of the author(s) and do not necessarily reflect the official position or policies of the U.S. Department of Justice.

80
Figure 47. dpFRET CSF1PO assay precision. Alleles are listed by color.
This document is a research report submitted to the U.S. Department of Justice. This report has not been published by the Department. Opinions or points of view expressed are those of the author(s) and do not necessarily reflect the official position or policies of the U.S. Department of Justice.

81
Figure 48. dpFRET D5S818 assay precision. Alleles are listed by color.
This document is a research report submitted to the U.S. Department of Justice. This report has not been published by the Department. Opinions or points of view expressed are those of the author(s) and do not necessarily reflect the official position or policies of the U.S. Department of Justice.
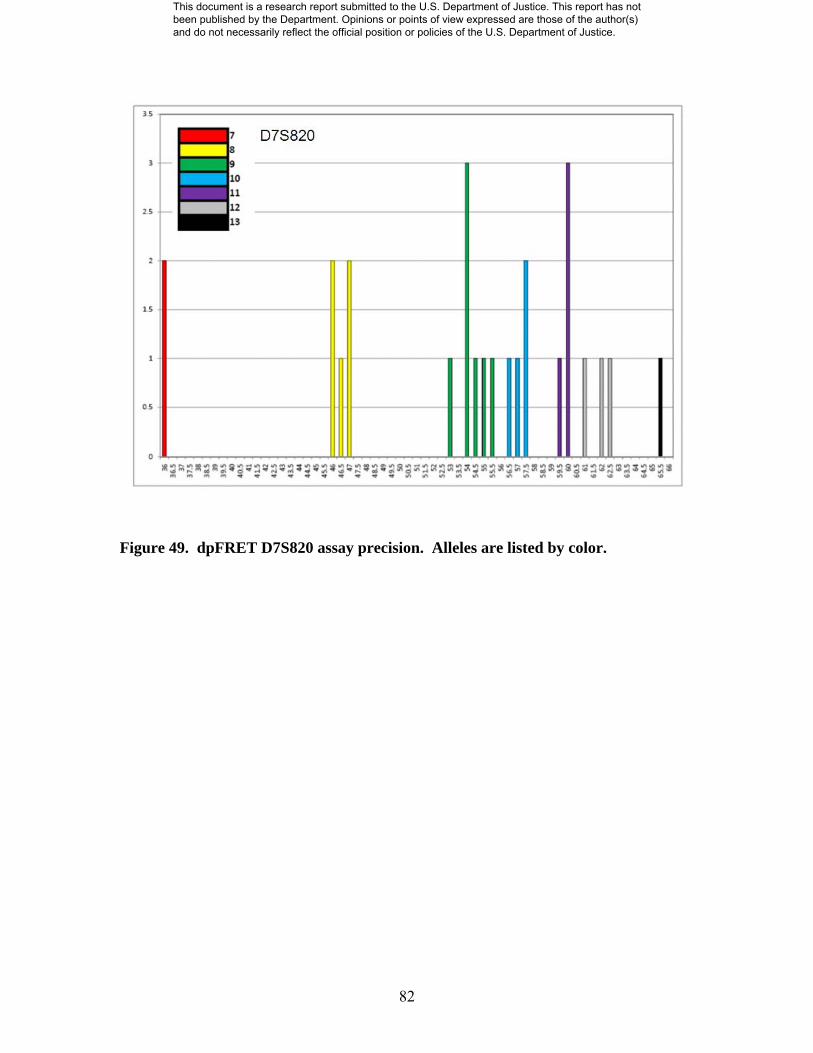
82
Figure 49. dpFRET D7S820 assay precision. Alleles are listed by color.
This document is a research report submitted to the U.S. Department of Justice. This report has not been published by the Department. Opinions or points of view expressed are those of the author(s) and do not necessarily reflect the official position or policies of the U.S. Department of Justice.

83
Figure 50. dpFRET D13S317 assay precision. Alleles are listed by color.
This document is a research report submitted to the U.S. Department of Justice. This report has not been published by the Department. Opinions or points of view expressed are those of the author(s) and do not necessarily reflect the official position or policies of the U.S. Department of Justice.

84
Figure 51. Heterozygote allele resolution for D5S818 (n, n+1) samples. Melt peaks showed lower resolution for increasingly larger alleles (Top to bottom panels).
This document is a research report submitted to the U.S. Department of Justice. This report has not been published by the Department. Opinions or points of view expressed are those of the author(s) and do not necessarily reflect the official position or policies of the U.S. Department of Justice.

85
Figure 52. ESB-FRET assay sensitivity for (a) TPOX and (b) D5. Melt curves are illustrated for 7 decreasing input amounts for each of three samples for each assay.
This document is a research report submitted to the U.S. Department of Justice. This report has not been published by the Department. Opinions or points of view expressed are those of the author(s) and do not necessarily reflect the official position or policies of the U.S. Department of Justice.

86
Figure 53. ESB-FRET mixture results for the TPOX locus.
This document is a research report submitted to the U.S. Department of Justice. This report has not been published by the Department. Opinions or points of view expressed are those of the author(s) and do not necessarily reflect the official position or policies of the U.S. Department of Justice.

87
Figure 54. Comparison of total DNA recovery from dried bloodstains (0.2, 1, 5 and 10 ul) extracted using on-card microfluidic extraction or commercial kit (Qiagen).
This document is a research report submitted to the U.S. Department of Justice. This report has not been published by the Department. Opinions or points of view expressed are those of the author(s) and do not necessarily reflect the official position or policies of the U.S. Department of Justice.

88
Figure 55. Micronics’ PanNAT instrument developed independent of the project for point of care molecular diagnosis applications.
This document is a research report submitted to the U.S. Department of Justice. This report has not been published by the Department. Opinions or points of view expressed are those of the author(s) and do not necessarily reflect the official position or policies of the U.S. Department of Justice.

89
TABLES Table 1. Original dpFRET design strategy locus development summary. Table 2. Comparison of extraction efficiency between commercial blood extraction kit (Qiagen) and Micronics extraction subcircuit.
Locus Preliminary Results (n=5) Secondary Results (n=16)Amelogenin Good GoodCSF1P0 Good GoodTH01 Good GoodTPOX Good GoodD7S820 Good Samples discordant w ith CED16S539 Good Samples discordant w ith CED3S1358 Good Samples discordant w ith CED5S818 Samples discordant with CE Samples discordant w ith CED13S317 Insufficient peak separation Samples discordant w ith CED8S1179 Shorter probe redesign Samples discordant w ith CEvWA Incompatible alleles -D18S51 Incompatible alleles -D21S11 Incompatible alleles -FGA Incompatible alleles -
QiagenMicronics Extraction
CardDifference
Avg. Calc. Conc. (ng/ul) 29.28 5.29 -23.99
Avg. Ct 25.00 27.19 +2.19
This document is a research report submitted to the U.S. Department of Justice. This report has not been published by the Department. Opinions or points of view expressed are those of the author(s) and do not necessarily reflect the official position or policies of the U.S. Department of Justice.

90
Table 3. ESB-FRET assay sensitivity for four additional loci.
This document is a research report submitted to the U.S. Department of Justice. This report has not been published by the Department. Opinions or points of view expressed are those of the author(s) and do not necessarily reflect the official position or policies of the U.S. Department of Justice.

91
Table 4. Microfluidic card and investigator extracted blood stains genotyped using Identifiler and the ESB-FRET assay.
This document is a research report submitted to the U.S. Department of Justice. This report has not been published by the Department. Opinions or points of view expressed are those of the author(s) and do not necessarily reflect the official position or policies of the U.S. Department of Justice.