Embed Size (px)
Citation preview
For comments, suggestions or further inquiries please contact:
Philippine Institute for Development StudiesSurian sa mga Pag-aaral Pangkaunlaran ng Pilipinas
The PIDS Discussion Paper Seriesconstitutes studies that are preliminary andsubject to further revisions. They are be-ing circulated in a limited number of cop-ies only for purposes of soliciting com-ments and suggestions for further refine-ments. The studies under the Series areunedited and unreviewed.
The views and opinions expressedare those of the author(s) and do not neces-sarily reflect those of the Institute.
Not for quotation without permissionfrom the author(s) and the Institute.
The Research Information Staff, Philippine Institute for Development Studies5th Floor, NEDA sa Makati Building, 106 Amorsolo Street, Legaspi Village, Makati City, PhilippinesTel Nos: (63-2) 8942584 and 8935705; Fax No: (63-2) 8939589; E-mail: [email protected]
Or visit our website at http://www.pids.gov.ph
June 2015
Nerlita M. Manalili, Kevin F. Yaptencoand Alessandro A. Manilay
Rapid Appraisal of the PostharvestFacilities Projects in the Philippines
DISCUSSION PAPER SERIES NO. 2015-31

i
Rapid Appraisal of the Post-Harvest Facilities Projects in the Philippines
Nerlita M. Manalili
Kevin F. Yaptenco
Alessandro A. Manilay
With statistical support from Prof Nelita M. Lalican and
research support from Ms. Imelda V. Valenton and Carissa Joy Ozoa
ii
Abstract
The Philippine government’s postharvest loss reduction programs entail significant investments (manpower, facilities and equipment) and their impacts need evaluating. Thus, the Philippine Institute for Development Studies of the National Economic and Development Authority commissioned NEXUS Agribusiness Solutions to undertake the “Rapid Appraisal of Selected Postharvest Facilities in the Philippines”.
PHF Selection process considered at least one each for Luzon, Visayas and Mindanao and for the following PHF categories:
1. Equipment and facilities required immediately after harvest 2. Processing and storage facilities 3. Market infrastructure and transport facilities
Selected were four Rice Processing Centers (RPCs), established through a Korean International Cooperation Agency grant, in Pangasinan, Davao Del Sur, Bohol, and Iloilo. Using these sites as hub, other PHF nearby such as food terminals (FT), flatbed dryers (FBD) and threshers were included for evaluation.
In the context of upgrading value chains, reducing postharvest losses, and improving economic outcomes for smallholder farmers, selected PHF were characterized and assessed.
Evaluated PHFs were found responsive to farmers’ needs (production, postharvest, processing and marketing), met pre-set objectives and posted positive impacts.
RPCs’ increase farmers’ income, produce quality milled rice, reduce postharvest losses, improve distribution, and maximize utilization of byproducts, however, continued government support is needed, until a qualified beneficiary can take over operations.
FBD/thresher distribution, reportedly preserve grain quality and reduce postharvest losses, but needs ensuring that benefits accrue to farmers.
FTs provide agri-suppliers with access to markets, improve availability of commodities/basic goods, employment/entrepreneurial opportunities, and strengthened LGUs- private sector partnership. Proper management, comparable prices (to nearest market) and entrepreneurial skill of beneficiaries were key to successful FT operations in addition to appropriate location.
Recommendations centered on project management enhancement (timeliness of preparatory activities, participatory planning, etc.) and on operational improvements (capacity utilization, viability and sustainability).
Keywords: postharvest loss, postharvest facility, value chain, agricultural marketing, rapid appraisal
iii
Contents 1. INTRODUCTION .......................................................................................................................................... 10
2. SITUATIONER .............................................................................................................................................. 11
2.1. Production Areas .............................................................................................................................. 11
2.2. Postharvest Losses ........................................................................................................................... 15
2.2.1. Loss Assessment of Grains ....................................................................................................... 15
2.2.2. Loss Assessment of Fruit and Vegetables .......................................................................... 16
2.3. Government Interventions for Postharvest Loss Reduction .......................................... 16
2.3.1. Rice and Corn Processing ......................................................................................................... 17
2.3.2. Marketing of High-Value Crops .............................................................................................. 19
2.3.3. Cold Chain Systems for Storage and Transport .............................................................. 22
2.3.4. Tramline Program ....................................................................................................................... 26
2.4. Summary of Situationer ................................................................................................................. 26
3. OBJECTIVES .................................................................................................................................................. 27
4. GENERAL APPROACH AND METHODOLOGY ................................................................................. 27
4.1. Identification of PHF for Impact Assessment........................................................................ 27
4.1.1. General Analytical Framework .............................................................................................. 27
4.1.2. Characterization of Postharvest Facility Projects .......................................................... 28
4.1.3. Selection of PHF Projects, Commodities, Study Sites and Respondents ............... 28
4.1.4. Respondents and Respondent selection ............................................................................ 30
4.1.5. Data Collection .............................................................................................................................. 31
4.2. Impact Assessment of PHF ........................................................................................................... 32
4.2.1. Appraisal Process ........................................................................................................................ 32
4.2.2. Assessment of PHF Projects and Project Management ................................................ 33
4.2.3. Evaluation of Project Management ...................................................................................... 37
4.2.4. Identification of Strengths and Weaknesses in Identified PHF Programs and Projects 37
4.3. Study Timeline ................................................................................................................................... 37
5. RAPID ASSESSMENT RESULTS ............................................................................................................. 37
5.1. Postharvest Facility Description and Technical Assessment ......................................... 37
5.1.1. KOICA Rice Processing Centers.............................................................................................. 37
5.2. Benefits Derived from the Postharvest Facilities Projects .............................................. 67
5.2.1. Benefits Derived from the KOICA-Rice Processing Centers ....................................... 67
5.2.2. Cost-Benefit Analysis ................................................................................................................. 72
5.2.3. Threshers and Flatbed Dryers ................................................................................................ 73
5.2.4. Benefits of Farmers/Fisherfolks in Selling to Barangay Food Terminals (BFTs) and Municipal Food Terminals (MFTS) ...................................................................................................... 75

iv
5.2.5. Employment Generation ........................................................................................................... 78
5.3. Rice Value Chain Upgrading associated with PHF .............................................................. 80
5.3.1. MFTs and BFTs ............................................................................................................................. 82
5.3.2. Flatbed dryers and threshers ................................................................................................. 82
6. PROJECT MANAGEMENT ........................................................................................................................ 83
6.1. Project Cycle: Process and Issues .............................................................................................. 83
6.2. Project Monitoring and Evaluation ........................................................................................... 87
7. SUMMARY OF FINDINGS ......................................................................................................................... 87
7.1. Relevance of PHF .............................................................................................................................. 87
7.2. Strengths and Weaknesses of PHF ............................................................................................ 87
7.2.1. Project Management ................................................................................................................... 87
7.2.2. Operational Level ......................................................................................................................... 88
8. RECOMMENDATIONS ............................................................................................................................... 88
8.1. Project Planning and Implementation ..................................................................................... 88
8.2. Enhanced Facility Utilization ....................................................................................................... 89
8.2.1. KOICA RPCs: ................................................................................................................................... 89
8.2.2. MFTs/BFTs ..................................................................................................................................... 89
8.2.3. Flat Bed Dryers ............................................................................................................................. 90
8.3. Areas For Further Study ................................................................................................................ 90
9. REFERENCES ................................................................................................................................................ 92
10. APPENDIX .......................................................................................................................................................... 95
Appendix 1 Key Informants ..................................................................................................................... 95
Appendix 2. Sample survey instruments used in the in depth field assessments............. 99

v
List of Tables
Table 1. Programs of the Department of Agriculture for establishment of
postharvest facilities in the Philippines 11
Table 2. Annual value of production of palay (PhP x 10) at current prices 12
Table 3. Annual Volume of production of palay (metric tons) 12
Table 4. Average annual production volume of selected high value crops by region 13
Table 5. Average annual value of production (PhP x 1,000,000)
of selected high value crops by region 13
Table 6. Average annual value of production of fisheries products by region 14
Table 7. Average annual volume of production (metric tons) of fisheries by region 14
Table 8 Regional distribution of barangay and municipal food terminals 17
Table 9. Matrix of postharvest facilities for evaluation 29
Table 10. Study sites per province 29
Table 11. Number of respondents by PHF type per province 30
Table 12. Initial and In-depth field assessment dates 32
Table 13. Percent value of paddy with delayed drying compared to 100%
value of paddy dried on the day of harvest 35
Table 14. Percent of yellow kernels by day of threshing delay 36
Table 15. Implementing agencies of the Department of Agriculture under the
KOICA RPC Project 41
Table 16. Technical aspects of the various RPCs 40
Table 17. Impact of the RPCs on the domestic rice industry 47
Table 18. Technical description of barangay food terminals visited
during the impact assessment 52
Table 19. Technical description of municipal food terminals 53
Table 20. Profile of products sold by barangay food terminals 57
Table 21. . Impact of barangay food terminals. 61
Table 22. Impact of municipal food terminals 61
Table 23. Paddy procured by RPCs at MC greater than 18% during the wet season 68
Table 24. Percent value of paddy procured by the RPCs with 3 days delay in drying 69
Table 25 .Paddy procured by RPCs wet and dry seasons in 2013 and 2014 70
Table 26. Quantitative losses, RPC vs traditional milling facility 71
Table 27. Value of reduced losses from proper grain drying and milling 71
Table 28. Average price received by rice farmers for wet paddy sold
to RPCs vs traders/millers, wet season (Aug-Oct) 72
Table 29. Farmers' gain from higher RPC buying price for wet paddy for
wet season procurement 72
Table 30. Benefits gained from the additional thresher 73
Table 31. Marketing practices of farmers after harvesting of paddy 74
Table 32. Volume of paddy threshed, 20 farmer key informants 74
Table 33. Perceived advantage/disadvantage of Barangay Food Terminals 76
Table 34. Comparison of buying prices and transport (delivery) cost
between Barangay Food Terminals and other market outlets 77
Table 35 RPC employees and respective compensation 79
Table 36. Number BFT of employees and their compensation 79
Table 37. Number of MFT employees and their compensation 79
Table 38. Comparative assessment of value chains key elements
with or without RPCs 82
Table 39 Project Development Process Evaluation 84

vi
List of Figures
Figure 1 Location of KOICA-supported rice processing facilities in the Philippines. 18 Figure 2 Location of municipal food terminals in the Philippines 20 Figure 3 Location of municipal food terminals in the Philippines 21 Figure 4 Location of private and government cold chain facilities in the Philippines with respect to top five production (by volume) areas of fisheries products (shaded regions) 24 Figure 5 Location of private ice plants and combined facilities and government cold chain facilities in the Philippines with respect to top five production (by volume) areas of fisheries products 28 Figure 6 General Analytical Framework 28 Figure 7 Location of KOICA-supported Rice Processing Centers in the Philippines 41 Figure 8 Monthly volume of procured paddy for KOICA RPCs (except Pilar) 43 Figure 9 Sources of paddy for Pototan RPC (Iloilo) 44 Figure 10 Sources of paddy for the Sta. Barbara RPC (Pangasinan) 44 Figure 11 Sources of paddy for the Pilar RPC (Bohol) 45 Figure 12 Sources of paddy for the Matanao RPC (Davao) 45 Figure 13 Estimated growing area serviced by RPCs (except Pilar) 46 Figure 14 Pricing scheme for procurement of paddy from RPC suppliers. The buying price is a function of moisture content of paddy and the prevailing market price for well-dried paddy (14% MC). 48 Figure 15 Common equipments and facilities in BFT’s 54 Figure 16 Typical structures for MFT’s 55 Figure 17 MFT Binalonan 59 Figure 18 MFTs' in Iloilo 59 Figure 19 Mechanics of the flat bed dryer program implemented by PHILMECH as proponent of the flatbed dryer project under the FIELDS Program. 64 Figure 20 Pressure and temperature gauges of a flatbed dryer in Alaminos, Pangasinan 65 Figure 21 Some flatbed dryers need retrofitting of safety shield for rotating / moving components. 66 Figure 22 The Rice Value Chain in RPC Areas 80

vii
List of Acronyms
PHFs Postharvest Facilities ACEF Agricultural Competitive Enhancement Fund AFMA Agricultural & Fisheries Modernization Act Agri-Pinoy Agrikulturang Pinoy AMAS Agribusiness and Marketing Assistance Services BAI Bureau of Animal Industry BFAR Bureau of Fisheries and Aquatic Resources BFT Barangay Food Terminals BOD Board of Directors BPRE Bureau of Postharvest Research & Extension CCP Cold Chain Program DA Department of Agriculture DSWD Department of Social Welfare & Development FBDs Flatbed Dryers FIELDS Fertilizers, Irrigation, Extension, Loans, Dryers &Postharvest Facilities FO Farmer’s Organization GAA General Appropriations Act HVCDP High Value Crops Development Program KII Key Informant Interviews KOICA Korean International Cooperation Agency LGU Local Government Units MAO Municipal Agricultural Officers MC Moisture Content MFT Municipal Food Terminals NABCOR National Agribusiness Corporation NEDA National Economic Development Authority NIA National Irrigation Administration NHMP National Hunger Mitigation Program PAES Philippine Agricultural Engineering Standard PHILMECH Philippine Center for Postharvest Development & Mechanization RFU Regional Field Unit RPC Rice Processing Centers SPPAQFI Sentrong Pamilihang Produktong Agricultural sa Quezon Foundation, Inc.

8
Executive Summary
Among global agricultural development woes are postharvest issues, specifically losses. This is a
multifaceted concern as it impacts on the lives of the smallholder producers, the economy of the
producing geographical unit, to a larger extent, the food security of the greater populace, the level
of environmental challenges in meeting global food requirements. Aware of the pressing
postharvest concerns, governments of countries in the Asia Pacific region agreed to prioritize the
reduction of food losses, particularly post-harvest losses and food waste issues, in their country
strategic plans for agricultural development, during the 2013 high level meeting on food loss and
food waste in Bangkok, Thailand. Consequently, they agreed a) to work towards the creation of
an enabling environment that is supportive of food loss reduction and will provide a better
climate to stimulate private sector to investment in food loss reduction, and b) to integrate policy
consideration for the development of basic and post-harvest specific infrastructure and food
safety and quality regulations.
In the Philippines, while there are continuous government efforts to reduce postharvest losses,
there is anecdotal evidence to indicate that government Post Harvest Facilities (PHF) investments
may have been misallocated (as mentioned in this study’s Terms of Reference). “Are investments
in PHFs truly responding to postharvest problems and issues in the agricultural value chain?”. This
study, the “Rapid Appraisal of Postharvest Facilities”, a component of a larger evaluation study of
agricultural production support, shall evaluate the effectiveness of PHFs in the context of
upgrading value chains and improving economic outcomes for small farmers.
The six-month study conducted from October 2014 to March 2015 centered on the four Rice
Processing Centers (RPC) granted by KOICA since these have been in operation for at least two
cropping seasons. The primary sites were Sta. Barbara (Pangasinan), Matanao (Davao del Sur),
Pilar (Bohol), and Pototan (Iloilo). Using these sites as the hub, secondary sites with food
terminals, flatbed dryers, and threshers were selected.
The study involved five major activities namely: (1) mobilization and workplan finalization, (2)
detailed rapid appraisal planning, (3) rapid appraisal proper which is composed of two phases,
initial assessment and in depth survey, (4) data processing and analysis and (5) report
preparation. The rapid appraisal proper started with an initial assessment to determine
operational status of the PHFs under consideration and for inclusion in the in- depth phase.
Capacity utilization and effect on reduction of postharvest losses were the main concerns
evaluated regarding the KOICA-RPCs. Based on the procurement records provided by the four
RPCs, the dryer and rice mill capacity utilization appeared to be inadequate. At full capacity
assuming an eight-hour operation per day, the mechanical dryers can produce 25, 120 kg of dried
paddy. The rice mills, on the other hand, can process 20,000 kg of milled rice per day. At least
30,000 kg/day of paddy must be procured to attain full capacity utilization. Procurement records
showed that Pangasinan and Iloilo RPCs did not go beyond 12,000 kg/day of paddy procurement.
Davao del Sur, however, reached an average of 141,043 kg/day of paddy procurement. (Bohol
RPC procurement data is not yet available at the time that this initial report was written.) Lack of
capital for paddy procurement was identified as a major constraint that led to low capacity
utilization. Despite this limitation, the RPCs were still able to contribute to quality and
quantitative postharvest losses in rice. A total of PhP 307 M worth of postharvest losses was
estimated to be saved by utilizing the RPC facilities.
9
With regard to the flatbed dryers (FBDs) and rice threshers, the results of the impact evaluation revealed that the presence of the FBDs eliminates the risk of grain deterioration during the rainy season. Deterioration takes the form of stress cracking, mold development, grain fermentation and grain sprouting. This, however, is true among farmers who are able to avail of the services of the drying facilities. During the dry season, however, the impact of FBDs is less pronounced since farmers prefer the less costly method of sundrying (especially if grain volume to be dried is small). In the case of the threshers, farmer-respondents reported that they were able to thresh their paddy immediately with the additional unit of threshers provided by the Department of Agriculture. There is urgency to have the paddy threshed because farmers need cash as soon as their paddy is harvested to pay debts and to pay for household needs.
Barangay Food Terminals (BFTs) and Municipal Food Terminals (MFTs) were designed to function as food depots and distribution systems. Since each food terminal is located within a farming or fishing area, the Impact Evaluation Team concluded that the facilities can provide direct links between suppliers and consumers. BFTs are facilities that serve as a food distribution point at the barangay level, where farmers can bring their produce for sale as well as purchase food and non-food products at low prices. MFTs are designed to function as trading centers where growers can bring produce in large volumes for direct trading with wholesalers and “viajeros”. Thus, layers of middlemen are reduced leading to improved income for producers.
The government’s postharvest development program, based on selected assessment, were found to be strategically directed with its component mix addressing major postharvest concerns. The PHF identified and provided are those truly responsive to the needs of the marginalized farmers such as RPCs, food terminals, FBDs and threshers. This project mix covered key areas of agricultural development, namely: production, processing and marketing.
As to impact, the PHF facilities assessed were found to have met the objectives set for their
establishment as well as have posted positive impacts. Given the state of the art equipment and
well-trained personnel, RPCs are generally able to produce properly dried paddy and
consequently good-quality milled rice. Likewise, RPCs also provide a safety net for farmers during
periods of oversupply, when drying facilities are over utilized and private traders are not willing
to accept wet paddy and/or offer very low buying prices.
MFTs and BFTs impacts are observable through the enhanced economic activities continually
observe in areas where they were established, including expanded trade which afford suppliers
and consumers alike greater product choices at lesser transaction costs. Flatbed dryers, are
crucial and essential, especially during the rainy season, while threshers are instrumental in
meeting farmers’ urgent need to immediately turn harvest into cash for household and loan
repayment needs as well as timing of marketing produce while prices are still high (market not
yet flooded with supply).
Having involved champions committed to the cause of PHF facilities program is a potent force in successful project implementations. Whether this is part of the strategy or just an incidental outcome is yet to be established.
Recommendations centered on the project management enhancement such as ensuring preparatory activities/consultation process are properly done and stakeholders involved the earliest possible time. This is in in view of cited issues of nonawareness of counterpart requirements, unclear roles and responsibilities, among others. Operational enhancement to improve capacity utilization and enhance viability and sustainability were likewise recommended.

10
RAPID APPRAISAL OF POST-HARVEST FACILITIES
PROJECTS IN THE PHILIPPINES
1. INTRODUCTION
Postharvest issues, specifically losses, are a multifaceted concern. The state of the postharvest
sector’s development in a given agricultural economy impacts not only on the lives of the
smallholder producers, the economy of the producing geographical unit but to a larger extent, the
food security of the greater populace, as well as the level of environmental challenges in meeting
global food requirements. Food losses and food waste not only have adverse effects on the
region’s food security, but also negatively impact on the environment, labor, land, water and other
resources used in food production (FAO 2013). Huge resources that could otherwise be spent on
more productive activities go into producing and transporting goods that only go to waste
(Manalili, et. al, 2014).
Cognizant of this pressing concern, governments in the Asia Pacific region, during the 2013
high level meeting on food loss and food waste in Bangkok, Thailand, agreed to prioritize the
reduction of food losses, particularly post-harvest losses, and food waste issues in their country
strategic plans for agricultural development; to work toward the creation of an enabling
environment that is supportive of food loss reduction and provide a better climate to stimulate
private sector to invest in the food industry for food loss reduction and for policy objectives to
meet that end must integrate consideration for the development of basic and post-harvest specific
infrastructure and food safety and quality regulations.
In the Philippines, while there are continuous government efforts to reduce postharvest
losses, there is anecdotal evidence to indicate that government postharvest facilities (PHF)
investments may have been misallocated (as mentioned in this study’s Terms of Reference).
Questions such as “How much wastage is really going on in public PHF investments?” or “Are
investments in PHFs truly responding to postharvest problems and issues in the agricultural value
chain?”. These are just some of the many questions that need to be answered.
This study, “Rapid Appraisal of Postharvest Facilities”, a component of a larger evaluation
study of agricultural production support, is a modest attempt to address the concerns cited above.
Evaluating the effectiveness of PHFs in the context of upgrading value chains and improving
economic outcomes for small holder farmers is the major objective of the study. It will attempt to
characterize PHF projects supported by public and donor funds, profile the types of post-harvest
facilities provided to minimize postharvest losses, including expenditure patterns and trends (to
identify the priority investments), as well as provide a field-based description of the decision
process behind project identification, approval, and implementation.
Philippine Republic Act 8435, also known as the Agricultural & Fisheries Modernization Act
(AFMA), defines postharvest activities as those involving threshing, drying, milling, grading,
storage and handling of produce, and other activities such as stripping, winnowing, chipping and
washing. Postharvest facilities for conducting these activities include, but are not limited to,
drying and milling facilities, fish ports and landings, ice plants and refrigerated storage facilities,
11
processing plants, warehouses, buying stations, and market infrastructure and transportation
(NAFC 2014).
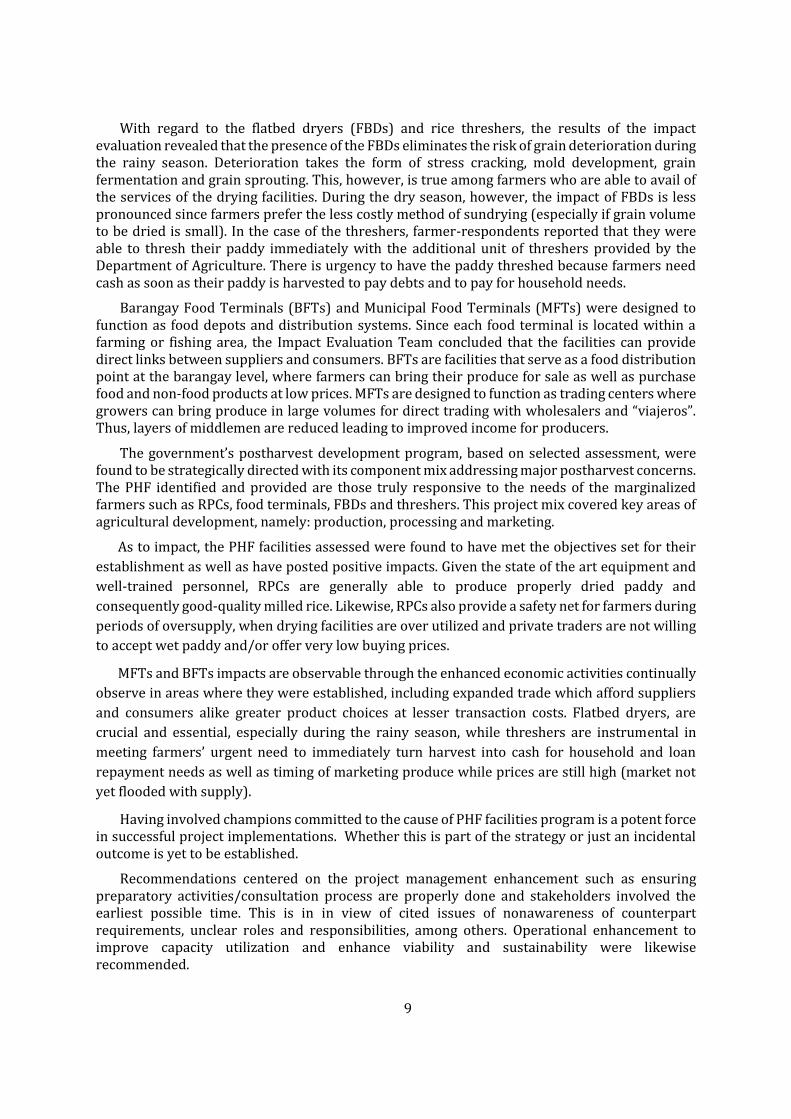
Under the 2014 General Appropriations Act (GAA), the budget of the Philippine government
is about PhP2.3 trillion with PhP 10.7 billion allocated to the Department of Agriculture (DA)
(PCDSPO 2013). Of this agriculture budget allocation, 27 percent or about PhP 2.9 billion is
provided for community postharvest development services and facilities. Table 1 provides a
summary of ongoing and completed projects provided by the DA for postharvest facilities.
Table 1. Programs of the Department of Agriculture for establishment of postharvest facilities in the Philippines
2. SITUATIONER
2.1. Production Areas
In terms of value and volume of rice produced, the top five rice producing regions in the
Philippines are Central Luzon, Cagayan Valley, Ilocos, Western Visayas, and SOCCSKSARGEN
(Table 2 and Table 3, respectively). The average annual value and volume of production of Central
Luzon was highest at PhP37.1 Billion and 2.02 Million metric tons for the period 2005-2009.

12
Table 2. Annual value of production of palay (PhP x 10) at current prices
Table 3. Annual Volume of production of palay (metric tons)
High-value crops are classified mainly into fruits and vegetables. For fruits, production
volume is highest in Mindanao (58%) (Table 4). The top five fruit-producing regions by volume
are Northern Mindanao, SOCCSKSARGEN, Davao, Western Visayas, and Cagayan Valley. For
vegetables, 68% of production comes from Luzon. The top five vegetable-producing regions are
Cagayan Autonomous Region, Ilocos, CALABARZON, Central Luzon, and Cagayan Valley.

13
Table 4. Average annual production volume of selected high value crops by region
In terms of aggregate value of production of high-value crops, the top five regions are Davao,
Northern Mindanao, SOCCSKSARGEN, Ilocos, and Western Visayas (Table 5).
Table 5. Average annual value of production (PhP x 1,000,000) of selected high value crops by region
Annual value of production of fisheries products (total of commercial and municipal fisheries
and aquaculture) is highest in the Central Luzon provinces (PhP8.6 Billion), followed by Western
Visayas, CALABARZON, Zamboanga Peninsula and SOCCSKSARGEN regions (Table 6).In terms of
volume, the highest producer is the ARMM, followed by MIMAROPA, Zamboanga Peninsula,
Western Visayas and CALABARZON (Table 7).

14
Table 6. Average annual value of production of fisheries products by region
Table 7. Average annual volume of production (metric tons) of fisheries by region

15
2.2. Postharvest Losses
The Philippine government aims for inclusive growth in agriculture. Such a goal, however,
requires investment in infrastructure like transport and logistical systems that afford production
areas access to resources, markets and social services (Manalili, et.al. 2014). At present,
agricultural production and postharvest industry is fragmented and small-scale in nature with
numerous producers, as well as multiple layers for marketing and distribution between growers
and buyers. This results in inefficiencies in the supply chain which increases costs, causes losses
both in terms of quantity and quality, and leads to higher prices of products. The large losses from
farm to plate are attributed to poor handling, distribution, storage, and purchase/consumption
behavior involving huge resources that could otherwise be spent on more productive activities
go into producing and transporting goods that are wasted (Manalili, et. al., 2014).
2.2.1. Loss Assessment of Grains
Loss assessment has been conducted to quantify the magnitude of postharvest losses for
several crops. For grain, postharvest losses may be classified into two categories: quality
deterioration and quantitative losses. Grain quality deterioration is manifested by grain
discoloration (yellowing) and decreases in head rice recovery after the milling process (Mendoza
and Quitco, 1985). Other quality measures are the presence of foreign matter (eg., stone grits,
grass seeds, rice straw, rice chaff) and unmilled rice. Quality deterioration, particularly yellowing,
occurs when harvested paddy (unmilled rice) remains unthreshed and stored or piled in field
stacks at a grain moisture content of 20% or even higher (wet paddy)(Trigo-Stockli and Pedersen,
1994). A five-day delay in threshing could result in a 38% to 67% yellowing per volume of harvest
while a five day delay in drying could cause a 17% incidence of yellowing (Mendoza and Quitco,
1985). Delays in drying also render the grain to become brittle thereby increasing the amount of
broken grains after milling (Trigo-Stockli and Pedersen 1994). Sundrying by spreading paddy on
pavements causes grain fissures that leads to low head rice recovery after milling. Inefficient
milling machines can also be the cause of low levels of milling and head rice yields. Since Filipino
consumers, regardless of social status, prefer to eat good quality rice, the deterioration of grain
quality is manifested (but not significantly) in the market price of palay and milled rice. (Manilay
and Frio, eds, 1985).
In addition to quality deterioration, physical (quantitative) losses can be experienced when
rice is improperly stored. Storing rice above its equilibrium moisture content (14%) at an
extended period of time could result in mold growth thereby rendering the stockpile unfit for
human consumption. Furthermore, rice storage facilities that lack proper protection from rats
contribute to physical losses. Storage losses due to rats are mostly due to feces and urine
contamination rather than from the actual amount of grain consumed (Halid, 1993). An average
size Norway rat (Rattus norvegicus) only eats an equivalent of 7 to 9 kilograms of grain in a year
(Brooks and Rowe, 1979). Studies on rice indicate an average total loss of 15% from harvesting
until the crop is milled. The largest loss is encountered during drying, due mainly to poorly-
designed drying equipment, improper use of drying technology, or poor drying conditions.
Provision of well-managed drying and milling facilities and trading plants is considered a
sustainable solution compared to farmer coop-operated postharvest facilities (de Padua 1999;
PHILMECH 2012).

16
2.2.2. Loss Assessment of Fruit and Vegetables
For calamansi fruit produced in Zamboanga Sibugay and shipped to Manila, the marketable
fruit is more than 95% at the farm but has decreased to 68% by the time it reaches the destination
market. This is due to improper handling, lack of proper packaging, and poor transport and
shipping conditions. Postharvest interventions such as curing and modified atmosphere
packaging increased the proportion of marketable fruit to 95% (Agravante et al 2013). These
interventions require only a simple postharvest facility equipped with curing racks and packing
tables.
Loss assessment of banana shipped from Nasipit port (Agusan Del Norte) to Manila showed
that fruit may be handled up to 10 times prior to shipment, and as many as 20 times before the
final consumer is reached. There are 5-8 layers in the supply chain and involving up to 10
stakeholders. Shippers and consignees are the key players in the chain based on volume handled.
The greatest risk occurs during inter-island shipment due to the practice of bulk loading in
unrefrigerated container vans (Artes et al 2013).
Losses in cabbage are similarly significant. A loss assessment study conducted by Serrano et
al (2009) showed that system losses are dependent on the distance to be traversed and the
number of transfers along the handling chain. Farther destinations or greater number of transfer
points (e.g. farmer to trader, trader to wholesaler) resulted in increased losses. Depending on the
handling chain used, these system losses could reach 19-29%.
2.3. Government Interventions for Postharvest Loss Reduction
Government intervention in postharvest loss reduction becomes necessary when market
forces are unable to provide enough incentives to encourage private investment in postharvest
facilities (Cabanilla, et. al., 2002; Villaroel & Cardino, 1985). The Department of Agriculture (DA)
has spearheaded various postharvest facility projects aimed at minimizing postharvest losses.
The number and type of postharvest facilities are identified jointly by the units of the DA that will
be involved in the implementation of the department’s banner programs. The Regional Field Unit
(RFU) overseeing the area where the projects will be located validates the appropriateness of the
number and/or type of the identified facilities based on the postharvest needs specific to the
location. In the current administration, project funds are directly released to the RFUs by the DA.
The RFUs are responsible for the procurement of the postharvest facilities required by the
projects.
Upon implementation of the projects, monitoring and technical support are provided by the
Philippine Center for Postharvest Development & Mechanization (PHILMECH) for grains and high
value crops while fisheries and livestock/poultry projects are monitored by the Bureau of
Fisheries and Aquatic Resources (BFAR) and the Bureau of Animal Industry (BAI), respectively.
Projects related to the provision of marketing facilities (e.g., food terminals and cold storages) are
handled by the Agribusiness and Marketing Assistance Services (AMAS). Monitoring entails
comparing the number of functional or completed postharvest facilities with the targeted number
and type of units as well as determining whether the units are being utilized by the beneficiaries.

17
2.3.1. Rice and Corn Processing
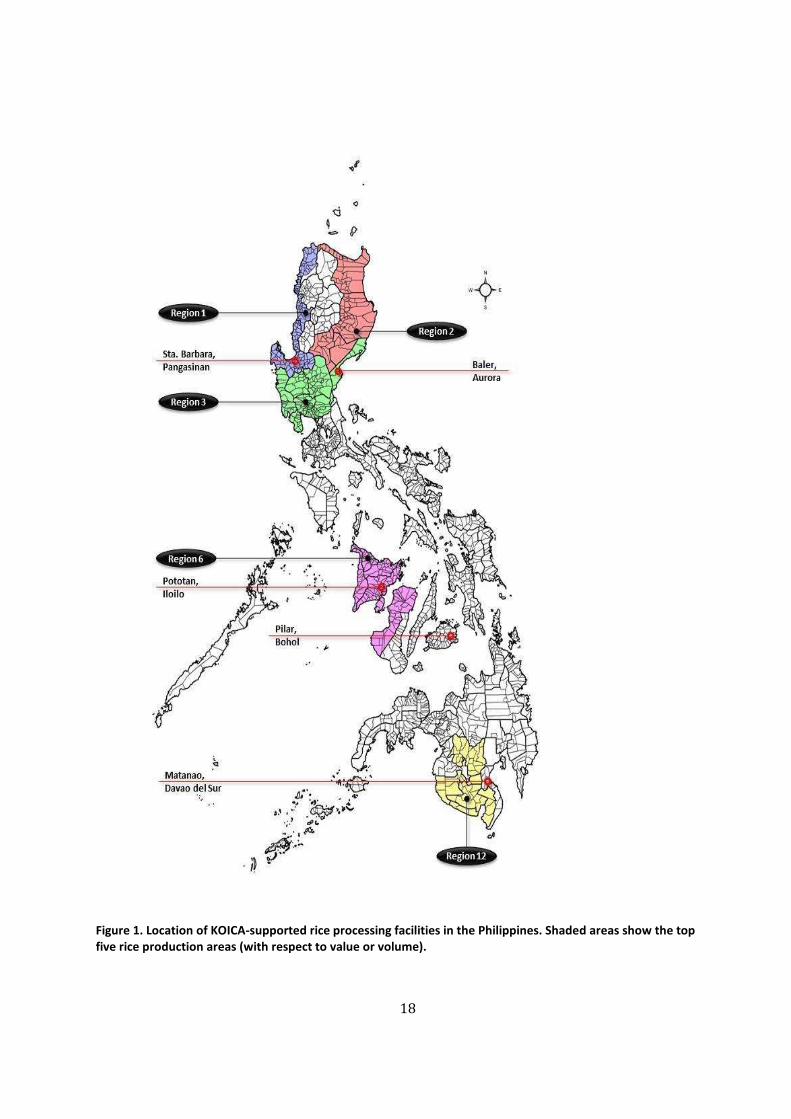
Four modern rice processing centers (RPC) from the Republic of South Korea have been
established in Pangasinan (Sta. Barbara), Iloilo (Pototan), Bohol (Pilar), and Davao del Sur
(Matanao) (Figure 1). These RPCs are intended to duplicate the loss reduction achieved by the
Korea-Philippines Integrated RPC established in Baler, Aurora in 2006; postharvest losses were
reduced from 15% to 8% using the modern facility. The four facilities were established with
PhP649-M provided by the Korean International Cooperation Agency (KOICA), while the
Philippine government provided PhP136-M in counterpart funding (PHILMECH 2012).
Smaller RPCs are to be established (a number already completed and functional) nationwide
for qualified beneficiaries. The government will shoulder about 85% of the project cost while the
recipient provides 15% of the cost (Manila Bulletin 2013; Bingabing 2014). In addition to the
RPCs, several units of rice threshers and FBDs have been provided by the DA in various locations
within the rice-producing provinces. At present, PHILMECH reported that there are 1,744 units
of threshers and 1,071 units of FBDs provided for farmers’ use nationwide (Table 8).
Table 8. Regional distribution of barangay and municipal food terminals
18
Figure 1. Location of KOICA-supported rice processing facilities in the Philippines. Shaded areas show the top five rice production areas (with respect to value or volume).

19
Corn farmers encounter significant difficulties in marketing their crop due to their failure to
dry their harvest down to the required level of 14% moisture content. The lack of drying facilities
is one reason for this failure. PHILMECH provided technical assistance in establishing a
processing facility in Ilocos Sur that is equipped with dryers and biomass furnaces. The
processing center purchases corn from farmers, dries the grain, and sells the dried product to
feed millers in Pangasinan and Bulacan (Jose 2012). A second processing and drying facility was
established in Claveria, Misamis Oriental with a milling capacity of 10 tons. The cost of the facility
was borne by the Mindanao Rural Development Program of the DA (PhP8-M) while the provincial
government provided PhP2-M as counterpart.
2.3.2. Marketing of High-Value Crops
For trading and loss reduction for high-value crops, the successful establishment and
operation of the Sentrong Pamilihan ng Produktong Agricultural sa Quezon Foundation, Inc
(SPPAQFI) in 2006 was considered a model for farmer empowerment. The facility is presently
managed by a farmers’ cooperative, where members can bring their produce to the facility and
the association assists with marketing. Payments are quick and can be collected the next day by
the farmer. An automated teller machine is being installed within the facility for more convenient
payments. Farmers are also represented in the Board of Trustees, ensuring that issues are quickly
and properly addressed.
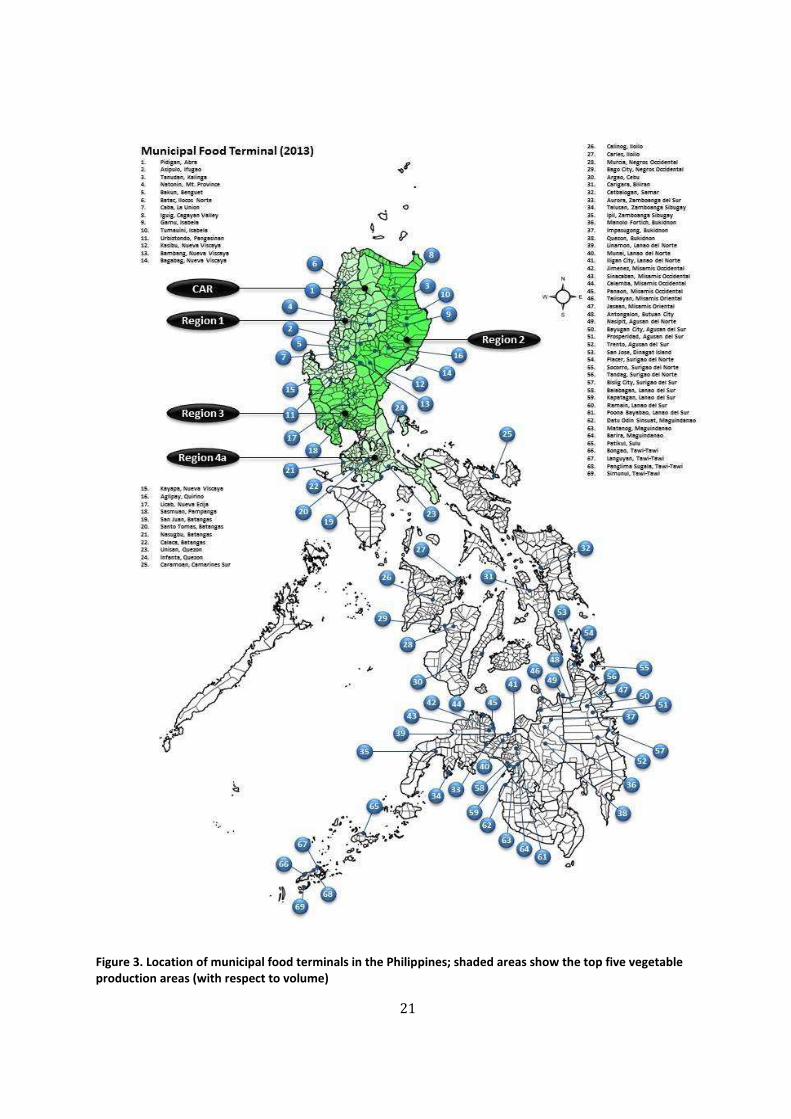
To duplicate this model, the Agrikulturang Pinoy (Agri-Pinoy) Trading Center program of the
DA plans to construct a total of 12 regional trading centers, 111 MFTs and BFTs in 2013 and 2014
(Figure 2 and Figure 3).

20
Figure 2. Location of municipal food terminals in the Philippines; shaded areas show the top five fruit production areas (with respect to volume).
21
Figure 3. Location of municipal food terminals in the Philippines; shaded areas show the top five vegetable production areas (with respect to volume)

22
Previous government administrations have pursued similar programs, such as Pres. Gloria M.
Arroyo’s poverty- and hunger-reduction programs called “Gulayan ng Masa”, “Food for School”
and “Tindahan Natin” (The News Today 2007). For the period of 2007-2013, the project has been
able to establish 186 MFTs and 1,258 BFTs. At present, there are varying levels of operational
status of BFTs; 88%, 20%, and 9% of BFTs are regularly operating, on irregular status, or non-
operational, respectively. For MFTs, 69%, 1%, and 30% are operating, on irregular status, or not
operating, respectively. Net returns in high-value crops such as vegetables are 11 and 18 times
higher than rice and corn (Briones and Galang 2013). However, the presence of functioning
trading posts and packinghouses are essential to ensure that quality produce is brought to
markets where farmers can realize these types of returns.
As of June 2014, the regional trading centers are all in various stages of planning and
construction; the facility in Urdaneta, Pangasinan is the closest to completion, having conducted
a soft launch in July 2014. The facility is mainly targeted for lowland vegetable farmers (Macam
2014).
Most of the BFTs are clustered in the CAR (13.3%) to cater to the large number of highland
vegetable farms in the region. Regions III and V also received large numbers of BFTs with 10.5%
and 10.0%, respectively.
In terms of MFTs received, the top three recipients were Regions III, IVb, and NCR with
25.5%, 10.8%, and 8.6%, respectively. or are not operating, respectively.
2.3.3. Cold Chain Systems for Storage and Transport
The use of refrigerated transport or storage facilities for maintaining quality and extending
shelf life of commodities has met varying degrees of success. A 1986 survey of cold storage
facilities and ice plants in the Philippines showed that high fuel and electricity costs, mechanical
breakdowns, high cost of replacement parts, low water quality, inadequate water supply, intense
competition, and lack of credit access contributed to non-expansion of operations and facilities,
temporary closure, or bankruptcy (Lantican et al 1986). These constraints towards adoption of
cold chain systems still exist at present.
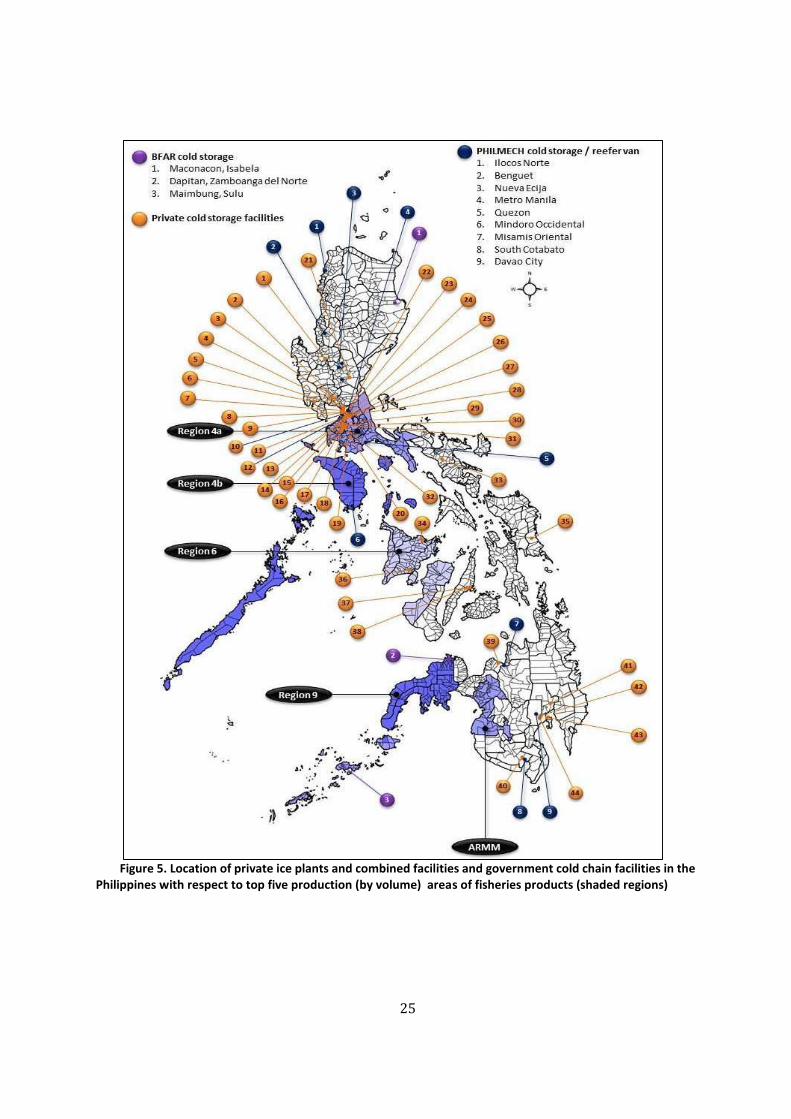
The DA-PHILMECH is currently implementing its Cold Chain Program (CCP) at three major
vegetable-producing areas in the Philippines by providing training to beneficiaries, as well as
access to cold chain equipment such as precoolers, cold storage rooms, and refrigerated trucks
(Estigoy 2006). Figure4 and Figure 5 show the location of government projects where cold chain
facilities such as cold storage facilities and refrigerated trucks have been deployed; location of
private cold chain facilities such as cold storage facilities, ice plants and combined ice plant-cold
storage facilities are also shown. Despite such government support, however, commercial
adoption of the technology has been difficult to implement on a continuous and sustainable basis.
However, the cold chain system established by DA in Benguet recorded its first year of positive
results in 2009 with PhP1.5-M in total revenues, and utilization rates of 66%, 100% and 85% of
its refrigerated trucks, cold storage units and plastic crates, respectively. This was achieved after
four years of operation, culminating in the export of Benguet-grown beans and broccoli to Japan
(Embuscado 2010).

23
Cold storage facilities for fish have also been established in Dapitan (Zamboanga del Norte),
Maconacon (Isabela) and Sulu under the DA Bureau of Fisheries and Aquatic Resources (BFAR)
(Figure 4 and Figure 5). The facility in Dapitan cost PhP40-M and was intended to stabilize supply
of sardines for processing, a major product of this city. It was turned over to the government in
2011, but has since been unused due to equipment malfunctions and lack of proper project
monitoring (Takumi 2013). The status of the facilities in Isabela and Sulu at present is unknown.

24
Figure 1 Location of private and government cold chain facilities in the Philippines with respect to top five production (by volume) areas of fisheries products (shaded regions); refer to Attachment 1 for listing of private facilities.
25
Figure 5. Location of private ice plants and combined facilities and government cold chain facilities in the Philippines with respect to top five production (by volume) areas of fisheries products (shaded regions)

26
2.3.4. Tramline Program
PHILMECH has been implementing a tramline program that aims to provide farmers with an
alternative system for hauling perishable crops or farm inputs (fertilizer, chemicals, seeds) from
areas that are isolated from farm roads. The system uses trams conveyed along steel cables that
are suspended between two or more stations that can bridge ravines, rivers, and dense
vegetation. Farmers bring their produce to strategically located consolidation points using the
tramline in exchange for a user fee.
Two systems are being provided by PHILMECH according to the needs of the site to be
serviced. The monocable tramline has a hauling capacity of 2.5-2.8 tons hr-1, a cable length of 980
m, a service area of 10 ha, with up to 9 consolidation points that can be serviced. The bi-cable
tramline system has a capacity of 0.5 – 2.0 tons hr-1, a carrier capacity of 150-500 kg, is capable
of servicing 2-5 consolidation points, and has an estimated cost of P100,000-1,000,000 per
tramline. The benefits include faster and less costly delivery of produce and farm inputs, and less
mechanical damage to the crop (PHILMECH 2013).
At present, the tramline project has established or is planning to set up 121 systems
nationwide. Benguet province has 21.5% of all tramline projects, followed by Nueva Viscaya
(7.4%) and Ifugao (6.6%) provinces.
The system has proven to be versatile, allowing farm inputs, produce, and people to be
transported safely and cheaply across difficult terrain. It has even been used to replace washed-
out bridges during periods of calamity when growing areas have been isolated (Magararu 2012).
2.4. Summary of Situationer
A recent study by Reardon et al (2012) in China, Bangladesh and India has shown that
appropriate government policies and interventions can reduce postharvest losses without any
major government role in the supply chain. Relaxing restrictions on foreign investment and
deregulation of milling in the rice industry allowed private sector investments to come in and for
modern technology to be introduced; provision of roads and other infrastructures further
facilitated change. Direct transactions between farmers and rice mills or wholesale traders
increased; and services to farmers were also improved. These findings align with
recommendations by de Padua (1999).
The Philippine government continues to invest in programs to reduce commodity losses
through the provision of postharvest facilities and technology interventions. However, many
programs are unsustainable and survive only due to subsidies. Underutilization is also a common
problem due to inappropriate technology, overcapacity, improper location, lack of understanding
on postharvest technology, or added costs of interventions.
To cite one example, the National Agribusiness Corporation (NABCOR) was a government-
owned and controlled corporation that aims to promote agribusiness through the development
and multiplication of enterprises of small farmers and fisherfolk (NABCOR undated). However,
the existing corn grain facilities by NABCOR across the country are underutilized and
mismanaged, leading to their discontinued operation, to the detriment of corn farmers (Manalili
et al 2014). In the early part of 2014, however, the privatization process of the said facilities was
initiated.
27
In light of the significant investments on postharvest facilities for rice, high-value crops and
fisheries, some effort must be exerted in determining the effectiveness of these interventions in
loss reduction. Proper and sustained operation of these facilities is necessary for Philippine
farmers, fishers and commodities to become competitive under an integrated ASEAN economic
zone that is to be established in 2015. This assessment should not be taken in isolation and must
be done within the value chain context and in consideration of markets, support services
provision and more importantly, chain governance and coordination.
3. OBJECTIVES
The overall objective of this study is to evaluate the effectiveness of postharvest facilities
(PHF) and assets in the context of upgrading value chains and improving economic outcomes for
small holder farmers. The specific objectives are:
(1) Survey existing literature and secondary data to characterize PHF project identification,
selection, expenditures, assets, and impacts, within a framework of value chain upgrading,
and identify a suitable selection of study sites and projects.
(2) Assess a representative set of PHF covering projects in terms of quality, utilization, and
operations, and maintenance, based on appropriate indicators, according to the following
categories:
● Threshers, dryers, and other facilities proximate to harvest;
● Processing and storage facilities (e.g. milling equipment, ice plants, cold storage,
warehouses)
● Market infrastructure and transport facilities
(3) Based on objectives (1) and (2), identify strengths and weaknesses/problem areas in the
project cycle of PHF projects, in terms of identification, selection, implementation, and
operation and maintenance.
4. GENERAL APPROACH AND METHODOLOGY
4.1. Identification of PHF for Impact Assessment
4.1.1. General Analytical Framework
The general analytical framework to assess the impact of PHF projects in the Philippines
including program management is presented in Figure6. The study collected primary and
secondary data pertinent to the impact assessment. Engineering and economic efficiency
indicators were used to measure the effectiveness of the PHF projects in upgrading value chains.

28
Figure 6. General Analytical Framework
4.1.2. Characterization of Postharvest Facility Projects
Requests for information on postharvest programs of the Department of Agriculture were
sent to the concerned agencies such as the Agribusiness & Marketing Assistance Service (AMAS)
and PHILMECH. The information requested covered the background of various postharvest
programs (e.g. program rationale, budget requested, original proponent, and implementing
agencies), as well as the current status of the program if available. Further information was
obtained from websites of the government agencies concerned.
4.1.3. Selection of PHF Projects, Commodities, Study Sites and Respondents
Examples of PHFs established by the Philippine government include barangay and municipal
food terminals, cold chain systems, rice processing plants, and marketing and distribution
infrastructure (farm-to-market roads, port areas, nautical highways). Projects implemented to
establish PHFs and target commodities were selected for evaluation based on amount of
government investment, impact potential on beneficiaries, and relevance to current government
programs and thrusts. Furthermore, the focus of the impact assessment was on projects that had
been on-going for a number of years enough to ensure sufficient data.
Study Sites
In order to be representative nationwide, study sites were distributed between the Luzon,
Visayas and Mindanao group of islands. Target commodities were rice, high-value crops (fruits
and vegetables), and aquatic products. Information on PHF projects and priority commodities
were obtained from the DA and its agencies and programs, including PHILMECH, Agribusiness
and Marketing Assistance Service (AMAS), Bureau of Fisheries & Aquatic Resources (BFAR) and
the High-Value Crops Development Program (HVCDP). Based on assessment of information
gathered by the Impact Assessment team, study sites were centered on the four Rice Processing
Centers (RPC) granted by KOICA since these have been in operation for at least two cropping
seasons. These primary sites were Sta. Barbara (Pangasinan), Matanao (Davao del Sur), Pilar

29
(Bohol), and Pototan (Iloilo) (Table 9).Using these sites as the hub, secondary sites with food
terminals, flatbed dryers, and threshers were selected
Table 9. Matrix of postharvest facilities for evaluation Island (Province) Rice Processing
Centers Municipal/Barangay Food Terminal
Cold Chain Facilities
LUZON Region1 (Pangasinan)
Region 2 (Aurora) × × VISAYAS
Region 6 (Iloilo) × Region 7 (Bohol) ×
Mindanao Region 11/12
(Davao del Sur)
(South Cotabato)
Originally, fishports with cold storage were included in the list of facilities to be studied. These
were eventually excluded because the facilities were found to be non-operational during the
initial field assessment conducted by the Impact Assessment Team. These were the fishports in
Sual, Pangasinan and in Estancia, Iloilo. Tramlines were also removed from the list of facilities
since these services are located in areas outside the provinces that were earlier selected.
Rice Processing Centers
Rice remains to be a major crop of concern of the DA. Rice processing centers make up a
significant portion of the budget of the DA allotted for the Rice Mechanization Program, the
flagship program of the current administration. Evaluation of engineering aspects of rice
processing centers was done using PAES 206:2000 as a guide.
Flatbed Dryers and Rice Threshers
Distribution of flatbed dryers and rice threshers is also a component of theRice Mechanization
Program. Flatbed dryers and threshers within the province where the KOICA-RPCs are located
were included in the evaluation.
Food Terminals for High-Value Crops
For impact assessment of BFTs and MFTs, study sites were selected based on identification of
a BFT-MFT pair that allows tracing the movement of produce from the barangay to the
municipality. At present, only BFTs and MFTs have had sufficient time to operate, while regional
trading centers were only established in 2014. In addition, BFT-MFT pairs were chosen in sites
with RPCs to maximize the time of team members; specific sites were identified in collaboration
with the DA-AMAD and MAOs. Within the areas of RPCs
Since some primary processing operations (e.g. trimming, washing, sorting) are performed in
municipal food terminals, the Philippine Agricultural Engineering Standard (PAES) 418: 2002
was used as a guide for evaluating these types of facilities.
The specific sites of the study by region and by PHF are given in Table 10.

30
Table 10. Study sites per province
PROVINCE RPC MFT BFT Flatbed Dryer THRESHER
Pangasinan
Pangasinan
Rice
Processing
Center—Sta.
Barbara,
Pangasinan
BFT-Mona,--
Brgy. Mona,
Alaminos
City
Alaminos Alaminos City FAF
Amandiego FO Timpuyong Ulog Danggit Pamililya
Amanalon Amagbangan FA
Alaminos Purok Sto. Rosario
Association Hundred Islands FO Alaminos City FAF,
Alcala Pindangan Coop
Davao del
Sur
Davao Rice
Processing
Complex-
Matanao,
Davao del Sur
BFT-Kiba-0--
Brgy. Kiba-O
Matano , BFT
Kinuskusan,--
Brgy.
Kinuskusan,
Bansalan, BFT –
Malawanit--
Brgy.
Malawanit,
Magsaysay,
Magsyasay Badagoy Irrigation
Association Balaka Na Pulo
Communal Irrigation Association
Albatana Malabis Communal Association
Digos City SARBIDA
Bansalan Lower Marber IC
United FO
Digos City Sarbida
Magsaysay Magsaysay FO
Badagoy IA Albatama Malabis Communal Assoc
Iloilo
Iloilo Rice
Processing
Complex-
Pototan, Iloilo
MFT- Leon MFT- Tubunga
n
BFT
Jolason—
Tubungan ,
Iloilo
Leon Talacuan FO Isian Norte
Umambong FO Anoca IA’s
Leon Talacuan FO Lanang FO
Tubungan
Tubungan Federation FO
Tubungan Tabat FO
Tenyente Benito F Tubungan
Zone 3 Tubungan FO Bikil FO
Bankal FO San Miguel
Federated FO of San Miguel
Tigbauan Nagba Farmers MPC
Bohol
Bohol Rice
Processing
Complex—
Pilar, Bohol
MFT-
Guindulma
n
BFT-Rizal—
Brgy.
Rizal,Pilar BFT-Libaong,
Brgy.
Libaong,
Panglao
Dagohoy LACASANDA IA
Dagohoy Sab-D-Mil IA Ballidance IA
LACASANDA IA Pilar
EA, Irrigators Association BOFAMCO
San Isidro IA
Pilar BOFAMCO
San Isidro IA
4.1.4. Respondents and Respondent selection
A total of 529 respondents were interviewed for the study. Table 11 presents the number of respondents on a per type of PHF and on a per area basis.

31
Table 11. Number of respondents by PHF type per province
Province RPC MFT BFT
FBD T KI User Non
User RPC
Manager Supplie
r Costume
r Manager Supplier Costumer
Manager
Pangasinan 35 35 1 0 0 0 0 5 1 4 4 27 Davao del
Sur 31 32 1 0 0 0 30 33 3 4 6 34
Iloilo 32 30 1 21 13 2 4 8 1 6 10 23
Bohol 31 30 1 11 11 1 20 20 2 6 5 22
Total 129 127 4 32 24 3 54 66 7 20 25 106
In terms of respondent selection, in the case of the PRPCs, the lists of farmers who availed of
the services of the rice processing centers were secured from the RPC management. Thirty
farmers were randomly selected for each RPC. Another set of thirty farmers who do not avail of
the services of the processing complex were identified through the assistance of the Municipal
Agricultural Officers (MAO) of the town where the RPCs are located as well as from the MAOs of
the towns surrounding the RPCs. Respondents for the evaluation of barangay and municipal food
terminals were identified through the Barangay Captains (for the BFTs) and the Municipal
Agricultural Officer (for the MFTs). The respondents are farmers/fishermen supplying
agricultural/fishery products to the food terminals and customers of the food terminals (ie.,
vegetable/fruit traders (for MFTs) and members of households who buy from BFTs. Similarly,
respondents for the evaluation of the projects on flatbed dryers and threshers (farmers who
availed of the services of the facilities) were identified through the assistance of the respective
Municipal Agricultural Officers.
As to respondents for Key informant interviews (KII) representatives of key institutions
involved in the planning and or operation of PHF were targeted. These included local government
officials, heads of local units of the Department of Agriculture, plant managers and
representatives of the Board of Directors (BOD) of the RPCs and managers of BFTs and Appendix
1 presents the names of the key informants from each of the provinces visited by the Impact
Assessment Team. Farmers using the services of flatbed dryers and threshers were treated as key
informants since only a limited number (10 respondents per province) were interviewed due to
time constraint.
4.1.5. Data Collection
Questionnaires were used for data collection (Appendix 2). For suppliers of RPCs and food
terminals, questionnaires were structured to obtain information on before-and-after scenarios,
e.g., volume of paddy sold to the RPC or food terminal, price received for the product(s) sold,
selling price of the product when sold to other market outlets. Steps to minimize bias due to recall
were implemented, such as Benchmarking (recalling data for specific time periods, e.g., recent
wet season harvest or price paid by rice traders for the same wet season) and Triangulation
(recalling data about two or more time periods or sources of information, e.g., wet and dry season
paddy prices and paddy prices paid by rice traders versus RPC).
32
4.2. Impact Assessment of PHF
4.2.1. Appraisal Process
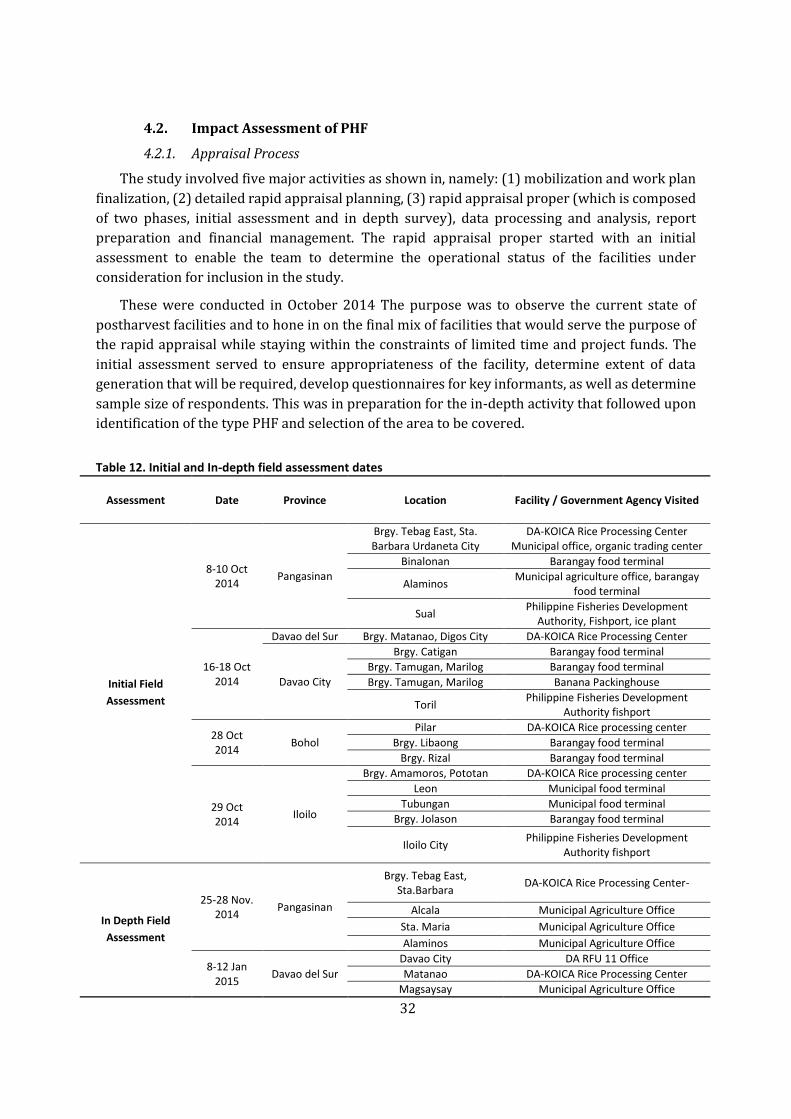
The study involved five major activities as shown in, namely: (1) mobilization and work plan
finalization, (2) detailed rapid appraisal planning, (3) rapid appraisal proper (which is composed
of two phases, initial assessment and in depth survey), data processing and analysis, report
preparation and financial management. The rapid appraisal proper started with an initial
assessment to enable the team to determine the operational status of the facilities under
consideration for inclusion in the study.
These were conducted in October 2014 The purpose was to observe the current state of
postharvest facilities and to hone in on the final mix of facilities that would serve the purpose of
the rapid appraisal while staying within the constraints of limited time and project funds. The
initial assessment served to ensure appropriateness of the facility, determine extent of data
generation that will be required, develop questionnaires for key informants, as well as determine
sample size of respondents. This was in preparation for the in-depth activity that followed upon
identification of the type PHF and selection of the area to be covered.
Table 12. Initial and In-depth field assessment dates
Assessment Date Province Location Facility / Government Agency Visited
Initial Field
Assessment
8-10 Oct 2014
Pangasinan
Brgy. Tebag East, Sta. Barbara Urdaneta City
DA-KOICA Rice Processing Center Municipal office, organic trading center
Binalonan Barangay food terminal
Alaminos Municipal agriculture office, barangay food terminal
Sual Philippine Fisheries Development Authority, Fishport, ice plant
16-18 Oct 2014
Davao del Sur Brgy. Matanao, Digos City DA-KOICA Rice Processing Center
Davao City
Brgy. Catigan Barangay food terminal Brgy. Tamugan, Marilog Barangay food terminal Brgy. Tamugan, Marilog Banana Packinghouse
Toril Philippine Fisheries Development Authority fishport
28 Oct 2014 Bohol
Pilar DA-KOICA Rice processing center Brgy. Libaong Barangay food terminal
Brgy. Rizal Barangay food terminal
29 Oct 2014 Iloilo
Brgy. Amamoros, Pototan DA-KOICA Rice processing center Leon Municipal food terminal
Tubungan Municipal food terminal Brgy. Jolason Barangay food terminal
Iloilo City Philippine Fisheries Development Authority fishport
In Depth Field
Assessment
25-28 Nov. 2014 Pangasinan
Brgy. Tebag East, Sta.Barbara DA-KOICA Rice Processing Center-
Alcala Municipal Agriculture Office Sta. Maria Municipal Agriculture Office Alaminos Municipal Agriculture Office
8-12 Jan 2015 Davao del Sur
Davao City DA RFU 11 Office Matanao DA-KOICA Rice Processing Center
Magsaysay Municipal Agriculture Office

33
Digos City Office of the Provincial Agriculturist
14-17 Jan 2015 Iloilo
Iloilo City DA RFU 6 Office Iloilo City Office of the Provincial Agriculturist Pototan DA-KOICA Rice Processing Center Pototan Municipal Agriculture Office
Leon Municipal Food Terminal Tubungan Municipal Food Terminal
Brgy. Jolason, Tubungan Barangay Food Terminal
5-7 Feb 2015
Bohol
Tagbilaran Office of the Provincial Agriculturist Guindulman Municipal Food Terminal
Pilar Barangay Food Terminal Pilar DA-KOICA Rice Processing Center
Panglao Barangay Food Terminal
4.2.2. Assessment of PHF Projects and Project Management
Assessing the impact of PHF projects involves a four-stage process. Figure 6 is a graphical
representation of the process.
Outputs are the “immediate results generated by a program or project upon its completion”
(Davis, et. al. 2008 in PCAARRD, 2013). The types of outputs can be determined from the
statement of objectives of the PHF projects. The information to be generated under the Outputs
Stage are:
1. The postharvest process(es) that is(are) being improved;
2. Types and number of postharvest facilities installed or awarded to the beneficiaries;
and Number of persons utilizing the facilities.At the Outputs Stage, the impact
indicators that will be used are:
a. Appropriateness of PHF installed/awarded to location-specific needs;
b. Degree of utilization of the PHF;
c. PHF capacity versus volume being handled;
d. State of PHF/ maintenance program;
e. Technology adoption strategy(ies) employed; and,
f. Degree of equity in PHF utilization among members of the community.
The proper design and use of Good Manufacturing Practices in postharvest facilities to ensure
safe and good quality products were also assessed (Yaptenco 2014; Yaptenco and Esguerra
2012). For cold chain projects, proper operation of facilities and use of appropriate temperature
management practices will be assessed (Yaptenco 2009).
Outcomes are changes in postharvest practices, product quality and/or quantity, increase in
income or general household welfare as a result of the adoption of project outputs by the final
users (Davis, et. al., 2008). Analysis of outcomes of the PHF programs/projects included the
following:
1. Determination of postharvest losses reduced due to the adoption of the PHF;
2. Savings gained by intended beneficiaries of the PHF; and
34
3. Number of jobs created by the PHF programs/projects.
Determination of reduced postharvest losses
Quantitative losses in drying and milling
Postharvest losses were classified as quantitative and quality losses. Quantitative losses
in rice after harvest are manifested by the decrease in milling and head rice recovery. Studies
conducted by PhilMech estimated that the practice of the traditional method of paddy drying
(sundrying) leads to quantitative losses reaching about 5.8% of total volume of dry paddy ready
to be milled. This is brought about by grain fissuring due to overheating the grain during the
drying process (i.e., when grain temperature exceeds 40 degrees Centigrade) as well as rewetting
which happens when there is a sudden downpour during sundrying. Losses due to grain fissuring
become evident only after the paddy is milled. Fissured grains come out as brokens after milling.
Small brokens are separated from the larger brokens and head rice and are sold as animal feeds.
Grain germination is another cause of grain loss when sundrying is delayed for more than a day.
The amount of reduced quantitative losses due to sundrying was estimated using the monthly
paddy procurement by the RPCs for 2013 (available data was for Pangasinan and Davao Del Sur
only) and 2014. Applying the 5.8% loss due to drying, the magnitude of losses was determined
by assuming that this volume of procured paddy were instead dried using the traditional method.
Losses in the milling process are caused by technically inefficient milling machines resulting
in low milling recovery. Private millers commonly operate single-pass village mills which have a
rated milling recovery of 60%. Smaller mills use the Engleberg steel mill which has a lower (50-
55%) milling recovery. These mills produce more brokens that are mixed with the rice hull and
bran and are sold as animal feeds. In contrast, a multi-pass modern rice mill produces a milling
recovery of 65-70% (or an average of 68%) (IRRI, 2014)1. All KOICA-RPCs are equipped with a
multi-pass rice mill. The amount of milled rice that would have been lost was determined by
computing for the difference in the milled rice yield obtained from the KOICA-RPC rice mills and
from the traditional single-pass rice mills of most private millers. This was done using the total
procurement of the RPCS for 2013 and 2014 as basis for the computation.
Quality Losses
Paddy harvested during the wet season commonly has a high moisture content which
ranges from 21 to 28 %. When left in this condition, grain discoloration (grain yellowing)
gradually occurs at a rate that is directly proportional to the number of days that drying is
delayed. The market price of milled rice with a considerable amount of discolored grains is lower
than the price of the same commodity with no yellow grains. Thus, an economic loss (which is
termed, Value Loss) is incurred when paddy is improperly dried. Value loss can be estimated
using the formula (Teter, 1987)2:
% paddy value = 100 – 3.51 D 0.35 x (M-15) 0.69
1 International Rice Research Institute. Rice Milling. www.knowledgebank.irri.org (accessed 2/9/15) 2Teter, Norman. 1987. Paddy Drying Manual, Agricultural Services Bulletin 70, FAO, Rome.

35
Where: D = number of days the wet paddy was held without drying starting at 20:00 hrs on the
day of harvest
M= moisture content, % wet basis
100 = 100% of the value of the paddy after milling if it were dried immediately
Table 13 provides the percent value of paddy with delayed drying compared to 100% value
of paddy that was properly dried. If paddy at 22% moisture content (MC) is held 10 days without
drying , “the rice obtained from it will be worth 70% of the value of rice that could have been
milled from the same paddy if it had been dried immediately” (Teter).
Table 13. Percent value of paddy with delayed drying compared to 100% value of paddy dried on the day of harvest
Quality deterioration due to delay in threshing was computed following the results of the
study conducted by Mendoza and Quitco, former researchers of the National Postharvest
Research Institute (now PhilMech). The percent of yellow kernels obtained from the number of
days threshing is delayed is summarized in Table 14. The percentage of yellow kernels was
dovetailed with the buying price of the National Food Authority (NFA) for paddy. However, the
price matrix was based on 1985 paddy buying prices. This was adjusted to the equivalent current
prices.

36
Table 1. Percent of yellow kernels by day of threshing delay
Qualitative data based on key informant interview were used in the impact evaluation of
flatbed dryers. This included utilization rate and perceived benefits generated from the facilities.
Savings gained by intended beneficiaries of the BFTs and MFTs
Farmers/fisherfolks benefited from the presence of BFTs in terms of having an assured
market outlet for their harvests. The economic indicators used in measuring benefits derived
were 1) savings in transport cost and 2) added income. Savings in transport cost represents the
difference in transport cost that producers would otherwise incur to bring their product to the
town market in the absence of the BFTs. Added income, on the other hand, is the increase in
income from selling the products to the BFTs based on the buying price of the BFTs versus the
price paid by other market outlets.
Net Benefit Derived from the Projects
The Impact Evaluation was able to estimate the returns to public investment of the KOICA-RPCs. However, since the facilities have only been operating for three harvest seasons at the most, the usual financial measures (e.g., Internal Rate of Return, Net Present Value) would not provide a realistic analysis. In lieu of these measures, the study employed the Capital Recovery Approach. This approach measured the extent by which the project investment has been recovered based on the monetary value of the benefits generated by the project.
Only qualitative data were generated for the other PHF projects. In this case, quantitative measures of returns to investment was not possible.
Employment Generated
Creation of opportunities for employment is considered a component of the benefits that can be derived from the PHF projects. The jobs created by the projects were determined by asking the RPC managers and the Municipal Agricultural Officers of the respective MFTs/BFTs and threshers/flatbed dryer projects to identify the various personnel hired by the projects including the salaries and wages that they receive.

37
4.2.3. Evaluation of Project Management
Evaluation of project management included the (1) assessment of decision-making process
to identify the type and capacities of PHF, as well as the location and beneficiaries of the project,
(2) criteria used for choosing PHF suppliers/manufacturers, and (3) presence or absence of a
project monitoring system.
Operational evaluation was undertaken to determine if implementation of identified PHF
programs was carried out as planned. The evaluation was based on initial project objectives,
indicators, and targets. Interviews with program beneficiaries and implementers/proponents
were used to gather information. The objective was to compare planned outputs with actual
outcomes, and to determine if there were gaps between expected and actual outputs. Lessons for
future project proposals and implementation were also identified (Khandker 2010).
4.2.4. Identification of Strengths and Weaknesses in Identified PHF Programs and Projects
Parameters that could affect the performance of a PHF will include proximity to production
areas and markets, access to transport and storage infrastructure, availability of technical
support (repair, maintenance, and operation), presence of a reliable and adequate water and
power supply, labor availability, and local weather conditions and geography. Inaccessibility of
markets and inadequate support for farmers may be seen as manifestations of coordination
failure, where despite profit opportunities for service providers, farmers, and buyers,
coordination failure prevents the supply chain from assuring timely flow of supply from farmers
(Briones and Galang, 2013).
Other factors examined include presence/absence of political interference, qualifications of
personnel of implementing agencies. Similarly, coping mechanisms and modalities of emerging
responses to challenges and potentials are worth documenting as well.
4.3. Study Timeline
The study duration was for 6 months from October 7, 2015 to March 30, 2015. Rapid appraisal
proper was done for the first four months of the study, from October to February while the
remaining months were devoted to analysis report writing. A brown bag seminar where
preliminary results of the study was conducted in February 10, 2015. The idea was to generate
feedback and have enough time to incorporate them in the study’s final report.
5. RAPID ASSESSMENT RESULTS
5.1. Postharvest Facility Description and Technical Assessment
5.1.1. KOICA Rice Processing Centers
Project Background
Four modern rice processing centers (RPC) from South Korea were established in Pangasinan
(Sta. Barbara), Iloilo (Pototan), Bohol (Pilar), and Davao del Sur (Matanao) (Figure 1) under a
project entitled “Establishment of Modern and Integrated Rice Processing Complexes in the

38
Philippines”. The project proposal was developed by the Bureau of Postharvest Research &
Extension (BPRE) under DA in Aug 2008. A project evaluation team was sent by South Korea in
Dec 2008; after evaluation, the Korean government approved the project for funding through the
Korean International Cooperation Agency (KOICA); hence, the project was also known as the
KOICA RPC Project. On the Philippine side, the project was approved by the National Economic
Development Authority (NEDA) in April 2009. These RPCs are intended to duplicate the loss
reduction achieved by the Korea-Philippines Integrated RPC established in Baler, Aurora in 2006;
postharvest losses were reduced from 15% to 8% using the modern facility.
The main objective of the KOICA RPC Project was “to increase the income of farmer-
beneficiaries by improving the efficiency of their rice post production system thru the provision
of integrated and modern rice processing facilities and equipment”. With these facilities, the
project was expected to (1) produce good-quality milled rice, (2) reduce postharvest losses, (3)
improve the distribution system of rice, and (4) maximize the utilization of rice byproducts.
Implementation of the project started in 2009. The first facility to be established was in
Pangasinan in 2010, followed by the RPCs in Iloilo, Bohol and Davao del Sur. All RPCs were
projected to be fully functioning and managed by farmers’ organizations (FO) by 2014.
The project was implemented in four phases. Phase I (pre-project phase) included
development of the project proposal, site selection, coordination activities with local government
units (LGU), and presentation and modification of the proposal to the Philippine and South
Korean governments for final approval. The lead agency in charge of this phase was the Project
Development Services division of the Department of Agriculture. Phase II (construction phase)
involved site preparation and development through LGUs, facility construction and installation of
equipment by KOICA, testing and commissioning, and turnover of the facility to the Philippine
government (represented by the DA and its regional office, as well as the concerned LGU). Phase
III (pre-operation phase) involved preparations for business operations of each facility. Activities
for this phase included consultations with farmers, establishment of the RPC Professional
Management Team, business planning and trial operations. Phase IV (operations phase) focused
mainly on operations needed to run each RPC as a full business by a FO.
Implementing Agencies
The three main agencies involved in implementing the KOICA RPC Project were the KOICA,
the Department of Agriculture, and LGUs. The four facilities were established with a PhP 649-M
grant provided by the KOICA which covered facilities and equipment, training of operators, and
travel of Korean experts to project sites. The Philippine government provided PhP136.45-M in
counterpart funding to cover freight and taxes, purchase of a 1-ha lot, site development, and
expenses incurred by government implementing agencies. The FO designated as recipient of the
RPC is required to provide a PhP2-M counterpart fund as additional operating capital.
Agencies of the Department of Agriculture were actively involved in the implementation of
the KOICA RPC Project. The functions of each agency are shown in Table 15.

39
Table 15. Implementing agencies of the Department of Agriculture under the KOICA RPC Project
Technical Assessment
Technical aspects of the various RPCs around the Philippines are shown in Table 16; the
information shown was gathered from interviews with key informants within each RPC and
government agencies implementing the project.
Degree of Utilization
As a modern rice milling facility, each RPC is provided with a multi-pass milling system
composed of rice hullers, aspirators, color sorter and length grader (Figure 7). The rice mill can
produce 2.5 tons of milled rice per hour; for an 8-hour shift per day, this translates to 20,000 kg
of milled rice per day. Assuming an average milling recovery of 65%, the estimated dried paddy
requirement is 30,769 kg per day. An estimated volume of 10,769 kg per day of byproducts (rice
hull, bran) is produced.
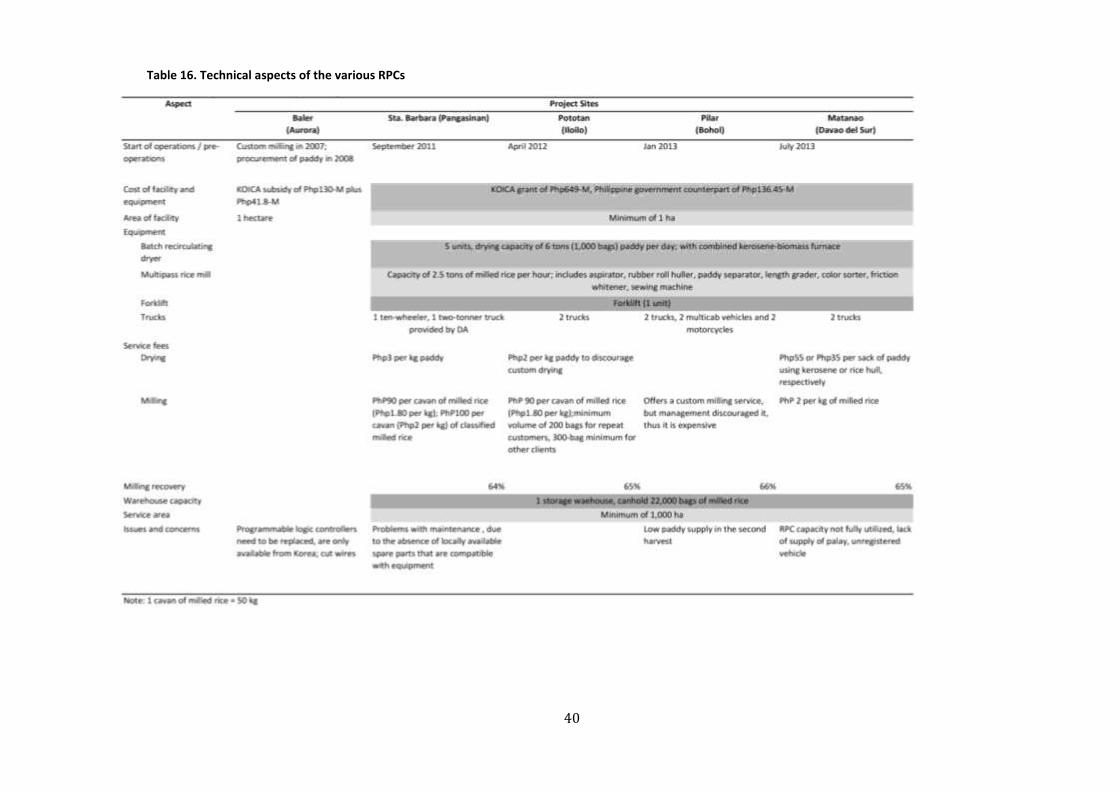
40
Table 16. Technical aspects of the various RPCs

41
Figure 7. Facility and equipment provided by the Korean International Cooperation Agency for each Rice Processing Center.

42
To produce dried paddy, each RPC is equipped with five batch recirculating dryers with a
drying capacity of 6 tons per day per dryer; total capacity of each facility is 30 tons per day. For
an average moisture content (MC) of 28% wet basis and a target MC of 14%, about 25,120 kg per
day of dried paddy can be produced per 8-hour shift. During periods of oversupply, RPCs can
operate beyond this period to dry larger amounts of grain. Based on information from the RPC
manager in Pototan, the number of days of operation is 23 (30 days – 4 weekends – 3 days
maintenance); if paddy is procured daily for 23 days, the RPC should purchase 690 tons per
month to fully utilize the dryers. Once dried, the paddy is stored to allow moisture in the grain to
equalize in a process known as tempering. This is said to increase the head rice yield.
Based on procurement data provided by RPCs, availability of paddy for drying and milling
seems to be inadequate to fully utilize the capacities of the facility. Figure 8 shows the volume of
procurement for RPCs in Sta. Barbara (Jan – Dec 2013), Matanao (Jan – Sept 2014) and Pototan
(Jan – Dec 2014). Paddy procurement in Sta. Barbara shows a distinct peak during September and
October, reaching approximately 600 tons for these months. Procurement during the rest of the
year is markedly lower. Procured volume in Matanao is more evenly distributed and larger
compared to the Sta. Barbara RPC, with peaks in March and September. The paddy volume
procured by the Pototan RPC is much lower compared to Matanao and Sta. Barbara, with the peak
procurement occurring in September. No data was available from the Pilar RPC.
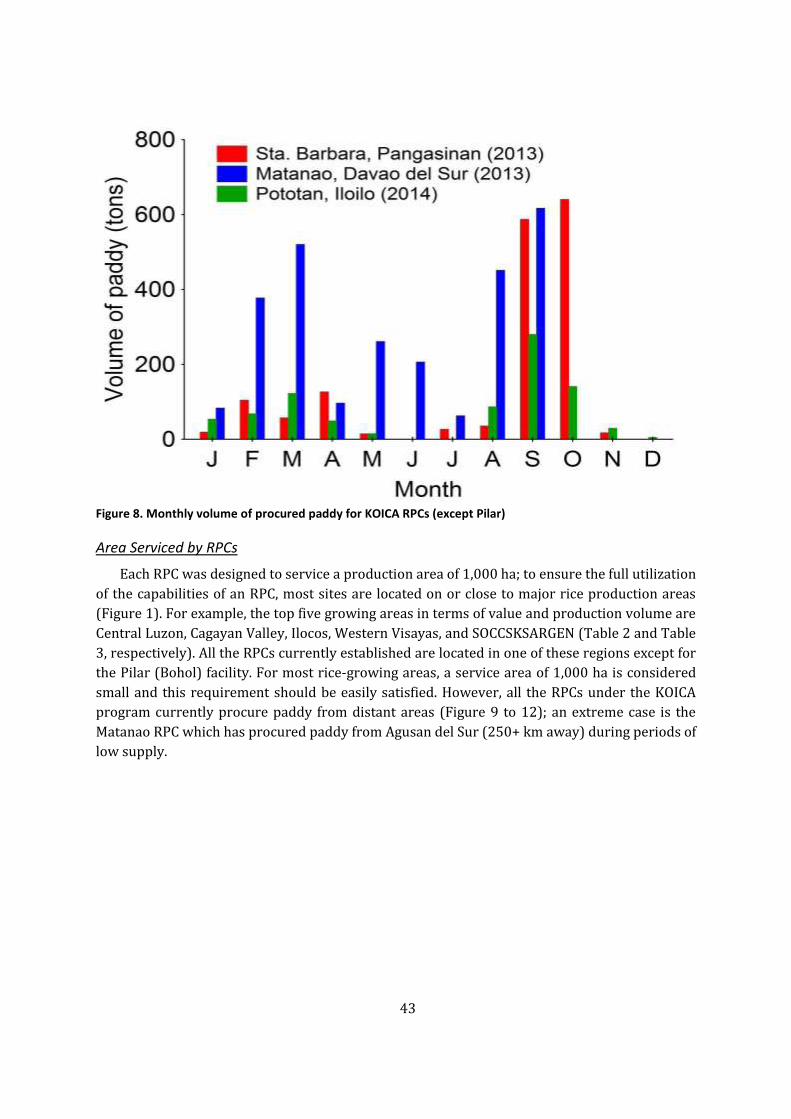
43
Figure 8. Monthly volume of procured paddy for KOICA RPCs (except Pilar)
Area Serviced by RPCs
Each RPC was designed to service a production area of 1,000 ha; to ensure the full utilization
of the capabilities of an RPC, most sites are located on or close to major rice production areas
(Figure 1). For example, the top five growing areas in terms of value and production volume are
Central Luzon, Cagayan Valley, Ilocos, Western Visayas, and SOCCSKSARGEN (Table 2 and Table
3, respectively). All the RPCs currently established are located in one of these regions except for
the Pilar (Bohol) facility. For most rice-growing areas, a service area of 1,000 ha is considered
small and this requirement should be easily satisfied. However, all the RPCs under the KOICA
program currently procure paddy from distant areas (Figure 9 to 12); an extreme case is the
Matanao RPC which has procured paddy from Agusan del Sur (250+ km away) during periods of
low supply.

44
Figure 9. Sources of paddy for Pototan RPC (Iloilo)
Figure 10. Sources of paddy for the Sta. Barbara RPC (Pangasinan)

45
Figure 11. Sources of paddy for the Pilar RPC (Bohol)
Figure 12. Sources of paddy for the Matanao RPC (Davao)

46
Based on a national average yield of 3.47 tons of wet paddy per hectare, the estimated service area for a single year was 469 ha, 771 ha and 245 ha for the Sta. Barbara, Matanao and Pototan RPCs, respectively (Figure 13).
Figure 13.Estimated growing area serviced by RPCs (except Pilar)
The limited utilization of each RPC may be due to:
1. Existing agreements between farmers and private traders which limit the volume of
paddy that can be procured by each RPC;
2. Limited operating capital which restricts the volume of paddy that can be procured by
RPCs;
3. Lack of awareness of farmers on the services of RPCs;
4. Unprogrammed planting leading to oversupply of paddy during certain months of the
year and shortages during the rest of the year.
Operation & Maintenance
The majority of equipments in all RPCs are mostly sourced from South Korean manufacturers.
Interviews with key informants indicate that replacement of parts is difficult due to the lack of an
accredited Philippine distributor. Locally available parts are not compatible with the machines
installed in RPCs.

47
During the rapid assessment, RPCs were generally observed to be operating under hygienic
conditions in stark contrast to village-level rice mills where dust is an ever present health hazard.
Cleanliness can still be improved since scattered grain in floor areas and cobwebs in ceilings were
observed, indicating a need to implement a more thorough cleaning program. Working areas are
well-lighted, safe and danger zones are clearly delineated, and equipment are labeled.
Impact Assessment
Table 17 shows a matrix of the actual impact that the KOICA RPC Project has had on the rice
industry within the locale of each RPC. Initial and in-depth assessments show that the overall
impact of the project has been positive. With its modern equipment and well-trained personnel,
RPCs are generally able to produce properly dried paddy, which in turn ensures good-quality
milled rice.
Table 17. Impact of the RPCs on the domestic rice industry

48
Since RPCs are equipped with mini-rice mills that can be used for predicting milled rice
quality, the RPC can decide quickly whether to accept or reject procured paddy. The presence of
RPCs also provides a safety net for farmers during periods of oversupply, when drying facilities
are overwhelmed and private traders are not willing to accept wet paddy and/or offer very low
buying prices.
The Pilar RPC follows a pricing scheme based on MC of procured paddy and prevailing market
price of dried paddy (14% MC); this scheme is shown in Figure 14 based on data provided by the
RPC. The practice of the RPC is to offer a buying price for paddy at 14% MC that is higher than the
market price by PhP 0.50 per kg; this is then adjusted according to the actual MC of the procured
paddy. The RPC also does not go below the NFA-dictated price of PhP17 per kg, even if market
price is below this level. This gives an objective means of pricing paddy while giving an incentive
to growers to sell their paddy to the RPC. For example, if the prevailing buying price for dried
paddy is PhP19.50 per kg, the RPC will offer to buy at PhP20 per kg. If a farmer has wet paddy at
21% MC, then the adjusted buying price based on Figure 14 is PhP18 per kg.
Figure 2 Pricing scheme for procurement of paddy from RPC suppliers. The buying price is a function of moisture content of paddy and the prevailing market price for well-dried paddy (14% MC).
49
Food Terminals
Project Background
The Agrikulturang Pinoy (or Agri-Pinoy) Trading Center program of the Department of
Agriculture (DA) has a total investment target of PhP3.5-B (NEDA 2014). Previous government
administrations have pursued similar programs, such as Pres. Gloria M. Arroyo’s poverty- and
hunger-reduction programs called “Gulayan ng Masa”, “Food for School” and “Tindahan Natin”
(The News Today 2007). For the period of 2007-2013, the project has been able to establish 186
MFTs and 1,258 BFTs.
High-value crops are classified mainly into fruits or vegetables. For fruits, production in terms
of volume is centered in the main island group of Mindanao (58%) (Table 4). The top five fruit-
producing regions by volume are Northern Mindanao, SOCCSKSARGEN, Davao, Western Visayas,
and Cagayan Valley regions. For vegetables, however, 68% of production in terms of volume
comes from the Luzon island group. The top five vegetable-producing regions are Cagayan
Autonomous, Ilocos, CALABARZON, Central Luzon, and Cagayan Valley regions. In terms of
aggregate value of production of high-value crops, the top five producing regions are Davao,
Northern Mindanao, SOCCSKSARGEN, Ilocos and Western Visayas regions (Table 5). Most of the
BFTs are clustered in the CAR (13.3%) to cater to the large number of highland vegetable farms
in the region (Table8). Regions III and V also received large numbers of BFTs with 10.5% and
10.0%, respectively.In terms of MFTs received, the top three recipients were Regions III, IVb, and
NCR with 26%, 11%, and 9%, respectively (MADECOR 2013). The location on MFTs to be
established in 2013 relative to fruit and vegetable production areas are shown in Figure 3 and
Figure 4, respectively.
As earlier cited in the report, the regional trading centers are in various stages of planning
and construction with only the facility in Urdaneta, Pangasinan the closest to completion. In fact,
the facility which is mainly targeted for lowland vegetable farmers (Macam 2014) had a soft
launch in July 2014.Since only BFTs and MFTs have been operating for several years, only these
facilities were expected to have sufficient data for impact assessment.
Barangay & Municipal Food Terminals
BFTs and MFTs were designed to function as food depots and distribution systems that could
offer safe and quality food products such as meat, poultry, fish, vegetables and fruits. Since each
food terminal is located within farming or fishing area, it can provide direct links between
suppliers and consumers. BFTs are facilities that serve as a food distribution point at the
barangay level, where farmers can bring their produce for sale as well as purchase food and non-
food products at low prices. MFTs are designed to function as trading centers where growers can
bring produce in large volumes for direct trading with wholesalers. Thus, trading layers or
middlemen are reduced leading to improved income for producers. The objectives of the program
are to:
1. “To provide farmers and fisherfolk immediate access to markets;
2. To make available and accessible agri-fishery commodities and basic necessities at
affordable prices;

50
3. To create employment opportunities through the project’s livelihood component and its
forward and backward linkages;
4. To capacitate the operators to become entrepreneurs by providing trainings on
enterprise development and other technical support;
5. To strengthen the partnership between LGUs and private sectors and other stakeholders
in the delivery of basic goods and services in the community” (AMAS 2013).
Expected impact of the program includes:
1. Increased income of agri-fishery producers
2. Availability of safe, nutritious and affordable food
3. Creation of employment opportunities for food repacking, processing and delivery
4. Income generation for local government units
Eligible barangays or municipalities were considered as recipients of a food terminal
according to the following criteria:
1. Areas identified by the Department of Social Welfare & Development (DSWD) as
depressed areas
2. Located in areas with high population density
3. High demand for low-priced wage commodities
4. Located in provinces with Priority 1, 2 or 3 ratings in the National Hunger Mitigation
Program (NHMP).
Implementing Agencies
The Agri-Pinoy Food Terminal Program is implemented mainly by the DA Agribusiness &
Marketing Assistance Service (AMAS) in collaboration with LGUs and registered farmer or fishers’
organizations as project recipients.
Funding up to PhP150,000 for trading capital, building improvement and training is provided
for each BFT. Equipment such as freezers, chillers, meat processing equipment, package sealers
and weighing scales are also provided based on the requirements of the site. Funding for
construction of MFTs is provided by the DA in the PhP500,000 to PhP1.5-M range.
As a basic policy of the program, beneficiaries must be able to provide counterpart inputs
such as land for the facility, an existing building or structure, initial operating capital, and a
management team to operate the facility.
Technical Assessment
Table 18 gives the technical description of BFTs visited during the impact assessment. Since
these facilities are intended as retail outlets at the community level, they are generally single-
story structures without air conditioning (Figure 15). These are generally equipped with simple

51
equipment for food processing and storage, weighing and packaging, as well as display stands for
fresh produce.
Table 19 gives the technical description of MFTs that were evaluated. The structure generally
resembles a gymnasium, open on all sides with a high roof line to promote air circulation. The
floor area is kept free of obstructions to allow the free movement of goods and people; concrete
is used for durability, ease of cleaning and to promote mobility of goods and equipment. Figure
16 shows some typical structures for MFTs.

52
Tab
le 1
8. T
ech
nic
al d
esc
rip
tio
n o
f b
aran
gay
foo
d t
erm
inal
s vi
site
d d
uri
ng
the
imp
act
asse
ssm
en
t

53
Tab
le 1
9. T
ech
nic
al d
esc
rip
tio
n o
f m
un
icip
al f
oo
d t
erm
inal
s vi
site
d d
uri
ng
the
imp
act
asse
ssm
en
t

54
Figure 15. Barangay food terminals in Bohol (top) and Davao City (bottom) serve as retail outlets for the community.

55
Figure 16. Municipal food terminals in Alaminos, Pangasinan (top) and Guindulman, Bohol (bottom)
56
Operational Status
At present, there are varying levels of operational status of BFTs; 88%, 20%, and 9% of BFTs
are regularly operating, on irregular status, or non-operational, respectively. For MFTs, 69%, 1%,
and 30% are operating, on irregular status, or are not operating, respectively (MADECOR
2013).Net returns in high-value crops such as vegetables are 11 and 18 times higher than rice
and corn, respectively (Briones and Galang 2013). However, the presence of functioning trading
posts and packinghouses are essential to ensure that quality produce is brought to markets where
farmers can realize these types of returns.
The BFTs that were visited are mostly operational to varying degrees; level of operation and
utilization of a BFT is highly dependent on the quality of management that is in charge of the
facility. BFTs were also observed to be managed either by the LGU, a farmer or fishers’
cooperative, or a regional council. Households within the barangay where the BFTs are located
serve as suppliers of produce being sold at the terminal as well as consumers of the products
being sold there. Other BFTs documented by DA that are successfully operating include Manito
(Albay), MacArthur (Leyte), and Vega (Nueva Ecija). Techniques employed by BFTs to ensure
success include:
1. Selection of a strategic location – access to a road network and transport terminals (to
capture commuters), proximity to demand centers (churches, schools, government
offices)
2. Variety of products available – rice, meat and poultry, fruit, vegetables, root crops,
processed / canned goods, and dry goods are being sold in BFTs to serve as a one-stop
shop (sari-sari) that can serve the day-to-day needs of the community. Fresh produce
being sold in MFTs are also varied, especially with respect to vegetables (Table 20).
3. Paying suppliers in cash – farmers are attracted to bring their harvest to BFTs when
paid in cash; they may also choose the option of barter trade to procure goods with an
equivalent cash value. The system of lako-lako has been eliminated since farmers have a
ready market for their products. Postharvest losses, transport costs, and the time and
effort involved in marketing products are largely eliminated by selling to the BFT.
4. Selling at lower prices – BFTs can sell farm products at a lower price since these are
procured directly from suppliers.
5. Professional services – to ensure accurate and updated record-keeping and accounting,
some BFTs have hired full time staff. For example, BFT MacArthur has now hired an
administrative officer and bookkeeper; from 2 workers at the start of operations, the
BFT now has 9 full-time and 3 part-time staff.
6. Monitoring and recording system – this helps the BFT to program purchasing of goods
and satisfy demands of customers while minimizing waste due to over-procurement.
7. Quality assurance – BFTs should not be content with just maintaining sales volume, but
should strive to continually improve quality and safety of products being sold.
8. Synergy with local business – rather than competing with other local businesses, BFTs
can provide them with affordable raw materials and other necessities (DA-AFMIS 2013).
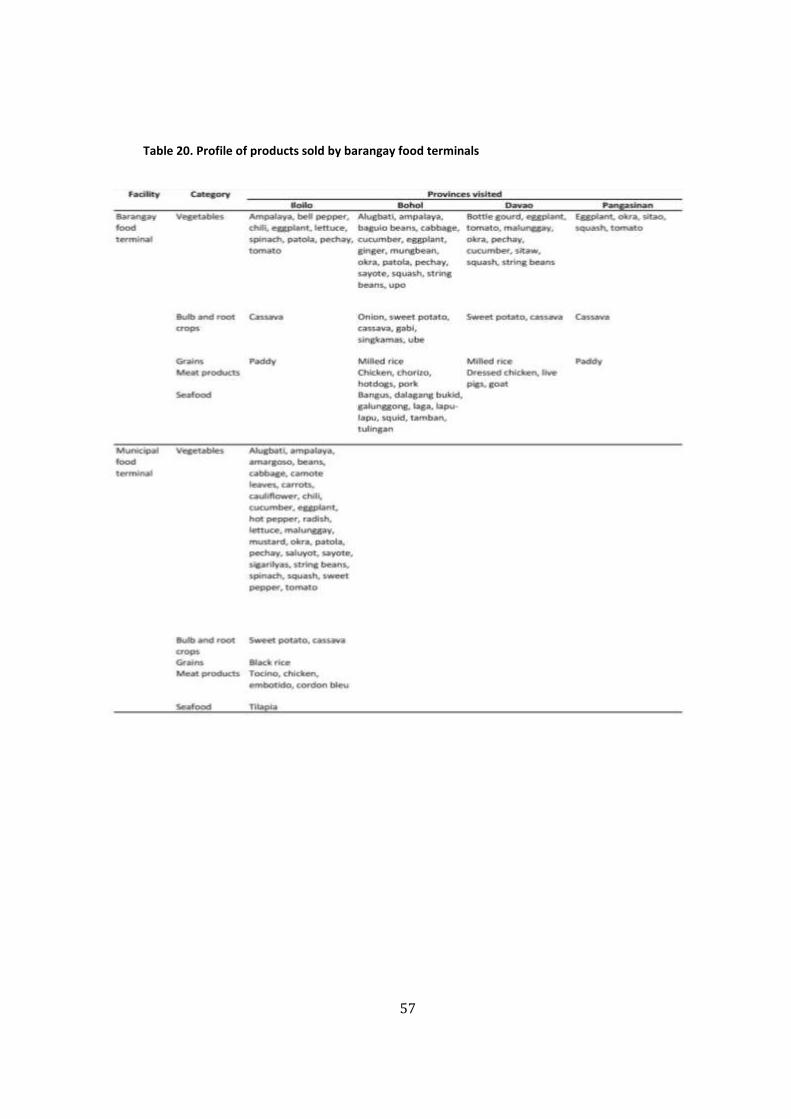
57
Table 20. Profile of products sold by barangay food terminals

58
Location of a MFT plays a major role in determining its utilization. The presence of an existing
major trading center that is already patronized by both wholesale suppliers and traders can result
in unused or under-utilized MFTs. For example, a MFT in Binalonan, Pangasinan is only
operational during Thursdays and Saturdays at present. Half of the facility is rented out to fresh
vegetable and fruit retailers and to fast food (carinderia) operators to augment earnings to cover
operating costs (Figure17).
The lack of utilization is due to Urdaneta City which has traditionally served as the meeting
point for suppliers and traders based in Manila. Since Urdaneta City is only 9.7 km away from
Binalonan, suppliers tend to bypass the MFT and go directly to Urdaneta which has an existing
trading center that is undergoing upgrading. The MFT in Villasis (9 km away from Urdaneta City)
is also underutilized for the same reason.
In contrast, the MFT in Leon, Iloilo is a commercially active facility with regular market days
(Figure 18). Agricultural produce is transported by farmers to the terminal daily and wholesaler-
traders frequent the facility to buy their goods. The facility was recently enlarged to provide more
space for trading. Traders are able to transact their business within a shorter time period by
using the food terminal. They are also assured that the products that they buy are graded
uniformly. Farmers, on the other hand, are assured of a market for their harvests and receive a
fair price for what they sell. The facility is actively monitored by the local government; only
registered traders are allowed to transact business to control the activities of middlemen and
unscrupulous traders. Operations of the facility are supported by a transaction fee charged to
traders; farmers do not pay any fees for use of the MFT.

59
Figure 17. Municipal food terminal in Binalonan, Pangasinan that is partially used as a food court due to low utilization. Inset shows the wholesale trading area sitting idle; it is used as a retail area on certain days of the week.
Figure 18. Municipal food terminal in Leon, Iloilo during a trading day. Wholesalers arrive with cargo trucks or jeepneys (inset) to procure fruits, vegetables and root crops for trading

60
Impact Assessment
For BFTs, the main impact is the reduction in transport cost on the part of farmers; since the
facility is located within the community, passenger fees in public transport are reduced or
eliminated entirely. Furthermore, for suppliers bringing their produce to market, the reduced
distance translates to less mechanical damage. For consumers, transport cost is also minimized,
while the variety and quality of fresh produce available to them is improved. BFTs also offer an
opportunity for entrepreneurs so engage in retail of fresh fruits and vegetables by providing a
venue at low cost. Table 21 and 22 summarizes the impact of barangay and municipal food
terminals, respectively, on suppliers and consumers with respect to the program objectives; these
are findings as reported by DA and as determined from interviews with key informants during
the impact assessment.
In general, the concept of establishing food terminals at the barangay and municipal level
appears to have uplifted several communities by providing employment, better food choices, and
reducing transaction costs. What is needed is to multiply the number of successful facilities by
studying what has worked for these food terminals and their communities and replicating them
on a case-by-case basis.
Operation and Maintenance
Repair and maintenance of chillers and freezers are the main technical problems encountered
by BFT managers. Since some of the facilities are in isolated areas, requesting inspection visits by
technicians is difficult. Equipment may be brought to service centers but requires a vehicle for
hauling.
The minimum requirements for a packing facility include providing protection from sun and
rain, proper flooring, providing ventilation, and sufficient lighting. For general working areas
within a packing facility, light intensity should be 200 lux. For working tables and surfaces, 500
lux should be provided. For 200 lux, three 20-W bulbs or one 40-W bulb should be provided for
every 10 m2 of work area. To achieve a 500-lux intensity, there should be one 20-W bulb per
square meter of work area (Yaptenco and Esguerra 2012).However, for some facilities observed
during the assessment, lighting may not be sufficient, especially for some facilities that are
blocked by surrounding structures or vegetation. The situation will be worsened at night if
workers are forced to sort and grade produce under limited lighting.

61
Table 21. Impact of barangay food terminals.
Table 22. Impact of municipal food terminals

62
Background of Flatbed Dryer Project
Technology Description
The UPLB flatbed dryer (FBD) was developed in the 1970’s as an alternative to large sophisticated dryers that were intended for use at the farm level. The original FBD had a batch capacity of 2 tons (40 cavans x 50 kg/cavan); about eight hours was needed to dry rice paddy during the wet season; this was reduced to four hours during the dry season. The dryer is composed of three main components: (1) a grain bin with perforated floor, (2) a blower to move conditioned air through the floor and grain mass, and (3) a burner as heat source. Despite its effectiveness in drying grain and simplicity in design and operation, adoption rates were low among farmers and traders. Farmers still preferred to sell wet paddy directly to traders or millers at very low prices, or dry the grain themselves. For the latter option, sun-drying was still the most financially viable. For traders, the capacity of the FBD was too low considering the amount of grain that was harvested during peak harvest season.
The Maligaya FBD is a modified version of the UPLB design, featuring a 6-ton capacity. This version was developed by PHILRICE and disseminated to farmers under the Fertilizers, Irrigation, Extension, Loans, Dryers & Postharvest Facilities (FIELDS) Program of the DA during the administration of Pres. Gloria M. Arroyo. Under this program, about 1,000 units of the Maligaya version were initially distributed (Ragudo 2011). Included with the dryer was a biomass furnace and drying shed; the total budget for each recipient was around PhP700,000.
The general objective of the program was to “preserve grain quality and reduce quantitative losses through appropriate and efficient drying technologies”. The specific objectives were (1) “to improve rice farmers’ productivity and income through expediting access of farmers to low-cost drying technology (mechanical dryer equipped with rice hull-fed furnace)”, and (2) “to reduce postharvest losses through provision and promotion of flatbed dryers”.
The FIELDS Program has since been superseded by the Rice Mechanization Program of the DA under the term of Pres. Benigno Aquino Jr. The program started in 2014 and will terminate in 2016; it has two main components, namely the (1) On-Farm Mechanization Program and the (2) Postharvest Mechanization Program. Under the postharvest component, flatbed dryers will continue to be disseminated along with other drying facilities and machinery such as recirculating dryers, mobile dryers, collapsible drying cases, and multi-purpose drying pavements.
Funding Source
Through a series of Administrative Orders (with accompanying amendments, addendums) in 2006 and 2007, the DA was able to tap the Agricultural Competitive Enhancement Fund (ACEF) to finance the dissemination of FBDs. The provision of FBDs through ACEF was considered a public investment to support the rice industry. Under the postharvest component of the GMA-Rice Program, the establishment of mechanical drying facilities was given priority; it was hoped that the program would satisfy 10-20% of the total drying requirement of the Philippines.
Fund releases for the flatbed dryer program totaled PhP 1.6-B, broken down by source as follows:
● PhP 500-M from ACEF funds
● PhP 982-M from DA funds in 2008 and 2009
● PhP 75-M from NHMP funds

63
Implementing Agencies
PHILMECH was the main implementing agency in cooperation with NABCOR, DA Regional Field Units, PHILRICE, the National Irrigation Administration (NIA) and local government units (LGUs).
Figure 19 shows the mechanics of the FBD program. PHILMECH was the proponent and main implementer of the program in line with its mandate to develop and extend postharvest technologies to reduce losses, increase quality of food and feed products, and promote food safety. Funds were received by PHILMECH and transferred to NABCOR, DA RFUs and PHILRICE. These agencies receiving funds from PHILMECH were responsible for fund management, as well as for procurement and installation of drying facilities. Aside from acting as the conduit for project funds, PHILMECH also provided the engineering plans for establishment of drying facilities.
A counter-parting scheme was implemented between the Rice Program and the dryer recipients. The program provided the FBD (with biomass furnace), shed and moisture meter as a grant. Recipients provided the land, an additional structure for storage, and initial operating funds and labor.

64
Figure 19. Mechanics of the flat bed dryer program implemented by PHILMECH as proponent of the flatbed dryer project under the FIELDS Program. Solid boxes within the dotted areas represent responsibilities of implementing agencies; common responsibilities cut across several dotted areas. Technical Assessment
Based on interviews with operators of drying facilities with FBDs, the main technical problem appears to be corrosion of the perforated steel flooring of the grain bin. The material initially specified was prone to rusting and deteriorated after a few growing seasons. The alternative material being recommended by PHILMECH is stainless steel sheet; this material is more resistant to corrosion but is much more expensive. A low-cost alternative is the use of bamboo slats overlaid with nylon netting to prevent grain from slipping through the gaps. This has been tested by operators and has been found to be effective.
The following observations were made during field assessment of FBDs:
1. Gauges are not in working condition – the drying temperature of the FBD when in use
should be in the range of 40-45oC. A stainless steel dial-type thermometer is provided for
monitoring air temperature. However, during assessment activities, thermometers of
some FBDs were not registering the correct temperature while drying paddy (Figure 20).
Furthermore, gauges for temperature or pressure should be properly labeled to inform
operators and inspectors of the parameter being measured.

65
Figure 20. Pressure and temperature gauges of a flatbed dryer in Alaminos, Pangasinan. Gauges should be properly labeled and replaced as soon as possible if malfunctioning. The temperature gauge at the right is showing a temperature reading of 90oC; however, drying temperature of rice paddy is supposed to be 40-45oC. Is the gauge malfunctioning or is it measuring air exhaust of the biomass furnace directly?
2. Lack of safety shields and warning signs – FBDs have rotating or oscillating components
when in use. These include the belt drive for the fan, the fan blades and the feeding
mechanism of the biomass furnace. To prevent accidental contact, safety shields should
be retrofitted to existing dryers (Figure 21). Engineering designs should be modified to
include shields if these are still lacking. Highly visible signage should also be provided as
a warning to operators. Hot surfaces on the biomass furnace should also be shielded
and/or labeled with warning signs to prevent injury.
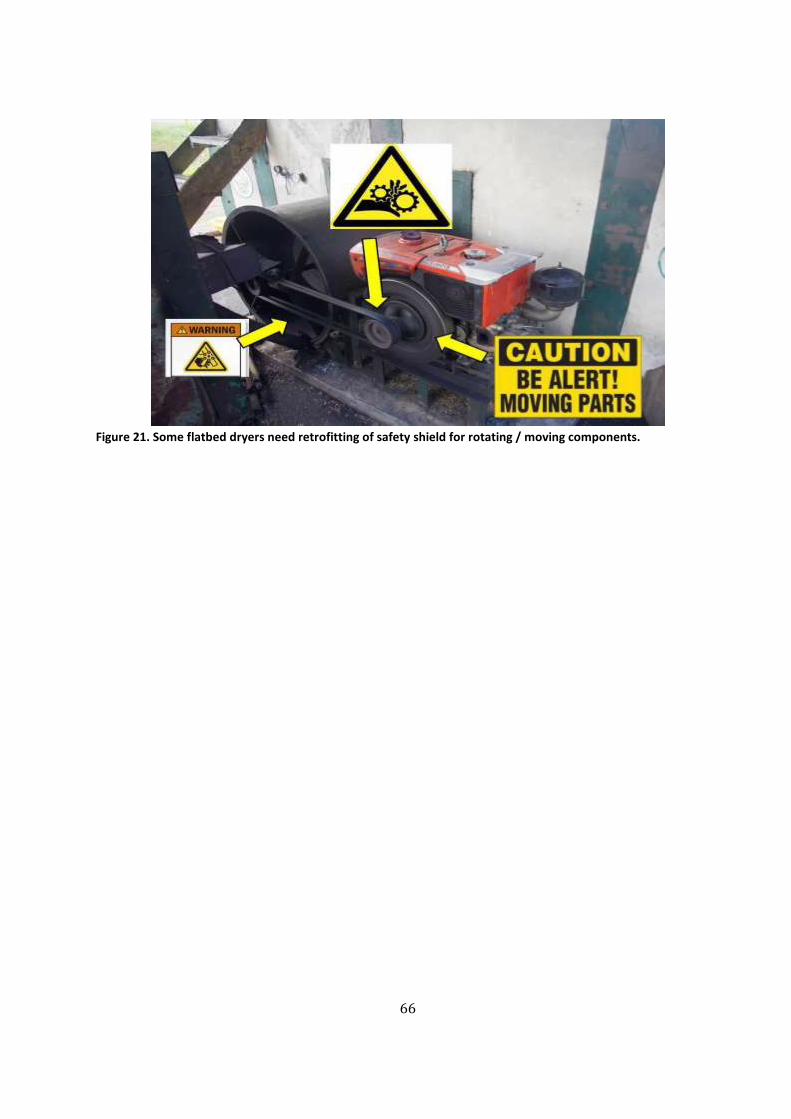
66
Figure 21. Some flatbed dryers need retrofitting of safety shield for rotating / moving components.

67
Regardless of the condition of the equipment or the need for safety features, the FBDs that were visited were all in working condition. Results of the in-depth assessment showed that farmers consider dryers as essential, especially during the rainy season. This is mainly due to weather which prevents them from using sundrying.
Impact Assessment
Based on results of the survey, the presence of the FBD eliminates the risk of grain deterioration during the rainy season. Deterioration takes the form of stress cracking, mold development, grain fermentation and grain sprouting. During the dry season, however, the impact of FBDs is less pronounced since farmers prefer the less costly method of sundrying (especially if grain volume to be dried is small).
5.2. Benefits Derived from the Postharvest Facilities Projects
5.2.1. Benefits Derived from the KOICA-Rice Processing Centers
Value Loss Prevented When Farmers Sell Wet Paddy to the KOICA-RPCs
The value loss prevented when farmers sell their wet paddy to the KOICA-Rice Processing
Centers was estimated using Teter’s formula. The paddy sold to the RPCs would have been dried
improperly if the RPC facilities were not established since farmers would have no choice but to
sell to the traders/millers.
Actual paddy procurement of the KOICA-RPCs during the months of July to October was used
for the value loss estimation (Table 23). July to October are the months when the wet season
harvest for paddy occurs. The value loss estimation further assumes that majority of private
traders and millers use sundrying to dry the paddy that they procure and that, on the average,
drying is delayed for three days during these months for every batch of paddy procured. The
percent moisture content used was the average of the moisture content of paddy for the indicated
months of procurement. Thus, the resulting MC values were: 27.53% for RPC Pangasinan (i.e.,
[28.6+27.9+26.1]/3) and 28.21% for RPC Iloilo (ie., [27.7+28.7+28.22]/3). No specific moisture
content values were reported by RPC Davao, so an MC of 28% was assumed to facilitate
computation.

68
Table 23. Paddy procured by RPCs at MC greater than 18% during the wet season

69
Table 24. Percent value of paddy procured by the RPCs with 3 days delay in drying
Table 24 provides a summary of the % value of the paddy bought by the RPCs assuming a 3-
day delay in drying.
Using the data in this table, the economic loss that was prevented by the presence of the RPCs
was estimated. The computational steps are presented as follows:
(1) Weighted % value = 506,054,549/7,238,178 = 70.00%
(2) Value of paddy immediately dried = PhP 20.50/Kg x 7,238,178 Kg = PhP 148,382,649.00
(3) Actual value of paddy = 7,238,178 x PhP 20.50 x 70% = PhP 103,867,854.00
(4) Value loss prevented = PhP 44,514,795.00
The value loss that was prevented by the presence of the RPCs was estimated to be PhP 44.51
million based on an actual combined procurement of 7,238,178 Kg of wet paddy. A buying price
of PhP 20.50/Kg was used representing the price of the best grade paddy at 14% MC.
Quantitative LossesPrevented When Farmers Sell Wet Paddy to the KOICA-RPCs
Reduction of quantitative losses (drying)
Quantitative drying losses that were averted by using the drying facilities of the RPCs were
estimated by taking 5.8% of the total RPC paddy procurement for 2013 and 2014 (Table 25).
Altogether, the RPCs were able to save 3,355,325 Kg of paddy from being wasted. In terms of
milled rice (using 68% milling recovery), proper drying will add 2,281,621 Kg to the supply of
milled rice in the market. The value of this additional volume of rice was computed by using a
selling price of PhP 38.00/Kg if sold as well-milled rice by an RPC; the total value amounted to
PhP 86,701,598.00.

70
Table 25 .Paddy procured by RPCs wet and dry seasons in 2013 and 2014
Reduction of quantitative losses (Milling)
The amount of milled rice that would have been lost was determined by computing for the
milled rice yield obtained from the KOICA-RPC rice mills and from the traditional single-pass rice
mills of most private millers. In both milling systems, a total of 57, 850,436 Kg of paddy were used
as the initial quantity to be processed (from Table 26). This value represents the total paddy
procured by the RPCs (excluding Bohol) for 2013 (RPC Pangasinan and Davao del Sur) and 2014.
Using 68% and 60% as percent milling recovery for the RPCs and the traditional milling method,
respectively, a loss reduction of about 4.63 million Kilograms milled rice was estimated. Using
PhP 38.00/Kg (wholesale price of Well-milled Rice of RPC-Pangasinan), the saved milled rice has
an estimated value of PhP 175,865,325.00 (Table 27).

71
Table 26. Quantitative losses, RPC vs traditional milling facility
Market Value of Total Reduced Losses
The availability of large capacities for mechanical drying and modern milling facilities in the KOICA-RPCs reduced qualitative and quantitative postharvest losses in rice. The value attached to these reduced losses when summed up together reached an amount equivalent to PhP 307, 081, 718.00 (Table 27).
Table 27. Value of reduced losses from proper grain drying and milling
Farmers’ Gain from Selling to the KOICA-RPCs
The Impact Assessment noted that the price paid for wet paddy by the KOICA-RPCs are, on
the average higher than what private traders/millers are paying for the same product. Davao del
Sur and Iloilo rice farmers benefited by PhP 0.79/Kg (Davao del Sur) to as much as PhP 1.11/Kg
(Iloilo) for selling wet paddy to the rice processing centers during the wet season (Table 28). The
difference between the buying prices offered by the RPCs and traders/millers for both provinces
were proven to be statistically significant at α = 5%. Dry season prices also exhibited differences
in favor of the RPCs but did not show any statistical significance. A similar observation was
obtained buying prices in Pangasinan were compared. However, no statistical analysis was
conducted since only a limited number of respondents who sold paddy to traders/millers were
interviewed.
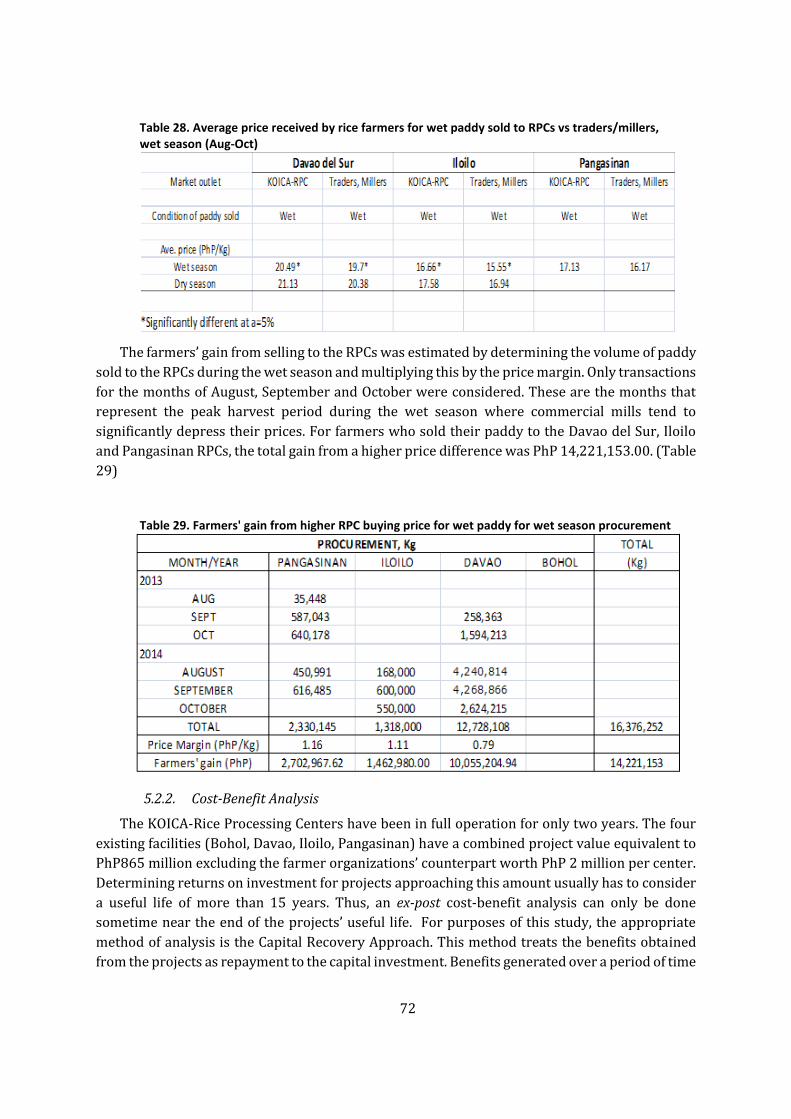
72
Table 28. Average price received by rice farmers for wet paddy sold to RPCs vs traders/millers, wet season (Aug-Oct)
The farmers’ gain from selling to the RPCs was estimated by determining the volume of paddy
sold to the RPCs during the wet season and multiplying this by the price margin. Only transactions
for the months of August, September and October were considered. These are the months that
represent the peak harvest period during the wet season where commercial mills tend to
significantly depress their prices. For farmers who sold their paddy to the Davao del Sur, Iloilo
and Pangasinan RPCs, the total gain from a higher price difference was PhP 14,221,153.00. (Table
29)
Table 29. Farmers' gain from higher RPC buying price for wet paddy for wet season procurement
5.2.2. Cost-Benefit Analysis
The KOICA-Rice Processing Centers have been in full operation for only two years. The four
existing facilities (Bohol, Davao, Iloilo, Pangasinan) have a combined project value equivalent to
PhP865 million excluding the farmer organizations’ counterpart worth PhP 2 million per center.
Determining returns on investment for projects approaching this amount usually has to consider
a useful life of more than 15 years. Thus, an ex-post cost-benefit analysis can only be done
sometime near the end of the projects’ useful life. For purposes of this study, the appropriate
method of analysis is the Capital Recovery Approach. This method treats the benefits obtained
from the projects as repayment to the capital investment. Benefits generated over a period of time
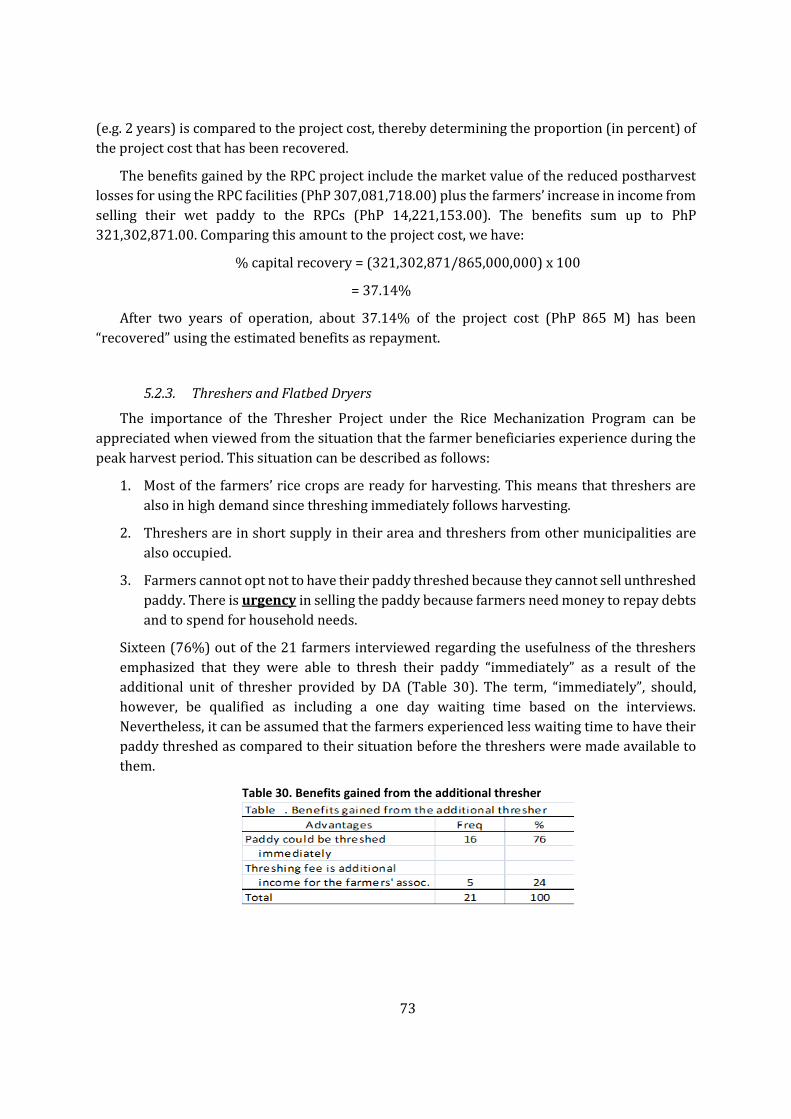
73
(e.g. 2 years) is compared to the project cost, thereby determining the proportion (in percent) of
the project cost that has been recovered.
The benefits gained by the RPC project include the market value of the reduced postharvest
losses for using the RPC facilities (PhP 307,081,718.00) plus the farmers’ increase in income from
selling their wet paddy to the RPCs (PhP 14,221,153.00). The benefits sum up to PhP
321,302,871.00. Comparing this amount to the project cost, we have:
% capital recovery = (321,302,871/865,000,000) x 100
= 37.14%
After two years of operation, about 37.14% of the project cost (PhP 865 M) has been
“recovered” using the estimated benefits as repayment.
5.2.3. Threshers and Flatbed Dryers
The importance of the Thresher Project under the Rice Mechanization Program can be
appreciated when viewed from the situation that the farmer beneficiaries experience during the
peak harvest period. This situation can be described as follows:
1. Most of the farmers’ rice crops are ready for harvesting. This means that threshers are
also in high demand since threshing immediately follows harvesting.
2. Threshers are in short supply in their area and threshers from other municipalities are
also occupied.
3. Farmers cannot opt not to have their paddy threshed because they cannot sell unthreshed
paddy. There is urgency in selling the paddy because farmers need money to repay debts
and to spend for household needs.
Sixteen (76%) out of the 21 farmers interviewed regarding the usefulness of the threshers
emphasized that they were able to thresh their paddy “immediately” as a result of the
additional unit of thresher provided by DA (Table 30). The term, “immediately”, should,
however, be qualified as including a one day waiting time based on the interviews.
Nevertheless, it can be assumed that the farmers experienced less waiting time to have their
paddy threshed as compared to their situation before the threshers were made available to
them.
Table 30. Benefits gained from the additional thresher

74
Delay in threshing has a similar effect as a delay in drying (Mendoza and Quitco, 1985). Yellow
kernels increase as harvested paddy is left unthreshed for days. For instance, a one-day delay in
threshing results in 11.7% yellow kernels. Since most farmers sell their harvest unmilled, (based
on the key informants’ report, Table 31), it is the millers who benefit from immediate threshing
since the effect is only felt after the paddy is milled.
Table 31. Marketing practices of farmers after harvesting of paddy
Table 32. Volume of paddy threshed, 20 farmer key informants
The monetary value of the grain quality deterioration that was minimized due to the DA
threshers can be estimated but limited to the volume of harvest of the farmer-key informants
(Table 32) We assume that all key informants experienced a one-day delay in threshing
instead of a zero delay (to be conservative in our estimate). It was earlier noted that a one-
day delay translates to an 11.7% yellowing of rice kernels. This is equivalent to a 6.2%
decrease in the price of paddy (based on the pricing system of the National Food Authority).
Assuming that the price of premium quality paddy is PhP 20.50/Kg, the 6.2% decrease in peso
value is PhP 1.27/Kg. Thus, instead of PhP 20.50/Kg, the value of the paddy with 11.7%
yellowing has been reduced to PhP 19.23/Kg. The harvested paddy volume of the key
informants was 144,920 Kg. If these were sold to a private miller, the value loss due to a one-
day delay in threshing may be derived as follows:
1) Value of premium quality paddy: 86,952 Kg x PhP 20.50/Kg = PhP 1.78 M
2) Value of paddy with 1 day delay in threshing: 86,952 Kg x PhP 19.23 = PhP1.67 M
3) Value loss = PhP 1.78 M – PhP 1.67 M = PhP 110,000.00

75
In the case of Flatbed Dryers (FBDs), the technology is most appreciated during the wet
season harvest. According to the key informants, the market outlets for their paddy areprivate
traders/millers. These farmers either have a credit-marketing linkage or a “suki” relationship
with the traders/millers. Thus, they do not consider selling to the KOICA-RPC as an option.
During the rainy season, traders/millers tend to attach a very low price on wet paddy. In
2014, this ranged between PhP 16.00/Kg to PhP 17.00/Kg. On the other hand, dry paddy was
given an added premium of at least PhP 1.00/Kg. The FBDs became useful to farmers who
were accommodated at the drying centers. Ideally, all farmers wanting to use the FBDs will
be accommodated for drying at the time that they need the service. However, this was not
totally possible because a unit of dryer can only service one farmer at a time. It takes around
8 hours to completely dry a batch of paddy to 14% MC. Since the dryers are operated 16
hours/day at the most, only two batches of paddy can be dried per day. According to the
farmers who were interviewed, the flatbed dryers are useful only to the extent that their wet
paddy can be dried immediately.
5.2.4. Benefits of Farmers/Fisherfolks in Selling to Barangay Food Terminals (BFTs) and Municipal Food Terminals (MFTS)
Savings due to less transport expenses was identified by suppliers of farm produce as a
significant benefit derived from BFTs (Table 33). Instead of bringing their harvest to other market
outlets that are farther from their farm (usually at the Poblacion), they now spend less in
transport cost because they have an alternative market outlet within their barangay. Other
respondents reported that they do not incur any transport cost at all since they can deliver their
produce by walking to the BFT. Savings ranged from PhP 7.50 to PhP 275.00 depending on the
type of commodity being transported (Table 34). The largest savings in transport cost was
generated by selling paddy to the BFT since it is usually sold in 40-Kg sacks which require higher
transport cost due to bulk and weight. However, another respondent said that he incurred
additional transport cost by selling to the BFT because his paddy was being picked up previously
by a rice trader at no cost.

76
Table 33. Perceived advantage/disadvantage of Barangay Food Terminals

77
Table 34. Comparison of buying prices and transport (delivery) cost between Barangay Food Terminals and other market outlets

78
The hypothesis that suppliers would benefit from a higher buying price at the BFT was not
validated by a majority of the respondents. In fact, Table 34 shows that BFT buying prices
exhibited a varying behavior in relation to the buying prices of other market outlets, i.e., they
were either higher, lower or the same depending on the commodity being sold and the location
of the BFT. For instance, the BFT in Guindulman, Bohol bought eggplants from farmers at a price
higher by PhP 17.50 compared to market outlets in Tagbilaran. The Davao BFT, on the other hand,
bought eggplants at PhP 5.00/kg less than other outlets. Still in Bohol, buying price of Dalagang
Bukid was reported to be lower by PhP 10/kg than the price in the Tagbilaran market. The farmer
supplying cucumber in Davao benefited both in terms of a higher buying price (PhP 4.50/kg) and
savings in transport cost by PhP 150.00 while in Bohol, the buying price for cucumber at the BFT
was the same as the price at Tagbilaran.
The purpose of a “Bagsakan” Center (Municipal Food Terminal) is to provide the physical
infrastructure that will serve as a ready market for agricultural producers and as a source of
goods for wholesalers and “viajeros”of fruits and vegetables. Observations made by the Impact
Assessment Team at the Leon, Iloilo MFT validated that this objective is being met. In Leon,
baskets of chilli pepper, tomatoes, mangoes and watermelon were brought to the facility by
farmers. Wholesalers from as far as Antique, Capiz go there to purchase the goods that they will
sell in their respective wet markets. The process of buying and selling and the accompanying
documentation is systematic resulting in smooth transactions. Similarly, the MFT at Bansalan,
Davao del Sur provides the facility for a convenient transaction among farmers and buyers.
However, business is only carried during Wednesdays and Sundays.
5.2.5. Employment Generation
The employment generated by the Postharvest Facilities projects is an added benefit that can be attributed to the implementation of the projects. From the four KOICA-RPCs, 28 technical monthly-salaried positions and several daily-paid personnel were hired (Table 35). The Pangasinan-RPC estimated that around PhP 120,000 to PhP 150,000 is the monthly expenditure for salaries and wages depending on the month of operation. Peak harvest months require more laborers and, if necessary, longer hours of work that must be compensated. The amount of salaries and wages being spent by the other RPCs would be similar.

79
Table 35 RPC employees and respective compensation
At least two persons are necessary to operate the flatbed dryers: the flatbed operator and assistant who helps in the loading and unloading of the paddy into and out of the dryer bin. They are paid PhP 800-1000 for every load in the flatbed dryer. Similarly, two laborers operate the rice threshers. Payment for their services is based on the number of sacks of paddy threshed.
In the case of the Barangay Food Terminals, monthly paid storekeepers were hired at the barangay facilities but at varying salary rates (Table 36). Salaries ranged from PhP 600/month to PhP 3,000/month. Some BFTs hire the services of a Bookkeeper.
Table 36. Number BFT of employees and their compensation
Municipal Food Terminals also hire a manager to oversee the business transactions in these facilities (Table 37). The salaries of the managers are obtained from the budget of the Local Government Unit where the MFT is located. Daily-wage labors (kargador) are also employed to unload agricultural products coming in, as well as to load products for buyers/”viajeros”.
Table 37. Number of MFT employees and their compensation

80
5.3. Rice Value Chain Upgrading associated with PHF
Value chain (VC) analysis approach generally looks at the elements of the food chain comprised of the stakeholders and their roles, the changes in the physical form, packaging and location/availability of the product, as well as the coordination and the relationships or interface within the chain. These elements characterize the chain and reflect the quality of its operation. Doing one’s role right and or adding value are strategies for chain stakeholders to contribute and be considered an important part of the chain worthy of partaking whatever gains are achieved through enhancements of the VC.
Rice Processing Centers The traditional rice VC in the study areas is generally comprised of at least 4 major
stakeholders, namely: rice farmers, traders, millers and consumers (Figure 22) There could be cases that traders and millers use agents as “feelers” who assess paddy volume expected out of a particular area even before harvest and when to expect harvest. They may likewise double up as village assemblers, once their trader/miller bosses decide what volume to buy and at what price.
Figure 22 The Rice Value Chain in RPC Areas
The usual “arm’s length” or “abutan” buy and sell relationship gets complicated when traders/millers provide credit in terms of cash or production input that binds farmers to sell their produce to the credit providers. The purchase price per kilogram paid to the farmers is usually one peso less than the prevailing market price.
Picked up or delivered is the usual mode of transporting produce from the farm to the buyers. In the case of the latter, the farmers incur additional cost of about PhP 0.25 per 40 Kg sack of paddy depending upon distance between the farm and the mill/trader’s facility.
This VC set up is true only for the dry season, because when the wet season comes, paddy prices paid by the traders and millers dip significantly (e.g., from PhP 20.00/Kg to PhP 12.00/Kg). If farmers are not willing to sell at this price, they are left to find other traders/millers who are willing to buy their paddy at a better price or totally lose their harvest to spoilage.
With the establishment of the RPCs, farmers are afforded the option to sell direct to RPCs and
in the process cut short the VC, eliminating the traders and millers. This is the first point of VC
upgrading associated with RPCs (Table 38). Related to this first point is the elimination of
transport (delivery) cost incurred by farmers since RPCs usually pick up produce at farms or
otherwise refund the farmers the cost of delivery equivalent to the amount of PhP 0.23/Kg.
81
Transparency in the procurement process is the second VC upgrading point attributable to the RPCs. Traditionally, traders/millers determine paddy price using “sensory grading” which is considered by farmers as highly subjective. Samples from bags of threshed paddy are visually inspected for moisture content, discoloration of the unhusked kernels (presence of molds), grain temperature and foreign matter (stones, rice straw) that are mixed with the paddy. In contrast, RPCs determine paddy price by digitally measuring moisture content and assessing milling quality. Moisture content and weight is determined when paddy is poured out of the sack containers into the receiving hopper. From the hopper, paddy passes through moisture sensors while in transit to the weighing scale. Milling quality, on the other hand, is assessed by laboratory milling using a mini rice mill, a test not used by traders and millers. A sample of the paddy is dried, milled using the mini rice mill and then the output is assessed for milling and head rice recovery, yellowed and chalky kernels, percent broken grains and foreign matter content. Appropriate price for the paddy is immediately determined after the assessment process is completed. This built-in transparency feature of the RPC operation serves as an example of good business conduct and ethics in the rice industry which is laden with opportunities for shortchanging the farmers. Setting an example for good business conduct (later on emulated by some traders and millers for fear of being left out of the industry band wagon) is the third VC upgrading point.
The next RPCs upgrading VC point is its role in stabilizing rice prices. The RPCs’ purchase price of paddy is at least a peso above the PhP 17/kg buying price of the government’s National Food Authority (NFA). This is to account for the premium quality of RPCs’ milled rice (which is the fifth VC upgrading point) thus pegging purchase price at PhP 18/kg. A price that traders or millers have to approximate, as against their usual price offering of PhP 12/kg to PhP 14/kg. Producing premium milled rice (achieved through combined strategies of selectivity in varieties purchased, MC control and proper milling process) is the sixth VC upgrading point of RPCs.
Having a choice and information out of transparent market conduct afforded farmers informed decisions, the 7th VC upgrading point, and greater chances of being better off in the process through better returns (least selling cost, better purchase price options). The 8th of the VC upgrading of RPCs is affording the farmers a market for their wet season produce as depicted in red arrows in Figure 22.
Other opportunities for upgrading are on the works, such as (a) credit tie ups though not by RPC but rather thru RPCs with the Land Bank of the Philippines (LBP)’ SikatSakaProgram and (b) coordinated planting schedule In the LBP’s SikatSaka program, the loan beneficiaries are required to pay their loans through RPCs by selling at least 70 percent of their harvest to RPC, this afford the loan beneficiaries ready market at better prices for their produce, while ensuring RPCs have sure paddy supplies. This is a very crucial window for VC upgrading as non RPC paddy suppliers inability to sell their paddy to RPC (in addition to smallness of volume of produce) is their credit/input dependency on traders/millers. However, this will not result in a true upgrading unless harvest scheduling is undertaken as the loan beneficiaries bring not only 70% but all of their produce is putting pressure on RPCs’ operation.
This leads us to the next VC upgrading opportunity which is enhanced coordination, the key in any value chain operation. RPCs (the Bohol RPC in particular) is looking at the possibility of scheduled planting to ensure paddy supply at any given time for RPC, at the same time addressing possibility of low price (over supply) and sure market for their produce in the case of the farmer suppliers.

82
Table 38. Comparative assessment of value chains key elements with or without RPCs
5.3.1. MFTs and BFTs
The VC upgrading attributable to the MFTs and BFTs are providing market options to the
suppliers at lesser cost (nearer to source, less transport) being within a particular town/
barangay and with regularity. The latter is afforded by MFTs/BFTs owing to its regular market
days, usually twice a week, in some cases, even daily market operations. Household processing of
produce otherwise marketed fresh are encouraged given a regular venue to sell goods otherwise
peddled or “lako” in the local dialect.
On the part of the consumers, making products more accessible at affordable prices and with
variety of choices are resultant VC upgrading as well. Convenience with goods almost at one’s
doorstep is a value added offering of BFTs that leads to better customers’ satisfaction.
Enhanced economic activity within the community with residents of other municipalities/
barangays supplying as well as buying from MFTs/BFTs are VC upgrading as well with the
expanded number and types of chain participants.
5.3.2. Flatbed dryers and threshers
Better quality arising from uniformity of heating in the case of FBDs and timing of threshing
right after harvest (quicker return on investment, in time for periods of better prices) are VC
upgradings afforded by FBDs and threshers. This is true not only for produce intended for the
table but for seeds as well as appropriate threshing and milling lead to higher germination rate
of paddy for seed purposes.

83
6. PROJECT MANAGEMENT
The technical assessment part of the report already tackled the process of PHF facility
selection, their respective capacities as well as how sites and beneficiaries were selected. This
part will, on the other hand, look at the PHF projects from the perspective of the users and
nonusers as well as local implementers.
6.1. Project Cycle: Process and Issues
The middle column of Table 41provides the ideal steps in project development from
initiating process to preparation, approval, implementation to completion and phasing out stages.
This provides a reference point on how well PHFs Projects under study fared in terms of the
process of project development undertaken. In general, all PHF projects pass through the major
stages, with KOICA RPCs having the most detailed process from preparation to operation phase
(complete with operations manual), while flatbed dryer and thresher projects having the simplest
process while MFTs and BFTs in between in terms of complexity of process. This is but expected
given the variation in terms of unit cost of facilities to put up.
Despite having passed through the said processes, there are field generated evidences that
point to the fact that some process components are wanting as far as ensuring smooth project
implementation is concerned. A most glaring issue is the undisclosed project cost breakdown in
the case of RPCs. While it is understood that it is a grant, it is still a natural expectation for the
receiving institution to be curious about the composition of the grant, more so when it has an
equipment component which will need parts replacement, sooner or later.
The project stage with the most number of cited issues are the preparatory activities prior
to or during the early stages of project implementation. This is Some beneficiaries are unaware
of the extent of required contribution or counterparts as in the case of MFTs (power requirement,
lack of product volume resulting to low utilization capacities) while some have unclear notions of
their roles and responsibilities as far as PHF project implementation are concerned.
Problems at procurement level of equipment previously done by lot during the NABCOR days
and later on by regions/province through bidding process proved problematic. There are
equipment-design related concerns affecting performance efficiency given different equipment
suppliers,
While criteria were applied in location selection, there are nontransparent or hidden clauses
that renders area choices prone to political “muscling-in” or interference. These lead to project
implementation delays and power play with the farmers the one at the losing end. Problem on
selection extends further to beneficiary selection both for RPCs and FBD. The operation of more
than one RPC suffered due to selection of FOs still lacking in capacities to manage the RPCs. In the
same manner that DA RFUs have to recall awarded FBDs due to the FOs inability to make them
operational within an ideal period of time
It was the study team’s observation that performances of any PHF facilities are enhanced by the
presence of an individual who champions the cause of the PHF project.

84
Table 39 Project Development Process Evaluation KOICA RPC FBD/T MFT/BFT Ideal
Project Devt
Stages
KOICA RPC FBD/T MFT/BFT Evidences From the Field
(issues/proofs that the project steps worked, didn’t worked, found wanting) Actual Project Development Process
(activities undertaken under each project cycle level, complete with date if possible)
1. Initiating process (proj concept, funding request, etc
Pre Project Phase 1.RPC project proposal
preparation/submission 2. Project Planning 3. Site Selection 4.Coordination w LGU 5. Approval of Philippine
government and Korea.
Letter of intent of the FO , addressed to DA
● Submission of Letter of intent
● First Tranche(50% of
project cost)1 1.SB Resolution and MOA 2. Approved PP 3.Work &Financial Plan 4.Audited liquidation report 5.Release request 1st tranche
Alternative drying method during
the wet season (FBD) Ready market Project Concept
● August 13, 2008- BPRE submission of proposal to DA
● August 28,2008 DA project endorsement to
KOICA
Implemented by PHilMech, NABCOR, DA-RFUs NIA, Phil Rice& LGU’s
Implemented by DA-AMAS
Funding Request Budget Proposal Financial Plan
While consultation is done down to the local unit level, once consolidated at the regional/ national, level, the submitted plans have been changed. Realignment is the last resost to bring it back to original request
2. Preparation
● Board Resolution of the FO
● FO Registration ● LGU
Endorsement
● Second Tranche(40%
project cost))1 1. Inspection & second release
requests 2.Inspection/Accomplishment
report of LGU 3.Certificate of acceptance of
inspection Report DA-RFU 4. Project Pictures signed by
MAO or municipal engr 5.First tranche (100%) liquidation
report 6.Project documents
authenticated copies
Thematic/ sector Analysis
Dec 2-11, 2008 KOICA Evaluation Team
Assessment in the Philippines
Assessment Studies
March 2009 Dispatch of KOICA Project Team
Implementation &Survey Mission
Reefer Van returned- high power required Consultation
● Undisclosed project cost breakdown
3. Approval
Construction Phase – (RPC Physical Establishment) 1.Site development -LGU’s

85
2. Building construction machinery installation by KOICA 3.Testing/commissioning
4. Turn over to Philippine govt ● Dec 2008-
KOICA Approval of Proj ● April 2009-NEDA & ICC
Tech Board approval ● May 2009
Approval- Cabinet Cluster
Unwritten requirements for site selection such as visibility
● Equipment designs problems due to different manufacturers, choice based on bidding
● Political influences in distribution of threshers
Requirements
Met
● 1000 ha service area ● Eagerness of the LGU to
support the developments of the project
● Provision- of counterpart (T)
● Land agreement (FBD)
● SEC certification
● IA;s request for equipment
● NIA/MAO Certificate of Good standing
● Feasibility Study
Provision of 15% counterpart of recipient
● Encourage production of good quality grains
● Unclear roles & responsibilities of institutions involved
● Insufficient funds for -paddy purchase
● RPC operation legality
*Higher cost for flatbed drying vs solar drying
*FBD design related high repair/ maintenance cost
*Short useful life *Scheduling of the use of the
FBD/threshers *FBD Low supply; while
oversupply of threshers in some areas
● Reefer Van returned due to high installation cost power requirement
● Inadequate volume of products to fill the equipment
● Seasonal demand ● Employment
generation ● Income
generation
4. Implementation
● Pre-operation Phase (Transition to RPC Enterprise)
1. Consultation meetings 2. Recruitment 3. Hiring and training of
management team 4. Business Planning 5. Business trial operation
● October 2009 Pangasinan RPC groundbreaking
● FOs Inability to manage the RPC
● Unaccounted depreciation cost
Threshers not a priority for farmers already familiar
Insufficient FT mgt capability of coop/FO
Recipient Orientation
● Sept 30 2012 ● Selection and training of
FO
● Operation and maintenance training
Operator’s Training
● Delay in repair and maintenance due to absence of locally available parts
● Inadequate supply of paddy
● Drying option during the wet season. ● Uniform drying for seeds ● Overutilization during the wet season ,
underutilization during the dry season
● Nearby and ready market
5. Completion Operation Phase (Full business operation of the
RPC Enterprise by FO) ● Sept 2011
Awarding of facilities and equipment
Third tranche (10%)1 1. Final inspection and last tranche request

86
● Safe and clean operation
● Negative income ● Farmers not selling to
RPC ,have loans from traders ● Fluctuating supply of paddy
● Income generation for the FO ● Employment generation
● Repair and maintenance of chillers and freezers
● Underutilization of some FT attributed to location
Turn Over to the Philippines (Pangasinan RPC)
2.Inspection/Accomplishment report of LGU 3. Acceptance of inspection report of DA RFU 4.Project Pictures signed by MAO or ME 5.Certificate of completion 6.Certificate of acceptance of recipient 7.Second tranche (80%) liquidation report
● December2014 Security of tenure of MGT team
● Reduction of losses ● Reduction in
transport cost & Production of well milled rice
● Competes in the market in terms of quality milled rice
● Institutional Development of the Coop
● Oversupply of thresher in some areas
● Short useful life ● Low utilization ● Shorter delay in threshing ● Smaller thresher for easier
transportation ● Conflicts due to the
scheduling of the FBD
● FT success largely depends on LGU/ FO mgt capability
● Cut off of funds ● No. of sellers
increased; selling income decreased
● Higher buying price vs other markets
Transition/ Phasing out phase
September 29, 2014 Turn over of the Pangasinan RPC to FO beneficiaries
Ensures maximum utilization otherwise the unit will be pulled
Monthly monitoring and evaluation
87
6.2. Project Monitoring and Evaluation
The presence of monitoring and evaluation (M&E) systems are observed in most PHFs
reviewed.
The KOICA RPCs have the most active M&E system and similar venues in place given a project
coordinating team coming from PHILMECH, who are well abreast of project activities and
performance as well as membership in coordinating boards at all levels (national, provincial,
RPC). The joint annual meeting of all RPCs provides venue for performance evaluation and cross
learning,
MFTs and BFTs visited, on the other hand, are well monitored by respective
provincial/municipal agricultures officers (PAOs/MAOs) with regular performance reporting
system in place (monthly sales and commodities traded) in the same manners that the FOs
managing them have their own records and reporting systems to keep track of operation
FBDs and threshers are likewise monitored by DA RFUs.
7. SUMMARY OF FINDINGS
7.1. Relevance of PHF
The overall impact of the RPC project has been positive. With state of the art equipment and
well-trained personnel, RPCs are generally able to produce properly dried paddy and
consequently good-quality milled rice. The presence of RPCs also provides a safety net for farmers
during periods of oversupply, when drying facilities are over utilized and private traders are not
willing to accept wet paddy and/or offer very low buying prices.
MFTs and BFTs impacts are observable through the enhanced economic activities continually
observe in areas where they were established, including expanded trade which afford suppliers
and consumers alike greater product choices at lesser transaction costs.
Flatbed dryers, on one hand, are crucial and essential, especially during the rainy season. This is mainly due to weather which prevents them from using sun drying. This is particularly so for farmers who are unable to avail of RPCs services due to the smallness in volume of their harvested paddy. Threshers, on the other hand are reported to be critical in meeting farmers urgent need to immediately turn harvest into cash for household and loan repayment needs. The DA provided additional unit of threshers enable them to thresh their paddy immediately. However, the Rice Mechanization Program is currently disseminating combine harvesters that harvest and thresh the grain at the same time. Farmers have been receptive to the technology and some areas have adopted the machine. PHILMECH should identify the areas where threshers may still be used (e.g. upland farms) to maximize utilization.
7.2. Strengths and Weaknesses of PHF
7.2.1. Project Management
The strengths of the government’s postharvest development program, in general, lies on its strategic direction and component mix. The PHF identified and provided are those truly responsive to the needs of the marginalized farmers such as RPC, food terminals and FBD and threshers. This project mix covered key areas of agricultural development, namely: production, processing and marketing. Having involved champions committed to the cause of PHF facilities is a potent force in successful project implementations.

88
Weaknesses, however, are the absence of proper planning as early as the preparatory stages that opens up the project to implementation flaws. These includes inappropriate area and beneficiary selection, faulty PHF design, nonsocialization of project details, noninclusion of performance indicators at the onset and ineffective consultation process (if ever done at all), among others. Process of equipment procurement is an issue from supplier selection to quality of equipment delivered.
7.2.2. Operational Level
KOICA-Rice Processing Centers:
The RPCs proved to be highly effective in the government’s vision of reducing postharvest losses in rice. The complexes are equipped with modern drying and milling facilities with capacities large enough to accommodate large quantities of procurement. Their weaknesses at the moment are limited working capital and sources of paddy to be processed. PhP 20M worth of working capital is considered small in relation to the operating capacities of the RPCs and the volume of harvest from a targeted rice production area of 1,000 has. It was estimated that around PhP 80 M is needed as capital for this size of land area. Also, the RPCs are still weak in marketing and promotion. Many farmers have unclear or incorrect perceptions regarding the RPCs. As a result, they hesitate to sell their produce to the facilities.
Municipal and Barangay Food Terminals,
In general, these projects have uplifted several communities by providing employment, better food choices, and reducing transaction costs. It is worth noting that the Leon, Iloilo MFT operates a hot water tank to control postharvest disease of ‘Carabao’ mango. A fruit processor in San Ildefonso, Iloilo has been a client for several years; treated fruit are ripened, scooped out and frozen; the final product is exported to Japan. In addition, three shipments of fresh fruit in2014 have been treated at the facility and successfully exported to Qatar. In comparison, there are no technologies being adopted to preserve the quality of other perishable high value products.
Flatbed Dryers and Threshers
These postharvest machineries eliminate the risk of grain deterioration during the rainy season. Deterioration takes the form of stress cracking, mold development, grain fermentation and grain sprouting. During the dry season, however, the impact of FBDs is less pronounced since farmers prefer the less costly method of sundrying (especially if grain volume to be dried is small). However, the usefulness of FBDs are delimited by the main technical problem of corrosion of the perforated steel flooring of the grain bin. The material used is prone to rusting and deteriorates easily after a few growing seasons. Innovativeness of several users surfaced by using bamboos as alternative flooring.
8. RECOMMENDATIONS
8.1. Project Planning and Implementation
1. Preparatory activities should be given equal if not greater attention (than project
implementation) as effects of flaws at the early projects stages (project concept, design and
plans) cannot be compensated even by good implementation strategy.

89
2. Beneficiaries and project stakeholders need be involved as early as possible for greater
understanding, appreciation and consequent “buy in” and even project ownership in the
process. Identify potential individuals who will champion the cause of the project to enhance
rate of project success.
3. Strict adherence to project guidelines (MOA, TOR, etc.) and processes are ways by which
organizational and implementation processes may be improved. The same way that political
interference and power play may be initially addressed. Possible a “project incubation clause”
could be added at least for a year that delimits interference of political figures to enable the
projects to develop and progress as intended.
8.2. Enhanced Facility Utilization
8.2.1. KOICA RPCs:
Capacity utilization and effect on reduction of postharvest losses are major issues in the KOICA-RPCs operation. Plant operations and management are equally pressing concerns as both sets affect the viability and sustainability of RPCs.
1. Increase operating capital to allow RPCs to scale up procurement. Based on interviews
with RPC managers, the ideal amount of operating capital should be in the range of PhP
40M
2. Provide additional cargo trucks for timely pickup of harvested paddy and delivery of
milled rice; vehicles should be of mixed capacities to allow access via field roads;
3. Scheduled planting and harvesting in identified areas to rationalize deliveries of paddy
to RPCs; one issue that needs to be considered is the tendency of animal and insect pests
to gravitate towards areas that are ready for harvesting.
4. Provide financing and crop insurance for farmers to reduce their dependence on private
traders who charge high interest rates for loans while procuring paddy at very low
prices.
5. Identify and/or train a reputable and capable Philippine distributor of Korean spare
parts and equipment for RPC facilities and equipment.
6. Provide specific guidelines as to:
a. The limit of management’s prerogative. sustain plant operation at whatever cost
(buy beyond 1,000 ha service area)
b. cost/revenue treatment
c. Sustainability measures (clear as early as planning stages)
7. Enhancing role of RPCs as rice value chain coordinator through
a. Providing Information to enable farmers to make informed decisions
b. Planting and harvesting programs develop in consultation with farmer suppliers.
8.2.2. MFTs/BFTs
Given initial gains of MFT and BFT projects, it will help a lot to push these forward if
success stories are documented, analyzed and best practices disseminated. Issues like “What
has worked for these food terminals and their communities?”, “Are new business models

90
developed?” and if so, “What will it take to outscale or upscale them?” are questions when
answered will provide a lot knowledge to others.
For technical improvement of food terminals, the following recommendations can be
considered:
1. Improvement of lighting systems for better working conditions. This will reduce worker
strain, errors in sorting and grading of produce, and accidents.
2. Institute unitized handling – provision of plastic crates and manual forklifts will greatly
reduce worker injuries, mechanical damage to produce, and time and labor needed for
loading and unloading of cargo vehicles. However, this will require additional
investment and a scheme for returning plastic crates will be needed.
3. Hygienic handling – a program for worker and workplace hygiene should be put in place
to keep products safe. Some training will be needed on the basics of Good Manufacturing
Practices which can be provided by several government agencies or the academe.
8.2.3. Flat Bed Dryers
With the implementation of the DA Rice Mechanization Program until 2016, there should be a concerted effort to further improve the design, fabrication, and utilization of flatbed dryers nationwide. The program is currently targeting a level of intervention of 6%; i.e. only 359 FBDs will be disseminated out of a total national requirement of 5,670 units. However, the total cost of these dryers will reach more than PhP251-M (at PhP700,000 per unit). To ensure the maximum recovery of this investment in the form of reduced losses and improved product quality, the following recommendations could be considered by DA:
1. Close monitoring of accredited fabricators to ensure quality of disseminated units,
compliance with specifications, and proper and timely servicing if defects are present.
2. Thorough evaluation of recipients and proper site selection to maximize the utilization
of dryers. Farmer organizations and/or irrigators’ associations with a proven track
record should be the preferred beneficiary of FBDs. Sites for facilities should be strategic
with respect to production areas, water and power sources, supply of biomass waste as
furnace fuel, and access to road networks.
3. Incorporate design improvements to improve safety and durability.
4. Continuous monitoring and testing by the government agencies concerned to ensure
proper operation of the dryers.
8.3. Areas For Further Study
A number of study themes surface during the course of study and were found to be worth pursuing. They are as follows:
1. Local development and production of RPC equipments, parts and tools. For example,
PHILMECH has already developed image analysis techniques for evaluating rice and corn
grains on a laboratory basis. This can serve as the starting point for development of a color
sorter to reduce dependence on imported technology.

91
2. Looking into other PHF programs such as the Agricultural Tramline and Cold Chain
Programs.
3. Documentation of PHF best practices business models for possible outscaling and
upscaling.

92
9. REFERENCES
AGRAVANTE JU, SERRANO EP, MASILUNGAN GD, AMATORIO EQ, CASTILLO PC, DOMINGO CL, PAZ RR. 2013. Postharvest Losses in the Supply Chain of Calamansi (x Citrofortunellamicrocarpa) and Loss Reduction with Modified Atmosphere Packaging. In: Batt PJ (ed). ActaHort 1006: International Symposium on Improving the Performance of Supply Chains. ISHS: p 49-56.
ARTES LA, MAUNAHAN MV, NUEVO PA. 2013. An Analysis of the Supply Chain for Bulk-Loaded Bananas (Musa sp.) from Mindanao to Luzon. In: ActaHort 1006: International Symposium on Improving the Performance of Supply Chains. ISHS.p 71-78.
BINGABING RL. 2014. Public Sector Investments on Processing and Post-Harvest Technologies to Food Security. Report presented at the Round Table Discussion on Food Security: Marketing and Postharvest. 01 October 2014. Apacible Hall, NAFC: Diliman, Quezon City. National Agricultural & Fisheries Council; UPLB Interdisciplinary Studies Center on Food Security.
BRIONES RM, GALANG IMR. 2013. Urgent: A road map for agro-industrial development in the Philippines. Policy Notes. No. 2013-06.
BROOKS JE, ROWE FP. 1979. Commensal Rodent Control, Mimeograph: WHO/VBC/79.726: 89p
DA-NPMO [Department of Agriculture – National Project Management Office]. Rice Processing Complex: Operational Guidelines and Policies: 2009-2014.
DE PADUA DB. 1999. Postharvest Handling in Asia 1. Rice.Available at http://www.fftc.agnet.org/library.PhP?func=view&id=20110715231853. Accessed 20 July 2014.
EMBUSCADO ES. 2010. Benguet Cold Chain: Preserving the Freshness of the Farmers’ Harvests. Philippine Center for Postharvest Development & Mechanization]. Available at http://www.PHILMECH.gov.ph/?page=news&action=details&code01=FB10070003. Accessed 02 Aug 2014.
ESTIGOY RP. 2006. Improving quality of Philippine vegetables through agricultural tramline and cold chain systems: Status, prospects, and technology transfer initiatives. In: Batt PJ (editor), Proceedings of the 1st International Symposium on Improving the Performance of Supply Chains in the Transitional Economies: ActaHort 699. p. 169-172.
FA0 2014. Report on the High Level Multi-Stakeholder Consultation on Food Losses and Food Waste in Asia and the Pacific Region. 27-28 August 2013. Bangkok Thailand
GUTIERREZ N. 2014. Aquino: Abolish Pork Scam Gov’t Agencies. Available at http://www.rappler.com/nation/49262-aquino-abolishes-state-agencies-pork-barrel-scam#. Accessed on 18 Feb 2015.
HALID H. 1993. Grain damage and losses caused by rodents and other vertebrate pests, in Grain Storage Warehouse Control Technology, J. O. Naewbanij and A.S. Frio (eds.), ASEAN Grain Postharvest Programme, Bangkok, Thailand.
International Rice Research Institute. Rice Milling. Available at http://www.knowledgebank.irri.org. Accessed on 9 Feb 2015.
JOSE ML. 2012.Easing the Corn Farmers’ Woes through the CPhPTC. Philippine Center for Postharvest Development & Mechanization. Available at

93
http://www.PHILMECH.gov.ph/?page=news&action=details&code01=FE12100001. Accessed on 02 Aug 2014.
KHANDKER SR, KOOLWAL GB, SAMAD HA. 2010. Handbook on Impact Evaluation. Available at http://www-wds.worldbank.org/external/default/WDSContentServer/WDSP/IB/2009/ 12/10/000333037_20091210014322/Rendered/PDF/520990PUB0EPI1101Official0Use0Only1.pdf.Accessed 20 July 2014.
LANTICAN FA, PABUAYON IM, MABESA RC, ESGUERRA EB, REYES MU. 1986. Cold storage economics of onions, fish, shrimps and beef in the Philippines: Terminal report. International Development Research Center.
MACAM, FB. 2014. Agri-Pinoy Trading Center (APTC) Implementation Updates. Report presented at the Round Table Discussion on Food Security: Marketing and Postharvest. 01 October 2014. Apacible Hall, NAFC: Diliman, Quezon City. National Agricultural & Fisheries Council; UPLB Interdisciplinary Studies Center on Food Security.
MAGARARU BGS. 2012. Agricultural Tramline Tows a Line for Baungon, Bukidnon. PhilMech Newsletter. 19: 3.
MANALILI, N.M., DORADO M.A., Van OTERIDIJK, R. 2014, Investing in Appropriate Packaging Technologies in Developing Countries. Food and Agriculture Organization of the United Nations, Rome, Italy.
MANALILI N.M., SEVILLA, F.M. and VALENTON, I.V. 2014 Agribusiness Public Private Partnership in the Philippines, Food and Agriculture Organization of the United Nations, Rome, Italy (to be published).
MANALILI, N.M. and DIGAL, L. 2012. Impact Evaluation of the National Technology Commercialization Program of the Philippines, Department of Agriculture Bureau of Agricultural Research (DA BAR) and Southeast Asia Regional Center for graduate Study and Research (SEARCA), a study report.
MANALILI NM, DORADO MA, JALOTJOT H. 2014. Rapid Appraisal of the Yellow Corn Value Chain in Mindanao. World Bank. USA.
MANILA BULLETIN. 2013. P421-M Rice Processing Center Assistance. Available at https://ph.news.yahoo.com/p421-m-rice-processing-center-assistance-220031846.html.Accessed 28 July 2014.
MANILAY AA. 2013, Financial Analysis of Technologies in Agriculture, Aquatic and Natural Resource, Training documents, Los Banos, Laguna Philippines.
MENDOZA ME, QUITCO R. 1985. Quality deterioration and value loss in grains, in Coming To Grips with the Wet Season Grain Handling Problems in Southeast Asia, Alessandro A. Manilay and Antonio S Frio (eds.), ASEAN Crops Postharvest Programme, Manila, Philippines.
NABCOR [National Agribusiness Corporation]. Undated. Welcome to NABCOR. Available at http://nabcor.da.gov.ph/. Accessed 20 July 2014.
NAFC [National Agricultural & Fisheries Council]. 2004. Agricultural Fisheries & Modernization Act. Available at http://nafc.da.gov.ph/afma/ra8435-1.PhP. Accessed 20 July 2014.
PAES [Philippine Agricultural Engineering Standards]. 2000. Agricultural Machinery – Rice Mill – Specifications. PAES 206: 2000.
PAES [Philippine Agricultural Engineering Standards]. 2002. Agricultural Structures – Primary Processing Plant for Fresh Fruit and Vegetable. PAES 418: 2002.
94
PCDSPO [Presidential Communications Development & Strategic Planning Office]. 2013. Available at http://www.gov.ph/featured/gaa-2014/. Accessed 20 July 2014.
PHILMECH [Philippine Center for Postharvest Development & Mechanization]. 2012. Postharvest Losses in Rice and Corn. Available at http://www.PHILMECH.gov.ph/?page=phlossinfo. Accessed 20 July 2014.
PHILMECH [Philippine Center for Postharvest Mechanization and Development]. 2013. Agricultural Tramline System. Available at http://www.philmech.gov.ph/?page=phtech. Accessed 19 Oct 2013.
RAGUDO TFM. 2011. Status of adoption of UPLB flatbed dryer. J ISSAAS. 17: 168-180.
REARDON T, CHEN K, MINTEN B, ADRIANO L. 2012. The Quiet Revolution in Staple Food Value Chains. Available at http://www.ifpri.org/publication/quiet-revolution-staple-food-value-chains. Accessed 20 July 2014.
SERRANO EP, ESGUERRA EB, MAUNAHAN MV, DEL CARMEN DR, AGRAVANTE JU, NUEVO PA, YAPTENCO KF, AMATORIO EQ, ARTES LA, MASILUNGAN GD, FLOR NB, PAZ RR, GUTIERREZ RQ, RAMOS MEV, VERENA RO, CALICA GB, CASTILLO PC, CORPUZ ES, DOMINGO CL, RAPUSAS RS. 2009. Terminal Report on Qualitative and Quantitative Loss Assessment of Selected High Value Food Crops: Case Study. Loss Assessment for Cabbage. PHTRC, UP Los Baños / Philippine Center for Postharvest Development and Mechanization.
TAKUMI R. 2013. Faulty P40-M cold storage facility in Zamboangadel Norte unusable since 2011. Available at http://www.gmanetwork.com/news/story/339039/economy/ agricultureandmining/faulty-p40-m-cold-storage-facility-in-zamboanga-del-norte-unusable-since-2011. Accessed 02 Aug 2014.
TETER, Norman. 1987. Paddy Drying Manual, Agricultural Services Bulletin 70, FAO, Rome.
THE NEWS TODAY. 2007. Barangay Food Terminal to Rise in City. Available at http://www.thenewstoday.info/2007/03/28/barangay.food.terminal.to.rise.in.city.htmlAccessed 01 Dec 2014.
TRIGO-STOCKLI DM, PEDERSEN JR. 1994. Effect of rice storage conditions on the quality of milled rice, in Proceedings of the 6th international Working Conference on Stored Product protection, 17-23 April 1994, Highley, Wright, Banks and Champ (eds). Canberra, Australia.
YAPTENCO KF. 2009 Precooling; Refrigerated Transport and Storage. International Training Course on Postharvest Technology for Perishable Horticulture Crops. Paper presented, ASEAN-Japan Partner Los Baños, Laguna, Philippines.
YAPTENCO KF. 2014. Packinghouse Infrastructure, Operation & Management; Transport Systems; Storage Systems for Perishable Crops. Training on Postharvest Technology Management and Extension: Focus on Mango and Citrus. Paper presented, Crop Science Cluster – UPLB College of Agriculture / UNIDO.
YAPTENCO KF, ESGUERRA EB. 2012. RAP Publication 2012/04: Good Practice in the Design, Management and Operation of a Fresh Produce Packing-house. RS Rolle, E Hewett (technical editors). United Nations Food &Agriculture Organization. 164 p.

95
10. APPENDIX
Appendix 1 Key Informants
NO. NAME DESIGNATION
COMPANY/ ADDRESS
CONTACT DETAILS
LANDLINE /FAX NO.
MOBILE NO. EMAIL
ADDRESS PANGASINAN
1 Alicia Noche Agricultural Technician LGU-Sta. Barbara
(075) 5293828 6961406
9995176517 [email protected]
2 Amelia E. Tandoc Agriculturist LGU-Sual (075) 548 4503 3 Antonio A.
Miranda Recipient of FBD Western
Pangasinan Seed Growers MPC
9995728770
4 April Joy Abucay Agricultural Technician DA-RFO 1 (072) 888 7213 9175806822 [email protected]
5 Arccli B. Talamia City Agriculturist LGU Alaminos City
(O75) 551-3101
9088954121
6 Bonifacio Parinas Municipal Agriculturist MAO-Urdaneta 9165428273 7 Dalisay A. Moya Provincial Agriculturist OPAG-
Pangasinan (075) 523 2703 921565430
8 Edgardo G. Tugas Municipal Agriculturist LGU-Alcala 9163918967 [email protected]
9 Emely D. Lucero AT/HVCDP Coordinator
LGU-Urdaneta City
(075) 522 0142 9228712756
10 Irma A. Catain Port Manager PFDA- Sual Pangasinan
9098059067
11 Jean Marie Miranda
MPC Chairman KKK MPC 9189654193
12 Krista Lou G. Ingaran
Management Team Member
DA-Pangasinan RPC
(075)5291393 9104179887
13 Mac Jesson V. Tucay
Interim Plant Manager DA-Pangasinan RPC
(075)5291393 9297494052
14 Marjuellieto Raranggor
Marketing and Procurement Officer
DA-Pangasinan RPC
(075)5291393 9184082705
15 Mercuria R. Caramba
Senior Agriculturist LGU-Alaminos City
(075)5513101 9206029550
16 Merlita Tugas Agriculturist LGU-Alcala 9357620156 17 Mikki Eduard Businessman Mariscos Royale
Corp. 9178055955 pangasinanrpc
@yahoo.com 18 Paz L. Mones Regional Technical
Director DA-RFO 1 (072) 888 2045 9175202224
19 Primitivo Bautista Market Supervisor LGU-Binalonan (075) 562 3386 [email protected]
20 Ramonito R. Sabido
Municipal Administrator
LGU-Sual 9067728745 [email protected]
21 Ranilo M. Padilla RPC Chairman Albacopa Fed. Of Coop.
9088634202
22 Reynaldo Segui Jr. Municipal Agriculturist LGU-Sta. Maria (075)5742283 9209670171 23 Teresita A. Plado Agriculturist LGU-Sta.
Barbara 9334432894 villa-
24 Venus D. Pamoceno
Veterinary 2 LGU-Sta. Barbara
(075)5290936 9175625163
25 Villla Nacional Engineer LGU Alaminos City
(075)551-3101; 551-2146
9985427099

96
26 Wilma C. Valdez Store Keeper Organic Trading Post –Urdaneta
9236872897
27 Wilson G. Camba City Engineer LGU Alaminos City
9196791898
DAVAO DEL SUR
28 Albert P. Aguinaldo
Engineer in the Fish Port
PFDA-Davao Fish Port
(082) 291 0298/ (082) 291 0752
29 Aniano C. Ramos BFT Chairman BFT Kinuskusan Bansalan
9212092018
30 Bernandina Belotindos
BFT Chairman BFT Malawanit Mag/ Davao del Sur
9352129983
31 Bimbo O. Bagamante
BFT Chairman BFT-Kiba-O Matanao, Davao del Sur
9097816544
32 Dennis Jay S. Lutero
Enumerator LGU-Matanao 9182858357 [email protected]
33 Elmer L. Daplin BFT Chairman BFT New Clarin Bansalan
9303553708
34 Felinon T. Cangrejo
Manager NFA Digos City (082) 553 2196 9175038422 [email protected]
35 Felix N. Bariquit Municipal Agriculturist LGU-Hagonoy 9999963025 36 Givel M. Mamaril Investment
Promotions Officer PLGU (082) 553 9142 9983379814 Givel.6274@gm
ail.com 37 Helen P.
Carampatana Municipal Agriculturist LGU-Magsaysay 9471754636 maomagsaysay
@gmail.com 38 Jaime Severino Project Director GK-Pueblo 9087473601 39 Jery Lisuo In Charge Cavendish
Banana Packing House
9364034259
40 Jimmy C. Taiblo BFT Chairman BFT Manga 9208610464 41 Jovita P. Bretana Agricultural Technician PLGU-OPAG (082) 553 7099 09213949229
/ 9176307293
42 Julian Albores Board of Director DASUFEMCO (082) 5539295 9997314169 43 Juvy M.Pregon DA-BFT Coordinator DA-RFO XI (082) 226 3625 9177026853 agribiz_11@ya
hoo.com/[email protected]
44 Karen T. Lamboton
DA-AMAD RFO-XI,DC
(082) 226 3625 loc 1105
9075517697/9359116108
45 Leonaveth L. Nedamo
Plant Manager RPC-Davao 9461654520 [email protected]
46 Maria Febe T. Orbe
Asst. Regional Executive Director
DA
47 Maria Lita D. Pogoy
BFT Chairman BFT Ladeco 9486616700
48 Mario M. Malinao Port Manager PFDA-Davao Fish Port
(082) 291 0298/(082) 291 0752 [email protected]
49 Marvin C. Reyes Agricultural Technician PLGU-OPAG (082) 553 7099 9185139567 [email protected]
50 Mayrene S. Payot Manager BFT Catigan 9087473601 51 Melinda G.
Rubellano BFT coordinator PLGU-OPAG (082) 553 7099 9107221667 m_rubellano@
yahoo.com 52 Remelyn Recoter Regional Executive
Director DA RFO XI (082) 221 9697 9178927525 remirecoter@y
ahoo.com

97
53 Reynante T. Andrade
Agricultural Technician PLGU-OPAG (082) 553 7099 9177128690 [email protected]
54 Ricardo M. Onate Engineer DA-RFO XI 9234015468 [email protected]
55 Rocelio T. Tabay City Agriculturist City Agriculture Office
9253911957
56 Ryan Y. Tabay BFT Chairman BFT-Kasuga, Magsaysay, Davao del Sur
09202952778/9339165955
57
Sabino Allawan Engineer City Agriculture Office-Davao City
9177868557 [email protected]
58
Temesita R. Bawot
Agricultural Technician OPAG 9205284810
59 Teresita C. Cabucano
BFT manager BFT Tamugan 9466368122
60 Vicente A. Ruferos V
BFT Chairman BFT- DCAFC Digos City
9189366093
61 Vicente Fernandez
Municipal Mayor LGU-Matanao 926707171
ILOILO
62 Bonifacio Talidano
Operator of the flatbed dryer
LGU-Tubungan 9273304055
63 Carmelita Fantillanan
Senior Agriculturist DA RFO 6 (033)3374775 9998805674 [email protected]
64 Catalina C. Capilastique
Municipal Agriculturist LGU-Leon (033) 331 0033 9199919772 [email protected]
65 Delia T. Tano FA Chairman Ten Benito FA 9261544114 66 Edgar Deysolong Port Manager PFDA-Iloilo 9152788737 67 Elma B. Francisco Agriculturist 1 DA-AMAD RFO 6 (033)337 1227 9395029914 daamad6@yah
oo.com 68 Federico C.
Tabanda Chairman Bagsakan
Association 9078381053
69 Ildefonso Toledo Provincial Agriculturist PLGU-Iloilo (033)337 3062 09209093326/09176222389
70 Jieben Villarino AMAD Staff DA-AMAD RFO 6 (033)337 1227 9465099530 [email protected]
71 Josefa Melocoton Plant Manager Iloilo RPC Pototan
(033) 529 8780 9173425779 [email protected]
72 Larry P. Nacionales
Regional Executive Director
DARFO 6 (033)337 3549/336 4221
9067753224 [email protected]
73 Ma. Asuncion Tabucuran
Municipal Agriculturist LGU-Tubungan 9174014415 [email protected]
74 Ma. Wilma Perez Bookkeeper Pototan Seed Growers
(033) 857 3340 9196841389
75 Martino Tadia Operator of the thresher
Ten Benito FA
76 Renato P Jamiliarin
Municipal Agriculturist LGU-Pototan (033) 529 8416 9164373020 [email protected]
77 Rene P. Benedicto
Agriculturist LGU-Pototan (033) 529 6010 9296481762 [email protected]
78 Rene Silbor Operator of the Flatbed Dryer
Talacua-an FA 9174038699 [email protected]
79 Rolito C. Cajilig Municipal Mayor LGU-Leon (033) 331 0226 9153715884 80 Romar A. Areno PhilMech Coordinator
for Bohol DA-PHilMech 9178259403 marx_xeno@ya
hoo.com

98
81 Tomasita Capindo BFT Chair LGU-Jolason 9128251478 82 Wenifredo
Calacapa Operator of the thresher
Talacu-an FA 9307977814
83 Winelyn Laging Engineer DA-RFO 6 (RAEG)
(033) 336 9982 9461152263 [email protected]
84 Yvonne Grace Sur Agriculturist DA RFO 6 (033) 336 9982 9107196833 [email protected]
BOHOL
85 Acero, Jose Paolo PhilMech Coordinator for Bohol
DA-PhilMech 9291127843 [email protected]
86 Algerica Pilvera NIA Staff NIA-Malina (038) 510 8465 9199999522 [email protected]
87 Alvin Mante General Manager Bohol RPC 9995812023 88 Artemio B. Cubu Flatbed Dryer
Recipient Caluasan, Dagohoy
9203687761
89 Avelino Baliong Flatbed Dryer Recipient
Cambailan, Catigbian Bohol
90 Balajadia, Cesar PhilMech Coordinator for the Region
DA-PhilMech 9328623678 [email protected]
91 Cahiles, Eugene Chairman of the RPC board
DA-Bohol APC (038) 411 2436 9189087027 [email protected]
92 Carmen Cubrado Municipal Agriculturist LGU-Pilar 9053347148 93 Cecilio S. Bauy Flatbed Dryer
Recipient Flatbed Dryer Recipient
94 Celestino Jamil Former Brgy Captain Rizal, Pilar 9084990405 95 Erlinda T. Vargas BFT Chair and Brgy.
Captain LGU-Pilar 9295571176
96 Fabian Aranaso BFT Chair and Brgy. Captain
LGU-Libaong 9159759563
97 Geofrey Gulay Municipal Agriculturist LGU-Guindulman
9215152390
98 Jimmy C. Baldero Plant Manager Bohol RPC 9127347567 [email protected]
99 Joel A. Rasonable Flatbed Dryer Recipient
San Miguel, Dagohoy
9129474124
100
Larry M. Pamugas Provincial Agriculturist PLGU Bohol (038) 411 5892
101
Maria Wencisa B. Egama
Chief- Socio Economic Section
DA-Bohol APC (038) 411 2436/ (038) 501 7538
9176311655 [email protected]
102
Peter Caramba Flatbed Dryer Recipient
Dagohoy 9066216368
103
Primitivo Sarigumba
Flatbed Dryer Recipient
Similian IA 9128978387
104
Rodrigo Pechon Agriculuturist DA-Bohol APC (038) 411 2436 9214445848 [email protected]
105
Rogelio O. Paderanga
Flatbed Dryer Recipient
San Isidro, Pilar 9208026976
106
Tereso C. Cruda Flatbed Dryer Recipient
San Miguel, Dagohoy
9079812709

99
Appendix 2. Sample survey instruments used in the in depth field assessments
Questionnaire # ______ Interviewer ________________ Reviewer __________________ Date _________
Survey Form for Farmers
Province : ▢ Pangasinan ▢ Davao del Sur ▢ Iloilo ▢ Bohol
Barangay:…........................................ Municipality/City:.................................................
Section 1 PERSONAL INFORMATION OF RESPONDENT
Respondent name :___________________________________________
1. Gender ; ▢ Male ▢ Female 2. Birth date / Age :____________________________________________ 3. Contact Info/Phone number :____________________________________________ 4. Main occupation :▢Farming ▢Others (specify)_____________. 5. Income from rice farming :PhP_____________ [ ] per cropping [ ] per year 6. Years in rice farming :____________________________________________ 7. Member of farm-related organization :▢ Yes ▢ No 8. Name of organization :____________________________________________ 9. Position in organization :____________________________________________ 10. Years in organization :____________________________________________ 11. Location of farm :__________________________________________ 12. Land tenure: ▢ Owned ___% ▢Tenant___% ▢ Lease ___% ▢ Others:___% 13. Do you plant other crops for commercial purposes? ▢ Yes ▢ No
(If Yes, answer #14)
14. Other commercial crops planted:
Crop Area
Planted (ha)
No. Of cropping per year
Harvest per cropping Net Income
Volume Value
15. Do you avail of the services of the RPC? : ▢ Yes ▢ No If YES; do you
▢ Avail of custom drying from RPC (answer Section 2-A)
▢ Sell wet paddy to RPC (answer Section 2-B)
▢ Sell dry paddy to RPC (answer Section 2-C)
16. Before the establishment of the RPC, were you already a rice farmer? ▢ Yes ▢ No If YES, then; do you
▢ Sell wet paddy to traders/millers
▢ Sell dry paddy to traders/millers
▢ Conduct sun drying
▢ Use a flatbed dryer

100
17. Were you previously a user of RPC services? ▢ No
▢ Yes (If yes, why, did you stop using the RPC?)
▢Too far, transport cost too high: PhP______/kg
▢ Service fee too expensive
▢ No truck for hauling
▢ Buying price too low: PhP______/kg
▢ Others, (Pls. Specify:_____________________________

101
Section 2-A FARMER USING CUSTOM DRYING SERVICE OF RICE PROCESSING
COMPLEX
1. What is your production volume (in cavans of wet paddy)? _______________ 2. Area harvested (hectares) _______________ 3. What portion of total production volume is:
a. Dried by RPC:___ b. Dried by other means______(specify) c. Sold as wet paddy to RPC:_______ d. Sold as wet paddy to other buyers:_____
4. Do you buy paddy from other farmers? ▢ Yes ▢ No If YES:
from farmers of the same area; ______cav (wet); ______cav (dry)
from farmers of other areas ______cav (wet); ______cav (dry)
Transport cost (PhP per _____) _________ from same area _________ from other areas
5. Why do you choose to avail of the custom drying service offered by the RPC? _____________________________________________________________________________
_____________________________________________________________________________
_____________________________________________________________________________
_____________________________________________________________________________
6. How much is the custom drying fee of RPC: wet season (PhP/kg) _________ dry season (PhP/kg) _________
7. What other costs are incurred when availing of the custom drying service of the RPC?
Item Cost at RPC (PhP) Cost before RPC(PhP)
Transportation
Pick Up
Labor
Others (pls. specify):_______
8. Before the presence of the RPC, how did you dry your palay? ▢ Sun drying ▢ flatbed dryer of cooperative
▢ Others, (specify)_____________________
9. How much was the custom drying fee? _________wet season _________dry season 10. How much were the other related expenses? (go to #7) 11. To whom do you sell your dry paddy?
_____________________________________________________________________________
_____________________________________________________________________________
_____________________________________________________________________________
12. What are your future plans? ▢ Continue availing of the custom drying service of the RPC, same volume
▢ Continue availing of the custom drying service of the RPC, increase in volume
▢ Continue selling to RPC, decrease in volume
▢ Others (specify): __________________________________________________
__________________________________________________
__________________________________________________

102
1. What is your production volume (in cavans of wet paddy)? _______________ 2. Area harvested (has) _______________ 3. What portion of your total paddy produce do you sell as wet paddy?
a) To RPC ▢ 100% ▢ 50% ▢ Others (specify)____ Month:______
b) To Others (specify) ▢ 100% ▢ 50% ▢ Others (specify)____ Month:______
4. Do you buy paddy from other farmers? ▢ Yes ▢ No If YES:
from farmers of the same area; ______cav (wet); ______cav (dry)
from farmers of other areas ______cav (wet); ______cav (dry)
Transport cost (PhP per _____) _________ from same area _________ from other areas
5. Why do you choose to sell wet paddy to the RPC? __________________________________________________________________________
__________________________________________________________________________
__________________________________________________________________________
__________________________________________________________________________
6. How much is the buying price for wet paddy at the RPC: wet season (PhP/kg) _________ dry season (PhP/kg)___________
7. What are the costs incurred when selling wet paddy?
Item Cost at RPC (PhP) Cost Before RPC (PhP)
Transportation
Pick Up
Labor
Others (pls. specify):_______
8. Before the presence of the RPC, to whom do you sell wet paddy? __________________________________________________________________________
__________________________________________________________________________
__________________________________________________________________________
9. How much were the other related expenses? (go to #7) 10. What are your future plans?
▢ Continue selling to RPC, sell more
▢ Continue selling to RPC, sell less
▢ Others (specify): __________________________________________________
__________________________________________________
__________________________________________________

103
Section 2-C FARMERS SELLING DRY PADDY TO THE RICE PROCESSING COMPLEX
1. What is your production volume (in cavans of wet paddy)? ______ 2. Area harvested (has)_____ 3. What portion of your total paddy produce do you sell as dry paddy?
a) To RPC ▢ 100% ▢ 50% ▢ Others (specify)____ Month:______
b) To Others (specify) ▢ 100% ▢ 50% ▢ Others (specify)____ Month:______
4. Do you buy paddy from other farmers? ▢ Yes ▢ No If YES:
from farmers of the same area; ______cav (wet); ______cav (dry)
from farmers of other areas ______cav (wet); ______cav (dry)
Transport cost (PhP per _____) _________ from same area _________ from other areas
5. Why do you choose to sell dry paddy to the RPC? __________________________________________________________________________
__________________________________________________________________________
__________________________________________________________________________
__________________________________________________________________________
6. How much is the buying price for dry paddy at the: a) RPC : wet season (PhP/kg) ____ dry season(PhP/kg) ____
b) Others : wet season (PhP/kg) ____ dry season(PhP/kg) ____
7. What are the costs incurred when selling dry paddy?
Item Cost at RPC (PhP) Cost before RPC (PhP)
Drying
Transportation
Pick Up
Labor
Others (pls. specify):_______
8. Before the presence of the RPC, to whom do you sell dry paddy? __________________________________________________________________________
__________________________________________________________________________
__________________________________________________________________________
9. How much were the other related expenses? (go to #7) 8. What are your future plans?
104
▢ Continue selling to RPC, sell more
▢ Continue selling to RPC, sell less
▢ Others (specify): __________________________________________________
__________________________________________________
__________________________________________________
Section 3 OTHER ISSUES AND CONCERNS
1. Other than the issues, challenges, and other concerns mentioned previously, is there anything you want to mention (both local or national) which you believe affects you and the rice industry in general?
_____________________________________________________________________________
_____________________________________________________________________________
_____________________________________________________________________________

105
Questionnaire # ______ Interviewer ________________ Reviewer __________________ Date _________
Survey Form for Non Users of RPC
Province : ▢ Pangasinan ▢ Davao del Sur ▢ Iloilo ▢ Bohol
Barangay: ........................................ Municipality/City: .................................................
Section 1 PERSONAL INFORMATION OF RESPONDENT
Respondent name :___________________________________________
1. Gender : ▢ Male ▢ Female 2. Birth date / Age : ____________________________________________ 3. Contact Info/Phone number : ____________________________________________ 4. Main occupation : ▢Farming ▢Others (specify)_____________. 5. Income from rice farming : PhP_____________ [ ] per cropping [ ] per year 6. Years in rice farming : ____________________________________________ 7. Member of farm-related organization : ▢ Yes ▢ No 8. Name of organization : ____________________________________________ 9. Position in organization : ____________________________________________ 10. Years in organization : ____________________________________________ 11. Location of farm :__________________________________________ 12. Land tenure: ▢ Owned ___% ▢ Tenant___% ▢ Lease ___% ▢ Others:___% 13. Do you plant other crops for commercial purposes? ▢ Yes ▢ No
(If Yes, answer #14)
14. Other commercial crops planted:
Crop Area
Planted (ha)
No. Of cropping per year
Harvest per cropping Net Income
Volume Value
15. Before the establishment of the RPC, were you already a rice farmer? ▢ Yes ▢ No If yes, then; do you
▢ Sell wet paddy to traders/millers
▢ Sell dry paddy to traders/millers
▢ Conduct sun drying
▢ Use a flatbed dryer
16. Were you previously a user of RPC services? ▢ No
▢ Yes (If yes, why, did you stop using the RPC?)
▢Too far, transport cost too high: PhP______/kg
▢ Service fee too expensive
▢ No truck for hauling

106
▢ Buying price too low: PhP______/kg
▢ Others (Pls. Specify):_____________________________
Section 2 FARMERS NOT USING THE RICE PROCESSING COMPLEX
1. What is/are the reason(s) why you don’t avail of the services of the RPC? [ ] Not aware of any services offered [ ] Service fees are too expensive
[ ] Waiting time is too long [ ] Buying price is too low [ ] Trucking is not available (pick-up or delivery) [ ] Not a member of farmers’ assoc.
[ ] Trucking is too expensive
[ ] Others (specify): _______________________________________________________
_______________________________________________________
_______________________________________________________
2. How do you dispose of your paddy? [ ] Sell wet paddy to private traders / millers (answer Section 2-A)
[ ] Sell dry paddy to private traders / millers (answer Section 2-B)
3. If you do not avail of the RPC then , do you ▢ Sell wet paddy to traders/millers (answer Section 2-A)
▢ Sell dry paddy to traders/millers (answer Section 2-B)
▢ Conduct sun drying (answer Section 2-B-1)
▢ Use a flatbed dryer (answer Section 2-B-2)
Section 2-A FARMER SELLING WET PADDY TO PRIVATE TRADERS /
MILLERS
1. What is your production volume (in cavans of wet paddy)? ______ 2. Area harvested (hectares)_____ 3. What portion of your total paddy produce do you sell as wet paddy?
▢ 100% ▢ 50% ▢ Others (specify)____ Month:______
4. How much is the buying price for wet paddy at the: Wet season (PhP/kg) ____ Dry season (PhP/kg) ____
5. What are the benefits of selling wet paddy to private traders/millers? ____________________________________________________________________________
____________________________________________________________________________
____________________________________________________________________________
6. What other costs are incurred when selling wet paddy from farm to private traders/millers?
Item Cost (PhP)
Transportation
Pick Up
Labor
Others (pls. specify):_______

107
7. What are your future plans? ▢ Continue selling to traders/millers, sell more
▢ Continue selling to traders/millers, sell less
▢ Start selling to RPC as [ ] wet paddy or [ ] dry paddy
▢ Others (specify): __________________________________________________
__________________________________________________
Section 2-B FARMER SELLING DRY PADDY TO TRADERS /
MILLERS
1. What is your production volume (in cavan of wet paddy)? ______ 2. Area harvested (has) _____ 3. What portion of your total paddy produce do you sell as dry paddy?
▢ 100% ▢ 50% ▢ Others (specify)____ Month:______
4. Why do you choose to sell dry paddy to traders/millers? __________________________________________________________________________
__________________________________________________________________________
__________________________________________________________________________
__________________________________________________________________________
5. How much is the buying price for dry paddy in the: Wet season (PhP/kg) ____ Dry season (PhP/kg) ____
6. What other costs are incurred when selling dry paddy from farm to traders /private millers?
Item Cost (PhP)
Transportation
Pick Up
Labor
Others (pls. specify):_______
7. What drying method do you use? [ ] Sun drying (answer Section 2-B-1) [ ] Flatbed dryer (answer Section 2-B-2)
8. What are your future plans? ▢ Continue selling to traders/millers, sell more
▢ Continue selling to traders/millers, sell less
▢ Start selling to RPC as [ ] wet paddy or [ ] dry paddy
▢ Others (specify): __________________________________________________
__________________________________________________
__________________________________________________

108
Section 2-B-1 FARMERS CONDUCTING SUN
DRYING
1. Why do you choose to do sun drying? __________________________________________________________________________
__________________________________________________________________________
__________________________________________________________________________
_____________________________________________________________________________
2. How many days does it take you to sun-dry?______________ 3. Are you using your own facilities for sun drying? ▢ Yes ▢ No
One batch Whole crop
Wet Season
Dry Season
If No, how much do you pay for renting a sun drying facility? PhP________
4. Please fill up the table of materials used in sun drying (e.g. mats , rakes, Others):
Item Initial Cost (PhP) Useful Life
5. What are the costs incurred when conducting sun drying?
Item Cost (PhP)
Labor
Transportation
Others (pls. specify):_______
6. What are the disadvantages of sun drying? __________________________________________________________________________
__________________________________________________________________________
__________________________________________________________________________
_____________________________________________________________________________
7. What are your future plans? ▢ Continue selling to traders/millers, sell more
▢ Continue selling to traders/millers, sell less
▢ Start selling to RPC as [ ] wet paddy or [ ] dry paddy
▢ Others (specify): __________________________________________________
__________________________________________________
__________________________________________________

109
Section 2-B-2 FARMERS USING A FLATBED
DRYER
1. Why do you choose to use a flatbed dryer? __________________________________________________________________________
__________________________________________________________________________
__________________________________________________________________________
_____________________________________________________________________________
2. How much is the drying fee? _____ 3. What is the waiting period for using the flatbed dryer? _______ hours / days / weeks (choose one) 4. How long does it take to dry your harvested crop? _______ hours / days (choose one) 5. What are the costs incurred when using a flatbed dryer?
Item Cost (PhP)
Labor
Fuel
Transportation
Facility
Others (pls. specify):_______
6. What are your future plans? ▢ Continue selling to traders/millers, sell more
▢ Continue selling to traders/millers, sell less
▢ Start selling to RPC as [ ] wet paddy or [ ] dry paddy
▢ Others (specify): __________________________________________________
__________________________________________________
__________________________________________________

110
Section 3 OTHER ISSUES AND
CONCERNS
1. Other than the issues, challenges, and other concerns mentioned previously, is there anything you want to mention (both local or national) which you believe affects you and the rice industry
in general?
_____________________________________________________________________________
_____________________________________________________________________________
_____________________________________________________________________________
_____________________________________________________________________________
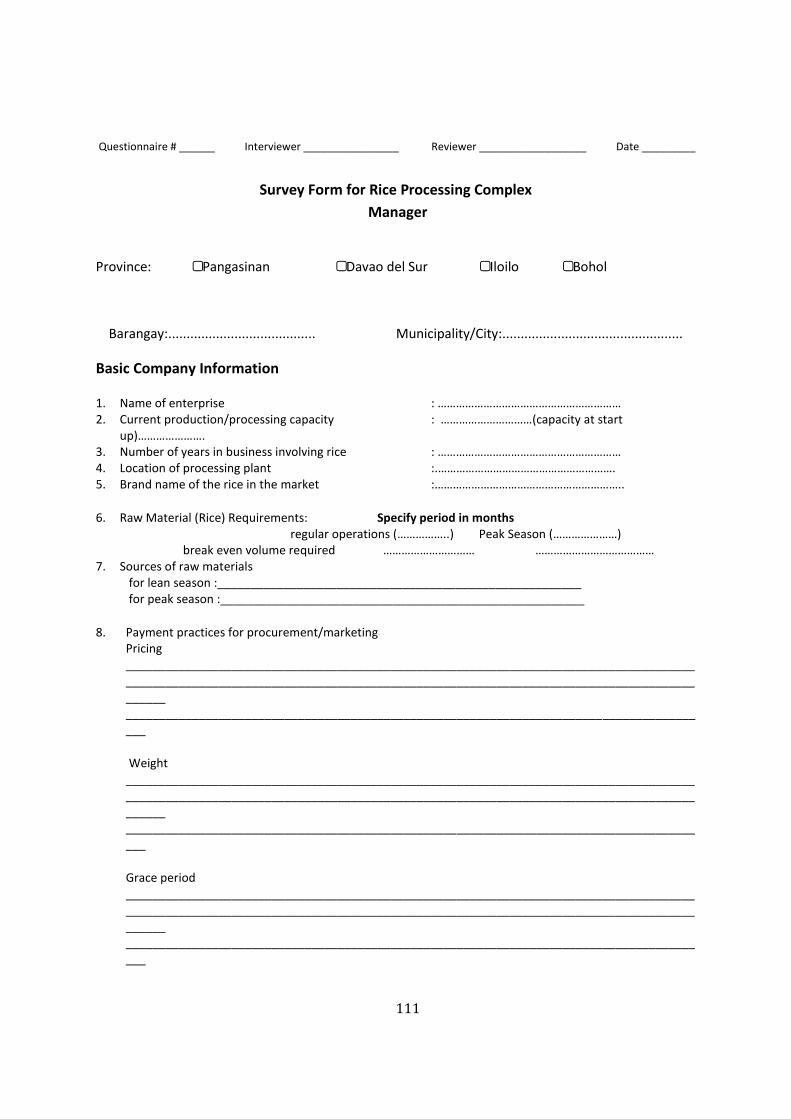
111
Questionnaire # ______ Interviewer ________________ Reviewer __________________ Date _________
Survey Form for Rice Processing Complex
Manager
Province: ▢ Pangasinan ▢ Davao del Sur ▢ Iloilo ▢ Bohol
Barangay:........................................ Municipality/City:.................................................
Basic Company Information 1. Name of enterprise : …………………………………………………… 2. Current production/processing capacity : …………………………(capacity at start
up)…………………. 3. Number of years in business involving rice : …………………………………………………… 4. Location of processing plant :.…………………………………………………. 5. Brand name of the rice in the market :……………………………………………………..
6. Raw Material (Rice) Requirements: Specify period in months regular operations (……………..) Peak Season (…………………)
break even volume required ………………………… ………………………………… 7. Sources of raw materials
for lean season :_______________________________________________________ for peak season :_______________________________________________________
8. Payment practices for procurement/marketing Pricing __________________________________________________________________________________________________________________________________________________________________________________ _________________________________________________________________________________________
Weight __________________________________________________________________________________________________________________________________________________________________________________ _________________________________________________________________________________________ Grace period __________________________________________________________________________________________________________________________________________________________________________________ _________________________________________________________________________________________

112
9. Who buys the rice?
__________________________________________________________________________________________________________________________________________________________________________________ _________________________________________________________________________________________
10. Have there been any complaints regarding the quality of the RPC products? ▢Yes ▢No
11. Average distances from suppliers, type and costs of transport. _____________________________________________________________________________
_____________________________________________________________________________
_____________________________________________________________________________
12. Who is responsible for transportation? ▢Supplier ▢Buyer ▢Others, pls. specify
13. Transportation cost
Expense Cost (PhP) Cost of Transportation (per distance of delivery) Labor fee per trip Other cost per trip (toll, etc.) Maintenance cost per month
14. How frequent do you procure paddy in a month?
Wet season____________________ Dry season _______________________ 15. Are there monitoring/technical assistance programs for paddy suppliers? ▢Yes ▢No 16. Please describe the rice chain (from production to end user) as you understand it
(In the province, region)

113
17. Are there optional processes done to the rice to increase its value? ▢No ▢Yes
(If yes, what are these processes and how much (PhP) is the service fee? a._______________________________ b._______________________________ c._______________________________
18. What are the benefits generated by the presence of the RPC? _____________________________________________________________________________
_____________________________________________________________________________
_____________________________________________________________________________
19. What is the effect of the Rice Processing Complex with regards to private millers?
In terms of volume: _________________________________________________________ In terms of price :__________________________________________________________
20. Describe the installations/ equipment / processes with the top/best benchmarks you know. _____________________________________________________________________________
_____________________________________________________________________________
_____________________________________________________________________________
_____________________________________________________________________________
_____________________________________________________________________________
_____________________________________________________________________________
21. How does the location affect the performance of the RPC?
_____________________________________________________________________________
_____________________________________________________________________________
_____________________________________________________________________________
22. What are byproducts of the processing facility and how are they disposed?
_____________________________________________________________________________
_____________________________________________________________________________
_____________________________________________________________________________
23. What is the actual milling recovery? _____ 24. What is the average wholesale price of milled rice? _____ 25. Estimated initial cost for the facility PhP___________.

114
26. What are the breakdowns of the monthly expense of the RPC?
Expense Value ( PhP)
Operating Cost
1. 1.
2.
3.
4.
5.
Management Cost
1.
2.
3.
4.
5.
27. What is the ideal capacity of the plant, considering economies of scale?___________
28. What will make you decide to operate at ideal capacity level (if not yet at it)
_____________________________________________________________________________
_____________________________________________________________________________
_____________________________________________________________________________
29. What policies worked and did not work in favor of the sector?
_____________________________________________________________________________
_____________________________________________________________________________
_____________________________________________________________________________
30. Any other policy/institutional issues related to rice marketing/supply chain that affected the operations? _____________________________________________________________________________
_____________________________________________________________________________
_____________________________________________________________________________
THANK YOU

115
Questionnaire # ______ Interviewer ________________ Reviewer __________________ Date _________
Survey Form for Flatbed Dryers
Province:▢ Pangasinan ▢ Davao del Sur ▢ Iloilo ▢ Bohol Barangay:........................................ Municipality/City:.................................................
Respondent name :….....................................................................................
1. Gender :▢ Male ▢ Female 2. Contact Info/Phone number :…..................................................................................... 3. Birthdate / Age :….................................................................................... 4. Main occupation : ▢Farming ▢others(specify)_____________ 5. Income from farming :PhP_____________ [ ] per cropping [ ] per year 6. Years in rice farming :…..................................................................................... 7. Member of farm-related organization : ▢ Yes ▢ No 8. Name of organization :…...................................................................................... 9. Position in organization :…...................................................................................... 10. Years in organization :.…..................................................................................... 11. Land tenure: ▢ Owned ___% ▢ Tenant___% ▢ Lease ___% ▢ Others:___% 12. Do you plant other crops for commercial purposes? ▢ Yes ▢ No
(If Yes, proceed to #13)
13. Other commercial crops planted:
Crop Area
planted
No. Of cropping per
year
Harvest per cropping Net Income Volume Value
14. Do you dry your palay using the FBD in your community? ▢ Yes ▢ No If Yes, go to Part A If No, go to Part B.
PART A FARMERS USING THE FLAT BED
DRYER 1. If yes, how often do you use the FBD?
▢ Every harvest season ▢ Wet season only ▢ Only when I am able to secure a cue to dry
2. What portion of your total harvest do you dry using the FBD? ▢ 100% ▢ 50% ▢ Others _______
(If not, 100%) What do you do with the rest of your harvest? ▢ Sell them as wet palay to:
▢ RPC ▢ traders/miller ▢ Sundry
3. How much is the drying fee? PhP/cav______ 4. How much is the transport cost to the drying center? PhP/cav______ 5. Other costs?________

116
6. What do you do with the palay dried using the FBD? ▢ Sell to :
▢ RPC ▢ 100% ▢ 50% ▢ Others _______ ▢ Private trader/miller ▢ 100% ▢ 50% ▢ Others _______
▢ Mill the palay
7. If you sell the dried paddy, how much did you get for it from your most recent transaction? PhP/cav______
8. If you milled the paddy, how much did you received from the milled rice? PhP/cav______ 9. What is the advantage of having the flatbed dryer?
______________________________________________________________________________
______________________________________________________________________________
______________________________________________________________________________
10. Was the traditional system of drying disturbed due to the introduction of the DA flatbed dryer? ▢ Yes ▢ No
If Yes, in what way was the system disturbed?
______________________________________________________________________________
______________________________________________________________________________
______________________________________________________________________________
PART B FARMERS THAT ARE PREVIOUS NON USER OF FBD 1. What do you do with your harvest?
1. ▢ Sell as wet paddy -----------▢ 100% ▢ 50% ▢ Others _______
2. ▢ Sundry ---------▢ 100% ▢ 50% ▢ Others _______
If A, how much were you getting from your harvest? PhP/cav______ If B, how much were you spending for sun drying? PhP/cav______
2. Why do you prefer to sundry rather than use available mechanical dryers? ______________________________________________________________________________
______________________________________________________________________________
______________________________________________________________________________
OTHER ISSUES
1. Other than the , issues, challenges, and other concerns mentioned previously, are there anything you want to mention (both local or national) which you believe affects you and the rice industry in general? _____________________________________________________________________________
_____________________________________________________________________________
_____________________________________________________________________________
_____________________________________________________________________________
THANK YOU!

117
Questionnaire # ______ Interviewer ________________ Reviewer __________________ Date _________
Survey Form for Threshers
Province ▢ Pangasinan ▢ Davao del Sur ▢ Iloilo ▢ Bohol
Barangay:........................................ Municipality/City: .................................................
PERSONAL INFORMATION OF RESPONDENT
Respondent name
:______________________________________________
___
1. Gender : ▢ Male ▢ Female 2. Birth date / Age
:_________________________________________________ 3. Main occupation ▢Farming ▢others (specify)_____________. 4. Income from farming :PhP_____________ [ ] per cropping [ ] per year 5. Years in rice farming
:_________________________________________________ 6. Contact Info/Phone number :
_________________________________________________ 7. Member of farm-related organization : ▢ Yes ▢ No 8. Name of organization
:_________________________________________________ 9. Position in organization
:_________________________________________________ 10. Years in organization
:_________________________________________________ 11. Location of farm
:_________________________________________________ 12. Land tenure: ▢ Owned ___% ▢ Tenant___% ▢ Lease ___% ▢ others ___% 13. Do you plant other crops for commercial purposes? ▢ Yes ▢ No
(If Yes, answer #14)
14. Other commercial crops planted:
Crop Area
planted
No. Of
cropping
per year
Harvest per cropping Net Income
Volume Value
15. Were you always a thresher user? ▢ Yes, If yes please answer Part A,
▢ No , If No, please answer Part B

118
PART A. FARMERS USING THE THRESHER
1. Volume of palay harvest in the most recent cropping season (in cavans of wet paddy)________ 2. What is the payment scheme for the use of the thresher?
______________________________________________________________________________
______________________________________________________________________________
______________________________________________________________________________
______________________________________________________________________________
______________________________________________________________________________
3. Was the palay immediately threshed after harvesting? ▢ Yes ▢ No If yes, go to question 4
If no, how many days did it take before the palay was threshed?
▢ 1 day delay ▢ 2 days delay ▢ 3 days delay ▢ others: _______
4. What did you do with the palay after threshing? ▢ Sold it as wet paddy
▢ Dried the paddy and then sold it
5. How much did you get from your palay? ▢ Wet Palay PhP/cav: _____ No. of cav._____
▢ Dry Palay PhP/cav: _____ No. of cav._____
6. What is/are the advantage/s of having the thresher? ______________________________________________________________________________
______________________________________________________________________________
______________________________________________________________________________
7. Was the traditional system of harvesting disturbed due to the introduction of the DA thresher? ▢ Yes ▢ No
If Yes, in what way was the system disturbed?
______________________________________________________________________________
______________________________________________________________________________
______________________________________________________________________________

119
PART B. PREVIOUS NON USER OF THRESHER
1. Was the palay immediately threshed after harvesting? ▢ Yes ▢ No
If yes, go to question 2
If no, how many days did it take before your palay was threshed?
▢ 1 day delay ▢ 2 days delay ▢ 3 days delay ▢ others: _______
2. What did you do with the palay after threshing? ▢ Sold it as wet paddy
▢ Dried the paddy and then sold it
3. Please fill up the table below:
Item Value
No. of days to finish threshing
No. of Workers/day
Labor Cost /person/day
Other cost (Pls. Specify)
4. What is the payment scheme for the traditional method of threshing? ___________________________________________________________________________________
___
___________________________________________________________________________________
_______________________________________________________________________________________
______
OTHER ISSUES
1. Other than the , issues, challenges, and other concerns mentioned previously, are there anything you want to mention (both local or national) which you believe affects you and the rice industry in general? _____________________________________________________________________________
_____________________________________________________________________________
_____________________________________________________________________________
Thank You

120
Questionnaire # ______ Interviewer ________________ Reviewer __________________ Date _________
Survey Form for Barangay/Municipal Food Terminal Suppliers
Province : ▢ Pangasinan ▢ Davao del Sur ▢ Iloilo ▢ Bohol
Barangay: ........................................ Municipality/City: .................................................
▢ Farmers ▢ Fisherfolk
PERSONAL INFORMATION OF RESPONDENT
Respondent name :___________________________________________
1. Gender :▢ Male ▢ Female 2. Birth date / Age :____________________________________________ 3. Contact Info/Phone number :____________________________________________ 4. Main occupation :▢Farming ▢others (specify)_________________ 5. Income from farming :PhP_____________ [ ] per cropping [ ] per year 6. Years in farming :____________________________________________ 7. Member of farm-related organization : ▢ Yes ▢ No 8. Name of organization : ____________________________________________ 9. Position in organization :____________________________________________ 10. Years in organization :____________________________________________ 11. Location of farm :____________________________________________ 12. Location of the food terminal :____________________________________________ 13. Describe the basic function and operation of your trading.
▢ Buying ▢ Selling ▢ Both 14. Do you sell your products to the BFT? ▢ Yes ▢ No (If yes, what percentage of your products do you sell to the BFT?)
▢ 100% ▢ 75% ▢ 50% ▢ 25% 15. Do you sell your products fresh or processed? ______________. 16. Do you sell produce all year? ▢ Yes ▢ No
(If No, what are the usual months that you sell produce?)____________ 17. Do you avail of other services provided by the BFT , like food processing? ▢ Yes ▢ No
(If yes, what are the services you avail from the BFT and how much do you pay for each service?
Services Fees(PhP) 1. 2. 3.
18. Does the presence of the BFT prevented if not lessened the postharvest losses, like spoilage? ▢ Yes ▢ No 19. What are the differences observed before and during the presence of the BFT?
______________________________________________________________________________________________________________________________________________________________________________________________________________________________________________________________________________

121
20. Kindly fill up the Table below.
Type of
Produce
Wei
ght
(kg
or
cav)
With the Food Terminal
Before the Food Terminal
Use of Food Terminal (Pls
Check) Selling Price
Transport Cost
Market Outlet (Pls Check) Selling
Price
Transport Cost D
aily
Weekly
Others (specify):_________
Brgy. Wet
Market Public Wet
Market
Others (specify):_________
Rice
Vegetable
1.
2.
3.
4.
5.
Root Crop
1.
2.
3.
4.
5.
Meat
1.
2.
3.
4.
5.
Seafood
1.
2.
3.
4.
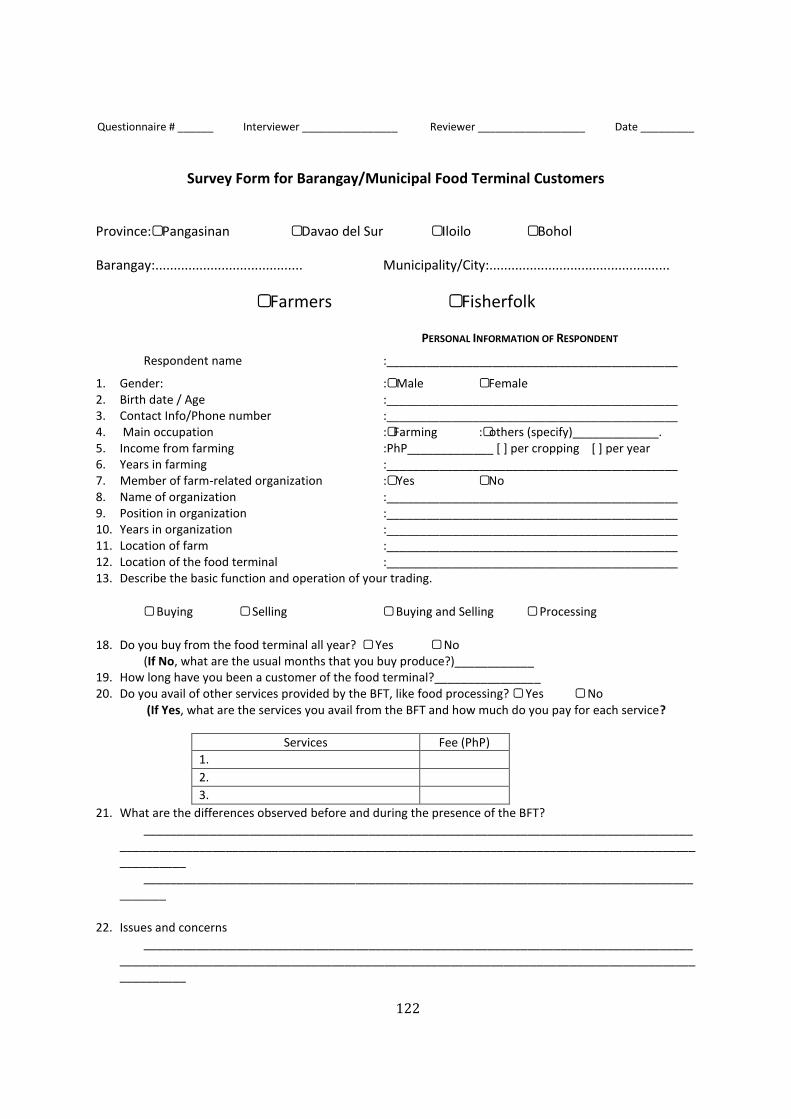
122
Questionnaire # ______ Interviewer ________________ Reviewer __________________ Date _________
Survey Form for Barangay/Municipal Food Terminal Customers Province:▢ Pangasinan ▢ Davao del Sur ▢ Iloilo ▢ Bohol
Barangay:........................................ Municipality/City:.................................................
▢ Farmers ▢ Fisherfolk
PERSONAL INFORMATION OF RESPONDENT
Respondent name :____________________________________________
1. Gender: :▢ Male ▢ Female 2. Birth date / Age :____________________________________________ 3. Contact Info/Phone number :____________________________________________ 4. Main occupation :▢Farming :▢others (specify)_____________. 5. Income from farming :PhP_____________ [ ] per cropping [ ] per year 6. Years in farming :____________________________________________ 7. Member of farm-related organization :▢ Yes ▢ No 8. Name of organization :____________________________________________ 9. Position in organization :____________________________________________ 10. Years in organization :____________________________________________ 11. Location of farm :____________________________________________ 12. Location of the food terminal :____________________________________________ 13. Describe the basic function and operation of your trading.
▢ Buying ▢ Selling ▢ Buying and Selling ▢ Processing
18. Do you buy from the food terminal all year? ▢ Yes ▢ No (If No, what are the usual months that you buy produce?)____________
19. How long have you been a customer of the food terminal?________________ 20. Do you avail of other services provided by the BFT, like food processing? ▢ Yes ▢ No
(If Yes, what are the services you avail from the BFT and how much do you pay for each service?
Services Fee (PhP) 1. 2. 3.
21. What are the differences observed before and during the presence of the BFT? ___________________________________________________________________________________
_________________________________________________________________________________________________
__________________________________________________________________________________________
22. Issues and concerns
____________________________________________________________________________________________________________________________________________________________________________________

123
23. Kindly fill up the Table below
Type of
Produce
Wei
ght
(kg
or
cav)
With the Food Terminal
Without the Food Terminal
Frequency of Use of the
Food Terminal Buying
Price
Transport Cost
Market Outlet
Buying Price
Transport
Cost
Daily
Weekly
Others (specify):_________
Brgy. Wet
Market
Public Wet
Market
Others (specify):_________
Rice
Vegetable
2.
2.
3.
4.
5.
Root Crop
2.
2.
3.
4.
5.
Meat
2.
2.
3.
4.
5.
Seafood
2.
2.
3.
4.
5.

124
Questionnaire # ______ Interviewer ________________ Reviewer __________________ Date _________
Survey Form for Barangay/Municipal Food Terminal Manager
Province: ▢ Pangasinan ▢ Davao del Sur ▢ Iloilo ▢ Bohol
Barangay:........................................
Municipality/City:.................................................
Section 1 PERSONAL INFORMATION OF
RESPONDENT Respondent name
:………………………………………………………………………………………
…
1. Gender ; ▢ Male ▢ Female 2. Birth date / Age : ……………………………………………………………………………………… 3. Contact Info/Phone number :
………………………………………………………………………………………… 4. Main occupation :▢Farming ▢Others (specify)_____________. 5. Monthly income :
………………………………………………………………………………………… 6. Income from farming :PhP…………………………… [ ] per cropping [ ] per year 7. Years in farming :
………………………………………………………………………………………… 8. Member of farm-related organization :▢ Yes ▢ No 9. Name of organization :
……………………………………………………………………………………….. 10. Position in organization :
………………………………………………………………………………………… 11. Years in organization :
………………………………………………………………………………………… 12. Main purpose of the organization :
…………………………………………………………………………………………
Section 2 BASIC COMPANY INFORMATION
1. Name of store
:…………………………………………………………………………………………. 2. Type of store :▢ LGU Managed ▢ Coop Managed ▢ Others 3. Current production/processing capacity :………………………………(capacity at start up)……………….. 4. Year of start of operation
:…………………………………………………………………………………………. 5. Location of the store
:…………………………………………………………………………………………. b. Ownership of the land
:………………………………………………………………………………………….
125
c. Building :………………………………………………………………………………………….
d. Food Terminal Fund :………………………………………………………………………………………….
6. Goods Sold ▢ Fruits and Vegetables ▢ Fruits, Vegetables and Meat ▢ Fruits, Vegetables, Meat and Basic Commodities
7. Monthly Revenue of the Food Terminal :Now……………………………. Before:……………….………… 8. Number of members :Now:……………………………. Before:…………………………..
Section 3
OPERATIONS 1. Describe the basic function and operation of your trading.
▢ Buying and selling only ▢ Buying then processing ▢ Both
2. Volume of Goods Sold
Goods At the Start Now
3. Marketing practices
● Pricing; ▢ Purchasing Goods ▢ Selling Goods
▢Prevailing Market Price ▢Purchase Price +%Mark –Up ▢Others __________________________________________________________________________________
● Sell on credit :▢ Yes ▢ No, (If No , then what is the grace period duration) ______________________________________________________________________________________________________________________________________________________________________
4. Who buys your products? ▢ Member ▢ Non Members, (If Yes) from :same barangay:……………………..................... Other barangay:………………………………………..
5. Where are your usual sources of products? _____________________________________________________________________________________________________________________________________________________________________________________________________________________________________________________________________
6. Sourcing from local supplier? Why or why not? ____________________________________________________________________________________________________________________________________________________________________________

126
______________________________________________________________________________________ ______________________________________________________________________________________
7. How frequent do you purchase goods ? From Within the Municipality/Barangay:
_____________________________________________________ From Nearby
Municipality/Barangay:________________________________________________________
8. Where do you store your products? ____________________________________________________________________________________________________________________________________________________________________________ ____________________________________________________________________________________________________________________________________________________________________________
9. Have there been any issues with the quality of the products? ▢ Yes ▢ No
If yes , please state the issue/s: __________________________________________________________________________________________________________________________________________________________________________________________________________________________________________________________________
10. Are there other service you provide to the customers (e.g. food processing) ▢ Yes ▢ No (If yes, please answer No. 10, if no please answer No. 11)
11. What are these services, and how much do you charge for each service?
Service Fee
12. What are the reasons that you do not provide food processing services?
____________________________________________________________________________________________________________________________________________________________________________ ______________________________________________________________________________________
13. What is the average monthly operating cost of the food terminal?
Item Cost ( PhP) Utility Cost (Electric, Water, Telephone, Room or Land Rental) Transportation Cost Management Cost

127
14. Please describe the chain (from production to end user) as you understand it (in your province, region).
Section 4 OTHER
CONCERNS
1. What are the benefits obtained from having a food terminal? ____________________________________________________________________________________________________________________________________________________________________________ ______________________________________________________________________________________
2. What are the disadvantages of the presence of the food terminal? ____________________________________________________________________________________________________________________________________________________________________________ ______________________________________________________________________________________
3. What policies worked and that did not work in favor of your sector?
____________________________________________________________________________________________________________________________________________________________________________ ______________________________________________________________________________________
4. Any other policy/institutional issues related to marketing/supply chain that affected your operations?

128
____________________________________________________________________________________________________________________________________________________________________________ ______________________________________________________________________________________
PLEASE ATTACH LIST OF COMMODITIES SOLD AND VOLUME SOLD ON A MONTHLY BASIS
THANK YOU