Embed Size (px)
Citation preview

2
Rank-Biased Precision for Measurementof Retrieval Effectiveness
ALISTAIR MOFFATThe University of MelbourneandJUSTIN ZOBELRMIT University and NICTA Victoria Research Laboratory
A range of methods for measuring the effectiveness of information retrieval systems has beenproposed. These are typically intended to provide a quantitative single-value summary of a doc-ument ranking relative to a query. However, many of these measures have failings. For exam-ple, recall is not well founded as a measure of satisfaction, since the user of an actual sys-tem cannot judge recall. Average precision is derived from recall, and suffers from the sameproblem. In addition, average precision lacks key stability properties that are needed for ro-bust experiments. In this article, we introduce a new effectiveness metric, rank-biased pre-cision, that avoids these problems. Rank-biased precision is derived from a simple model ofuser behavior, is robust if answer rankings are extended to greater depths, and allows accu-rate quantification of experimental uncertainty, even when only partial relevance judgments areavailable.
Categories and Subject Descriptors: H.3.3 [Information Storage and Retrieval]: Informa-tion Search and Retrieval—Retrieval models, search process; H.3.4 [Information Storage andRetrieval]: Systems and Software—Performance evaluation (efficiency and effectiveness)
General Terms: Experimentation, Measurement, Human Factors
Additional Key Words and Phrases: Recall, precision, average precision, relevance, pooling
ACM Reference Format:Moffat, A. and Zobel, J. 2008. Rank-biased precision for measurement of retrieval effectiveness.ACM Trans. Inform. Syst. 27, 1, Article 2 (December 2008), 27 pages. DOI = 10.1145/1416950.1416952 http://doi.acm.org/10.1145/1416950.1416952
This work was supported by the Australian Research Council.Authors’ addresses: A. Moffat, Department of Computer Science and Software Engineering, TheUniversity of Melbourne, Victoria 3010, Australia; email: [email protected]; J. Zobel,Department of Computer Science and Software Engineering, The University of Melbourne, Victoria3010, Australia; email: [email protected] to make digital or hard copies of part or all of this work for personal or classroom use isgranted without fee provided that copies are not made or distributed for profit or direct commercialadvantage and that copies show this notice on the first page or initial screen of a display alongwith the full citation. Copyrights for components of this work owned by others than ACM must behonored. Abstracting with credit is permitted. To copy otherwise, to republish, to post on servers,to redistribute to lists, or to use any component of this work in other works requires prior specificpermission and/or a fee. Permissions may be requested from Publications Dept., ACM, Inc., 2 PennPlaza, Suite 701, New York, NY 10121-0701, USA, fax +1 (212) 869-0481, or [email protected]© 2008 ACM 1046-8188/2008/12-ART2 $5.00 DOI 10.1145/1416950.1416952 http://doi.acm.org/10.1145/1416950.1416952
ACM Transactions on Information Systems, Vol. 27, No. 1, Article 2, Publication date: December 2008.

2:2 • A. Moffat and J. Zobel
1. INTRODUCTION
Information retrieval systems compute, for each document in a collection, ascore that estimates the similarity between that document and a query. In typ-ical systems, each score represents an estimated probability that the documentis relevant to the information need expressed by the query. Once the processof scoring is complete, documents are presented to the user in decreasing scoreorder, in the expectation that the user considers them in sequence until theirinformation need has been satisfied.
A range of methods for measuring the effectiveness of information retrievalsystems has been proposed. A key element of many of these measures—andcertainly of those in the widest use—is the assumption of binary relevance, withhuman assessors asked to determine, for a set of documents, which membersare relevant to the query and which are not. Given a ranking, each document ismarked as relevant or irrelevant (or unjudged), and the sequence of decisions isthen used as input to a quantitative measure of effectiveness. Two elementarymeasures are recall and precision [van Rijsbergen 1979, Chapter 7]. These canbe combined to give a single value via mechanisms such as a 3-point or 11-pointrecall-precision average [Buckley and Voorhees 2005].
One of the most commonly used measures in recent IR research is averageprecision (AP), which does not directly use recall, but does require knowledgeof R, the total number of relevant documents for the query in question. Otherwidely used measures are precision at d documents retrieved (P@d ), where typ-ically d is 10; R-precision, or P@R; and reciprocal rank (RR). However, all ofthese measures have failings. For example, it is not clear what user behavioris modeled by AP, and it has properties that render it volatile in typical experi-mental settings. In particular, using AP with incomplete relevance judgmentstypically leads to inflated effectiveness estimates, and the discovery of furtherrelevant documents in a ranking usually reduces measured effectiveness. Theseissues are not addressed by recent AP-based metrics such as those of Buckleyand Voorhees [2004] or Sakai [2004].
Underlying these issues are two problems with recall. One, which is widelyknown, is that in current systems complete relevance judgments are imprac-tical and thus recall tends to be overestimated. Figure 1 shows this problemusing the standard Venn diagram approach. The TREC methodology is dis-cussed in more detail below. Another problem with recall, which has not re-ceived such wide attention, is that it does not correspond to a likely model of userbehavior.
In this article, we introduce a new metric, rank-biased precision (RBP), thatavoids many of the failings of average precision. The basis of RBP is that itmeasures the rate at which utility is gained by a user working at a given de-gree of persistence; by adjusting persistence, a parameter that represents anaspect of user behavior, RBP has the advantage of capturing the critical facetsof AP, RR, and P@d . An additional benefit of RBP compared to AP is that itallows accurate quantification of experimental errors when only partial rele-vance judgments are available, which is useful when large-scale experimentsare being carried out. Rank-biased precision also has some similarities with the
ACM Transactions on Information Systems, Vol. 27, No. 1, Article 2, Publication date: December 2008.

Rank-Biased Precision for Measurement of Retrieval Effectiveness • 2:3
C’
(a) The Cranfield arrangement (b) The TREC arrangement
Judged
Retrieved RelevantRetrieved Relevant
B A C AB’
B C
A’
Fig. 1. Recall and precision: (a) the Cranfield arrangement, with all documents in the collectioncategorized for relevance, and in which precision is |A|/(|A| + |B|), and recall is |A|/(|A| + |C|); and(b) the TREC arrangement, in which only a subset of the documents are categorized for relevance,and the size of the sets A′ and C′ is not known, but for calculation purposes it is assumed that|A′| = |C′| = 0 and that |A| + |B| + |B′| = d , the number of documents retrieved.
discounted cumulative gain (DCG) metric of Jarvelin and Kekalainen [2002],and is compared to that measure below.
To understand some of the issues in existing measures, we first considerrecall and precision and the way in which relevance judgments are collected.We next review the measures in common use in experimental work, as well asother measures that have been proposed in the literature. We then describerank-biased precision, and experimentally examine its behavior.
2. RECALL AND PRECISION
Recall and precision have been in use for more than four decades [vanRijsbergen 1979, Chapter 7]. Recall is the proportion of the relevant documentsthat have been retrieved, while precision is the proportion of retrieved docu-ments that are relevant. In the context of a ranked list of documents, recalland precision can be measured at each document retrieved, at each relevantdocument retrieved, or at recall percentiles in the ranking. Alternatively, if asingle value is required, recall and precision can be measured at any fixed pointin the ranking. Recall and precision tend to be in tension; when recall is high,precision is usually low, and vice versa. Textbooks describe these two metricsin detail, and the associated concept of recall-precision curves; see, for example,van Rijsbergen [1979, Chapter 7] and Witten et al. [1999, Chapter 4].
Relevance is a human concept that requires human judgment, and a well-known problem with current experiments is that exhaustive relevance judg-ments stop being practical once collections exceed a few tens of megabytes.“Trying to get an indication of which proportion of the existing relevantinformation items was retrieved by a system . . . is a hopeless undertaking”[Frei and Schauble 1991, page 154]. Practical experiments such as TREC1
make use of an approximation to the true number of relevant documents.
1See trec.nist.gov.
ACM Transactions on Information Systems, Vol. 27, No. 1, Article 2, Publication date: December 2008.

2:4 • A. Moffat and J. Zobel
Participating TREC systems generate query rankings containing 1000 docu-ments, from which a set of relevant documents is identified via a pooling ap-proach [Harman 1995; Zobel 1998], with (typically) the top 100 documents fromeach system for each query assessed for relevance. That is, in TREC the num-ber R of relevant documents in a collection for some query is deemed to be thenumber of relevant documents that appear in the top 100 in the ranking ofsome participating system when executing that query. Figure 1(b) shows theTREC arrangement of documents retrieved in a query’s result list by some sys-tem; documents that have been judged, after a pool is derived based on prefixrankings contributed by multiple systems; and documents that are relevant forthat query. For a particular query and system, all eight zones in Figure 1(b) canbe nonempty.
A key assumption of the pooling approach is that, by having a large enoughnumber of participants, the great majority of the relevant documents are iden-tified and thus, for each query, that a good first-order approximation to thenumber R of documents relevant to that query can be determined. Postexperi-ment analysis has indeed shown that, for some queries, it is highly likely thatall the relevant documents have been discovered, but that, for others, thereare clearly many more that have not been identified [Zobel 1998]. For these,and other reasons, Saracevic [1995] referred to recall as a “metaphysical mea-sure: how does one know what is missed when one does not know that it ismissed?”
What is arguably a more profound problem relates to a very simple ques-tion: what is it that recall is measuring? The purpose of a metric is to evaluatewhether a system is successful completing some task, or rather, a computableabstraction of a task. We measure the CPU time consumed by an algorithmbecause we claim that, to be an interesting property that has consequences forhow the algorithm will be used, we don’t usually measure (say) the numberof bytes in the compiled instruction sequence, because that tells us nothing ofgreat interest. In IR, we need “criteria representing the objectives of the sys-tem,” and that they should be concerned with the question of “how to provide aprospective user with useful information” [Saracevic 1995]. For example, mea-suring precision to depth d is valid because a user who is given six answersin the top 10 documents is probably better off than a user who is given three.That is, precision can be interpreted as a measure of user satisfaction when theuser’s actions are modeled in a certain plausible way.
It might similarly be argued that a user who is given all the answers to aquery is better off than a user who is given only some, and thus that calculationof recall is of value. However, in our view this line of reasoning does not standscrutiny, because unless a user has “perfect” knowledge of the documents in-cluded in some retrieval system, they cannot know that they have seen all theanswers (or half the answers, or 27% of the answers). As an extreme example,a system comparison based on recall asserts that, if a collection has only oneanswer, the user is 100% satisfied once they have seen it, but, if there is an-other relevant document that they neither know about nor view, they are onlyhalf satisfied. Many authors have also written of similar concerns. For example,Buckley and Voorhees [2005, page 61] indicated that “one of the current debates
ACM Transactions on Information Systems, Vol. 27, No. 1, Article 2, Publication date: December 2008.

Rank-Biased Precision for Measurement of Retrieval Effectiveness • 2:5
in IR is whether recall is important outside a few specific applications such aspatent searching.” Also worth noting is that, in these high-recall applications,users typically pose multiple queries, and seek to address their informationneed in a variety of ways, including via browsing and citation following. Insuch cases, the recall arising from the whole sequence of interactions with thecollection is what is of interest, regardless of how satisfied (or not) the userfeels after each individual search. That is, while missing a legal precedent or amedical experiment with every query in an information-seeking session mightbe disastrous, the recall of one query considered in isolation is not particularlyinformative.
Another perspective on this issue is that, crudely, queries can be said to be oftwo kinds: “find a document” and “find a lot of documents.” For the first kind, anyrelevant document is satisfactory, and the query is resolved when the answer isfound (and perhaps confirmed), no matter how many other relevant documentsthere are—consider the query “boiling point of lead,” for example. In this kindof search the concept of recall is not applicable. For the second kind of query,for large and uncurated collections such as the Web, the user almost certainlydoes not know whether all relevant documents have been found until they havephrased a variety of queries and undertaken a multipronged exploration of thedata, meaning that recall is unrelated to their satisfaction level in regard toany single query.
In a particularly pertinent comment, Cooper [1973, page 95] wrote the fol-lowing:
The involvement of unexamined documents in a performance for-mula has long been taken for granted as a perfectly natural thing,but if one stops to ponder the situation, it begins to appear mostpeculiar. . . . Surely a document which the system user has not beenshown in any form, to which he has not devoted the slightest particleof time or attention during his use of the system output, and of whosevery existence he is unaware, does that user neither harm nor goodin his search.
On the next page, Cooper [1973] went on to say the following:
Instead of attempting to estimate recall in spite of all the difficulties,what should have been done was to find a way to overcome the defi-ciencies of the precision measure without bringing a second measureinto the picture.
Although written well over 30 years ago, Cooper’s words remain applicabletoday.
Precision is a rather more straightforward metric than recall. It clearly doesprovide a measure of user satisfaction, particularly when evaluated at a query-independent value such as d = 10 or d = 20. On the other hand, if precision isevaluated at a single point that is in some way determined by a numeric recalllevel, then the criticisms above still apply.
Su [1994] observed and interviewed 40 users who had employed profes-sional intermediaries to assist with Boolean querying in online library services.
ACM Transactions on Information Systems, Vol. 27, No. 1, Article 2, Publication date: December 2008.

2:6 • A. Moffat and J. Zobel
Su compared each user’s subjective judgment of overall search success againsta range of other measures, including precision, search time, search cost, theuser’s satisfaction with the completeness of search results, and the user’s con-fidence in completeness of the search results. Su found that precision was nota strong indicator of subjective success and that the two “completeness” indi-cators were more closely aligned with overall success, concluding that “recall ismore important than precision to users” [Su 1994, page 213]. However, Su wasnot able to directly assess recall, because, as she observed in her article, “recall. . . requires the knowledge of all the relevant documents in the databases(s)in relation to the users’ needs or problems” [Su 1994, page 208]. Moreover, theexperimental environment was of academic searchers who were given an un-ranked set of Boolean-matching documents with considerable effort going intothe construction of each query—quite different in terms of both approach andaudience to typical current search environments.
Other issues in retrieval experiments include the reliability of relevanceassessment and the validity of binary relevance judgments; see, for example,Harter [1996], Mizzaro [1997], Borlund and Ingwersen [1998], Jarvelin andKekalainen [2002], and Kekalainen [2005]. These issues are significant, butthey are separate from the topic of this article, and binary relevance judg-ments do provide a basis for assessing the utility of retrieval systems [Allanet al. 2005]. Likewise, there are many different ways of evaluating an IR sys-tem; see, for example, Kagolovsky and Moehr [2003]. These too are beyond thescope of this article. More broadly, there are many separate elements and de-cisions that must be considered in the design of a robust retrieval experiments[Tague-Sutcliffe 1992]; our focus here is on the rather narrower problem of pro-viding a score that represents retrieval effectiveness once a document rankinghas been obtained.
3. COMPOSITE MEASURES OF EFFECTIVENESS
To produce a statistic describing a retrieval system, many ways of combiningrecall and precision into a single number have been described. This sectionreviews some of those methods.
3.1 Average Precision
The measure of effectiveness most commonly used in experiments in recentyears has been average precision, AP. There has been little discussion of AP inthe literature; Buckley and Voorhees [2005] explained that AP, also known asnoninterpolated average precision, was introduced after the first year of TRECto address deficiencies in previous measures. Like its predecessors such as 11-point average precision, AP combines recall and precision to give a single-valuemeasure of a system.
Average precision is calculated by taking the set of ranks at which the rel-evant documents occur, calculating the precision at those depths in the rank-ing, and then averaging the set of precision values so obtained. For example,consider the ranking
$$---$----$-----$---,
ACM Transactions on Information Systems, Vol. 27, No. 1, Article 2, Publication date: December 2008.

Rank-Biased Precision for Measurement of Retrieval Effectiveness • 2:7
in which (reading left to right) there are five relevant documents, indicated bythe $ characters, interspersed among a further 15 nonrelevant documents. If itis assumed that there are a total of R = 5 documents that are relevant, thenAP at depth d = 20 is calculated as
15
×(
11
+ 22
+ 36
+ 411
+ 517
)= 0.6315.
If instead there were R = 6 relevant documents, the ranking would need tobe extended until that sixth document was located. If that was not possible—for example, because it was a TREC-style pooled experiment and the rank-ing had already been computed before the number of relevant documents wasknown—the standard assumption is that the missing relevant documents havecorresponding precision scores of zero. In this case the leading factor on thecomputation of AP would need to be 1/6, and the calculated value would be0.5263. If there were R = 7 relevant documents, the AP score would be 0.4511,and so on. The average precision across a series of queries can be averaged togive mean average precision (usually referred to as MAP).
Formally, if we have a ranked relevance vector to depth d
R = 〈ri | i = 1, 2, . . . , d 〉,where ri indicates the relevance of the ith ranked document scored as either 0(not relevant) or 1 (relevant), and if R is the number of relevant documents forthis query, then AP is computed as
AP = 1R
d∑i=1
(ri
i·
i∑j=1
r j
).
A consequence of this definition is that a system whose recall at the end of theranking (in TREC experiments, at depth d = 1000) is x can thus at best hopeto attain an AP of x. That is, recall bounds AP.
An alternative unnormalized formulation—useful if systems are to be com-pared on just a single query—is to remove the division by R, and simply sumthe set of precision values:
SP =d∑
i=1
(ri
i·
i∑j=1
r j
).
However, if more than one query is involved, this variation introduces seri-ous scaling problems—it makes little sense to compute a mean unnormalizedaverage precision when, taking two of the TREC-5 queries as a concrete ex-ample, there are (at least) 433 documents relevant to “volcanic and seismicactivity levels,” and (possibly only) seven relevant to “DNA information abouthuman ancestry.” In recent work, Webber et al. [2008] explored this point,and described a standardization approach that removes the bias caused byquery variation. Their “standardized SP” metric is identical to “standardizedAP,” but does not require knowledge of R, and has a range of other desirableproperties.
ACM Transactions on Information Systems, Vol. 27, No. 1, Article 2, Publication date: December 2008.

2:8 • A. Moffat and J. Zobel
Another tempting AP variant is to calculate the average over the relevantdocuments that are actually retrieved within the answer ranking through todepth d :
AP∗ = 1∑di=1 ri
d∑i=1
(ri
i·
i∑j=1
r j
).
But this leads to anomalous situations in which a ranking with an increasednumber of relevant documents can have a lower AP∗ score. For example, theranking
$---$----$-----$---
was used above and gives rise to an AP∗ of 0.6315. Now consider the ranking
$$---$----$-----$$$$,
in which eight documents are relevant. One would intuitively expect averageprecision to be greater, since certainly P@20 has increased. In fact, the alteredranking has an AP∗ of 0.5324, with the decrease caused by the inclusion of threeadditional terms, each of which is smaller than the previous average.
A related problem is that AP is unstable in the presence of uncertainty.Consider the ranking
$--$------??????????,
in which question marks represent unjudged documents, and there are R = 2relevant documents within the set of judged documents. Given these facts, AP iscomputed to be (1/2) · (1.0+0.5) = 0.75. However, if any one of the 10 unjudgeddocuments is in fact relevant, then the AP cannot be greater than 0.5909. Noris the movement consistent: on the ranking
-------$--??????????
discovery of further relevant documents among the unjudged ones can causeAP to increase rather than decrease. This is a serious concern—on addition ofmore information AP can take any value at all between the limiting values of 0and 1, irrespective of what mix of relevant and irrelevant documents appearsin any finite prefix of the ranking. There is thus a perceived risk that the scoresobtained in a retrieval experiment are a function as much of the resources spentcarrying out the evaluation and judgments as they are of the system itself, andthat “preliminary” results should be treated with caution.
The AP drift caused by unjudged documents is not merely an academic con-cern. Consider the data gathered by TREC in 1996 (TREC-5), a year in which61 systems contributed to the Ad Hoc Retrieval Track, and processed 50 queriesagainst 2 GB of newswire data.2 The depth used for forming the pool of judg-ments was 100, and based on those judgments it is straightforward to alsoinvestigate the alternative outcomes that would have been observed were thejudgments to be compiled over shallower pools. The performance of the 61 sys-tems is plotted in Figure 2, comparing the calculated mean AP scores with
2See trec.nist.gov for details.
ACM Transactions on Information Systems, Vol. 27, No. 1, Article 2, Publication date: December 2008.

Rank-Biased Precision for Measurement of Retrieval Effectiveness • 2:9
0.0 0.1 0.2 0.3 0.4
MAP (judgment pool depth 10)
0.0
0.1
0.2
0.3
0.4
MA
P (
judg
men
t poo
l dep
th 1
00)
Fig. 2. Mean average precision of 61 TREC-5 systems, using relevance judgments compiled usingtwo different pool depths. The dotted line is the identity relationship, with points below the lineshowing systems for which average precision decreased when additional documents were judged.The nonlinearity of the decrease shows that the ordering of systems is also affected.
pool depths of 10 and 100. Note how AP for an assessment pool of depth 10is almost always an overestimate for the “correct” AP when calculated usingan assessment pool of depth 100. Note also that the ordering of the systemschanges as the pool depth is increased. We can only conclude that, were thepools to be extended to depth (say) 1000, further decreases in mean AP wouldbe observed, and that there would be additional perturbations in the systemordering.
In addition to these relatively technical issues, average precision, like recall,is on uncertain foundations. Average precision can be said to represent an esti-mate of user satisfaction, but based on a complex abstraction that does not fitwell with our usual understanding of how users interact with a retrieval sys-tem. Consider the necessary scenario: the user issues a query, obtains a rankedlist of answers, and begins examining them. Every time a relevant document isencountered, the user pauses, asks “Over the documents I have seen so far, onaverage how satisfied am I?” and writes a number on a piece of paper. Finally,when the user has examined every document in the collection—because this isthe only way to be sure that all of the relevant ones have been seen—the usercomputes the average of the values they have written.
Buckley and Voorhees [2005, page 59] also criticized AP, on the groundsthat it “is an overall system evaluation measure, not an application measure,”and that “there is no single user application that directly motivates MAP.”We agree with this criticism, and posit that, in the absence of any task towhich the measurements correspond, abstract measurements of a system areless interesting than those that are predicated on a plausible model of userbehavior.
Average precision does have strengths. Perhaps the best evidence in its favoris its stability and robustness: AP-based differences between systems on one set
ACM Transactions on Information Systems, Vol. 27, No. 1, Article 2, Publication date: December 2008.

2:10 • A. Moffat and J. Zobel
of queries tend to be observed on other query sets, especially if the differencesare statistically significant [Voorhees 2002; Sanderson and Zobel 2005; Buckleyand Voorhees 2005].
3.2 Precision-at-Depth, R-Precision, and Reciprocal Rank
Several other measures are regularly employed by researchers. One of theseis precision-at-depth, or P@d . This measure is free of several of the failingsof AP, but it has the drawback of being insensitive to the rank positions of therelevant documents—the rankings “$$$$$-----” and “-----$$$$$” are identicalin terms of precision at depth 10, but the first is almost certainly a betterranking than the second. A second problem with P@d is that interpretationof precision also needs to be tempered to a certain extent by knowledge of R[Buckley and Voorhees 2005]. In particular, when the number R of relevantdocuments in the collection is less than d , the number of documents retrieved,precision is restricted to R/d < 1. That is, while precision can be calculatedat any depth d and knowledge of R is not required to do so, at depths d ≥ Rprecision is hobbled and cannot fully range over the interval 0.0 to 1.0. Becauseof this issue, P@10 tends to be a more reliable measurement than P@100, andP@1000 is of little interest.
The real issue is that, to compute P@d , a value of d must be selected, andbecause of the relationship between d and R it is hard to argue for any partic-ular value of d . One way fixing d is to use R-precision, sometimes known asmissed-at equivalence—the precision score at depth d = R. Scores are guar-anteed to be able to fully range from 0.0 to 1.0, but this metric again requiresthat R, the number of relevant documents, be known for each query. And, as isthe case for average precision, R-precision presents anomalies, such as that anincrease in both R and the number of documents returned may lead to a reduc-tion in measured effectiveness. In terms of user behavior, it seems implausibleto suppose that a user would choose in advance to inspect exactly R documentsfor a given query, even if they could somehow be aware of what R was for theirquery.
Finally, another common measure is the reciprocal rank (RR) of the firstrelevant document. Reciprocal rank has the singular advantage of being com-pletely independent of R, since only one relevant document needs to be located;other relevant documents are not considered at all. Reciprocal rank also hasan attractive user model—a person who is only interested in the first relevantanswer. But, because of the fact that the score for the first position is doublethat of the score for the second position, RR is not particularly stable whensystems are being compared via an average, because good performance on asingle query can compensate for poor performance on many others.
There are many variants of these simple measures, such as interpolated av-erage precision, and 11-point and 3-point average precision. All of these metricstend to correlate with each other, average precision and R-precision particularlyso [Buckley and Voorhees 2005]. Nevertheless, we conclude that the standardmethods for comparing document rankings have shortcomings that make themeither difficult to interpret, or deficient in some other way. One simple problem
ACM Transactions on Information Systems, Vol. 27, No. 1, Article 2, Publication date: December 2008.

Rank-Biased Precision for Measurement of Retrieval Effectiveness • 2:11
is that these composite methods tend to be undefined if there are no relevantdocuments in the ranking. In the absence of any answers, effectiveness caneasily be defined to be zero; nevertheless, it is irksome that an exception isrequired.
3.3 Other Measures of Effectiveness
In the three decades prior to the commencement of TREC in 1992, a varietyof system evaluation measures had been in use. The TREC project not onlyintroduced standardized large-scale test collections, but also standardized eval-uation of retrieval systems, embodied in the TREC EVAL evaluation software.3
In particular, the pre-1990 literature contains descriptions of several mea-sures that since then have been largely neglected, or have been superseded bythe measures in TREC EVAL. Some of these were examined by van Rijsbergen[1979, Chapter 7], who noted that they are for the most part ad hoc in natureand “cannot be justified in any rational way” (p. 119). van Rijsbergen [1979]examined in detail several methods with a mathematical foundation, includ-ing measures and observations due to Swets, Brookes, Robertson, Teather, andCooper, and the measures incorporated into the SMART retrieval system. All ofthese measures yield statistics that balance precision and recall.
A motivation in design of some of these measures is to explicitly weight for“the relative importance a user attaches to precision and recall” Shaw, Jr. [1986,346], leading to measures based on combinations such as
11/p + 1/r − 1
,
where p and r are point measures of precision and recall at some depth d in theranking [Shaw, Jr. 1986; Losee 2000]. We do not survey this early literature, butnote that the importance of recall appears to be a near-universal assumption. Interms of practical experimentation, Keen [1992] described experience gleanedfrom work with the Cranfield test collection; and Cooper [1968] and Raghavanet al. [1989] defined a quantity they called the expected search length, beingthe expected number of documents retrieved before i relevant ones have beendetermined, including proper handling of cases in which there are ties in theranking.
There have also been recent proposals that are of relevance to our work. Oneis the binary preference measure (BPref) proposed by Buckley and Voorhees[2004]. In this approach, the binary vector R of relevance values is modified togive a condensed vector R′ of length d ′ by removing the documents for whichthere are no relevance judgments, and then computing
BPref-k = 1R
·d ′∑
i=1
{r ′
i ·(
1 − min(R + k, i − ∑i
j=1 r ′j
)min(R + k, N )
)},
where N is the number of documents known to be nonrelevant, and k is a tuningconstant designed to avoid volatility when R is small. Buckley and Voorhees
3Available from trec.nist.gov.
ACM Transactions on Information Systems, Vol. 27, No. 1, Article 2, Publication date: December 2008.

2:12 • A. Moffat and J. Zobel
[2004] showed that BPref is consistent with average precision when the judg-ments are complete, and has better behavior when the judgments are partial.However, it also shares some of the undesirable aspects of AP, including relianceon a knowledge of the number of relevant documents; a tendency to prefer aquery with one answer over a query with many (that is, per-query scores areincomparable); lack of an obvious user model; and the fact that the calculatedscore can move upward or downward as more documents are judged. Sakai[2007] considered several further issues in connection with BPref.
Sakai [2004] proposed a Q-measure, first used at NTCIR in 2004, which forbinary relevance can be expressed as
Q-measure = 1R
·d∑
i=1
{ri ·
(2
∑ij=1 r j
i + min(i, R)
)}.
This measure does not appear to have any advantages compared to AP or BPref.Another recent proposal is the discounted cumulative gain (DCG) method of
Jarvelin and Kekalainen [2002]. Discounted cumulative gain is monotonic inthe number of relevant documents found, meaning that the score for a rankingwhich is a proper prefix of another serves as a lower bound on the score assignedto the longer ranking. However, DCG suffers from the problem of having noupper limit on the scores that can be assigned.
In a similar vein, Meng and Chen [2004] explored a metric they calledRankPower, which also factors rank position into a precision-based score, butdoes so in a manner that is at odds with other metrics, in that strongly usefulrankings generate low scores. There are a number of other anomalies with thismetric that put it at odds with both DCG and RBP, including its treatment ofrankings in which there are no relevant documents at all.
With a sufficient number of queries, binary relevance provides an accuratemethod of distinguishing between systems [Voorhees 2002]; but this does notmean that all relevant documents are in fact equal. There are many articlesexploring graded relevance, which was used as early as the 1967 Cranfield-2experiments [Voorhees 2002] and continues to be investigated; see, for exam-ple, the approaches of Borlund and Ingwersen [1998], Jarvelin and Kekalainen[2002], Della Mea and Mizzaro [2004], and [Kekalainen 2005]. Our new mech-anism can easily be applied to nonbinary judgments.
Finally in this section, note that all of the approaches to measurement dis-cussed here relate to what Saracevic [1995] called batch mode evaluation, anabstraction that does not capture the richness of the ways in which usersinteract with practical search systems. However, the underlying similarity-measuring components of even complex systems are clearly worth measuringof themselves, and it is that measurement with which we are concerned in thisarticle.
4. RANK-BIASED PRECISION
We now introduce the new metric for scoring rankings; describe some itsproperties, and compare it to the discounted cumulative gain mechanism ofJarvelin and Kekalainen [2002]. To motivate the discussion, Table I shows the
ACM Transactions on Information Systems, Vol. 27, No. 1, Article 2, Publication date: December 2008.

Rank-Biased Precision for Measurement of Retrieval Effectiveness • 2:13
Table I.Contribution made by each of five relevant documents towardthe final AP for the ranking “$$---$----$-----$---”. The AP of0.6316 is the sum of the component contributions shown in the secondto last row. The last row shows the component contributions expressedas a percentage. For example, the first document in the rankingcontributes 0.3633/0.6316 = 58% of the final AP.
Precision Relevant documents
1 2 6 11 17d = 1 1/1d = 2 1/2 1/2d = 6 1/6 1/6 1/6d = 11 1/11 1/11 1/11 1/11d = 17 1/17 1/17 1/17 1/17 1/17Total 1.8164 0.8164 0.3164 0.1497 0.0588×1/5 0.3633 0.1633 0.0633 0.0299 0.0118% 58 26 10 5 2
computation of average precision for the same ranking as was used as an ex-ample earlier, but with the final AP score attributed individually to the fiverelevant documents. For example, document number one contributes to all fiveof the precision scores that are averaged, and in doing so generates 0.3633 ofthe final AP of 0.6316. More than half of the final score is contributed by thefirst document in the ranking. Buckley and Voorhees [2005] noted the sameissue of items dominating the scoring, and comment that this aspect of AP hasbeen criticized by statisticians. Observing that each document in the rankingcan be assigned a weight is one of the starting points of our proposed metric;the other is a model of user behavior.
4.1 Patient and Impatient Users
Consider the user of some retrieval system, sitting at a computer and issuingqueries. Each query results in a ranked list of pretty much arbitrary lengthbeing returned to them. In our model of user behavior, we assume that a useralways starts by examining the top-ranked document, then the second-ranked,then the third-ranked, and so on, until they stop looking. We further assumethat, as the user looks at suggested answers, they are willing to pay $1 for eachrelevant answer provided by the system, but nothing for irrelevant answers.The $1 can be thought of as income to the search provider, in exchange for utilitygained by the searcher. As the user progress down the ranked list, they are thusrunning up an account with the search provider, or, equivalently, increasingtheir total utility.
The user has no desire to examine every answer. Instead, our suggestionis that they progress from one document in the ranked list to the next withpersistence (or probability) p, and, conversely, end their examination of theranking at that point with probability 1 − p. We assume that each terminationdecision is made independently of the current depth reached in the ranking,independently of previous decisions, and independently of whether or not thedocument just examined was relevant or not. (The implications of relaxing these
ACM Transactions on Information Systems, Vol. 27, No. 1, Article 2, Publication date: December 2008.
2:14 • A. Moffat and J. Zobel
View first itemin ranked list
View next itemin ranked list
Finish searching,pay search cost
p
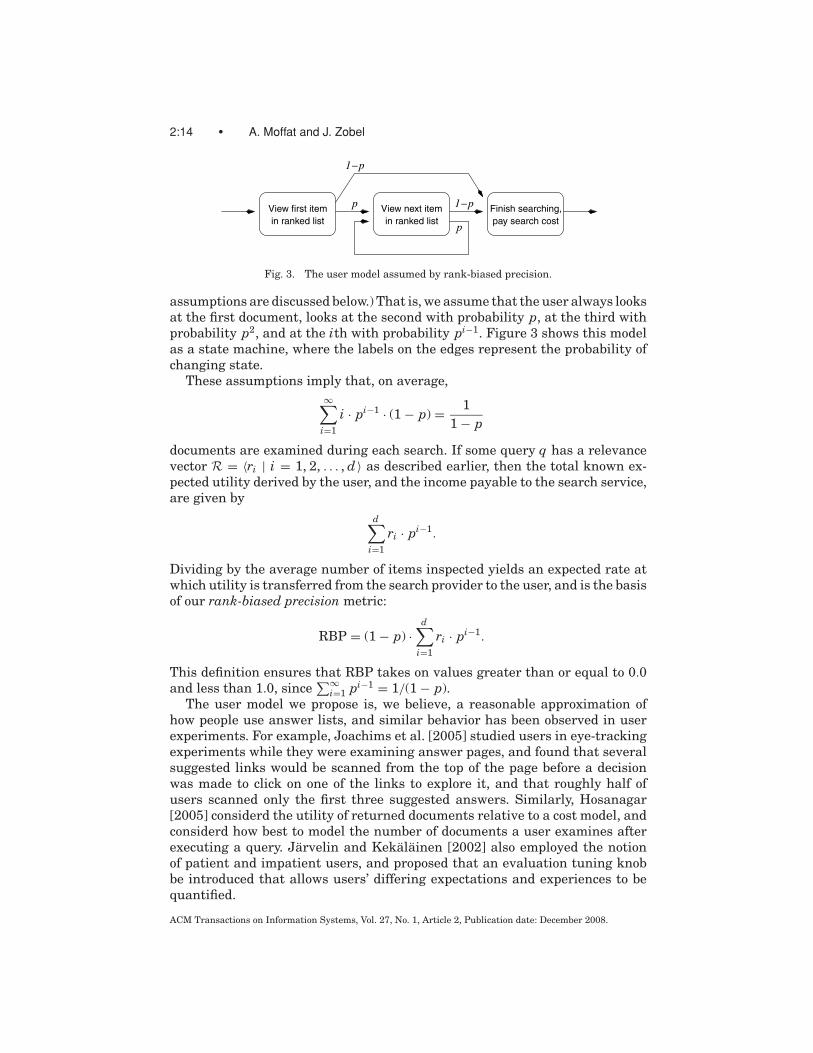
Fig. 3. The user model assumed by rank-biased precision.
assumptions are discussed below.) That is, we assume that the user always looksat the first document, looks at the second with probability p, at the third withprobability p2, and at the ith with probability pi−1. Figure 3 shows this modelas a state machine, where the labels on the edges represent the probability ofchanging state.
These assumptions imply that, on average,∞∑
i=1
i · pi−1 · (1 − p) = 11 − p
documents are examined during each search. If some query q has a relevancevector R = 〈ri | i = 1, 2, . . . , d 〉 as described earlier, then the total known ex-pected utility derived by the user, and the income payable to the search service,are given by
d∑i=1
ri · pi−1.
Dividing by the average number of items inspected yields an expected rate atwhich utility is transferred from the search provider to the user, and is the basisof our rank-biased precision metric:
RBP = (1 − p) ·d∑
i=1
ri · pi−1.
This definition ensures that RBP takes on values greater than or equal to 0.0and less than 1.0, since
∑∞i=1 pi−1 = 1/(1 − p).
The user model we propose is, we believe, a reasonable approximation ofhow people use answer lists, and similar behavior has been observed in userexperiments. For example, Joachims et al. [2005] studied users in eye-trackingexperiments while they were examining answer pages, and found that severalsuggested links would be scanned from the top of the page before a decisionwas made to click on one of the links to explore it, and that roughly half ofusers scanned only the first three suggested answers. Similarly, Hosanagar[2005] considerd the utility of returned documents relative to a cost model, andconsiderd how best to model the number of documents a user examines afterexecuting a query. Jarvelin and Kekalainen [2002] also employed the notionof patient and impatient users, and proposed that an evaluation tuning knobbe introduced that allows users’ differing expectations and experiences to bequantified.
ACM Transactions on Information Systems, Vol. 27, No. 1, Article 2, Publication date: December 2008.
Rank-Biased Precision for Measurement of Retrieval Effectiveness • 2:15
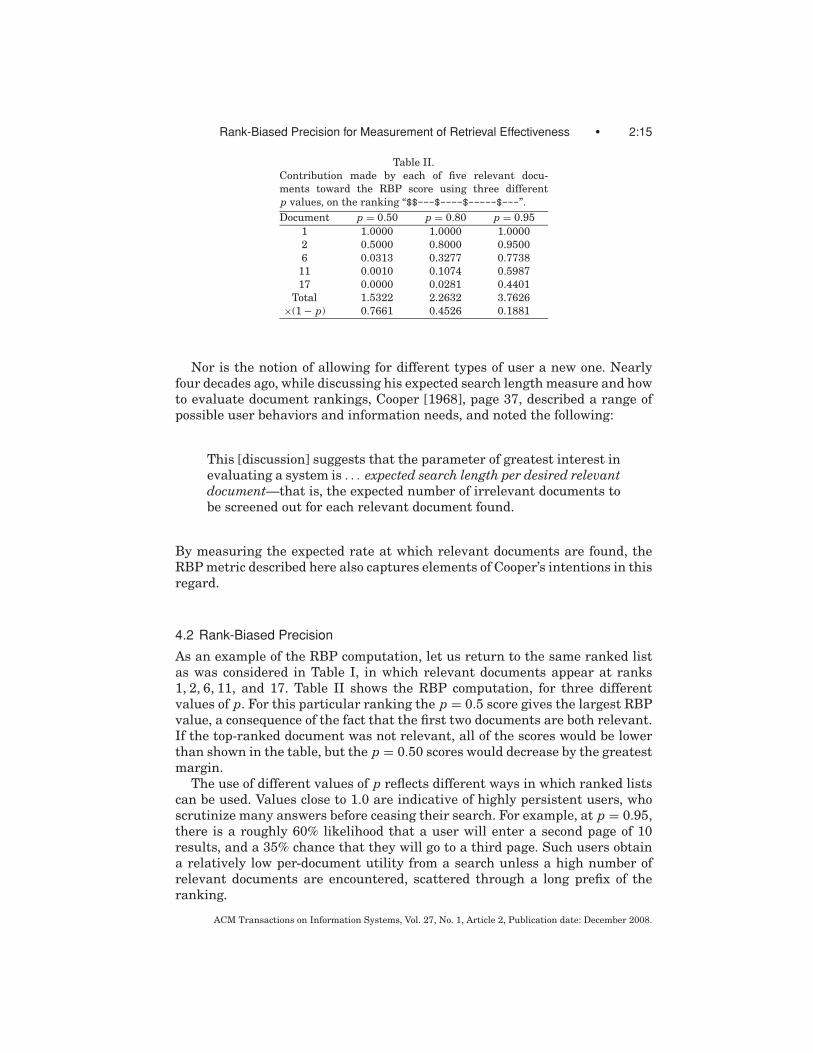
Table II.Contribution made by each of five relevant docu-ments toward the RBP score using three differentp values, on the ranking “$$---$----$-----$---”.Document p = 0.50 p = 0.80 p = 0.95
1 1.0000 1.0000 1.00002 0.5000 0.8000 0.95006 0.0313 0.3277 0.773811 0.0010 0.1074 0.598717 0.0000 0.0281 0.4401
Total 1.5322 2.2632 3.7626×(1 − p) 0.7661 0.4526 0.1881
Nor is the notion of allowing for different types of user a new one. Nearlyfour decades ago, while discussing his expected search length measure and howto evaluate document rankings, Cooper [1968], page 37, described a range ofpossible user behaviors and information needs, and noted the following:
This [discussion] suggests that the parameter of greatest interest inevaluating a system is . . . expected search length per desired relevantdocument—that is, the expected number of irrelevant documents tobe screened out for each relevant document found.
By measuring the expected rate at which relevant documents are found, theRBP metric described here also captures elements of Cooper’s intentions in thisregard.
4.2 Rank-Biased Precision
As an example of the RBP computation, let us return to the same ranked listas was considered in Table I, in which relevant documents appear at ranks1, 2, 6, 11, and 17. Table II shows the RBP computation, for three differentvalues of p. For this particular ranking the p = 0.5 score gives the largest RBPvalue, a consequence of the fact that the first two documents are both relevant.If the top-ranked document was not relevant, all of the scores would be lowerthan shown in the table, but the p = 0.50 scores would decrease by the greatestmargin.
The use of different values of p reflects different ways in which ranked listscan be used. Values close to 1.0 are indicative of highly persistent users, whoscrutinize many answers before ceasing their search. For example, at p = 0.95,there is a roughly 60% likelihood that a user will enter a second page of 10results, and a 35% chance that they will go to a third page. Such users obtaina relatively low per-document utility from a search unless a high number ofrelevant documents are encountered, scattered through a long prefix of theranking.
ACM Transactions on Information Systems, Vol. 27, No. 1, Article 2, Publication date: December 2008.

2:16 • A. Moffat and J. Zobel
0.0 0.1 0.2 0.3 0.4 0.5 0.6
RBP (judgment pool depth 10)
0.0
0.1
0.2
0.3
0.4
0.5
0.6
RB
P (
judg
men
t poo
l dep
th 1
00)
p=0.50p=0.80p=0.95
Fig. 4. Rank-biased precision of 61 TREC-5 systems, for three different values of p, using relevancejudgments compiled using two different pool depths. Rank-biased precision at p = 0.5 and p = 0.8is stable when the pool depth is increased from 10 documents per system to 100 documents. Atp = 0.95 the RBP scores increase (and never decrease) when the pool depth is increased.
Compare the behavior of a persistent user to the one-in-a-thousand chance ofa p = 0.5 user entering even the second page of 10 results. Users in the p = 0.5category are highly impatient, but obtain high average per-document utility(that is, high RBP) whenever there is a relevant document in the first one ortwo rank positions. In the limit, use of p = 0.0 implies a user who is “feelinglucky” and is either satisfied or dissatisfied with the top-ranked document, andnever looks any further. This latter mode corresponds exactly to evaluating thesystem using P@1.
Figure 4 shows the effect of calculating average RBP scores over the 61systems that participated in TREC-5 in 1996, calculated using two different pooldepths for the relevance assessments. Three different values of the parameterp were used, covering a range from relatively impatient users (p = 0.5) throughto relatively patient users (p = 0.95). When p = 0.5 and p = 0.8, the systemaverage scores calculated based on judgments extracted from a pool depth of10 documents per run are almost identical to the scores generated when a pooldepth of 100 is used. When p = 0.95, a pool depth of 10 is insufficient to giveaccurate RBP scores, and the correlation is weaker. Note, however, that addingfurther relevance judgments into the computation increases the system score,rather than decreasing it. That is, unlike the situation with AP that is depictedin Figure 2, system scores using rank-biased precision can always be regardedas lower bounds on the score that would be obtained were perfect relevanceinformation to be available.
It was noted above that the interpretation of precision scores needs to betempered by knowledge of R, the number of relevant documents. The same isalso true of RBP, since a persistent user (with say p = 0.95) is guaranteed toobtain a low expected utility from a search with only a few relevant documents.
ACM Transactions on Information Systems, Vol. 27, No. 1, Article 2, Publication date: December 2008.
Rank-Biased Precision for Measurement of Retrieval Effectiveness • 2:17
For example, when there are only five relevant documents and p = 0.95, it mustbe that RBP < 0.23. However, we resist the temptation to normalize the scoresbased on the maximum attainable score for each query, since to do so woulddefeat the purpose of introducing RBP. Instead, we observe that, however lowthe RBP score is for a particular query and p value, it still reflects the averagerate at which utility is gained by that particular user. Impatient users will alsoobtain low RBP scores if none of the top few documents are relevant.
4.3 User Models
A key part of the RBP proposal is the user model, and the notion of scoring aranking according to the average utility gained by the person using the rank-ing. Other user models also give rise to possible scoring regimes. For example,consider a simple user model in which documents are examined starting withthe first, until a relevant one is found. The total utility gained from a ranking bysuch a user will always be $1, and they will have examined documents until thefirst relevant one. The average utility per document examined is thus exactlythe score assigned by the reciprocal rank (RR) metric. That is, RR can also bethought of as a scoring regime with a tractable user model.
An obvious extension is then to consider other models. For example, a scep-tical user might not stop when they see the first relevant document in theranking, and instead continue until they have seen corroboration from a sec-ond relevant one. Such a user can score rankings by a RR2 metric, in whichthe reciprocal rank of the second relevant document is what matters. Anothervariation on RR is to use a “damping” factor, computing 1/(k + mini{ri = 1})instead of 1/(mini{ri = 1}), where k is a constant. This metric corresponds to acautious user, who stops examining documents only after they have looked atk past the first relevant one.
A further variant is to relax the assumption that p, the probability that theuser advances to the next document in the ranking, is independent of whetheror not the document just considered is relevant. An arrangement in which theconditional probability of advancing given a relevant document is p1, and theconditional probability of advancing given an irrelevant document is p2, wouldstill allow the average utility per document inspected to be calculated, andwould lead to another mechanism for scoring runs and thus comparing retrievalsystems.
4.4 Bounding the Residual Error
A useful consequence of the proposed RBP metric is that it is possible to computeupper and lower bounds on effectiveness, even when the ranking and relevancejudgments are partial rather than comprehensive. For example, consider theTREC environment, in which the top (say) 100 documents from multiple runsfor each query are combined into a single pool and then judged, but systemsare compared on the basis of 1000 answers for each query. By construction, allof the top 100 documents in each run of 1000 have been judged, and perhapsothers beyond the top 100 too, because of the pooling. But the great majority ofdocuments further down the rankings will be unjudged.
ACM Transactions on Information Systems, Vol. 27, No. 1, Article 2, Publication date: December 2008.

2:18 • A. Moffat and J. Zobel
As noted earlier, the convention in TREC evaluation is that any unjudgeddocuments are taken to be not relevant, and that only “lower bounds” on effec-tiveness should be computed. With this assumption, quoted effectiveness ratesmight be expected to be pessimistic, meaning that with a greater volume ofjudgments, measured effectiveness should increase. But Figure 2 clearly showsthat, when average precision is used as the effectiveness metric, the defaultassumptions do not lead to a lower bound being calculated. That is, assumingthat unjudged documents are irrelevant is not necessarily pessimistic in thecontext of AP.
In the RBP measure it is straightforward to accumulate an uncertainty value,or residual, that captures the unknown component of the effectiveness metric.The simplest case is when the ranking is calculated to a depth of d answers perquery, and the contributions from depth d + 1 on are not available. Then theuncertainty in the RBP score is given by
(1 − p) ·∑
i=d+1
pi−1 = (1 − p) · pd ·∑i=1
pi−1 = pd.
When the judgments are nonexhaustive, missing items should be added tothe residual on an item-by-item basis, using the weight they would have had ifthey were relevant. For example, consider the ranking “$$---$----$-??--?---,”where a “?” represents a missing judgment. The documents ranked in positions13, 14, and 17 are unjudged, so the properties of the geometric distributionmean that the uncertainty is given by p20 + (1− p)(p12 + p13 + p16). For p = 0.5,the RBP is bounded by 0.7661 and 0.7663; for p = 0.8, the RBP is bounded by0.447 and 0.489; for p = 0.95, the RBP is bounded by 0.17 and 0.60. Each ofthese ranges encompasses the values given in Table II.
The residual calculation can be done in advance of any experimentation.For example, with p = 0.8 and a pooling depth of d = 20, the residual fromall remaining terms in the geometric series is 0.820 = 0.012, which impliesthat calculated RBP figures should be quoted to at most two decimal places.Conversely, when four decimal digits of accuracy are required, the residualshould be less than 0.0001, and the required depth to attain this is a functionof the value of p being used:
pd < 0.0001 ⇒ d >ln 0.0001
ln p≈ 9.21
1 − p.
When p = 0.5, p = 0.8, and p = 0.95, this expression suggests minimumevaluation depths of d = 14, d = 42, and d = 180, respectively. Another wayof looking at this analysis is that, in a TREC-style pooled evaluation, a depthof d = 100 of guaranteed exhaustive judgments is sufficient to support fourdigits of accuracy in the computation of RBP only when p ≤ 0.91. Use of largervalues of p will require a greater pool depth if four digits of accuracy are to bepresented.
The behavior of the lower and upper bounds on RBP for one TREC-5 run forthree different values of p and two different judgment pool depths is illustratedin Figure 5. Within each of the two graphs in the figure, increasing the amount ofinformation taken into account by increasing the depth d of the ranking allows
ACM Transactions on Information Systems, Vol. 27, No. 1, Article 2, Publication date: December 2008.

Rank-Biased Precision for Measurement of Retrieval Effectiveness • 2:19
1 10 100
Depth of ranking
0.0
0.2
0.4
0.6
0.8
1.0
Ave
rage
RB
P
p=0.5p=0.8p=0.95
1 10 100
Depth of ranking
0.0
0.2
0.4
0.6
0.8
1.0
Ave
rage
RB
P
p=0.5 p=0.8 p=0.95
001htpedlooP)b(Pool depth 10(a)
Fig. 5. Upper and lower bounds for RBP as p is varied and increasing numbers of documents areconsidered in the ranking for one of the submitted TREC-5 runs, for (a) a pool depth of 10; and (b) apool depth of 100. Note how the upper and lower bounds stabilize as the depth d of the evaluationis increased, but, for larger values of p, do not converge if the pool depth on which the relevancejudgments are based is too small.
increased accuracy in the estimated effectiveness values. Comparing the left-hand and right-hand graphs in Figure 5 shows that increasing the depth of thepool of relevance judgments allows convergence toward accurate scores, with(in the right-hand graph) the upper bound closing on the lower bound evenwhen p = 0.95. The balance between p, the accuracy of the score, and thecost of relevance evaluations, is something that can be designed into retrievalexperiments in a manner that is simply not possible with AP.
4.5 Choosing a Value for p
An obvious question is that of choosing a value for p. Ideally that choice wouldbe made during the design phase of any experiment, as an estimate of thetype of user characteristic being tested in the experiment, and as a parameterthat helps determine how much the experiment will cost if it is to yield dataof a specified accuracy. Alternatively, the choice of p can be made after theexperiment has been carried out, in which case the accuracy of the resultingscores can be computed. A third option, for systems claimed to be “broad spec-trum” and suitable for all types of users, would be to design the experimentusing a high value of p, and then report RBP results for several different valueof p.
Small values of p, less than around 0.5, place the bulk of their emphasison the first few positions in the ranking, and provide less balance across thewhole of a ranked list. However, this bias means that small values of p alsoallow cheaper evaluation, because fewer documents need to be judged to obtaina given level of accuracy in the scoring. As p gets larger, the emphasis on earlyrank positions is reduced, and an increasing fraction of the total weighting isavailable to later rank positions, modeling users who are more persistent, and
ACM Transactions on Information Systems, Vol. 27, No. 1, Article 2, Publication date: December 2008.

2:20 • A. Moffat and J. Zobel
0.0 0.2 0.4 0.6 0.8 1.0
Parameter p
0.0
0.2
0.4
0.6
0.8
Ave
rage
RB
P
System A
System B
Upper bound, pool depth 10Upper and lower bound, pool depth 100Lower bound, pool depth 10
Fig. 6. Rank-biased precision scores for two of the TREC-5 runs, averaged across 50 queries. Upperand lower bounds for RBP at pool depth 10 are plotted as a function of p, together with the RBPvalue computed for that value of p when the pool depth is 100. When p is large, the error tolerancebetween the upper and the lower bounds is large for depth 10 evaluations. Increasing the pooldepth to 100 gives convergence even at high values of p. The line denoted System A is the samesystem as illustrated in Figure 5.
likely to look at (in the Web search environment) the second or third page of Webresults. The weightings are still monotonic, and, even with p = 0.95, the docu-ment in rank position 100 gets a weighting of just 0.6% of the document in rankposition 1. But increasing p toward 1 also implies that an increasing amountof effort must be spent on relevance judgments, as otherwise the accumulatedimprecision is too large.
Figure 6 shows this balance for two TREC-5 runs, with RBP averaged overthe set of 50 applicable queries. As was also done for Figures 2, 4, and 5, therelevance judgments at a pool depth of 100 performed for TREC-5 were usedto extract the set of relevance judgments that would have been formed if thepool depth was only 10. Three lines are plotted in the graph for each of thetwo systems: the upper and lower bounds on RBP with a pool depth of 10, andthe (indistinguishable at the scale of the graph) upper and lower bounds onRBP when the pool depth is increased to 100. The pattern of the three curvesshows typical behavior: with an assessment pool depth of only 10, values of pgreater than around 0.7 lead to noticeable imprecision in the scores; but whenthe assessment pool depth is increased to 100, values of p as large as 0.95 canbe handled with only small residual errors.
In summary, if reliable experiments with large p are required, the pool depthused to form the relevance judgments must be high. On the other hand, reliablescores can be generated using relatively shallow assessment pool depths whenp ≤ 0.8. Searching processes that are intended to be “high recall” should thusbe assessed with a relatively high value for p, whereas Web-user search taskscan be assessed using a smaller value of p, and cheaper experiments.
ACM Transactions on Information Systems, Vol. 27, No. 1, Article 2, Publication date: December 2008.

Rank-Biased Precision for Measurement of Retrieval Effectiveness • 2:21
4.6 Discounted Cumulative Gain
In work first presented at SIGIR in 2000, Jarvelin and Kekalainen [2002] de-scribed a metric they called discounted cumulative gain (DCG) that shares someof the features of RBP. For a relevance vector R of length d , DCG is defined as
DCG-b =b∑
i=1
ri +d∑
i=b+1
ri
logb i,
where b is a persistence parameter akin to our p parameter, and relevancecontributions are weighted more highly earlier in the ranking than they arein the later rank positions. Jarvelin and Kekalainen [2002] suggested the useof b = 2, and employed that value in their examples and experiments. Theintention of DCG is that high-ranking relevant documents give more satisfac-tion than do low-ranking ones, the same notion as is built into RBP. However,where RBP discounts relevance via a geometric sequence, DCG does so using alog-harmonic one.
The change in discounting regime we propose in RBP is a critical one. Con-sider what happens with a relevance vector R = 〈1, 1, 1, . . . , 1〉, representing aranking in which every retrieved item is relevant. With RBP, a score of close to1.0 will be assigned, regardless of p, and regardless of the ranking depth, withthe discrepancy between the actual score and 1.0 completely accounted for bythe residual uncertainty. On the other hand, with DCG the maximum scoregrows without limit as the answer ranking is deepened. To limit the valueof DCG to 1.0 for a given ranking depth, a scaling factor would be required,and would depend on d . For example, a scaled DCG score calculated for aranking depth of d = 100 (for which the scaling constant would need to be21.79 when b = 2) might decrease by a factor of almost 5 if the ranking depthd was increased to 1000 (for which the corresponding scaling constant wouldbe 123.99).
Jarvelin and Kekalainen [2002] recognized the need for a normalized formof DCG, and took a different approach to the scaling problem. Rather than com-pute the normalization constant based on an “all relevant” ranking as hypoth-esized in the previous paragraph, they suggested that it should be computedrelative to the DCG score of a “perfect” ranking at that depth, where a perfectranking lists all (known) relevant documents first, followed by all nonrelevantdocuments. From our point of view, this approach is unsatisfactory, since, tocalculate a normalized discounted cumulative gain (NDCG) score in this way,all relevant documents (and thus the value of R) must be identified. That is,NDCG has the same issues as AP and P@R. A similar assumption weakens theQ-measure of Sakai [2004], which was also proposed in both unnormalized andnormalized forms.
4.7 Other Extensions
A further part of the rationale for DCG and NDCG (see also Sakai [2004] andKekalainen [2005]) is to provide for nonbinary relevance judgments, wheredocuments are considered to be relevant to varying degrees, and the vector
ACM Transactions on Information Systems, Vol. 27, No. 1, Article 2, Publication date: December 2008.
2:22 • A. Moffat and J. Zobel
R is constructed over a richer domain. In the experiments of Jarvelin andKekalainen [2002], ri ∈ {0, 1, 2, 3}, and the relevance judgments were four-way.
The same flexibility is readily accommodated in our framework, by scalingthe ri values to the unit range, and working with ri ∈ {0.00, 0.33, 0.67, 1.00} (orany other desired subset of the real numbers 0 ≤ ri ≤ 1). Rank-biased precisioncan then be used unchanged, with the RBP score reflecting the average per-answer rate at which the user gains utility from the ranking, assuming that afractional relevance score reflects the fractional utility gained by the user whenthat document is presented to them.
Also worth noting is that the definition of RBP is readily modified to handledocument rankings containing ties. For example, if the j documents in positionsk to k+ j −1 of the ranking are all deemed to be tied, then the score contributionof each is given by (
∑k+ j−1i=k pi−1)/j , so that the total score weight attached to
the group of documents is shared equally between them. Cooper [1968] andRaghavan et al. [1989] considered a similar solution in connection with theexpected search length metric.
5. RBP VERSUS AP IN RETRIEVAL EXPERIMENTS
Rank-biased precision addresses many of the concerns that have been raisedin connection with average precision. However, AP is widely regarded as a re-liable way of comparing system retrieval performance, and has accumulatedmore than a decade of experimental confidence. It is thus natural to turn to ex-periment, to compare the usefulness of rank-biased precision and other metrics.We do this in two ways.
The first of these experiments makes direct use of the TREC evaluationmethodology, which has as one of its objectives a desire to order retrievalsystems, so that lessons can be inferred concerning techniques that work welland other techniques that do not. The question we ask is this: how different isthe system ordering generated by RBP compared to the system orderings thatresult when other effectiveness metrics are used? Table III shows the results.
To build Table III, system orderings were generated using the submittedTREC-5 runs for each of a range of effectiveness metric computations and rel-evance assessment pool depths. Each system ordering contained 61 systemrun names, based on numeric average effectiveness scores, without regard towhether or not the ordering of adjacent items could be defended via a signifi-cance test. That is, each overall average system score was taken at face value,and used to assign that system a rank in a “performance league table.”
The different system orderings were then pairwise compared using Kendall’sτ , which calculates a numeric similarity score for a pair of ordered lists overa common domain. A subset of those results appears in Table III. A score of1.0 indicates that the two lists of system names are in exactly the same order,while a score of −1.0 would indicate that one list is the reverse of the other.Four reference orderings, all calculated using an assessment pool depth of 100,are shown as the columns.
The preponderance of numbers greater than 0.8 in Table III shows that allof the listed effectiveness metrics are generating similar system orderings, and
ACM Transactions on Information Systems, Vol. 27, No. 1, Article 2, Publication date: December 2008.
Rank-Biased Precision for Measurement of Retrieval Effectiveness • 2:23
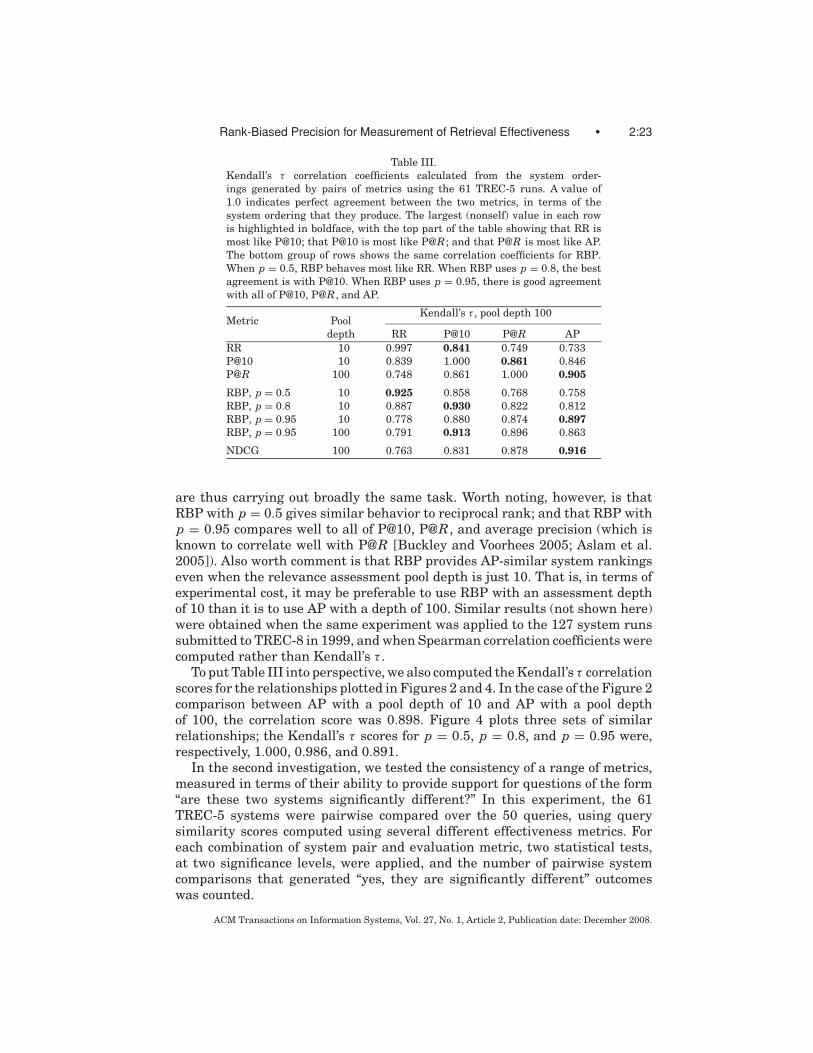
Table III.Kendall’s τ correlation coefficients calculated from the system order-ings generated by pairs of metrics using the 61 TREC-5 runs. A value of1.0 indicates perfect agreement between the two metrics, in terms of thesystem ordering that they produce. The largest (nonself) value in each rowis highlighted in boldface, with the top part of the table showing that RR ismost like P@10; that P@10 is most like P@R; and that P@R is most like AP.The bottom group of rows shows the same correlation coefficients for RBP.When p = 0.5, RBP behaves most like RR. When RBP uses p = 0.8, the bestagreement is with P@10. When RBP uses p = 0.95, there is good agreementwith all of P@10, P@R, and AP.
Kendall’s τ , pool depth 100Metric Pool
depth RR P@10 P@R APRR 10 0.997 0.841 0.749 0.733P@10 10 0.839 1.000 0.861 0.846P@R 100 0.748 0.861 1.000 0.905
RBP, p = 0.5 10 0.925 0.858 0.768 0.758RBP, p = 0.8 10 0.887 0.930 0.822 0.812RBP, p = 0.95 10 0.778 0.880 0.874 0.897RBP, p = 0.95 100 0.791 0.913 0.896 0.863
NDCG 100 0.763 0.831 0.878 0.916
are thus carrying out broadly the same task. Worth noting, however, is thatRBP with p = 0.5 gives similar behavior to reciprocal rank; and that RBP withp = 0.95 compares well to all of P@10, P@R, and average precision (which isknown to correlate well with P@R [Buckley and Voorhees 2005; Aslam et al.2005]). Also worth comment is that RBP provides AP-similar system rankingseven when the relevance assessment pool depth is just 10. That is, in terms ofexperimental cost, it may be preferable to use RBP with an assessment depthof 10 than it is to use AP with a depth of 100. Similar results (not shown here)were obtained when the same experiment was applied to the 127 system runssubmitted to TREC-8 in 1999, and when Spearman correlation coefficients werecomputed rather than Kendall’s τ .
To put Table III into perspective, we also computed the Kendall’s τ correlationscores for the relationships plotted in Figures 2 and 4. In the case of the Figure 2comparison between AP with a pool depth of 10 and AP with a pool depthof 100, the correlation score was 0.898. Figure 4 plots three sets of similarrelationships; the Kendall’s τ scores for p = 0.5, p = 0.8, and p = 0.95 were,respectively, 1.000, 0.986, and 0.891.
In the second investigation, we tested the consistency of a range of metrics,measured in terms of their ability to provide support for questions of the form“are these two systems significantly different?” In this experiment, the 61TREC-5 systems were pairwise compared over the 50 queries, using querysimilarity scores computed using several different effectiveness metrics. Foreach combination of system pair and evaluation metric, two statistical tests,at two significance levels, were applied, and the number of pairwise systemcomparisons that generated “yes, they are significantly different” outcomeswas counted.
ACM Transactions on Information Systems, Vol. 27, No. 1, Article 2, Publication date: December 2008.
2:24 • A. Moffat and J. Zobel
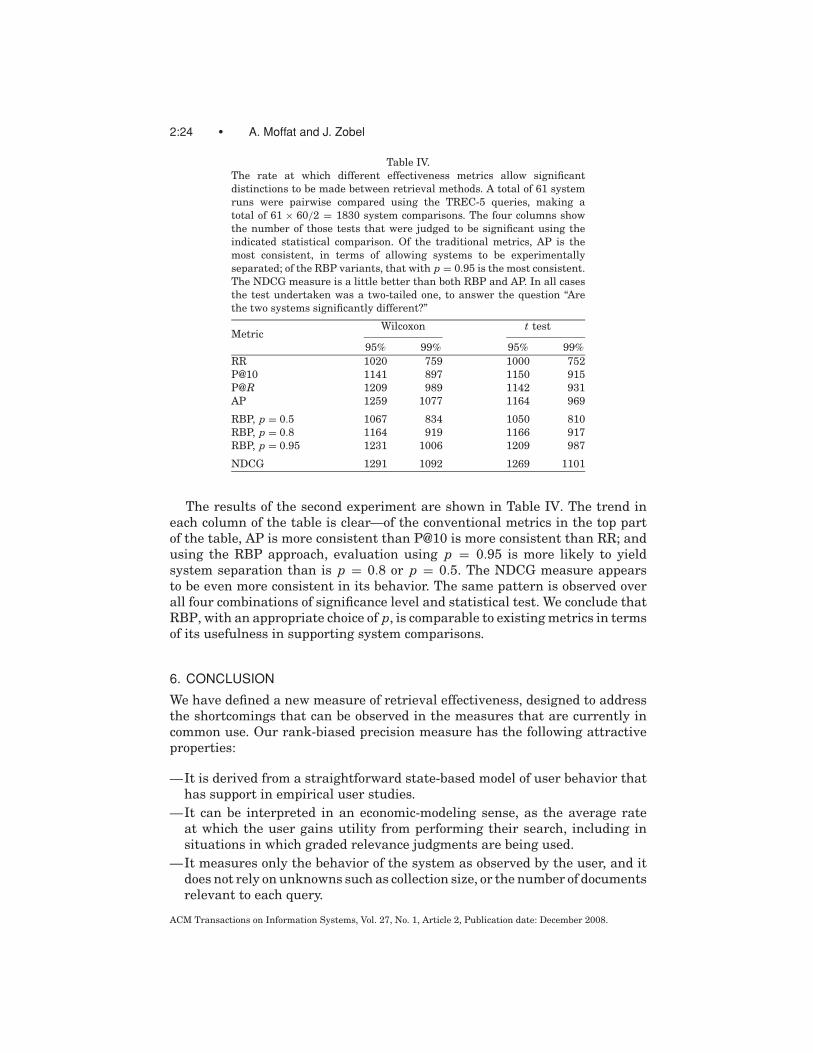
Table IV.The rate at which different effectiveness metrics allow significantdistinctions to be made between retrieval methods. A total of 61 systemruns were pairwise compared using the TREC-5 queries, making atotal of 61 × 60/2 = 1830 system comparisons. The four columns showthe number of those tests that were judged to be significant using theindicated statistical comparison. Of the traditional metrics, AP is themost consistent, in terms of allowing systems to be experimentallyseparated; of the RBP variants, that with p = 0.95 is the most consistent.The NDCG measure is a little better than both RBP and AP. In all casesthe test undertaken was a two-tailed one, to answer the question “Arethe two systems significantly different?”
Wilcoxon t testMetric
95% 99% 95% 99%RR 1020 759 1000 752P@10 1141 897 1150 915P@R 1209 989 1142 931AP 1259 1077 1164 969
RBP, p = 0.5 1067 834 1050 810RBP, p = 0.8 1164 919 1166 917RBP, p = 0.95 1231 1006 1209 987
NDCG 1291 1092 1269 1101
The results of the second experiment are shown in Table IV. The trend ineach column of the table is clear—of the conventional metrics in the top partof the table, AP is more consistent than P@10 is more consistent than RR; andusing the RBP approach, evaluation using p = 0.95 is more likely to yieldsystem separation than is p = 0.8 or p = 0.5. The NDCG measure appearsto be even more consistent in its behavior. The same pattern is observed overall four combinations of significance level and statistical test. We conclude thatRBP, with an appropriate choice of p, is comparable to existing metrics in termsof its usefulness in supporting system comparisons.
6. CONCLUSION
We have defined a new measure of retrieval effectiveness, designed to addressthe shortcomings that can be observed in the measures that are currently incommon use. Our rank-biased precision measure has the following attractiveproperties:
—It is derived from a straightforward state-based model of user behavior thathas support in empirical user studies.
—It can be interpreted in an economic-modeling sense, as the average rateat which the user gains utility from performing their search, including insituations in which graded relevance judgments are being used.
—It measures only the behavior of the system as observed by the user, and itdoes not rely on unknowns such as collection size, or the number of documentsrelevant to each query.
ACM Transactions on Information Systems, Vol. 27, No. 1, Article 2, Publication date: December 2008.

Rank-Biased Precision for Measurement of Retrieval Effectiveness • 2:25
—It provides a mechanism for allowing calculation of the required rankingdepth if scores are to be presented to a certain level of accuracy.
—In the presence of uncertainty (partial rankings, or unjudged documents), anerror bound can be precisely determined.
—It is well defined even when a query has no answers.—Depending on the parameter p chosen, it gives overall system rankings sim-
ilar to reciprocal rank, or similar to P@10, or similar to P@R and AP.—It is as likely as comparable measures to lead to statistically significant sys-
tem comparisons.
In addition, we have shown how the use of RBP at the “performing judg-ments” stage of an experiment can reduce the amount of effort needed (com-pared to pooling) when TREC-style system comparisons are being carried outusing RBP as the evaluation metric [Moffat et al. 2007], noting that similar rela-tionships based on MAP have also been proposed [Aslam et al. 2006; Carteretteet al. 2006; Cormack and Lynam 2006; Buttcher et al. 2007].
Needing to be weighed in the balance against these benefits are the following:
—For practical purposes RBP values are always strictly less than 1, since onlyan infinitely long ranking of relevant documents can give rise to RBP = 1.
—Rank-biased precision scores reflect user satisfaction in absolute terms,rather than in “relative to the maximum possible for this query” terms. Itmay be that standardization [Webber et al. 2008] can be usefully applied toRBP, but we have yet to explore this possibility.
—In any evaluation, the person reporting the experiment must choose a valueof p, and be willing to defend that choice to their target audience. If theirchosen p is significantly higher than the p used by the person designing theexperiment, then (a calculable level of) imprecision will result.
On balance, and taking both the drawbacks and benefits into account, webelieve that rank-biased precision provides a useful tool that will be of benefitin all situations where recall, or precision, or some amalgam of them such asaverage precision, might currently be used.
ACKNOWLEDGMENTS
Jamie Callan, Bruce Croft, Mark Sanderson, Ellen Voorhees, and WilliamWebber provided helpful assistance.
REFERENCES
ALLAN, J., CARTERETTE, B., AND LEWIS, J. 2005. When will information retrieval be “good enough”?See Marchionini et al. [2005], 433–440.
ASLAM, J. A., PAVLU, V., AND YILMAZ, E. 2006. A statistical method for system evaluation using in-complete judgments. In Proceedings of the 29th Annual International ACM SIGIR Conference onResearch and Development in Information Retrieval, S. Dumais, E. N. Efthimiadis, D. Hawking,and K. Jarvelin, Eds. ACM Press, New York, NY, 541–548.
ASLAM, J. A., YILMAZ, E., AND PAVLU, V. 2005. A geometric interpretation of r-precision and itscorrelation with average precision. See Marchionini et al. [2005], 573–574.
ACM Transactions on Information Systems, Vol. 27, No. 1, Article 2, Publication date: December 2008.

2:26 • A. Moffat and J. Zobel
BORLUND, P. AND INGWERSEN, P. 1998. Measures of relative relevance and ranked half-life: Perfor-mance indicators for interactive IR. In Proceedings of the Twenty-First Annual International ACMSIGIR Conference on Research and Development in Information Retrieval, W. B. Croft, A. Moffat,C. J. van Rijsbergen, R. Wilkinson, and J. Zobel, Eds. ACM Press, New York, NY, 324–331.
BUCKLEY, C. AND VOORHEES, E. M. 2004. Retrieval evaluation with incomplete information. InProceedings of the Twenty-Seventh Annual International ACM SIGIR Conference on Researchand Development in Information Retrieval, M. Sanderson, K. Jarvelin, J. Allan, and P. Bruza,Eds. ACM Press, New York, NY, 25–32.
BUCKLEY, C. AND VOORHEES, E. M. 2005. Retrieval system evaluation. In TREC: Experiment andEvaluation in Information Retrieval. MIT Press, Cambridge, MA, Chapter 3, 53–75.
BUTTCHER, S., CLARKE, C. L. A., YEUNG, P. C. K., AND SOBOROFF, I. 2007. Reliable information re-trieval evaluation with incomplete and biased judgements. In Proceedings of the Thirtieth AnnualInternational ACM SIGIR Conference on Research and Development in Information Retrieval,C. L. A. Clarke, N. Fuhr, N. Kando, W. Kraaij, and A. P. de Vries, Eds. ACM Press, New York,NY, 63–70.
CARTERETTE, B., ALLAN, J., AND SITARAMAN, R. 2006. Minimal test collections for retrieval evalua-tion. In Proceedings of the 29th Annual International ACM SIGIR Conference on Research andDevelopment in Information Retrieval, S. Dumais, E. N. Efthimiadis, D. Hawking, and K. Jarvelin,Eds. ACM Press, New York, NY, 268–275.
COOPER, W. S. 1968. Expected search length: A single measure of retrieval effectiveness basedon weak ordering action of retrieval systems. Amer. Document. 19, 1 (Jan.), 30–41.
COOPER, W. S. 1973. On selecting a measure of retrieval effectiveness: Part I, the ‘subjective’philosophy of evaluation. J. Amer. Soc. Inform. Sci. 24, 87–100.
CORMACK, G. V. AND LYNAM, T. R. 2006. Statistical precision of information retrieval evaluation.In Proceedings of the 29th Annual International ACM SIGIR Conference on Research and De-velopment in Information Retrieval, S. Dumais, E. N. Efthimiadis, D. Hawking, and K. Jarvelin,Eds. ACM Press, New York, NY, 533–540.
DELLA MEA, V. AND MIZZARO, S. 2004. Measuring retrieval effectiveness: a new proposal and a firstexperimental validation. J. Amer. Soc. Inform. Sci. Tech. 55, 6, 530–543.
FREI, H. P. AND SCHAUBLE, P. 1991. Determining the effectiveness of retrieval algorithms. Inform.Process. Manage. 27, 2/3, 153–164.
HARMAN, D. 1995. Overview of the second text retrieval conference (TREC-2). Inform. Process.Manage. 31, 3, 271–289.
HARTER, S. P. 1996. Variations in relevance assessments and the measurement of retrieval effec-tiveness. J. Amer. Soc. Inform. Sci. 47, 1, 37–49.
HOSANAGAR, K. 2005. A utility theoretic approach to determining optimal wait times in dis-tributed information retrieval. See Marchionini et al. [2005], 91–97.
JARVELIN, K. AND KEKALAINEN, J. 2002. Cumulated gain-based evaluation of IR techniques. ACMTrans. Inform. Syst. 20, 4, 422–446.
JOACHIMS, T., GRANKA, L., PAN, B., HEMBROOKE, H., AND GAY, G. 2005. Accurately interpreting click-through data as implicit feedback. See Marchionini et al. [2005], 154–161.
KAGOLOVSKY, Y. AND MOEHR, J. R. 2003. Current status of the evaluation of information retrieval.J. Med. Syst. 27, 5, 409–424.
KEEN, E. M. 1992. Presenting results of experimental retrieval comparisons. Inform. Process.Manage. 28, 4, 491–502.
KEKALAINEN, J. 2005. Binary and graded relevance in IR evaluations. Inform. Process. Man-age. 41, 5, 1019–1034.
LOSEE, R. M. 2000. When information retrieval measures agree about the relative quality ofdocument rankings. J. Amer. Soc. Inform. Sci. 51, 9, 834–840.
MARCHIONINI, G., MOFFAT, A., TATE, J., BAEZA-YATES, R., AND ZIVIANI, N., Eds. 2005. Proceedings ofthe Twenty-Eighth Annual International ACM SIGIR Conference on Research and Developmentin Information Retrieval. ACM Press, New York, NY.
MENG, X. AND CHEN, Z. 2004. On user-oriented measurements of effectiveness of Web informationretrieval systems. In Proceedings of the International Conference on Internet Computing, H. R.Arabnia, O. Droegehorn, and S. Chatterjee, Eds. CSREA Press, Las Vegas, NV, 527–533.
MIZZARO, S. 1997. Relevance: The whole history. J. Amer. Soc. Inform. Sci. 48, 9, 810–832.
ACM Transactions on Information Systems, Vol. 27, No. 1, Article 2, Publication date: December 2008.
Rank-Biased Precision for Measurement of Retrieval Effectiveness • 2:27
MOFFAT, A., WEBBER, W., AND ZOBEL, J. 2007. Strategic system comparisons via targeted relevancejudgments. In Proceedings of the Thirtieth Annual International ACM SIGIR Conference on Re-search and Development in Information Retrieval, C. L. A. Clarke, N. Fuhr, N. Kando, W. Kraaij,and A. P. de Vries, Eds. ACM Press, New York, NY, 375–382.
RAGHAVAN, V. V., JUNG, G. S., AND BOLLMANN, P. 1989. A critical investigation of recall and precisionas measures of retrieval system performance. ACM Trans. Inform. Syst. 7, 3, 205–229.
SAKAI, T. 2004. Ranking the NTCIR systems based on multigrade relevance. In Proceedings ofthe AIRS Asian Information Retrieval Symposium. Lecture Notes in Computer Science, vol. 3411.Springer, Berlin, Germany, 251–262.
SAKAI, T. 2007. Alternatives to Bpref. In Proceedings of the Thirtieth Annual International ACMSIGIR Conference on Research and Development in Information Retrieval, C. L. A. Clarke,N. Fuhr, N. Kando, W. Kraaij, and A. P. de Vries, Eds. ACM Press, New York, NY, 71–78.
SANDERSON, M. AND ZOBEL, J. 2005. Information retrieval system evaluation: Effort, sensitivity,and reliability. See Marchionini et al. [2005], 162–169.
SARACEVIC, T. 1995. Evaluation of evaluation in information retrieval. In Proceedings of the Eigh-teenth Annual International ACM SIGIR Conference on Research and Development in InformationRetrieval, E. A. Fox, P. Ingwersen, and R. Fidel, Eds. ACM Press, New York, NY, 138–146.
SHAW, JR., W. M. 1986. On the foundation of evaluation. J. Amer. Soc. Inform. Sci. 37, 5, 346–348.SU, L. T. 1994. The relevance of recall and precision in user evaluation. J. Amer. Soc. Inform.
Sci. 45, 3 (Apr.), 207–217.TAGUE-SUTCLIFFE, J. 1992. The pragmatics of information retrieval experimentation, revisited.
Inform. Process. Manage. 28, 4, 467–490.VAN RIJSBERGEN, C. J. 1979. Information Retrieval, 2nd ed. Butterworths, London, U.K.VOORHEES, E. M. 2002. The philosophy of information retrieval evaluation. In Proceedings of
the 2001 Cross Language Evaluation Forum Workshop, C. Peters, M. Braschler, J. Gonzalo, andM. Kluck, Eds. Lecture Notes in Computer Science, vol. 2406, Springer, Berlin, Germany, 355–370.
WEBBER, W., MOFFAT, A., AND ZOBEL, J. 2008. Score standardization for inter-collection comparisonof retrieval systems. In Proceedings of the 31st Annual International ACM SIGIR Conference onResearch and Development in Information Retrieval. ACM Press, New York, NY. To appear.
WITTEN, I. H., MOFFAT, A., AND BELL, T. C. 1999. Managing Gigabytes: Compressing and IndexingDocuments and Images, 2nd ed. Morgan Kaufmann, San Francisco, CA.
ZOBEL, J. 1998. How reliable are the results of large-scale information retrieval experiments? InProceedings of the Twenty-First Annual International ACM SIGIR Conference on Research andDevelopment in Information Retrieval, W. B. Croft, A. Moffat, C. J. van Rijsbergen, R. Wilkinson,and J. Zobel, Eds. ACM Press, New York, NY, 307–314.
Received October 2005; revised September 2007; accepted April 2008
ACM Transactions on Information Systems, Vol. 27, No. 1, Article 2, Publication date: December 2008.