Embed Size (px)
Citation preview

Range of Motion
IB SEHSInternal Assessment
Internal Assessment
• Lesson 1:-pre-lab-carrying out a standardised practical using handouts I will give you-thinking about how you could adapt the experiment for an Internal Assessment
• Lesson 2 and 3:-Using your Design Lab Training Sheet you will work in teams to design a practical investigating an aspect of osmosis.
• Lesson 4 and 5: -You will carry out the practical and collect data as a team.
• Lesson 6 and 7:-I will show you how to process your data with statistics!-specifically using Excel to calculate means, standard deviations and draw graphs
• Lesson 8 and 9:-I will guide you on how to write a conclusion and evaluation
• Lesson 10:-Your practical will be handed in-written up individually and in the correct format-self assessment should be complete as well

Writing A Statement of the Problem for the Experiment
It should state: “The Effect of the Independent Variable on the Dependent Variable”.
A good statement of the problem for pur experiment would be…..
The effect of a limited range of motion of the knee on sprinting performance
What should it state?
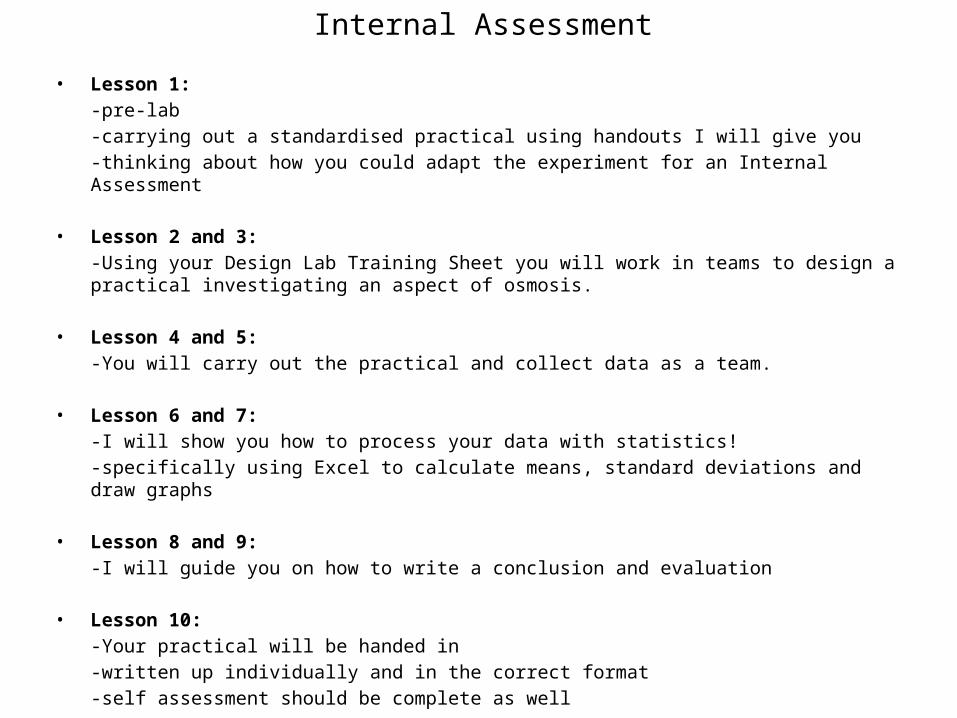
More about our variables:
The independent variable is the variable that is purposely changed. It is the manipulated variable.
The dependent variable changes in response to the independent variable. It is the responding variable.
What is the “RoM” independent variable?Knee brace
What is the dependent variable?
Sprinting time

Title for the photosynthesis experiment
The effect of a limited range of motion of the knee on sprinting performance

Another Look at Our HypothesisINDEPENDENT VARIABLE
If the RoM decreases,
DEPENDENT VARIABLE
then the sprinting time will increase.
To make this IB worthy you MUST:
a)Include a sketch graph of your predicted results
b) Give SCIENTIFIC reasoning as to why you predict this

Controls in an Experiment
You MUST explain-what affect each CV could have on the reliability of the results if not controlled
-how you are going to control them
Factors that are kept the same and not allowed to change
What should be kept constant in the experiment?• Age
• Gender
• Level of fitness
• Health/dietary issues
• Distance run and surface
• Intensity of run
• Construction of knee brace
• Outside air temperature
• Time of day

Values of the Independent VariableHow many different values of the
independent variable should we test?Enough to clearly illustrate a trend in the data
Always have 2 populuations for dicontinuous data (with one being the control)
e.g. smokers and non-smokers
Always use the 5x5 rule for continuous data
e.g. 10cm, 20cm, 30cm, 40cm, 50cm

Repeated TrialsHow many repeated trials are needed in the experiment
Always have a minimum of 20 in each experimental group for discontinuous data
Always have at at least 5 repeats for each range of the independent variable

Drawing/photo of experiment
Place a cardboard strip either side of the knee to stabilize it
Wrap the bandage around the knee to hold the cardboard strips in place thereby stabilizing the joint

Writing a method
• EVERY step needs to be written with quantities, equipment and uncertainties ALL specified
• You must take into account the ethical considerations of carrying out a practical
• If you plan to use people in your experiment then you MUST ask them to sign consent forms
Now complete your Design Lab sheet!

Carrying out your practical…
Qualitative Observations (must have these or zero for DCP1!!)
•Pupils wearing looser clothing generally found it easier to run faster
•All pupils started on a different foot

Quantitative: Sample Data Table
Title: The effect of changing glucose concentration on the rate of respiration
Concentration of glucose (%)
Mean Vol of C02 produced in 5 min (±0.01ml)
Vol of C02 produced in 5 min (±0.01ml)
TRIALS
1 2 3
10
20
30
40
50
3.00 5.00 4.00 4.00
4.00 5.00 6. 00 5.00
6. 00 7.00 5.00 6.00
7.00 8.00 6. 00 7.00
9.00 7. 00 8. 00 8.00

Data Processing for Internal Assessment AND Topic 1

Data Processing
• You need to:
1. Calculate the mean sprinting time for each group
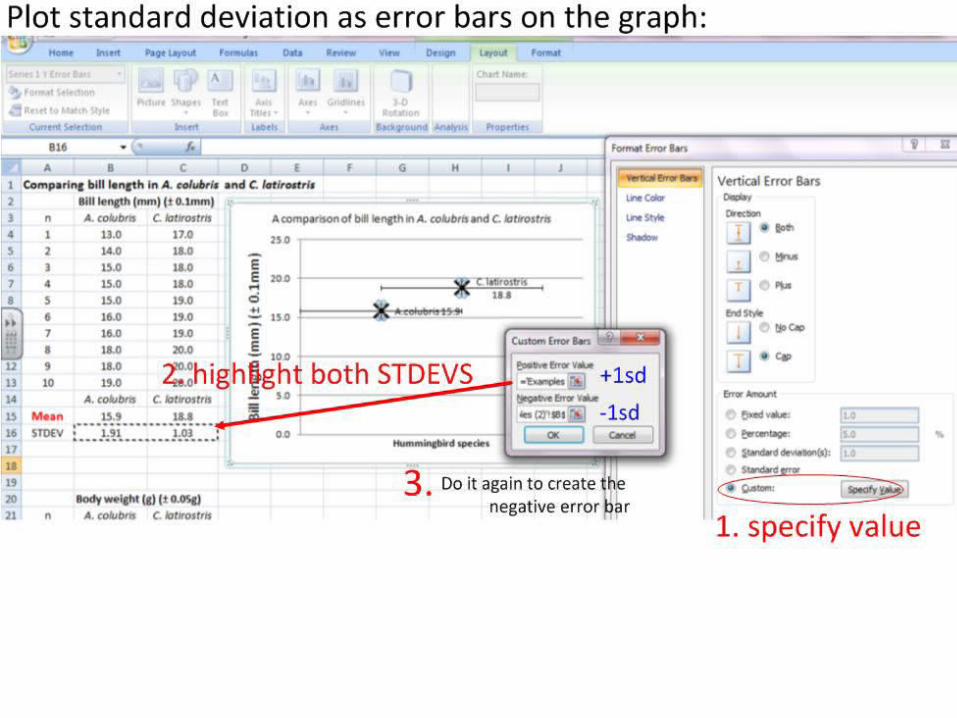
2. Calculate the error for EACH mean
3. Plot a graph comparing the times


Two classes took a recent quiz.
There were 10 students in each class
Each class had an mean score of 81.5
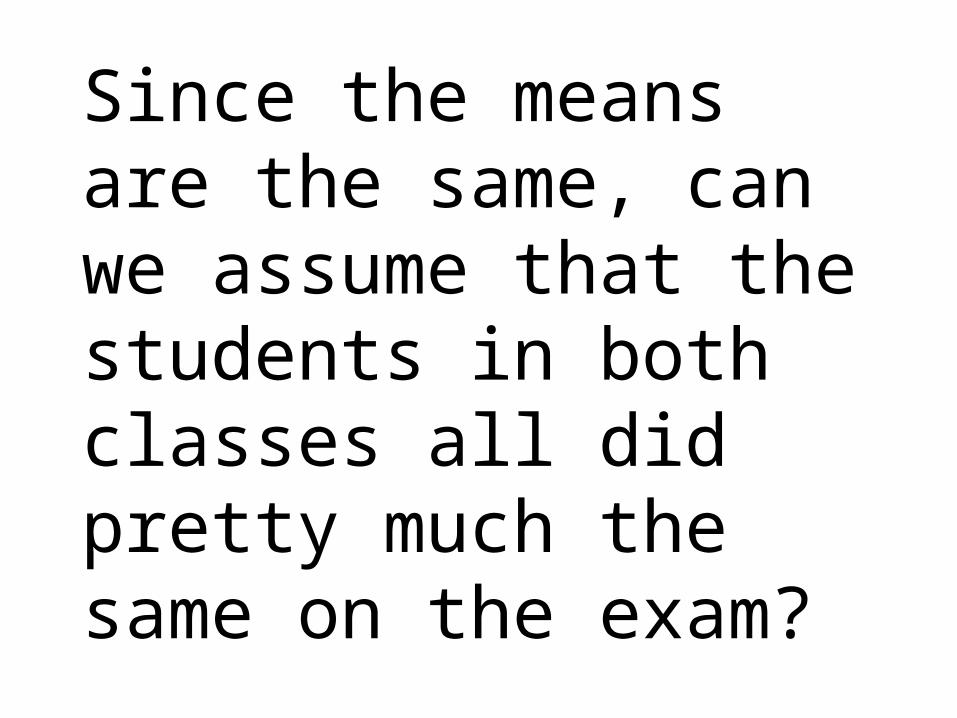
Since the means are the same, can we assume that the students in both classes all did pretty much the same on the exam?

The answer is… No.
The mean (mean) does not tell us anything about the distribution or variation in the grades.

Here are scatter diagrams of the grades in each class:

Mean

So, we need to come up with some way of
measuring not just the mean, but also the spread of the distribution of our
data.

Why not just give an mean and the range of data (the highest and lowest values) to describe the distribution
of the data?

Well, for example, lets say from a set of data, the mean is 17.95
and the range is 23.
But what if the data looked like this:

Here is the mean
And here is the range
But really, most of the numbers are in this area, and are not evenly distributed throughout the range.
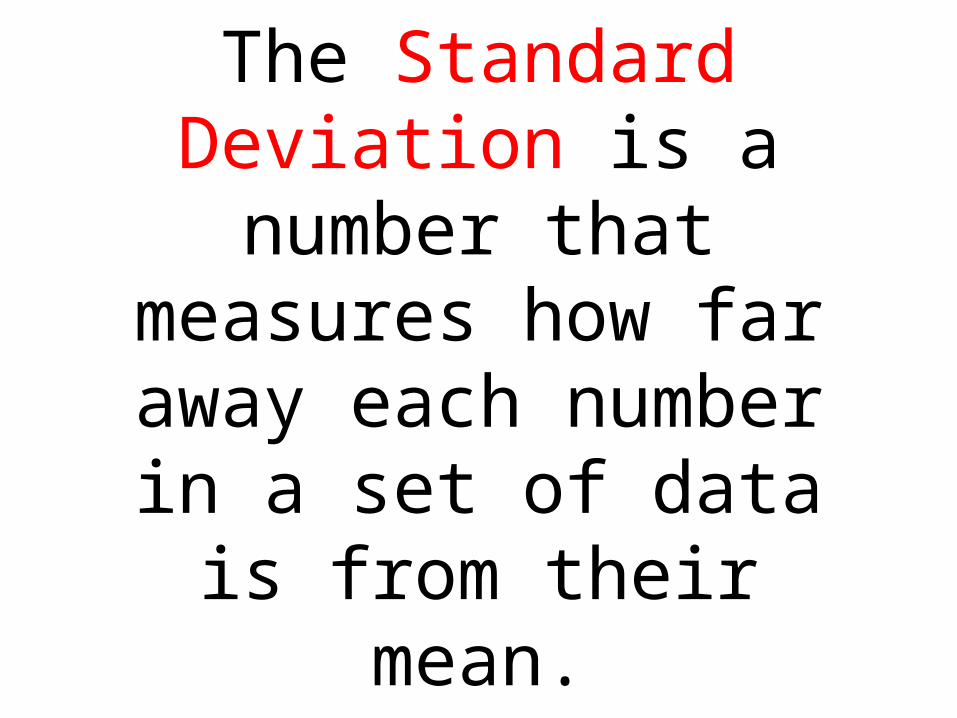
The Standard Deviation is a number that measures
how far away each number in a set of data is from
their mean.

If the Standard Deviation is large, it means the numbers are spread
out from their mean.
If the Standard Deviation is small, it means the numbers are
close to their mean.small,
large,
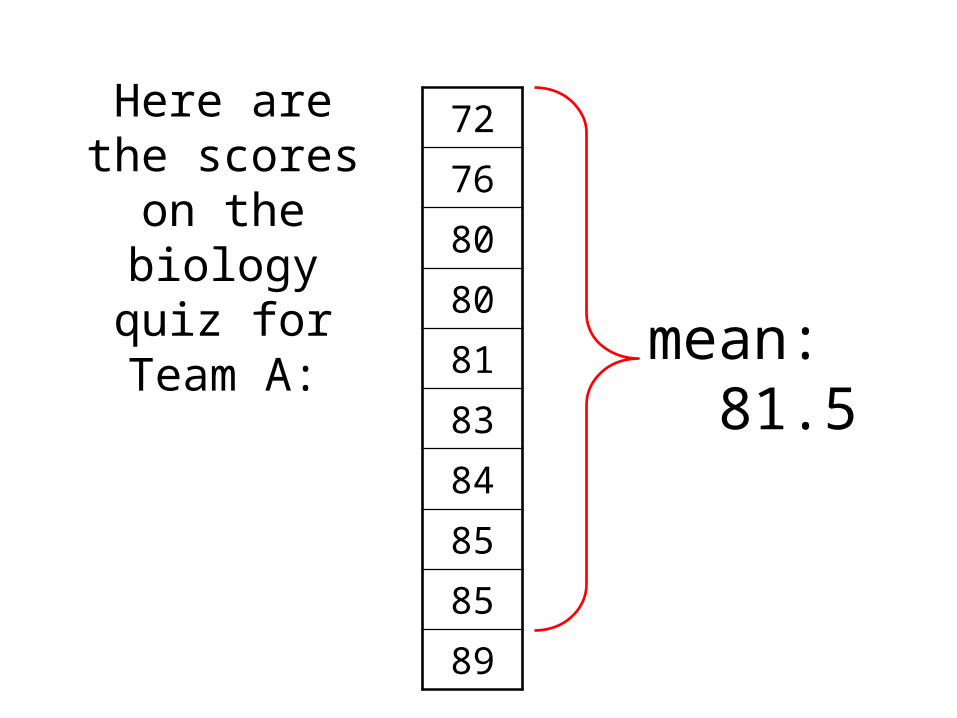
Here are the scores on the biology quiz for Team A:
72768080818384858589
mean: 81.5

The Standard Deviation measures how far away each number in a set of data is from their mean.
For example, start with the lowest score, 72. How far away is 72 from the mean of 81.5?
72 - 81.5 = - 9.5
- 9.5

- 9.5
Or, start with the lowest score, 89. How far away is 89 from the mean of 81.5?
89 - 81.5 = 7.5
7.5

Now, lets compare the two classes again
Team A Team B
mean on the Quiz
Standard Deviation
81.5 81.5
4.88 15.91

6.1.3 State that the statistic standard deviation is used to summarize the spread of values around the mean, and that within a normal distribution approximately 68% and 95% of the values fall within plus or minus one ortwo standard deviations respectively.

6.1.4 Explain how the standard deviation is useful for comparing the means and the spread of data between two or more samples.
• A small standard deviation indicates that the data is clustered closely around the mean value.
• Conversely, a large standard deviation indicates a wider spread around the mean.

Now...how do you do it the easy way?


Concluding and Evaluating

•ConclusionThis is the section where you draw conclusions about the experiment as it relates to your aim and hypothesis. Calculated results should be compared to values from the literature (i.e. accepted values from professional laboratories) where possible.
This section should include: • Conclusion based on your Aim or Hypothesis. (using appropriate
language)• States the quantitative or qualitative relationship• Correctly interprets the graph of the data• Includes relevant calculated values to support conclusion• Includes some elaboration based on the science being learned

Discussion of errors and limitations to the experiment
• Must comment on the “quality” of the results, do they make sense?• Identifies anomalous results where appropriate (use your SDs to help you
do this!)• Prioritizes errors and suggests where they came from.
• Utilizes the ideas of “systematic” and “random” errors in the discussion• Indicate what effect the error(s) would have on the results• Human errors should not be the main source of errors!
• Suggestions for improvements• Identifies weaknesses in the experiment and suggests realistic suggestions
for improvement• Improvements should help to improve the errors previously identified

How to write an effective conclusion
Also known as putting it all together

What is a conclusion?
• A conclusion is a summary of the experiment.
• It is putting the hypothesis together with the data and coming up with a conclusion or ending thought.
• It is a written answer to the original question.

So where to start…
• Every conclusion begins with a topic sentence.
• In a conclusion, the topic sentence is the restatement of the problem/question.

Can your group state a hypothesis for the research question below?
• The effect of different concentrations of glucose solution on the rate of respiration?

Can you write a conclusion for the data below?
0 0.5 1 1.5 2 2.5 3 3.5 4 4.5 50
2
4
6
8
10
12
14
A graph showing the effect of different glucose concentrations on the rate of respiration
Glucose concentration (%)
Rate
of r
espi
ratio
n (C
O2m
l/m
in

Keep your group’s conclusion close to hand
• We will now go through step by step of the format and information that should have been included….
Our conclusion outline
1. Restate the Problem
This experiment was investigating the effect of different concentrations of glucose solution on the rate of respiration

Our conclusion outline
1. Restate the problem2. Restate your hypothesis
(It was predicted that…)
It was predicted that as the concentration increased from 0%, the rate of respiration will increase up until the all respiration enzymes are being used and their active sites are all occupied. From this point on, the rate of respiration will remain the same.

So was your hypothesis right, wrong or indifferent?
3. Accept or reject your hypothesisDoes the data support the hypothesis?
If it does-we accept the hypothesisIf it doesn’t-we reject the hypothesis
My processed data supports my hypothesis

Now provide evidence
4. Provide actual data in sentence form that backs up your previous statement.
• What type of relationship was there, if any?– How did the independent variable effect the
dependent variable?• Were there any trends? • changes; (increases, decreases in data)• patterns (repeated data that is similar)

Can you write a conclusion for the data below?
0 0.5 1 1.5 2 2.5 3 3.5 4 4.5 50
2
4
6
8
10
12
14
A graph showing the effect of different glucose concentrations on the rate of respiration
Glucose concentration (%)
Rate
of r
espi
ratio
n (C
O2m
l/m
in

Our conclusion outlineAs the concentration increased from 0% to 3%, the rate of reaction also increased constantly from 1 CO2ml/min to 12 CO2ml/min until at 3% where the rate of reaction reached it’s maximum of 12 CO2ml/min.
After this the rate of reaction remained constant at 12 CO2ml/min even though the glucose concentration was increased to 5%
Next
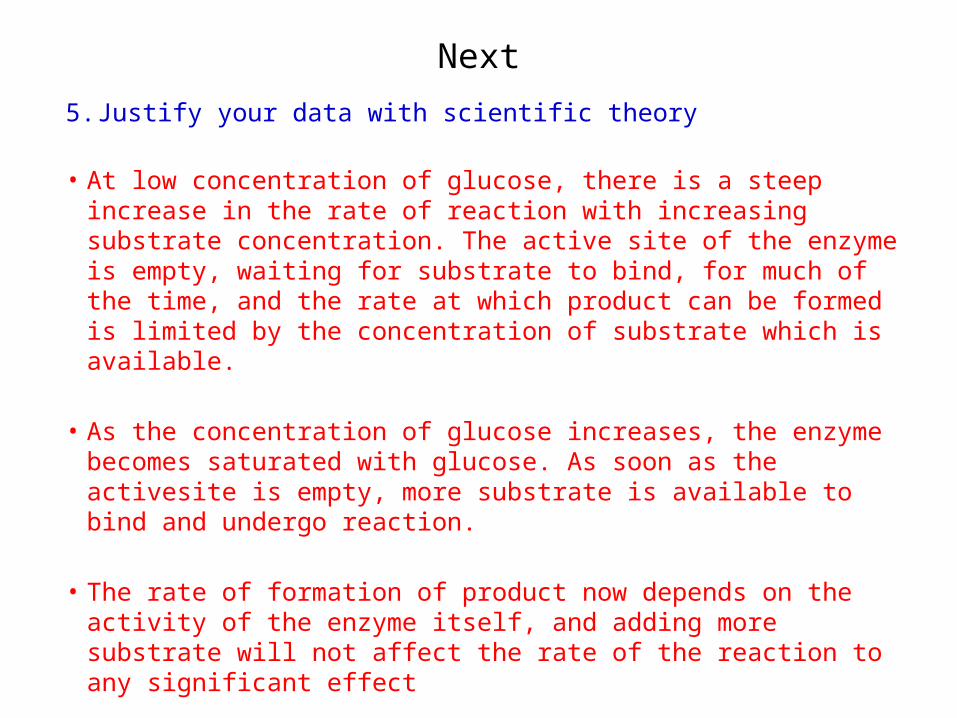
5. Justify your data with scientific theory
• At low concentration of glucose, there is a steep increase in the rate of reaction with increasing substrate concentration. The active site of the enzyme is empty, waiting for substrate to bind, for much of the time, and the rate at which product can be formed is limited by the concentration of substrate which is available.
• As the concentration of glucose increases, the enzyme becomes saturated with glucose. As soon as the activesite is empty, more substrate is available to bind and undergo reaction.
• The rate of formation of product now depends on the activity of the enzyme itself, and adding more substrate will not affect the rate of the reaction to any significant effect

Our conclusion outline
1. Restate the problem2. Restate your hypothesis
(It was predicted that…)3. Accept or reject your hypothesis4. Provide actual data in sentence form that
backs up your previous statement.5. Justify your data with scientific theory

Yeah! We’re almost there….

6. Concluding sentence
• This sentence should– Begin with a transition word
• To sum up• In conclusion• Therefore, it can be said that
– Rephrase the original question or problem– Explain the importance of carrying out the
experiment

Our conclusion outline
In conclusion, it can be stated that different concentrations of glucose do have an effect on the rate of respiration
Therefore, it is possible to deduce the optimum concentration for a respiratory enzyme to ensure maximum efficiency of this particular enzyme.

6 points to scientific success!
1. Restate the problem2. Restate your hypothesis 3. Accept or reject your hypothesis4. Provide actual data in sentence form that
backs up your previous statement.5. Justify your data with scientific theory6. Concluding sentence that justifies the
experiment

Conclusion
This experiment was investigating the effect of different concentrations of glucose solution on the rate of respiration
It was predicted that as the concentration increased from 0%, the rate of respiration will increase up until the all respiration enzymes are being used and their active sites are all occupied. From this point on, the rate of respiration will remain the same.
My processed data supports my hypothesis
• As the concentration increased from 0% to 3%, the rate of reaction also increased until at 3% where the rate of reaction reached it’s maximum of 12 CO2ml/min.
• After this the rate of reaction remained constant even though the glucose concentration was increased to 5%
This is because• At low concentration of glucose, there is a steep increase in the rate of reaction with increasing substrate concentration. The
active site of the enzyme is empty, waiting for substrate to bind, for much of the time, and the rate at which product can be formed is limited by the concentration of substrate which is available.
• As the concentration of glucose increases, the enzyme becomes saturated with glucose. As soon as the activesite is empty, more substrate is available to bind and undergo reaction.
• The rate of formation of product now depends on the activity of the enzyme itself, and adding more substrate will not affect the rate of the reaction to any significant effect
In conclusion, it can be stated that different concentrations of glucose do have an effect on the rate of respiration Therefore, it is possible to deduce the optimum concentration for a respiratory enzyme to ensure maximum efficiency of this
particular enzyme.

Evaluation
To evaluate your science experiments simply answer the following questions:
• How could you have improved the way you did your practical?
• What improvements would you make to your method if you did it again? Why?
• Did the data you collected give you enough information? Why? • What could you do to improve the reliability of your data?

Evaluations : What to include... Examples...
1) Write down how well you think the experiment went and why.
2) "The experiment went quite well but my human error contributed to unreliable results. This is because….".

3) Point out any odd results that you had
• "Looking at the graph/standard deviations anomalous results can be identified. These are….”

4) Explain why IN DETAIL, you may have some odd results / what problems you had with the experiment.
• Include MINIMUM THREE and it MUST refer back to the method
• "One of the reasons that these large standard deviations/anomalous results were obtained could be due to not using the same starting position, which meant that some participants had an advantage in terms of distance they had to cover…

5) Explain how you could improve the experiment if you had to do it again IN DETAIL. Suggest AT LEAST THREE things. Include a diagram and explain why.
• "The experiment could be repeated using the same starting position for all participants

6) Explain what further experiments you could do in the future, if you had the time.
• "If this investigation could be extended, the effect of limiting the RoM of the elbow joint would compliment the data obtained in this experiment.. This could be done by…"