Embed Size (px)
Citation preview

Randomized Evaluation of Long-term anticoagulant therapY
Dabigatran Compared to Warfarin in 18,113 Patients with Atrial Fibrillation at Risk of Stroke
Sponsored by Boehringer-Ingelheim

Atrial Fibrillation and Stroke
• AF responsible for 1/6 of all strokes
• Warfarin reduces stroke in AF by 64%– significant increase in intracranial and other hemorrhage
– Difficult to use
• Only 50% of eligible patients receive warfarin
• An alternative treatment is needed

Dabigatran
Dabigatran Etexilate, a pro-drug, is rapidly converted to dabigatran
6.5% bioavailability, 80% excreted by kidney
Half-life of 12-17 hours
Phase 2 data identified 110 mg BID and 150 mg BID as viable doses

RE-LY: A Non-inferiority Trial
Atrial fibrillation ≥1 Risk Factor
Absence of contra-indications951 centers in 44 countries
R
Warfarinadjusted
(INR 2.0-3.0)N=6000
Dabigatran Etexilate
110 mg BIDN=6000
Dabigatran Etexilate
150 mg BIDN=6000
Blinded Event Adjudication.
Open Blinded

Trial Execution
Performed December 2005-March 2009
Median Follow up 2.0 years
Follow up 99.9% complete
Mean TTR = 64% (patients on warfarin)

Baseline Characteristics
Characteristic Dabigatran 110 mg
Dabigatran 150 mg
Warfarin
Randomized 6015 6076 6022
Mean age (years) 71.4 71.5 71.6
Male (%) 64.3 63.2 63.3
CHADS2 score (mean) 0-1 (%) 2 (%) 3+ (%)
2.1
32.634.732.7
2.2
32.235.232.6
2.1
30.937.032.1
Prior stroke/TIA (%) 19.9 20.3 19.8
Prior MI (%) 16.8 16.9 16.1
CHF (%) 32.2 31.8 31.9
Baseline ASA (%) 40.0 38.7 40.6
Warfarin Naïve (%) 49.9 49.8 51.4

Stroke or Systemic Embolism
0.50 0.75 1.00 1.25 1.50
Dabigatran 110 vs. Warfarin
Dabigatran 150 vs. Warfarin
Non-inferiorityp-value
<0.001
<0.001
Superiorityp-value
0.34
<0.001
Margin = 1.46
HR (95% CI)Warfarin betterDabigatran better

10 Outcome: Superiority Analysis
D 110mg D 150mg warfarinD 110mg vs.
WarfarinD 150mg vs.
Warfarin
Annual Annual raterate
Annual Annual raterate
Annual Annual raterate
RRRR
95% CI95% CIP*P*
RRRR
95% CI95% CIPP
Stroke or systemic Embolism
1.5 % 1.1 % 1.7 %0.91
0.74-1.110.34
0.66
0.53-0.82<0.001
Stroke 1.4 % 1.0 % 1.6 %0.92
0.74-1.130.41
0.64
0.51-0.81<0.001

Ischemic/Unspecified Stroke
D 110 mg vs. Warfarin
D 150 mg vs. Warfarin
RR =1.1195% CI = 0.89-1.40P = 0.35
RR = 0.7695% CI = 0.60-0.98P = 0.03
Years of Follow-up
Cu
mu
lati
ve H
azar
d R
ates
0.0
0.02
0.04
0.06
0.08
0 0.5 1.0 1.5 2.0 2.5
Dabigatran110
Dabigatran150
Warfarin

Hemorrhagic Stroke
D 110 mg vs. Warfarin
D 150 mg vs. Warfarin
RR = 0.31
95% CI =0.17-0.56
P <0.001
RR =0.26
95% CI =0.14-0.49
P <0.001
Years of Follow-up
Cu
mu
lati
ve H
azar
d R
ates
0.0
0.01
0.02
0.03
0.04
0 0.5 1.0 1.5 2.0 2.5
Dabigatran110
Dabigatran150
Warfarin
Bleeding
D
110mg
D
150mgwarfarin
D 110mg vs. Warfarin
D 150mg vs. Warfarin
AnnualAnnual
raterate
AnnualAnnual
raterate
AnnualAnnual
raterate
RRRR
95% CI95% CIpp
RRRR
95% CI95% CIpp
Total 14.6% 16.4% 18.2%0.78
0.74-0.83<0.001
0.91
0.86-0.970.002
Major 2.7 % 3.1 % 3.4 %0.80
0.69-0.930.003
0.93
0.81-1.070.31
Life-Threatening major
1.2 % 1.5 % 1.8 %0.68
0.55-0.83<0.001
0.81
0.66-0.990.04
Gastro-intestinal
Major1.1 % 1.5 % 1.0 %
1.10
0.86-1.410.43
1.50
1.19-1.89<0.001

MI, Death and Net clinical Benefit
D 110mg D 150mg warfarinD 110mg vs.
WarfarinD 150mg vs.
Warfarin
AnnualAnnual
raterate
AnnualAnnual
raterate
AnnualAnnual
raterate
RRRR
95% CI95% CIpp
RRRR
95% CI95% CIpp
MI 0.7% 0.7 % 0.5 %1.35
0.98-1.870.07
1.38
1.00-1.910.048
Death 3.8 % 3.6 % 4.1 %0.91
0.80-1.030.13
0.88
0.77-1.000.05
Net Clinical Benefit
7.1 % 6.9 % 7.6 %0.92
0.84-1.020.10
0.91
0.82-1.000.04
Net Clinical Benefit includes vascular events, death and major bleed

Dabigatran 150 mg vs. 110 mg
Dabigatran 110mg
Dabigatran 150mg
D 150mg vs. D 110 mg
Number Number
rate/yrrate/yr
Number Number
rate/yrrate/yr
Relative RiskRelative Risk
95% CI95% CIpp
Stroke and systemic embolism
1.5% 1.1 %0.73
0.58-0.910.005
Hemorrhagic stroke 0.1% 0.1 %0.85
0.39-1.830.67
Major Hemorrhage 2.7 % 3.1 %1.16
1.00-1.340.05
Net Clinical Benefit 7.1 % 6.9 %0.98
0.89-1.080.66
*Net Clinical Benefit includes vascular events, death and major bleed

Permanent Discontinuation
Years of Follow-up
Sto
pp
ing
Ra
tes
0.0
0.1
0.2
0.3
0.4
0 0.5 1.0 1.5 2.0 2.5
Dabigatran110
Dabigatran150
Warfarin

Years of Follow-up
Cu
mu
lati
ve R
isk
0.0
0.01
0.02
0.03
0.04
0 0.5 1.0 1.5 2.0 2.5
Dabigatran110
Dabigatran150
Warfarin
ALT or AST >3x ULN
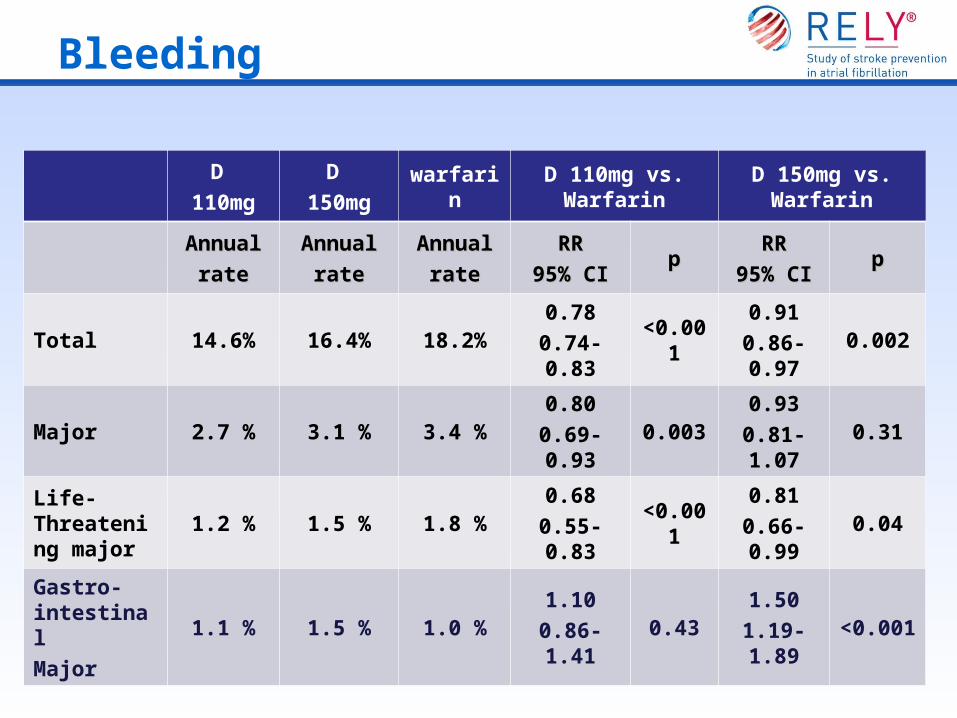
Adverse events occurring in >5% of any group
Dabigatran 110 mg
%%
Dabigatran 150 mg
%%
Warfarin
%%
Dyspepsia * 11.8 11.3 5.8Dyspnea 9.3 9.5 9.7Dizziness 8.1 8.3 9.4Peripheral edema 7.9 7.9 7.8Fatigue 6.6 6.6 6.2Cough 5.7 5.7 6.0Chest pain 5.2 6.2 5.9Arthralgia 4.5 5.5 5.7Back pain 5.3 5.2 5.6Nasopharyngitis 5.6 5.4 5.6Diarrhea 6.3 6.5 5.7Atrial fibrillation 5.5 5.9 5.8Urinary tract infection 4.5 4.8 5.6Upper respiratory tract infection
4.8 4.7 5.2
Common Adverse Events
*Occurred more commonly on dabigatran p<0.001

Conclusions
Dabigatran 150 mg significantly reduced stoke compared to warfarin with similar risk of major bleeding
Dabigatran 110 mg had a similar rate of stroke as warfarin with significantly reduced major bleeding
Both doses markedly reduced intra-cerebral, life-threatening and total bleeding
Dabigatran had no major toxicity, but did increase dyspepsia and GI bleeding

Conclusions
Both Dabigatran doses offer advantages over warfarin
Dabigatran 150 is more effective and dabigatran 110 has a better safety profile
There is potential to tailor therapy to individual patient characteristics


![Praxbind-a novel anticoagulant reversal agent · PDF file2015-FDA approve dabigatran antidote ... (colostomy) # femur 110mg BD 95% Survived ... Ppt0000000.ppt [Read-Only] Author: nabb0001](https://img.dokumen.tips/doc/110x75/5aa707067f8b9ab8228bb23e/praxbind-a-novel-anticoagulant-reversal-agent-approve-dabigatran-antidote-colostomy.jpg)