Embed Size (px)
Citation preview

Boise State UniversityScholarWorks
Physics Faculty Publications and Presentations Department of Physics
4-4-2008
Raman Spectroscopy of Ferroelectric Thin Filmsand SuperlatticesDmitri TenneBoise State University
Xiaoxing XiPennsylvania State University
This is an author-produced, peer-reviewed version of this article. The final, definitive version of this document can be found online at Journal of theAmerican Ceramic Society, published by Blackwell Publishing. Copyright restrictions may apply. DOI: 10.1111/j.1551-2916.2008.02371.x
Raman spectroscopy of ferroelectric thin films and superlattices∗
Dmitri A. Tenne†
Department of Physics, Boise State University, Boise, ID 83725-1570
Xiaoxing Xi
Department of Physics, Department of Materials Science
and Engineering, and Materials Research Institute,
the Pennsylvania State University, University Park, PA 16802
(Dated: January 16, 2008)
Abstract
Recent results of Raman spectroscopy studies of lattice dynamics and phase transitions in
ferroelectric thin films and superlattices are reviewed. Raman studies of SrTiO3, BaTiO3, and
BaxSr1−xTiO3 thin films in comparison to corresponding single crystals are presented; essential
differences in the lattice dynamics behavior of thin films and single crystals are discussed. Applica-
tion of ultraviolet Raman spectroscopy for studies of nanoscale ferroelectric heterostructures, such
as BaTiO3/SrTiO3 superlattices, is demonstrated.
1

I. INTRODUCTION
In the past 15 years, thin films and heterostructures based on perovskite oxide fer-
roelectrics have been extensively studied for wide variety of device applications such as
non-volatile ferroelectric memories, dynamic random access memories or tunable microwave
devices.1–4 The difference in the properties of thin films compared to those of corresponding
bulk materials has been a major issue. For example, while the bulk ferroelectrics such as
BaxSr1−xTiO3 show sharp peaks reaching the values of 104 in the temperature dependence
of the dielectric constant ε,14 thin films of the same material exhibit a broad maximum with
the peak values an order of magnitude smaller, and a larger dielectric loss.4,5
Recent advances in epitaxial technology of oxide materials 6 have opened a new stage in
the field, making possible an experimental realization of complex artificial oxide nanoscale
heterostructures with atomic-level thickness control comparable to that developed for semi-
conductor heterostructures. High quality ultrathin films of ferroelectric materials can be
grown and combined with other ferroelectrics and such materials as superconducting and
magnetic oxides, semiconductors, allowing fabrication of multifunctional structures and
opening exciting opportunities for potential device applications. Reduction of the structural
dimensions to the nanometer scale gives rise to new physical phenomena and properties
dramatically different from those of homogeneous bulk ferroelectrics 3,7,8. The continuous
demand for device miniaturization requires the behavior of ferroelectric nanoscale films and
heterostructures to be understood.
Of central importance for understanding the fundamental properties of ferroelectrics is
dynamics of crystal lattice.9 The soft-mode theory of ferroelectricity 10 has established the
relationship between the polar optical vibrational modes and ferroelectric polarization. The
lowest-frequency transverse optical phonon, the soft mode, involves the same atomic dis-
placements as those responsible for the appearance of spontaneous polarization. When the
temperature approaches the Curie temperature Tc, the soft-mode frequency tends to zero,
becoming frozen in the crystal, which transforms to the ferroelectric phase.10, thus the soft
mode instability at Tc causes the ferroelectric phase transition. The soft mode behavior is
related to such properties of ferroelectric materials as high dielectric constant, large piezo-
electric coefficients, dielectric nonlinearity, which are extremely important for technological
applications. Lyddane-Sachs-Teller (LST) relation connects the macroscopic dielectric con-
2
This is an author-produced, peer-reviewed version of this article. The final, definitive version of this document can be found online at Journal of the American Ceramic Society, published by Blackwell Publishing. Copyright restrictions may apply. doi: 10.1111/j.1551-2916.2008.02371.x
stants of a material with its microscopic properties - optical phonon frequencies:
ε0 = ε∞∏ ω2
LOj
ω2TOj
(1)
where ε0 and ε∞ are the static and high-frequency dielectric constants, ωLO and ωTO)
are the frequencies of longitudinal and transverse optical phonons, respectively. Usually the
frequencies of higher optical phonons vary slightly with temperature, and the temperature
dependence of ε0 is mostly determined by the behavior of the soft mode. The decrease of the
soft mode frequency as the temperature approaches to Tc causes a dramatic increase of the
dielectric constant. The soft-mode behavior is also responsible for the dielectric nonlinearity,
i. e. the electric-field dependence of ε0. The electric field-induced hardening, i.e. the increase
of the soft mode frequency ωTO, according to the LST relation, leads to the decrease of ε0.
Another important materials parameter for applications, the dielectric loss, is also related to
the soft mode behavior. In an ideal ferroelectric crystal, it is determined by the damping of
the soft mode through multiple-phonon processes in the paraelectric phase, and dominated
by the quasi-Debye contribution in the ferroelectric phase.11–13.
Lattice dynamics in bulk perovskite oxide ferroelectrics has been investigated for several
decades using neutron scattering,15–20, far infrared spectroscopy,21–23 and Raman scatter-
ing. Raman spectroscopy is one of the most powerful analytical techniques for studying the
lattice vibrations and other elementary excitations in materials providing important infor-
mation about the structure, composition, strain, defects, phase transitions. This technique
was successfully applied to bulk perovskite oxides, such as barium titanate, BaTiO3,24–31
strontium titanate, SrTiO3,32–34 lead titanate, PbTiO3.
35
Study of lattice dynamics in ferroelectric thin films and nanostructures is a challenging
task. A difficulty in applying conventional Raman spectroscopy for thin films of ferroelectrics
and other wide-bandgap materials lies in the fact that the visible photon energy is much
smaller than the bandgap. Consequently, the absorption of light is extremely weak and the
penetration depth is large, allowing light to travel through thin film into the much thicker
substrate. Much larger scattering volume of the substrate thus generates overwhelming sig-
nals in the Raman spectra. Several approaches were used to overcome this difficulty. In
previous Raman studies of ferroelectric thin films, the films were grown either on reflective
substrates, such as Pt/Si,36 or on substrates with low Raman activity at the frequency of
3
This is an author-produced, peer-reviewed version of this article. The final, definitive version of this document can be found online at Journal of the American Ceramic Society, published by Blackwell Publishing. Copyright restrictions may apply. doi: 10.1111/j.1551-2916.2008.02371.x
interest, such as Al2O3,37,38 KTaO3,
39, fused silica,40, and MgO.40–44 But for many applica-
tions these are not the substrates of choice in terms of growth of high-quality defect-free
epitaxial films and structures because of lattice and thermal expansion mismatch problems,
and the crystalline quality of the ferroelectric thin films is often compromised. In our stud-
ies of relatively thick (over 100 nm) SrTiO3, BaTiO3, BaxSr1−xTiO3 films we employed the
metal-oxide bilayer technique using an opaque layer of a conductive oxide, such as SrRuO3
to eliminate the substrate contribution.45–51 In contrast to thin film growth on substrates
like Pt/Si or Al2O3, the metaloxide layer allows the growth of the epitaxial ferroelectric
thin films with significantly higher structural quality. This technique was also successfully
applied for study of the soft modes in SrTiO3 films by far infrared ellipsometry.52
However, for ultrathin films (less than 100 nm) and nanostructures, another approach is
required. In such thin films, the intensity of Raman scattering using conventional (visible)
excitation sources is extremely low, and even weak signal from the conductive oxide layer
used to block the substrate can prevent the observation of the phonons of the nanometer-
thick film. We have recently demonstrated that Raman spectroscopy using an ultraviolet
(UV) excitation can be successfully applied for studies of nanoscale ferroelectrics.53 In the
present paper we summarize our recent results on Raman spectroscopy of thin films of
SrTiO3, BaTiO3, BaxSr1−xTiO3, obtained using the metaloxide bilayer technique, and first
UV Raman results on BaTiO3/SrTiO3 periodic multilayer structures - superlattices.
II. PHONONS IN BULK BATIO3, SRTIO3 AND BAxSR1−xTIO3
Bulk BaTiO3, SrTiO3 and their solid solution BaxSr1−xTiO3 have the same cubic per-
ovskite structure in the high-temperature phase. The pure compounds, BaTiO3 and SrTiO3
exhibit different behaviors at lower temperatures. BaTiO3 undergoes 3 consecutive phase
transitions from a cubic m3m to a tetragonal 4mm phase at 403 K, then to an orthorhombic
mm2 phase at 278 K, and, finally, to a rhombohedral 3m phase at 183 K.14 The three low-
temperature phases are ferroelectric. In bulk BaxSr1−xTiO3 of Ba-rich compositions these
three ferroelectric phases also exist, but the temperatures of three phase transitions decrease
nearly linearly with decreasing x and coincide at about 100 K and x ≈ 0.15.54 For lower Ba
concentrations only one ferroelectric phase exists, which disappears at x < 0.035.54 Bulk
SrTiO3 is an incipient ferroelectric (quantum paraelectric), in which the ferroelectric phase
4
This is an author-produced, peer-reviewed version of this article. The final, definitive version of this document can be found online at Journal of the American Ceramic Society, published by Blackwell Publishing. Copyright restrictions may apply. doi: 10.1111/j.1551-2916.2008.02371.x

transition is suppressed by quantum fluctuations.55 An antiferrodistortive cubic-tetragonal
phase transition occurs in SrTiO3 at 105 K, which involves the rotation of the Ti-O octa-
hedra. The resulting tetragonal structure 4/mmm is still centrosymmetric and, hence, not
ferroelectric. The transition to the ferroelectric phase can be induced by doping,56,57 isotope
substitution,58 or stress.59–61
The perovskite structure has 5 atoms per unit cell, therefore, there are 12 optical vibra-
tional modes. In the cubic phase m3m the zone center optical phonons belong to 3F1u +F2u
irreducible representations. Each of the Fu modes is triply degenerate, and all of them are
of odd parity with respect to the inversion, therefore, forbidden in the first order Raman
scattering. The F1u modes are infrared active, while the F2u modes are silent. When the tem-
perature decreases, BaxSr1−xTiO3 becomes ferroelectric for x ≥ 0.035,54 thus breaking the
inversion symmetry, and the Raman-active modes appear. Upon transition from the cubic
to the tetragonal phase the F1u modes split into A1 and E modes, and the F2u phonons gives
rise to B1 and E modes. The E modes are doubly degenerate. In the orthorhombic phase
the optical phonons belong to A1, A2, B1, and B2 symmetry. In the lowest-temperature,
rhombohedral phase, the modes, originating from the cubic F1u phonons are split into A1
and E modes, while the F2u vibrations produce A2 and E modes. The symmetric A1 and E
modes are Raman-active. For the A1 phonons the atomic displacements are parallel to the
z axis (polar axis in the ferroelectric phases), while for the E modes atoms vibrate in the
xy plane perpendicular to the polar axis. Also, in polar crystals, to which barium strontium
titanate belongs, long-range electrostatic interaction results in additional splitting of each
optical phonon branch into transverse (TO) and longitudinal (LO) modes.
In BaTiO3, the F1u soft mode is heavily overdamped in the paraelectric cubic phase.25–27
(The term ”overdamping” usually implies the ratio Γ/ω >√
2, where Γ is the phonon mode
linewidth, and ω is the mode frequency. Upon this condition there is no distinct peak at
finite frequency in Raman spectra.) In the tetragonal phase, the E component of the soft
mode remains overdamped.25–27 In the orthorhombic phase, Laabidi et al.62 reported the
damping of the soft mode to decrease, so the mode becomes underdamped below 253 K.
At the transition to the rhombohedral phase, according to Laabidi et al.62 the soft mode
abruptly stiffens up to ∼ 200 cm−1. This heavy overdamping of the soft mode in BaTiO3
has been attributed to the order-disorder character of the ferroelectric phase transition in
this material. For a long time since the discovery of ferroelectricity, barium titanate had
5
This is an author-produced, peer-reviewed version of this article. The final, definitive version of this document can be found online at Journal of the American Ceramic Society, published by Blackwell Publishing. Copyright restrictions may apply. doi: 10.1111/j.1551-2916.2008.02371.x

been considered as an example of displacive ferroelectrics,9 supported by earlier neutron,63
Raman 25–27 and hyper-Raman 28 experiments, which demonstrated the existence of the soft
TO phonon mode and its softening in the paraelectric phase with decreasing the temperature.
However, the soft mode becomes highly overdamped near the Curie temperature, and its
frequency does not extrapolate to zero at Tc. A discrepancy was observed near Tc between
the dielectric constant obtained from capacitance measurements and from the soft mode
frequencies via the LST relation.
The order-disorder picture was initially suggested for BaTiO3 in order to explain the
observation of strong diffusive x-ray scattering.64 It was later supported by the observation
of the symmetry-forbidden first-order Raman lines above Tc, in the cubic phase, and by
electronic paramagnetic resonance (EPR) studies.65 An eight-site order-disorder model was
proposed, in which the Ti ions in the paraelectric phase do not reside in the center of the
cubic unit cell. Instead there are eight equivalent off-center energy minima located along
[111] directions. In the high-temperature phase all sites are occupied by Ti ion with equal
probability, and the average symmetry is cubic. Four sites become preferentially occupied
in the tetragonal phase, only two nearest-neighbor sites are the most probably occupied in
the orthorhombic phase, and only one site remains occupied in rhombohedral phase. The
ab initio calculations of the total energy as a function of Ti ion displacements 66 in the cubic
phase show the presence of absolute energy minima at the [111] off-center positions, while
local (higher energy) minima exist for [100] displacements. The low-frequency (∼108 Hz)
motion of Ti ion between equivalent off-center cites was suggested to be responsible for
the discrepancy between the dielectric constant and soft mode behavior near the Curie
temperature. This relaxational motion leads to the appearance of intensive low-frequency
near-excitation scattering in Raman spectra (so called central peak). The observation of
a central peak in the Raman spectra of BaTiO367,68 provided the evidence of such a slow
relaxational motion. Later femtosecond time-resolved stimulated Raman measurements 69
allowed to distinguish between overdamped soft modes and relaxational modes.
Recent nuclear magnetic resonance studies 70 demonstrated the coexistence of both dis-
placive and order-disorder components in the phase transition mechanism in BaTiO3 and
the breakdown of local cubic symmetry due to the motion of Ti ions between off-center
sites in the paraelectric phase. Theoretical models were developed 71–74 which describe the
dynamics of ions in BaTiO3 as consisting of two components with different time scale: rapid
6
This is an author-produced, peer-reviewed version of this article. The final, definitive version of this document can be found online at Journal of the American Ceramic Society, published by Blackwell Publishing. Copyright restrictions may apply. doi: 10.1111/j.1551-2916.2008.02371.x
vibrations associated with the soft phonons and slow relaxational modes. In intermediate
ferroelectrics like BaTiO3 there is strong coupling between the soft and relaxational modes,
probably leading to overdamping of the soft mode. First-principles theory of ferroelectric
phase transitions for BaTiO375 also shows the phase transitions to be intermediate between
order-disorder and displacive character.
In contrast to BaTiO3, SrTiO3 remains paraelectric at all temperatures, and the zone-
center optical phonons remain Raman inactive. The spectrum of SrTiO3 crystal is dominated
by the second order features. Application of an electric field breaks the inversion symmetry,
thus allowing the observation of the soft mode by Raman scattering.33 The soft mode is
well-defined and does not tend to zero as temperature decreases, saturating at ∼32 K due
to quantum fluctuations. The soft mode in SrTiO3 exhibits no overdamping over the entire
temperature range, and excellent agreement is observed between the dielectric constant and
the soft mode, both in temperature and electric field dependence.33 No significant disor-
der effects have been observed in SrTiO3, and therefore it is considered as predominantly
displacive-type ferroelectric. Due to the antiferrodistortive phase transition at 105 K, sharp
peaks of R modes, which are the zone-edge (R point) phonons, become Raman active via
double folding of the Brillouin zone.32
As compared to pure BaTiO3 and SrTiO3, only few studies of lattice dynamics of bulk
BaxSr1−xTiO3 were published, despite the large number of studies dealing with the proper-
ties of this technologically important material. For BaxSr1−xTiO3 ceramics the concentration
dependence of phonon frequencies at the temperature of 6 K was reported76. Kuo et al.77 re-
ported combined Raman and X-ray diffraction studies of polycrystalline BaxSr1−xTiO3 sam-
ples in the entire composition range, but only at room temperature. Dobal et al.78 and Naik
et al.79 studied Raman spectra of bulk ceramic and thin-film polycrystalline BaxSr1−xTiO3
with large x (x = 0.65−1.0) at elevated temperatures focusing on the cubic-tetragonal phase
transition temperature as a function of composition x. In these Ba-rich compositions, the
authors observed broad first-order Raman features well beyond Tc, similar to the behavior
of pure BaTiO3. The loss of intensity of several tetragonal-phase phonon modes was used
to determine the ferroelectric to paraelectric phase-transition temperatures.
There has been lack of literature data on BaxSr1−xTiO3 single crystals, which is likely
due to the difficulties in growing high purity crystals. We reported a detailed Raman study
of BaxSr1−xTiO3 single crystals with different compositions (x = 0, 0.05, 0.1, 0.2, 0.35, 0.5,
7
This is an author-produced, peer-reviewed version of this article. The final, definitive version of this document can be found online at Journal of the American Ceramic Society, published by Blackwell Publishing. Copyright restrictions may apply. doi: 10.1111/j.1551-2916.2008.02371.x

and 1) and measured between 5–300 K.80 The BaxSr1−xTiO3 single crystals for this study
were grown by laser-heated pedestal growth technique.81 Addition of Ba to SrTiO3 changes
the Raman spectra lattice dynamics significantly. Already for x = 0.05 the crystal becomes
ferroelectric at about 60 K and Tc increases with x. Consequently, the low temperature
Raman spectra of BaxSr1−xTiO3 crystals are dominated by the first order peaks. Two
distinct lines of the TO1 phonons, the soft modes of A and E symmetries, are seen in the
low-frequency range (See Fig. 1(a), their frequencies depend strongly on temperature and
composition (Fig. 1(b)). Figure 2 shows the variation of the hard mode frequencies with Ba
content x at T = 5 K.
The two components of the TO1 soft phonon, the E and A1 modes have been observed
at low temperatures for all BaxSr1−xTiO3 compositions studied. We found that for low Ba
content (x < 0.2) the soft modes extrapolate to zero at Tc and remain underdamped, indicat-
ing a displacive type of the ferroelectric phase transition. Heavy damping of the soft mode
and the intensive low-frequency Raman scattering related to the order-disorder behavior are
observed in BaxSr1−xTiO3 crystals with x ≥ 0.2 in the temperature and composition range
of the orthorhombic and tetragonal phases. There is no soft mode overdamping in the rhom-
bohedral phase, which is completely ordered. No first-order Raman scattering in the cubic
phase of BaxSr1−xTiO3 is observed for all compositions studied (x ≤ 0.5), in contrast to
pure BaTiO3. Therefore, we conclude that the behavior characteristic for the order-disorder
phase transitions becomes less noticeable with decreasing Ba content, and BaxSr1−xTiO3
with x <∼ 0.2 can be considered as predominantly displacive type ferroelectrics with single
ferroelectric phase and well-defined soft mode in the entire temperature range. Also, it can
be seen on Fig. 1 that the TO1 A1 soft mode frequency decreases significantly and tends
to merge with the E mode when temperature approaches Tc from below in BaxSr1−xTiO3
crystals with x ≤ 0.2, but the A1 mode shows much less softening in crystals with higher
Ba content. This indicates that the polarization is discontinuous at Tc in crystals with
x > 0.2, but the discontinuity apparently disappears for smaller x, i.e. the ferroelectric
phase transition known to be of the first order for pure BaTiO3, is also of the first order
in BaxSr1−xTiO3 with high Ba content, but turns into the second order for x < 0.2. These
single crystal results can be used as a reference point for the understanding of the lattice
dynamical properties in BaxSr1−xTiO3 ceramics, thin films and nanostructures.
8
This is an author-produced, peer-reviewed version of this article. The final, definitive version of this document can be found online at Journal of the American Ceramic Society, published by Blackwell Publishing. Copyright restrictions may apply. doi: 10.1111/j.1551-2916.2008.02371.x

III. RAMAN SPECTROSCOPY OF FERROELECTRIC THIN FILMS USING
CONDUCTIVE OXIDE LAYERS
In this section we review the results of Raman spectroscopy of SrTiO3, BaxSr1−xTiO3,
and BaTiO3 films, obtained using the metal-oxide bilayer technique.45,46 The films studied
were grown by pulsed laser deposition on SrTiO3 and LaAlO3 (LAO) substrates. A KrF
excimer laser operating at the wavelength of 248 nm was used for the deposition. Between the
substrate and BaxSr1−xTiO3 film a 0.3µm-thick conducting layer of SrRuO3 was deposited
to screen the Raman signal from the substrate. Visible light (mostly 514.5 nm line of Argon
ion laser) was used for excitation. The thickness of all BaTiO3 and BaxSr1−xTiO3 films
and most of SrTiO3 studied was 1µm, but for some SrTiO3 films varied from 0.5 to 2.3µm.
These studies revealed essential differences in the lattice dynamical properties of SrTiO3,
BaxSr1−xTiO3 thin films compared to single crystals.
A. SrTiO3 films
Raman spectra of SrTiO3 thin films obtained using the metal-oxide bilayer technique are
very different from those of bulk SrTiO3 crystals.46 In Fig. 3, the spectra for three SrTiO3
films of different thicknesses measured at T = 5K are shown together with the spectrum of an
SrTiO3 single crystal. By comparing with the hyper-Raman results of bulk single crystals,34,
the strong peaks at 170 and 545 cm−1 were identified as due to the TO2 and TO4 phonons,
respectively, and the weak peak at 264 cm−1 - to the silent TO3 mode. These peaks can be
observed up to room temperature. In contrast, the Raman spectrum of the SrTiO3 single
crystal is characterized by the second-order scattering features and the structural modes.
(Weak TO2 and TO4 peaks can also be seen in the single crystal spectrum, likely due to the
impurities in the sample). The appearance of the strong first-order TO phonon peaks in the
thin film spectra indicates a lowering of the crystal symmetry in the films. (Spectra contain
also peaks due to the SrRuO3 buffer layers at 98, 130, 230, 252, 361,393, and 412 cm−1,
which are marked by stars. The same lines were observed in the spectra of bare SrRuO3
films and also reported in the literature.82 Similar peaks have also been observed in the
spectra of BaSrTiO3 films grown on SrRuO3 buffer layers bilayer structures, described in
the next subsection.)
9
This is an author-produced, peer-reviewed version of this article. The final, definitive version of this document can be found online at Journal of the American Ceramic Society, published by Blackwell Publishing. Copyright restrictions may apply. doi: 10.1111/j.1551-2916.2008.02371.x
The metal-oxide bilayer method was also employed for studies of SrTiO3 films by far-
infrared ellipsometry using synchrotron radiation.52 This technique combines ellipsometry
with the high brightness of the synchrotron radiation, and provides a powerful capability
to measure vibrational properties with high reliability and accuracy. The soft TO1 phonon
modes were clearly observed along with other TO modes. The soft phonon frequency square,
ω2TO1 is plotted as a function of temperature in Fig. 4, which also shows the inverse dielectric
constant, 1/ε0, as obtained from the low-frequency dielectric measurements. The results
for a SrTiO3 film and a SrTiO3 single crystal are displayed for comparison. As shown by
Fig. 4(a), the frequency of the soft-mode decreases as the temperature is lowered. However,
in clear contrast to the bulk crystals where the frequency of the TO1 phonon mode saturates
at 13 cm−1 at low temperature,83 in our SrTiO3 thin film the TO1 frequency remains fairly
high and saturates at 62 cm−1. Since the frequencies of the hard modes (the phonons other
than the soft mode) change only weakly with temperature and are completely the same as
those in the bulk SrTiO3, a higher soft-mode frequency at low temperatures should lead to a
lower the static dielectric constant ε0, which is indeed observed as shown by Fig. 4(b). This
observation demonstrates that the primary reason for low dielectric constant in SrTiO3 thin
films is the soft mode hardening.
Studies of the response of the soft mode to external electric field proved to be very helpful
for the understanding of the different field tuning behaviors of ε0 in SrTiO3 thin films and
crystals. In SrTiO3 single crystals, the dielectric nonlinearity vanishes above T∼ 80 K 84
but in thin films, it remains non-zero even at room temperature.85 Fig. 5 shows Raman
spectra of SrTiO3 thin films obtained at 10 K with and without application of external
electric field.47 The phonon frequencies determined by Raman scattering are similar to the
results of FTIR ellipsometry. Raman spectrum at zero field contains a strong peak at about
40 cm−1 originated from the Eu component of the soft mode (labelled E). Application of the
external electric field leads to appearance of the A2u component of the soft mode (labelled
A). The splitting between the A and E components od the soft mode at low temperatures
and in the absence of electric field is induced by the tetragonal distortion (antiferrodistortive
transition). The soft mode frequency in the film is higher at low temperature than that in
bulk SrTiO3 crystals, in a quantitative agreement with the LST formalism.
Raman spectra of SrTiO3 films measured as a function of external electric field show
that the soft mode frequency increases when an electric field is applied, and the electric field
10
This is an author-produced, peer-reviewed version of this article. The final, definitive version of this document can be found online at Journal of the American Ceramic Society, published by Blackwell Publishing. Copyright restrictions may apply. doi: 10.1111/j.1551-2916.2008.02371.x
induced soft-mode hardening is observed in the entire temperature range of the measurement,
as shown on Fig. 6 Observed electric-field and temperature dependencies for ε0 and 1/ω2TO1
are remarkably similar.47 Hence the mechanism of electric-field tunability of the dielectric
constant in the SrTiO3 films is, as in the bulk, the field induced hardening of the soft mode.
The difference in the dielectric nonlinearity in thin films and bulk crystals is due to the
different soft-mode properties and their responses to the external electric field.
Petzelt et al.86–88 studied SrTiO3 ceramics, SrTiO3 and BaxSr1−xTiO3 films by Fourier
transform infrared and Raman spectroscopy. They also observed important differences in
the soft mode behavior of thin films compared to the bulk crystals, such as the soft mode
hardening in thin films and presence of the symmetry-forbidden first order Raman peaks in
the spectra of paraelectric phase. Similarly to SrTiO3 films, the lattice dynamical properties
of BaxSr1−xTiO3 films were found to be essentially different from bulk BaxSr1−xTiO3, as
discussed in the next subsection.
B. BaxSr1−xTiO3 films
There have been several Raman studies of BaxSr1−xTiO3 thin films, whose lattice dy-
namical properties are influenced by strain and defects in the films. Yuzyuk et al.41–44
reported several Raman studies of Ba-rich (x ≥ 0.55) BaxSr1−xTiO3 films grown on MgO
substrates, focusing mainly on the strain effects on the ferroelectric phase transitions in
films. They observed the soft phonon modes of thin films and studied the influence of com-
position variation on the soft modes. Kim et al.89 investigated the effect of crystallinity on
the microwave dielectric losses in BaxSr1−xTiO3 films and found the correlation between the
increased dielectric loss and the symmetry-breaking defects evidenced by Raman spectra.
We conducted a detailed Raman study of vibrational spectra of BaxSr1−xTiO3 films
with Ba contents x varied from 0.05 to 0.5 in comparison with single crystals of the same
compositions.49,51 The films were grown by pulsed laser deposition on SrTiO3 substrates
covered by 0.3µm-thick conducting SrRuO3 layers. Temperature dependence of the phonon
frequencies and intensities was investigated, with particular emphasis on the soft mode
behavior. Significant differences in the soft mode behavior of the thin films and crystals
are observed. We compare the vibrational properties of the BaxSr1−xTiO3 films with those
of relaxor ferroelectrics, recently studied by inelastic neutron scattering.90,91 Remarkable
11
This is an author-produced, peer-reviewed version of this article. The final, definitive version of this document can be found online at Journal of the American Ceramic Society, published by Blackwell Publishing. Copyright restrictions may apply. doi: 10.1111/j.1551-2916.2008.02371.x

similarities are found between BaxSr1−xTiO3 thin films and relaxors, which are explained
by the existence of polar nanoregions in the BaxSr1−xTiO3 thin films, analogously to those
in relaxors.
All the BaxSr1−xTiO3 compositions studied are paraelectric at room temperature.54 All
the zone-center optical phonon modes are forbidden in the first order Raman scattering in
the cubic m3m phase, but become Raman-active upon transition into a ferroelectric phase.
Fig. 7 shows the Raman spectra for a film and a crystal with x = 0.2 at 200 and 10 K, above
and below the ferroelectric phase transition (120 K in the bulk54). At low temperatures the
spectra of both single crystal and film contain the lines of hard phonon modes (178, 276, and
542 cm−1 in the film and 174, 275, 541 cm−1 in the crystal). These lines are attributed to
the mixed TO2+LO1, TO3+LO2, and TO4 phonon modes, respectively. Similar lines were
observed for SrTiO3 films,46 as discussed in the previous subsection. Above the ferroelectric
phase transition the first order Raman lines disappear from the single crystal spectra, which
contain only the broad features of the second order Raman scattering. However, in thin films
the first order Raman lines are still seen even when the temperature is well above the phase
transition, in violation of the symmetry selection rules. The same behavior was observed in
films of all Ba concentrations studied.
Two lines of the TO1 A1 and E soft modes were observed at low temperatures in the
low-frequency spectral region of both crystals and films of all compositions studied, as shown
in Fig. 7 for Ba0.2Sr0.8TiO3. They originate from the triple degenerated soft phonon of F1u
symmetry in the cubic phase. The A1 mode appears in the ferroelectric phase only, which
is used to determine the ferroelectric transition temperature. It has atomic displacements
parallel to the z axis, and its frequency is related to the spontaneous polarization. The
lowest-frequency mode, E soft mode has atomic displacements perpendicular to the polar-
ization axis z, and the square of its frequency is inversely proportional to the dielectric
constant in the xy plane.26,27 It transforms continuously to the F1u mode of the cubic phase
when the temperature is increased to above the ferroelectric transition. The soft modes
in BaxSr1−xTiO3 films appear at significantly higher frequencies than in single crystals. In
crystals the soft mode frequencies decrease rapidly as the temperature approaches the ferro-
electric phase transition from below. In films the soft modes show much less softening.49,51
Similarly to the SrTiO3 films discussed above, there are important differences in the
phonon spectra of BaxSr1−xTiO3 films compared to the single crystals, such as the soft
12
This is an author-produced, peer-reviewed version of this article. The final, definitive version of this document can be found online at Journal of the American Ceramic Society, published by Blackwell Publishing. Copyright restrictions may apply. doi: 10.1111/j.1551-2916.2008.02371.x

mode hardening and the presence of the first-order Raman peaks in the spectra of films
at the temperatures above the ferroelectric phase transition temperature, indicating the
breakdown of the inversion symmetry. The same behavior was observed in films of all Ba
concentrations studied. Another difference in the soft mode behavior of BaxSr1−xTiO3 films
and crystals appears when considering the E soft mode damping. For larger Ba compositions
(x ≥ 0.2), both in crystals and films the E soft modes are not observable near the ferroelectric
transition due to overdamping. The latter term means that the phonon linewidth is higher
than the mode frequency itself, so there is no distinct peak at finite frequency in Raman
spectra. The overdamping in Ba0.2Sr0.8TiO3 crystal and film is illustrated in Fig. 8, showing
the temperature dependence of the linewidth (damping) for the E soft mode shown in in
comparison with the mode frequency. As one can see, the range of the soft mode overdamping
is significantly broader in the film compared to the single crystal.
The soft mode mode is known to be heavily overdamped in pure bulk BaTiO3 at the
temperatures around Tc25–27 due to the order-disorder character of the ferroelectric phase
transition and the existence of so called central peak.66–68,71,73 Similar behavior is expectable
to take place in BaxSr1−xTiO3, especially for Ba-rich compositions. Indeed, we have observed
the soft mode overdamping in BaxSr1−xTiO3 crystals and films with x ≥ 0.2, but there is a
quantitative difference between the films and crystals. In Fig. 9, the range of overdamping
is shown for both thin films (vertical error bars) and single crystals (shaded area) in com-
parison with the phase diagram for bulk BaxSr1−xTiO3.54 The ferroelectric phase transition
temperatures shown here are determined by the disappearance of the A1 soft mode. As can
be seen on the Fig.9, the overdamping in the crystals occurs mainly in the orthorhombic
and tetragonal phases. The E soft mode is not overdamped in the rhombohedral phase, and
there is no Raman-active modes above Tc in the cubic phase. The range of overdamping
is significantly broader in the films. This fact suggests that there are additional damping
mechanisms in the films that are not present in the single crystals.
In order to explain the specific features of lattice vibrations in BaxSr1−xTiO3 films, mak-
ing them essentially different from the bulk crystals, let us consider briefly the lattice dy-
namics behavior in relaxor ferroelectrics. Recently the lattice dynamics was studied by
inelastic neutron scattering in relaxors, such as Pb(Zn1/3)Nb2/3)1−xTixO3 (PZN-xPT)92 and
Pb(Mg1/3Nb2/3)O3 (PMN).90,91,93 The results of these studies, demonstrating the specific
behavior of the soft phonon modes, supported the idea of polar nanoregions (PNR) in re-
13
This is an author-produced, peer-reviewed version of this article. The final, definitive version of this document can be found online at Journal of the American Ceramic Society, published by Blackwell Publishing. Copyright restrictions may apply. doi: 10.1111/j.1551-2916.2008.02371.x

laxors. PNR are the nanometer-size regions of randomly oriented polarization, embedded in
the non-polar background, giving rise to broad maxima in the temperature dependence of
the dielectric constant with a characteristic frequency dependence.94,95 Burns and Dacol 95
demonstrated that a randomly oriented local polarization starts to develop at a certain tem-
perature Td (the Burns temperature), several hundred degrees above the temperature of the
dielectric constant maximum.
The neutron scattering results 90,91 show that the soft mode in PMN is overdamped in a
broad temperature range, but it is well resolved above the Burns temperature Td and below
a temperature coincident with the field-induced ferroelectric transition temperature. The
observed soft mode exhibits a normal ferroelectric behavior, i.e. the square of its frequency
decreases linearly as the temperature approaches the phase transition.90,91 These behaviors
are strikingly similar to the results on BaxSr1−xTiO3 films described in the present paper.
The soft mode overdamping, as well as the anomalous TA-phonon broadening in PMN 91,93
was attributed to the presence of polar nanoregions, which couple strongly with the polar soft
modes.91,95 We suggest that the similarities between the soft mode behaviors in bulk relaxor
ferroelectrics and thin films of classical ferroelectric BaxSr1−xTiO3 indicate that the PNR also
exist in BaxSr1−xTiO3 films in a broad temperature range. Strong coupling of the PNR with
the polar soft phonons causes the damping in addition to the intrinsic damping mechanism
in BaxSr1−xTiO3 due to the order-disorder behavior. Electric field associated with PNR
causes the increase of the soft mode frequencies in the BaxSr1−xTiO3 films compared to
single crystals, similarly to the soft mode hardening induced by external electric field in
SrTiO3.33,47 Also, the PNR locally break the inversion symmetry in BaxSr1−xTiO3 films,
making the first order Raman scattering possible at temperatures above the ferroelectric
phase transition.
The analogy in the lattice dynamics behavior of BaxSr1−xTiO3 films and relaxor fer-
roelectric PMN is illustrated in the Fig. 10. Both relaxors and BaxSr1−xTiO3 films are
characterized by a broad maximum in the temperature dependence of the dielectric con-
stant. For PMN, the deviation of ε from the Curie-Weiss behavior occurs below the Burns
temperature,96 which is much higher than the maximum in the ε(T ) dependence. Below
Td correlations between PNR become important.96 Analogous behaviors are observed in
BaxSr1−xTiO3 films as demonstrated in Fig. 10(a), the temperature dependence of ε−1 for
Ba0.2Sr0.8TiO3, which is very similar to the ε−1(T ) dependence for PMN (Fig. 2 in the paper
14
This is an author-produced, peer-reviewed version of this article. The final, definitive version of this document can be found online at Journal of the American Ceramic Society, published by Blackwell Publishing. Copyright restrictions may apply. doi: 10.1111/j.1551-2916.2008.02371.x
by Vieland et al.96). As in PMN, ε(T ) in BaxSr1−xTiO3 films deviates from the Curie-Weiss
law below a temperature Td, which is much higher than the maximum of ε(T ).
Fig. 10(b) shows the temperature dependence of ω2TO, the square of the E or F1u soft mode
frequency. Comparing the figures 10 (a) and (b), one can see that above Td the dielectric
constant is inversely proportional to ω2TO following the Lyddane-Sachs-Teller relation. The
soft mode becomes overdamped below Td, but is recovered at low temperatures, as shown
on Fig. 10(c). Again, this behavior is very similar to that of PMN (Fig.4(a) from Ref. 9).
The existence of polar nanoregions in ferroelectric films explains also the observations
of the first order Raman scattering in SrTiO3 films,46,47 and the earlier results obtained
on KTaO3 crystals doped with Li and Nb. Pure KTaO3, like SrTiO3 is incipient ferro-
electric, which remains in the cubic paraelectric state down to low temperatures and has
no Raman-active phonon modes. In doped KTaO3, the observations of the first order Ra-
man scattering,97 the soft mode hardening, and the increased damping 98 were attributed
to the presence of PNR induced by off-center Li and Nb ions. In BaxSr1−xTiO3 films, re-
cent investigations by time-resolved confocal scanning optical microscopy demonstrated the
polarization reorientation of the polar nanoregions under electric field 99 and a strong dis-
persion of microwave dielectric response due to the size-dependent relaxation frequencies of
PNR.100 The similarities in the lattice dynamical properties between BaxSr1−xTiO3 films and
relaxor ferroelectric PMN provide further evidences to the importance of polar nanoregions
in determining the properties of ferroelectric thin films.
The characteristic feature of relaxor ferroelectrics is the frequency dispersion of
temperature-dependent dielectric susceptibility in the hertz-gigahertz range.94 An important
difference between relaxors and BaxSr1−xTiO3 thin films is the absence of such a dispersion
in BaxSr1−xTiO3 films. This may be due to the different structure and size of PNR, and
strain in thin films, which influence the polarization dynamics in PNR. In relaxors the for-
mation of PNR is caused by the compositional heterogeneity resulting from the B site being
occupied by ions of different valence (either Mg2+ or Zn2+, and Nb5+).94 In BaxSr1−xTiO3
films the origin of the PNR is more likely polar grain boundaries, oxygen vacancies and
inhomogeneous strain. It should be noted that dielectric dispersion in BaxSr1−xTiO3 films
has been observed in the terahertz range by Hubert et al. in resemblance with those of
relaxors.100
Several possible causes for the formation of the polar nanoregions in ferroelectric thin films
15
This is an author-produced, peer-reviewed version of this article. The final, definitive version of this document can be found online at Journal of the American Ceramic Society, published by Blackwell Publishing. Copyright restrictions may apply. doi: 10.1111/j.1551-2916.2008.02371.x
were suggested. In polycrystalline SrTiO3 films Ostapchuk et al.88 observed such defects
as porosity and cracks along the grain boundaries and suggested these defects to cause the
appearance of of symmetry forbidden Raman peaks and soft mode hardening. However, these
defects were not found in epitaxial films studied by Sirenko et al.46,47,52, as demonstrated by
Wu et al.101 Another cause for the appearance of polar nanoregions proposed by Petzelt et
al.86 for SrTiO3 ceramics is the presence of dipoles localized at the grain boundaries, which
can explain the observed soft mode hardening and presence of the symmetry-forbidden first
order Raman peaks in the spectra of epitaxial SrTiO3 films. Other factors that can cause
thin film properties to be different from bulk, include nonstoichiometry, inhomogeneous
strain distribution, impurities and oxygen vacancies, which are among the most common
defects in oxide thin films.102 Uwe et al. have shown that introducing oxygen vacancies
into a nominally pure SrTiO3 crystal leads to appearance of local regions of ferroelectric
polarization.103 Infrared reflectance studies of highly reduced SrTiO3 showed the presence of
oxygen vacancies to cause hardening of the TO phonon.104 It is important to know, which
of these factors plays a more significant role in determining the thin films behavior.
In order to investigate the effect of oxygen vacancies on the lattice dynamics of SrTiO3, we
have studied oxygen reduced SrTiO3 single crystals by Raman spectroscopy.105 Comparing
the Raman spectra of reduced SrTiO3 crystals and SrTiO3 films, we found that both in
films and reduced SrTiO3 there are first order peaks of SrTiO3 phonons. This indicates
that there are local regions where the inversion symmetry is broken, and SrTiO3 phonons
become Raman active. In reduced SrTiO3, the oxygen vacancies, being polar defects, are
responsible for the appearance of the polar regions. However, in reduced SrTiO3 the first
order Raman peaks appear at rather high vacancy concentrations, where SrTiO3 becomes
conductive. The appearance of the first-order phonon lines is accompanied by the peaks of
local vibrational modes associated with oxygen vacancies.105 The latter modes have not been
observed in SrTiO3 films, which are still insulating.85 Therefore, we conclude that although
oxygen vacancies do cause the formation of polar nanoregions, in thin films the vacancy
concentration is not high enough to cause such intensive first order Raman scattering. There
must be another or additional cause for polar regions in SrTiO3 films. Polar impurities may
lead to similar effects, but very high doping levels are needed (tenths of %) to induce a
significant first order Raman scattering,106,107, which is unlikely in nominally undoped films
we studied. Sr/Ti non-stoichiometry could be another possible factor, but it is difficult to
16
This is an author-produced, peer-reviewed version of this article. The final, definitive version of this document can be found online at Journal of the American Ceramic Society, published by Blackwell Publishing. Copyright restrictions may apply. doi: 10.1111/j.1551-2916.2008.02371.x

prove the existence of a small amount of non-stoichiometry in thin films.
Strain in thin epitaxial films can be an important factor strongly affecting their
properties108 Transmission electron microscopy (TEM) studies were performed on
SrTiO3/SrRuO3 epitaxial bilayers grown on LaAlO3 substrates,101 which Raman spectra
are similar to those of SrTiO3/SrRuO3 films on SrTiO3. TEM results demonstrate that the
lattice mismatch between the substrate and the SrRuO3 layer is mostly relaxed by dislo-
cations in the vicinity of the SrRuO3/substrate interface, although some defects propagate
through the SrRuO3 layer and reach the SrRuO3/SrTiO3 interface, resulting in defects in
the SrTiO3 layers.101 The lattice mismatch between SrRuO3 and SrTiO3 (0.64%) is small
compared to that between SrRuO3 and LaAlO3 (3.6%), therefore one can expect a signifi-
cantly smaller dislocation density in SrTiO3/SrRuO3 films on SrTiO3 substrates compared
to the films on LaAlO3. However, Raman spectra are similar for the films grown on SrTiO3
and LaAlO3 substrates, both showing the forbidden first order Raman peaks. Therefore, we
believe that dislocations are unlikely to cause the observed features in Raman spectra.
The small misfit between the SrRuO3 layer and the SrTiO3 film was shown to be mainly
not relaxed and accommodated by elastic strain in the SrTiO3 films.101 A uniform bi-
axial strain does not, however, break the inversion symmetry and cannot cause the ob-
served Raman peaks in the films, unless the strain exceeds the critical value for inducing
ferroelectricity,109 which is not the case in our films. Although we cannot rule out the influ-
ence of the inhomogeneous strain distribution in the films, we believe that the likely cause for
the appearance of polar nanoregions is the dipoles localized at the grain boundaries in films.
The polar grain boundaries were proposed by Petzelt et al.86 to explain the observed the soft
mode hardening and appearance of the first order Raman peaks of considerable intensity in
SrTiO3 ceramics. The ceramics studied were nominally pure, highly stoichiometric and not
subject to strain, yet the first order Raman peaks were observed. Ostapchuk et al.88 studied
polycrystalline SrTiO3 films and also observed the activation of the forbidden modes in the
Raman spectra in the whole temperature range studied (80–300 K), which was explained by
the dipoles associated with such defects as porosity and cracks along the grain boundaries.
Although these defects were not found in epitaxial films studied here, the dipoles frozen at
the grain boundaries can still exist and induce the polar phase in the bulk of grains, leading
to the symmetry breakdown and appearance of the forbidden modes in the Raman spectra,
as well as the soft mode hardening and increased damping.
17
This is an author-produced, peer-reviewed version of this article. The final, definitive version of this document can be found online at Journal of the American Ceramic Society, published by Blackwell Publishing. Copyright restrictions may apply. doi: 10.1111/j.1551-2916.2008.02371.x
C. Strain effect on the phase transitions in BaTiO3 films
As discussed in the Section II, bulk BaTiO3 undergoes three phase transitions, in which
the crystal structure changes from cubic to tetragonal at 403 K, then to orthorhombic at
278 K, and to rhombohedral at 183 K. The cubic phase is paraelectric and the other phases
are ferroelectric. In thin films, strain due to lattice and/or thermal expansion mismatch be-
tween a film and a substrate may result in dramatic changes in phase transition behavior.108
Raman spectroscopy is a powerful tool to study phase transitions as the structural changes
alter the vibrational spectra. We applied this technique to study phase transitions in epi-
taxial BaTiO3 thin (1µm) films grown by pulsed laser deposition on SrTiO3 and LaAlO3
substrates covered by 0.3 µm-thick conducting SrRuO3 layers,50 focusing on the tempera-
ture range 5–325 K, where the transitions from tetragonal to orthorhombic and rhombohedral
phase take place in bulk BaTiO3.
Fig. 11 shows Raman spectra of a BaTiO3 single crystal and a film grown on a SrTiO3
substrate as a function of temperature. The spectra of the single crystal show clear changes
attributed to the phase transitions, most noticeable in the frequency range 150–300 cm−1.
At low temperatures, in the rhombohedral phase, the most intensive lines observed in the po-
larized Raman spectrum are at 173, 187, 242, 485, 522, and 714 cm−1, and are attributed to
TO1, LO1, TO2, LO3, TO4, and LO4 modes of A1 symmetry, respectively.29 The peak at 310
cm−1 is due to mixed LO2-TO3 phonon of E symmetry.29 When the temperature is increased
up to ∼ 185 K, sudden jumps to a higher frequency, as large as 35 cm−1, took place for the
A1 (TO2) phonon line. A less dramatic, but still well pronounced jump (∼10 cm−1) occurred
for the A1 (TO4) line. These changes are indicative of the rhombohedral-orthorhombic phase
transition. When the crystal was heated further to ∼ 280 K, another sudden jumps of the
A1 TO2 and TO4 phonon frequencies (25 and 4 cm−1, respectively) and changes in the Ra-
man spectra occurred, which indicates the orthorhombic-tetragonal phase transition. The
observed frequency shifts are well detectable in Raman spectra despite large linewidths TO2
and TO4 phonons, and are in agreement with the reported results for BaTiO3 crystals.24,30,31
The temperature dependence of the Raman spectra of the BaTiO3 film, shown in Fig. 11(b),
is markedly different from that of the single crystal. It does not show sharp changes in the
temperature range of 5-300 K. When temperature increases, the phonon lines broaden, but
their frequencies are either almost constant (TO2) or change only very slightly and gradually
18
This is an author-produced, peer-reviewed version of this article. The final, definitive version of this document can be found online at Journal of the American Ceramic Society, published by Blackwell Publishing. Copyright restrictions may apply. doi: 10.1111/j.1551-2916.2008.02371.x

(TO4). The two intensive sharp lines observed at 173 and 187 cm−1 at low temperatures
(rhombohedral phase) in the BaTiO3 crystal are broader and their relative intensity is much
smaller in the films at all temperatures measured. In fact, the positions, relative intensi-
ties and lineshapes of phonon modes in the spectra of the films are similar to those of the
orthorhombic phase of the single crystal.
The temperature dependence of the frequencies of the A1 (TO2) and A1 (TO4) phonon
modes for both the crystal and film shown on Fig. 12 clearly demonstrates the difference
between the crystal and film behavior. Large jumps in the A1 (TO2) phonon frequency are
clearly seen in the crystal, but it is constant in the film. The A1 (TO4) phonon frequency
shows smaller jumps in the crystal, whereas no such jumps are visible in the film. This behav-
ior indicates that the BaTiO3 film does not undergo any phase transition in the temperature
range 5-325 K. The same behavior was observed for films grown both on SrTiO3 and LaAlO3
substrates. The tetragonal-orthorhombic and orthorhombic-rhombohedral phase transitions
of the bulk BaTiO3 are completely absent in the thin films.
The observed behavior was attributed to the presence of a thermal-mismatch-induced
tensile strain in the BaTiO3 films. For a quantitative determination of film strain the
BaTiO3/SrRuO3 films studied were charachterized by the x-ray diffraction and transmission
electron microscopy. X-ray data show that both the BaTiO3 and SrRuO3 layers grow epitax-
ially with c axis normal to the substrate. The films are in-plane aligned with the substrate
lattice with [100] BaTiO3‖[100] SrRuO3‖[100] LaAlO3.50
From x-ray data, the lattice parameters of SrRuO3 buffer layers are determined to be
a =3.93 A for the pseudocubic lattice, equal to the bulk values, i.e. the SrRuO3 layers
(both on SrTiO3 and LaAlO3) are completely relaxed. For BaTiO3 films the measured
lattice constants are a= b= 4.01± 0.01 A(in-plane), and c= 4.004± 0.001 A. Similar x-ray
diffraction data were obtained for films grown on SrTiO3 substrates, yielding the same
epitaxial orientation, the same SrRuO3 and BaTiO3 lattice constants. Transmission electron
microscopy studies showed that the films consist of columnar grains with in-plane grain
size of ∼100 nm. Electron diffraction results indicated the BaTiO3 grains are oriented in
same direction and confirmed the epitaxial relationship between the substrate, SrRuO3 and
BaTiO3 layers described above. From the the lattice constants of the unstrained BaTiO3, the
strain in the BaTiO3 thin films at room temperature was calculated to be a tensile strain of
0.58%. Although the lattice constants of both LaAlO3 and SrTiO3 substrates and of SrRuO3
19
This is an author-produced, peer-reviewed version of this article. The final, definitive version of this document can be found online at Journal of the American Ceramic Society, published by Blackwell Publishing. Copyright restrictions may apply. doi: 10.1111/j.1551-2916.2008.02371.x

buffer layer are smaller than that of BaTiO3, the misfit strain in the BaTiO3 film is fully
relaxed at the growth temperatures because the film thickness (1µm) far exceeds the critical
thickness for strain relaxation. Although the strain state in such a structure containing thick
BaTiO3 and SrRuO3 layers is difficult to predict, the tensile strain in BaTiO3 films can arise
from the thermal expansion mismatch. The thermal expansion coefficients of LaAlO3110 and
SrRuO3111 are smaller than that of BaTiO3.
110 Consequently, when a BaTiO3 film is cooled
to room temperature after the deposition, it contracts more than underlaying layers and a
tensile stress is imposed on it. It is difficult to calculate the strain between 5-300 K because
the thermal expansion coefficients are temperature dependent. However, the tensile strain is
expected to increase when the temperature is lowered from 300 to 5 K. (Estimation assuming
the room temperature strain of 0.58%, as determined experimentally, and the temperature
independent average thermal mismatch between LaAlO3, SrRuO3 and BaTiO3 results in
0.78% tensile strain at 5 K.)
Comparison of the experimentally determined magnitude of the film strain BaTiO3 with
the calculated temperature-strain phase diagram for BaTiO3 films under biaxial substrate
constraint 112 shows that a tensile strain of 0.58% at room temperature corresponds to the or-
thorhombic phase with in-plane polarization. This is confirmed by the Raman spectroscopy
results (Figs. 11 and 12), as the form of the spectra, the phonon line positions and relative
intensities in the BaTiO3 film are close to those of the orthorhombic phase of BaTiO3 single
crystal. Because the tensile strain in the film increases when the temperature decreases from
room temperature to 5 K, the film remains in the orthorhombic phase without undergoing
any phase transitions.
IV. UV RAMAN SPECTROSCOPY OF NANOSCALE FERROELECTRIC SU-
PERLATTICES
In the previous section we discussed some results of Raman studies of SrTiO3 and
BaxSr1−xTiO3 films obtained using the metal-oxide bilayer technique. These studies revealed
essential differences in the lattice dynamical properties of thin films compared to single crys-
tals of the same materials. These results, along with the studies by other groups 41–44,87–89
contributed significantly to a fundamental understanding of lattice dynamical properties
in ferroelectric thin films. However, all these results were obtained on films or superlat-
20
This is an author-produced, peer-reviewed version of this article. The final, definitive version of this document can be found online at Journal of the American Ceramic Society, published by Blackwell Publishing. Copyright restrictions may apply. doi: 10.1111/j.1551-2916.2008.02371.x

tices 113,114 thicker than 150 nm.
Study of lattice dynamics in ferroelectric films and heterostructures thinner than∼100 nm
has been a challenging task. Conventional visible Raman spectroscopy works poorly for thin
films of ferroelectrics and other wide-bandgap materials because the visible photon energy is
much smaller than the bandgap (see Fig. 13(a) with SrTiO3 as an example). Consequently,
the absorption of light is extremely weak and the penetration depth is large, allowing light
to travel through thin film into the much thicker substrate, which generates overwhelming
signals in the Raman spectra. The above described Raman studies of ferroelectric thin films
had to employ an opaque layer of a conductive oxide, or study films grown on Raman-
inactive substrates, such as MgO. We have recently realized another approach using an UV
excitation for Raman studies of nanoscale ferroelectrics.53 For UV excitation, the photon
energy is above the bandgap of ferroelectric oxides such as SrTiO3 BaTiO3, which leads to
a much stronger absorption and a greatly reduced penetration depth (Fig. 13(a)). Thus the
substrate contribution is suppressed, and phonons of nanoscale films and heterostructures
can be observed. UV excitation near the bandgap can also lead to a resonance enhancement
of Raman signals.
The advantage of UV over visible excitation is clearly demonstrated by Fig. 13(b) show-
ing Raman spectra of a ferroelectric [(BaTiO3)5/(SrTiO3)4]×25 superlattice having total
thickness of ∼90 nm measured with visible (514.5 nm) and UV (351.1 nm) excitations are
shown. (BaTiO3/SrTiO3 superlattices are denoted by [(BaTiO3)n/(SrTiO3)m]× number of
periods, where n and m refer to the thickness, in unit cells, of the BaTiO3 and SrTiO3
layers, respectively.) The substrate features dominate the 514.5 nm spectrum while they
are greatly reduced in the UV spectrum, in which peaks of superlattice phonons are clearly
seen.
So far, UV Raman spectroscopy has not been widely used for ferroelectric films because of
technical difficulties such as lower throughput efficiency, insufficient dispersion, and higher
stray light level of UV Raman spectrometers compared to those operating in the visible
range. Only a room temperature measurement of SrTiO3 films using 325 nm excitation has
been reported115. Recent progress in UV Raman instrumentation has made measurement of
ferroelectric ultrathin films possible. In our experiment, UV-optimized triple spectrometers
(Jobin Yvon T64000) with a multichannel coupled charge-device detector were used. The
system employs a triple monochromator to provide high resolution and effective stray light
21
This is an author-produced, peer-reviewed version of this article. The final, definitive version of this document can be found online at Journal of the American Ceramic Society, published by Blackwell Publishing. Copyright restrictions may apply. doi: 10.1111/j.1551-2916.2008.02371.x
reduction. Powerful laser sources and optimized optical paths were used to improve the
throughput. The 351.1 nm line of an Ar+ laser and the 325 nm line of a He-Cd laser were
used for excitation. Spectra were recorded in a backscattering geometry in the temperature
range from 7 to 700 K using either a closed cycle cryostat (for low temperatures) or an
evacuated heater stage (for above 300 K). With these setups, we have measured Raman
scattering in BaTiO3/SrTiO3 superlattices as thin as 24 nm, and in singla-layer BaTiO3
films as thin as 2.4 nm, i.e. 6 unit cells (See Fig. 13(c)).
We have demonstrated the UV Raman spectroscopy to be an effective technique to deter-
mine the phase transition temperature Tc in ferroelectric ultrathin films and superlattices,
which is a critical but challenging step for understanding ferroelectricity in nanoscale sys-
tems. The Tc determination from Raman data is based on the fact that perovskite-type
crystals have no first-order Raman active modes in paraelectric phase. We applied this
method to study phase transitions in BaTiO3/SrTiO3 superlattices, as described below.
The [(BaTiO3)n/(SrTiO3)m]×N superlattice samples were grown by reactive molecular-
beam epitaxy on TiO2-terminated (001) SrTiO3 substrates. The n and m values are con-
trolled using reflection high-energy electron diffraction (RHEED) oscillations during growth,
and confirmed by x-ray diffraction (XRD) and in some samples by high resolution transmis-
sion electron microscopy (HRTEM)116. XRD showed excellent epitaxy and crystallinity in
the superlattice samples, with all superlattice peaks present in the θ − 2θ scan. HRTEM
images showed atomically sharp BaTiO3/SrTiO3 interfaces and acurate periodicity.116 Ac-
cording to XRD, all samples studied were commensurate to the SrTiO3 substrate (a= 0.3905
nm), meaning that the SrTiO3 layers are strain free and the BaTiO3 layers are under 2.2%
compressive biaxial strain (a = 0.3992 nm in bulk BaTiO3 at room temperature), except
for a 200 nm-thick superlattice [(BaTiO3)8/(SrTiO3)4]×40, in which the strain is partially
relaxed (a = 0.3946 nm in-plane). In this case, the SrTiO3 layers are under biaxial tensile
strain and the BaTiO3 layers are under biaxial compressive strain.
Fig. 14 shows the comparison of room temperature spectra of two superlattices,
(BaTiO3)8/(SrTiO3)4×10 and (BaTiO3)5/(SrTiO3)4)×25, (Tc = 640 and 530 K, respec-
tively) with the spectra of BaTiO3 single crystals in the three different ferroelectric phases
(tetragonal, orthorhombic, and rhombohedral) and the SrTiO3 substrate spectra at 295 and
5 K. The top two spectra are typical of the UV Raman spectra of BaTiO3/SrTiO3 superlat-
tices below Tc, exhibiting strong first-order (single-phonon) peaks as labeled in the figure.
22
This is an author-produced, peer-reviewed version of this article. The final, definitive version of this document can be found online at Journal of the American Ceramic Society, published by Blackwell Publishing. Copyright restrictions may apply. doi: 10.1111/j.1551-2916.2008.02371.x

Weak second-order (two-phonon) features from the SrTiO3 substrate can be seen between
600 and 700 cm−1 and as a background in the range 200-500 cm−1. The phonon mode as-
signment is made by comparison with the spectra of SrTiO3 and BaTiO3 single crystals and
with the help of first-principles calculations.
The lines at about 290 cm−1 have similar positions and shapes to the TO2 modes of A1
symmetry of the tetragonal-phase BaTiO326,50, thus they are assigned to the BaTiO3 layers.
We conclude that BaTiO3 layers in superlattices are tetragonal. This is supported by the
absence of the sharp peak at 310 cm−1 characteristic of the orthorhombic and rhombohedral
phases of BaTiO3, but not pronounced in the tetragonal phase.
The frequencies of several phonon branches in SrTiO3 and BaTiO3 are close to each
other, and the phonons are not expected to be strongly localized within the thin SrTiO3
and BaTiO3 layers. According to first-principle calculations, these vibrations extend through
the whole superlattice. This is the case for the LO3 and the TO4 modes, observed at about
478 and 530 cm−1, respectively.
The line at about 180 cm−1 is attributed to the SrTiO3-like TO2 phonons. Its position
corresponds closely to the TO2 line in the electric-field-induced Raman spectrum of SrTiO3
crystals 33 and the weak feature in the 5 K spectrum of the SrTiO3 single crystal. (The
first-order Raman lines are visible in these cases because the electric field and defects break
the inversion symmetry in the SrTiO3 crystals.) The 180 cm−1 line is not from the SrTiO3
substrate because the first-order Raman lines are symmetry-forbidden in bulk SrTiO3.32 In
fact, even the much stronger second-order features of the substrate at 230 and 610 cm−1 are
barely seen in the UV Raman spectra. Although BaTiO3 also has a feature due to the TO1
mode of A1 symmetry at about the same position (177 cm−1), at room temperature (in the
tetragonal phase) that feature is about 15-20 times weaker compared to the TO2 and TO4
lines, and it has a characteristic interference dip due to the coupling of the TO1 and TO2
modes of A1 symmetry.26 The 180 cm−1 line observed in the spectra of the superlattices
is of the same order of magnitude in intensity as the TO2 and TO4 lines of BaTiO3 and
does not have the dip characteristic of BaTiO3. Therefore, although we cannot absolutely
rule out the contribution of the BaTiO3 layers, we believe this line should be attributed to
the phonons of the SrTiO3 layers in the superlattices. The observation of the first-order
Raman scattering by SrTiO3 phonons indicates that the inversion symmetry is broken, and
the SrTiO3 layers in the superlattices are polar.
23
This is an author-produced, peer-reviewed version of this article. The final, definitive version of this document can be found online at Journal of the American Ceramic Society, published by Blackwell Publishing. Copyright restrictions may apply. doi: 10.1111/j.1551-2916.2008.02371.x

A doublet of folded longitudinal acoustic (LA) phonon due to the superlattice
periodicity117 is also observed. The two triangles indicate the predicted first doublet frequen-
cies by an elastic continuum model118. The observation of the LA phonon folding suggests
that these superlattices possess the requisite structural quality for acoustic Bragg mirrors
and cavities used for coherent phonon generation119,120.
Fig. 15 shows the temperature evolution of Raman spectra for two BaTiO3/SrTiO3 su-
perlattices. From the shapes and positions of the BaTiO3 lines it follows that the BaTiO3
layers are in ferroelectric tetragonal phase at all temperatures below the Tc. The intensities
of the first-order superlattice phonons decrease as the temperature increases and disappear
at Tc. Above Tc, the spectra contain only the second-order features as expected from the
symmetry selection rules. When the BaTiO3 layers are paraelectric, the induced polarization
in the SrTiO3 layers also disappears.
By plotting the first-order Raman intensity as a function of temperature, we can deter-
mine Tc accurately as the temperature where the intensity becomes zero. For this purpose,
the TO2 and TO4 phonon lines are the most suitable because they do not overlap with
the second-order features. The results, with the phonon intensities normalized by the Bose
factor n + 1 = (1 − exp(−hω/kT ))−1 and by the intensities at 7 K, are presented for
four superlattices: [(BaTiO3)2/(SrTiO3)4]×40 and [(BaTiO3)5/(SrTiO3)4)]×25 in Fig. 16A,
and [(BaTiO3)8/(SrTiO3)4]×10 and [(BaTiO3)8/(SrTiO3)4]×40 (strain partially relaxed) in
Fig. 16B. Both TO2 and TO4 phonons show similar behaviors and the dashed-dotted lines
are linear fits to the average of the two modes. The linear fit corresponds to a parabolic
decrease of polarization with temperature as Raman intensity is proportional to the square
of atomic displacement. The intersection of a dash-dotted line with the horizontal axis is
taken as the Tc of the sample.
The temperature dependence of polarization from a phase-field model calculation121 is
plotted in Figs. 16C and 16D for the same samples as in Figs. 16A and B. The model assumes
that the BaTiO3 and SrTiO3 layers in the superlattices have their respective bulk elastic and
thermodynamic properties. The in-plane lattice constant is commensurately constrained to
the SrTiO3 substrate except for the partially relaxed case, and the top surface is stress-free.
The surface depolarization field is ignored and a short-circuit electrostatic boundary condi-
tion is employed. A computational cell of 64 nm along the two in-plane directions and one
unit cell along the growth direction was employed. The corresponding 3-dimensional time-
24
This is an author-produced, peer-reviewed version of this article. The final, definitive version of this document can be found online at Journal of the American Ceramic Society, published by Blackwell Publishing. Copyright restrictions may apply. doi: 10.1111/j.1551-2916.2008.02371.x
dependent Ginzburg-Landau equations are then numerically solved using the perturbation
method with semi-implicit Fourier-spectral algorithms122. The result reveals a spontaneous
polarization along the growth direction with multiple 180◦ domains in the BaTiO3 layers,
which induces polarization in the adjacent SrTiO3 layers whose magnitude and distribution
vary with the thickness and domain size of the BaTiO3 layers. The spontaneous polarization
in the BaTiO3 layers becomes zero at Tc, and the predicted Tc values agree with those from
the Raman data. This is remarkable considering that no fitting parameters from the Raman
experiments are used in the calculations.
In Fig. 17, Tc determined by the Raman data, XRD, and the phase-field model are shown
as a function of the BaTiO3 and SrTiO3 layer thicknesses. The XRD measurement provides
an additional confirmation of the Raman results, where a change in the temperature de-
pendence of the out-of-plane lattice constant can be taken as an indication of Tc.116. The
figure shows that the BaTiO3 layers in the superlattices are ferroelectric even when their
thickness is only one unit cell, with a Tc as high as 250 K. Tc increases with increasing n as
the dipole-dipole interaction in BaTiO3 layers becomes stronger, while large m suppresses
Tc by reducing the coupling between the BaTiO3 layers. By changing the values of n and m,
we were able to tune Tc from 151 K to 638 K, i.e. from 250 K below to 235 K above the bulk
value of BaTiO3. The higher-than-bulk Tc is due to the strain in the BaTiO3 layers, just
as strain enhances Tc in single-layer ferroelectric films123,124. When the strain is partially
relaxed in sample (BTO8/STO4)×40, Tc drops to 440 K, almost to the bulk BaTiO3 value.
While the 3-dimensional phase-field model allowing domain formation provides a good de-
scription of the Raman data, simulations assuming a single domain in the BaTiO3 layers
yield significantly lower Tc for m = 13, demonstrating the importance of domain formation
in theoretical calculations.125
We now can conclude that ferroelectricity can be very strong in one-unit-cell thick BaTiO3
layers (Tc ∼ 250 K for n/m = 1/4). The electrical boundary condition plays a critical role.
With the highly-polarizable SrTiO3 in contact with the BaTiO3 layers, the critical thickness
is reduced to a single unit cell. Meanwhile, the mechanical boundary condition imposed by
the SrTiO3 substrate leads to strain in the BaTiO3 layers and thus enhanced ferroelectricity.
The interplay between the electrical and mechanical boundary conditions enables the tuning
of Tc by nearly 500 K.
25
This is an author-produced, peer-reviewed version of this article. The final, definitive version of this document can be found online at Journal of the American Ceramic Society, published by Blackwell Publishing. Copyright restrictions may apply. doi: 10.1111/j.1551-2916.2008.02371.x

V. SUMMARY
We discussed the applications of Raman spectroscopy to the studies of lattice dynamics
in (Ba,Sr)TiO3 single crystals, thin films and superlattices. Raman studies of SrTiO3 and
BaxSr1−xTiO3 films revealed essential differences in the lattice dynamical properties of thin
films and corresponding single crystals, such as forbidden first order Raman scattering in
films of paraelectric material SrTiO3, and in BaxSr1−xTiO3 films well above the ferroelectric
phase transition temperature in bulk; hardening of the soft phonon modes in films compared
to crystals; significantly larger range of the soft mode overdamping in the BaxSr1−xTiO3
films. On the other hand, the lattice dynamics behavior in the BaxSr1−xTiO3 films is found
similar to that of relaxor ferroelectrics. Analogously to the relaxors, the presence of polar
nanoregions existing in the films at the temperatures corresponding to the paraelectric phase
in the bulk explains the specific lattice-dynamical properties of SrTiO3 BaxSr1−xTiO3 thin
films.
The effect of strain on the phase transitions in epitaxial BaTiO3 films has been studied.
Strain strongly affects the phase diagram in the films, suppressing the transitions between
different ferroelectric phases (tetragonal-orthorhombic-rhombohedral), characteristic of bulk
BaTiO3, and stabilizing a single ferroelectric phase (orthorhombic in the case of BaTiO3 films
which are tensile strained due to the thermal expansion mismatch and tetragonal in the
case of coherent lattice-mismatch induced strain). The thermodynamic phase-field model
calculations of the thin film phase diagrams are in agreement with Raman spectroscopy
results.
Ultraviolet Raman spectroscopy is proved to be an effective technique allowing the ob-
servation of phonons and studying phase transitions in nanoscale ferroelectric superlattices
and ultrathin films. From UV Raman results it was found that coherently-strained BaTiO3
layer in BaTiO3/SrTiO3 superlattices is ferroelectric even when its thickness is only one unit
cell. Depending on thickness of BaTiO3 layers and strain, the phase transition temperature
can be for about 500 degrees, from ∼170 K to ∼650 K. Comparison of Raman data are with
the thermodynamic calculations of polarization in superlattices reveals essential role of 180
domains. These results demonstrate the great utility of UV Raman spectroscopy for study-
ing nanoscale ferroelectrics and show an example of the dramatic modification of material
properties in artificially engineered epitaxial heterostructures.
26
This is an author-produced, peer-reviewed version of this article. The final, definitive version of this document can be found online at Journal of the American Ceramic Society, published by Blackwell Publishing. Copyright restrictions may apply. doi: 10.1111/j.1551-2916.2008.02371.x

∗ Supported in part by the Basic Energy Sciences Division, U.S. Department of Energy, under
Grant No. DE-FG02-01ER45907, by National Science Foundation under Grant No. DMR-
0705127, and by Research corporation (Grant No.7134)
† Electronic address: [email protected]
1 Thin film ferroelectric materials and devices, edited by R. Ramesh (Kluwer Academic Publish-
ers, Boston 1997)
2 R. Ramesh, S. Aggarwal, and O. Auciello, ”Science and technology of ferroelectric films and het-
erostructures for non-volatile ferroelectric memories,” Mater. Sci. Eng. R 32, 191–236 (2001).
3 M. Dawber, K. M. Rabe, and J. F. Scott, ”Physics of thin-film ferroelectric oxides,” Rev. Mod.
Phys. 77, 1083–1130 (2005).
4 N. Setter, D. Damjanovic, L. Eng, G. Fox, S. Gevorgian, S. Hong, A. Kingon, H. Kohlstedt, N.
Y. Park, G. B. Stephenson, I. Stolitchnov, A. K. Taganstev, D. V. Taylor, T. Yamada, and S.
Streiffer, ”Ferroelectric thin films: Review of materials, properties, and applications,” J. Appl.
Phys. 100, 051606 46pp. (2006).
5 S. K. Streiffer, C. Basceri, C. B. Parker, S. E. Lash, and A. I. Kingon, ”Ferroelectricity in
thin films: The dielectric response of fiber-textured (BaxSr1−x)Ti1+yO3+z thin films grown by
chemical vapor deposition,” J. Appl. Phys. 86, 4565–4575 (1999).
6 D. G. Schlom, J. H. Hanei, J. Lettieri, C. D. Theis, W. Tian, J. C. Jiang, and X. Q. Pan,
”Oxide nano-engineering using MBE,” Mater. Sci. Eng. B 87, 282–291 (2001).
7 C. H. Ahn, K. M. Rabe, and J.-M. Triscone, ”Ferroelectricity at the nanoscale: Local polar-
ization in oxide thin films and heterostructures,” Science 303, 488–491 (2004).
8 Nanoscale Phenomena in Ferroelectric Thin Films, edited by Seungbum Hong (Springer,
Berlin, 2004)
9 M. E. Lines and A. M. Glass, Principles and Applications of Ferroelectrics and Related Mate-
rials (Oxford University Press, New York 1977).
10 W. Cochran, ”Crystal stability and the theory of ferroelectricity,” Adv. Phys. 9, 387-423 (1960).
11 G. Rupprecht, R. O. Bell, and B. D. Silverman, ”Nonlinearity and microwave losses in cubic
strontium-titanate,” Phys. Rev. 123, 97–98 (1961).
12 V. L. Gurevich and A. K. Tagantsev, ”Intrinsic dielectric loss in crystals,” Adv. Phys. 40,
27
This is an author-produced, peer-reviewed version of this article. The final, definitive version of this document can be found online at Journal of the American Ceramic Society, published by Blackwell Publishing. Copyright restrictions may apply. doi: 10.1111/j.1551-2916.2008.02371.x
719–767 (1991).
13 A. K. Tagantsev, ”Phonon mechanisms of intrinsic dielectric loss in crystals,” in Ferroelectric
Ceramics, edited by N. Setter and E. L. Colla (Birkhauser, Basel, 1993), p. 127.
14 Landolt-Bornstein, Numerical Data and Functional Relationships in Science and Technology,
New Series, Group III, Vol. 16 (Springer, 1981), p. 416.
15 J. D. Axe, J. Harada, and G. Shirane, ”Anomalous acoustic dispersion in centrosymmetric
crystals with soft optic phonons,” Phys. Rev. B 1, 1227–1234 (1970).
16 W. G. Stirling, ”Neutron inelastic scattering study of the lattice dynamics of strontium titanate:
harmonic models,” J. Phys. C 5, 2711–2730 (1972).
17 G. Shirane, J. D. Axe, J. Harada, and A. Linz, ”Inelastic neutron scattering from single-domain
BaTiO3”, Phys. Rev. B 2, 3651–3657 (1970).
18 G. Shirane, J. D. Axe, J. Harada, and J. P. Remeika, ”Soft ferroelectric modes in lead titanate,”
Phys. Rev. B 2, 155–159 (1970).
19 I. Tomeno, Y. Ishii, Y. Tsunoda, and K. Oka, ” Lattice dynamics of tetragonal PbTiO3”, Phys.
Rev. B 73, 064116, 10pp. (2006).
20 J. Hlinka, M. Kempa, J. Kulda, P. Bourges, A. Kania, and J. Petzelt, ” Lattice dynamics of
ferroelectric PbTiO3 by inelastic neutron scattering,” Phys. Rev. B 73, 140101(R) 4pp. (2006).
21 J. T. Last, ”Infrared-absorption studies on barium titanate and related materials,” Phys. Rev.
105, 1740–1750 (1957).
22 W. G. Spitzer, R. C. Miller, D. A. Kleinman, and L. E. Howarth, ”Far infrared dielectric
dispersion in BaTiO3, SrTiO3, and TiO2 ”, Phys. Rev. 126, 1710–1721 (1962).
23 J. L. Servoin, Y. Luspin, and F. Gervais, ”Infrared dispersion in SrTiO3 at high temperature,”
Phys. Rev. B 22, 5501-5506 (1980); J. L. Servoin, F. Gervais, A. M. Quittet, and Y. Luspin,
”Infrared and Raman responses in ferroelectric perovskite crystals: Apparent inconsistencies,”
ibid. 21, 2038–2041 (1980).
24 C. H. Perry and D. B. Hall, ”Temperature dependence of the Raman spectrum of BaTiO3”,
Phys. Rev. Lett. 15, 700–702 (1965).
25 M. DiDomenico, Jr., S. P. S. Porto, and S. H. Wemple, ”Evidence from Raman scattering
for an overdamped soft optic mode in BaTiO3”, Phys. Rev. Lett. 19, 855–857 (1967); M.
DiDomenico, Jr., S. H. Wemple, S. P. S. Porto, and R. P. Bauman, ”Raman spectrum of
single-domain BaTiO3”, Phys. Rev. 174, 522–530 (1968).
28
This is an author-produced, peer-reviewed version of this article. The final, definitive version of this document can be found online at Journal of the American Ceramic Society, published by Blackwell Publishing. Copyright restrictions may apply. doi: 10.1111/j.1551-2916.2008.02371.x
26 A. Scalabrin, A. S. Chaves, D. S. Shim, and S. P. S. Porto, ”Temperature dependence of the
A1 and E optical phonons in BaTiO3”, Phys. Status Solidi B 79, 731–742 (1977).
27 G. Burns and F. H. Dacol, ”Lattice modes in ferroelectric perovskites. III. Soft modes in
BaTiO3”, Phys. Rev. B 18, 5750–5755 (1978).
28 H. Vogt, J. A. Sanjurjo, and G. Rossbroich, ”Soft-mode spectroscopy in cubic BaTiO3 by
hyper-Raman scattering,” Phys. Rev. B 26, 5904–5910 (1982); H. Presting, J. A. Sanjurjo,
and H. Vogt, ”Mode softening in cubic BaTiO3 and the problem of its adequate description,”
ibid. 28, 6097–6099 (1983).
29 J. D. Freire and R. S. Katiyar, ”Lattice dynamics of crystals with tetragonal BaTiO3 structure,”
Phys. Rev. B 37, 2074–2085 (1988).
30 U. D. Venkateswaran, V. M. Naik, and R. Naik, ”High-pressure Raman studies of polycrys-
talline BaTiO3”, Phys. Rev. B 58, 14256–14260 (1998).
31 M. Osada, M. Kakihana, S. Wada, T. Noma, and W.-S. Cho, ”Broken symmetry in low-
temperature BaTiO3 phases: Strain effects probed by Raman scattering,” Appl. Phys. Lett.,
75, 3393-3395 (1999).
32 W. G. Nilsen and J. G. Skinner, ”Raman spectrum of strontium titanate,” J. Chem. Phys. 48,
2240–2248 (1968).
33 P. A. Fleury and J. M. Worlock, ”Electric-Field-Induced Raman Scattering in SrTiO3 and
KTaO3 ”, Phys. Rev. 174, 613–623 (1968).
34 H. Vogt and G. Rossbroich, ”Accurate determination of the far-infrared dispersion in SrTiO3
by hyper-Raman spectroscopy,” Phys. Rev. B 24, 3086–3091 (1981); H. Vogt, ”Hyper-Raman
tensors of the zone-center optical phonons in SrTiO3 and KTaO3”, ibid. 38, 5699–5708 (1988).
35 G. Burns and B. A. Scott, ”Raman studies of underdamped soft modes in PbTiO3”, Phys.
Rev. Lett. 25, 167–170 (1970); ”Lattice Modes in Ferroelectric Perovskites: PbTiO3”, Phys.
Rev. B 7, 3088–3101 (1973).
36 I. Taguchi, A. Pignolet, L. Wang, M. Proctor, F. Levy, and P. E. Schmid, ”Raman scatter-
ing from PbTiO3 thin films prepared on silicon substrates by radio frequency sputtering and
thermal treatment,” J. Appl. Phys. 73, 394–399 (1993).
37 H. Zhang, S. Leppavuori, P. Karjalainen, ”Raman spectra in laser ablated lead zirconate
titanate thin films near the morphotropic phase boundary,” J. Appl. Phys. 77, 2691–2696
(1995).
29
This is an author-produced, peer-reviewed version of this article. The final, definitive version of this document can be found online at Journal of the American Ceramic Society, published by Blackwell Publishing. Copyright restrictions may apply. doi: 10.1111/j.1551-2916.2008.02371.x
38 E. Ching-Prado, J. Cordero, R. S. Katiyar, and A. S. Bhalla, ”Temperature-dependent Raman
scattering in PT and PMN-PT thin films,” J. Vac. Sci. Technol. A 14, 762–767 (1996).
39 Z. C. Feng, B. S. Kwak, A. Erbil, and L. A. Boatner, ”Difference Raman spectra of PbTiO3
thin films grown by metalorganic chemical vapor deposition,” Appl. Phys. Lett. 62, 349–351
(1993.
40 L. H. Robins, D. L. Kaiser, L. D. Rotter, P. K. Schenck, G. T. Stauf, and D. Rytz, ”Investigation
of the structure of barium titanate thin films by Raman spectroscopy,” J. Appl. Phys. 76,
7487–7498 (1994).
41 Yu. I. Yuzyuk, V. A. Alyoshin, I. N. Zakharchenko, E. V. Sviridov, A. Almeida, and M.
R. Chaves, ”Polarization-dependent Raman spectra of heteroepitaxial (Ba,Sr)TiO3/MgO thin
films,” Phys. Rev. B 65, 134107, 9pp. (2002)
42 Yu. I. Yuzyuk, P. Simon, I. N. Zakharchenko, V. A. Alyoshin, and E. V. Sviridov, ”Stress effect
on the ferroelectric-to-paraelectric phase transition in heteroepitaxial (Ba,Sr)TiO3/(001)MgO
thin film studied by Raman scattering and x-ray diffraction,” Phys. Rev. B 66, 052103, 4pp.
(2002).
43 Yu. I. Yuzyuk, J. L. Sauvajol, P. Simon, V. L. Lorman, V. A. Alyoshin, I. N. Zakharchenko, and
E. V. Sviridov, ”Phase transitions in (Ba0.7Sr0.3)TiO3/(001)MgO thin film studied by Raman
scattering,” J. Appl. Phys. 93, 9930–9937 (2003)
44 Yu. I. Yuzyuk, R. S. Katiyar, V. A. Alyoshin, I. N. Zakharchenko, D. A. Markov, and E.
V. Sviridov, ”Stress relaxation in heteroepitaxial (Ba,Sr)TiO3/(001)MgO thin film studied by
micro-Raman spectroscopy” Phys. Rev. B 68, 104104, 4pp. (2003).
45 V. I. Merkulov, J. R. Fox, H.-C. Li, W. Si, A. A. Sirenko, and X. X. Xi, ”Metal-oxide bilayer
Raman scattering in SrTiO3 thin films,” Appl. Phys. Lett. 72, 3291–3293 (1998).
46 A. A. Sirenko, I. A. Akimov, J. R. Fox, A. M. Clark, Hong-Cheng Li, Weidong Si, and X. X.
Xi, ”Observation of the first-order Raman scattering in SrTiO3 thin films,” Phys. Rev. Lett.
82, 4500–4503 (1999).
47 I. A. Akimov, A. A. Sirenko, A. M. Clark, J.-H. Hao, and X. X. Xi, ”Electric-field-induced
soft-mode hardening in SrTiO3 films,” Phys. Rev. Lett. 84, 4625–4628 (2000)
48 D. A. Tenne, A. M. Clark, A. R. James, K. Chen, and X. X. Xi, ”Soft phonon modes in
Ba0.5Sr0.5TiO3 thin films studied by Raman spectroscopy,” Appl. Phys. Lett. 79, 3836-3838
(2001).
30
This is an author-produced, peer-reviewed version of this article. The final, definitive version of this document can be found online at Journal of the American Ceramic Society, published by Blackwell Publishing. Copyright restrictions may apply. doi: 10.1111/j.1551-2916.2008.02371.x
49 D. A. Tenne, A. Soukiassian, M. H. Zhu, A. M. Clark, X. X. Xi, H. Choosuwan, Qi He, R.
Guo, and A. S. Bhalla, ”Raman study of BaxSr1−xTiO3 films: evidence for the existence of
polar nanoregions,” Phys. Rev. B 67, 012302, 4pp. (2003).
50 D. A. Tenne, X. X. Xi, Y. L. Li, L. Q. Chen, A. Soukiassian, M. H. Zhu, A. R. James, J.
Lettieri, D. G. Schlom, W. Tian, and X. Q. Pan, ”Absence of low-temperature phase transitions
in epitaxial BaTiO3 thin films,” Phys. Rev. B 69, 174101, 5pp. (2004).
51 D. A. Tenne, A. Soukiassian, X. X. Xi, H. Choosuwan, R. Guo, and A. S. Bhalla, ”Lattice
dynamics in BaxSr1−xTiO3 thin films studied by Raman spectroscopy,” J. Appl. Phys. 96,
6597–6605 (2004).
52 A. A. Sirenko, C. Bernhard, A. Golnik, Anna M. Clark, Jianhua Hao, Weidong Si, and X. X.
Xi, ”Soft-mode hardening in SrTiO3 thin films,” Nature 404, 373–376 (2000).
53 D. A. Tenne, A. Bruchhausen, N. D. Lanzillotti-Kimura, A. Fainstein, R. S. Katiyar, A.
Cantarero, A. Soukiassian, V. Vaithyanathan, J. H. Haeni, W. Tian, D. G. Schlom, K. J.
Choi, D. M. Kim, C. B. Eom, H. P. Sun, X. Q. Pan, Y. L. Li, L. Q. Chen, Q. X. Jia, S. M.
Nakhmanson, K. M. Rabe, X. X. Xi, ”Probing nanoscale ferroelectricity by ultraviolet Raman
spectroscopy,” Science 313, 1614–1616 (2006)
54 V. V. Lemanov, E. P. Smirnova, P. P. Syrnikov, and E. A. Tarakanov, ”Phase transitions and
glasslike behavior in Sr1−xBaxTiO3”, Phys. Rev. B 54, 3151–3157 (1996).
55 K. A. Muller and H. Burkard, ”SrTiO3: an intrinsic quantum paraelectric below 4 K,” Phys.
Rev. B 19, 3593–3602 (1979).
56 J. G. Bednorz and K. A. Muller, ”Sr1−xCaxTiO3: An XY quantum ferroelectric with transition
to randomness,” Phys. Rev. Lett. 52, 2289–2292 (1984).
57 Ang Chen, Zhi Yu, J. Scott, A. Loidl, R. Guo, A. S. Bhalla and L. E. Cross, ”Dielectric
polarization processes in Bi:SrTiO3”, J. Phys. Chem. Solids 61, 191-196 (2000).
58 M. Itoh, R. Wang, Y. Inaguma, T. Yamaguchi, Y-J. Shan, and T. Nakamura, ”Ferroelectricity
induced by oxygen isotope exchange in strontium titanate perovskite,” Phys. Rev. Lett. 82,
3540-3543 (1999).
59 H. Uwe and T. Sakudo, ”Stress-induced ferroelectricity and soft phonon modes in SrTiO3”,
Phys. Rev. B 13, 271–286 (1976).
60 N. A. Pertsev, A. G. Zembilgotov, and A. K. Tagantsev, ”Effect of mechanical boundary
conditions on phase diagrams of epitaxial ferroelectric thin films,” Phys. Rev. Lett. 80, 1988-
31
This is an author-produced, peer-reviewed version of this article. The final, definitive version of this document can be found online at Journal of the American Ceramic Society, published by Blackwell Publishing. Copyright restrictions may apply. doi: 10.1111/j.1551-2916.2008.02371.x
1991 (1998).
61 N. A. Pertsev, A. K. Tagantsev, and N. Setter, ”Phase transitions and strain-induced ferro-
electricity in SrTiO3 epitaxial thin films,” Phys. Rev. B 61, R825–R829 (2000).
62 K. Laabidi, M. D. Fontana, and B. Jannot, ”Underdamped soft phonon in orthorhombic
BaTiO3”, Solid State Commun. 76, 765–768 (1990).
63 J. Harada, J. D. Axe, and G. Shirane, ”Neutron-scattering study of soft modes in cubic
BaTiO3”, Phys Rev. B 4, 155–162 (1971).
64 R. Comes, M. Lambert, and A. Guinier, ”Chain structure of BaTiO3 and KNbO3”, Solid State
Commun. 6, 715–719 (1968); ”Linear disorder in crystals (silicon, quartz and ferroelectric
perovskites),” Acta Crystallogr. A 26, 244–254 (1970).
65 K. A. Muller and W. Berlinger, ”Microscopic probing of order-disorder versus displacive be-
havior in BaTiO3 by Fe3+ EPR,” Phys. Rev. B 34, 6130–6136 (1986).
66 R. E. Cohen and H. Krakauer, ”Lattice dynamics and origin of ferroelectricity in BaTiO3:
Linearized-augmented-plane-wave total-energy calculations,” Phys. Rev. B 42, 6416–6423
(1990).
67 J. P. Sokoloff, L. L. Chase, and D. Rytz, ”Direct observation of relaxation modes in KNbO3
and BaTiO3 using inelastic light scattering,” Phys. Rev. B 38, 597–605 (1988); ”Reply to
Comment on Direct observation of relaxation modes in KNbO3 and BaTiO3 using inelastic
light scattering,” ibid. 40, 788-790 (1989).
68 M. D. Fontana, K. Laabidi, and B. Jannot, ”Quasimodes and a central peak in BaTiO3”, J.
Phys. Condens. Matter 6, 8923–8930 (1994).
69 T. P. Dougherty, G. P. Wiederrecht, K. A. Nelson, M. H. Garrett, H. P. Jenssen, and C.
Warde, ”Femtosecond time-resolved spectroscopy of soft modes in structural phase transitions
of perovskites,” Phys. Rev. B 50, 8996–9019 (1994).
70 B. Zalar,V. V. Laguta, and R. Blinc, ”NMR Evidence for the coexistence of order-disorder and
displacive components in barium titanate,” Phys. Rev. Lett. 90, 037601, 4pp. (2003).
71 M. Stachiotti, A. Dobry, R. Migoni, and A. Bussmann-Holder, ”Crossover from a displacive to
an order-disorder transition in the nonlinear-polarizability model,” Phys. Rev. B 47, 2473–2479
(1993).
72 A. Bussmann-Holder, ”Soft modes and order-disorder effects in ferroelectric phase transitions,”
J. Phys. Chem. Solids 57, 1445–1448 (1996).
32
This is an author-produced, peer-reviewed version of this article. The final, definitive version of this document can be found online at Journal of the American Ceramic Society, published by Blackwell Publishing. Copyright restrictions may apply. doi: 10.1111/j.1551-2916.2008.02371.x
73 Y. Girshberg and Y. Yakobi, ”Ferroelectric phase transitions and off-centre displacements in
systems with strong electron-phonon interaction,” J. Phys. Condens. Matter 11, 9807–9822
(1999).
74 H. J. Bakker, ”Unified description of the soft and the relaxational mode in the dielectric
response of ferroelectrics,” Phys. Rev. B 52, 4093–4103 (1995).
75 W. Zhong, D. Vanderbilt, and K. M. Rabe, ”Phase transitions in BaTiO3 from first principles,”
Phys. Rev. Lett. 73, 1861-1864 (1994); ”First-principles theory of ferroelectric phase transitions
for perovskites: The case of BaTiO3”, Phys. Rev. B 52, 6301–6312 (1995).
76 V. V. Lemanov, ”Concentration dependence of phonon mode frequencies and the Gruneisen
coefficients in BaxSr1−xTiO3 solid solutions,” Phys. Solid State 39, 318–322 (1997).
77 S.-Y. Kuo, W.-Y. Liao, and W.-F. Hsieh, ”Structural ordering transition and repulsion of
the giant LO-TO splitting in polycrystalline BaxSr1−xTiO3”, Phys. Rev. B 64, 224103, 7pp.
(2001).
78 P. S. Dobal, A. Dixit, R. S. Katiyar, D. Garcia, R. Guo, and A. S. Bhalla, ”Micro-Raman
study of Ba1−xSrxTiO3 ceramics,” J. Raman Spectrosc. 32, 147–149 (2001).
79 R. Naik, J. J. Nazarko, C. S. Flattery, U. D. Venkateswaran, V. M. Naik, M. S. Mohammed, G.
W. Auner, J. V. Mantese, N. W. Schubring, A. L. Micheli, and A. B. Catalan, ”Temperature
dependence of the Raman spectra of polycrystalline Ba1−xSrxTiO3”, Phys. Rev. B 61, 11367–
11372 (2000).
80 D. A. Tenne, A. Soukiassian, X. X. Xi, H. Choosuwan, R. Guo, and A. S. Bhalla, ”Lattice
dynamics in BaxSr1−xTiO3 single crystals: a Raman study,” Phys. Rev. B 70, 174302, 9pp.
(2004).
81 D. Garcia, R. Guo, and A. S. Bhalla, ”Dielectric properties of Ba1−xSrxTiO3 single crystal
fibers grown by laser heated pedestal growth technique,” Integr. Ferroelectrics 42, 57–69 (2002).
82 D. Kirillov, Y. Suzuki, L. Antognazza, K. Char, I. Bozovic, and T. H. Geballe, ”Phonon
anomalies at the magnetic phase transition in SrRuO3”, Phys. Rev. B 51, 12825–12828 (1995).
83 H. Vogt, ”Refined treatment of the model of linearly coupled anharmonic oscillators and its
application to the temperature dependence of the zone-center soft-mode frequencies of KTaO3
and SrTiO3,” Phys. Rev. B 51, 8046–8059 (1995).
84 J. Hemberger, P. Lunkenheimer, R. Viana, R. Bo”hmer, and A. Loidl, ”Electric-field-dependent
dielectric constant and nonlinear susceptibility in SrTiO3”, Phys. Rev. B 52, 13159–13162
33
This is an author-produced, peer-reviewed version of this article. The final, definitive version of this document can be found online at Journal of the American Ceramic Society, published by Blackwell Publishing. Copyright restrictions may apply. doi: 10.1111/j.1551-2916.2008.02371.x

(1995).
85 H. C. Li, W. Si, A. D. West, and X. X. Xi, ”Near single crystal-level dielectric loss and
nonlinearity in pulsed laser deposited SrTiO3 thin films,” Appl. Phys. Lett. 73, 190–192 (1998).
86 J. Petzelt, T. Ostapchuk, I. Gregora, I. Rychetsky, S. Hoffmann-Eifert, A. V. Pronin, Y.
Yuzyuk, B. P. Gorshunov, S. Kamba, V. Bovtun, J. Pokorny, M. Savinov, V. Porokhonskyy,
D. Rafaja, P. Vanek, A. Almeida, M. R. Chaves, A. A. Volkov, M. Dressel, and R. Waser,
”Dielectric, infrared, and Raman response of undoped SrTiO3 ceramics: Evidence of polar
grain boundaries,” Phys. Rev. B 64, 184111, 10pp. (2001).
87 J. Petzelt and T. Ostapchuk, ”Soft-mode spectroscopy in SrTiO3, BaTiO3, and BST films and
ceramics,” Ferroelectrics 267, 93–100 (2002)
88 T. Ostapchuk, J. Petzelt, V. Zelezny, A. Pashkin, J. Pokorny, I. Drbohlav, R. Kuzel, D.
Rafaja, B. P. Gorshunov, M. Dressel, Ch. Ohly, S. Hoffmann-Eifert, and R. Waser, ”Origin of
soft-mode stiffening and reduced dielectric response in SrTiO3 thin films,” Phys. Rev. B 66,
235406, 12pp. (2002).
89 T.-G. Kim, J. Oh, T. Moon, Y. Kim, B. Park, Y.-T. Lee, and S. Nam, ”Effect of crystallinity
on the dielectric loss of sputter-deposited (Ba,Sr)TiO3 thin films in the microwave range,” J.
Mater. Res. 18, 682–686 (2003).
90 P. M. Gehring, S. Wakimoto, Z.-G. Ye, and G. Shirane, ”Soft Mode Dynamics above and below
the Burns Temperature in the Relaxor Pb(Mg1/3Nb2/3)O3”, Phys. Rev. Lett. 87, 277601, 4pp.
(2001).
91 S. Wakimoto, C. Stock, R. J. Birgeneau, Z.-G. Ye, W. Chen, W. J. L. Buyers, P. M. Gehring,
and G. Shirane, ”Ferroelectric ordering in the relaxor Pb(Mg1/3Nb2/3)O3 as evidenced by
low-temperature phonon anomalies” Phys. Rev. B 65, 172105, 4pp. (2002).
92 P. M. Gehring, S.-E. Park, and G. Shirane, ”Soft Phonon Anomalies in the Relaxor Ferroelectric
Pb(Zn1/3Nb2/3)0.92Ti0.08O3”, Phys. Rev. Lett. 84, 5216–5219 (2001).
93 T. Y. Koo, P. M. Gehring, G. Shirane, V. Kiryukhin, S.-G. Lee, and S-W. Cheong, ”Anomalous
transverse acoustic phonon broadening in the relaxor ferroelectric Pb(Mg1/3Nb2/3)0.8Ti0.2O3”,
Phys. Rev. B 65, 144113, 6pp. (2002).
94 L. E. Cross, ”Relaxor ferroelectrics,” Ferroelectrics 76, 241–267 (1987); ”Relaxor ferroelectrics:
an overview,” ibid. 151, 305–320 (1994).
95 G. Burns and F. H. Dacol, ”Crystalline ferroelectrics with glassy polarization behavior,”
34
This is an author-produced, peer-reviewed version of this article. The final, definitive version of this document can be found online at Journal of the American Ceramic Society, published by Blackwell Publishing. Copyright restrictions may apply. doi: 10.1111/j.1551-2916.2008.02371.x
Phys. Rev. B 28, 2527–2530 (1983); ”Glassy polarization behavior in ferroelectric compounds
Pb(Mg1/3Nb2/3)O3 and Pb(Zn1/3Nb2/3)O3”, Solid State Commun. 48, 853–856 (1983).
96 D. Viehland, S. J. Jang, L. E. Cross, and M. Wuttig, ”Deviation from Curie-Weiss behavior in
relaxor ferroelectrics,” Phys. Rev. B 46, 8003–8006 (1992).
97 J. Toulouse, P. DiAntonio, B. E. Vugmeister, X. M. Wang, and L. A. Knauss, ”Precursor
effects and ferroelectric macroregions in KTa1−xNbxO3 and K1−yLiyTaO3”, Phys. Rev. Lett.
68, 232–235 (1992); P. DiAntonio, B. E. Vugmeister, J. Toulouse, and L. A. Boatner, ”Polar
fluctuations and first-order Raman scattering in highly polarizable KTaO3 crystals with off-
center Li and Nb” Phys. Rev. B, 47, 5629–5637 (1993).
98 H. Vogt, ”Hyper-Raman study of Li-induced polarization clusters in K1−xLixTaO3”, J. Phys.
Condens. Matter 7, 5913–5929 (1995).
99 C. Hubert, J. Levy, T. V. Rivkin, C. Carlson, P. A. Parilla, J. D. Perkins, and D. S. Ginley,
”Nanopolar reorientation in ferroelectric thin films,” Appl. Phys. Lett. 79, 2058–2060 (2001).
100 C. Hubert, J. Levy, E. J. Cukauskas, and S. W. Kirchoefer, ”Mesoscopic Microwave dispersion
in ferroelectric thin films,” Phys. Rev. Lett. 85, 1998-2001 (2000).
101 J. C. Wu, C. L. Jia, K. Urban, J. H. Hao, and X. X. Xi, ”Microstructure and misfit relaxation
in SrTiO3/SrRuO3 bilayer films on LaAlO3(100) substrates,” J. Mater. Researsh 16, 3443-3450
(2001).
102 R. Waser and D. M. Smyth, ”Defect chemistry, conduction, and breakdown mechanism of
perovskite-structure titanates,” pp. 47–92 in Ferroelectric Thin Films: Synthesis and Basic
Properties, edited by C. P. de Araujo, J. F. Scott and G. W. Taylor (Gordon and Breach,
Amsterdam, 1996).
103 H. Uwe, H. Yamaguchi, and T. Sakudo, ”Ferroelectric microregion in KTa1−xNbxO3 and
SrTiO3”, Ferroelectrics 96, 123–126 (1989).
104 D. A. Crandles, B. Nicholas, C. Dreher, C. C. Homes, A. W. McConnell, B. P. Clayman, W.
H. Gong, and J. E. Greedan, ”Optical properties of highly reduced SrTiO3−x”, Phys. Rev. B
59, 12842-12846 (1999).
105 D. A. Tenne, I. E. Gonenli, A. Soukiassian, D. G. Schlom, S. M. Nakhmanson, K. M. Rabe,
and X. X. Xi, ”Raman study of oxygen reduced and re-oxidized strontium titanate,” Phys.
Rev. B 76, 024303, 7pp. (2007).
106 U. Bianchi, W. Kleemann, and J. G. Bednorz, ”Raman scattering of ferroelectric
35
This is an author-produced, peer-reviewed version of this article. The final, definitive version of this document can be found online at Journal of the American Ceramic Society, published by Blackwell Publishing. Copyright restrictions may apply. doi: 10.1111/j.1551-2916.2008.02371.x

Sr1−xCaxTiO3, x=0.007”, J. Phys. Condens. Matter 6, 1229-1238 (1994).
107 V. Porokhonskyy, A. Pashkin, V. Bovtun, J. Petzelt, M. Savinov, P. Samoukhina, T.
Ostapchuk, J. Pokorny, M. Avdeev, A. Kholkin, and P. Vilarinho, ” Broad-band dielectric
spectroscopy of SrTiO3:Bi ceramics,” Phys. Rev. B 69, 144104, 10pp. (2004).
108 D. G. Schlom, L.-Q. Chen, C.-B. Eom, K. M. Rabe, S. K. Streiffer, and J.-Marc Triscone,
”Strain Tuning of Ferroelectric Thin Films,” Annu. Rev. Mater. Res. 37, 589–626 (2007), and
references therein.
109 Y. L. Li, S. Choudhury, J. H. Haeni, M. D. Biegalski, A. Vasudevarao, A. Sharan, H. Z. Ma,
J. Levy, V. Gopalan, S. Trolier-McKinstry, D. G. Schlom, Q. X. Jia, and L. Q. Chen, ”Phase
transitions and domain structures in strained pseudocubic (100) SrTiO3 thin films,” Phys. Rev.
B 73, 184112, 13pp. (2006).
110 D. Taylor, ”Thermal Expansion Data VIII. Complex Oxides, ABO3, the Perovskites,” Trans-
actions and Journal of the British Ceramic Society 84, 181–188 (1985).
111 J. J. Neumeier, A. L. Cornelius, and K. Andres, ”Thermodynamic investigation of the magnetic
phase transitions of CaMnO3 and SrRuO3”, Phys. Rev. B 64, 172406, 3pp. (2001).
112 Y. L. Li and L.-Q. Chen, ”Temperature-strain phase diagram for BaTiO3 thin films,” Appl.
Phys. Lett. 88, 072905, 3pp. 2006.
113 R. R. Das, Yu. I. Yuzyuk, P. Bhattacharya, V. Gupta, and R. S. Katiyar, ”Folded acoustic
phonons and soft mode dynamics in BaTiO3/SrTiO3 superlattices,” Phys. Rev. B 69, 132302,
4pp. (2004).
114 R. S. Katiyar, Y. I. Yuzyuk, R. R. Das, P. Bhattacharya, V. Gupta, ”Polarized Raman spectra
of BaTiO3/SrTiO3 superlattices,” Ferroelectrics 329, 907–916 (2005).
115 L. Hilt Tisinger, R. Liu, J. Kulik, X. Zhang, J. Ramdani, and A. A. Demkov, ”Ultraviolet-
Raman studies of SrTiO3 ultrathin films on Si,” J. Vac. Sci. Technol. B 21 53–56 (2003).
116 see Supporting Online Material for Ref. 53.
117 B. Jusserand and M. Cardona, ”Raman spectroscopy of vibrations in superlattices,” pp. 49–
152 in Light Scattering in Solids V , edited by M. Cardona and G. Guntherodt (Springer,
Heidelberg, 1989).
118 C. Colvard, T. A. Gant, M. V. Klein, R. Merlin, R. Fischer, H. Morkoc, and A. C. Gossard,
”Folded acoustic and quantized optic phonons in (GaAl)As superlattices,” Phys. Rev. B 31,
2080–2091 (1985).
36
This is an author-produced, peer-reviewed version of this article. The final, definitive version of this document can be found online at Journal of the American Ceramic Society, published by Blackwell Publishing. Copyright restrictions may apply. doi: 10.1111/j.1551-2916.2008.02371.x

119 M. Trigo, A. Bruchhausen, A. Fainstein, B. Jusserand, V. Thierry-Mieg, ”Confinement of
acoustical vibrations in a semiconductor planar phonon cavity,” Phys. Rev. Lett. 89, 227402,
4pp. (2002).
120 A. Bartels, T. Dekorsy, H. Kurz, K. Kohler, ”Coherent zone-folded longitudinal acoustic
phonons in semiconductor superlattices: excitation and detection,” Phys. Rev. Lett. 82, 1044–
1047 (1999).
121 L.-Q. Chen, ”Phase-field models for microstructure evolution,” Annu. Rev. Mater. Res. 32,
113–140 (2002).
122 L.-Q. Chen and J. Shen, ”Applications of semi-implicit Fourier-spectral method to phase field
equations,” Comput. Phys. Commun. 108, 147–158 (1998).
123 K. J. Choi, M. Biegalski, Y. L. Li, A. Sharan, J. Schubert, R. Uecker, P. Reiche, Y. B.
Chen, X. Q. Pan, V. Gopalan, L.-Q. Chen, D. G. Schlom, and C. B. Eom, ”Enhancement of
ferroelectricity in strained BaTiO3 thin films,” Science 306, 1005–1009 (2004).
124 J. H. Haeni, P. Irvin, W. Chang, R. Uecker, P. Reiche, Y. L. Li, S. Choudhury, W. Tian, M. E.
Hawley, B. Craigo, A. K. Tagantsev, X. Q. Pan, S. K. Streiffer, L. Q. Chen, S. W. Kirchoefer,
J. Levy, and D. G. Schlom, ”Room-temperature ferroelectricity in strained SrTiO3”, Nature
430, 758–761 (2004).
125 V. A. Stephanovich, I. A. Luk’yanchuk, M. G. Karkut, ”omain-Enhanced Interlayer Coupling
in Ferroelectric/Paraelectric Superlattices,” Phys. Rev. Lett. 94, 047601, 4pp. (2005).
126 Y. L. Li, S. Y. Hu, D. Tenne, A. Soukiassian, D. G. Schlom, X. X. Xi, K. J. Choi, C. B.
Eom, A. Saxena, T. Lookman, Q. X. Jia, and L.-Q. Chen, ”Prediction of ferroelectricity in
BaTiO3/SrTiO3 superlattices with domains,” Appl. Phys. Lett. 91, 112914, 3pp. 2007.
37
This is an author-produced, peer-reviewed version of this article. The final, definitive version of this document can be found online at Journal of the American Ceramic Society, published by Blackwell Publishing. Copyright restrictions may apply. doi: 10.1111/j.1551-2916.2008.02371.x

FIGURE CAPTIONS
FIG. 1: (a) Temperature evolution of Raman spectra of Ba0.1Sr0.9TiO3 crystal. Dashed-dotted
lines indicate the soft modes. The peaks labelled R in the spectra of SrTiO3 crystals are the
structural modes. Vertical dashed-dotted lines are guides to eye. (b) Temperature dependence of
the E and A1 soft mode frequencies (left and right panels, respectively) for BaxSr1−xTiO3 crystals
with x = 0.05, 0.1, 0.2, and 0.5. (After Tenne et al.80)
FIG. 2: Composition dependence of the hard phonon mode frequencies at 5 K. Dotted lines are
guides to eye. The half-solid circles label the TO2 and LO1 modes, undistinguishable in spectra.
(After Tenne et al.80)
FIG. 3: Raman spectra of SrTiO3 films grown on SrRuO3 buffer layers, and a single SrTiO3 crystal
measured at T = 5K with 514.5 nm excitation. The peaks labelled TOm are the TO phonons of
SrTiO3, R - the structural modes due to antiferodistortive transition; the stars denote the SrRuO3
Raman lines. (After Sirenko et al.46)
FIG. 4: (a) The square of the TO1 soft phonon frequency vs. temperature for a 2µm-thick SrTiO3
film and a SrTiO3 single crystal. (b) The inverse dielectric constant vs. temperature for the same
SrTiO3 film and single crystal. (After Sirenko et al.52)
FIG. 5: Raman spectra of 1µm-thick SrTiO3 film at T = 5 K without electric field (solid line) and
in the presence of an external electric field of 22 3 104 V/cm directed normal to the film plane
(dotted line). The soft mode components are labelled A and E. Structural modes are denoted by
R, the SrRuO3 Raman lines - by the stars. (After Akimov et al.47)
FIG. 6: Frequency of the TO1 phonon in SrTiO3 film as a function of temperature for different
values of external electric field. Zero-field values of the A mode are obtained by extrapolation
and shown with open symbols. The dotted lines guide the eye. Electric-field values are given in
104 V/cm. The vertical dashed line indicates the structural cubic-to-tetragonal phase transition
observed in the film at 120 K. (After Akimov et al.47)
38
This is an author-produced, peer-reviewed version of this article. The final, definitive version of this document can be found online at Journal of the American Ceramic Society, published by Blackwell Publishing. Copyright restrictions may apply. doi: 10.1111/j.1551-2916.2008.02371.x

FIG. 7: Raman spectra of Ba0.2Sr0.8TiO3 film (top panel) and single crystal of the same composition
(bottom panel) at 10 and 200 K. In the top panel solid and dotted lines correspond to parallel and
perpendicular polarization geometries, respectively. Stars mark the lines of SrRuO3 buffer layer.
Vertical dashed-dotted lines are guides to eye. (After Tenne et al.49)
FIG. 8: Temperature dependence of the E and F1u soft mode frequencies (circles) and damping
(diamonds) for Ba0.2Sr0.8TiO3. Open symbols: single crystal, solid symbols: thin film. Horizontal
bars show the temperature range where the soft mode is overdamped. (After Tenne et al.51)
FIG. 9: The ranges of the E soft mode overdamping as a function of Ba contents x for
BaxSr1−xTiO3 films (vertical error bars) and single crystals (shaded area). Symbols show the
ferroelectric phase transition temperatures for single crystals (open circles) and films (triangles),
as determined from the A1 soft mode behavior. Dotted lines represent the phase diagram for bulk
BaxSr1−xTiO3.54 (After Tenne et al.49)
FIG. 10: (a) The inverse dielectric constant as a function of temperature for Ba0.2Sr0.8TiO3 film.
(b) The temperature dependence of the square of the E or F1u soft mode frequency for the same
film; dotted line shows the region where the E soft mode is overdamped. (c) The E or F1u soft
mode damping. Vertical dashed-dotted lines are guides to eye. (After Tenne et al.51)
FIG. 11: Temperature evolution of Raman spectra of (a) a BaTiO3 single crystal and (b) a BaTiO3
film grown on SrTiO3 substrate with a SrRuO3 buffer layer, measured in parallel polarization
geometry z(x, x)z. Dashed-dotted lines are guides to eye. Star in the spectra of the film indicates
features due to SrRuO3 layer. (After Tenne et al.50)
FIG. 12: Temperature dependence of the A1 (TO2) and A1 (TO4) phonon frequencies for BaTiO3
single crystal (solid symbols) and film grown on SrTiO3 substrate with SrRuO3 buffer layer (open
symbols). (After Tenne et al.50)
39
This is an author-produced, peer-reviewed version of this article. The final, definitive version of this document can be found online at Journal of the American Ceramic Society, published by Blackwell Publishing. Copyright restrictions may apply. doi: 10.1111/j.1551-2916.2008.02371.x
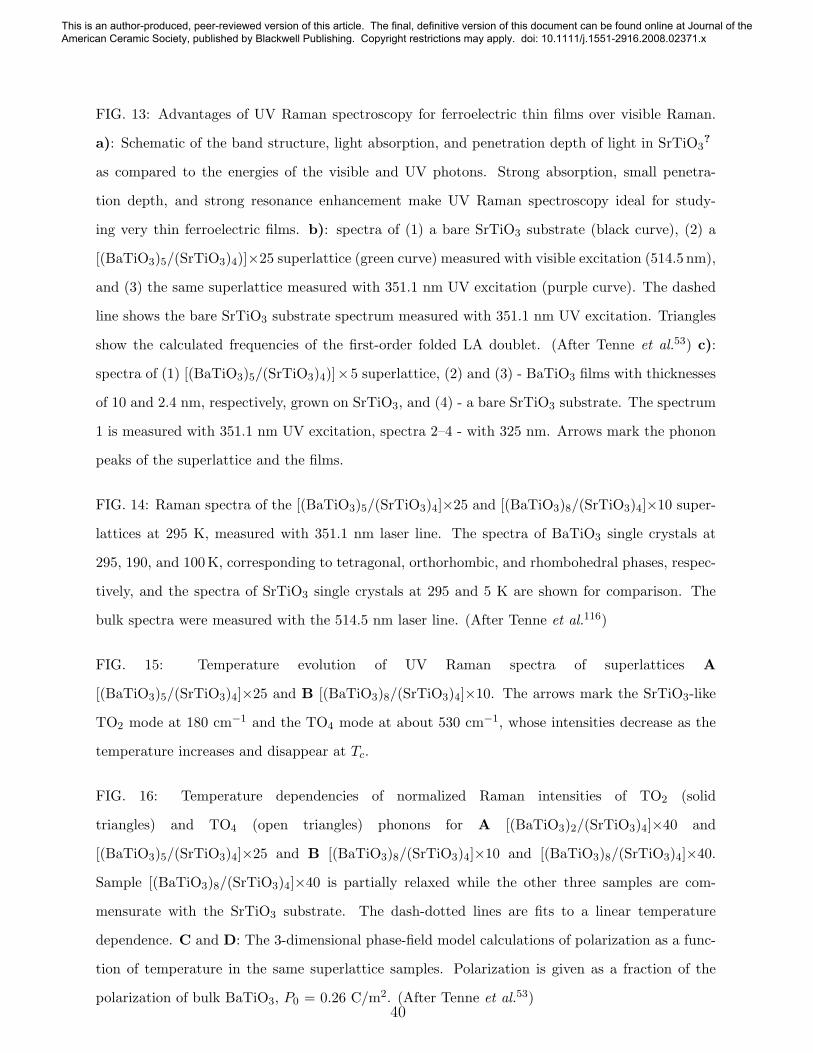
FIG. 13: Advantages of UV Raman spectroscopy for ferroelectric thin films over visible Raman.
a): Schematic of the band structure, light absorption, and penetration depth of light in SrTiO3?
as compared to the energies of the visible and UV photons. Strong absorption, small penetra-
tion depth, and strong resonance enhancement make UV Raman spectroscopy ideal for study-
ing very thin ferroelectric films. b): spectra of (1) a bare SrTiO3 substrate (black curve), (2) a
[(BaTiO3)5/(SrTiO3)4)]×25 superlattice (green curve) measured with visible excitation (514.5 nm),
and (3) the same superlattice measured with 351.1 nm UV excitation (purple curve). The dashed
line shows the bare SrTiO3 substrate spectrum measured with 351.1 nm UV excitation. Triangles
show the calculated frequencies of the first-order folded LA doublet. (After Tenne et al.53) c):
spectra of (1) [(BaTiO3)5/(SrTiO3)4)]×5 superlattice, (2) and (3) - BaTiO3 films with thicknesses
of 10 and 2.4 nm, respectively, grown on SrTiO3, and (4) - a bare SrTiO3 substrate. The spectrum
1 is measured with 351.1 nm UV excitation, spectra 2–4 - with 325 nm. Arrows mark the phonon
peaks of the superlattice and the films.
FIG. 14: Raman spectra of the [(BaTiO3)5/(SrTiO3)4]×25 and [(BaTiO3)8/(SrTiO3)4]×10 super-
lattices at 295 K, measured with 351.1 nm laser line. The spectra of BaTiO3 single crystals at
295, 190, and 100 K, corresponding to tetragonal, orthorhombic, and rhombohedral phases, respec-
tively, and the spectra of SrTiO3 single crystals at 295 and 5 K are shown for comparison. The
bulk spectra were measured with the 514.5 nm laser line. (After Tenne et al.116)
FIG. 15: Temperature evolution of UV Raman spectra of superlattices A
[(BaTiO3)5/(SrTiO3)4]×25 and B [(BaTiO3)8/(SrTiO3)4]×10. The arrows mark the SrTiO3-like
TO2 mode at 180 cm−1 and the TO4 mode at about 530 cm−1, whose intensities decrease as the
temperature increases and disappear at Tc.
FIG. 16: Temperature dependencies of normalized Raman intensities of TO2 (solid
triangles) and TO4 (open triangles) phonons for A [(BaTiO3)2/(SrTiO3)4]×40 and
[(BaTiO3)5/(SrTiO3)4]×25 and B [(BaTiO3)8/(SrTiO3)4]×10 and [(BaTiO3)8/(SrTiO3)4]×40.
Sample [(BaTiO3)8/(SrTiO3)4]×40 is partially relaxed while the other three samples are com-
mensurate with the SrTiO3 substrate. The dash-dotted lines are fits to a linear temperature
dependence. C and D: The 3-dimensional phase-field model calculations of polarization as a func-
tion of temperature in the same superlattice samples. Polarization is given as a fraction of the
polarization of bulk BaTiO3, P0 = 0.26 C/m2. (After Tenne et al.53)40
This is an author-produced, peer-reviewed version of this article. The final, definitive version of this document can be found online at Journal of the American Ceramic Society, published by Blackwell Publishing. Copyright restrictions may apply. doi: 10.1111/j.1551-2916.2008.02371.x

FIG. 17: Dependence of Tc on n and m in superlattices [(BaTiO3)n/(SrTiO3)m]×N , where the
number of periods N varies between 10 and 50. Blue symbols are for m = 4 and red symbols for m
= 13. Open squares are from temperature-dependent XRD measurement. Solid lines are from the
3-dimensional phase-field model calculations, dashed lines - simulations assuming a single domain
in the BaTiO3 layers. The black dash-dotted line shows the Tc in bulk BaTiO3. (After Li et al.126)
41
This is an author-produced, peer-reviewed version of this article. The final, definitive version of this document can be found online at Journal of the American Ceramic Society, published by Blackwell Publishing. Copyright restrictions may apply. doi: 10.1111/j.1551-2916.2008.02371.x

50 100 150 200 0 100 2000
50
100
150
0 100 2000
50
100
150
b)
Raman shift (cm-1)
a) Ba0.1Sr0.9TiO3
Inte
nsity
(arb
. uni
ts)
A1ETO1
100 K90 K
85 K
70 K
60 K
50 K
40 K
30 K
5 K
TO2+LO1
x = 0.05x = 0.1x = 0.2x = 0.35x = 0.5
ω (c
m-1)
T (K)
E mode A1 mode
x = 0.05x = 0.1x = 0.2x = 0.35x = 0.5
Figure 1D. A. Tenne and X. X. Xi
This is an author-produced, peer-reviewed version of this article. The final, definitive version of this document can be found online at Journal of the American Ceramic Society, published by Blackwell Publishing. Copyright restrictions may apply. doi: 10.1111/j.1551-2916.2008.02371.x

0.0 0.2 0.4 0.6 0.8 1.0
150
200
250
300
500
550
750
800
LO4
TO4
TO3 + LO2
LO3
ω (c
m-1)
Ba content x
TO2
LO1
Figure 2D. A. Tenne and X. X. Xi
This is an author-produced, peer-reviewed version of this article. The final, definitive version of this document can be found online at Journal of the American Ceramic Society, published by Blackwell Publishing. Copyright restrictions may apply. doi: 10.1111/j.1551-2916.2008.02371.x

Figure 3 D. A. Tenne and X. X. Xi
This is an author-produced, peer-reviewed version of this article. The final, definitive version of this document can be found online at Journal of the American Ceramic Society, published by Blackwell Publishing. Copyright restrictions may apply. doi: 10.1111/j.1551-2916.2008.02371.x

bulk SrTiO3
bulk SrTiO3 from Ref. 82 2 µm film
ω2 TO
1 × 1
0-3 (c
m-2
)
Figure 4 D. A. Tenne and X. X. Xi
This is an author-produced, peer-reviewed version of this article. The final, definitive version of this document can be found online at Journal of the American Ceramic Society, published by Blackwell Publishing. Copyright restrictions may apply. doi: 10.1111/j.1551-2916.2008.02371.x
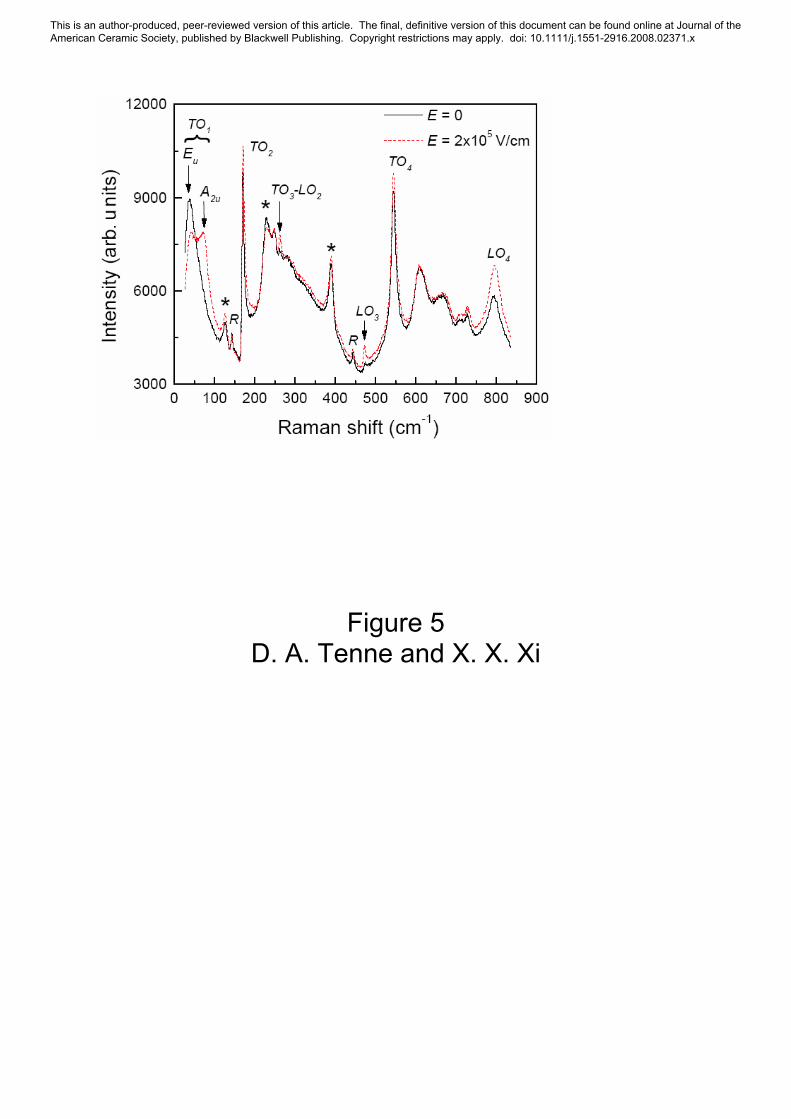
Figure 5 D. A. Tenne and X. X. Xi
This is an author-produced, peer-reviewed version of this article. The final, definitive version of this document can be found online at Journal of the American Ceramic Society, published by Blackwell Publishing. Copyright restrictions may apply. doi: 10.1111/j.1551-2916.2008.02371.x
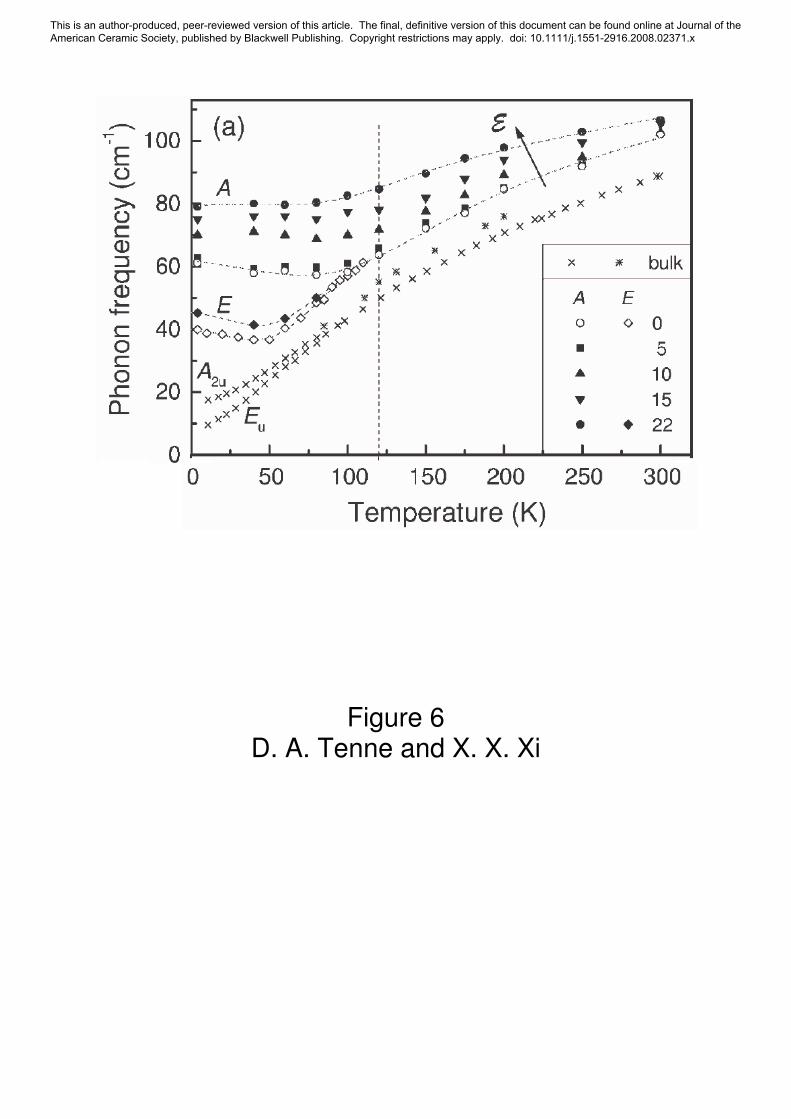
Figure 6 D. A. Tenne and X. X. Xi
This is an author-produced, peer-reviewed version of this article. The final, definitive version of this document can be found online at Journal of the American Ceramic Society, published by Blackwell Publishing. Copyright restrictions may apply. doi: 10.1111/j.1551-2916.2008.02371.x
200 400 600
E
A1E
TO4
TO3+LO
2
TO2+LO
1
(x,x)
(y,x)
(x,x)
200 K
10 K
Inte
nsity
(arb
. uni
ts)
TO1
A1
second order
TO4
TO3+LO2
TO2+LO
1
200 K, x10
10 K
Raman shift (cm-1)
TO1
Figure 7 D. A. Tenne and X. X. Xi
This is an author-produced, peer-reviewed version of this article. The final, definitive version of this document can be found online at Journal of the American Ceramic Society, published by Blackwell Publishing. Copyright restrictions may apply. doi: 10.1111/j.1551-2916.2008.02371.x

0 100 200 3000
50
100
F1u
crystal
film
Ba0.2
Sr0.8
TiO3
ω (c
m-1)
T (K)
E
Figure 8 D. A. Tenne and X. X. Xi
This is an author-produced, peer-reviewed version of this article. The final, definitive version of this document can be found online at Journal of the American Ceramic Society, published by Blackwell Publishing. Copyright restrictions may apply. doi: 10.1111/j.1551-2916.2008.02371.x
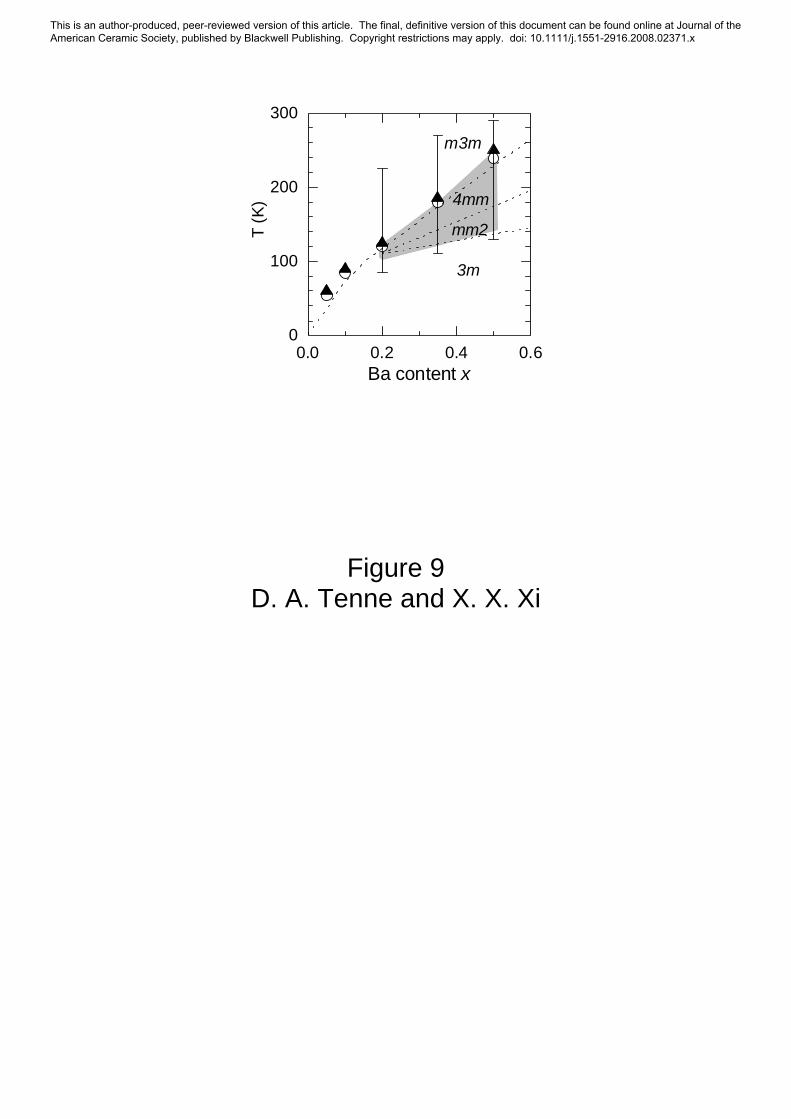
0.0 0.2 0.4 0.60
100
200
300
3m
4mm
mm2
m3m
T (K
)
Ba content x
Figure 9 D. A. Tenne and X. X. Xi
This is an author-produced, peer-reviewed version of this article. The final, definitive version of this document can be found online at Journal of the American Ceramic Society, published by Blackwell Publishing. Copyright restrictions may apply. doi: 10.1111/j.1551-2916.2008.02371.x

0.0
1.0x10⁻³
5.0x10³
1.0x10⁴
50
100
ε0/ε inverse dielectric constant
a)
Td
b)
ω2 (c
m-2)
soft modefrequency squared
c)
Γ (c
m-1)
soft modedamping
Figure 10 D. A. Tenne and X. X. Xi
This is an author-produced, peer-reviewed version of this article. The final, definitive version of this document can be found online at Journal of the American Ceramic Society, published by Blackwell Publishing. Copyright restrictions may apply. doi: 10.1111/j.1551-2916.2008.02371.x

200 400 600 200 400 600
Inte
nsity
(arb
. uni
ts)
Raman shift (cm-1)
295K
275K
225K
190K
185K
150K
100K
10K
285K
295K325K
Inte
nsity
(arb
. uni
ts) 285K
270K
250K
200K
175K
150K
100K
10K
b)a)
Figure 11 D. A. Tenne and X. X. Xi
This is an author-produced, peer-reviewed version of this article. The final, definitive version of this document can be found online at Journal of the American Ceramic Society, published by Blackwell Publishing. Copyright restrictions may apply. doi: 10.1111/j.1551-2916.2008.02371.x

0 100 200 300
240
260
280
520
540
TO2
ω (c
m-1)
T (K)
TO4
Figure 12 D. A. Tenne and X. X. Xi
This is an author-produced, peer-reviewed version of this article. The final, definitive version of this document can be found online at Journal of the American Ceramic Society, published by Blackwell Publishing. Copyright restrictions may apply. doi: 10.1111/j.1551-2916.2008.02371.x
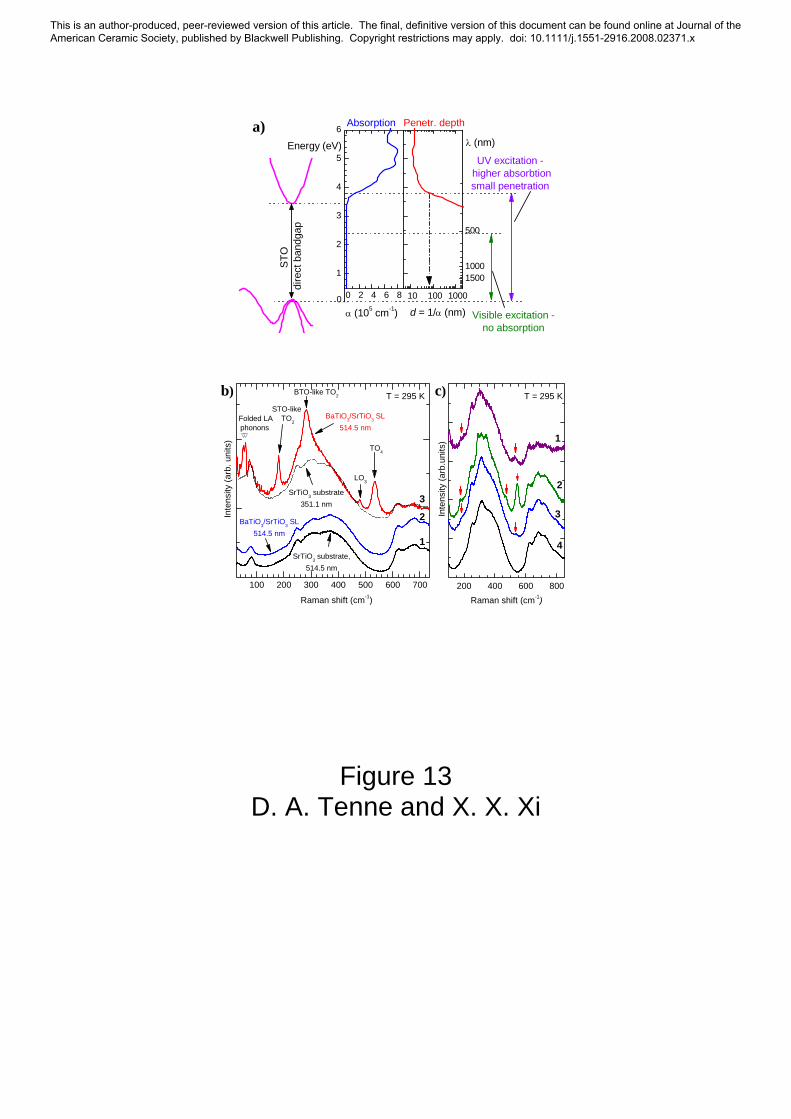
0 2 4 6 8
1
2
3
4
5
6
10 100 1000
500
10001500
Absorption
Energy (eV)
STO
di
rect
ban
dgap
Visible excitation -no absorption
UV excitation - higher absorbtionsmall penetration
0α (105 cm-1)
Penetr. depth
d = 1/α (nm)
λ (nm)a)
100 200 300 400 500 600 700 200 400 600 800
c)
BaTiO3/SrTiO3 SL514.5 nm
BaTiO3/SrTiO3 SL514.5 nm
SrTiO3 substrate,514.5 nm
3
2
BTO-like TO2
LO3
SrTiO3 substrate351.1 nm
Folded LA phonons
STO-like TO2
TO4
Inte
nsity
(arb
. uni
ts)
Raman shift (cm-1)
T = 295 K
1
b)
4
Inte
nsity
(arb
.uni
ts)
Raman shift (cm-1)
T = 295 K
3
2
1
Figure 13 D. A. Tenne and X. X. Xi
This is an author-produced, peer-reviewed version of this article. The final, definitive version of this document can be found online at Journal of the American Ceramic Society, published by Blackwell Publishing. Copyright restrictions may apply. doi: 10.1111/j.1551-2916.2008.02371.x
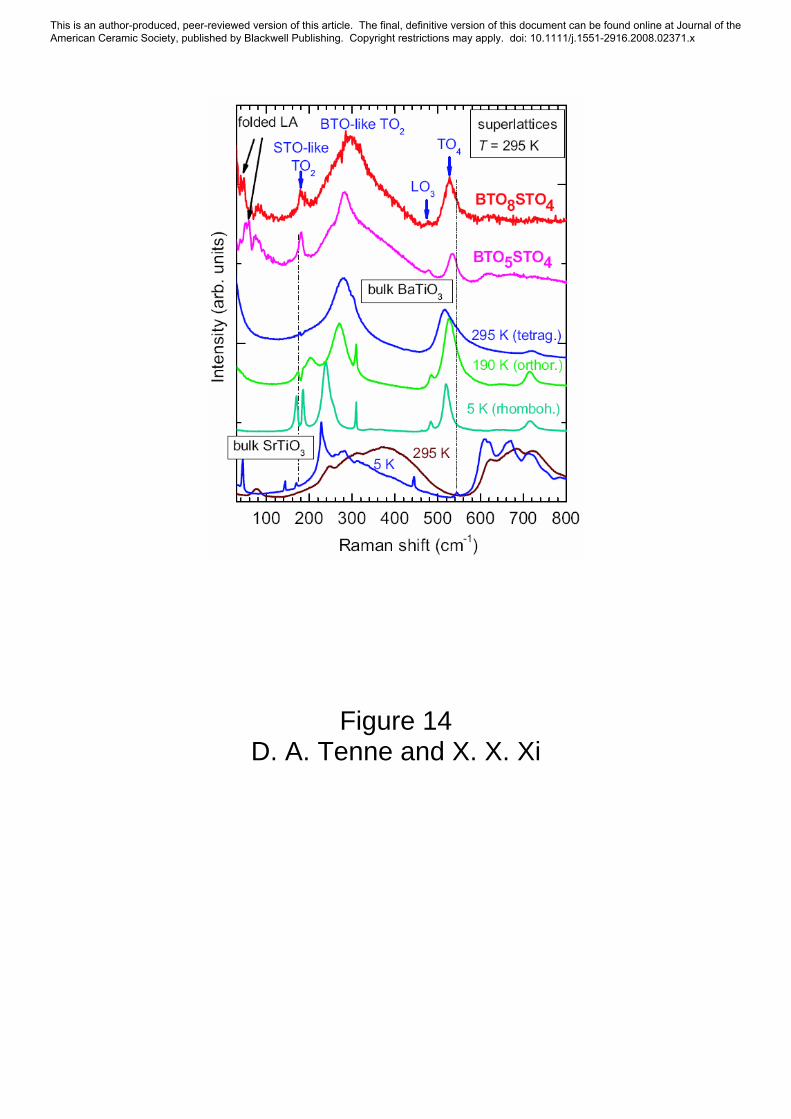
Figure 14 D. A. Tenne and X. X. Xi
This is an author-produced, peer-reviewed version of this article. The final, definitive version of this document can be found online at Journal of the American Ceramic Society, published by Blackwell Publishing. Copyright restrictions may apply. doi: 10.1111/j.1551-2916.2008.02371.x
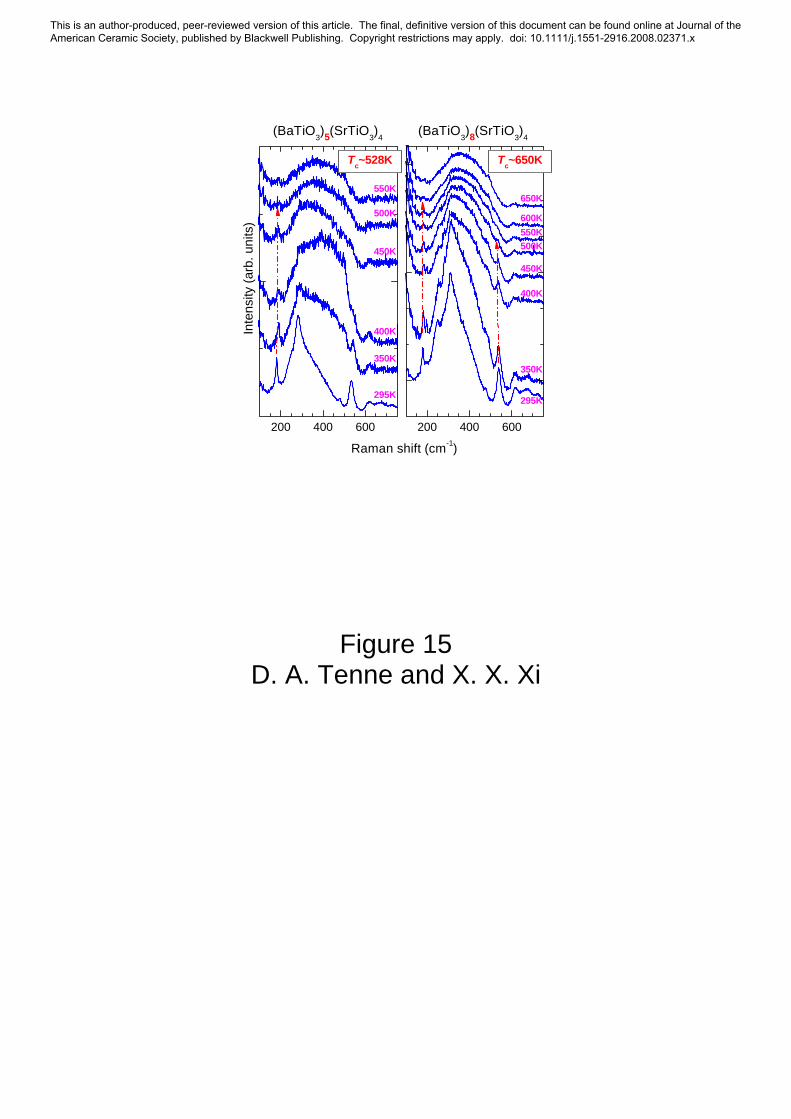
200 400 600
Raman shift (cm-1)
Inte
nsity
(arb
. uni
ts)
Tc~528K
550K
500K
450K
400K
350K
295K
(BaTiO3)5(SrTiO3)4 (BaTiO3)8(SrTiO3)4
200 400 600
Tc~650K
650K
600K550K500K
450K
400K
350K
295K
Figure 15 D. A. Tenne and X. X. Xi
This is an author-produced, peer-reviewed version of this article. The final, definitive version of this document can be found online at Journal of the American Ceramic Society, published by Blackwell Publishing. Copyright restrictions may apply. doi: 10.1111/j.1551-2916.2008.02371.x
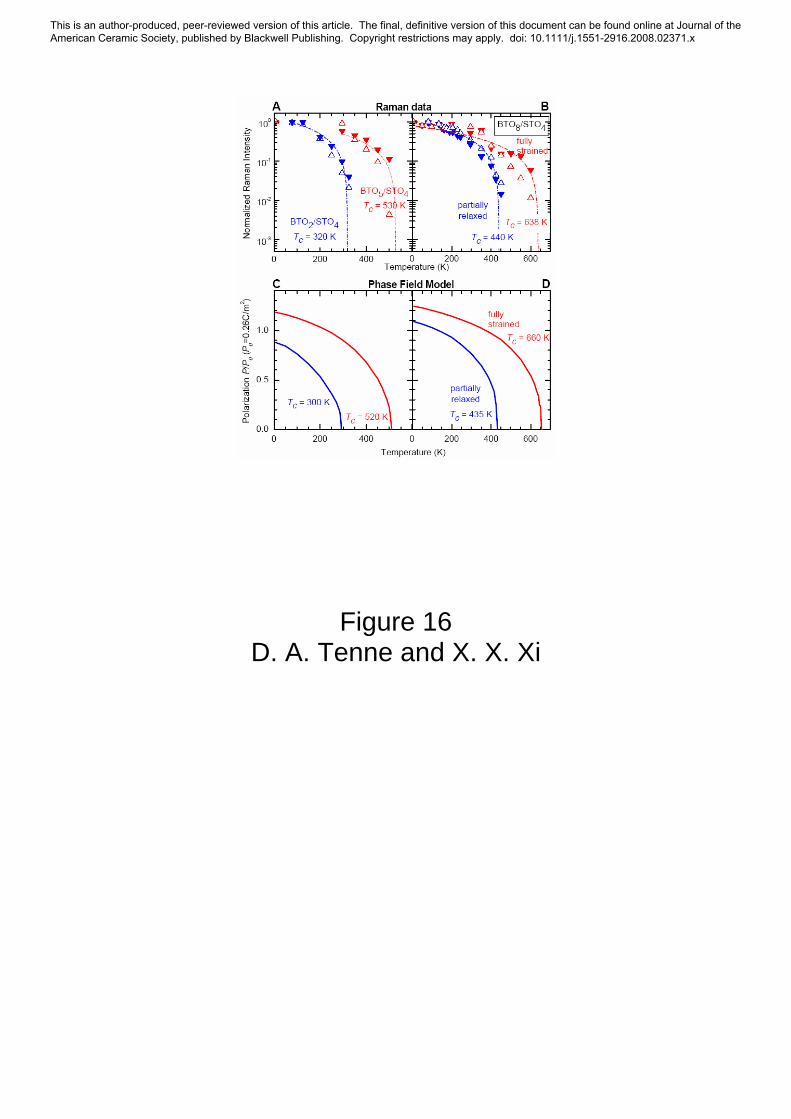
Figure 16 D. A. Tenne and X. X. Xi
This is an author-produced, peer-reviewed version of this article. The final, definitive version of this document can be found online at Journal of the American Ceramic Society, published by Blackwell Publishing. Copyright restrictions may apply. doi: 10.1111/j.1551-2916.2008.02371.x
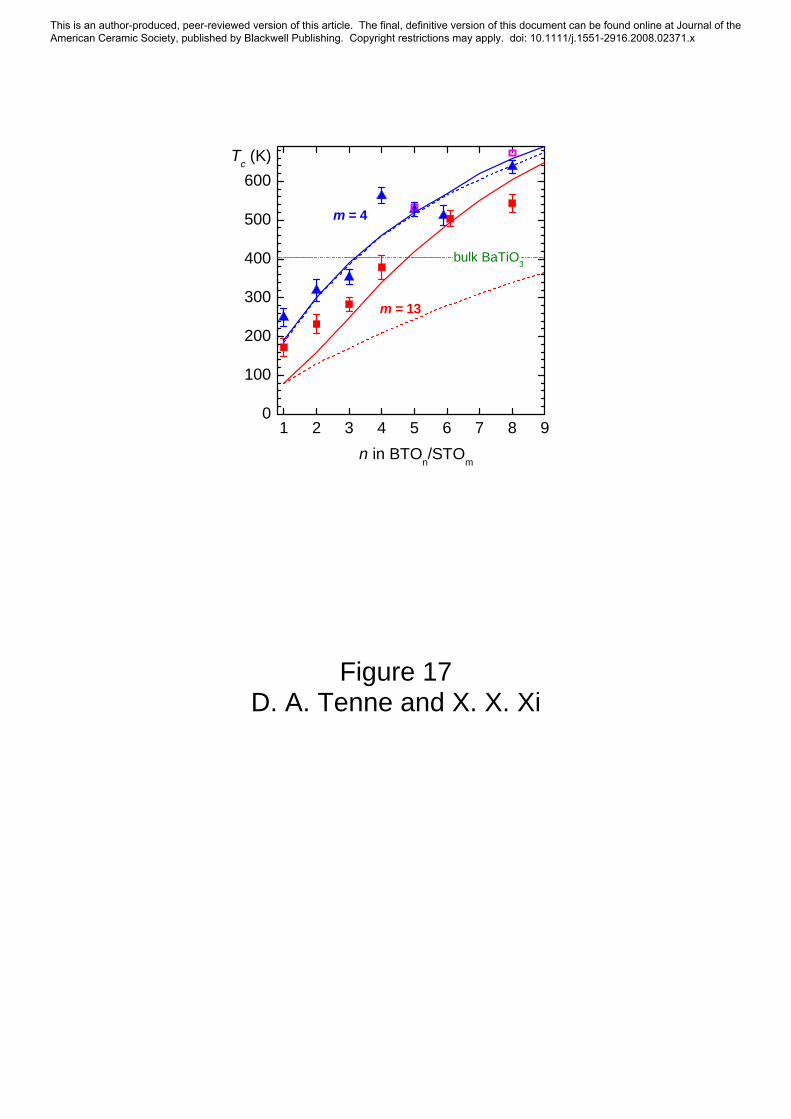
1 2 3 4 5 6 7 8 90
100
200
300
400
500
600
m = 4
m = 13
Tc (K)
n in BTOn/STOm
bulk BaTiO3
Figure 17 D. A. Tenne and X. X. Xi
This is an author-produced, peer-reviewed version of this article. The final, definitive version of this document can be found online at Journal of the American Ceramic Society, published by Blackwell Publishing. Copyright restrictions may apply. doi: 10.1111/j.1551-2916.2008.02371.x