Embed Size (px)
Citation preview
Raman Spectroscopy: a Valuable New Tool for Polymorph Analysis
2
Overview
• Raman spectroscopy –Rapidly growing technique
• New solution for polymorph screening– Multi-well format
– Automated data collection and analysis
• Result of a year-long collaboration with a major pharmaceutical company
3
Polymorphism
• Important issue for pharmaceutical industry–Physical properties
• Bioavailability, stability, dissolution, manufacturability
–Development and manufacturing
–Regulatory
–Intellectual property
4
Current Industry Status
• Polymorph characterization is moving to earlier stages in drug development
• More exhaustive screening– Parallel crystallization experiments
• Temperature
• Solvent selection
• Salt selection
• Recrystallization rate
• Increased analytical workload
• More data to analyze
• Demand for more automated analytical tools
5
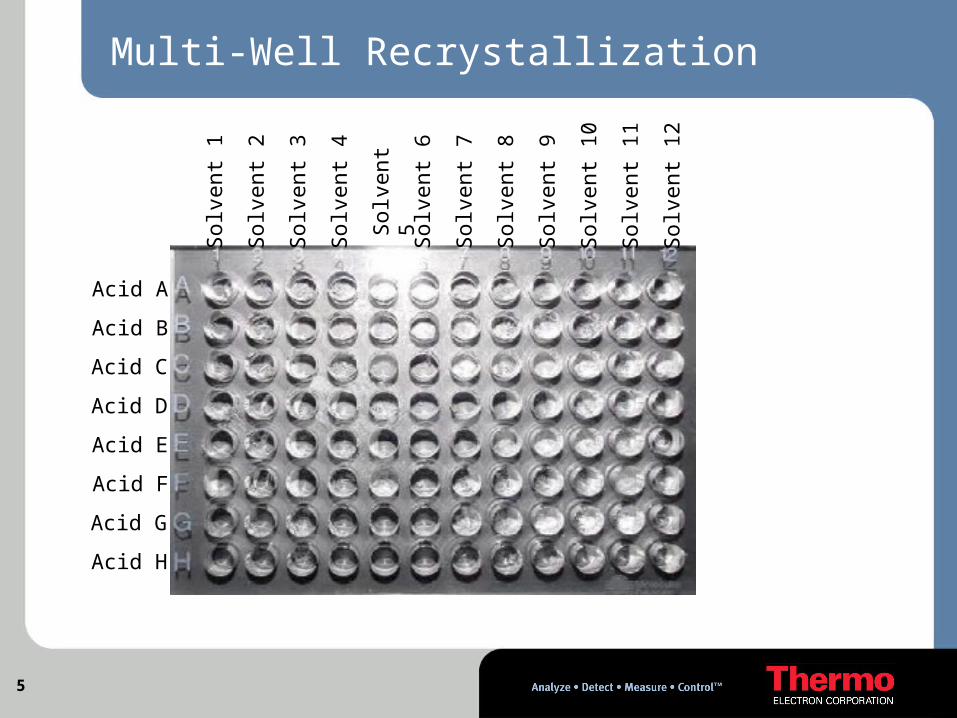
Multi-Well Recrystallization
Sol
vent
1
Sol
vent
2
Sol
vent
3
Sol
vent
4
Sol
vent
5
Sol
vent
6
Sol
vent
7
Sol
vent
8
Sol
vent
9
Sol
vent
10
Sol
vent
11
Sol
vent
12
Acid A
Acid B
Acid G
Acid C
Acid D
Acid F
Acid H
Acid E
6
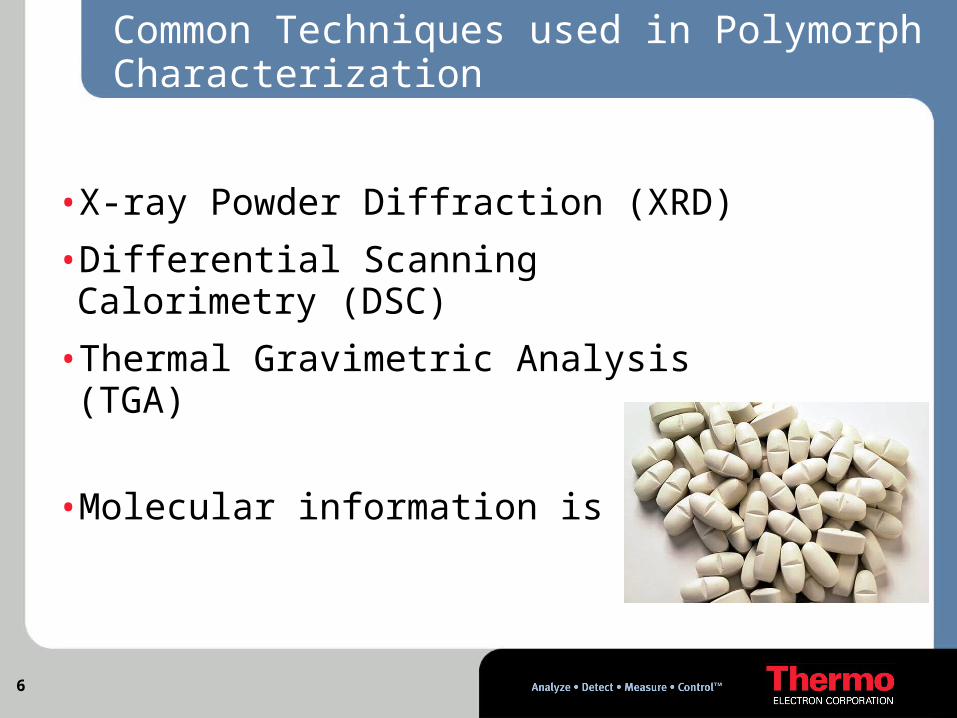
Common Techniques used in Polymorph Characterization
• X-ray Powder Diffraction (XRD)
• Differential Scanning Calorimetry (DSC)
• Thermal Gravimetric Analysis (TGA)
• Molecular information is lacking
7
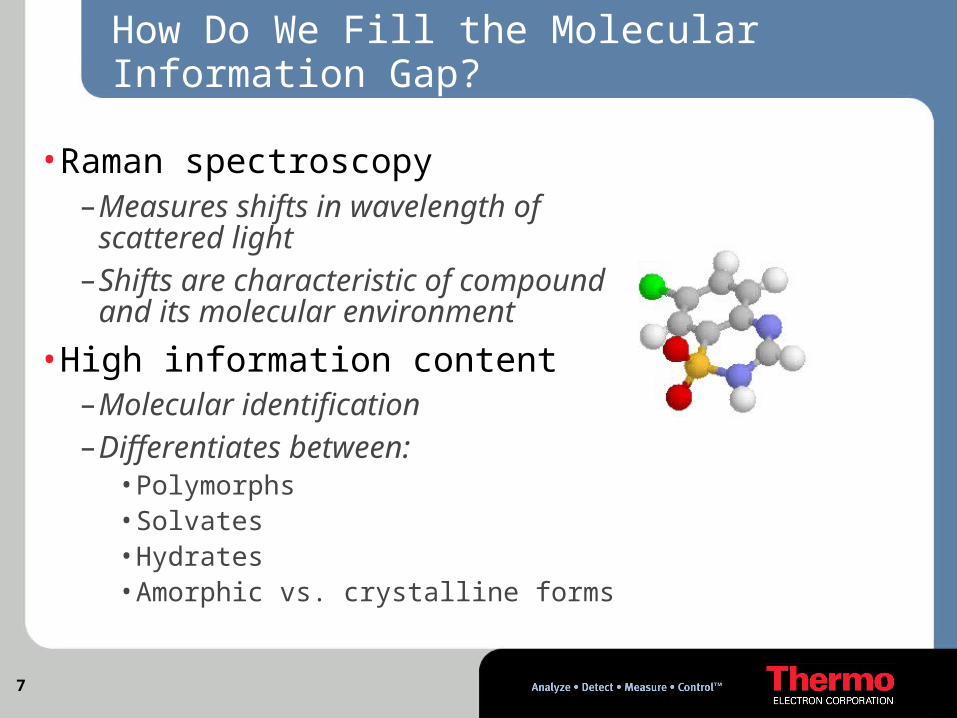
How Do We Fill the Molecular Information Gap?
• Raman spectroscopy –Measures shifts in wavelength of
scattered light –Shifts are characteristic of compound
and its molecular environment
• High information content–Molecular identification–Differentiates between:
• Polymorphs• Solvates• Hydrates• Amorphic vs. crystalline forms
8
Additional Benefits of Raman Spectroscopy
• Raman is well-suited to high throughput screening
• Non destructive
• Fast data acquisition (< 1 sec/sample)
• Little or no sample prep
• Flexible sampling–Microscope slides, glass vials,…etc.
–Measure directly in Microtiter™ plates (48, 96, 384 well)
–In situ monitoring
• Highly sensitive– Sample size flexibility (bulk or single crystal)
9
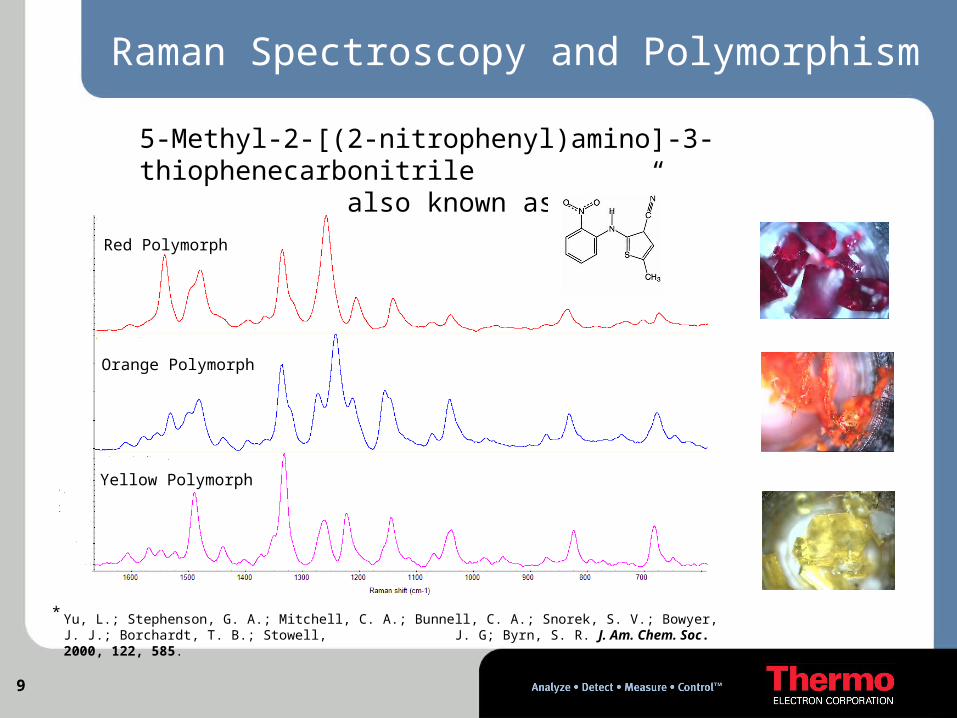
5-Methyl-2-[(2-nitrophenyl)amino]-3-thiophenecarbonitrile also known as “ROY” *
Raman Spectroscopy and Polymorphism
N
Yu, L.; Stephenson, G. A.; Mitchell, C. A.; Bunnell, C. A.; Snorek, S. V.; Bowyer, J. J.; Borchardt, T. B.; Stowell, J. G; Byrn, S. R. J. Am. Chem. Soc. 2000, 122, 585.
*
Yellow Polymorph
Orange Polymorph
Red Polymorph
10
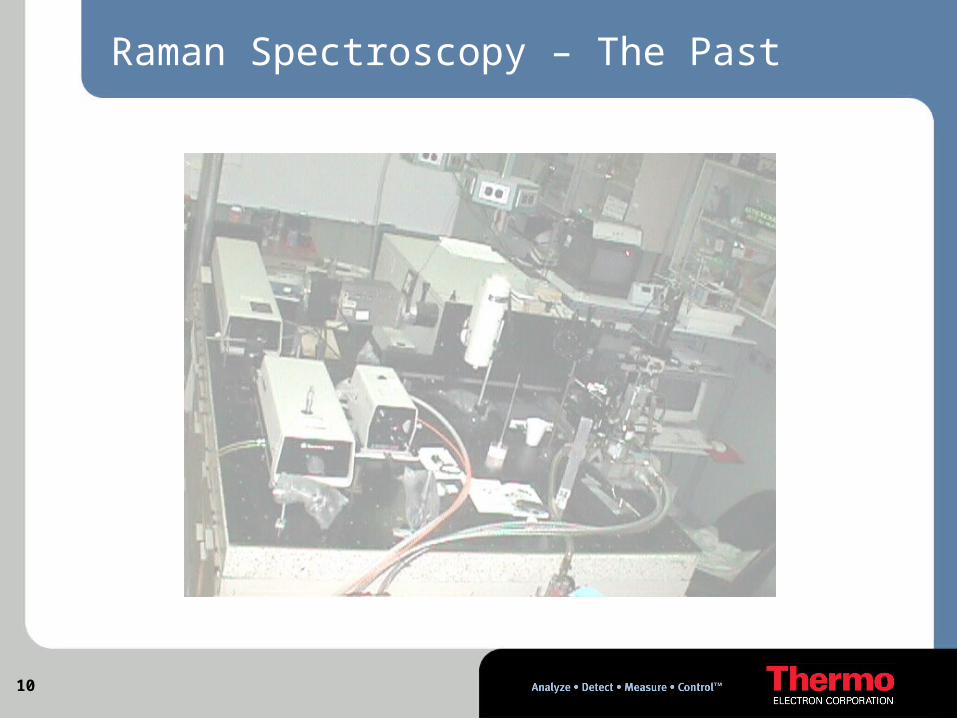
Raman Spectroscopy – The Past
11
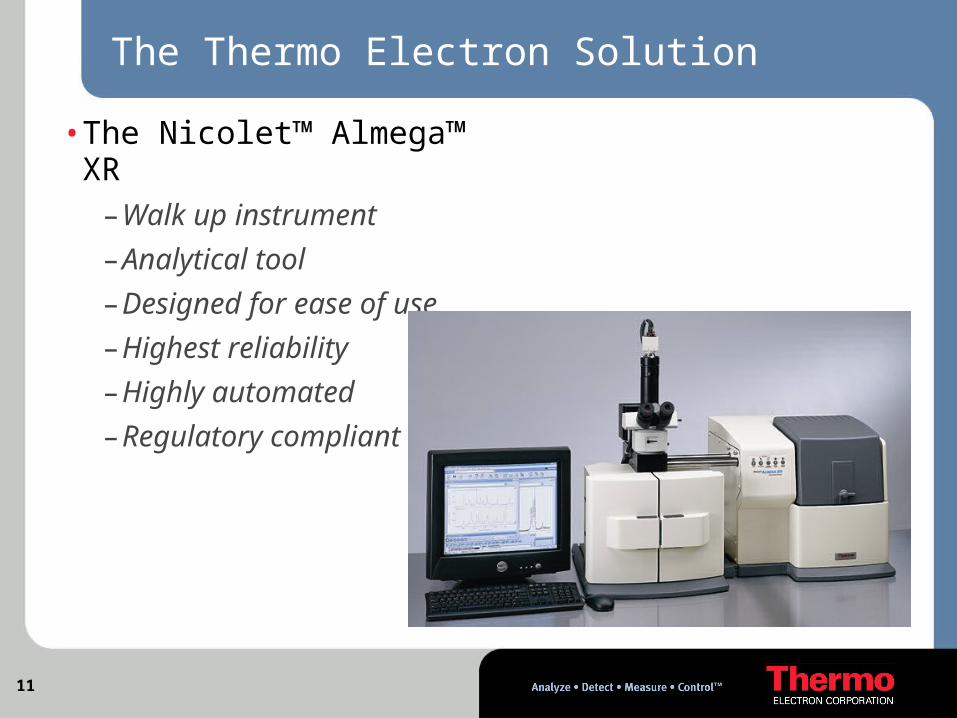
The Thermo Electron Solution
• The Nicolet™ Almega™ XR–Walk up instrument
–Analytical tool
–Designed for ease of use
–Highest reliability
–Highly automated
–Regulatory compliant
12
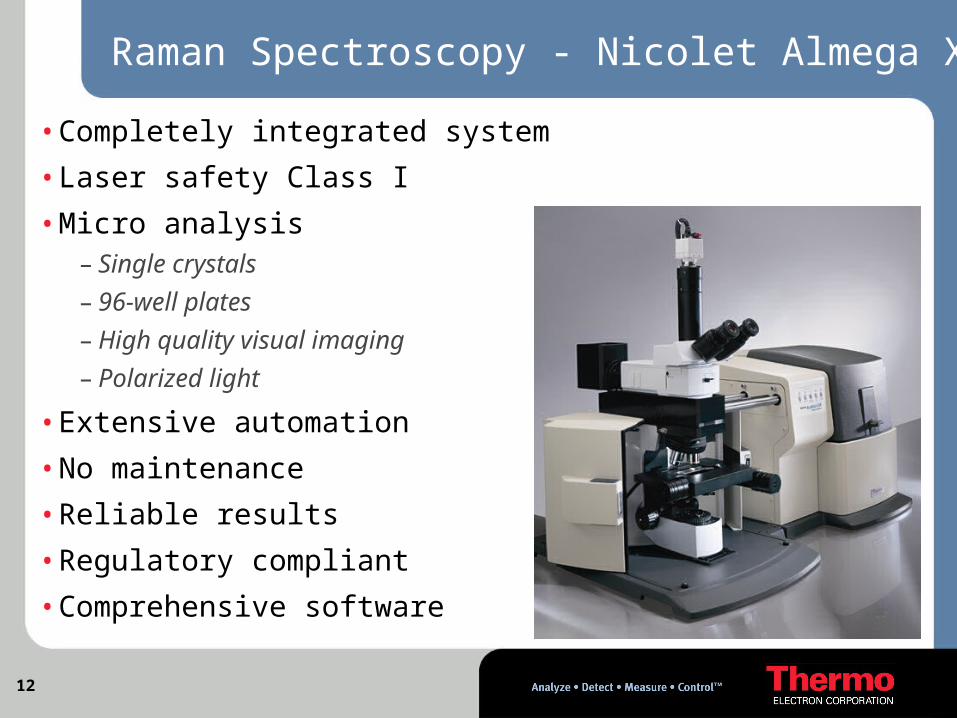
Raman Spectroscopy - Nicolet Almega XR
• Completely integrated system
• Laser safety Class I
• Micro analysis– Single crystals
– 96-well plates
– High quality visual imaging
– Polarized light
• Extensive automation
• No maintenance
• Reliable results
• Regulatory compliant
• Comprehensive software
13
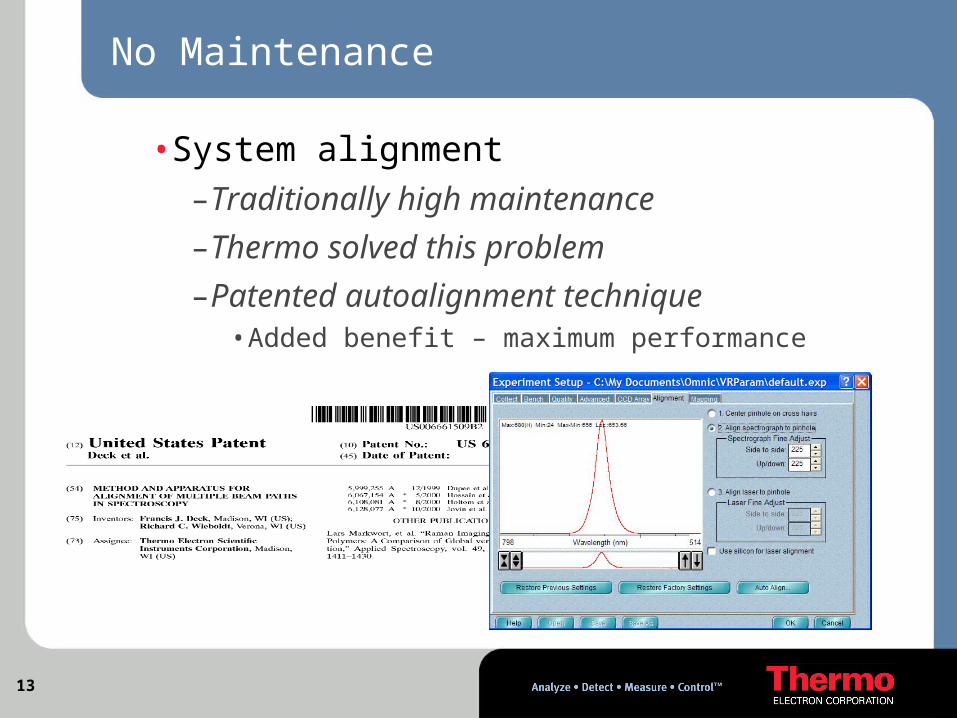
No Maintenance
• System alignment–Traditionally high maintenance
–Thermo solved this problem
–Patented autoalignment technique• Added benefit – maximum performance
14
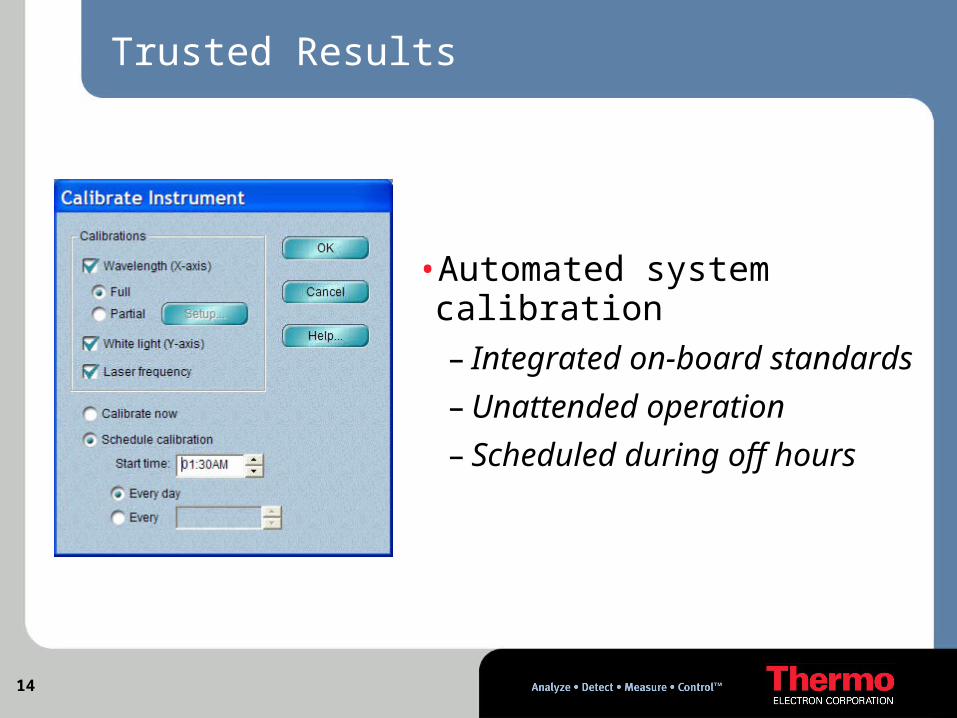
Trusted Results
• Automated system calibration– Integrated on-board standards
– Unattended operation
– Scheduled during off hours
15
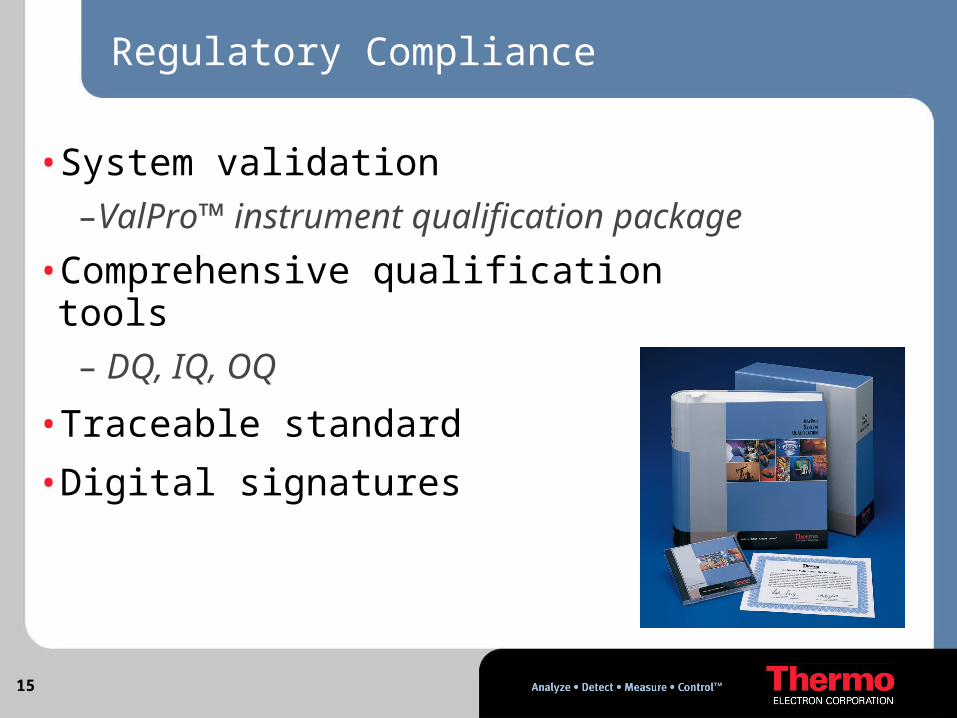
Regulatory Compliance
• System validation
–ValPro™ instrument qualification package
• Comprehensive qualification tools
– DQ, IQ, OQ
• Traceable standard
• Digital signatures
16
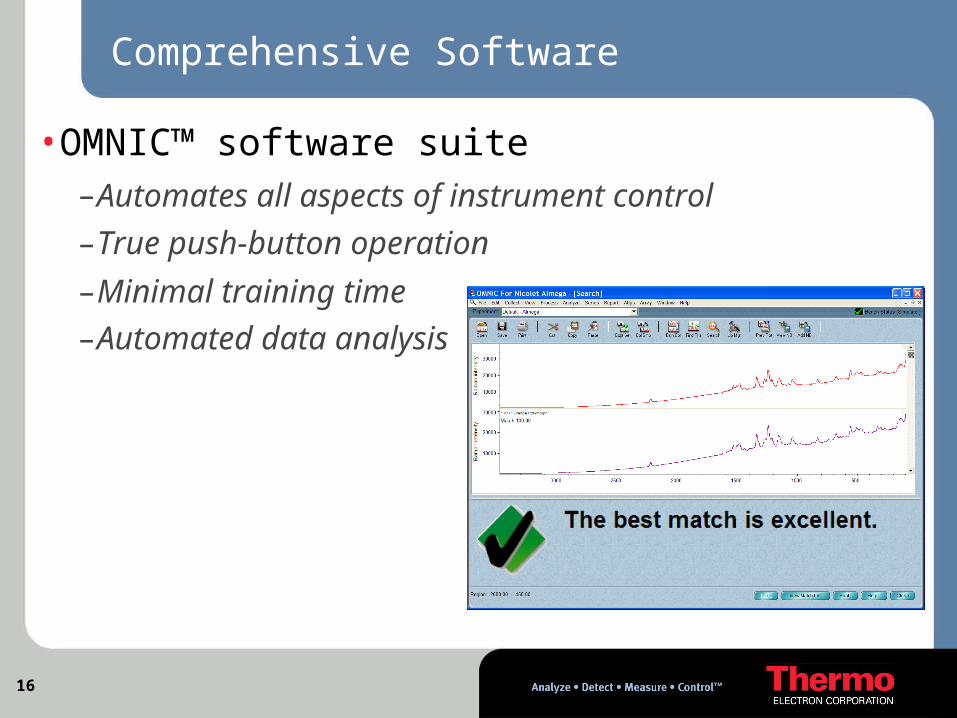
• OMNIC™ software suite–Automates all aspects of instrument control
–True push-button operation
–Minimal training time
–Automated data analysis
Comprehensive Software
17
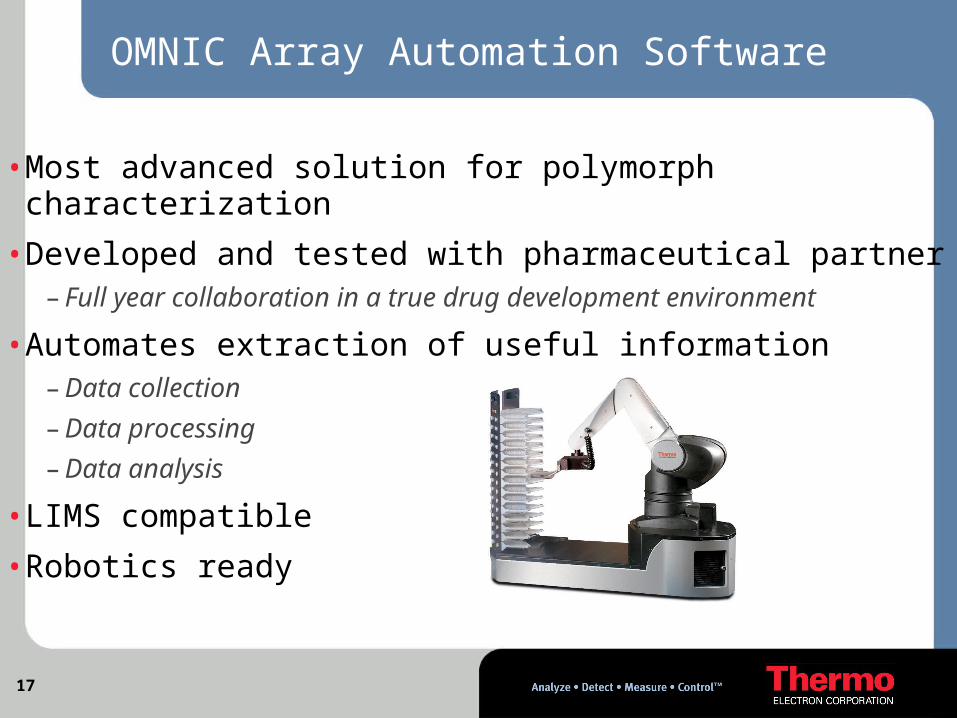
OMNIC Array Automation Software
• Most advanced solution for polymorph characterization
• Developed and tested with pharmaceutical partner– Full year collaboration in a true drug development environment
• Automates extraction of useful information – Data collection
– Data processing
– Data analysis
• LIMS compatible
• Robotics ready
18
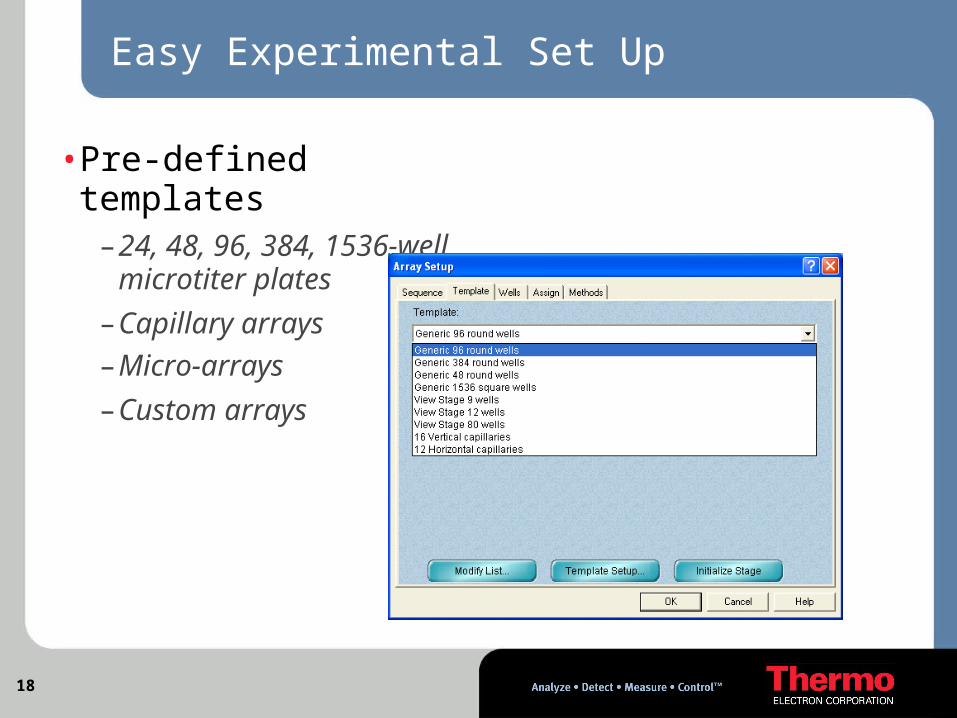
Easy Experimental Set Up
• Pre-defined templates–24, 48, 96, 384, 1536-well
microtiter plates
–Capillary arrays
–Micro-arrays
–Custom arrays
19
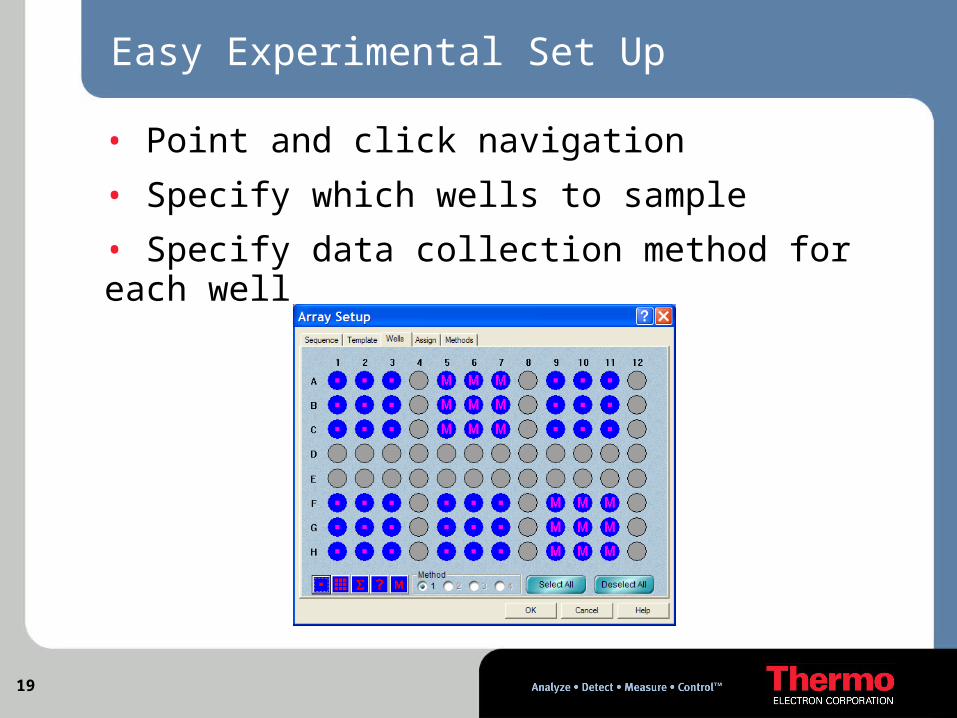
• Point and click navigation
• Specify which wells to sample
• Specify data collection method for each well
Easy Experimental Set Up
20
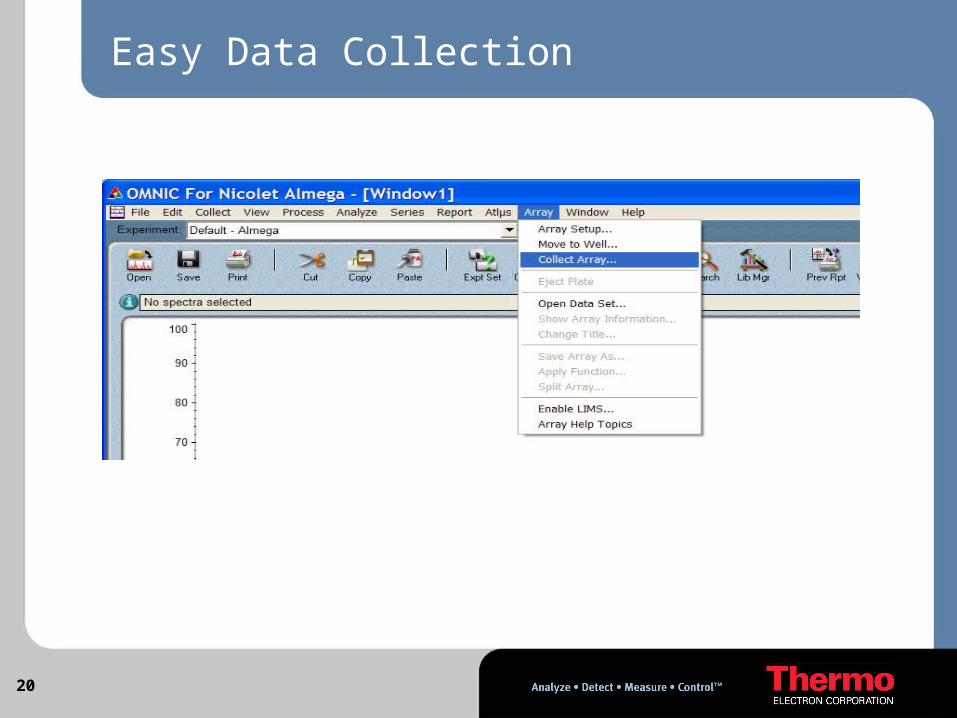
Easy Data Collection
21
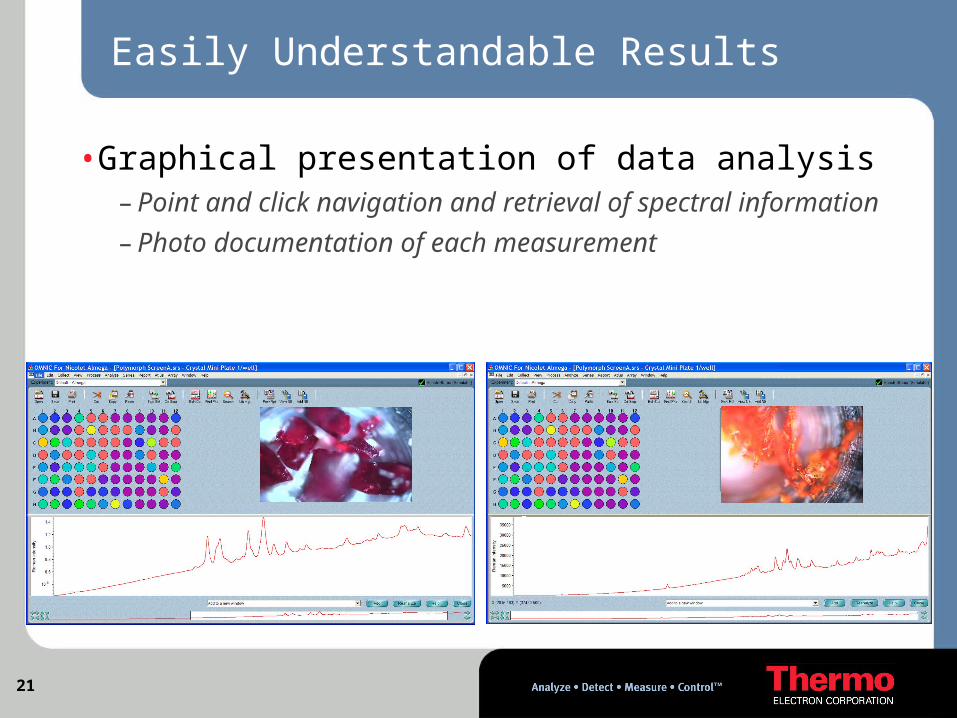
Easily Understandable Results
• Graphical presentation of data analysis– Point and click navigation and retrieval of spectral information
– Photo documentation of each measurement
22
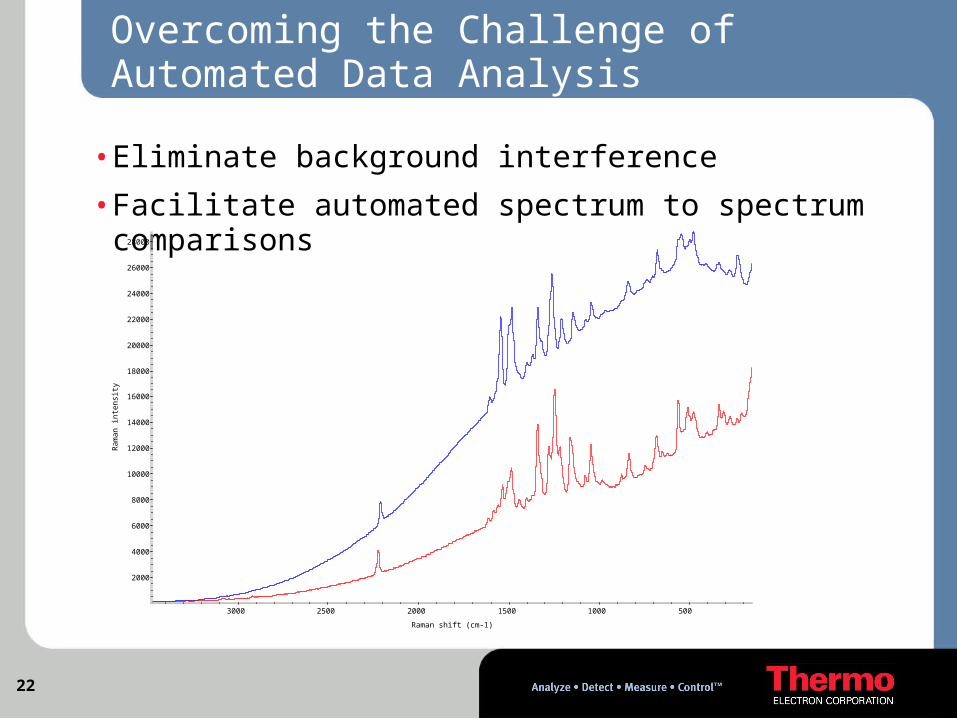
Overcoming the Challenge of Automated Data Analysis
• Eliminate background interference
• Facilitate automated spectrum to spectrum comparisons
2000
4000
6000
8000
10000
12000
14000
16000
18000
20000
22000
24000
26000
28000
Ram
an in
tens
ity
500 1000 1500 2000 2500 3000
Raman shift (cm-1)
23
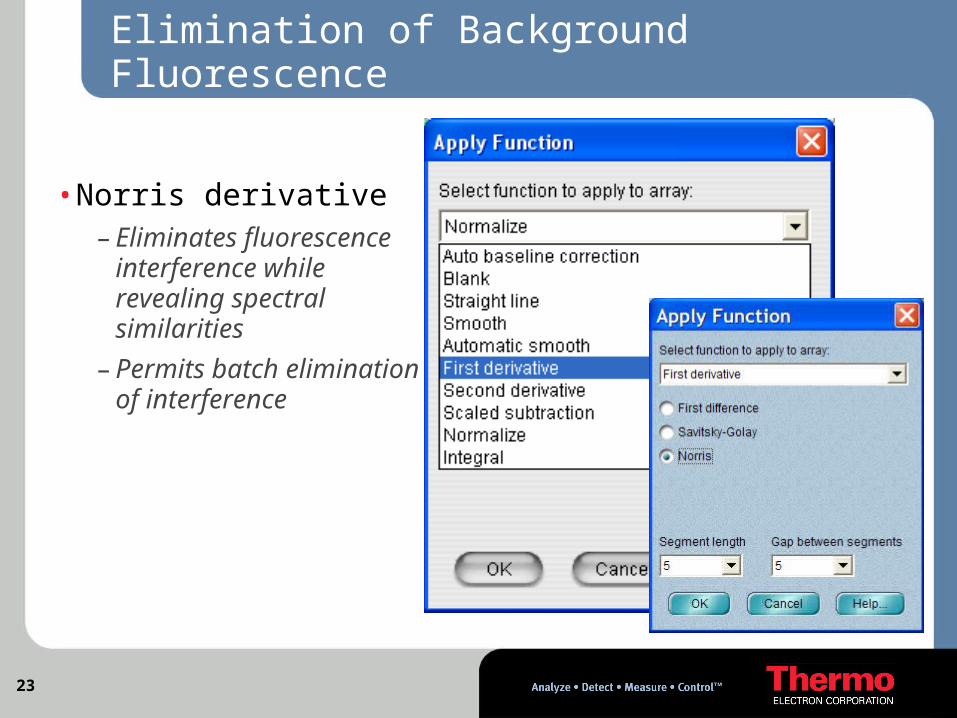
Elimination of Background Fluorescence
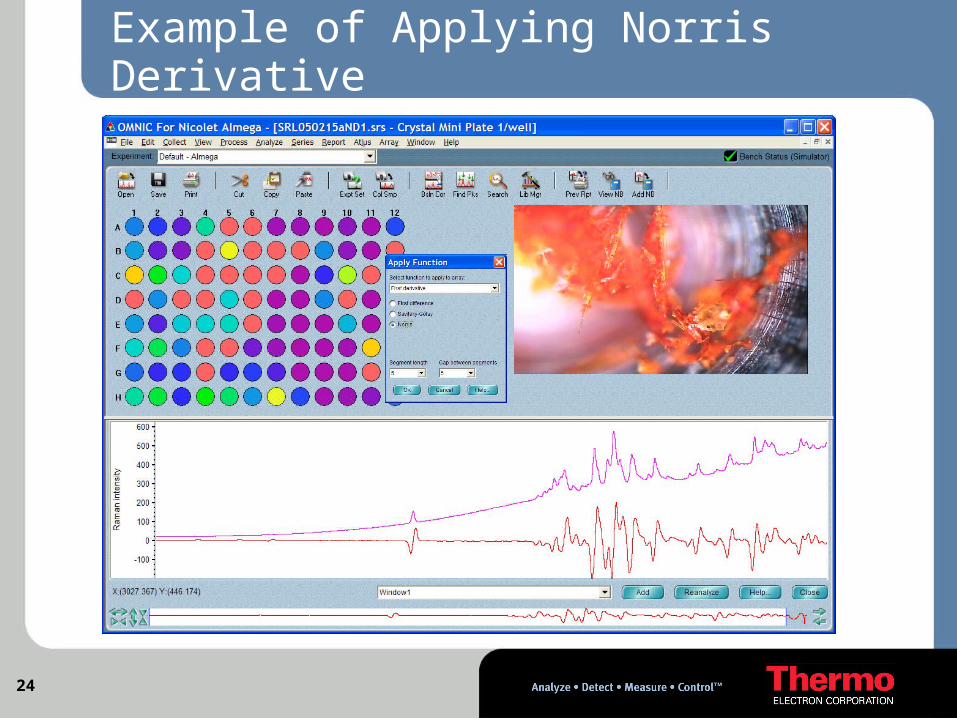
• Norris derivative – Eliminates fluorescence
interference while revealing spectral similarities
– Permits batch elimination of interference
24
Example of Applying Norris Derivative
25
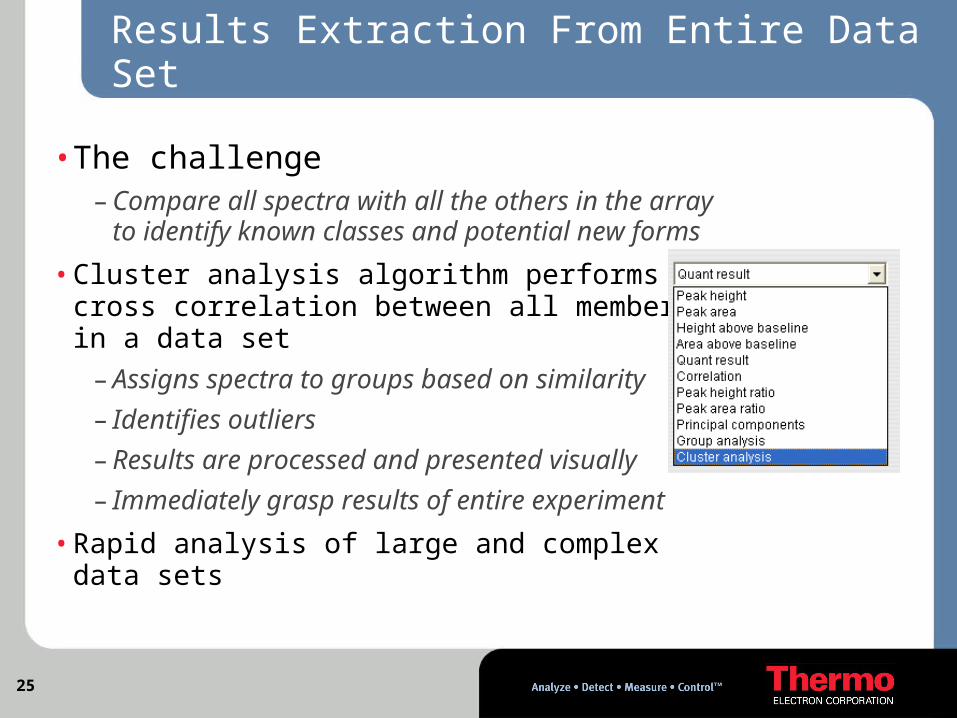
Results Extraction From Entire Data Set
• The challenge– Compare all spectra with all the others in the array
to identify known classes and potential new forms
• Cluster analysis algorithm performs a cross correlation between all members in a data set
– Assigns spectra to groups based on similarity
– Identifies outliers
– Results are processed and presented visually
– Immediately grasp results of entire experiment
• Rapid analysis of large and complex data sets
26
YellowCluster
Green Cluster
BlueClusterRed
Cluster
Purple Outliers
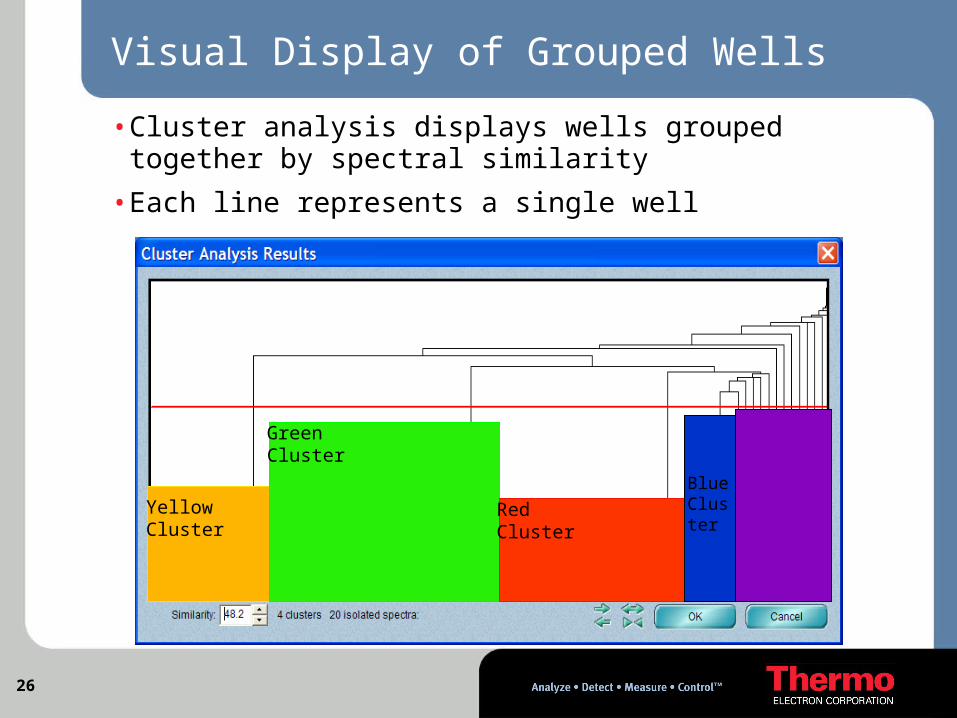
Visual Display of Grouped Wells
• Cluster analysis displays wells grouped together by spectral similarity
• Each line represents a single well
27
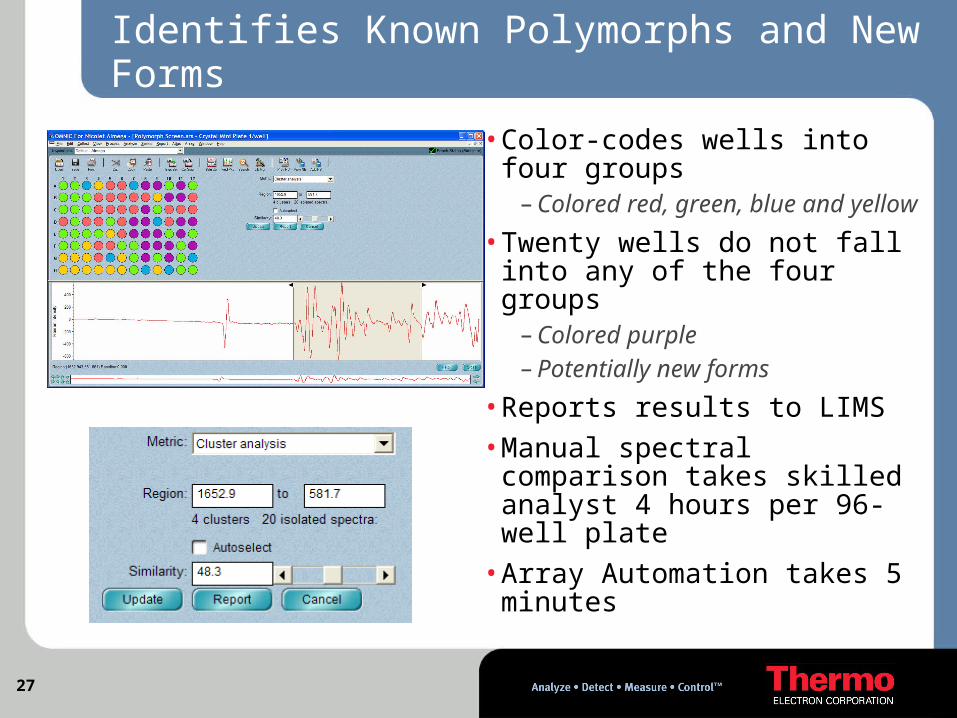
Identifies Known Polymorphs and New Forms
• Color-codes wells into four groups
– Colored red, green, blue and yellow
• Twenty wells do not fall into any of the four groups
– Colored purple– Potentially new forms
• Reports results to LIMS
• Manual spectral comparison takes skilled analyst 4 hours per 96-well plate
• Array Automation takes 5 minutes

28
Apply Norris derivative to eliminate fluorescence interference
Cluster analysis
Rapid Data Processing with Array Automation
Polymorphs identified by color coding
29
Summary
• Raman fills the critical molecular information gap
• The Thermo Raman tool is particularly well suited for the pharmaceutical analytical laboratory
–High degree of automation–High reliability–Automated data analysis–Complete instrument qualification tools
• Thermo has developed an advanced solution for polymorph screening
• Thermo is committed to partnering with you