Embed Size (px)
Citation preview

Standalone Financial StatementsSixty-eighth annual report 2015-2016
Rallis India Limited
RALLIS
94
Notes forming part of financial statements for the year ended 31 March 2016
Corporate Information:
Rallis India Limited (the “Company”) is an Indian public limited company, incorporated on 23 August, 1948, which is a subsidiary of Tata Chemicals Limited. It has been engaged primarily in the business of manufacture and marketing of Agri Inputs. The Company has its manufacturing facilities in India and sells both in India and across the globe. The Company is listed on the Bombay Stock Exchange (“BSE”) and the National Stock Exchange (“NSE”).
1. Significant Accounting Policies: -
(a) Basis of Accounting
The financial statements of the Company have been prepared in accordance with the Generally Accepted Accounting Principles in India (“Indian GAAP”) to comply with the Accounting Standards specified under Section 133 of the Companies Act, 2013, read with Rule 7 of the Companies (Accounts) Rules, 2014 and the relevant provisions of the Companies Act, 2013 (“the 2013 Act”) / Companies Act, 1956 (“the 1956 Act”), as applicable. The financial statements have been prepared on accrual basis under the historical cost convention. The accounting policies adopted in the preparation of the financial statements are consistent with those followed in the previous year.
All assets and liabilities have been classified as current or non-current as per the Company’s normal operating cycle and other criteria set out in the Schedule III to the Companies Act, 2013. The Company’s activities in its business segments have operating cycles which do not exceed 12 months. As a result, current assets comprise elements that are expected to be realised within 12 months after the reporting date and current liabilities comprise elements that are due for settlement within 12 months after the reporting date.
(b) Use of Estimates
The preparation of the financial statements in conformity with Indian GAAP requires the Management to make estimates and assumptions considered in the reported amounts of assets and liabilities (including contingent liabilities) and the reported income and expenses during the year. The Management believes that the estimates used in preparation of the financial statements are prudent and reasonable. Future results could differ due to these estimates and the differences between the actual results and the estimates are recognised in the periods in which the results are known / materialise.
(c) Fixed Assets and Depreciation / Amortisation
(i) Tangible fixed assets and depreciation
Tangible fixed assets acquired by the Company are reported at acquisition cost, with deductions for accumulated depreciation and impairment losses, if any.
The acquisition cost includes the purchase price (excluding refundable taxes) and expenses directly attributable to bring the asset to the location and condition for its intended use. Examples of directly attributable expenses included in the acquisition cost are delivery and handling costs, installation, legal services and consultancy services.
Where the construction or development of any such asset requiring a substantial period of time to set up for its intended use, is funded by borrowings, the corresponding borrowing costs are capitalised up to the date when the asset is ready for its intended use.
Depreciation has been provided as per Section 123 of the 2013 Act on a straight line method basis (“SLM”) over the estimated useful lives. Management believes based on a technical evaluation (which is based on technical advice, taking into account the nature of the asset, the estimated usage of the asset, the operating conditions of the asset, past history of replacement, anticipated technological changes, manufacturers

95
warranties and maintenance support, etc.) that the revised useful lives of the assets reflect the periods over which these assets are expected to be used, which are as follows:
Asset Revised useful life
Buildings, Factory Buildings ,etc. 3 years to 60 years
Computers and Data Processing Units 3 years to 10 years
Electrical Installations and Equipments 10 years to 15 years
Laboratory Equipments 10 years to 15 years
Office Equipments 3 years to 10 years
Furniture and Fixtures 3 years to 10 years
Vehicles 8 years
General Plant & Machinery 2 years to 30 years
Leasehold land is amortised over the duration of the lease.
(ii) Intangible assets and amortisation
Intangible assets other than goodwill are valued at cost less amortisation and impairment losses, if any. These generally comprise of costs incurred to acquire computer software licenses and implement the software for internal use (including software coding, installation, testing and certain data conversion) as well as costs incurred for obtaining approvals from registration authorities of products having proven technical feasibility.
Research costs are charged to the statement of Profit and Loss as they are occurred.
Costs incurred for applying research results or other knowledge to develop new products, are capitalised to the extent that these products or registrations are expected to generate future financial benefits. Other development costs are expensed as and when they arise.
Goodwill comprises the portion of purchase price for an acquisition that exceeds the market value of the identifiable assets, with deductions for liabilities, calculated on the date of acquisition, on the Company’s share in the acquired company’s assets.
Intangible assets are reported at acquisition value with deductions for accumulated amortisation and impairment losses, if any.
Amortisation is provided on a straight line basis over the asset’s anticipated useful life. The useful life is determined based on the period of the underlying contract or the period of time over which the intangible asset is expected to be used, whichever is lower and generally does not exceed 10 years. The estimated useful life of the intangible asset and the amortisation period are reviewed at the end of each financial year and amortisation period is revised to reflect the change in pattern if any.
An impairment test of intangible assets is conducted annually or more often if there is an indication of a decrease in value. The impairment loss, if any, is reported in the Statement of Profit and Loss.
(d) Impairment of assets
The carrying values of assets of the Company’s cash-generating units are reviewed for impairment annually or more often if there is an indication of decline in value. If any indication of such impairment exists, the recoverable amounts of those assets are estimated and impairment loss is recognised, if the carrying amount of those assets exceeds their recoverable amount. The recoverable amount is the greater of the net selling price and the value in use of those assets. Value in use is arrived at by discounting the estimated future cash flows to their present value based on an appropriate discount factor.

Standalone Financial StatementsSixty-eighth annual report 2015-2016
Rallis India Limited
RALLIS
96
(e) Investments
Long term investments are valued at cost, less provision for other than temporary diminution in value, if any. Current investments are carried at lower of cost and fair value.
Investments that are readily realisble and are intended to be held for not more than one year from the date, on which such investments are made, are classified as “Current” investments. All other investments are classified as “Long Term”.
(f) Inventory
Inventories are valued at the lower of cost and net realisable value.
In case of raw materials, packing materials, stores and spare parts and traded finished goods, costs are determined in accordance with continuous moving weighted average principle. Costs include purchase price, non-refundable taxes and delivery and handling costs.
Cost of finished goods and work-in-progress are determined using the absorption costing principles. Cost includes cost of materials consumed, labour and a systematic allocation of variable and fixed production overheads. Excise duties at the applicable rates are also included in the cost of finished goods.
Net realisable value is estimated at the expected selling price less estimated completion and selling costs.
(g) Revenue Recognition
Sales include products and services, net of trade discounts and exclude sales tax, state value added tax and service tax.
With regard to sale of products, income is reported when all obligations connected with the transfer of risks and rewards to the buyer have been fulfilled, after the price has been determined and collection of the receivable is reasonably certain.
Income recognition for services takes place as and when the services are performed.
Amounts received from customers specifically towards setting up / expansion of manufacturing facilities, linked to a contractual arrangement for supply of specified quantities of product manufactured from the said facilities at pre-determined prices, are treated as liabilities and recognized as revenue in the Statement of Profit and Loss over the contracted period of supply in proportion to the quantities dispatched.
(h) Interest Income and Borrowing Cost
Interest income is recognised as interest accrued on a time proportion basis taking into account the amount outstanding against the financial asset and the rate applicable provided no significant uncertainty exists as to measurability or collectability.
Borrowing (finance costs) are generally expensed as incurred except where they relate to the financing of construction or development of qualifying assets requiring a substantial period of time to prepare for their intended future use. Ordinarily, the term “substantial period of time” is considered to mean a period of 12 months or more unless a shorter or longer period could be justified on the basis of facts and circumstances of a specific case.
Borrowing costs are capitalised up to the date when the asset is ready for its intended use. The amount of finance costs capitalised (before the effects of income tax) for the period is determined by applying the interest rate applicable to appropriate borrowings outstanding during the period to the average amount of capitalised expenditure for the qualifying assets during the period.

97
(i) Foreign Currency Transactions
Transactions in foreign currencies are translated to the reporting currency based on the exchange rate on the date of the transaction. Exchange differences arising on settlement thereof during the year are recognised as income or expenses in the Statement of Profit and Loss.
Cash and bank balances, receivables and liabilities (monetary items) in foreign currencies as at the year end are valued at year end rates, and unrealised translation differences are included in the Statement of Profit and Loss.
The Company’s forward exchange contracts are not held for trading or speculation. The premium/discount arising on entering into such contract is amortised over the life of such contracts and exchange differences arising on such contracts are recognised in the Statement of Profit and Loss.
(j) Employee Benefits
Short term employee benefits are recognised as an expense at the undiscounted amount expected to be paid over the period of services rendered by the employees to the Company.
The Company has both defined-contribution and defined-benefit plans, of which some have assets in special funds or securities. The plans are financed by the Company and in the case of some defined contribution plans by the Company along with its employees.
The contribution as specified under the law are paid to the Provident Fund set up as irrevocable trust by the Company or to the Regional Provident Fund Commissioner when the corresponding services to which these contributions relate are rendered by employees. The Company is generaly liable for contribution and any shortfall in the fund assets based on the government specified minimum rates of return. Such contributions and shortfall, if any, are recognised in the Statement of Profit and Loss as an expense in the year incurred.
Expenses for gratuity and supplemental payment plans are calculated as at the balance sheet date by independent actuaries using the projected unit credit method in a manner that distributes expenses over the employee’s working life. These commitments are valued at the present value of the expected future payments, with consideration for calculated future salary increases, using a discount rate corresponding to the interest rate estimated by the actuary having regard to the interest rate on government bonds with a remaining term that is almost equivalent to the average balance working period of employees.
Compensated absences which accrue to employees and which can be carried to future periods but are expected to be encashed or availed in twelve months immediately following the year end are reported as expenses during the year in which the employees perform the services that the benefit covers and the liabilities are reported at the undiscounted amount of the benefits after deducting amounts already paid. Where there are restrictions on availment or encashment of such accrued benefit or where the availment or encashment is otherwise not expected to wholly occur in the next twelve months, the liability on account of the benefit is actuarially determined using the projected unit credit method.
(k) Taxes on Income
The Company’s income taxes include taxes on the Company’s taxable profits, adjustment attributable to earlier periods and changes in deferred taxes. Valuation of all tax liabilities / receivables is conducted at nominal amounts and in accordance with enacted tax regulations and tax rates or in the case of deferred taxes, those that have been enacted or substantively enacted.
Deferred tax is calculated to correspond to the tax effect arising when final tax is determined. Deferred tax corresponds to the net effect of tax on all timing differences which occur as a result of items being allowed for income-tax purposes during a period different from when they were recognised in the financial statements.

Standalone Financial StatementsSixty-eighth annual report 2015-2016
Rallis India Limited
RALLIS
98
Deferred tax assets are recognised with regard to all deductible timing differences to the extent that it is probable that taxable profit will be available against which deductible timing differences can be utilised. When the Company carries forward unused tax losses and unabsorbed depreciation, deferred tax assets are recognised only to the extent there is virtual certainty backed by convincing evidence that sufficient future taxable income will be available against which deferred tax assets can be realised.
The carrying amount of deferred tax assets is reviewed at each balance sheet date and reduced to the extent that it is no longer probable that sufficient taxable profit will be available to allow all or a part of the aggregate deferred tax asset to be utilised.
(l) Operating Leases
Leases in which significant portion of risks and rewards of ownership are retained by the lessor are classified as operating leases. Payments made towards operating lease arrangements are charged to the Statement of Profit and Loss on a straight line basis over the period of lease.
(m) Segment Reporting
The accounting policies adopted for segment reporting are in line with the accounting policies of the Company. Segment Revenue, Segment Expenses, Segment Assets and Segment Liabilities have been identified to segments on the basis of their relationship to the operating activities of the segment. Revenue, expenses, assets and liabilities which relate to the Company as a whole and are not allocable to segments on reasonable basis, have been included under “Unallocated Revenue / Expenses / Assets / Liabilities”.
(n) Provisions and Contingencies
A provision is recognised when the Company has a present obligation as a result of a past event and it is probable that an outflow of resources will be required to settle the obligation, in respect of which a reliable estimate can be made. Provisions (excluding retirement benefits) are not discounted to their present value and are determined based on best estimate required to settle the obligation at the balance sheet date. These are reviewed at each balance sheet date and adjusted to reflect the current best estimates. Where these is a possible obligation arising from past events, the existence of which will be confirmed only by the occurrence or non-occurrence of one or more uncertain future events not wholly within the control of the Company or where it is either not probable that and outflow of resources will be required to settle or a reliable estimate of the amount can not be made, the obligation is termed as a contingent liability. Contingent liabilities are not recognised but are disclosed in the notes to the financial statements unless the possibility of an outflow of resources embodying economic benefit is remote. A contingent asset is neither recognised nor disclosed.
(o) Cash Flow Statements
Cash-flow statements are prepared in accordance with the “Indirect Method” as explained in the Accounting Standard (AS) 3 - Cash Flow Statements.
(p) Cash and bank balance
Cash comprises cash on hand and demand deposits with banks. Cash equivalents are short-term balances (with an original maturity of three months or less from the date of acquisition), highly liquid investments that are readily convertible into known amounts of cash and which are subject to insignificant risk of changes in value.
(q) Earnings per Share
Basic Earnings per Share is calculated by dividing the net profit after tax for the year attributable to equity shareholders of the Company by the weighted average number of equity shares outstanding during the year.

99
2 Share Capital:
As at 31 March, 2016 As at 31 March, 2015
Number of shares
` lac Number of shares
` lac
Authorised
Equity Shares of ` 1 each with voting rights 500,000,000 5,000.00 500,000,000 5,000.00
Cumulative Redeemable Preference Shares of ` 10 each 150,000,000 15,000.00 150,000,000 15,000.00
Issued
Equity Shares of ` 1 each 194,470,890 1,944.71 194,470,890 1,944.71
Subscribed and Fully Paid up
Equity Shares of ` 1 each 194,468,890 1,944.69 194,468,890 1,944.69
Forfeited Shares
Equity Shares of ` 1 each 2,000 0.02 2,000 0.02
Total 194,470,890 1,944.71 194,470,890 1,944.71
footnotes:
a. Reconciliation of the number of shares and amount outstanding at the beginning and at the end of the year:
As at 31 March, 2016 As at 31 March, 2015
Number of shares
` lac Number of shares
` lac
Issued
At the beginning of the year 194,470,890 1,944.71 194,470,890 1,944.71
Outstanding at the end of the year 194,470,890 1,944.71 194,470,890 1,944.71
Subscribed and fully paid up
At the beginning of the year 194,468,890 1,944.69 194,468,890 1,944.69
Outstanding at the end of the year 194,468,890 1,944.69 194,468,890 1,944.69
b. The Company has issued one class of equity shares having a par value of `1 per share. Each shareholder is eligible for one vote per share held. The dividend proposed by the Board of Directors is subject to the approval of the shareholders in the ensuing Annual General Meeting, except in case of interim dividend. In the event of liquidation, the equity shareholders are eligible to receive the remaining assets of the Company after distribution of all preferential amounts, in proportion to their shareholding.
c. Details of shares held by the Holding Company:
Out of total equity shares issued by the Company, shares held by its Holding Company are as below:
As at 31 March, 2016 As at 31 March, 2015
Particulars Number of shares
` lac Number of shares
` lac
Tata Chemicals Limited (Holding Company) 97,341,610 973.42 97,341,610 973.42

Standalone Financial StatementsSixty-eighth annual report 2015-2016
Rallis India Limited
RALLIS
100
d. Details of shares held by each shareholder holding more than 5% shares in the Company:
As at 31 March, 2016 As at 31 March, 2015
Particulars Number of Shares
% Holding Number of Shares
% Holding
Tata Chemicals Limited 97,341,610 50.06% 97,341,610 50.06%
Rakesh Jhunjhunwala 20,105,820 10.34% 20,105,820 10.34%
ICICI Prudential Mutual Fund 15,333,781 7.88% 4,433,565 2.28%
e. As per records of the Company as at 31 March, 2016, no calls remain unpaid by the directors and officers of the Company.
3 Reserves and Surplus: ` lac
As at 1 April,
2015
Additions Utilisation/ Transfer
As at 31 March,
2016
As at 1 April,
2014
Additions Utilisation/ Transfer
As at 31 March,
2015
Capital Reserve 1,243.10 - - 1,243.10 1,243.10 - - 1,243.10
Capital Redemption Reserve 8,151.77 - - 8,151.77 8,151.77 - - 8,151.77
Securities Premium Account 8,793.88 - - 8,793.88 8,793.88 - - 8,793.88
Capital Subsidy 63.58 - - 63.58 63.58 - - 63.58
General Reserve* 16,389.73 1,260.20 - 17,649.93 14,935.56 1,454.17 - 16,389.73
Closing Balance (A) 34,642.06 1,260.20 - 35,902.26 33,187.89 1,454.17 - 34,642.06
Surplus in the Statement of Profit and Loss
Opening Balance 43,208.75 - - 43,208.75 36,191.61 - - 36,191.61
Depreciation on transition to Schedule II of the Companies Act, 2013 on tangible fixed assets with nil remaining useful life (Net of deferred tax) (Refer note 41)
- - - - - - 236.63 (236.63)
Net Profit for the current year - 12,601.97 - 12,601.97 - 14,541.71 - 14,541.71
Interim Dividend on Equity Shares
- - - - - - 1,944.69 (1,944.69)
Distribution Tax on Interim Dividend
- - - - - - 388.81 (388.81)
Proposed Equity Dividend - - 4,861.72 (4,861.72) - - 2,917.03 (2,917.03)
Distribution Tax on Proposed Equity Dividend
- - 989.73 (989.73) - - 583.24 (583.24)
Transfer to General Reserves - - 1,260.20 (1,260.20) - - 1,454.17 (1,454.17)
Closing Balance (B) 43,208.75 12,601.97 7,111.65 48,699.07 36,191.61 14,541.71 7,524.57 43,208.75
Total (A+B ) 77,850.81 13,862.17 7,111.65 84,601.33 69,379.50 15,995.88 7,524.57 77,850.81
* Transfer from surplus in the Statment of Profit and Loss.
101
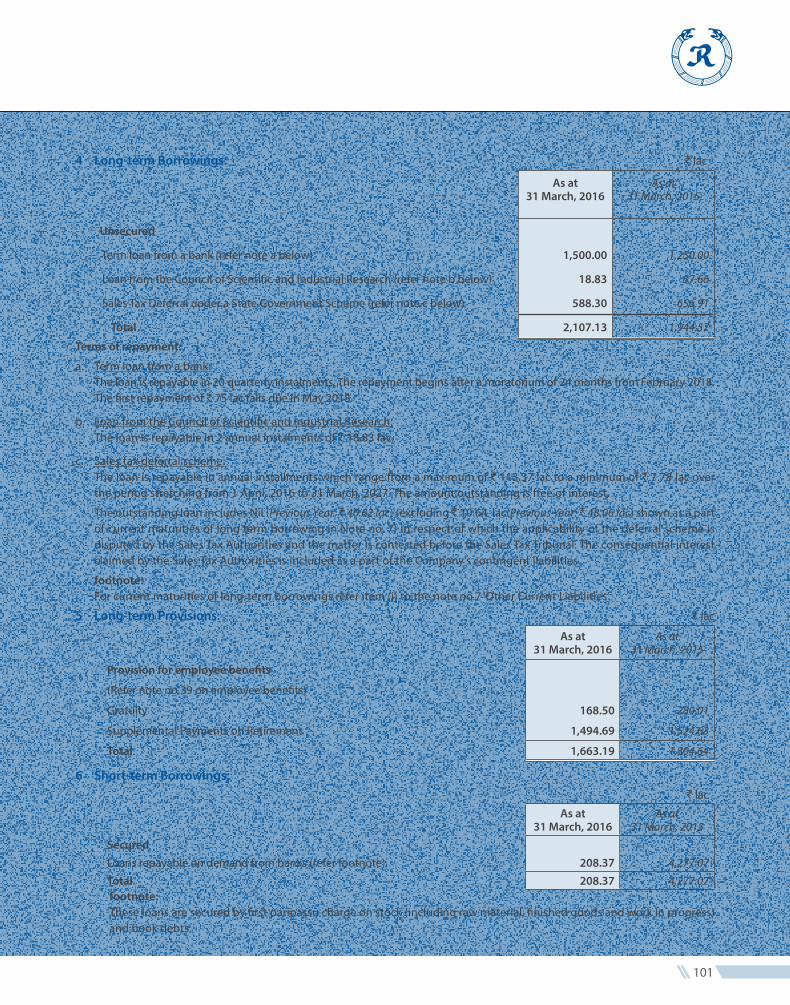
4 Long-term Borrowings: ` lac
As at 31 March, 2016
As at 31 March, 2015
Unsecured
Term loan from a bank (refer note a below) 1,500.00 1,250.00
Loan from the Council of Scientific and Industrial Research (refer note b below) 18.83 37.66
Sales Tax Deferral under a State Government Scheme (refer note c below) 588.30 656.91
Total 2,107.13 1,944.57
Terms of repayment:
a. Term loan from a bank: The loan is repayable in 20 quarterly instalments. The repayment begins after a moratorium of 24 months from February 2018.
The first repayment of ` 75 lac falls due in May 2018.
b. Loan from the Council of Scientific and Industrial Research: The loan is repayable in 2 annual instalments of ` 18.83 lac.
c. Sales tax deferral scheme: The loan is repayable in annual installments which range from a maximum of ` 113.37 lac to a minimum of ` 7.78 lac over
the period stretching from 1 April, 2016 to 31 March, 2027. The amount outstanding is free of interest.
The outstanding loan includes Nil (Previous Year: ` 40.62 lac) (excluding ` 10.64 lac(Previous Year: ` 48.06 lac) shown as a part of current maturities of long term borrowing in Note no. 7) in respect of which the applicability of the deferral scheme is disputed by the Sales Tax Authorities and the matter is contested before the Sales Tax Tribunal. The consequential interest claimed by the Sales Tax Authorities is included as a part of the Company’s contingent liabilities.
footnote: For current maturities of long-term borrowings refer item (i) to the note no.7 ‘Other Current Liabilities’.
5 Long-term Provisions: ` lac
As at 31 March, 2016
As at 31 March, 2015
Provision for employee benefits
(Refer note no 39 on employee benefits)
Gratuity 168.50 280.01
Supplemental Payments on Retirement 1,494.69 1,524.63
Total 1,663.19 1,804.64
6 Short-term Borrowings:` lac
As at 31 March, 2016
As at 31 March, 2015
Secured Loans repayable on demand from banks (refer footnote) 208.37 4,277.07
Total 208.37 4,277.07 footnote:These loans are secured by first paripassu charge on stock (including raw material, finished goods and work in progress) and book debts.

Standalone Financial StatementsSixty-eighth annual report 2015-2016
Rallis India Limited
RALLIS
102
7 Other Current Liabilities: (Refer Note No. 30)
` lac
As at 31 March, 2016
As at 31 March, 2015
Other Liabilities
i. Current maturity of long term borrowing
Sales Tax Deferral Scheme (unsecured) (refer note 4 c) 10.64 47.44
Council of Scientific & Industrial Research loan (unsecured) (refer note 4 b) 18.83 18.83
Term loan from a bank (unsecured) (refer terms of repayment below) 1,250.00 1,250.00
ii. Interest accrued but not due on borrowings 25.50 22.93
iii. Unclaimed dividends (refer footnote) 134.82 132.32
iv. Other Payables:
Provident Fund and other employee deductions 149.22 129.94
Central Excise, Customs Duty, Value Added Tax (VAT) and Service Tax payable 660.74 1,117.01
Tax deducted at source 136.09 276.09
Customer Advances and Deposits 2,495.42 2,323.91
Creditors for Capital Purchases 624.09 206.03
Other Liabilities 198.90 -
Total 5,704.25 5,524.50
Terms of Repayment: The loan is repayable in four quarterly installments of ` 312.50 lac each.
footnote:There has been no delay in transferring amounts, required to be transferred, to the Investor Education and Protection Fund by the Company except in cases wherein disputes relating to the ownership of the underlying shares have remained unresolved amounting to ` 0.13 lac.
8 Short-term Provisions:` lac
As at 31 March, 2016
As at 31 March, 2015
a. Provision for employee benefits
Compensated Absences 620.16 546.94
Supplemental Payments on Retirement 198.48 200.43
b. Others
Proposed Equity Dividend 4,861.72 2,917.03
Distribution Tax on Proposed Equity Dividend 989.73 583.24
Provision for Income Tax (net of advance tax ` 21,629.31 lac: Previous Year ` 19,570.65 lac)
611.13 1,552.19
7,281.22 5,799.83

103
9 Fixed Assets: ` lac
Gross Block (At Cost) Accumulated Depreciation/Amortisation Net Block
Balance as at 1 April
2015
Additions Disposals/ write-off
Balance as at 31 March 2016
Balance as at 1 April
2015
Depreciation charge for
the year
On disposals/ write-off
Transition adjustment
recorded against Surplus in Statement of Profit and Loss (refer note 41)
Balance as at 31 March 2016
Balance as at 31 March 2016
a. Tangible Assets (Refer note 41)
Freehold Land 251.68 - - 251.68 - - - - - 251.68
254.15 - 2.47 251.68 - - - - - 251.68
Leasehold Land(Refer footnote 5) 5,151.03 - - 5,151.03 405.66 98.47 - - 504.13 4,646.90
4,638.28 2,074.84 1,562.09 5,151.03 288.05 190.14 72.53 - 405.66 4,745.37
Leasehold Improvements 194.07 - - 194.07 28.96 21.88 - - 50.84 143.23
180.39 13.68 - 194.07 8.11 20.85 - - 28.96 165.11
Buildings (Refer footnote 1 & 2) 15,521.98 555.05 6.65 16,070.38 3,411.50 487.63 7.31 - 3,891.82 12,178.56
15,329.78 316.32 124.12 15,521.98 2,913.70 462.07 67.73 103.46 3,411.50 12,110.48
Plant and Equipment (Refer footnote 4)
36,301.98 4,930.31 239.52 40,992.77 18,139.52 2,592.40 236.34 - 20,495.58 20,497.19
35,138.42 1,780.91 617.35 36,301.98 15,522.48 2,986.04 520.60 151.60 18,139.52 18,162.46
Furniture and Fixtures 786.10 66.83 3.87 849.06 452.27 89.40 3.87 - 537.80 311.26
832.34 12.98 59.22 786.10 397.61 90.18 51.38 15.86 452.27 333.83
Vehicles 294.91 4.24 145.06 154.09 208.66 31.67 113.80 - 126.53 27.56
413.23 - 118.32 294.91 221.34 64.35 78.97 1.94 208.66 86.25
Office Equipments 397.61 33.88 14.11 417.38 272.06 52.41 13.72 - 310.75 106.63
479.26 10.32 91.97 397.61 159.50 90.88 64.00 85.68 272.06 125.55
Total 58,899.36 5,590.31 409.21 64,080.46 22,918.63 3,373.86 375.04 - 25,917.45 38,163.01
57,265.85 4,209.05 2,575.54 58,899.36 19,510.79 3,904.51 855.21 358.54 22,918.63 35,980.73
b. Intangible Assets
I. Internally generated:
Product Registrations 1,989.16 48.20 - 2,037.36 1,275.33 295.36 - - 1,570.69 466.67
1,860.03 129.13 - 1,989.16 951.39 323.94 - - 1,275.33 713.83
II. Others:
Goodwill 163.63 - - 163.63 163.63 - - - 163.63 -
163.63 - - 163.63 163.63 - - - 163.63 -
Licences and Commercial Rights 861.52 72.71 - 934.23 324.53 194.61 - - 519.14 415.09
861.52 - - 861.52 109.16 215.37 - - 324.53 536.99
Computer software 1,029.21 12.34 - 1,041.55 976.25 17.30 - - 993.55 48.00
1,010.02 19.19 - 1,029.21 961.25 15.00 - - 976.25 52.96
Total 4,043.52 133.25 - 4,176.77 2,739.74 507.27 - - 3,247.01 929.76
3,895.20 148.33 - 4,043.52 2,185.43 554.31 - - 2,739.74 1,303.78
Total Fixed Assets 62,942.88 5,723.56 409.21 68,257.23 25,658.37 3,881.13 375.04 - 29,164.46 39,092.77
Previous Year 61,161.05 4,357.38 2,575.54 62,942.88 21,696.22 4,458.82 855.21 358.54 25,658.37 37,284.51
footnotes: 1. Cost of buildings includes cost of 60 shares (Previous Year 60 shares) of ` 50 each fully paid and cost of 7 shares (Previous Year 7 shares) of ` 100 each
fully paid in respect of ownership flats in 8 (Previous Year 8) Co-operative Societies. 2. Buildings include assets carried at ` 1.00 lac (Previous Year ` 1.07 lac) where the conveyance in favour of the Company has not been completed.3. Fixed assets include assets carried at ̀ 784.90 lac (Previous Year ̀ 863.09 lac) which are held for disposal. The Management expects to recover amounts
higher than the carrying value of these assets. 4. Plant and equipment includes plant and machinery, electrical equipments and installations , laboratory equipments and computers and data
processing units.5. Leasehold land include assets carried at ` 1,583.59 lacs (Previous Year ` 1,600.22 lacs), for which the Company has sought an extension for the fulfilment
of pre-conditions of lease upon expiry of timeline.6. The figures in italics are for the previous year.

Standalone Financial StatementsSixty-eighth annual report 2015-2016
Rallis India Limited
RALLIS
104
10 Non-current Investments:(“Long - Term”) ` lac
Nominal value (in `)
Number As at 31 March 2016
As at 31 March 2015
A Trade Investments (Valued at cost less provision for other than temporary diminution) Unquoted equity instruments - Fully paid up:
a. Investment in Subsidiaries: Zero Waste Agro-Organics Ltd. 10 54,224 4,185.55 4,183.55
(PY - 54,198) Rallis Chemistry Exports Ltd. 10 50,000 5.00 5.00 Metahelix Life Sciences Ltd. (Refer footnote 1) 10 107,502 24,436.62 17,103.67
(PY - 86,549) A 28,627.17 21,292.22
b. Others: Aich Aar Chemicals Pvt. Ltd. 10 124,002 9.31 9.31 Biotech Consortium India Ltd. 10 50,000 5.00 5.00 Indian Potash Ltd. 10 54,000 0.90 0.90 Bharuch Enviro Infrastructure Ltd. 10 36,750 3.68 3.68 Narmada Clean Tech Ltd. (formerly known as Bharuch Eco-Aqua
Infrastructure Ltd.) 10 300,364 30.04 30.04
Cuddalore SIPCOT Industries Common Utilities Ltd.# 100 113 - - Patancheru Enviro-Tech Ltd. 10 10,822 1.08 1.08 Advinus Therapeutics Ltd. 10 18,286,000 1,828.60 1,828.60
1,878.61 1,878.61 Less: Provision for other than temporary diminution in value 9.31 9.31
B 1,869.30 1,869.30 C=A+B 30,496.47 23,161.52
B. Other Investments (Valued at cost less provision for other than temporary diminution)a. Quoted Investments in equity instruments - Fully paid up # Spartek Ceramics India Ltd.* 10 7,226 - - Nagarjuna Finance Ltd.* 10 400 - - Pharmaceuticals Products of India Limited* 10 10,000 - - Balasore Alloys Ltd. 5 504 - - J.K. Cement Ltd. 10 44 - -
D - - b. Unquoted Investments in equity instruments - Fully paid up Amba Trading & Manufacturing Company Private Ltd. 10 130,000 53.32 53.32 Associated Inds. (Assam) Ltd.# 10 30,000 - - Uniscans & Sonics Ltd.# 10 96 - - Caps Rallis (Private) Ltd. (Nominal value of Zim. $ 2 each) 2,100,000 146.30 146.30
199.62 199.62 Less: Provision for other than temporary diminution in value 199.62 199.62
E - - F=C+D+E 30,496.47 23,161.52
Aggregate Book Value of Investments:Unquoted - At cost less Provision for other than temporary diminution in value 30,496.47 23,161.52 Quoted - At cost less Provision for other than temporary diminution in value - -
30,496.47 23,161.52
footnotes:(1) During the year the Company acquired 20,953 shares for an aggregate value of ` 7,332.95 lac. As a result Metahelix Life Sciences Limited
became a wholly owned subsidiary of the Company on 15 February, 2016.(2) Market value of listed and quoted investments ` 0.38 lacs (Previous Year ` 0.37 lacs). * Listed but not quoted. # Amount is less than ` 0.01 lac.

105
11 Long-term loans and advances: (Refer footnote) (Unsecured, considered good unless otherwise stated)
` lac
As at 31 March, 2016
As at 31 March, 2015
Advance Income Tax (net of provisions ` 16,559.77 lac (Previous Year ` 16,365.34 lac)). 6,801.02 7,824.94
Security Deposits 619.97 562.56
Claims Receivable 323.19 388.13
VAT credit receivable 1,228.81 1,211.48
Prepaid Expenses 88.00 -
Capital Advances 232.32 200.02
Total 9,293.31 10,187.13
footnote: Long-term loans and advances does not include any amount due from director, other officer of the Company or firms in which any director is a partner or private companies in which any director is a director or member.
12 Inventories: (Valued at the lower of cost and net realisable value)
` lac
As at 31 March, 2016
As at 31 March, 2015
a. Raw Materials (Agri inputs) (including goods-in-transit of ` 492.72 lac; Previous Year ` 1,516.57 lac)
5,760.96 8,110.69
b. Work-in-progress (including intermidiate goods)(Agri inputs) 3,042.91 2,923.60
c. Finished goods (excluding finished goods traded in) (Refer Note No. 12A) 12,027.65 11,927.38
d. Stock in trade (in respect of goods acquired for trading) (Agri inputs) 3,924.76 3,755.74
e. Stores and spares 192.89 146.38
f. Packing Materials 800.93 795.48
Total 25,750.10 27,659.27
12A Nature of stocks of goods manufactured:
` lac
As at 31 March, 2016
As at 31 March, 2015
Agri inputs 11,642.44 11,904.07
Others 385.21 23.31
Total 12,027.65 11,927.38

Standalone Financial StatementsSixty-eighth annual report 2015-2016
Rallis India Limited
RALLIS
106
13 Trade Receivables: (Refer footnote)` lac
As at 31 March, 2016
As at 31 March, 2015
Trade receivables outstanding for a period exceeding six months from the date they were due for paymentSecured, considered good 29.59 8.09
Unsecured, considered good 517.56 406.90
Unsecured, Doubtful of recovery 362.65 245.87
Less: Provision for doubtful trade receivables (362.65) (245.87)
547.15 414.99
Other trade receivableSecured, considered good 379.29 402.21
Unsecured, considered good 14,896.95 19,829.19
Unsecured, Doubtful of recovery 17.56 -
Less: Provision for doubtful trade receivables (17.56) -
15,276.24 20,231.40
Total 15,823.39 20,646.39
footnote: There are no amounts outstanding from directors and other officers of the Company or firms in which any director is a partner or private companies in which any director is a director or member.
14 Cash and bank balance:` lac
As at 31 March, 2016
As at 31 March, 2015
Cash and cash equivalents (as per AS-3 Cash Flow Statement)
a. Balances with banks in current accounts 152.01 90.15
b. Cash on hand 2.73 2.65
c. Term Deposits with original maturity of less than 3 months 107.32 6.49
Total cash and cash equivalents (as per AS-3 Cash Flow Statement) (A) 262.06 99.29
Other Bank Balances (refer footnote)
a. In other deposit accounts - original maturity more than 3 months 51.75 68.99
b. In earmarked accounts:
i. Balances held for unpaid / unclaimed dividend accounts 134.82 132.32
ii. Bank deposits as margin money against bank guarantees 148.57 208.54
Total other bank balances (B) 335.14 409.85
Total (A + B) 597.20 509.14
footnote:
Other deposit accounts include deposit with remaining maturity of more than 12 months from the balance sheet date.
49.89 40.07

107
15 Short-term loans and advances:*(Unsecured, considered good unless otherwise stated)
` lac
As at
31 March, 2016
As at
31 March, 2015
a. Advances Recoverable in cash or in kind
-Advances to employees 116.95 96.94
-Advances to suppliers 1,841.01 916.20
-Others 194.92 263.41
b. Advances/Deposits considered doubtful of recovery (Refer footnote)
Doubtful 3,903.68 3,903.68
Less: Provision for doubtful loans and advances (3,903.68) (3,903.68)
c. Balances with Government Authorities
-CENVAT credit receivable 154.28 450.49
-Service tax credit receivable 282.65 382.57
d. Gratuity - 18.07
(Refer note no.39 on employee benefits)
e. Prepaid Expenses 84.82 82.00
Total 2,674.63 2,209.68
*Short-term loans and advances does not include any amount due from director , other officer of the company or firms in which any director is a partner or private companies in which any director is a director or member.
footnote: Includes a sum of ` 18.61 lac (Previous Year ` 18.61 lac) being amount due from Rallis Chemistry Exports Ltd., a wholly owned subsidiary. The maximum amount outstanding during the year was ` 18.61 lac (Previous Year ` 18.61 lac).
16 Other current assets:
` lac
As at 31 March, 2016
As at 31 March, 2015
Interest accrued on fixed deposit 12.16 8.55
Export benefits receivable 395.35 132.37
Total 407.51 140.92

Standalone Financial StatementsSixty-eighth annual report 2015-2016
Rallis India Limited
RALLIS
108
17 Revenue from Operations:
` lac
For the year ended 31 March, 2016
For the year ended 31 March, 2015
Sale of products (Refer Note No. 17A)
Own Manufactured Goods 120,577.61 137,907.96
Traded Goods 18,378.86 22,273.10
Subtotal (A) 138,956.47 160,181.06
Sale of services (B) 40.56 88.68
Other operating revenues
Scrap and Sundry Sales 369.52 543.99
Export Incentives 599.54 284.57
Royalty Income 229.51 190.63
Others 235.37 201.19
Subtotal (C) 1,433.94 1,220.38
Revenue from Operations (Gross) (A)+(B)+(C) 140,430.97 161,490.12
Less: Excise duty 9,867.97 10,368.97
Total 130,563.00 151,121.15
17A Note on Sale of Products:
` lac
For the year ended 31 March, 2016
For the year ended 31 March, 2015
Agri inputs 136,444.24 156,790.80
Others 2,512.23 3,390.26
Total 138,956.47 160,181.06
18 Other Income:
` lac
For the year ended 31 March, 2016
For the year ended 31 March, 2015
Interest Income from bank on fixed deposits 22.79 26.22
Interest on loans and advances & others (includes interest on VAT refund) 48.07 3.87
Dividend income
On current investments - others 22.76 1.68
On long term investments - others 1.35 2.08
Profit on sale of Fixed Assets (net) 3.40 18.67
Sundry Income 334.52 119.19
Total 432.89 171.71

109
19 Cost of materials consumed: ` lac
For the year ended 31 March, 2016
For the year ended 31 March, 2015
Raw Materials Consumed (Refer Notes No. 19A and 34)Opening Stock 8,110.69 7,323.02
Add : Purchases 54,136.31 68,993.82
Less : Closing Stock 5,760.96 8,110.69
56,486.04 68,206.15
Packing Materials Consumed (Refer Notes No. 34) 5,330.64 5,625.79
Total 61,816.68 73,831.94
19A Cost of materials consumed: ` lac
For the year ended 31 March, 2016
For the year ended 31 March, 2015
Active Ingredients for pesticides 25,946.24 27,646.94 Other Chemicals 30,539.80 40,559.21 Total 56,486.04 68,206.15
20 Purchase of traded goods: ` lac
For the year ended 31 March, 2016
For the year ended 31 March, 2015
Agri inputs 12,129.97 17,758.48 Total 12,129.97 17,758.48
21 Changes in inventories of finished goods, work-in-progress and stock-in-trade: ` lac
For the year ended 31 March, 2016
For the year ended 31 March, 2015
Opening StockFinished Goods - Own Manufactured 11,927.38 10,112.48 Finished Goods - Traded 3,755.74 2,883.18 Work in progress 2,923.60 2,473.57
18,606.72 15,469.23 Closing StockFinished Goods - Own Manufactured 12,027.65 11,927.38 Finished Goods - Traded 3,924.76 3,755.74 Work in progress 3,042.91 2,923.60
18,995.32 18,606.72 Net decrease/(Increase) (388.60) (3,137.49)
22 Employee benefits expense: (Refer Note No.42) ` lac
For the year ended 31 March, 2016
For the year ended 31 March, 2015
Salaries and Wages 8,504.65 8,689.01 Contribution to Provident and Other Funds (Refer Note No. 39) 541.52 495.10 Gratuity (Refer Note No. 39) 186.57 274.96 Staff welfare 970.68 894.48 Total 10,203.42 10,353.55

Standalone Financial StatementsSixty-eighth annual report 2015-2016
Rallis India Limited
RALLIS
110
23 Other expenses: (Refer Note No.42)` lac
For the year ended 31 March, 2016
For the year ended 31 March, 2015
Freight, Handling and Packing 4,387.53 4,499.01
Processing 808.73 885.55
Changes in Excise Duty on Inventory of Finished Goods (22.27) 344.74
Travelling and conveyance 1,043.71 1,096.14
Power and Fuel 4,637.31 6,042.87
Brand Equity Contribution 180.02 207.04
Repairs and maintenance :
to Machinery 737.44 614.28
to Buildings 183.45 189.61
to Others 382.64 375.02
Stores and Spares Consumed 483.11 510.43
Rates and Taxes 440.12 568.71
Bad trade receivables - 619.60
Cash Discount 1,935.71 1,857.98
Commission 106.16 117.40
Insurance 221.29 204.53
Rent 1,362.81 1,259.91
Bank Charges 234.99 176.22
Directors' Fees & Commission 393.90 448.40
Provision for Doubtful Debts/Advances 134.34 48.46
Less : Provision for doubtful debts written back - (619.60)
Selling Expenses 2,339.66 2,410.92
Legal and Professional 729.87 603.64
Net loss on Foreign currency transactions and translation 490.36 432.44
(other than considered as finance cost)
Other Expenses 4,853.09 4,080.33
Total 26,063.97 26,973.63
24 Finance costs :` lac
For the year ended 31 March, 2016
For the year ended 31 March, 2015
Interest expense on:
Long term Borrowings 224.93 324.86
Short term Borrowings 566.69 153.78
Total 791.62 478.64

111
25 Contingent liabilities and Commitments (to the extent not provided for) (Refer Note 30):(i) Contingent Liabilities:
The Company is involved in a number of appellate, judicial and arbitration proceedings (including those described below) concerning matters arising in the course of conduct of the Company’s businesses. Some of these proceedings in respect of matters under litigation are in early stages, and in some other cases, the claims are indeterminate. A summary of claims asserted on the Company in respect of these cases have been summarised below.
Tax contingencies Amounts in respect of claims asserted by various revenue authorities on the Company, in respect of taxes, which are in
dispute, have been tabulated below:
` lac
Nature of Tax As at 31 March, 2016
As at 31 March, 2015
Sales Tax 1,868.71 1,836.30
Excise Duty 369.31 360.84
Customs Duty 144.10 144.10
Income Tax 6,764.94 6,904.98
Service Tax 81.06 113.06
Property Cases 47.36 47.36
The management believes that the claims made are untenable and is contesting them. As of the reporting date, the management is unable to determine the ultimate outcome of above matters. However, in the event the revenue authorities succeed with enforcement of their assessments, the Company may be required to pay some or all of the asserted claims and the consequential interest and penalties, which would reduce net income and could have a material adverse effect on net income in the respective reported period.
Amount in respect of other claims
` lac
Nature of Tax As at 31 March, 2016
As at 31 March, 2015
Matters relating to Employee Benefits 103.11 103.26
Others (claims related to contractual disputes) 55.07 68.50
Management is generally unable to reasonably estimate a range of possible loss for proceedings or disputes other than those included in the estimate above, including where:
(i) plaintiffs / parties have not claimed an amount of money damages, unless management can otherwise determine an appropriate amount;
(ii) the proceedings are in early stages; (iii) there is uncertainty as to the outcome of pending appeals or motions or negotiations; (iv) there are significant factual issues to be resolved; and/or (v) there are novel legal issues presented.
However, in respect of the above matters, management does not believe, based on currently available information, that the outcomes of the litigation, will have a material adverse effect on the Company’s financial condition, though the outcomes could be material to the Company’s operating results for any particular period, depending, in part, upon the operating results for such period.

Standalone Financial StatementsSixty-eighth annual report 2015-2016
Rallis India Limited
RALLIS
112
(ii) Commitments
(A) Estimated amount of contracts remaining to be executed on capital account of tangible assets is ` 298.55 lac (Previous Year ̀ 774.96 lac) and Intangible assets is ̀ 105.00 lac (Previous Year ̀ 274.27 lac) against which advances paid aggregate ` 232.32 lac (Previous Year ` 200.02 lac).
(B) The company excercised its call options on 20,953 equity shares of Metahelix Life Science Limited (“Metahelix”) on 15 February, 2016, at an aggregate cost of ` 7,332.95 lac ( Also see footnote (1) to note no 10). As a result, commitments in the form of put option granted to the erstwhile owners of 6,895 equity shares in Metahelix stand extinguished.
(C) During the year, the Company has agreed to assign its leasehold rights in a property at Turbhe Navi Mumbai, for a gross consideration of ` 21,393.00 lac to Ikea India Private Limited. The arrangement is subject to the Company obtaining necessary approvals under various regulations in respect of which the company is liable to make payment aggregating to ` 9,778.19 lac against which the company is entitled to reimbursement of ` 4,400.19 lac.
(D) For lease commitments and derivatives, refer note no 26 and 37 respectively.
26 The Company has procured motor vehicles and computer network under non-cancellable operating leases. Lease rent charged to the Statement of Profit and Loss during the year is ` 605.09 lac(Previous Year ` 569.75 lac) net of amount recovered from employees ` 26.73 lac (Previous Year ` 10.71 lac). Disclosures in respect of non-cancellable leases are given below:
` lac
Particulars As at 31 March, 2016
As at 31 March, 2015
a) Total of minimum future lease payments 1,259.62 1,029.02
b) The total of future minimum lease payments under non-cancellable operating leases for a period:
Not later than one year 477.57 490.47
Later than one year and not later than five years 782.05 538.55
c) Lease payments recognised in the statement of profit and loss for the year 605.09 569.75
The terms of operating lease do not contain any exceptional/ restrictive covenants. Premises taken by the Company on operating leases are cancellable.
27 Other Expenses include Auditors’ Remuneration as under:` lac
Particulars For the year ended 31 March, 2016
For the year ended 31 March, 2015
(a) To statutory auditors
For audit 55.20 55.20
For taxation matters 50.00 23.00
For other services * 62.50 39.25
Reimbursement of expenses 1.46 1.56
(b) To cost auditors for cost audit 7.00 7.00
Service tax which is being claimed for set-off as input credit has not been included in the expenditure above. *exclude ` 33.00 lac ( Previous Year ` 11.90 lac) paid to network firms.

113
28 The Company has incurred the following expenses on research and development activity:` lac
Particulars (Refer footnote) For the year ended 31 March, 2016
For the year ended 31 March, 2015
On tangible fixed assets 150.02 124.92
On items which have been expensed during the year
- Materials 243.29 175.63
- Employee benefits expense 813.36 686.36
- Professional fees 35.63 45.57
- Consumables 37.58 40.28
- Finance Costs 1.80 2.61
- Travelling expenses 63.17 78.04
- Rent 35.19 32.12
- Depreciation and amortisation expense 460.85 540.44
- Others 175.59 138.91
Expenses - External Agency 76.72 46.28
Total 2,093.20 1,911.16
During the year the Company has also incurred ` 543.73 lac (Previous Year ` 234.83 lac) towards capital research and development expenditure which is included under Intangible Assets under Development. The total amount included in Intangible Assets under Development as at 31 March 2016 is ` 1,092.25 lac (Previous Year ` 665.86 lac).
footnote:The above figures include the amounts based on separate accounts for the Research and Developments (“R&D”) Centre recognised by the Department of Scientific & Industrial Research (“DSIR”), Ministry of Science and Technology for in-house research (consonance with the DSIR guidelines for in-house R & D Centre will be evaluated at the time of filing the return with DSIR).
29 Deferred tax assets and liabilities: The components of deferred tax assets and liabilities are as under:
` lac
Particulars As at 31 March, 2016
As at 31 March, 2015
Deferred Tax Assets
On Provision against debts and advances 1,474.49 1,436.08
On Employee and other related costs 210.61 274.60
On other items - 24.52
Total 1,685.10 1,735.20
Deferred Tax Liabilities
On fiscal allowance on fixed assets (Refer Note 41) 5,296.74 5,047.32
On other items 265.25 253.83
Total 5,561.99 5,301.15
Net Deferred Tax Liability Recognised (3,876.89) (3,565.95)

Standalone Financial StatementsSixty-eighth annual report 2015-2016
Rallis India Limited
RALLIS
114
30 Other Current Liabilities include provision held in respect of indirect tax matters in dispute: (Refer Note 25) While denying liabilities, on an evaluation of each of its disputed claims, the Company holds an overall provision for contingency
in respect of certain indirect tax matters in dispute which, as at the year-end, aggregates ₹ 193.82 lac (Previous year ₹ 193.82 lac). The movement during the year is as under:
` lac
Particulars As at 31 March, 2016
As at 31 March, 2015
Opening Balance as at 1 April 193.82 193.82 Additional provisions made during the year - - Total 193.82 193.82 Payments made adjusted against above sum - - Closing Balance as at 31 March 193.82 193.82
Due to the numerous uncertainties and variables associated with certain assumptions and judgments, and the effects of changes in the regulatory and legal environment, both the precision and reliability of the resulting estimates of the related contingencies are subject to substantial uncertainties. The Company regularly monitors its estimated exposure to such loss contingencies and, as additional information becomes known, may change its estimates significantly. However, no estimate of the range of any such change can be made at this time.
31 Segment Reporting The Company has determined its business segment as “Agri - Inputs” comprising of Pesticides, Plant Growth Nutrients and
Seeds. The other business segment comprises “Polymer” and is non reportable.
a. Primary Segment Information ` lac
ParticularsBusiness Segments
Total Agri - Inputs Others (non-reportable)
REVENUE
Total External Revenue 126,576.27 2,512.23 129,088.50
146,421.83 3,390.26 149,812.09
Total Inter-Segment Revenue - - -
Segment Revenue 126,576.27 2,512.23 129,088.50
146,421.83 3,390.26 149,812.09
Total Revenue 129,088.50
149,812.09
RESULTS
Segment Results 16,734.07 238.14 16,972.21
20,998.52 233.52 21,232.04
Unallocable Expenses/(Income) (Net) 317.11
(178.11)
Operating Profit 17,289.32
21,053.93
Finance costs 791.62
478.64

115
Profit before taxation 16,497.70
20,575.29
Tax Expense (3,895.73)
(6,033.58)
Profit for the year 12,601.97
14,541.71
OTHER INFORMATION
ASSETS
Segment Assets 86,970.26 1,820.93 88,791.19
89,899.77 1,925.29 91,825.06
Unallocated assets 37,739.95
31,411.35
Total Assets 126,531.14
123,236.41
LIABILITIES
Segment Liabilities 24,139.95 57.22 24,197.17
24,978.23 427.02 25,405.25
Unallocated Liabilities 15,787.93
18,035.64
Total Liabilities 39,985.10
43,440.89
CAPITAL EXPENDITURE (within India)
Total cost incurred during the year to acquire segment assets 6,295.71 - 6,295.71
4,682.43 - 4,682.43
Total cost incurred during the year to acquire assets 6,295.71
4,682.43
DEPRECIATION
Segment Depreciation 3,767.74 113.39 3,881.13
4,332.95 125.87 4,458.82
Total Depreciation 3,881.13
4,458.82
NON CASH EXPENSES
Segment Non-cash expenses other than Depreciation & Amortisation 114.23 - 114.23
385.68 - 385.68
Total Non-cash Expenses 114.23
385.68
The figures in italics are for the previous year.
` lac
ParticularsBusiness Segments
Total Agri - Inputs Others (non-reportable)

Standalone Financial StatementsSixty-eighth annual report 2015-2016
Rallis India Limited
RALLIS
116
b. Secondary Segment Information ` lac
2015-16 2014-15
1. Segment Revenue
a. India 89,083.90 99,674.89
b. Outside India 40,004.60 50,137.20
Total 129,088.50 149,812.09
2. Segment Assets
a. India 81,688.78 81,736.32
b. Outside India 7,102.41 10,088.74
Total 88,791.10 91,825.06
footnotes: (i) Segment Revenue includes Sales of Products less Excise Duty.(ii) Unallocable assets include Investments, Advance Income Tax, Advance Fringe Benefit Tax, Interest Accrued on Investments
and Fixed Deposits. (iii) Unallocable liabilities includes Long Term Borrowings (includes current maturities on long-term debt), Short Term
Borrowings, Provisions for Equity Dividend and tax thereon, Provision for Supplemental Payments, Provision for Income and Fringe Benefit Tax and deferred tax liabilities.
(iv) Unallocable income includes income from investment activities.(v) Unallocable expenditure includes charge in respect of Supplemental Payments on retirement valued on actuarial basis.
32 Value of imports on C. I. F. basis: ` lac
Particulars for the year ended
31 March, 2016
for the year ended
31 March, 2015
Raw Materials 28,170.86 39,619.78
Traded Materials 328.61 72.02
Stores and Spares Consumed 64.34 115.74
Capital Goods 119.29 60.83
Total 28,683.10 39,868.37
33 Expenditure in foreign currencies: ` lac
Particulars For the year ended 31 March, 2016
For the year ended 31 March, 2015
Professional Fees 9.18 31.73
Commission 94.47 86.66
Travelling 37.05 37.11
Research and Development 5.80 5.21
Handling and other selling expenses 57.97 24.66
Subscription 41.00 15.08
Bank Charges 85.85 12.22
Others 20.97 29.41
Total 352.29 242.08

117
34 Value of Imported and Indigenous Materials consumed: ` lac
Particulars For the year ended 31 March, 2016
For the year ended 31 March, 2015
Amount % Amount %
Raw Materials Consumed
Imported (including Customs Duty) 31,750.25 56% 42,208.11 62%
Indigenous 24,735.79 44% 25,998.04 38%
Total 56,486.04 100% 68,206.15 100%
Packing Materials Consumed
Indigenous 5,330.64 100% 5,625.79 100%
Total 5,330.64 100% 5,625.79 100%
Stores and Spares Consumed
Imported 64.34 13% 115.74 23%
Indigenous 418.77 87% 394.69 77%
Total 483.11 100% 510.43 100%
35 Earnings in foreign exchange: ` lac
Particulars For the year ended 31 March, 2016
For the year ended 31 March, 2015
Export of goods calculated on F. O. B. Basis 38,990.53 49,544.92
Royalty Income 229.51 190.63
Total 39,220.04 49,735.55
36 Earnings per share:` lac
Particulars For the year ended 31 March, 2016
For the year ended 31 March, 2015
Profit for the year 12,601.97 14,541.71
Weighted average number of Equity Shares for Basic / Diluted EPS 194,468,890 194,468,890
Nominal Value of Equity Per Share (in `) 1.00 1.00
Basic / Diluted Earning Per Share (in `) 6.48 7.48

Standalone Financial StatementsSixty-eighth annual report 2015-2016
Rallis India Limited
RALLIS
118
37 Foreign Currency Exposures : The Company, in accordance with its risk management policies and procedures, enters into foreign currency forward contracts
and currency option contracts to manage its exposure in foreign exchange rate variations. The counter party is generally a bank. These contracts are for a period between one day and four years.
(a) Derivative Instruments:
The Company uses foreign currency forward contracts to hedge its risks associated with foreign currency fluctuations relating to accounts receivable and accounts payable. The use of foreign currency forward contracts is governed by the Company’s strategy approved by the Board of Directors, which provide principles on the use of such forward contracts consistent with the Company’s Risk Management Policy. The Company does not use forward contracts for speculative purposes.
The following forward exchange contracts are outstanding as at balance sheet date:
Particulars As at 31 March, 2016 As at 31 March, 2015
Number of Contracts
` lac Foreign Currency in lac
Number of Contracts
` lac Foreign Currency in lac
Payables 2 1,405.30 JPY 2,532.00 3 404.49 JPY 776.00
Note: USD = US Dollar; JPY = Japanese Yen.
(b) The year end foreign currency exposures that were not hedged by a derivative instrument or otherwise are given below.
i) Amounts receivable in foreign currency on account of the following:
Particulars As at 31 March, 2016 As at 31 March, 2015
` lac Foreign Currency in lac
` lac Foreign Currency in lac
Exports of goods and services 7,798.39 USD 116.97 10,088.74 USD 161.14
EUR 0.64 EUR 0.26
ii) Amounts payable in foreign currency on account of the following:
Particulars As at 31 March, 2016 As at 31 March, 2015
` lac Foreign Currency in lac
` lac Foreign Currency in lac
Imports of goods and services 6,984.53 USD 82.61 8,686.51 USD 132.30
JPY 2559.01 JPY 800.01
EUR 0.03 EUR 0.01
Note: USD = US Dollar; EUR = Euro; JPY = Japanese Yen.
38 Related Party Disclosures :
Disclosure as required by Accounting Standard (AS) - 18 “Related Party Disclosures” as prescribed under section 133 of the Companies Act, 2013.
(a) Names of the related parties and description of relationship:
(i) Holding / Ultimate Holding Company : Tata Chemicals Ltd.
(ii) Subsidiary Companies: Rallis Chemistry Exports Ltd. Metahelix Life Sciences Ltd. Zero Waste Agro Organics Ltd.
(iii) Key Management Personnel : V. Shankar Managing Director & Chief Executive Officer

119
b) Details of Transactions: ` lac
Nature of Transactions Holding Company
Subsidiary Companies
Key Management Personnel Total
Purchase of Goods 579.49 2,128.05 - 2,707.54
485.05 1,731.91 - 2,216.96
Sales of Goods 2,474.33 201.88 - 2,676.21
2,996.87 65.21 - 3,062.08
Services Received 15.81 68.94 - 84.74
46.01 45.44 - 91.45
Services Given - 110.05 - 110.05
- 105.04 - 105.04
Other Expenses - 65.72 - 65.72
1.86 66.89 - 68.75
Dividend Paid (Equity) 1,460.12 - - 1,460.12
2,336.20 - - 2,336.20
Debit Balance outstanding as at year end - Other Receivables
10.22 459.19 - 469.41
278.56 430.17 - 708.73
Credit Balance outstanding as at year end - Other Payables
4.28 113.34 - 117.62
13.16 286.83 - 299.99
Investment as at year end - 28,627.17 - 28,627.17
- 21,292.22 - 21,292.22
Remuneration Paid - - 354.80 354.80
- - 367.07 367.07
The figures in italics are for the previous year.
Transactions included in (b) above which are in excess of 10% of the total related party transactions of the same type are given below: ` lac
Nature of Transactions Tata Chemicals Ltd.
Zero Waste Agro Organics Ltd.
Metahelix Life Sciences Ltd.
Key Management Personnel
Purchase of Goods 579.49 1,145.61 982.44 - 485.05 1,134.09 597.81 -
Sales of Goods 2,474.33 - 201.88 - 2,996.87 - 65.21 -
Services Received 15.81 68.94 - - 46.01 45.44 - -
Services Given - 109.94 - - - 105.04 - -
Other Expenses - - 65.72 - 1.86 - 66.89 -
Dividend Paid (Equity) 1,460.12 - - - 2,336.20 - - -
Remuneration Paid : V. Shankar Managing Director & Chief Executive Officer
- - - 354.80 - - - 367.07
The figures in italics are for the previous year.

Standalone Financial StatementsSixty-eighth annual report 2015-2016
Rallis India Limited
RALLIS
120
39 Employee Benefit Obligations: Defined–Benefits Plans:
The Company offers its employees defined-benefit plans in the form of a gratuity scheme (a lump sum amount) and a supplemental pay scheme (a life long pension). The gratuity scheme covers substantially all regular employees, while supplemental pay plan covers former certain executives. In the case of the gratuity scheme, the Company contributes funds to Gratuity Trust, which is irrevocable, while the supplemental pay scheme is not funded. Commitments are actuarially determined at year-end. The actuarial valuation is done based on “Projected Unit Credit” method. Gains and losses of changed actuarial assumptions are charged to the Statement of profit and loss.
The net value of the defined-benefit obligation (DBO) is detailed below:` lac
Particulars Gratuity (Funded Plan)
Supplemental Pay (Unfunded
Plan)
Total Gratuity (Funded Plan)
Supplemental Pay (Unfunded
Plan)
Total
As at 31 March, 2016 As at 31 March, 2015
Present Value of DBO 2,178.63 1,693.17 3,871.80 1,965.20 1,725.06 3,690.26
Fair Value of Plan Assets 2,010.13 - 2,010.13 1,703.26 - 1,703.26
Net liability * 168.50 1,693.17 1,861.67 261.94 1,725.06 1,987.00
* Includes fund balance of ` Nil ( Previous Year ` 18.07 lac) Changes in Defined Benefit Obligation during the year:
` lac
Particulars Gratuity (Funded Plan)
Supplemental Pay (Unfunded
Plan)
Total Gratuity (Funded Plan)
Supplemental Pay (Unfunded
Plan)
Total
As at 31 March, 2016 As at 31 March, 2015
Present value of DBO as at 1 April 1,965.20 1,725.06 3,690.26 1,528.21 1,522.23 3,050.44
Current Service Cost 185.72 - 185.72 138.38 - 138.38
Interest cost 156.63 137.49 294.12 143.49 142.93 286.42
Benefits paid (134.27) (147.68) (281.95) (83.96) (147.28) (231.24)
Actuarial (gain) / loss 5.35 (21.70) (16.35) 239.08 207.18 446.26
Present value of DBO as at 31 March 2,178.63 1,693.17 3,871.80 1,965.20 1,725.06 3,690.26
Changes in fair value of plan assets of the Gratuity Fund during the year:` lac
Particulars As at 31 March, 2016
As at 31 March, 2015
Opening balance as at 1 April 1,703.26 1,492.57
Expected return on plan assets 135.75 129.85
Contributions by the Company 280.01 48.66
Benefits paid (134.27) (83.96)
Actuarial gain / (loss) 25.38 116.14
Closing balance as at 31 March 2,010.13 1,703.26

121
Details of plan assets are as follows: The plan assets are managed by the Gratuity Trust formed by the Company. The management of funds is entrusted with the Life Insurance Corporation of India (“LIC”) and HDFC Standard Life Insurance Company Limited (“HSLIC”).
` lac
Particulars As at
31 March, 2016
As at
31 March, 2015
Debentures 700.09 406.79
Government Securities 959.92 915.93
Deposits, Money market Securities & Other Assets 128.23 156.50
Equity 1.81 -
Other – Fund managed by LIC whose pattern of investment is not available
with the Company
217.12 220.60
Others 2.96 3.44
Total Asset 2,010.13 1,703.26
Actual return on plan assets: - Gratuity ` lac
Particulars For the year ended
31 March, 2016
For the year ended
31 March, 2015
Expected return on plan assets 135.75 129.85
Actuarial gain / (loss) 25.38 116.14
Actual return on plan assets 161.13 245.99
Component of employer’s expense: ` lac
Particulars Gratuity
(Funded
Plan)
Supplemental
Pay (Unfunded
Plan)
Total Gratuity
(Funded Plan)
Supplemental
Pay (Unfunded
Plan)
Total
As at 31 March, 2016 As at 31 March, 2015
Current service costs 185.72 - 185.72 138.38 - 138.38
Interest cost 156.63 137.49 294.12 143.49 142.93 286.42
Expected return on plan assets (135.75) - (135.75) (129.85) - (129.85)
Net actuarial (gain) / loss (20.03) (21.70) (41.73) 122.94 207.18 330.12
Expenses charged to the
statement of profit and loss
186.57 115.79 302.36 274.96 350.11 625.07

Standalone Financial StatementsSixty-eighth annual report 2015-2016
Rallis India Limited
RALLIS
122
Actuarial assumptions: The actuarial calculations used to estimate defined benefit commitments and expenses are based on the following assumptions which if changed, would affect the defined benefit commitment’s size, funding requirements and pension expense.
Particulars As at 31 March, 2016
As at 31 March, 2015
Rate for discounting liabilities 8.04% p.a. 7.97% p.a.
Expected salary increase rate 8.00% p.a. 8.00% p.a.
Expected return on plan assets 8.04% p.a. 7.97% p.a.
Retirement Age (in years) 60 60
Attrition rate - For Services 5 years and below - 11% - For Services 5 years and below - 15%
- For Services above 5 years - 2% - For Services above 5 years - 2%
Mortality rates Indian Assured Lives Mortality (2006-08) Ultimate
Indian Assured Lives Mortality (2006-08) Ultimate
The estimates of future salary increases, considered in the actuarial valuation, take into account inflation, seniority, promotions and other relevant factors such as supply and demand in the employment market.
The discount rate is based on the prevailing market yields of Government of India securities as at the balance sheet date for the estimated term of the obligations.
Experience adjustment:
(a) Gratuity:` lac
Particulars 2015-16 2014-15 2013-14 2012-13 2011-12
Present value of DBO 2,178.63 1,965.20 1,528.21 1,537.94 1,402.76
Fair value of plan asset 2,010.13 1,703.26 1,492.57 1,445.72 1,172.57
Fund status Surplus/(Deficit) (168.50) (261.94) (35.64) (92.22) (230.19)
Experience adjustment on plan assets gain /(loss)
25.38 112.13 (53.15) 41.90 (69.99)
Experience adjustment on plan liabilities (gain)/ loss
12.80 5.60 50.82 (35.94) 76.86
(b) Supplemental Pay:` lac
Particulars 2015-16 2014-15 2013-14 2012-13 2011-12
Present value of DBO 1,693.17 1,725.06 1,522.23 1,577.46 1,494.66
Experience adjustment on plan liabilities (gain)/ loss
(13.98) 35.57 (226.12) 53.91 (61.52)
123
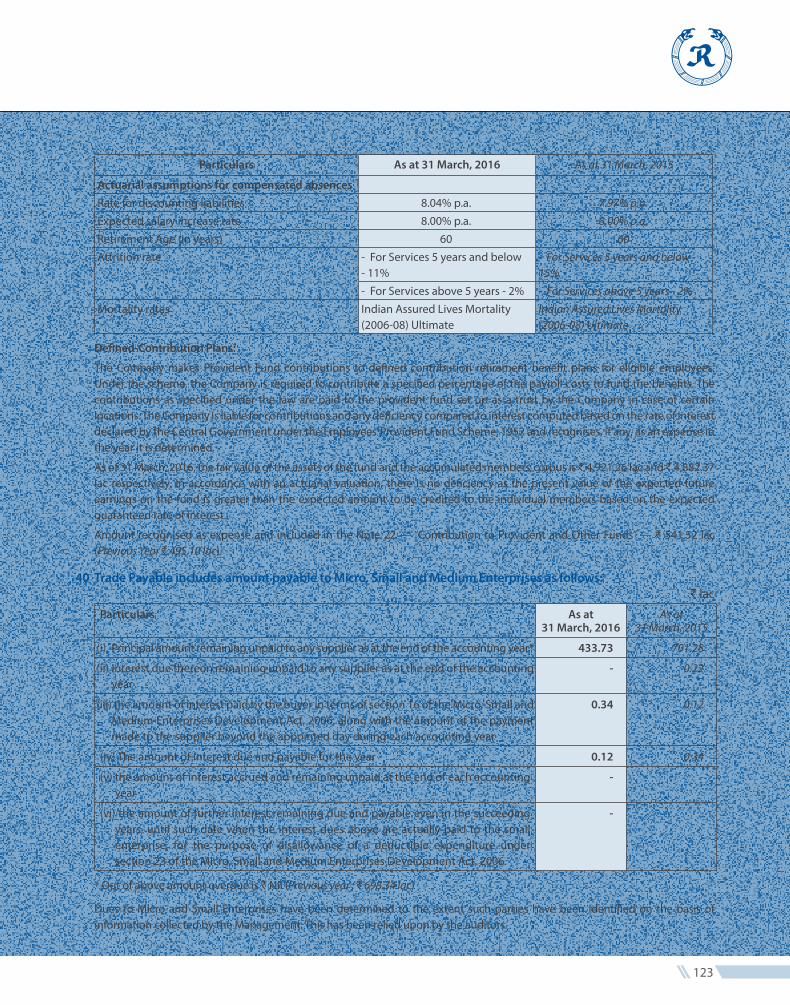
Particulars As at 31 March, 2016 As at 31 March, 2015
Actuarial assumptions for compensated absencesRate for discounting liabilities 8.04% p.a. 7.97% p.a.
Expected salary increase rate 8.00% p.a. 8.00% p.a.
Retirement Age (in years) 60 60
Attrition rate - For Services 5 years and below - 11%
- For Services 5 years and below - 15%
- For Services above 5 years - 2% - For Services above 5 years - 2%
Mortality rates Indian Assured Lives Mortality (2006-08) Ultimate
Indian Assured Lives Mortality (2006-08) Ultimate
Defined-Contribution Plans:
The Company makes Provident Fund contributions to defined contribution retirement benefit plans for eligible employees. Under the scheme, the Company is required to contribute a specified percentage of the payroll costs to fund the benefits. The contributions as specified under the law are paid to the provident fund set up as a trust by the Company in case of certain locations. The Company is liable for contributions and any deficiency compared to interest computed based on the rate of interest declared by the Central Government under the Employees’ Provident Fund Scheme, 1952 and recognises, if any, as an expense in the year it is determined.
As of 31 March, 2016, the fair value of the assets of the fund and the accumulated members’ corpus is ̀ 4,921.26 lac and ̀ 4,882.37 lac respectively. In accordance with an actuarial valuation, there is no deficiency as the present value of the expected future earnings on the fund is greater than the expected amount to be credited to the individual members based on the expected guaranteed rate of interest.
Amount recognised as expense and included in the Note 22 — “Contribution to Provident and Other Funds” — ` 541.52 lac (Previous Year ` 495.10 lac).
40 Trade Payable includes amount payable to Micro, Small and Medium Enterprises as follows: ` lac
Particulars As at 31 March, 2016
As at 31 March, 2015
(i) Principal amount remaining unpaid to any supplier as at the end of the accounting year* 433.73 701.28
(ii) Interest due thereon remaining unpaid to any supplier as at the end of the accounting year
- 0.22
(iii) the amount of interest paid by the buyer in terms of section 16 of the Micro, Small and Medium Enterprises Development Act, 2006, along with the amount of the payment made to the supplier beyond the appointed day during each accounting year
0.34 0.12
(iv) The amount of interest due and payable for the year 0.12 0.34
(v) the amount of interest accrued and remaining unpaid at the end of each accounting year
- -
(vi) the amount of further interest remaining due and payable even in the succeeding years, until such date when the interest dues above are actually paid to the small enterprise, for the purpose of disallowance of a deductible expenditure under section 23 of the Micro, Small and Medium Enterprises Development Act, 2006.
- -
* Out of above amount overdue is ` Nil (Previous year : ` 698.34 lac)
Dues to Micro and Small Enterprises have been determined to the extent such parties have been identified on the basis of information collected by the Management. This has been relied upon by the auditors.

Standalone Financial StatementsSixty-eighth annual report 2015-2016
Rallis India Limited
RALLIS
124
41 In the previous year, pursuant to the notification of Schedule II to the Companies Act, 2013 with effect from 1 April, 2014, the Company has revised the estimated useful life of some of its assets to align the useful life with those specified in Schedule II. The details of previously applied depreciation method, rates / useful life for these assets are as follows:
Asset Previous depreciation rate
Revised useful life
Buildings, Factory Buildings ,etc. 3.34% 3 years to 60 years
Computers and Data Processing Units 16.21% 3 years to 10 years
Electrical Installations and Equipments 4.75% 10 years to 15 years
Laboratory Equipments 4.75% 10 years to 15 years
Office Equipments 4.75% 3 years to 10 years
Furniture and Fixtures 6.33% 3 years to 10 years
Vehicles 9.50% 8 years
Pursuant to the transition provisions prescribed in Schedule II to the Companies Act, 2013, the Company has fully depreciated the carrying value of assets, net of residual value, where the remaining useful life of the asset was determined to be Nil as on 1 April, 2014, and has adjusted an amount of ` 236.63 lac (net of deferred tax of ` 121.92 lac) against the opening surplus balance in the Statement of Profit and Loss under Reserves and Surplus.
The depreciation expense in the Statement of Profit and Loss for the previous year is higher by ` 557.99 lac consequent to the change in the useful life of the assets.
42 The gross amount required to be spent by the Company during the year towards Corporate Social Responsibility (CSR) as per the provision of section 135 of the Companies Act, 2013 amounts to ̀ 388.40 lac (Previous Year ̀ 349.41 lac). Amount spent during the year on CSR activities (included in Note 22 and Note 23 of the Statement of Profit and Loss) as under:
` lac
Particulars For the year ended 31 March, 2016
For the year ended 31 March, 2015
Employee benefits expense 19.40 17.50
Other expenses ( for healthcare, education, women empowerment, skill development , disaster relief etc.)
379.32 195.69
398.72 213.19
43 Previous years’ figures have been regrouped / restated wherever necessary to conform to the classification of the current year.
Mumbai, 26 April, 2016
For and on behalf of the Board of Directors
B. D. BANERJEEE. A. KSHIRSAGAR PRAKASH R. RASTOGI BHARAT VASANI R. MUKUNDAN Y. S. P. THORAT PUNITA KUMAR-SINHA
Directors
BHASKAR BHAT Chairman
V. SHANKAR Managing Director & Chief Executive Officer
ASHISH MEHTA Chief Financial Officer
P. S. MEHERHOMJI Company Secretary