Embed Size (px)
Citation preview
Raising the Bar: Increased Hydraulic Pressure Allows UnprecedentedHigh Power Densities in Pressure-Retarded OsmosisAnthony P. Straub, Ngai Yin Yip, and Menachem Elimelech*
Department of Chemical and Environmental Engineering, Yale University, New Haven, Connecticut 06520-8286, United States
*S Supporting Information
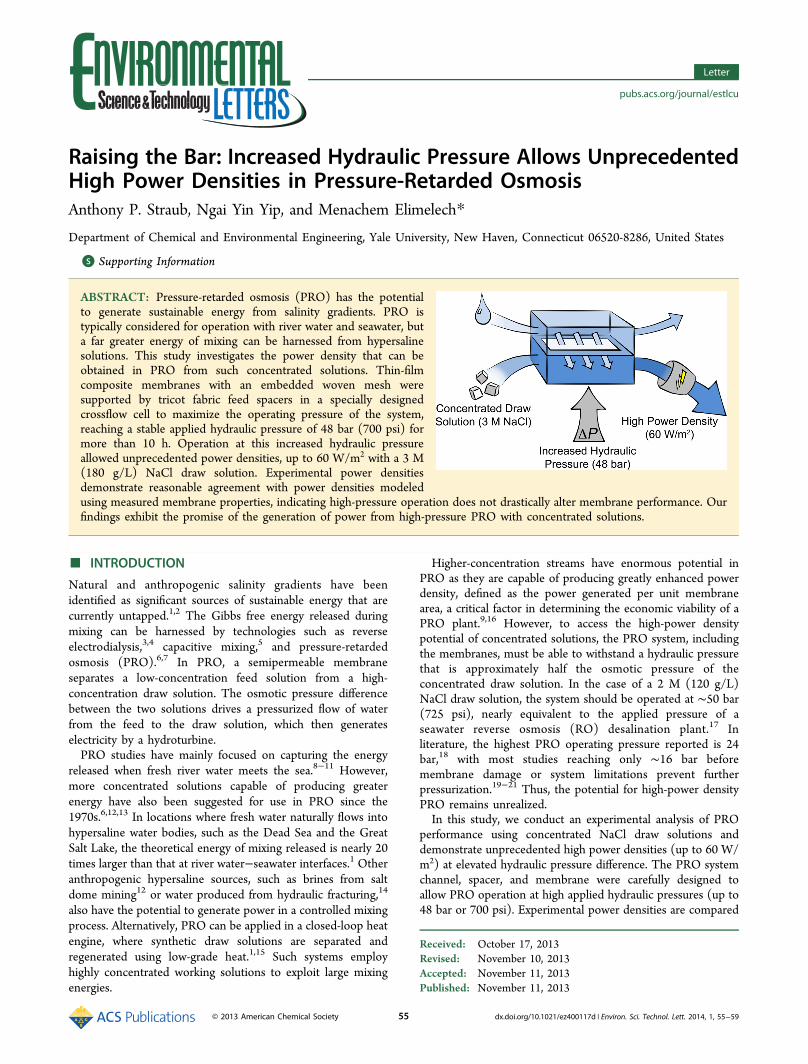
ABSTRACT: Pressure-retarded osmosis (PRO) has the potentialto generate sustainable energy from salinity gradients. PRO istypically considered for operation with river water and seawater, buta far greater energy of mixing can be harnessed from hypersalinesolutions. This study investigates the power density that can beobtained in PRO from such concentrated solutions. Thin-filmcomposite membranes with an embedded woven mesh weresupported by tricot fabric feed spacers in a specially designedcrossflow cell to maximize the operating pressure of the system,reaching a stable applied hydraulic pressure of 48 bar (700 psi) formore than 10 h. Operation at this increased hydraulic pressureallowed unprecedented power densities, up to 60 W/m2 with a 3 M(180 g/L) NaCl draw solution. Experimental power densitiesdemonstrate reasonable agreement with power densities modeledusing measured membrane properties, indicating high-pressure operation does not drastically alter membrane performance. Ourfindings exhibit the promise of the generation of power from high-pressure PRO with concentrated solutions.
■ INTRODUCTION
Natural and anthropogenic salinity gradients have beenidentified as significant sources of sustainable energy that arecurrently untapped.1,2 The Gibbs free energy released duringmixing can be harnessed by technologies such as reverseelectrodialysis,3,4 capacitive mixing,5 and pressure-retardedosmosis (PRO).6,7 In PRO, a semipermeable membraneseparates a low-concentration feed solution from a high-concentration draw solution. The osmotic pressure differencebetween the two solutions drives a pressurized flow of waterfrom the feed to the draw solution, which then generateselectricity by a hydroturbine.PRO studies have mainly focused on capturing the energy
released when fresh river water meets the sea.8−11 However,more concentrated solutions capable of producing greaterenergy have also been suggested for use in PRO since the1970s.6,12,13 In locations where fresh water naturally flows intohypersaline water bodies, such as the Dead Sea and the GreatSalt Lake, the theoretical energy of mixing released is nearly 20times larger than that at river water−seawater interfaces.1 Otheranthropogenic hypersaline sources, such as brines from saltdome mining12 or water produced from hydraulic fracturing,14
also have the potential to generate power in a controlled mixingprocess. Alternatively, PRO can be applied in a closed-loop heatengine, where synthetic draw solutions are separated andregenerated using low-grade heat.1,15 Such systems employhighly concentrated working solutions to exploit large mixingenergies.
Higher-concentration streams have enormous potential inPRO as they are capable of producing greatly enhanced powerdensity, defined as the power generated per unit membranearea, a critical factor in determining the economic viability of aPRO plant.9,16 However, to access the high-power densitypotential of concentrated solutions, the PRO system, includingthe membranes, must be able to withstand a hydraulic pressurethat is approximately half the osmotic pressure of theconcentrated draw solution. In the case of a 2 M (120 g/L)NaCl draw solution, the system should be operated at ∼50 bar(725 psi), nearly equivalent to the applied pressure of aseawater reverse osmosis (RO) desalination plant.17 Inliterature, the highest PRO operating pressure reported is 24bar,18 with most studies reaching only ∼16 bar beforemembrane damage or system limitations prevent furtherpressurization.19−21 Thus, the potential for high-power densityPRO remains unrealized.In this study, we conduct an experimental analysis of PRO
performance using concentrated NaCl draw solutions anddemonstrate unprecedented high power densities (up to 60 W/m2) at elevated hydraulic pressure difference. The PRO systemchannel, spacer, and membrane were carefully designed toallow PRO operation at high applied hydraulic pressures (up to48 bar or 700 psi). Experimental power densities are compared
Received: October 17, 2013Revised: November 10, 2013Accepted: November 11, 2013Published: November 11, 2013
Letter
pubs.acs.org/journal/estlcu
© 2013 American Chemical Society 55 dx.doi.org/10.1021/ez400117d | Environ. Sci. Technol. Lett. 2014, 1, 55−59
to power densities modeled from experimentally determinedmembrane properties to evaluate the potential of PRO usinghighly concentrated draw solutions.
■ MATERIALS AND METHODSMembrane and Spacers. Commercial flat-sheet, thin-film
composite (TFC) forward osmosis (FO) membranes wereobtained from Hydration Technology Innovations (Albany,OR). Membranes were loaded into a specially designedcrossflow test cell and oriented with the active layer facingthe concentrated draw solution and the support layer facing thedilute feed solution. In the feed channel, two layers of tricotwoven fabric were used to support the membrane underpressure and maintain the channel geometry. In the drawchannel, a biplanar extruded netting spacer was employed toinduce turbulence and support the membrane. Images of bothspacer types are shown in Figure S1 of the SupportingInformation. Scanning electron microscopy (SEM) character-ization of membranes and spacers is also described in theSupporting Information.Bench-Scale Experimental PRO Setup. A diagram of the
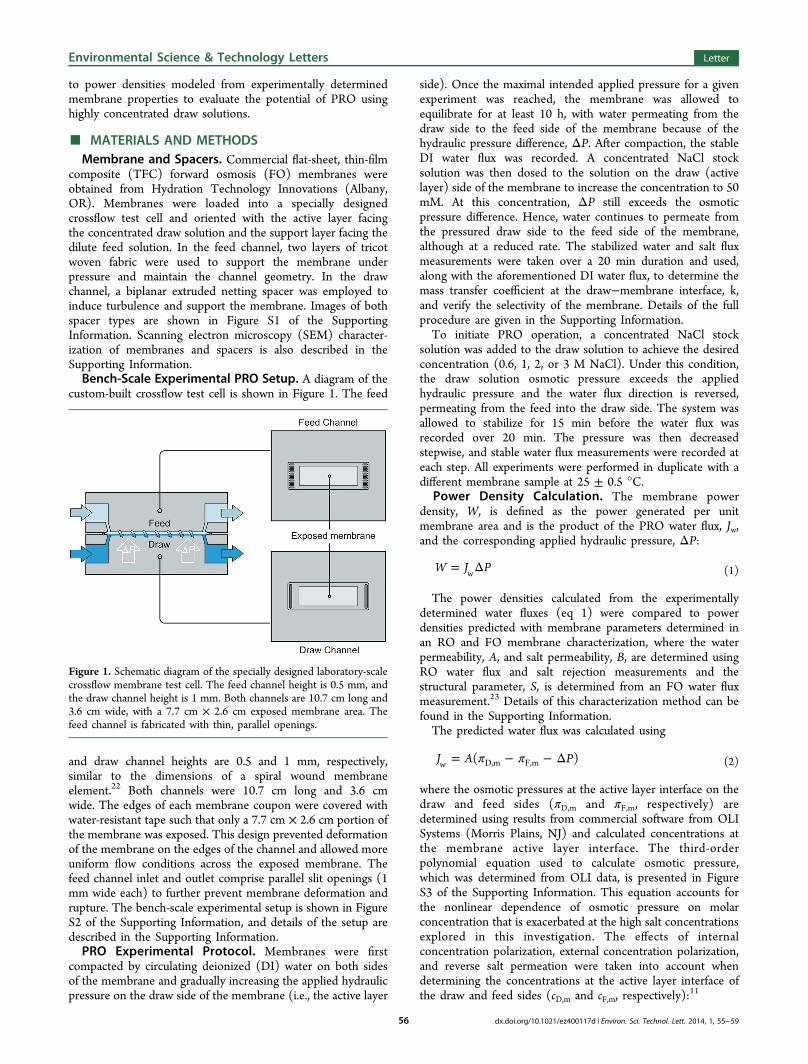
custom-built crossflow test cell is shown in Figure 1. The feed
and draw channel heights are 0.5 and 1 mm, respectively,similar to the dimensions of a spiral wound membraneelement.22 Both channels were 10.7 cm long and 3.6 cmwide. The edges of each membrane coupon were covered withwater-resistant tape such that only a 7.7 cm × 2.6 cm portion ofthe membrane was exposed. This design prevented deformationof the membrane on the edges of the channel and allowed moreuniform flow conditions across the exposed membrane. Thefeed channel inlet and outlet comprise parallel slit openings (1mm wide each) to further prevent membrane deformation andrupture. The bench-scale experimental setup is shown in FigureS2 of the Supporting Information, and details of the setup aredescribed in the Supporting Information.PRO Experimental Protocol. Membranes were first
compacted by circulating deionized (DI) water on both sidesof the membrane and gradually increasing the applied hydraulicpressure on the draw side of the membrane (i.e., the active layer
side). Once the maximal intended applied pressure for a givenexperiment was reached, the membrane was allowed toequilibrate for at least 10 h, with water permeating from thedraw side to the feed side of the membrane because of thehydraulic pressure difference, ΔP. After compaction, the stableDI water flux was recorded. A concentrated NaCl stocksolution was then dosed to the solution on the draw (activelayer) side of the membrane to increase the concentration to 50mM. At this concentration, ΔP still exceeds the osmoticpressure difference. Hence, water continues to permeate fromthe pressured draw side to the feed side of the membrane,although at a reduced rate. The stabilized water and salt fluxmeasurements were taken over a 20 min duration and used,along with the aforementioned DI water flux, to determine themass transfer coefficient at the draw−membrane interface, k,and verify the selectivity of the membrane. Details of the fullprocedure are given in the Supporting Information.To initiate PRO operation, a concentrated NaCl stock
solution was added to the draw solution to achieve the desiredconcentration (0.6, 1, 2, or 3 M NaCl). Under this condition,the draw solution osmotic pressure exceeds the appliedhydraulic pressure and the water flux direction is reversed,permeating from the feed into the draw side. The system wasallowed to stabilize for 15 min before the water flux wasrecorded over 20 min. The pressure was then decreasedstepwise, and stable water flux measurements were recorded ateach step. All experiments were performed in duplicate with adifferent membrane sample at 25 ± 0.5 °C.
Power Density Calculation. The membrane powerdensity, W, is defined as the power generated per unitmembrane area and is the product of the PRO water flux, Jw,and the corresponding applied hydraulic pressure, ΔP:
= ΔW J Pw (1)
The power densities calculated from the experimentallydetermined water fluxes (eq 1) were compared to powerdensities predicted with membrane parameters determined inan RO and FO membrane characterization, where the waterpermeability, A, and salt permeability, B, are determined usingRO water flux and salt rejection measurements and thestructural parameter, S, is determined from an FO water fluxmeasurement.23 Details of this characterization method can befound in the Supporting Information.The predicted water flux was calculated using
π π= − − ΔJ A P( )w D,m F,m (2)
where the osmotic pressures at the active layer interface on thedraw and feed sides (πD,m and πF,m, respectively) aredetermined using results from commercial software from OLISystems (Morris Plains, NJ) and calculated concentrations atthe membrane active layer interface. The third-orderpolynomial equation used to calculate osmotic pressure,which was determined from OLI data, is presented in FigureS3 of the Supporting Information. This equation accounts forthe nonlinear dependence of osmotic pressure on molarconcentration that is exacerbated at the high salt concentrationsexplored in this investigation. The effects of internalconcentration polarization, external concentration polarization,and reverse salt permeation were taken into account whendetermining the concentrations at the active layer interface ofthe draw and feed sides (cD,m and cF,m, respectively):
11
Figure 1. Schematic diagram of the specially designed laboratory-scalecrossflow membrane test cell. The feed channel height is 0.5 mm, andthe draw channel height is 1 mm. Both channels are 10.7 cm long and3.6 cm wide, with a 7.7 cm × 2.6 cm exposed membrane area. Thefeed channel is fabricated with thin, parallel openings.
Environmental Science & Technology Letters Letter
dx.doi.org/10.1021/ez400117d | Environ. Sci. Technol. Lett. 2014, 1, 55−5956

= − − − − −⎛⎝⎜
⎞⎠⎟
⎡⎣⎢
⎛⎝⎜
⎞⎠⎟⎤⎦⎥c c
J
kBJ
c cJ
kexp ( ) 1 expD,m D,b
w
wD,m F,m
w
(3)
= + − −⎛⎝⎜
⎞⎠⎟
⎡⎣⎢
⎛⎝⎜
⎞⎠⎟
⎤⎦⎥c c
J S
DBJ
c cJ S
Dexp ( ) exp 1F,m F,b
w
wD,m F,m
w
(4)
where cD,b and cF,b are the draw and feed solution bulkconcentrations, respectively, and the NaCl diffusion coefficient,D, is assumed to be 1.48 × 10⁻⁹ m2/s.24
■ RESULTS AND DISCUSSION
The Membrane and Spacer Design Is Critical for High-Pressure Operation. A critical parameter in PRO is the burstpressure, defined as the hydraulic pressure applied to the drawsolution at which the integrity of the membrane active layer iscompromised. To determine the burst pressure, the drawsolution hydraulic pressure was increased in 6.9 bar (100 psi)increments and the water flux with DI water feed wasmonitored. Throughout the tests, the pure water flux wasfound to remain stable at 48.3 bar (700 psi), indicating themembrane active layer was not compromised. However, whenΔP was increased to 55.2 bar (800 psi), replicate membranesloaded in the test cell exhibited a rapid increase in water flux tomore than double the expected value within 15 min, indicatingfailure of the active layer (i.e., the burst pressure is between48.3 and 55.2 bar). The applied pressure of 48.3 bar (700 psi),which was maintained for more than 10 h in repeatedexperiments, is considerably greater than the highest reportedoperating pressure for flat-sheet or hollow fiber PROmembranes (16.7 and 23.8 bar, respectively).18,25
The substantially increased burst pressure is attributed to themembrane, spacer, and channel design (Figures 1 and 2).During pressurization, the active layer of the membrane isforced against the support layer, which rests on the feed spacerand channel (Figure 2D). For high-pressure operation, it is
critical that all of these components minimize deformation ofthe active layer.Figure 2A shows an SEM image of the pristine TFC
membrane cross section, with a total membrane thickness of∼115 μm. The unique polyester mesh embedded in the supportlayer of the TFC membrane is also clearly visible in the crosssection. Figure 2B shows a top-down view of the woven meshonly (the polysulfone porous layer was dissolved with adimethylformamide solvent), with ∼150 μm spacing betweeneach 40 μm wide fiber. We postulate that the fine meshreinforced the porous polysulfone support layer by evenlydistributing the load, thus strengthening the compositemembrane. In addition, the fingerlike macrovoids spanningthe thickness of the polysulfone support layer have been shownto minimize the detrimental effects of internal concentrationpolarization on water flux.11,26
The feed channel spacer must be designed to further preventmembrane deformation. Tricot woven fabric, the material usedin this study, is widely employed in commercial seawaterreverse osmosis membrane modules and was also usedpreviously in an experimental PRO spiral-wound module.22
SEM images of the fabric (Figure 2C) demonstrate relativelysmall openings, with the largest unsupported gap beingapproximately 350 μm wide, much smaller than the openingsof plastic webbed spacers used in previous PRO tests.20,27 Wepropose the tight weave provided a robust scaffold structurethat helped suppress membrane deformation.Similarly, we specially designed the crossflow channel to
support the membrane under high pressure. Feed channel inletsand outlets were outfitted with 1 mm slits that prevented themembrane from folding and rupturing under high pressure(Figure 1). Water-resistant tape was also used to preventrupture of the membrane on the edges of the channel. Thecareful design of the channel, along with the aforementionedselection of membrane and feed spacer design, allowed PROexperiments to reach the unprecedented high pressures.
High Power Densities Are Realized at ElevatedPressures and Draw Solution Concentrations. Exper-imental power densities determined from eq 1 are presented inFigure 3 (blue circles and red squares), and numerical valuesfor water flux and power density are listed in Table S1 of theSupporting Information. The 0.6 and 1 M NaCl draw solutionsare representative of seawater and brine from seawater ROdesalination, respectively, while 2 and 3 M NaCl draw solutionswere employed to model hypersaline water sources or syntheticdraw solutions in a closed-loop osmotic heat engine.1 Maximalpower densities of 7.5, 14.1, 39.4, and 59.7 W/m2 wereachieved for the 0.6, 1, 2, and 3 M NaCl draw solutions,respectively. The corresponding applied hydraulic pressureswere 13.8, 20.7, 41.4, and 48.3 bar, respectively. Peak powerdensity results for 0.6 and 1 M draw solutions were comparableto those previously obtained using other TFC mem-branes.16,19,28 The methodical design of the PRO setup allowedthe experiments to operate near the peak power density of the 2and 3 M NaCl draw solutions, a pivotal condition thatconstrained past studies,20,29 thus yielding unmatched powerdensities.The membrane transport properties were determined and
used to model the expected performance. In an RO crossflowtest cell, the HTI-TFC membrane demonstrated an averagewater permeability coefficient, A, of 2.49 L m−2 h−1 bar−1 and asalt (NaCl) permeability coefficient, B, of 0.39 L m−2 h−1.These values of A and B are typical for membranes with a
Figure 2. SEM micrographs displaying (A) the pristine HTI thin-filmcomposite (TFC) membrane cross section, (B) the polyester meshembedded in the support layer of the membrane, and (C) the tricotfabric feed channel spacer. (D) During operation, the applied hydraulicpressure difference, ΔP, compresses the membrane active layer againstthe support layer, two sheets of tricot fabric, and the feed channel wall.
Environmental Science & Technology Letters Letter
dx.doi.org/10.1021/ez400117d | Environ. Sci. Technol. Lett. 2014, 1, 55−5957
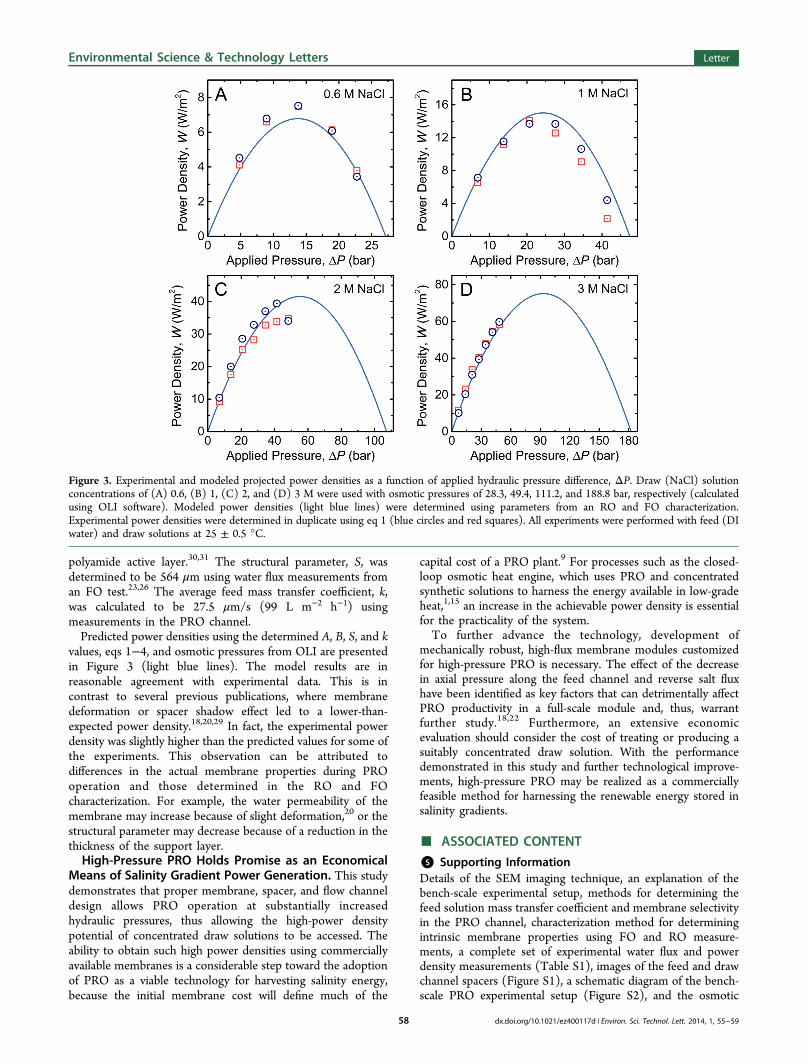
polyamide active layer.30,31 The structural parameter, S, wasdetermined to be 564 μm using water flux measurements froman FO test.23,26 The average feed mass transfer coefficient, k,was calculated to be 27.5 μm/s (99 L m−2 h−1) usingmeasurements in the PRO channel.Predicted power densities using the determined A, B, S, and k
values, eqs 1−4, and osmotic pressures from OLI are presentedin Figure 3 (light blue lines). The model results are inreasonable agreement with experimental data. This is incontrast to several previous publications, where membranedeformation or spacer shadow effect led to a lower-than-expected power density.18,20,29 In fact, the experimental powerdensity was slightly higher than the predicted values for some ofthe experiments. This observation can be attributed todifferences in the actual membrane properties during PROoperation and those determined in the RO and FOcharacterization. For example, the water permeability of themembrane may increase because of slight deformation,20 or thestructural parameter may decrease because of a reduction in thethickness of the support layer.High-Pressure PRO Holds Promise as an Economical
Means of Salinity Gradient Power Generation. This studydemonstrates that proper membrane, spacer, and flow channeldesign allows PRO operation at substantially increasedhydraulic pressures, thus allowing the high-power densitypotential of concentrated draw solutions to be accessed. Theability to obtain such high power densities using commerciallyavailable membranes is a considerable step toward the adoptionof PRO as a viable technology for harvesting salinity energy,because the initial membrane cost will define much of the
capital cost of a PRO plant.9 For processes such as the closed-loop osmotic heat engine, which uses PRO and concentratedsynthetic solutions to harness the energy available in low-gradeheat,1,15 an increase in the achievable power density is essentialfor the practicality of the system.To further advance the technology, development of
mechanically robust, high-flux membrane modules customizedfor high-pressure PRO is necessary. The effect of the decreasein axial pressure along the feed channel and reverse salt fluxhave been identified as key factors that can detrimentally affectPRO productivity in a full-scale module and, thus, warrantfurther study.18,22 Furthermore, an extensive economicevaluation should consider the cost of treating or producing asuitably concentrated draw solution. With the performancedemonstrated in this study and further technological improve-ments, high-pressure PRO may be realized as a commerciallyfeasible method for harnessing the renewable energy stored insalinity gradients.
■ ASSOCIATED CONTENT
*S Supporting InformationDetails of the SEM imaging technique, an explanation of thebench-scale experimental setup, methods for determining thefeed solution mass transfer coefficient and membrane selectivityin the PRO channel, characterization method for determiningintrinsic membrane properties using FO and RO measure-ments, a complete set of experimental water flux and powerdensity measurements (Table S1), images of the feed and drawchannel spacers (Figure S1), a schematic diagram of the bench-scale PRO experimental setup (Figure S2), and the osmotic
Figure 3. Experimental and modeled projected power densities as a function of applied hydraulic pressure difference, ΔP. Draw (NaCl) solutionconcentrations of (A) 0.6, (B) 1, (C) 2, and (D) 3 M were used with osmotic pressures of 28.3, 49.4, 111.2, and 188.8 bar, respectively (calculatedusing OLI software). Modeled power densities (light blue lines) were determined using parameters from an RO and FO characterization.Experimental power densities were determined in duplicate using eq 1 (blue circles and red squares). All experiments were performed with feed (DIwater) and draw solutions at 25 ± 0.5 °C.
Environmental Science & Technology Letters Letter
dx.doi.org/10.1021/ez400117d | Environ. Sci. Technol. Lett. 2014, 1, 55−5958

pressure equation used in modeling (Figure S3). This materialis available free of charge via the Internet at http://pubs.acs.org.
■ AUTHOR INFORMATIONCorresponding Author*E-mail: [email protected]. Phone: (203) 432-2789.NotesThe authors declare no competing financial interest.
■ ACKNOWLEDGMENTSWe acknowledge the support received from the NationalScience Foundation under Award Number CBET 1232619 andfrom the Advanced Research Projects Agency-Energy (ARPA-E), U.S. Department of Energy, via Grant DE-AR0000306. Wealso acknowledge the National Science Foundation GraduateResearch Fellowship awarded to A.P.S. and the GraduateFellowship (N.Y.Y.) made by the Environment and WaterIndustrial Development Council of Singapore.
■ REFERENCES(1) Logan, B. E.; Elimelech, M. Membrane-based processes forsustainable power generation using water. Nature 2012, 488, 313−319.(2) Pattle, R. E. Production of electric power by mixing fresh and saltwater in the hydroelectric pile. Nature 1954, 174, 660.(3) Post, J. W.; Hamelers, H. V. M.; Buisman, C. J. N. Energyrecovery from controlled mixing salt and fresh water with a reverseelectrodialysis system. Environ. Sci. Technol. 2008, 42, 5785−5790.(4) Długołecki, P.; Gambier, A.; Nijmeijer, K.; Wessling, M. Practicalpotential of reverse electrodialysis as process for sustainable energygeneration. Environ. Sci. Technol. 2009, 43, 6888−6894.(5) Brogioli, D. Extracting Renewable Energy from a SalinityDifference Using a Capacitor. Phys. Rev. Lett. 2009, 103, 058501.(6) Loeb, S. Osmotic power plants. Science 1975, 189, 654−655.(7) Achilli, A.; Childress, A. E. Pressure retarded osmosis: From thevision of Sidney Loeb to the first prototype installation: Review.Desalination 2010, 261, 205−211.(8) Ramon, G. Z.; Feinberg, B. J.; Hoek, E. M. V. Membrane-basedproduction of salinity-gradient power. Energy Environ. Sci. 2011, 4,4423−4434.(9) Skilhagen, S. E. Osmotic power: A new, renewable energy source.Desalin. Water Treat. 2010, 15, 271−278.(10) Thorsen, T.; Holt, T. The potential for power production fromsalinity gradients by pressure retarded osmosis. J. Membr. Sci. 2009,335, 103−110.(11) Yip, N. Y.; Tiraferri, A.; Phillip, W. A.; Schiffman, J. D.; Hoover,L. A.; Kim, Y. C.; Elimelech, M. Thin-film composite pressure retardedosmosis membranes for sustainable power generation from salinitygradients. Environ. Sci. Technol. 2011, 45, 4360−4369.(12) Wick, G.; Isaacs, J. Salt domes: Is there more energy availablefrom their salt than from their oil? Science 1978, 199, 1436−1437.(13) Loeb, S. Production of energy from concentrated brines bypressure-retarded osmosis. I. Preliminary technical and economiccorrelations. J. Membr. Sci. 1976, 1, 49−63.(14) Shaffer, D. L.; Arias Chavez, L. H.; Ben-Sasson, M.; Romero-Vargas Castrillon, S.; Yip, N. Y.; Elimelech, M. Desalination and reuseof high-salinity shale gas produced water: Drivers, technologies, andfuture directions. Environ. Sci. Technol. 2013, 47, 9569−9583.(15) McGinnis, R. L.; McCutcheon, J. R.; Elimelech, M. A novelammonia−carbon dioxide osmotic heat engine for power generation. J.Membr. Sci. 2007, 305, 13−19.(16) Gerstandt, K.; Peinemann, K. V.; Skilhagen, S. E.; Thorsen, T.;Holt, T. Membrane processes in energy supply for an osmotic powerplant. Desalination 2008, 224, 64−70.(17) Fritzmann, C.; Lowenberg, J.; Wintgens, T.; Melin, T. State-of-the-art of reverse osmosis desalination. Desalination 2007, 216, 1−76.
(18) Zhang, S.; Chung, T. S. Minimizing the instant andaccumulative effects of salt permeability to sustain ultrahigh osmoticpower density. Environ. Sci. Technol. 2013, 47, 10085−10092.(19) Chou, S.; Wang, R.; Fane, A. G. Robust and high performancehollow fiber membranes for energy harvesting from salinity gradientsby pressure retarded osmosis. J. Membr. Sci. 2013, 448, 44−54.(20) Kim, Y. C.; Elimelech, M. Adverse impact of feed channelspacers on the performance of pressure retarded osmosis. Environ. Sci.Technol. 2012, 46, 4673−4681.(21) Song, X.; Liu, Z.; Sun, D. D. Energy recovery from concentratedseawater brine by thin-film nanofiber composite pressure retardedosmosis membranes with high power density. Energy Environ. Sci.2013, 6, 1199−1210.(22) Kim, Y. C.; Kim, Y.; Oh, D.; Lee, K. H. ExperimentalInvestigation of a Spiral-Wound Pressure-Retarded Osmosis Mem-brane Module for Osmotic Power Generation. Environ. Sci. Technol.2013, 47, 2966−2973.(23) Yip, N. Y.; Tiraferri, A.; Phillip, W. A.; Shiffman, J. D.;Elimelech, M. High performance thin-film composite forward osmosismembrane. Environ. Sci. Technol. 2010, 44, 3812−3818.(24) Vitagliano, V.; Lyons, P. A. Diffusion coefficients for aqueoussolutions of sodium chloride and barium chloride. J. Am. Chem. Soc.1956, 78, 1549−1552.(25) Han, G.; Wang, P.; Chung, T. S. Highly Robust Thin-FilmComposite Pressure Retarded Osmosis (PRO) Hollow FiberMembranes with High Power Densities for Renewable Salinity-Gradient Energy Generation. Environ. Sci. Technol. 2013, 47, 8070−8077.(26) Tiraferri, A.; Yip, N. Y.; Phillip, W. A.; Schiffman, J. D.;Elimelech, M. Relating performance of thin-film composite forwardosmosis membranes to support layer formation and structure. J.Membr. Sci. 2011, 367, 340−352.(27) Achilli, A.; Cath, T. Y.; Childress, A. E. Power generation withpressure retarded osmosis: An experimental and theoretical inves-tigation. J. Membr. Sci. 2009, 343, 42−52.(28) Han, G.; Zhang, S.; Li, X.; Chung, T. S. High performance thinfilm composite pressure retarded osmosis (PRO) membranes forrenewable salinity-gradient energy generation. J. Membr. Sci. 2013, 440,108−121.(29) She, Q.; Jin, X.; Tang, C. Y. Osmotic power production fromsalinity gradient resource by pressure retarded osmosis: Effects ofoperating conditions and reverse solute diffusion. J. Membr. Sci. 2012,401−402, 262−273.(30) Yip, N. Y.; Elimelech, M. Performance limiting effects in powergeneration from salinity gradients by pressure retarded osmosis.Environ. Sci. Technol. 2011, 45, 10273−10282.(31) Tiraferri, A.; Yip, N. Y.; Straub, A. P.; Romero-Vargas Castrillon,S.; Elimelech, M. A Method for the Simultaneous Determination ofTransport and Structural Parameters of Forward Osmosis Membranes.J. Membr. Sci. 2013, 444, 523−538.
Environmental Science & Technology Letters Letter
dx.doi.org/10.1021/ez400117d | Environ. Sci. Technol. Lett. 2014, 1, 55−5959