Embed Size (px)
Citation preview

Slide 1
NCTL
RAISEonline governor training 2016
Primary

Slide 2
Introduction
• As a result of previously announced government reforms to the way schools are held to account for their performance, a number of reforms to performance measures have appeared for the first time this year.
• The new national curriculum came into force for all maintained schools from September 2014. Those pupils who were at the end of key stage 2 (KS2) in May 2016 became the first to be assessed by new set of tests against this curriculum.
• KS2 national curriculum test outcomes are no longer reported using levels. Scaled scores are used instead.
• Key stages 1 & 2 national curriculum teacher assessments are reported against the new interim frameworks for teacher assessment.
• At KS2 new headline attainment and progress performance measures, and a new floor standard are introduced.
https://www.gov.uk/government/publications/primary-school-accountability
New and established governors need to appreciate that almost all the assessments and accountability measures for schools have changed in 2016. Their school’s teachers have been working with the new national curriculum since 2014 using the interim structures then put in place. We are also mentioning straight away a number of key features that will have to be dealt with during this training; scaled scores; new teacher assessments; new attainment measures; new progress measures.

Slide 3
Changes to primary assessment in 2016
The relevant assessment changes at KS2 are:
• A new primary curriculum, with new KS2 assessments which are no longer reported in levels;
• A new expected standard which is set higher than previously (level 4), so it is more challenging to meet the new expected standard;
• The results of tests in reading, mathematics and English grammar punctuation & spelling are now reported as a scaled score, with the expected standard at 100;
• Writing is teacher assessed against an interim framework: working towards; working at the expected standard; working at greater depth (assessed using a ‘secure fit’ rather than ‘best fit’)
• Additionally there is a new interim framework for pupils below the standard of the test or assessment following the Rochford Review.
- These points serve to emphasise that outcomes in 2016 cannot be compared with those in 2015, despite the temptation to do so.
- Governors will need to appreciate that levels have ended and they will need to learn new concepts to understand the performance of their school.
Slide 4
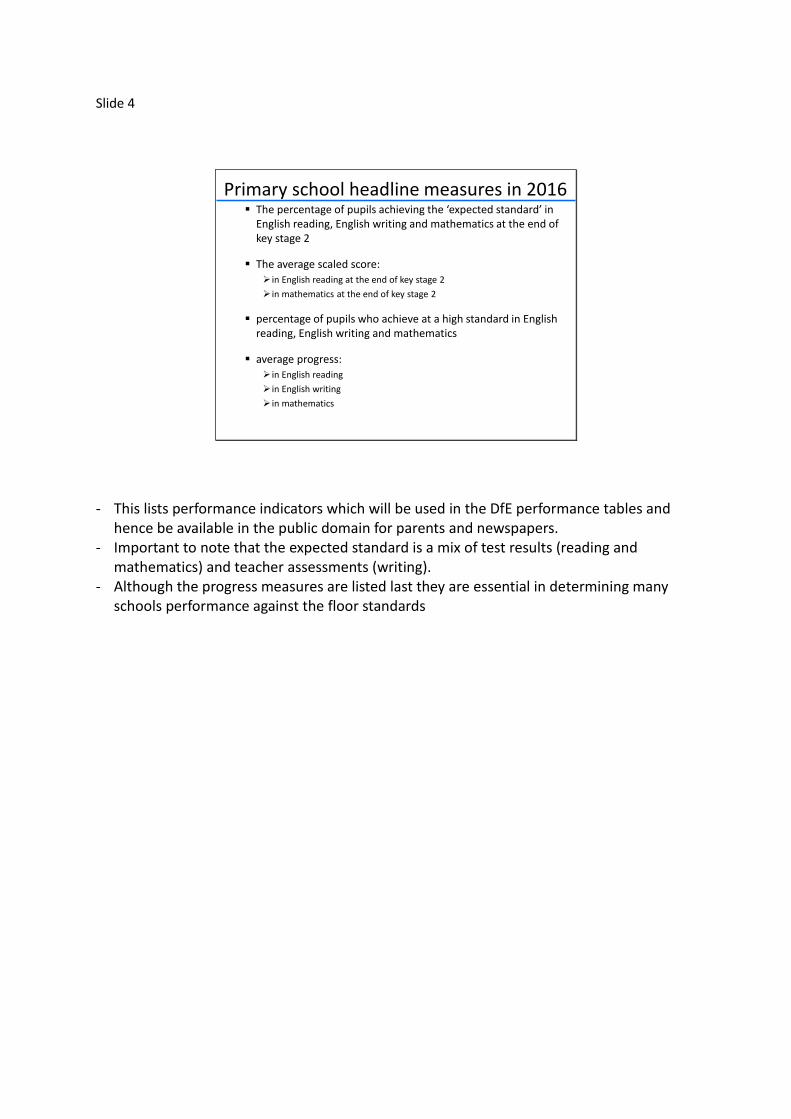
Primary school headline measures in 2016 The percentage of pupils achieving the ‘expected standard’ in
English reading, English writing and mathematics at the end of key stage 2
The average scaled score: in English reading at the end of key stage 2
in mathematics at the end of key stage 2
percentage of pupils who achieve at a high standard in English reading, English writing and mathematics
average progress: in English reading
in English writing
in mathematics
- This lists performance indicators which will be used in the DfE performance tables and hence be available in the public domain for parents and newspapers.
- Important to note that the expected standard is a mix of test results (reading and mathematics) and teacher assessments (writing).
- Although the progress measures are listed last they are essential in determining many schools performance against the floor standards
Slide 5
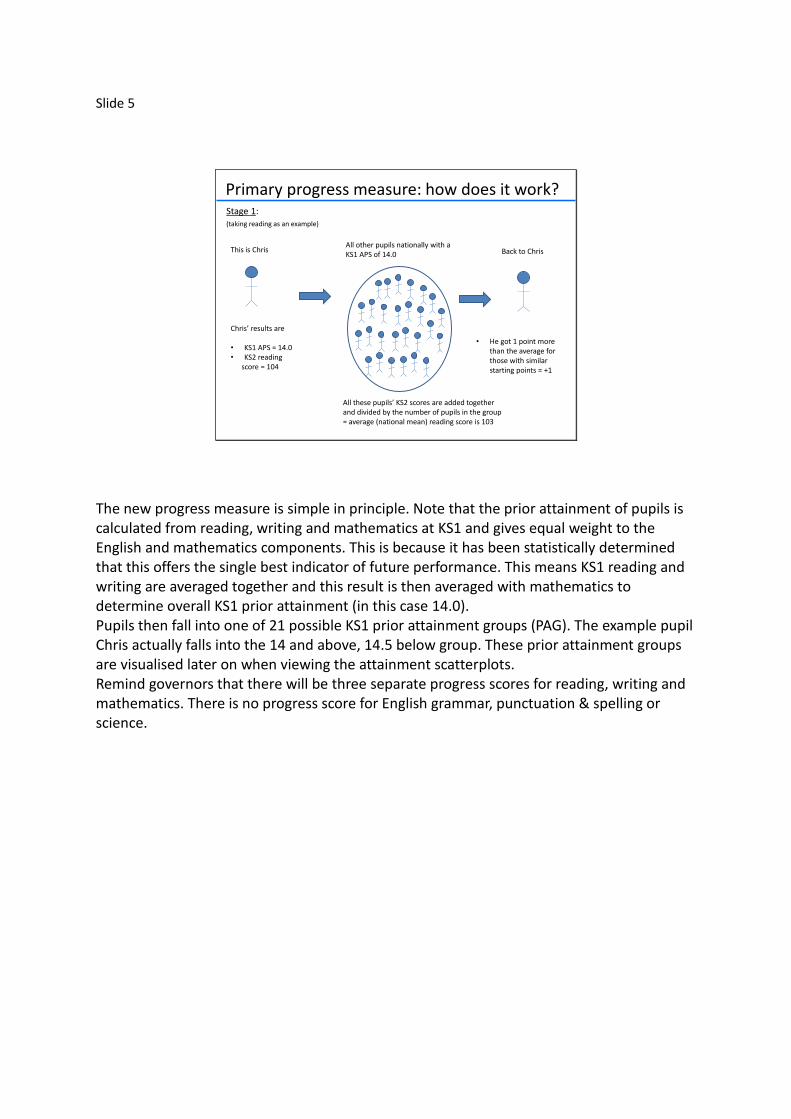
Primary progress measure: how does it work?
Chris’ results are
• KS1 APS = 14.0• KS2 reading
score = 104
• He got 1 point more than the average for those with similar starting points = +1
This is Chris All other pupils nationally with aKS1 APS of 14.0
All these pupils’ KS2 scores are added together and divided by the number of pupils in the group = average (national mean) reading score is 103
Back to Chris
Stage 1:(taking reading as an example)
The new progress measure is simple in principle. Note that the prior attainment of pupils is calculated from reading, writing and mathematics at KS1 and gives equal weight to the English and mathematics components. This is because it has been statistically determined that this offers the single best indicator of future performance. This means KS1 reading and writing are averaged together and this result is then averaged with mathematics to determine overall KS1 prior attainment (in this case 14.0). Pupils then fall into one of 21 possible KS1 prior attainment groups (PAG). The example pupil Chris actually falls into the 14 and above, 14.5 below group. These prior attainment groups are visualised later on when viewing the attainment scatterplots. Remind governors that there will be three separate progress scores for reading, writing and mathematics. There is no progress score for English grammar, punctuation & spelling or science.

Slide 6
Progress measure: how does it work? Stage 2:
Chris now brings his +1 progress score with him
We put Chris back with his Y6 peers in his school
• We add all the Y6 progress scores together and
• divide by the number of pupils to give mean score
• = schools progress score – of, say, +2
• So pupils in Chris’ school made slightly more progress than those with similar starting points in other schools
+2
-2
• Parents can now compare schools to see where pupils with similar starting points make more or less progress
+2+5
+2
+3 +2
0 +2
+1
-2
+1-4
+2 0
This process is repeated for other subjects. Schools get three scores showing average progress in: • Reading • Mathematics • Writing (nominal points, replace
scaled scores)
Governors need to appreciate that the progress scores will be in the public domain so that parents can compare schools for the progress pupils make. A negative score does not mean that pupils at a school have not made any progress, it means they have made less progress relative to other schools.

Slide 7
Floor standards 2016
• In 2016 KS2 schools will be held to account for the percentage of pupils achieving the expected standard at the end of KS2 and whether they make sufficient progress based on a measure of progress.
• A school will fall below the floor standard in 2016 where fewer than 65% of pupils achieve the expected standard and pupils do not make sufficient progress in reading and writing and mathematics– At least -5 in English reading, -5 in mathematics and -7 in English writing
• No school will be confirmed as being below the floor until December 2016 when schools’ performance tables are published.
Definition of floor standards for 2016. Stress that no school can be confirmed to be below the floor until the publication of schools performance tables.

Slide 8
Floor standards 2016
• Examples of schools above and below the floor standard
• School A – 70% of pupils meet the ‘expected standard’. School A is above the floor
• School B – 61% of pupils meet the ‘expected standard’, but the school has a progress score of -4.2 in reading, -4.5 in writing and 3.1 in mathematics. School B is above the floor.
• School C – 61% of pupils meet the ‘expected standard’, but the school has a progress score of -4.2 in reading, -4.5 in writing and -6.0 in mathematics. School C is below the floor.
https://www.gov.uk/government/uploads/system/uploads/attachment_data/file/563176/Primary_school_accountability_in_2016_technical_guide.pdf
The national attainment figure for the expected standard in 2016 was 53%. Many schools will be below the attainment floor of 65%. As a consequence these schools need to consider the progress scores as well and the point to stress for governors is that all of the subject progress figures must be above the progress floor. This is a significant change from the previous approach to the definition of floor standards. To be above the floor, the school needs to meet either the attainment or all of the progress element. Schools are also to be excluded from the floor standards where: • there are fewer than 11 eligible pupils in their Year 6 cohort; or • fewer than 50% of pupils have key stage 1 assessments that can be used to establish which prior attainment grouping the pupil should be allocated to. • there is not sufficient key stage 2 attainment information to produce progress scores because there are fewer than 6 pupils with key stage 2 results for a particular subject. The link also gives information about defining coasting schools.

Slide 9
In 2016, a primary school will be coasting if:
• it meets the 2014 and 2015 part of the definition of fewer than 85% of pupils achieving level 4 in reading, writing and mathematics and below the national median percentage of pupils making expected progress in all of reading, writing and mathematics; and
• it also meets the 2016 part of the definition - if fewer than 85% of children achieve the expected standard at the end of primary and average progress made by pupils is below -2.5 in English reading or -2.5 in mathematics or -3.5 in English writing
• A school will have to be below the coasting definition in three consecutive years to be defined as coasting.
• No school will be identified as coasting until after the 2016 primary performance tables are published in December.
Coasting schools
Schools will be excluded from the coasting measure if: • they have fewer than 11 pupils at the end of key stage 2; or • less than 50% of pupils have key stage 1 assessments that can be used to establish prior attainment; or • the school closes within the academic year (except if they reopen as a converter academy). Any school that is excluded from the coasting measure in a particular year, for one of the reasons above, cannot be defined as coasting until it has three consecutive years of data that meets the coasting definition. Subject to Parliament agreeing to the Regulations, the coasting definition will apply to all mainstream maintained schools and academies with the relevant key stage 2 data. It will not apply to PRUs, special schools and academies, alternative provision academies or maintained nursery schools.
Slide 10
2016 RAISEonline primary reporting
Key Stage 2
Key Stage 1
Phonics
Slide 11
The purpose of RAISEonline
• The aim of the RAISEonline summary report is to help show how effectively a school has performed in terms of past progress, attainment and attendance.
• The summary report is made available to schools and governors to help with their self-evaluation and planning to raise standards. It is also provided for inspectors.
• When evaluating outcomes, inspectors give most weight to progress, particularly from different starting points and of disadvantaged pupils, including the most able disadvantaged.
Slide 12
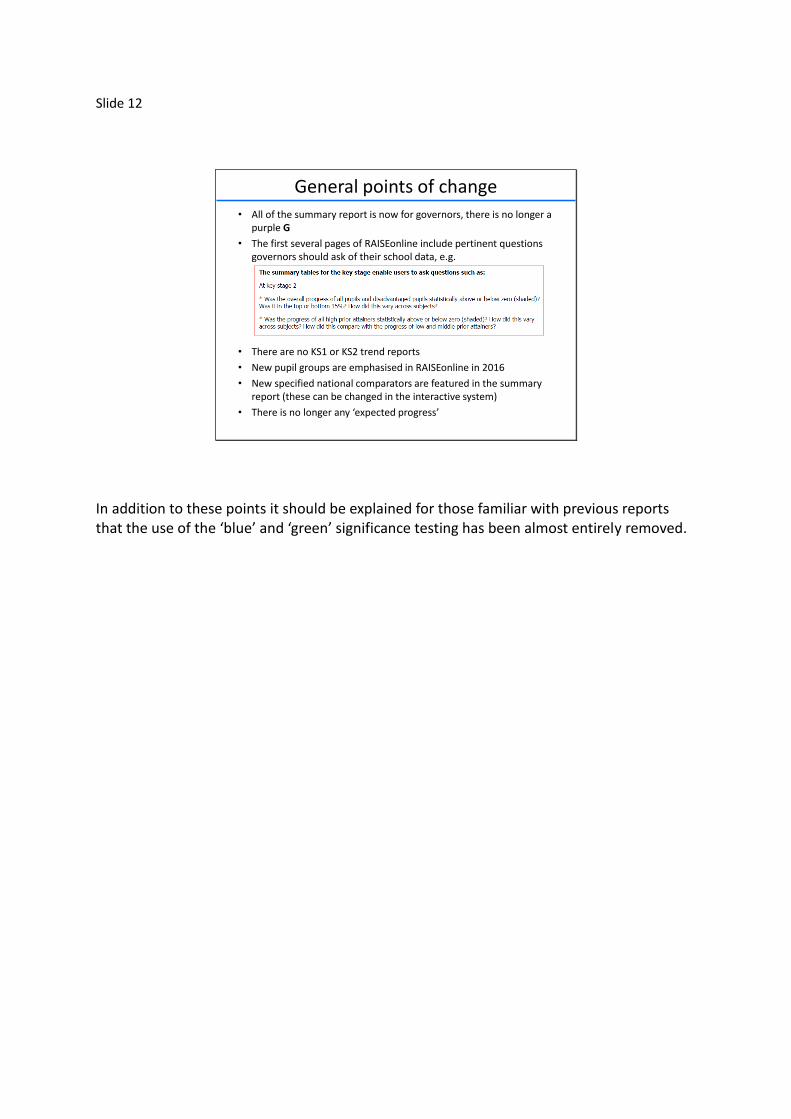
General points of change
• All of the summary report is now for governors, there is no longer a purple G
• The first several pages of RAISEonline include pertinent questions governors should ask of their school data, e.g.
• There are no KS1 or KS2 trend reports
• New pupil groups are emphasised in RAISEonline in 2016
• New specified national comparators are featured in the summary report (these can be changed in the interactive system)
• There is no longer any ‘expected progress’
In addition to these points it should be explained for those familiar with previous reports that the use of the ‘blue’ and ‘green’ significance testing has been almost entirely removed.
Slide 13
New performance indicators 2016
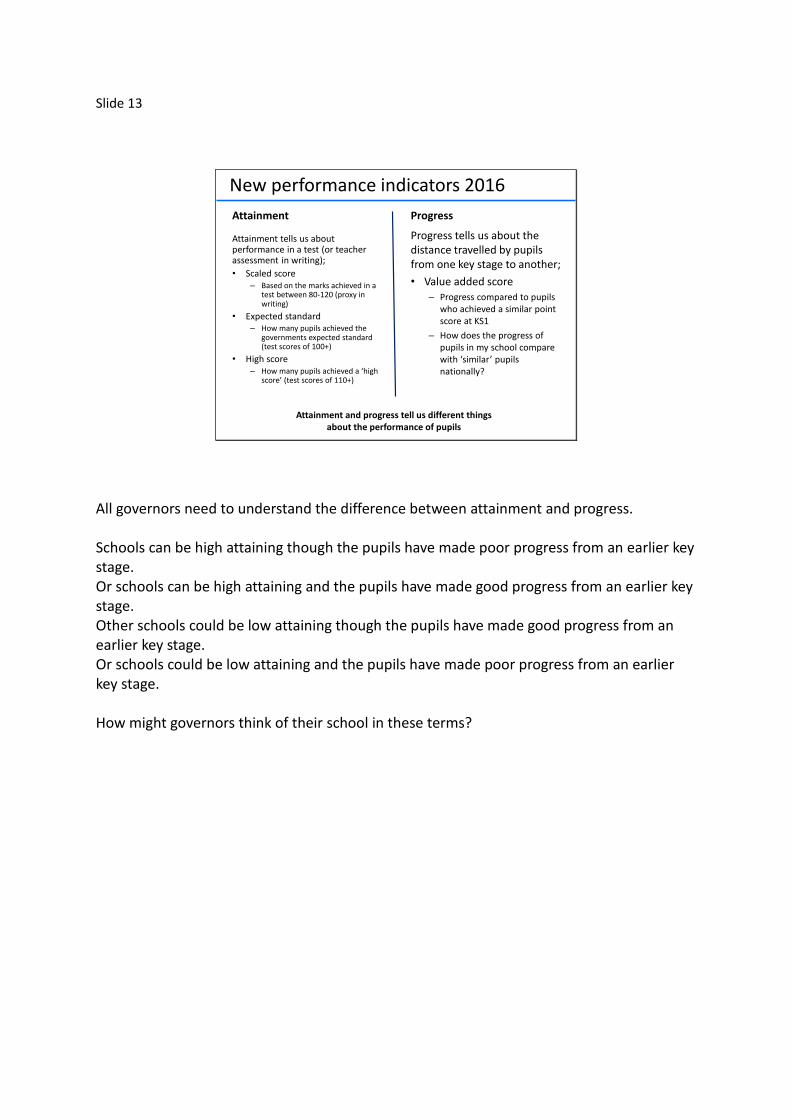
Attainment
Attainment tells us about performance in a test (or teacher assessment in writing);
• Scaled score– Based on the marks achieved in a
test between 80-120 (proxy in writing)
• Expected standard– How many pupils achieved the
governments expected standard (test scores of 100+)
• High score– How many pupils achieved a ‘high
score’ (test scores of 110+)
Progress
Progress tells us about the distance travelled by pupils from one key stage to another;
• Value added score– Progress compared to pupils
who achieved a similar point score at KS1
– How does the progress of pupils in my school compare with ‘similar’ pupils nationally?
Attainment and progress tell us different things about the performance of pupils
All governors need to understand the difference between attainment and progress. Schools can be high attaining though the pupils have made poor progress from an earlier key stage. Or schools can be high attaining and the pupils have made good progress from an earlier key stage. Other schools could be low attaining though the pupils have made good progress from an earlier key stage. Or schools could be low attaining and the pupils have made poor progress from an earlier key stage. How might governors think of their school in these terms?
Slide 14
Ethnic group
Specified Same
all pupils all same
White all same
British all same
Irish all same
Traveller all same
Gypsy/Roma all same
any other White background all same
Mixed all same
White & Black Caribbean all same
White & Black African all same
White & Asian all same
any other mixed background all same
Asian or Asian British all same
Indian all same
Pakistani all same
Bangladeshi all same
any other Asian background all same
Black or Black British all same
Black Caribbean all same
Black African all same
any other Black background all same
Chinese all same
any other ethnic group all same
unclassified - refused all same
unclassified - not obtained all same
National
comparator
type
National
comparator
type
Specified Same
all pupils all same
male same same
female same same
disadvantaged non same
other same same
Free School Meals non same
Children Looked After non same
SEN with statement or EHC plan all same
SEN support all same
no SEN same same
on roll in years 5 & 6 same same
English first language all same
English additional language all same
Prior attainment
overall low same same
overall middle same same
overall high same same
reading low same same
reading middle same same
reading high same same
writing low same same
writing middle same same
writing high same same
Mathematics low same same
Mathematics middle same same
Mathematics high same same
National
comparator
type
National
comparator
type
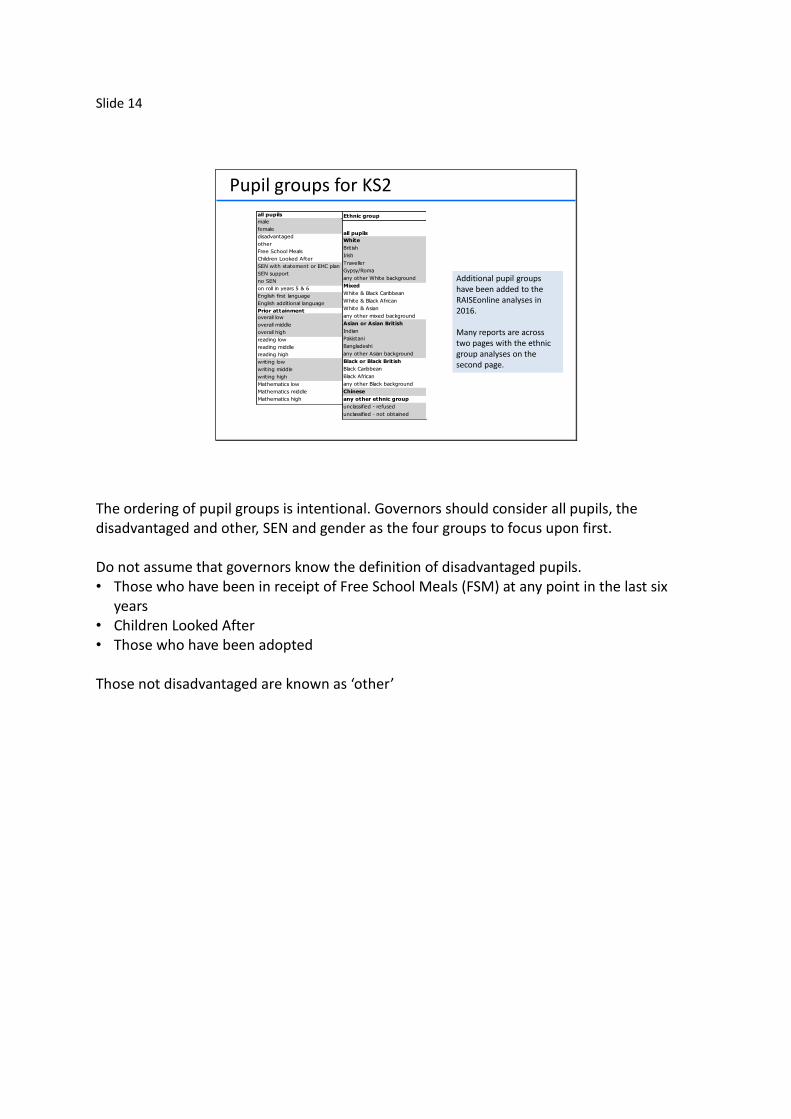
Pupil groups for KS2
Additional pupil groups have been added to the RAISEonline analyses in 2016.
Many reports are across two pages with the ethnic group analyses on the second page.
The ordering of pupil groups is intentional. Governors should consider all pupils, the disadvantaged and other, SEN and gender as the four groups to focus upon first. Do not assume that governors know the definition of disadvantaged pupils. • Those who have been in receipt of Free School Meals (FSM) at any point in the last six
years • Children Looked After • Those who have been adopted Those not disadvantaged are known as ‘other’
Slide 15
Ethnic group
Specified Same
all pupils all same
White all same
British all same
Irish all same
Traveller all same
Gypsy/Roma all same
any other White background all same
Mixed all same
White & Black Caribbean all same
White & Black African all same
White & Asian all same
any other mixed background all same
Asian or Asian British all same
Indian all same
Pakistani all same
Bangladeshi all same
any other Asian background all same
Black or Black British all same
Black Caribbean all same
Black African all same
any other Black background all same
Chinese all same
any other ethnic group all same
unclassified - refused all same
unclassified - not obtained all same
National
comparator
type
National
comparator
type
Specified Same
all pupils all same
male same same
female same same
disadvantaged non same
other same same
Free School Meals non same
Children Looked After non same
SEN with statement or EHC plan all same
SEN support all same
no SEN same same
on roll in years 5 & 6 same same
English first language all same
English additional language all same
Prior attainment
overall low same same
overall middle same same
overall high same same
reading low same same
reading middle same same
reading high same same
writing low same same
writing middle same same
writing high same same
Mathematics low same same
Mathematics middle same same
Mathematics high same same
National
comparator
type
National
comparator
type
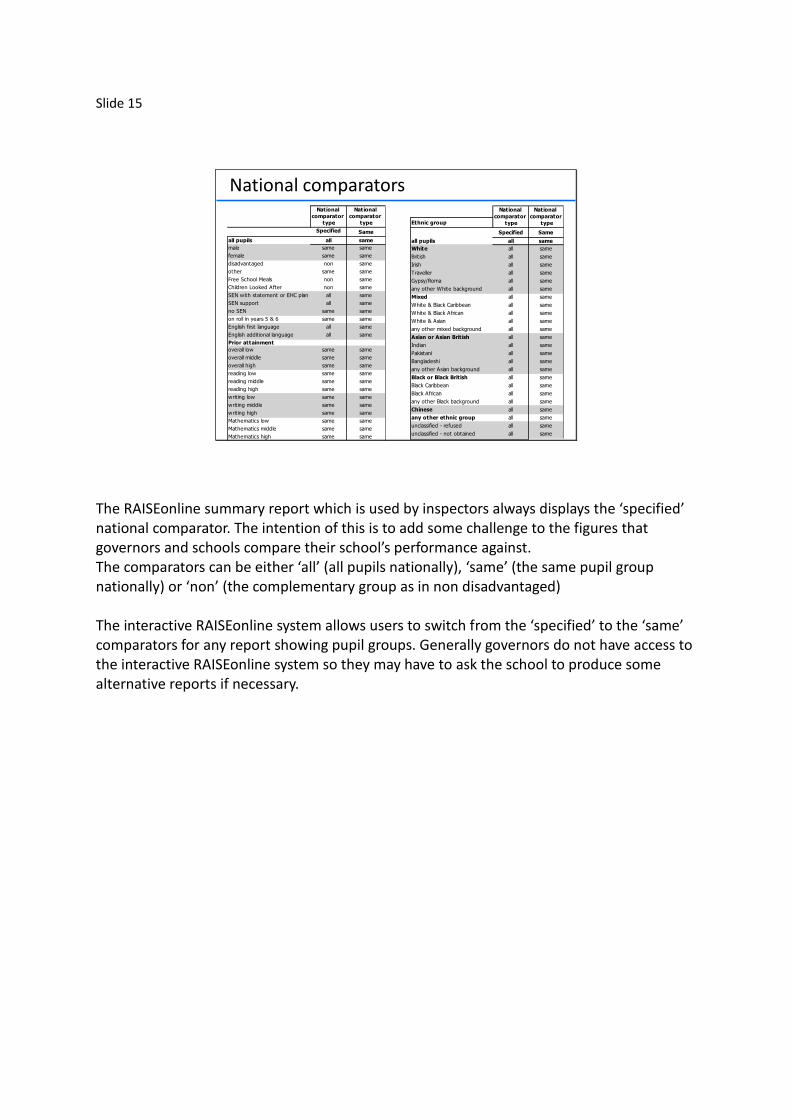
National comparators
The RAISEonline summary report which is used by inspectors always displays the ‘specified’ national comparator. The intention of this is to add some challenge to the figures that governors and schools compare their school’s performance against. The comparators can be either ‘all’ (all pupils nationally), ‘same’ (the same pupil group nationally) or ‘non’ (the complementary group as in non disadvantaged) The interactive RAISEonline system allows users to switch from the ‘specified’ to the ‘same’ comparators for any report showing pupil groups. Generally governors do not have access to the interactive RAISEonline system so they may have to ask the school to produce some alternative reports if necessary.
Slide 16
Key Stage 2 reports
• Summary page (highlighting disadvantaged pupils by prior attainment)
• Subject reports for reading, writing and mathematics
• A reading & writing & mathematics combined ‘expected standard’ and ‘high standard’ report
• An English grammar, punctuation & spelling report
• Science teacher assessment report
• KS1 to 2 scatterplots for reading , writing and mathematics
• KS1 to 2 transitions
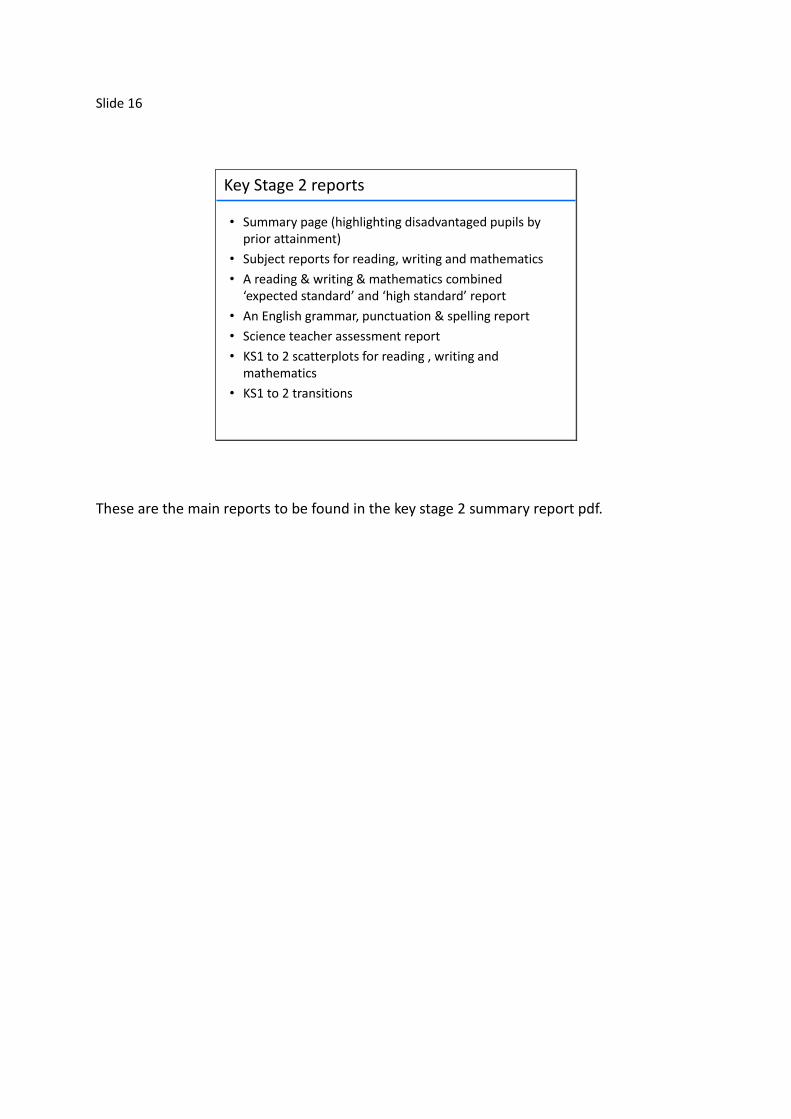
These are the main reports to be found in the key stage 2 summary report pdf.

Slide 17
Key Stage 1 reports
• Summary page (highlighting disadvantaged pupils by Early Years assessments)
• Subject reports for reading, writing and mathematics
• Science teacher assessment report
• Early Years Foundation Stage to KS1 transitions
• Other reports
– Phonics reports
– Early Years Foundation Stage (EYFS) reports
– Context
These are the main reports to be found in the key stage 1 summary report pdf. Note that the order of the summary report has been reversed from previous years, so that KS2 comes before KS1 which comes before phonics, EYFS and then places all context reports at the back. Junior schools will only see the KS2 and context reports.

Slide 18
Key Stage 2Reading, writing & mathematics
Subject reports, confidence intervals and comparators
The ‘summary’ page report featuring; Progress and attainment of disadvantaged pupils by their prior
attainment groups
All our data is for illustrative purposes only
The order in which we will tackle the 2016 KS2 reporting is by considering the combined reading, writing and mathematics report first, before unpacking the individual subject reports. The individual subject reports will cause us to consider confidence intervals and national comparators. Note that this is not the order in which the reports are presented in the summary report but we are using the approach here to explore a number of fundamental features before proceeding. After these have been considered we will be in a better position to tackle the ‘summary’ page for the performance of disadvantaged and all pupils by their prior attainment groups.
Slide 19
Reading, writing & mathematics
The national comparator type is switchable between the ‘specified’ and ‘same’ for all groups
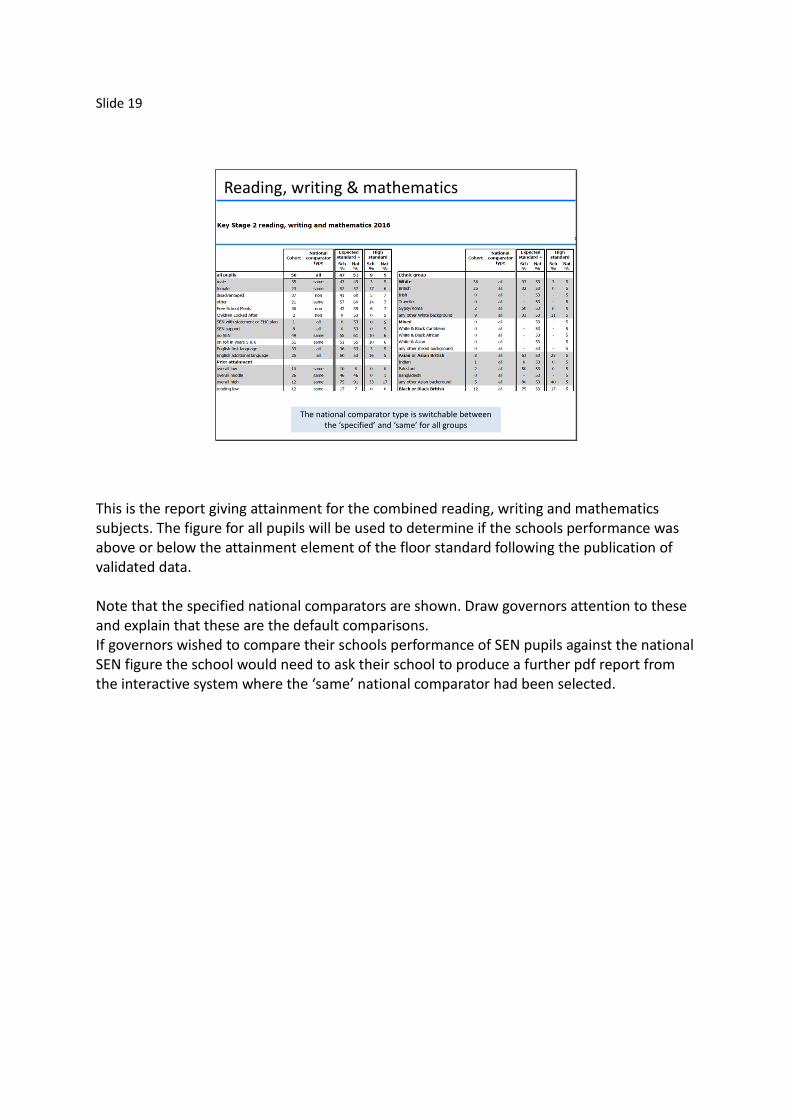
This is the report giving attainment for the combined reading, writing and mathematics subjects. The figure for all pupils will be used to determine if the schools performance was above or below the attainment element of the floor standard following the publication of validated data. Note that the specified national comparators are shown. Draw governors attention to these and explain that these are the default comparisons. If governors wished to compare their schools performance of SEN pupils against the national SEN figure the school would need to ask their school to produce a further pdf report from the interactive system where the ‘same’ national comparator had been selected.

Slide 20
Default subject reporting
This is the format used for the reporting of the reading and mathematics tests. Progress information for each pupil group is shown first with a count of how many pupils had both KS1 and KS2 data enabling progress to be calculated. The national comparator used for all progress scores here is ‘all pupils’ which is a national figure of zero. The second section shows how many pupils were included in the KS2 for attainment only along with the national comparator type displayed for attainment. The third section gives the attainment for each group as a scaled score of 100+, 110+ (high scaled score) and lastly the average scaled score. The final section (outlined in red) is a chart of the progress scores (marked in green) sorted in order with the highest figures at the top. Small horizontal lines show the confidence intervals for these measures. The vertical red dotted lines show the value of the top and bottom 10% of school scores nationally.

Slide 21
Confidence intervals • School scores should be interpreted alongside their associated confidence
intervals which show the statistical variability for the measure considered.
• A confidence interval has a lower bound and an upper bound which can be 95% confident contains the actual value of the measure.
• For the default subject report in which the confidence intervals are displayed as horizontal lines either side of the green dot.– If the lower (left) bound of the school’s confidence interval is greater than zero it can be
interpreted as meaning that the school has achieved greater than average progress compared to all pupils with similar starting points nationally.
– Similarly, if the upper (right) bound is below zero, then the school has made less than average progress compared to all pupils nationally. Where a confidence interval overlaps zero, this means that the school’s progress score is not significantly different from the national average.
• The results of schools with small cohorts will have wider confidence intervals.
• Both the progress score and the confidence interval for a school should be taken into account when comparing with other schools or pupil groups.
• Confidence intervals will be taken into account when determining whether a school is below the floor standard.
For those governors who need to know a little more about confidence intervals and how to use them in the default report.
Slide 22
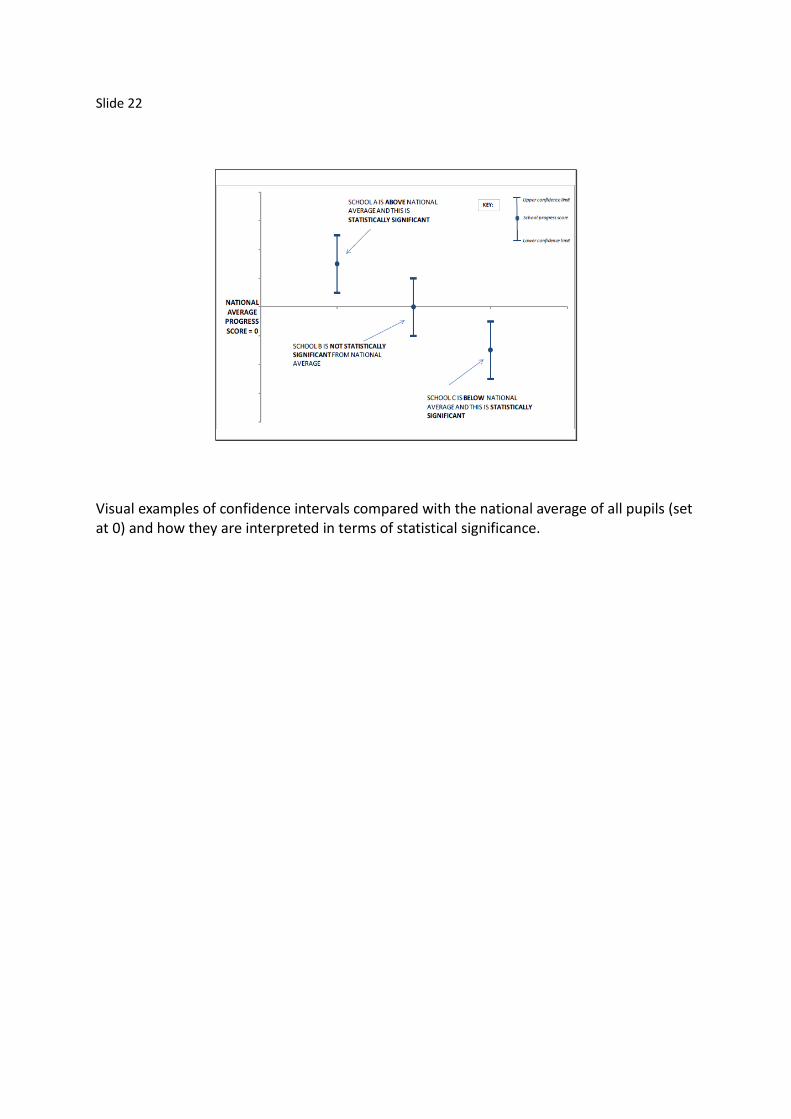
Visual examples of confidence intervals compared with the national average of all pupils (set at 0) and how they are interpreted in terms of statistical significance.

Slide 23
For ‘default’ subject reporting we will include a dynamically sorted list of pupil groups.
This places the pupil group with the highest progress measure (compared with the average of all pupils) at the top of a ranked list.
Shown against each group is the confidence interval of the progress measure.
The red dotted lines show the progress measure in the top and bottom 10% nationally
Ethnic groups will be shown in a separate table with identical format
Subject progress
-15 -10 -5 0 5 10 15
A larger visual and a summary of confidence intervals used in the default subject report. Questions for governors might be any of the following. • Which pupil group shows the highest progress? • Which group shows the poorest • How could we statistical describe the performance of the ‘no SEN’ group? (statistically
above average progress when compared with all pupils nationally) • Are the reading high pupil group statistically above average? (not statistically different
from the average of all pupils) • Which is the smallest pupil group listed on this slide? (Children Looked After because the
confidence interval is the widest, although users of the pdf anonymised summary report will disagree and say it is the Statemented/EHC Plan pupil group not shown on this slide)

Slide 24
Displaying ‘same’ nationals in the interactive system
Note that the numeric value of the school confidence intervals are also shown
This is what is shown when the ‘same’ national comparators are selected from the interactive system. Whilst there can be no graphic, the national figures for each pupil group are now shown along with the numeric value of the school’s pupil group score. Statistical interpretations can be made about the performance of school pupil groups compared with the same national group.
Slide 25
Writing
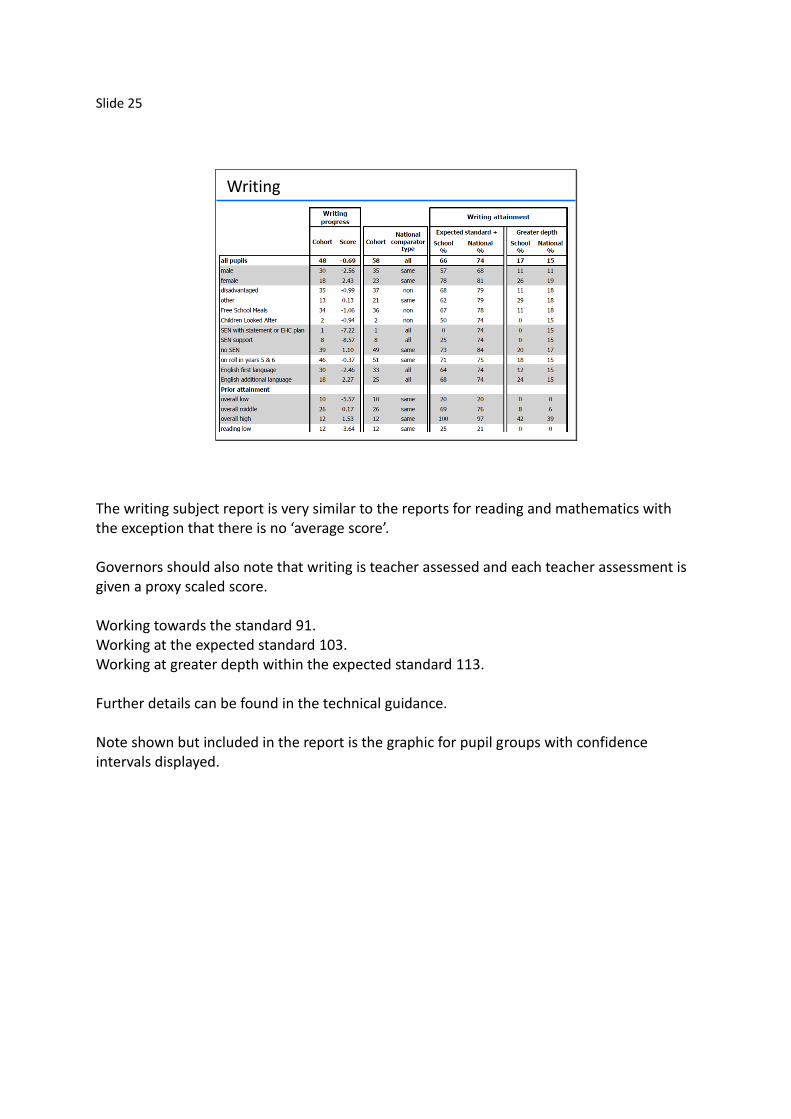
The writing subject report is very similar to the reports for reading and mathematics with the exception that there is no ‘average score’. Governors should also note that writing is teacher assessed and each teacher assessment is given a proxy scaled score. Working towards the standard 91. Working at the expected standard 103. Working at greater depth within the expected standard 113. Further details can be found in the technical guidance. Note shown but included in the report is the graphic for pupil groups with confidence intervals displayed.
Slide 26
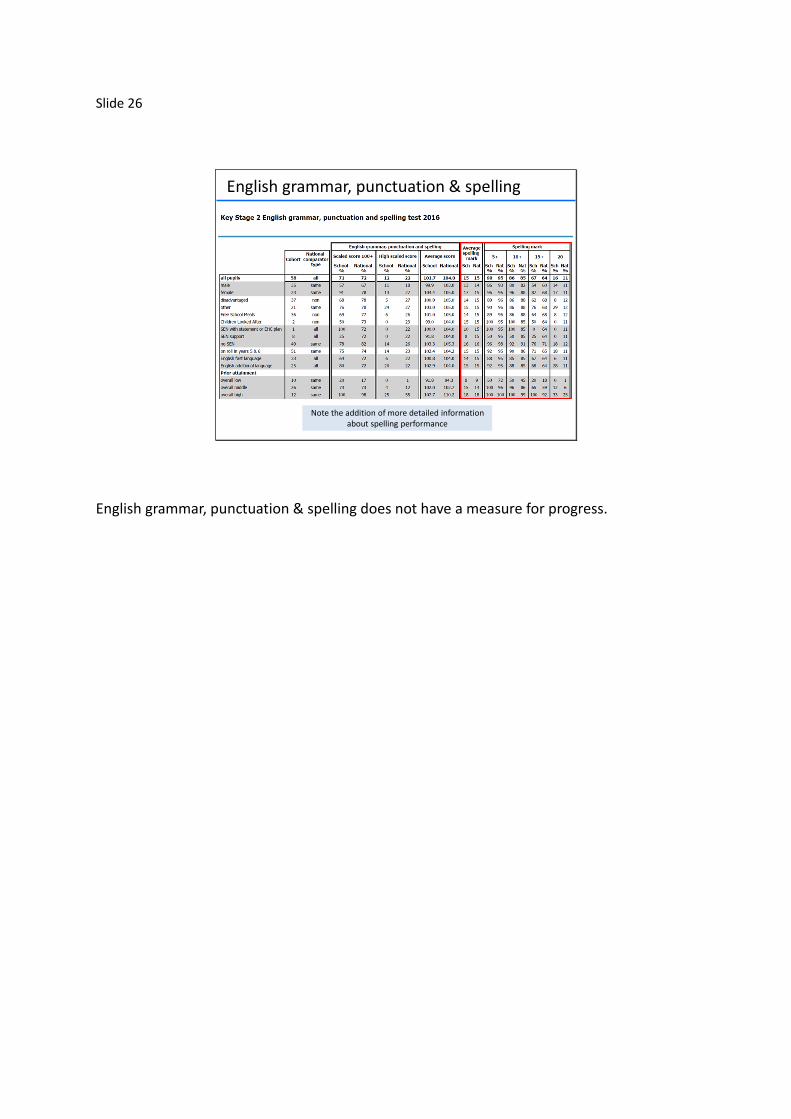
English grammar, punctuation & spelling
Note the addition of more detailed information about spelling performance
English grammar, punctuation & spelling does not have a measure for progress.
Slide 27
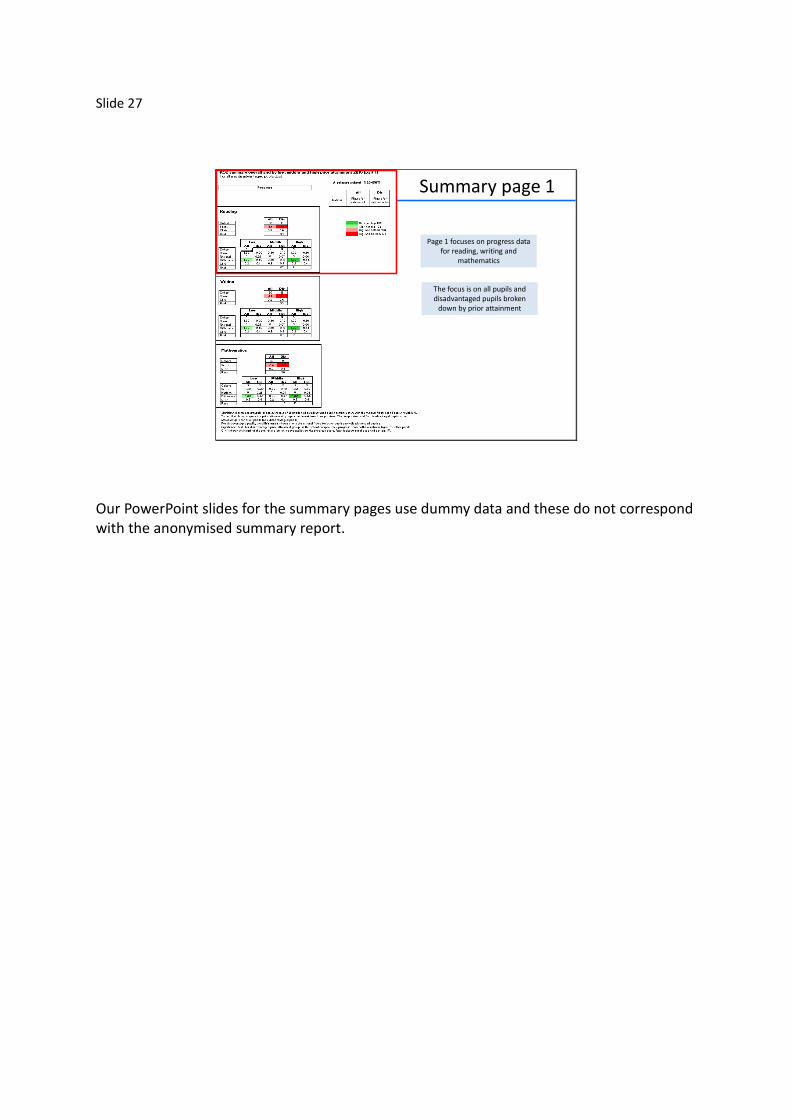
Summary page 1
Page 1 focuses on progress data for reading, writing and
mathematics
The focus is on all pupils and disadvantaged pupils broken
down by prior attainment
Our PowerPoint slides for the summary pages use dummy data and these do not correspond with the anonymised summary report.

Slide 28
Building up the summary report - progress
Important to note what national comparators are being used in this report
Disadvantaged pupils are compared to the national of other pupils
Significance is comparing school score to those national comparators
The percentile rank is against all schools nationally
The key points here are that the national comparators where shown are for the national ‘other’ pupils (non disadvantaged). This is a necessary comparator if we are to diminish the gap for disadvantaged pupils. New shading is about to be introduced using two shades of red and two shades of green.
Slide 29
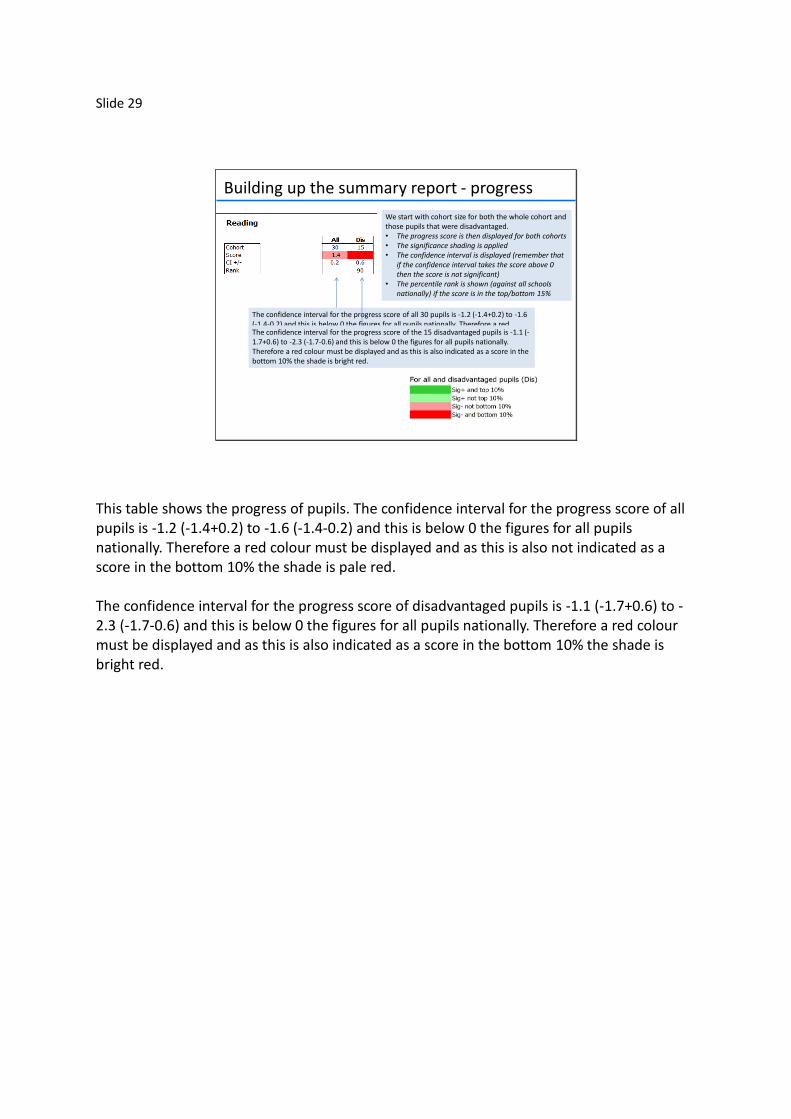
We start with cohort size for both the whole cohort and those pupils that were disadvantaged.• The progress score is then displayed for both cohorts• The significance shading is applied • The confidence interval is displayed (remember that
if the confidence interval takes the score above 0 then the score is not significant)
• The percentile rank is shown (against all schools nationally) if the score is in the top/bottom 15%
Building up the summary report - progress
The confidence interval for the progress score of all 30 pupils is -1.2 (-1.4+0.2) to -1.6 (-1.4-0.2) and this is below 0 the figures for all pupils nationally. Therefore a red colour must be displayed and as this is also not indicated as a score in the bottom 10% the shade is pale red.
The confidence interval for the progress score of the 15 disadvantaged pupils is -1.1 (-1.7+0.6) to -2.3 (-1.7-0.6) and this is below 0 the figures for all pupils nationally. Therefore a red colour must be displayed and as this is also indicated as a score in the bottom 10% the shade is bright red.
This table shows the progress of pupils. The confidence interval for the progress score of all pupils is -1.2 (-1.4+0.2) to -1.6 (-1.4-0.2) and this is below 0 the figures for all pupils nationally. Therefore a red colour must be displayed and as this is also not indicated as a score in the bottom 10% the shade is pale red. The confidence interval for the progress score of disadvantaged pupils is -1.1 (-1.7+0.6) to -2.3 (-1.7-0.6) and this is below 0 the figures for all pupils nationally. Therefore a red colour must be displayed and as this is also indicated as a score in the bottom 10% the shade is bright red.

Slide 30
The focus then switches to the progress made from different prior attainment starting points for both all pupils and disadvantaged
Building up the summary report - progress
The confidence interval for the progress score of all high prior attainment pupils is 1.52 (1.32+0.2) to 1.12 (1.32-0.2) as this confidence interval is above 0 a green colour must be displayed and as this is indicated as a score in the top 10% the shade is a brighter green.
The confidence interval for the progress score of all low prior attainment pupils is 1.50 (1.30+0.2) to 1.1 (1.30-0.2) as this confidence interval is above 0 a green colour must be displayed and as this is not indicated as a score in the top 10% the shade is a paler green.
Two examples. Test to follow!
Slide 31
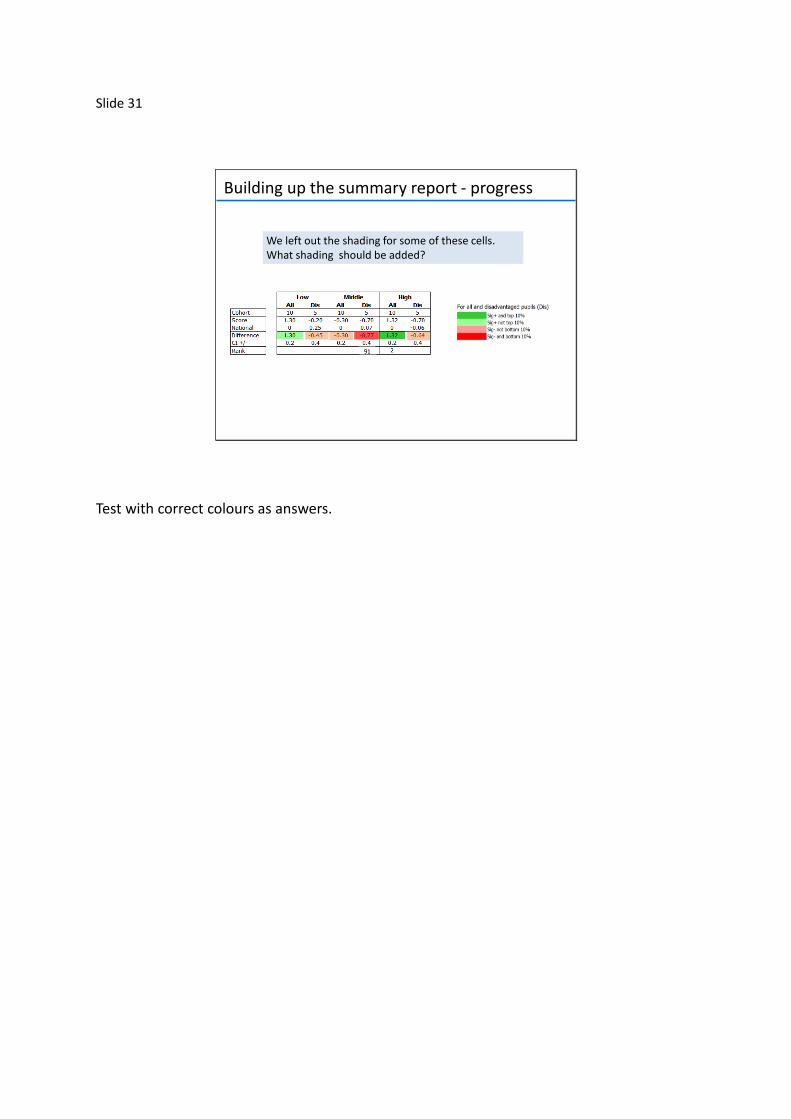
91
We left out the shading for some of these cells.What shading should be added?
Building up the summary report - progress
Test with correct colours as answers.
Slide 32
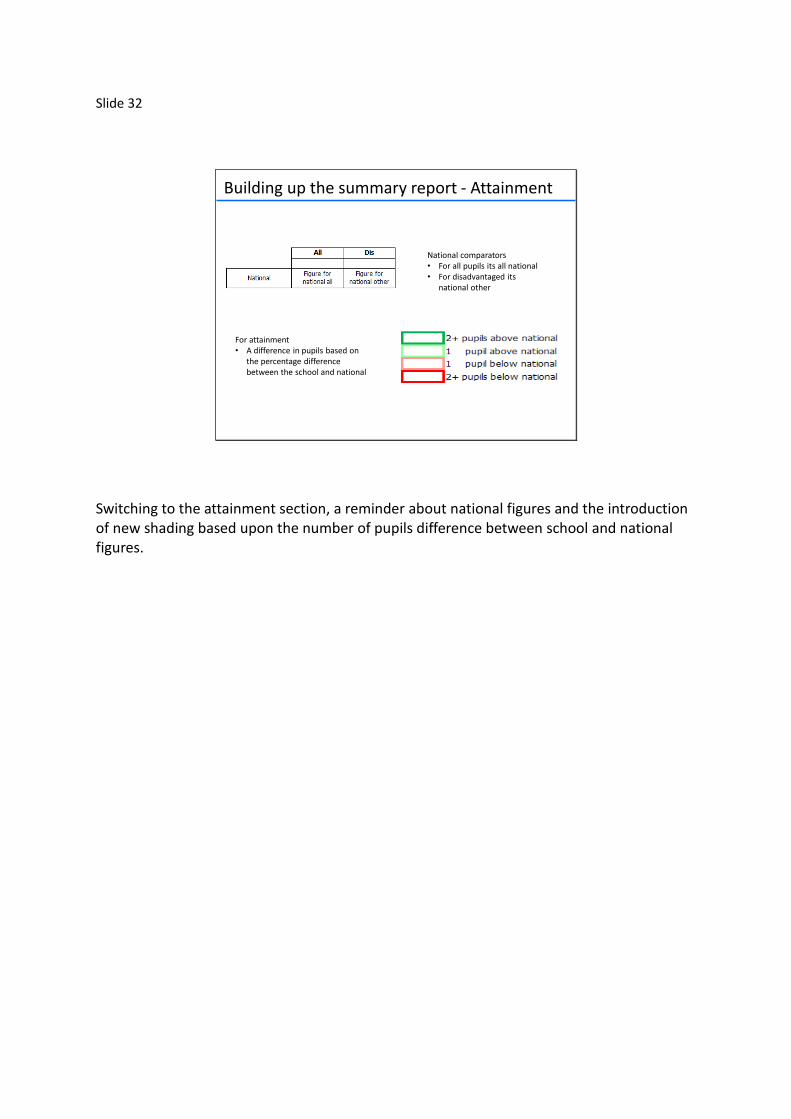
For attainment• A difference in pupils based on
the percentage difference between the school and national
National comparators• For all pupils its all national• For disadvantaged its
national other
Building up the summary report - Attainment
Switching to the attainment section, a reminder about national figures and the introduction of new shading based upon the number of pupils difference between school and national figures.
Slide 33
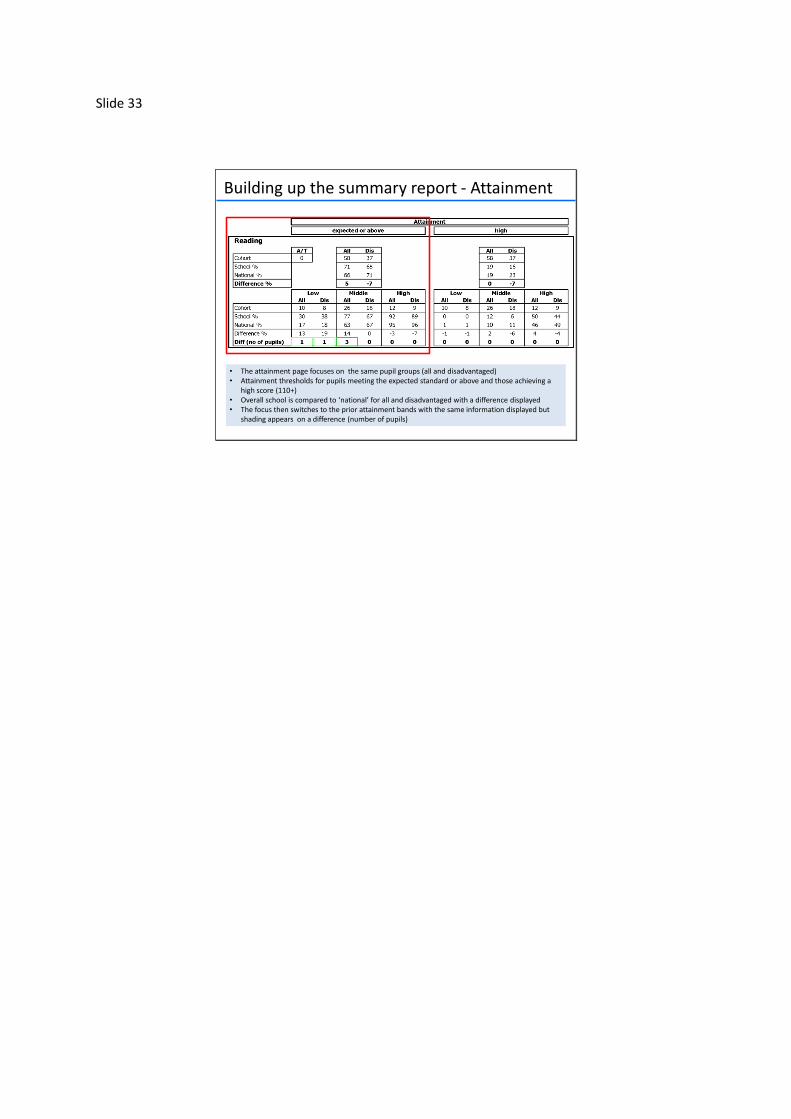
Building up the summary report - Attainment
• The attainment page focuses on the same pupil groups (all and disadvantaged)• Attainment thresholds for pupils meeting the expected standard or above and those achieving a
high score (110+)• Overall school is compared to ‘national’ for all and disadvantaged with a difference displayed• The focus then switches to the prior attainment bands with the same information displayed but
shading appears on a difference (number of pupils)
Slide 34
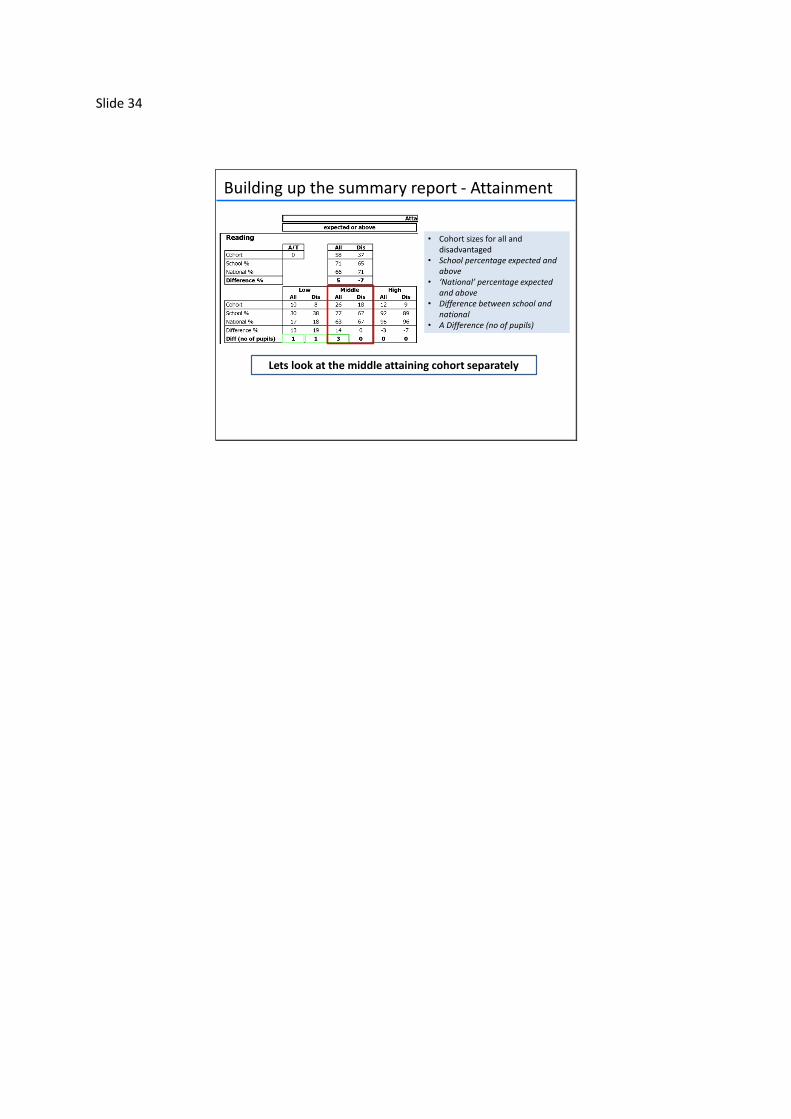
• Cohort sizes for all and disadvantaged
• School percentage expected and above
• ‘National’ percentage expected and above
• Difference between school and national
• A Difference (no of pupils)
Lets look at the middle attaining cohort separately
Building up the summary report - Attainment
Slide 35
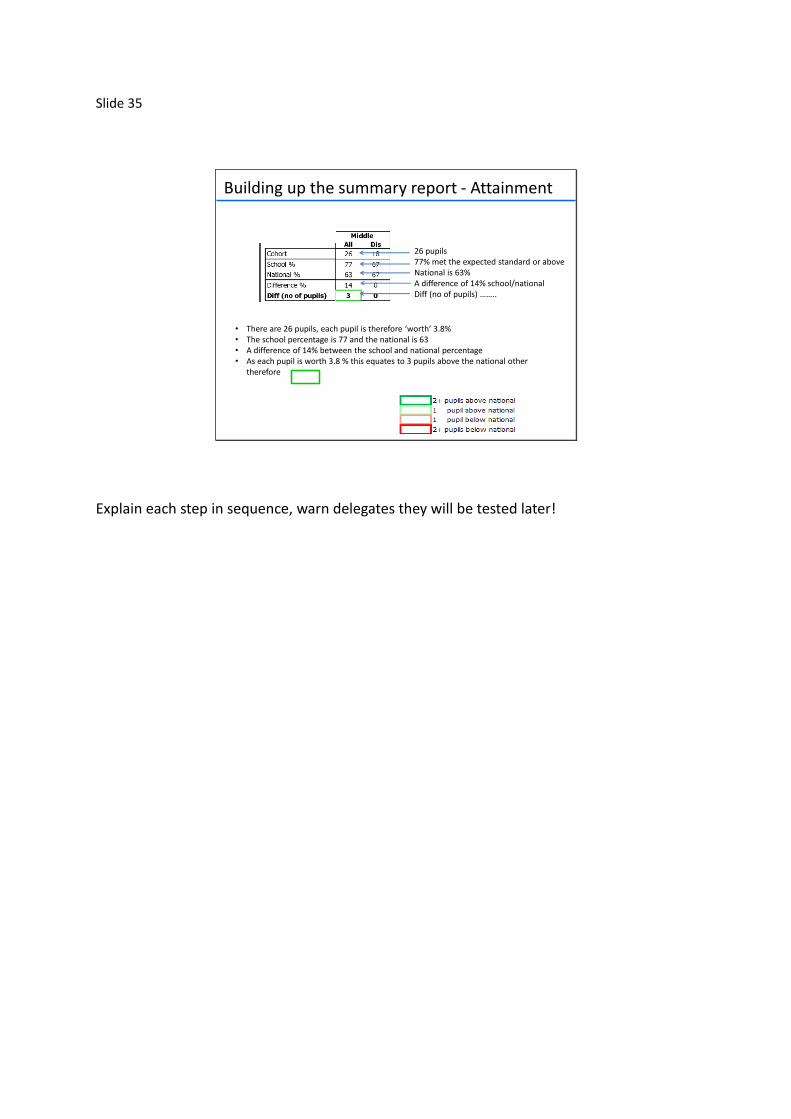
26 pupils77% met the expected standard or aboveNational is 63%A difference of 14% school/nationalDiff (no of pupils) ……..
• There are 26 pupils, each pupil is therefore ‘worth’ 3.8%• The school percentage is 77 and the national is 63• A difference of 14% between the school and national percentage• As each pupil is worth 3.8 % this equates to 3 pupils above the national other
therefore
Building up the summary report - Attainment
Explain each step in sequence, warn delegates they will be tested later!

Slide 36
Building up the summary report - Attainment
18 disadvantaged pupils56 % met the expected standard or aboveNational (other) is 71 %A difference of -16 % school/nationalDiff (no of pupils) ……..
• There are 18 pupils, each pupil is therefore ‘worth’ 5.5 %• The school percentage is 56 and the national other is 71• A difference of -16 % between the school and national percentage• As each pupil is worth 5.5 % this equates to 2 pupils below the national other
therefore
This is repeated for writing and
mathematics
Test time
Introduce the arrows one at a time, ask what this is pointing to for disadvantaged pupils, elicit some answers before revealing the answer. Provide further narrative if necessary for some governors.

Slide 37
Building up the summary report - Attainment
• Page 3 of the ‘summary’ continues with attainment and starts with the combined reading, writing and mathematics
• Expected standard or above and high• The same shading rules are applied• EGPS comes next • Science is included (expected or above)
Slide 38
• The first part of the ‘summary’ focuses on Progress
• The second part focuses on attainment
• The purpose of this report is to focus upon disadvantaged pupils from their starting points
• National comparators (all for all but other for disadvantaged)
• 4 different types of shading for progress and attainment
– Statistical significance for progress
– Shading based on pupils difference for attainment
Recap
At this stage governors may need time to consolidate their learning by referencing either the anonymised report or their own schools report
Slide 39
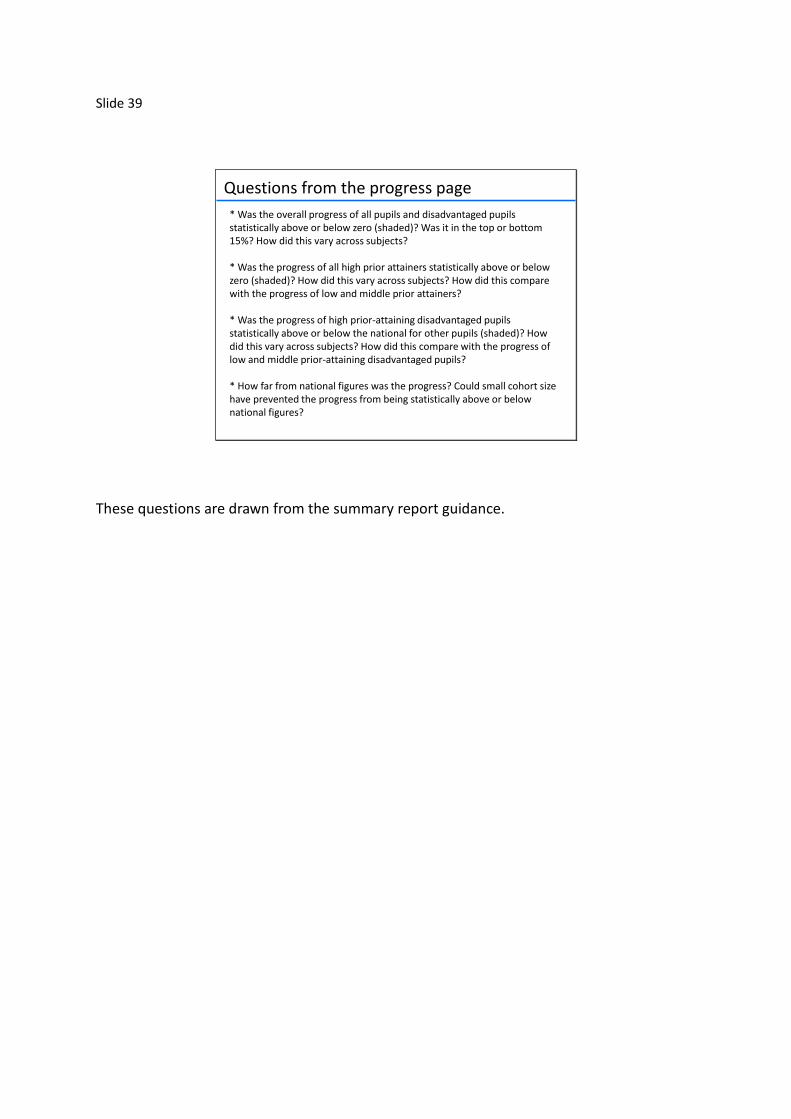
* Was the overall progress of all pupils and disadvantaged pupils statistically above or below zero (shaded)? Was it in the top or bottom 15%? How did this vary across subjects?
* Was the progress of all high prior attainers statistically above or below zero (shaded)? How did this vary across subjects? How did this compare with the progress of low and middle prior attainers?
* Was the progress of high prior-attaining disadvantaged pupils statistically above or below the national for other pupils (shaded)? How did this vary across subjects? How did this compare with the progress of low and middle prior-attaining disadvantaged pupils?
* How far from national figures was the progress? Could small cohort size have prevented the progress from being statistically above or below national figures?
Questions from the progress page
These questions are drawn from the summary report guidance.

Slide 40
* What additional information does the attainment data provide about the numbers of pupils represented by the difference from national figures (bearing in mind that larger cohorts of middle prior attainers are more likely to be shaded than smaller low or high prior-attaining cohorts)?
Questions from attainment
These questions are drawn from the summary report guidance. The reference to larger cohorts of middle prior attainers being more likely to be shaded is a consequence of the statistical approach being used and may not indicate more serious issues with middle prior attainment pupil performance.

Slide 41
Key Stage 2
Scatter plots
All our mock ups are draft and the data is illustrative purposes only

Slide 42
• There are separate scatter plots for progress and attainment• These scatterplots allow you to see the outliers in a school’s
performance• Progress scatterplots show pupil performance against the
national figure for all pupils (0)• Attainment scatterplots show pupil performance against the
national average lines for each of the 21 prior attainment groups
• These 21 prior attainment groups use a combined reading, writing and mathematics from KS1.
• School users of the interactive system can hover on a dot in ascatterplot to see pupil names and details
• Separate prior attainment inputs for reading, writing and mathematics can also be displayed although these can have no national comparators
KS1 – 2 Scatter plots
The scatterplots for progress and attainment look very different from the scatterplots previously used in the RAISEonline for primary schools. We introduce the progress scatterplots first before considering attainment scatterplots. Applies to following slides The RAISEonline summary report which governors receive contains a number of scatterplots with pupils grouped by disadvantage and other only. This is to emphasise the priority given to disadvantaged pupils. RAISEonline is an interactive system which schools access and this also allows for the pupils to be grouped in several different ways and this example shows this by SEN. In addition to disadvantaged and SEN other groupings available include gender, ethnicity, free school meals and prior attainment. Governors with an interest in these pupil groups could therefore ask schools to generate these reports as well.

Slide 43
Key stage 1 prior attainment
Pro
gre
ss s
core
fro
m K
S1 t
o K
S2
National average is 0 for all the prior attainment starting points
This is the basic structure of a KS1 to 2 progress scatterplot.
Slide 44
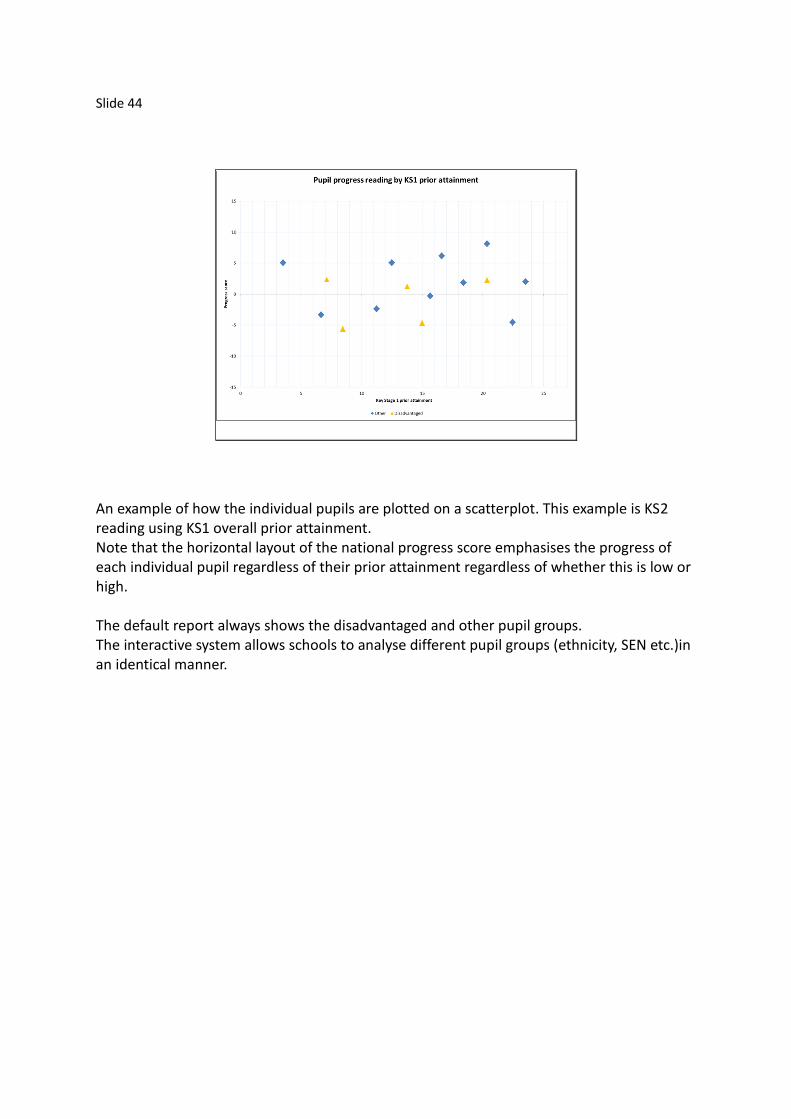
An example of how the individual pupils are plotted on a scatterplot. This example is KS2 reading using KS1 overall prior attainment. Note that the horizontal layout of the national progress score emphasises the progress of each individual pupil regardless of their prior attainment regardless of whether this is low or high. The default report always shows the disadvantaged and other pupil groups. The interactive system allows schools to analyse different pupil groups (ethnicity, SEN etc.)in an identical manner.

Slide 45
National average for pupils with prior attainment 10 from KS1
Our pupil is 10 scaled score points above the average pupil (+10)
National average for pupils with prior attainment 17 from KS1
Our pupil is 10 scaled score points below the average pupil (-10)
A graphic animation showing pupil progress being plotted.

Slide 46
The school score is the pupil scores added together then divided by the number of pupils. So ….
-10
10
5
-5
5
Pupil scores
-10 + 10 + -5 + 5 + 5 = 5
Progress score of 5 divided by the total number of pupils (5)
5/5 = +1
School score+ 1
This illustrates how a schools progress score is calculated from the individual scores of pupils. This example shows a school with 5 pupils and how the reading progress score is calculated.

Slide 47
KS1 to 2 scatterplots - progress
All scatterplots have a table beneath showing the performance of disadvantaged and all pupils by their KS1 prior attainment.
A mathematics progress scatterplot example
Slide 48
KS1 to 2 scatterplots - progress
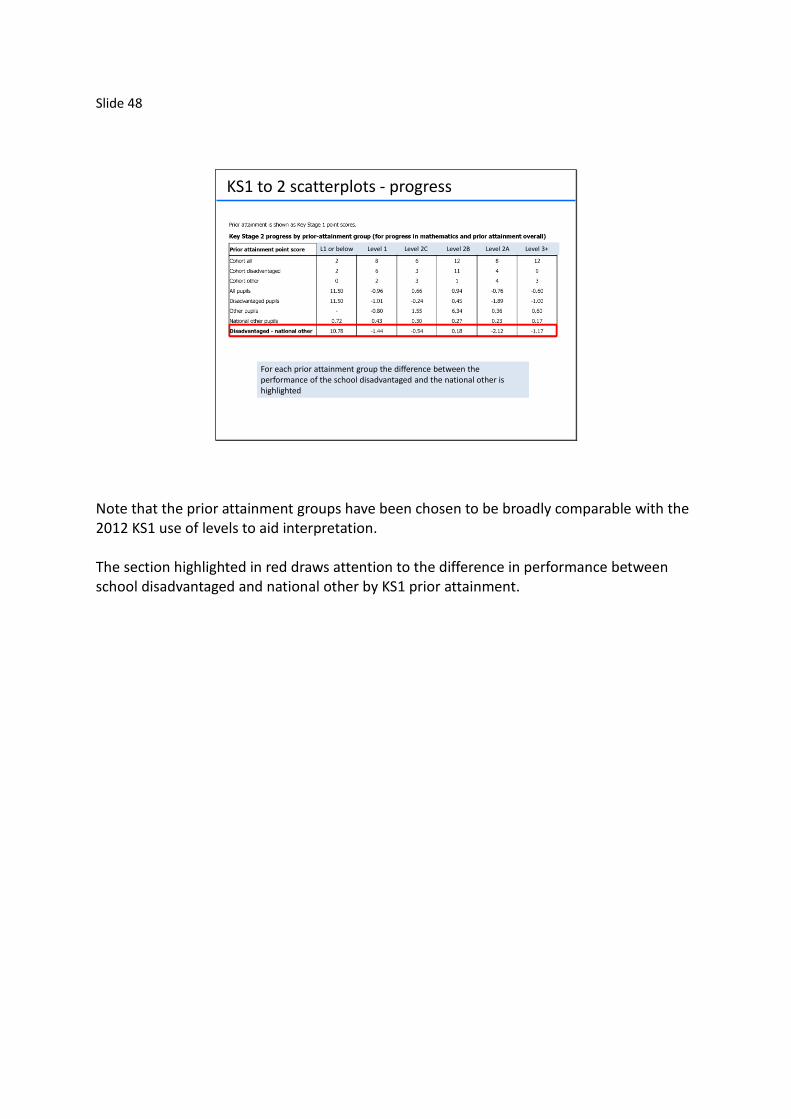
For each prior attainment group the difference between the performance of the school disadvantaged and the national other is highlighted
L1 or below Level 1 Level 2C Level 2B Level 2A Level 3+
Note that the prior attainment groups have been chosen to be broadly comparable with the 2012 KS1 use of levels to aid interpretation. The section highlighted in red draws attention to the difference in performance between school disadvantaged and national other by KS1 prior attainment.
Slide 49
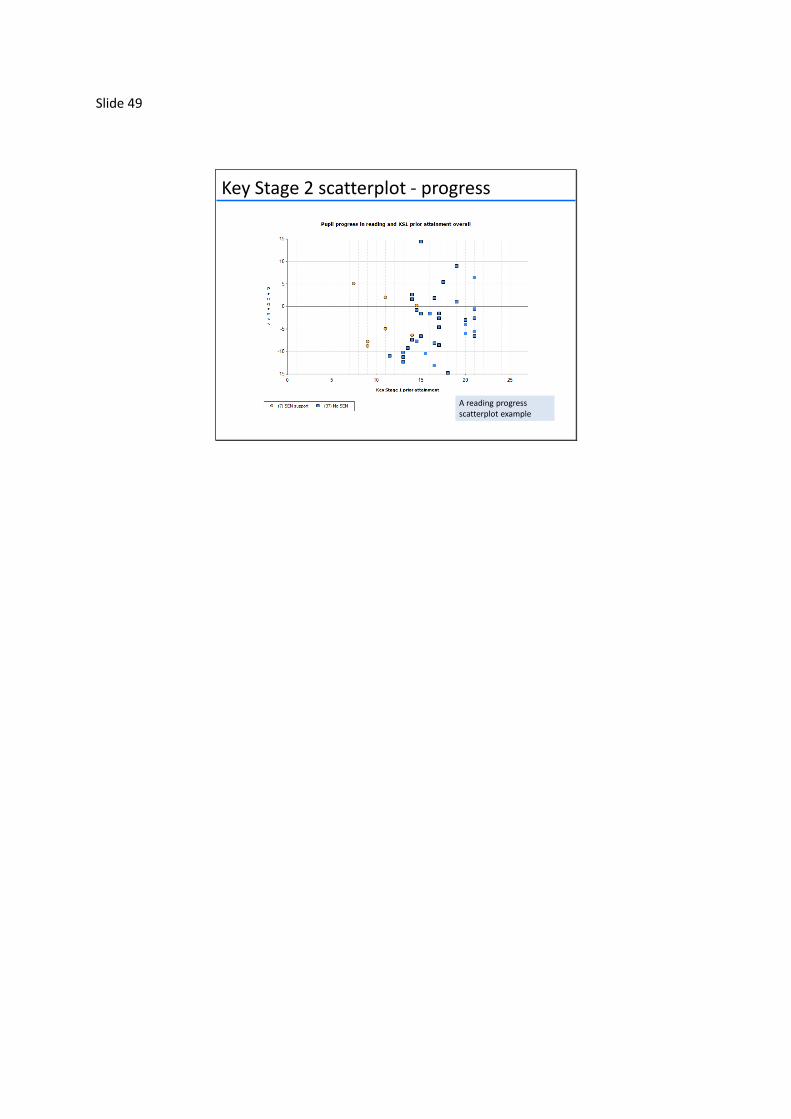
Key Stage 2 scatterplot - progress
A reading progress scatterplot example
Slide 50
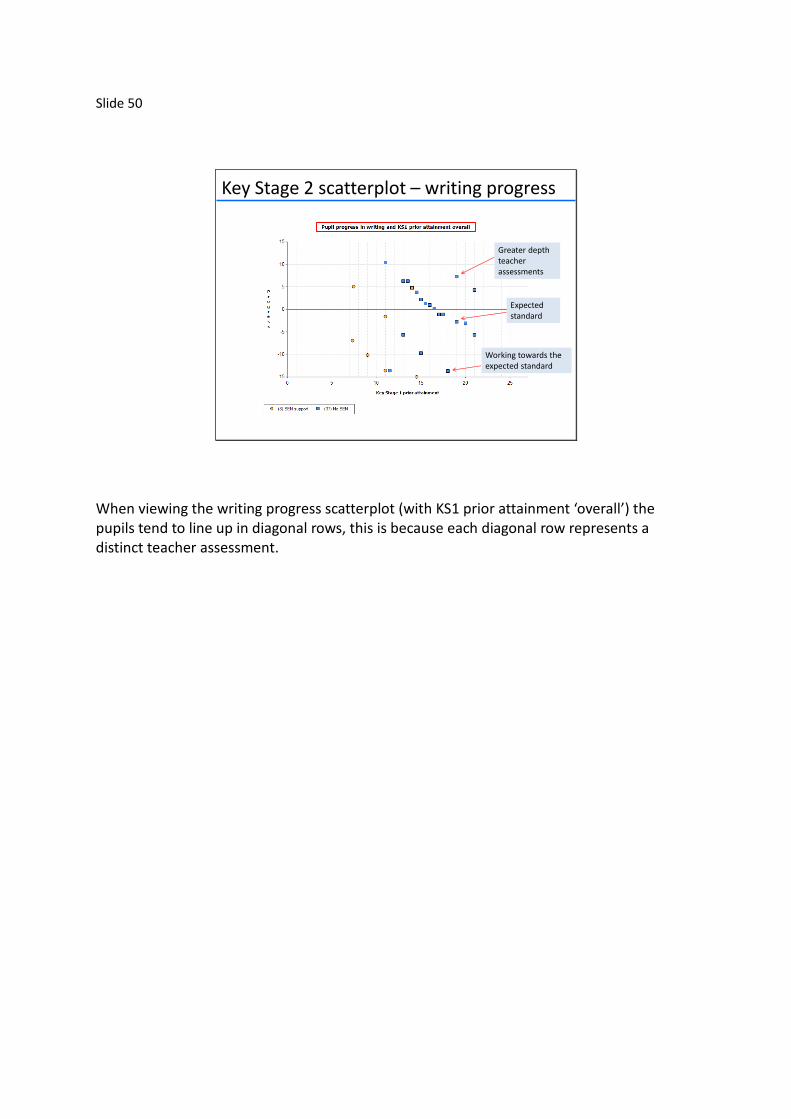
Greater depthteacher assessments
Expected standard
Working towards the expected standard
Key Stage 2 scatterplot – writing progress
When viewing the writing progress scatterplot (with KS1 prior attainment ‘overall’) the pupils tend to line up in diagonal rows, this is because each diagonal row represents a distinct teacher assessment.

Slide 51
Key Stage 2 scatterplot - progress
When viewing the writing progress scatterplot (with KS1 prior attainment writing) the pupils line up in vertical columns, this is because each vertical column represents a distinct teacher assessment in writing at KS1 in 2012. Left to right these are - below level 1, level 1, level 2C, 2B, 2A and with level 3 on the far right.
Slide 52
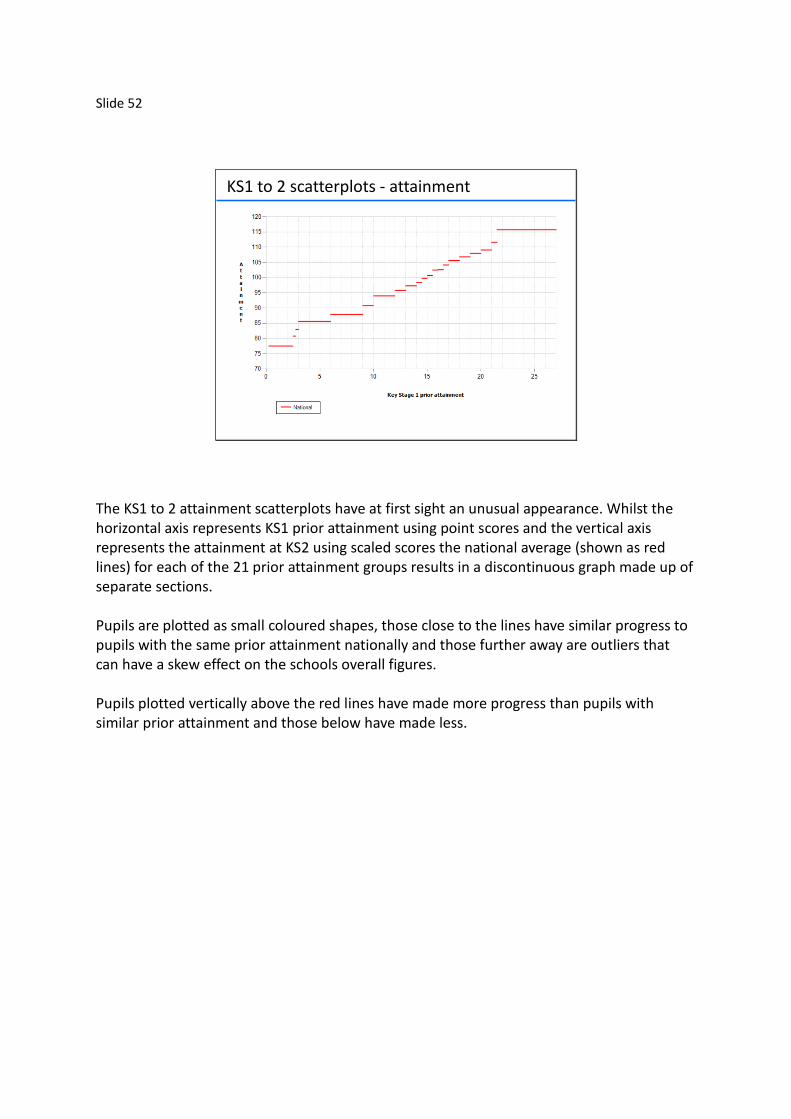
KS1 to 2 scatterplots - attainment
The KS1 to 2 attainment scatterplots have at first sight an unusual appearance. Whilst the horizontal axis represents KS1 prior attainment using point scores and the vertical axis represents the attainment at KS2 using scaled scores the national average (shown as red lines) for each of the 21 prior attainment groups results in a discontinuous graph made up of separate sections. Pupils are plotted as small coloured shapes, those close to the lines have similar progress to pupils with the same prior attainment nationally and those further away are outliers that can have a skew effect on the schools overall figures. Pupils plotted vertically above the red lines have made more progress than pupils with similar prior attainment and those below have made less.
Slide 53
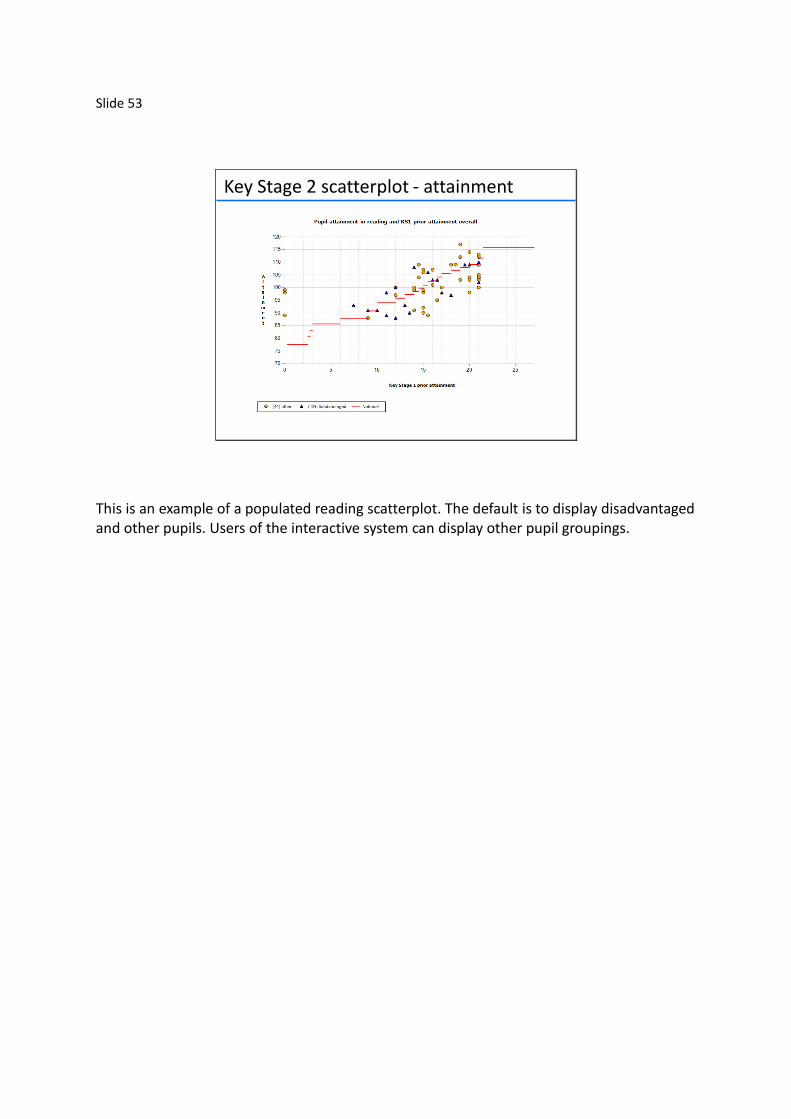
Key Stage 2 scatterplot - attainment
This is an example of a populated reading scatterplot. The default is to display disadvantaged and other pupils. Users of the interactive system can display other pupil groupings.
Slide 54
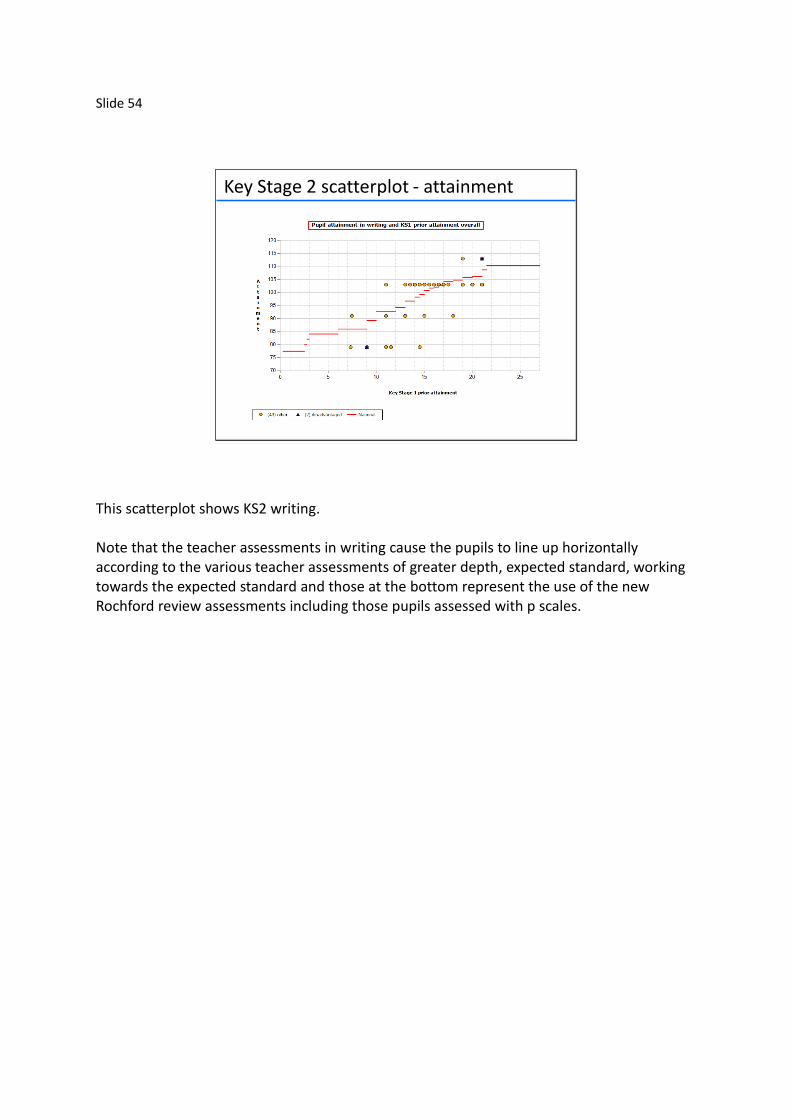
Key Stage 2 scatterplot - attainment
This scatterplot shows KS2 writing. Note that the teacher assessments in writing cause the pupils to line up horizontally according to the various teacher assessments of greater depth, expected standard, working towards the expected standard and those at the bottom represent the use of the new Rochford review assessments including those pupils assessed with p scales.
Slide 55
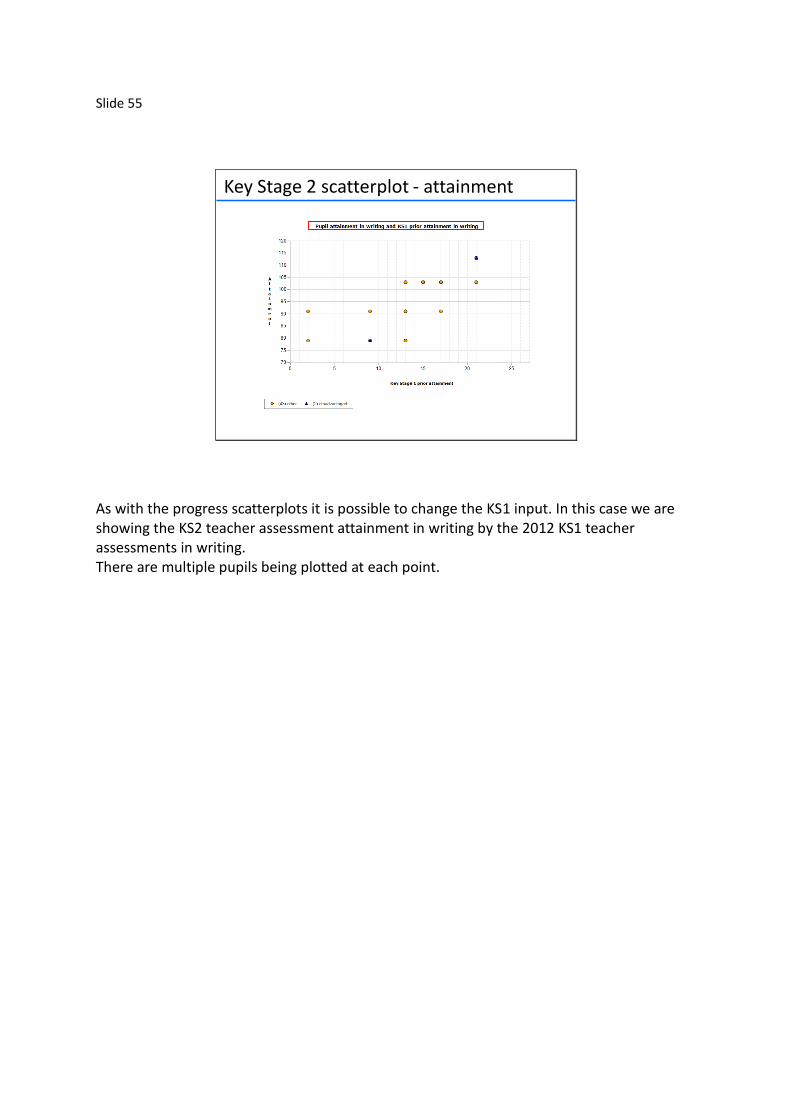
Key Stage 2 scatterplot - attainment
As with the progress scatterplots it is possible to change the KS1 input. In this case we are showing the KS2 teacher assessment attainment in writing by the 2012 KS1 teacher assessments in writing. There are multiple pupils being plotted at each point.
Slide 56
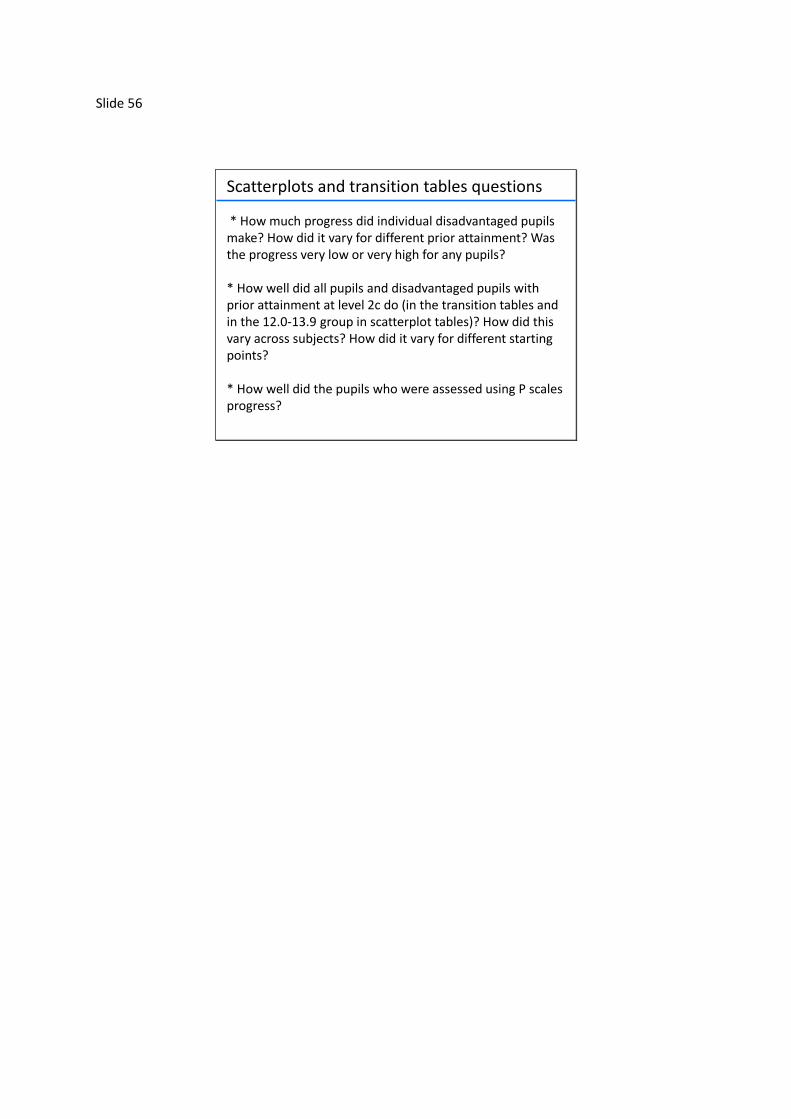
Scatterplots and transition tables questions
* How much progress did individual disadvantaged pupils make? How did it vary for different prior attainment? Was the progress very low or very high for any pupils?
* How well did all pupils and disadvantaged pupils with prior attainment at level 2c do (in the transition tables and in the 12.0-13.9 group in scatterplot tables)? How did this vary across subjects? How did it vary for different starting points?
* How well did the pupils who were assessed using P scales progress?

Slide 57
KS1 to 2 transitionsThere are separate reports for reading, writing and mathematics
There are two tables which give data for all pupils and those disadvantaged
Pupils assessed with p scales are presented in a third table
Note that the transition reports have no national figures included. This is because we have ended the notion of expected progress. For the first time the performance of pupils assessed with p scales is included in RAISEonline and these show the changes for pupils from KS1 to KS2.
Slide 58
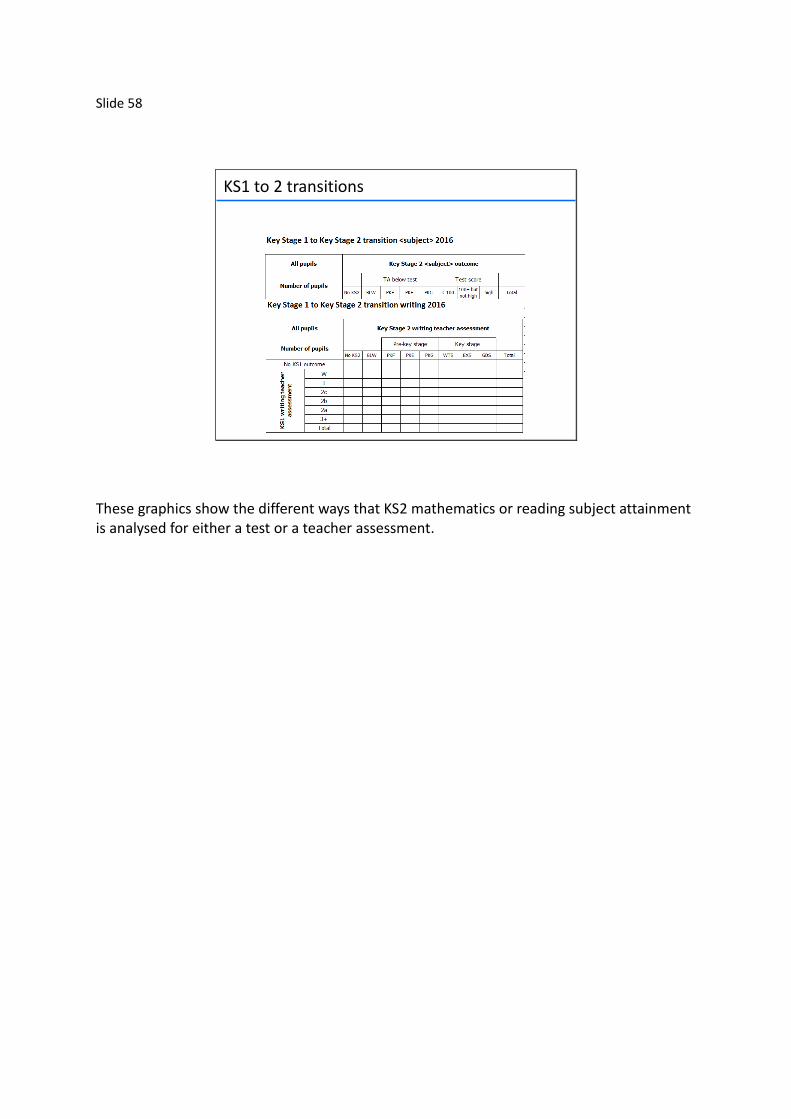
KS1 to 2 transitions
These graphics show the different ways that KS2 mathematics or reading subject attainment is analysed for either a test or a teacher assessment.
Slide 59
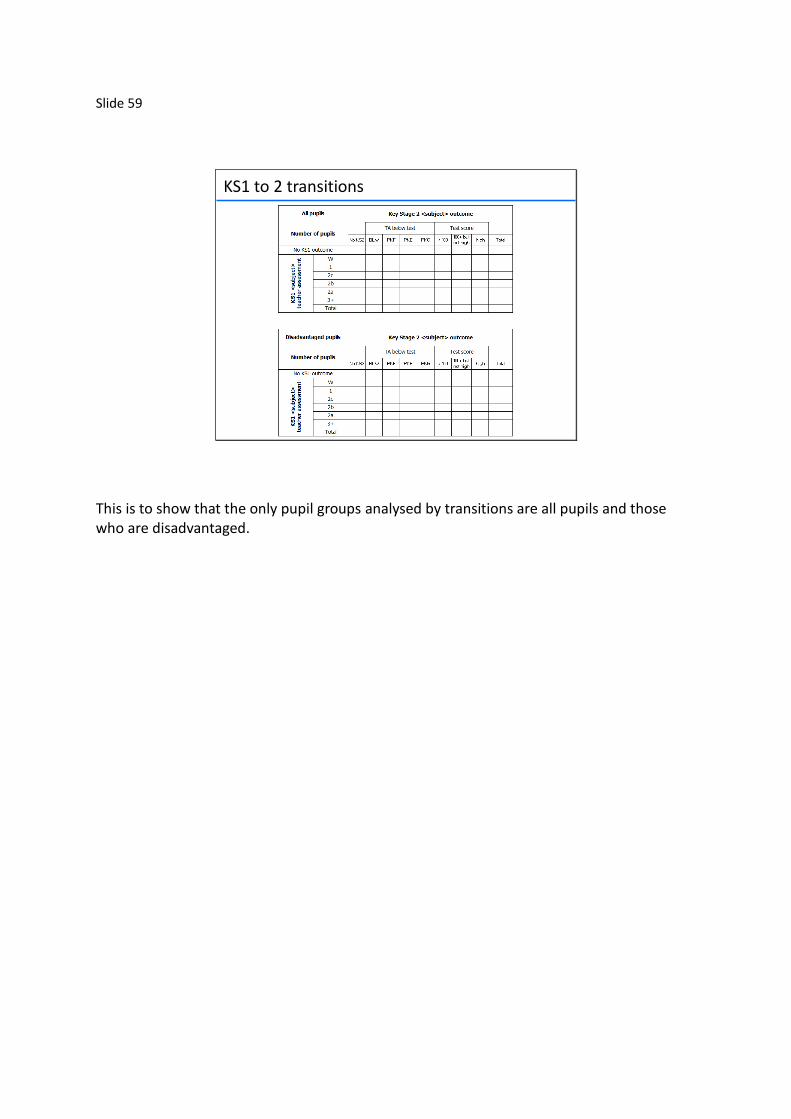
KS1 to 2 transitions
This is to show that the only pupil groups analysed by transitions are all pupils and those who are disadvantaged.
Slide 60
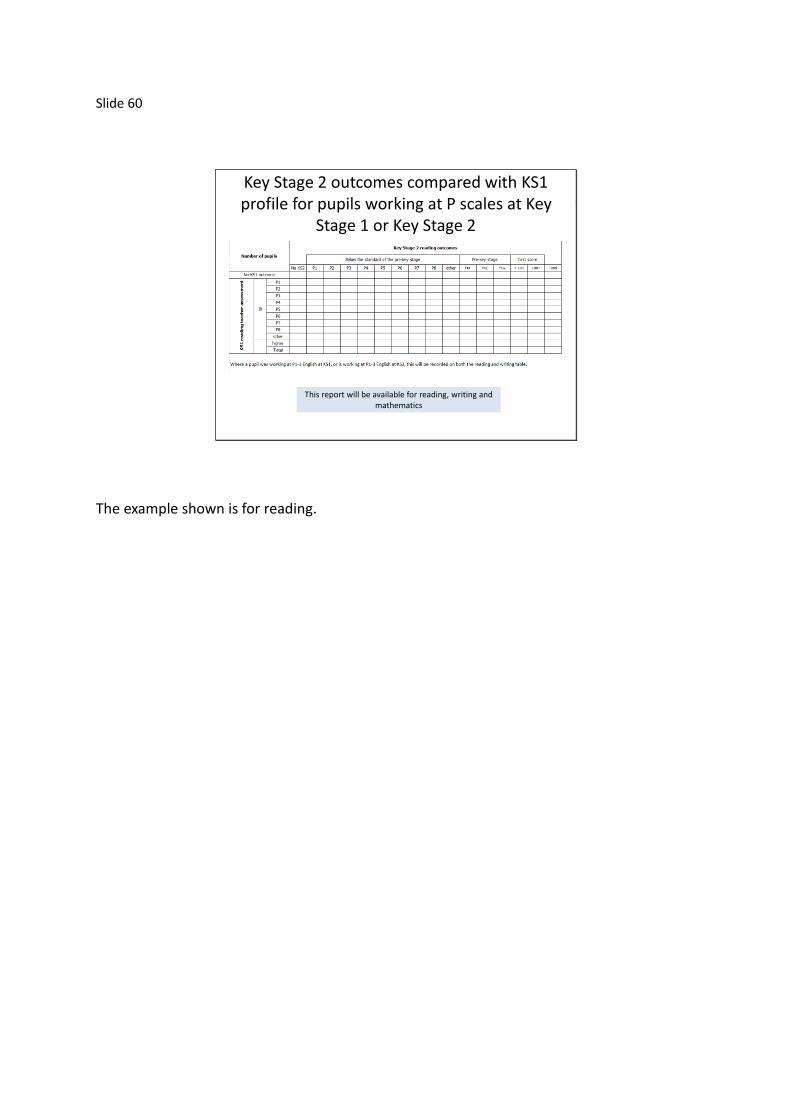
Key Stage 2 outcomes compared with KS1 profile for pupils working at P scales at Key
Stage 1 or Key Stage 2
This report will be available for reading, writing and mathematics
The example shown is for reading.

Slide 61
* How effectively has the school identified the main barriers faced by different disadvantaged pupils, in particular those with high prior attainment and those with low prior attainment who need to catch up?
* How was the pupil premium funding spent to address the different barriers and how effective were the various approaches?
* How might the progress and attainment of disadvantaged pupils in all current year groups compare with the 2016 progress and attainment?
Possible follow-up questions about disadvantaged pupils

Slide 62
* Which groups made the most progress and which groups made the least? Did this vary between subjects? Which groups made statistically above or below average progress (confidence interval does not touch zero)? Did any groups make progress in the top or bottom 10% when compared with all pupils nationally?
* Did enough pupils attain the expected and high standard? How did this vary between subjects, by groups, and by starting points overall and for subjects?
The tables and charts showing progress and attainment for each subject enable users to ask questions such as:
Other Questions
Slide 63
Key Stage 1General points of change
Science reportReading, writing & mathematics reports
Early Years Foundation Stage to KS1 transitions
The ‘summary’ page report featuring; Progress and attainment of disadvantaged pupils by their prior
attainment group
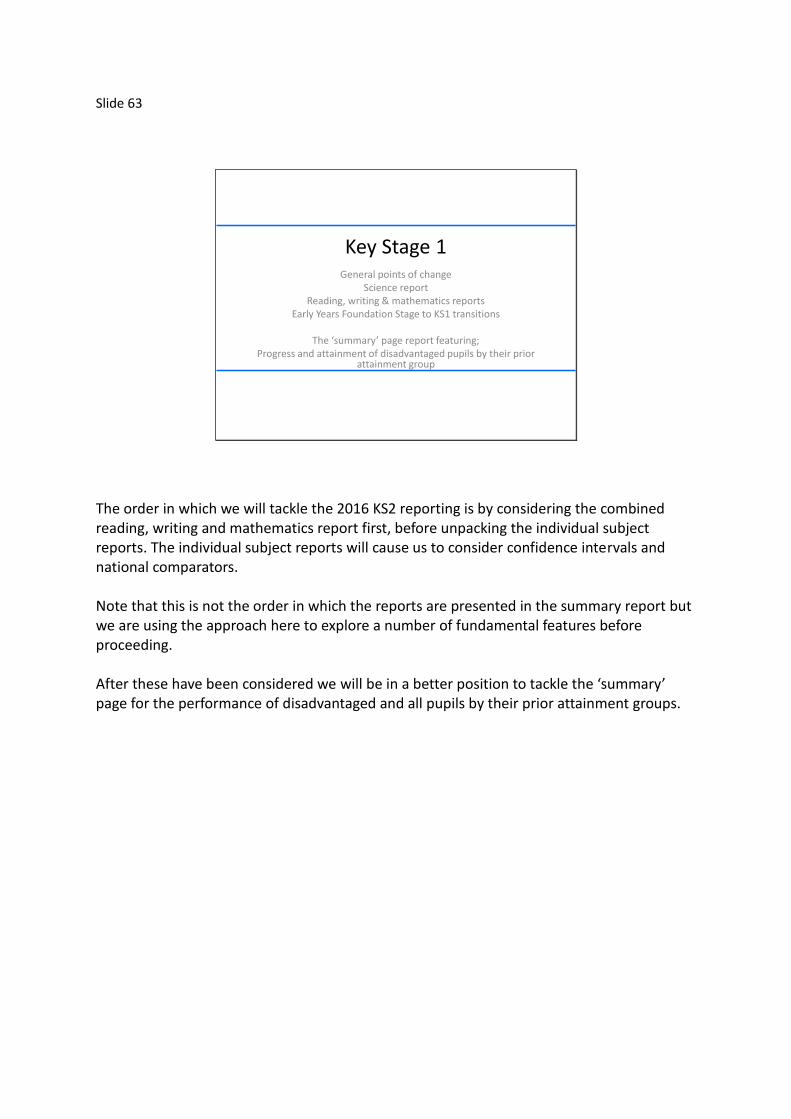
The order in which we will tackle the 2016 KS2 reporting is by considering the combined reading, writing and mathematics report first, before unpacking the individual subject reports. The individual subject reports will cause us to consider confidence intervals and national comparators. Note that this is not the order in which the reports are presented in the summary report but we are using the approach here to explore a number of fundamental features before proceeding. After these have been considered we will be in a better position to tackle the ‘summary’ page for the performance of disadvantaged and all pupils by their prior attainment groups.
Slide 64
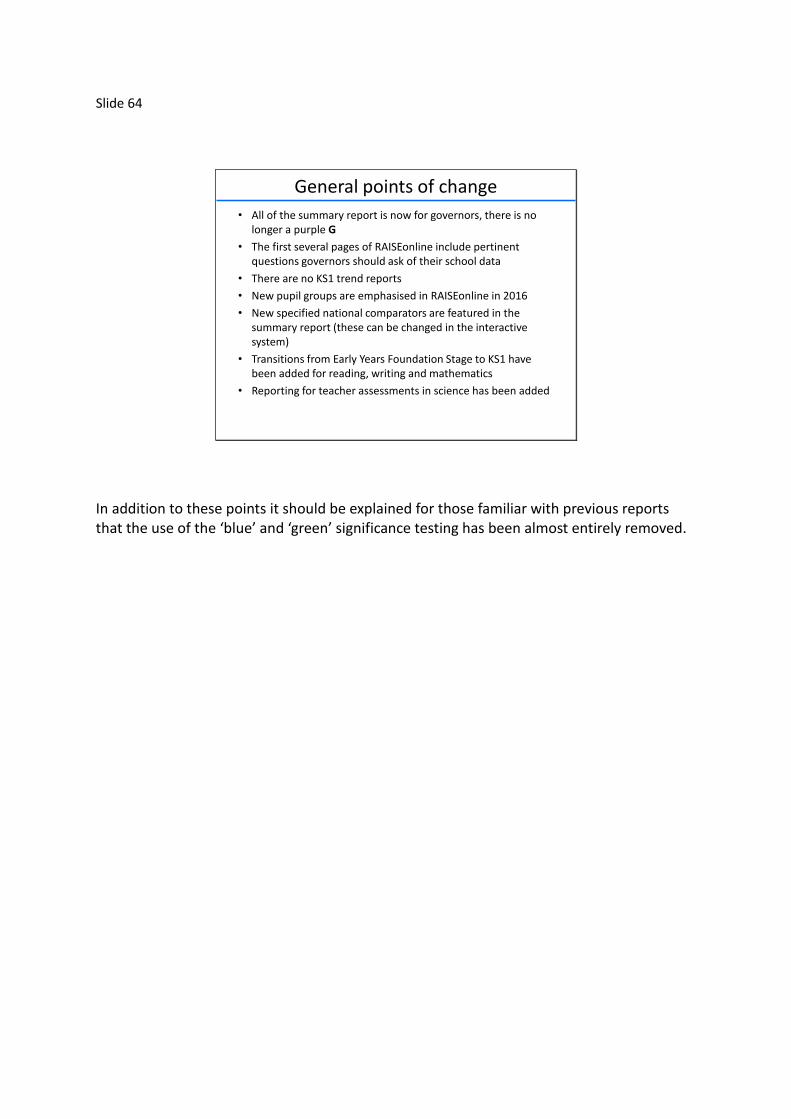
General points of change
• All of the summary report is now for governors, there is no longer a purple G
• The first several pages of RAISEonline include pertinent questions governors should ask of their school data
• There are no KS1 trend reports
• New pupil groups are emphasised in RAISEonline in 2016
• New specified national comparators are featured in the summary report (these can be changed in the interactive system)
• Transitions from Early Years Foundation Stage to KS1 have been added for reading, writing and mathematics
• Reporting for teacher assessments in science has been added
In addition to these points it should be explained for those familiar with previous reports that the use of the ‘blue’ and ‘green’ significance testing has been almost entirely removed.
Slide 65
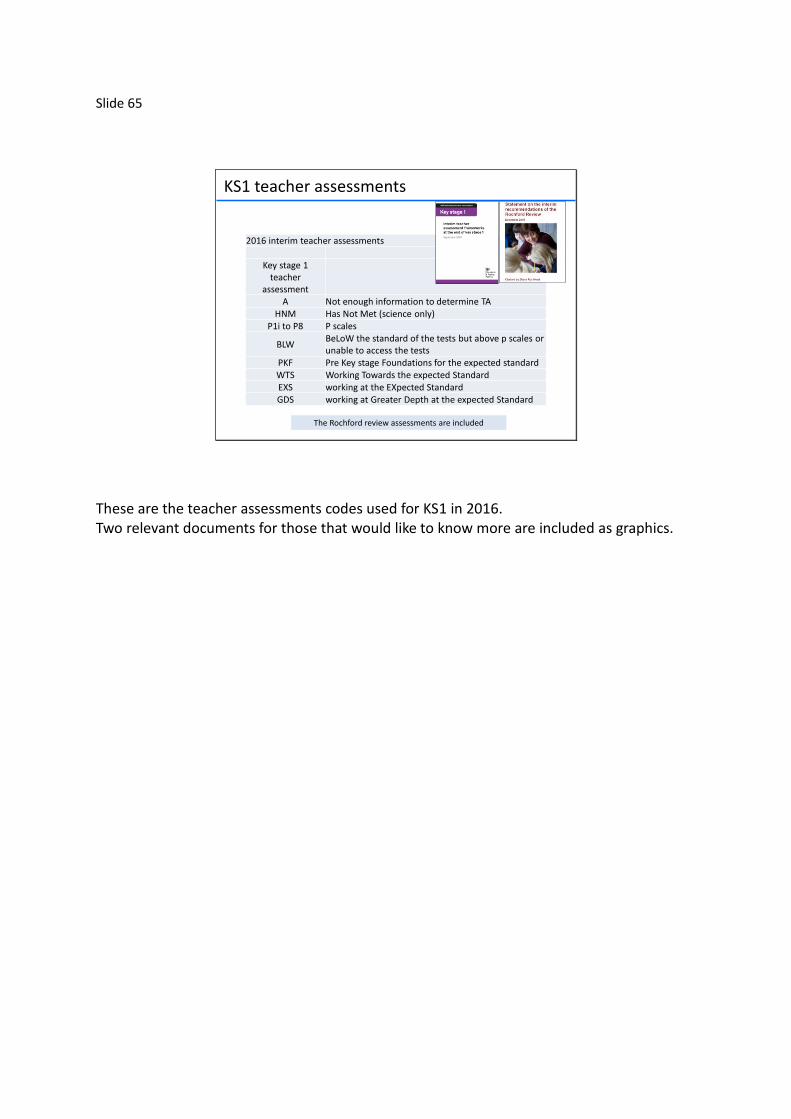
KS1 teacher assessments
2016 interim teacher assessments
Key stage 1 teacher
assessmentA Not enough information to determine TA
HNM Has Not Met (science only)P1i to P8 P scales
BLWBeLoW the standard of the tests but above p scales or unable to access the tests
PKF Pre Key stage Foundations for the expected standardWTS Working Towards the expected StandardEXS working at the EXpected StandardGDS working at Greater Depth at the expected Standard
The Rochford review assessments are included
These are the teacher assessments codes used for KS1 in 2016. Two relevant documents for those that would like to know more are included as graphics.
Slide 66
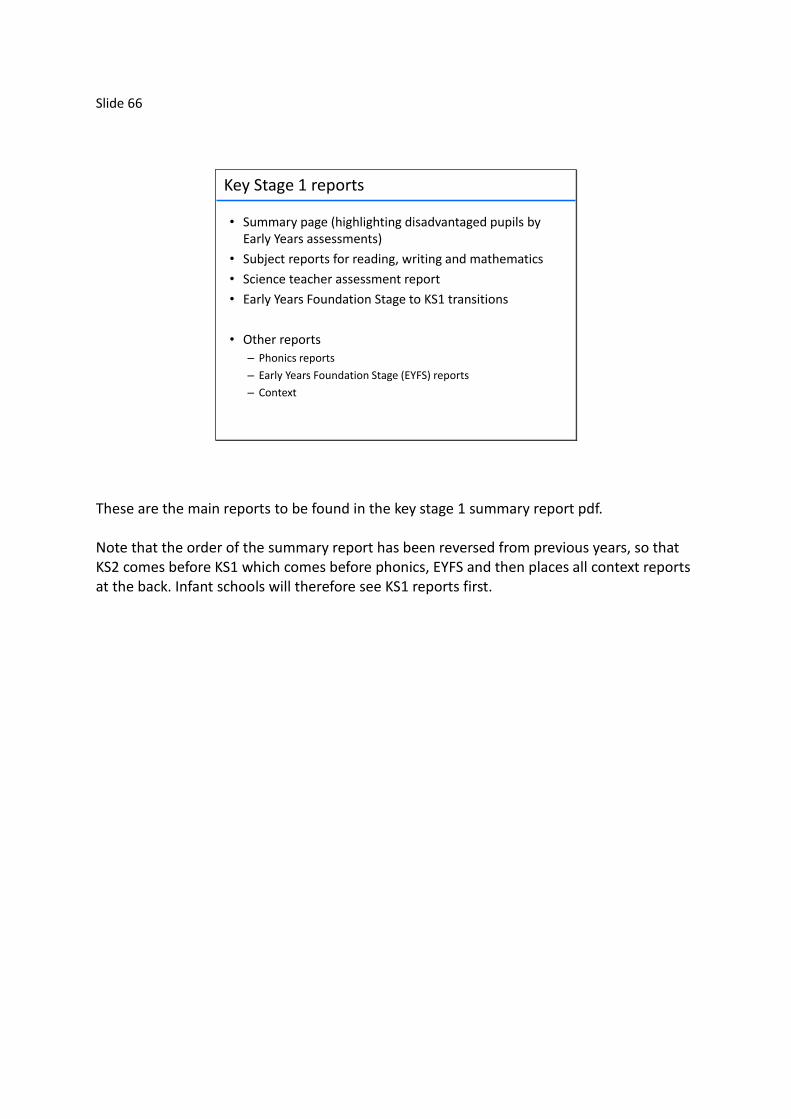
Key Stage 1 reports
• Summary page (highlighting disadvantaged pupils by Early Years assessments)
• Subject reports for reading, writing and mathematics
• Science teacher assessment report
• Early Years Foundation Stage to KS1 transitions
• Other reports
– Phonics reports
– Early Years Foundation Stage (EYFS) reports
– Context
These are the main reports to be found in the key stage 1 summary report pdf. Note that the order of the summary report has been reversed from previous years, so that KS2 comes before KS1 which comes before phonics, EYFS and then places all context reports at the back. Infant schools will therefore see KS1 reports first.
Slide 67
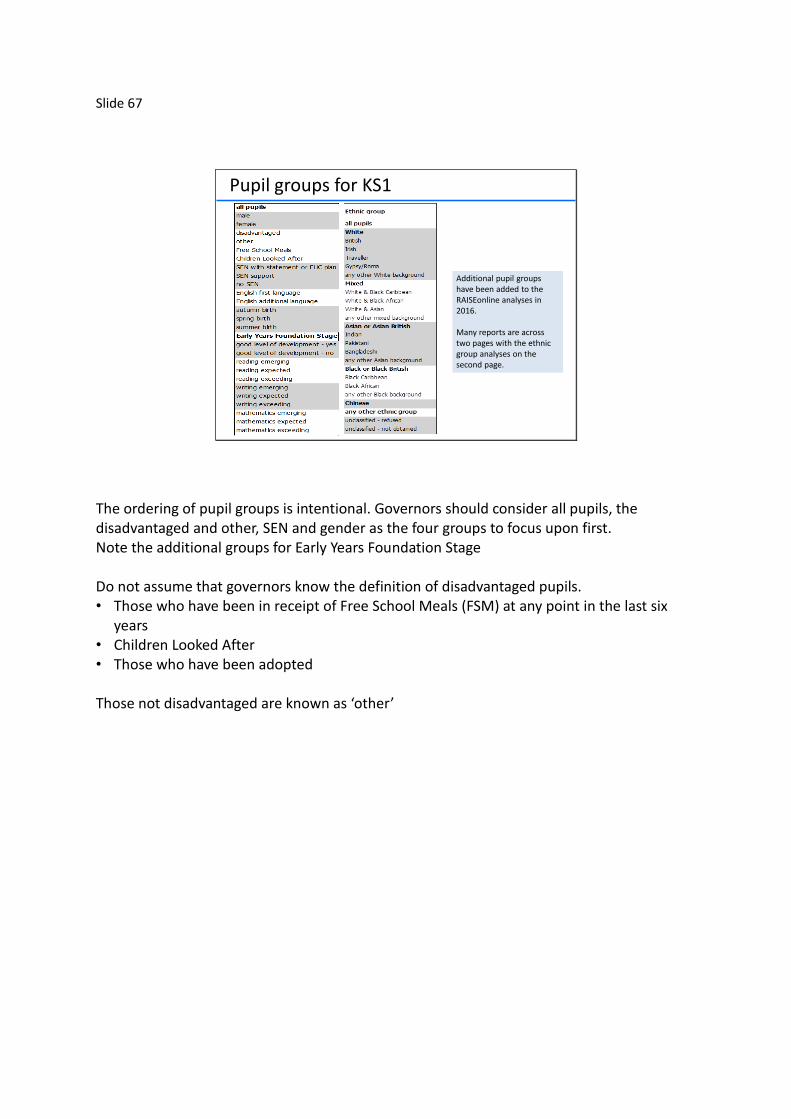
Pupil groups for KS1
Additional pupil groups have been added to the RAISEonline analyses in 2016.
Many reports are across two pages with the ethnic group analyses on the second page.
The ordering of pupil groups is intentional. Governors should consider all pupils, the disadvantaged and other, SEN and gender as the four groups to focus upon first. Note the additional groups for Early Years Foundation Stage Do not assume that governors know the definition of disadvantaged pupils. • Those who have been in receipt of Free School Meals (FSM) at any point in the last six
years • Children Looked After • Those who have been adopted Those not disadvantaged are known as ‘other’
Slide 68
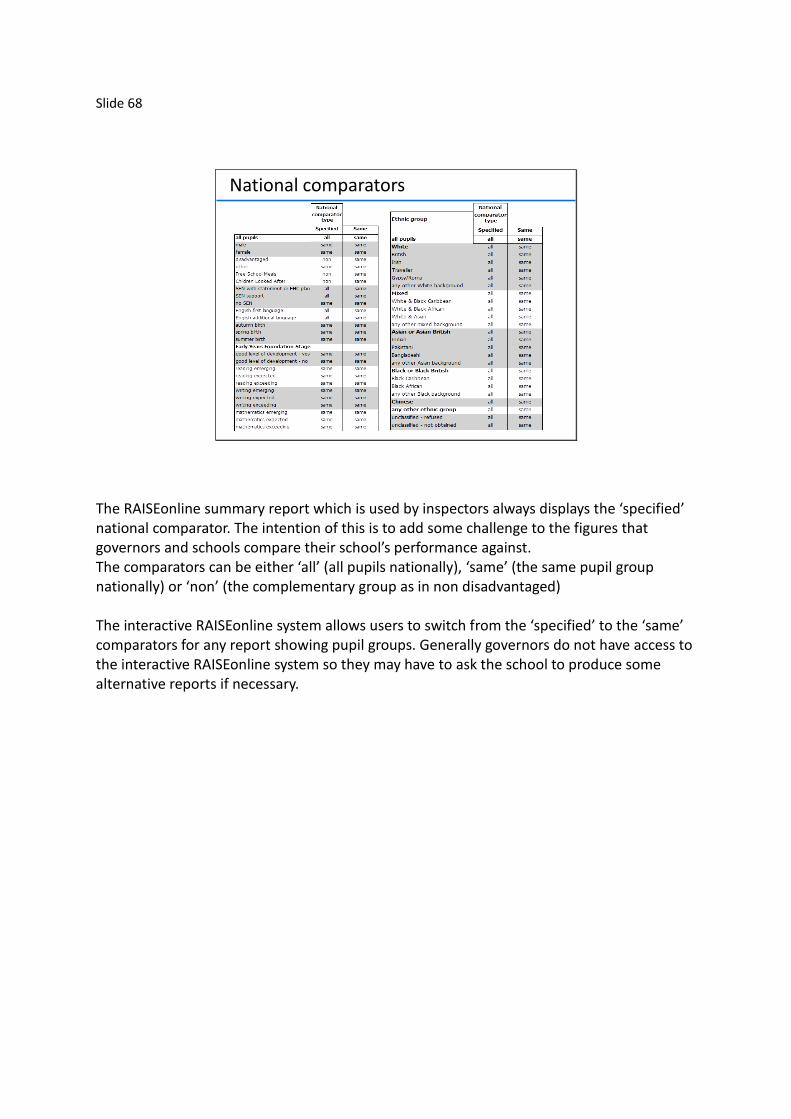
National comparators
The RAISEonline summary report which is used by inspectors always displays the ‘specified’ national comparator. The intention of this is to add some challenge to the figures that governors and schools compare their school’s performance against. The comparators can be either ‘all’ (all pupils nationally), ‘same’ (the same pupil group nationally) or ‘non’ (the complementary group as in non disadvantaged) The interactive RAISEonline system allows users to switch from the ‘specified’ to the ‘same’ comparators for any report showing pupil groups. Generally governors do not have access to the interactive RAISEonline system so they may have to ask the school to produce some alternative reports if necessary.
Slide 69
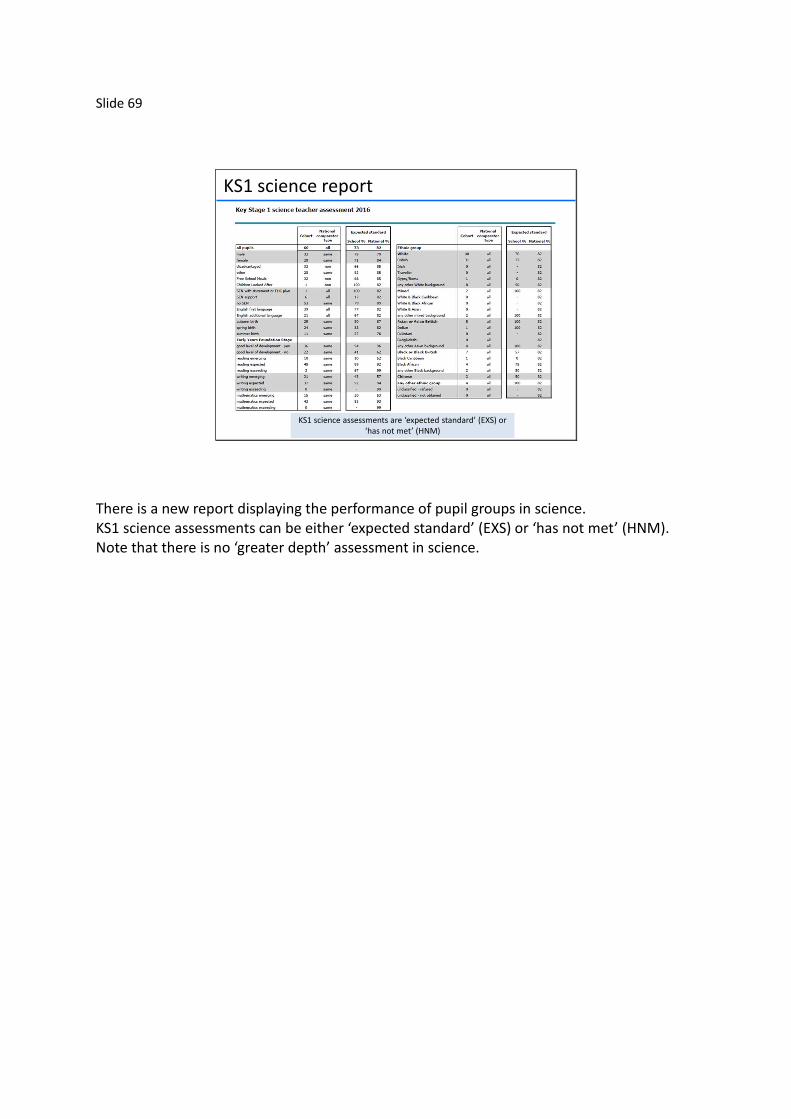
KS1 science report
KS1 science assessments are ‘expected standard’ (EXS) or ‘has not met’ (HNM)
There is a new report displaying the performance of pupil groups in science. KS1 science assessments can be either ‘expected standard’ (EXS) or ‘has not met’ (HNM). Note that there is no ‘greater depth’ assessment in science.

Slide 70
Reading or writing or mathematics
Each subject uses an identical format
The format of reporting for reading or writing or mathematics is identical. Information about pupil group cohort size and national comparators is followed by the percentages at expected+ and greater depth. The separate table to the right displays the information for those pupils who have not reached the expected standard.
Slide 71
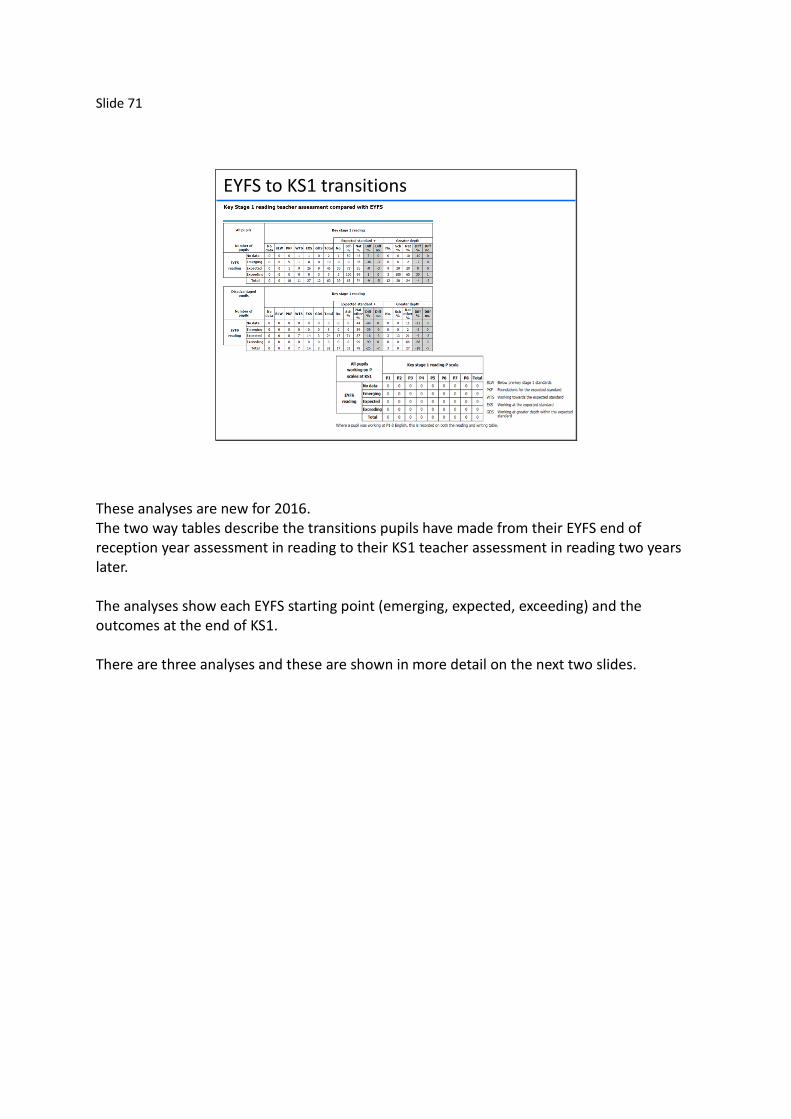
EYFS to KS1 transitions
These analyses are new for 2016. The two way tables describe the transitions pupils have made from their EYFS end of reception year assessment in reading to their KS1 teacher assessment in reading two years later. The analyses show each EYFS starting point (emerging, expected, exceeding) and the outcomes at the end of KS1. There are three analyses and these are shown in more detail on the next two slides.

Slide 72
EYFS to KS1 transition
There will be three pages for each of reading to reading writing to writing and mathematics to mathematics
Each single subject page will analyse ‘all pupils’, ‘disadvantaged’ and those assessed using p scales.
Talk governors through a single row. For example there are 45 pupils who were assessed as ‘expected’ in their EYFS assessment. Two years later, 1 attained PKF (foundations for the expected standard), 9 were WTS (working towards the expected standard), 26 were EXS (working at the expected standard) and 9 were GDS (working at greater depth). Of these 45 pupils, 35 were at the expected standard or higher which represents 78% of this cohort. Nationally 85% of pupils starting at EYFS expected reached the KS1 expected standard or higher. The school is therefore -8% below the national. As we started with a total of 45 pupils in this row each pupil represents 100/45=2.2%. The difference of 8% between the school performance and the national figure therefore represents a difference of over 3 pupils but less than 4. Hence a difference of 3 pupils is shown.
Slide 73
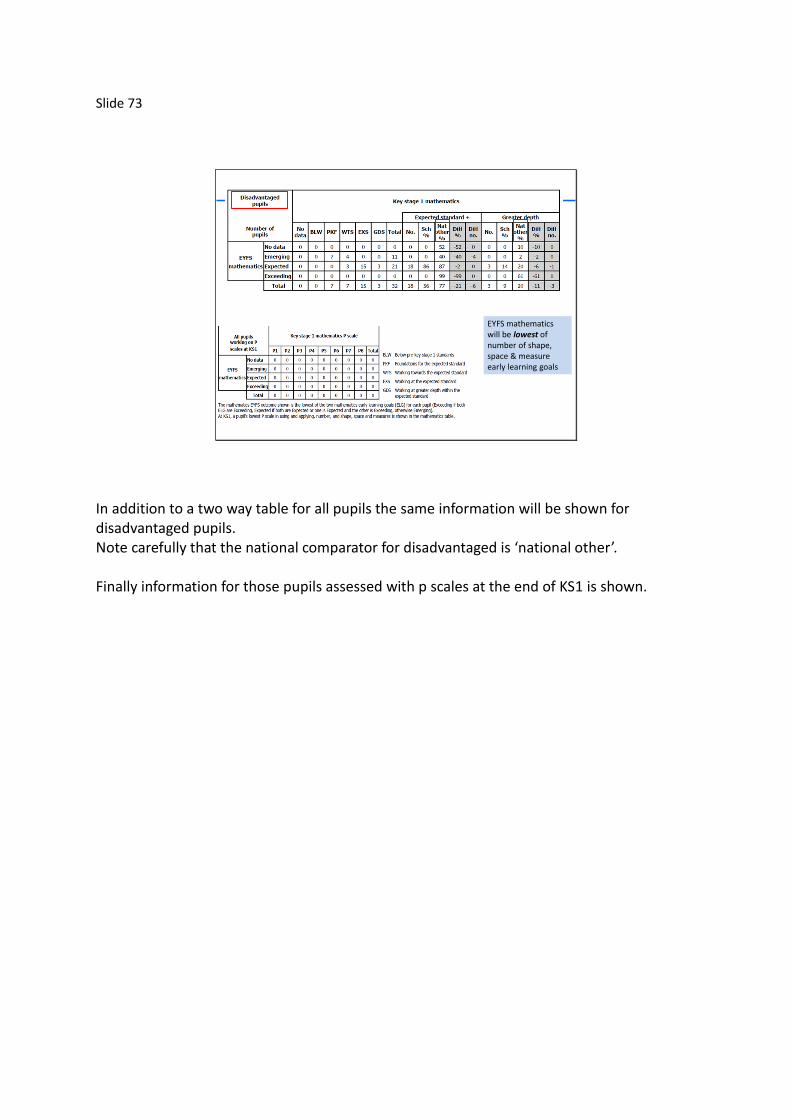
EYFS mathematics will be lowest of number of shape, space & measure early learning goals
In addition to a two way table for all pupils the same information will be shown for disadvantaged pupils. Note carefully that the national comparator for disadvantaged is ‘national other’. Finally information for those pupils assessed with p scales at the end of KS1 is shown.
Slide 74
Key Stage 1
New ‘summary’ report featuring; KS1 attainment
Disadvantaged pupilsEarly Years Foundation Stage pupil groups
Slide 75
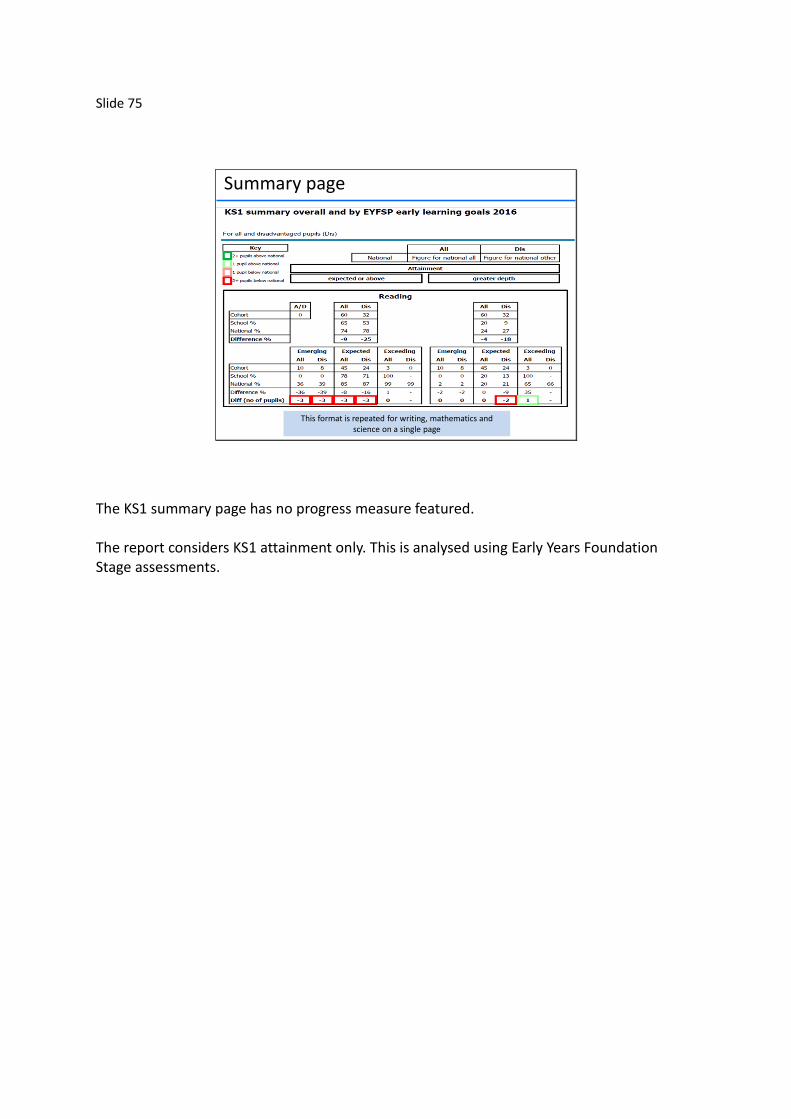
Summary page
This format is repeated for writing, mathematics and science on a single page
The KS1 summary page has no progress measure featured. The report considers KS1 attainment only. This is analysed using Early Years Foundation Stage assessments.
Slide 76
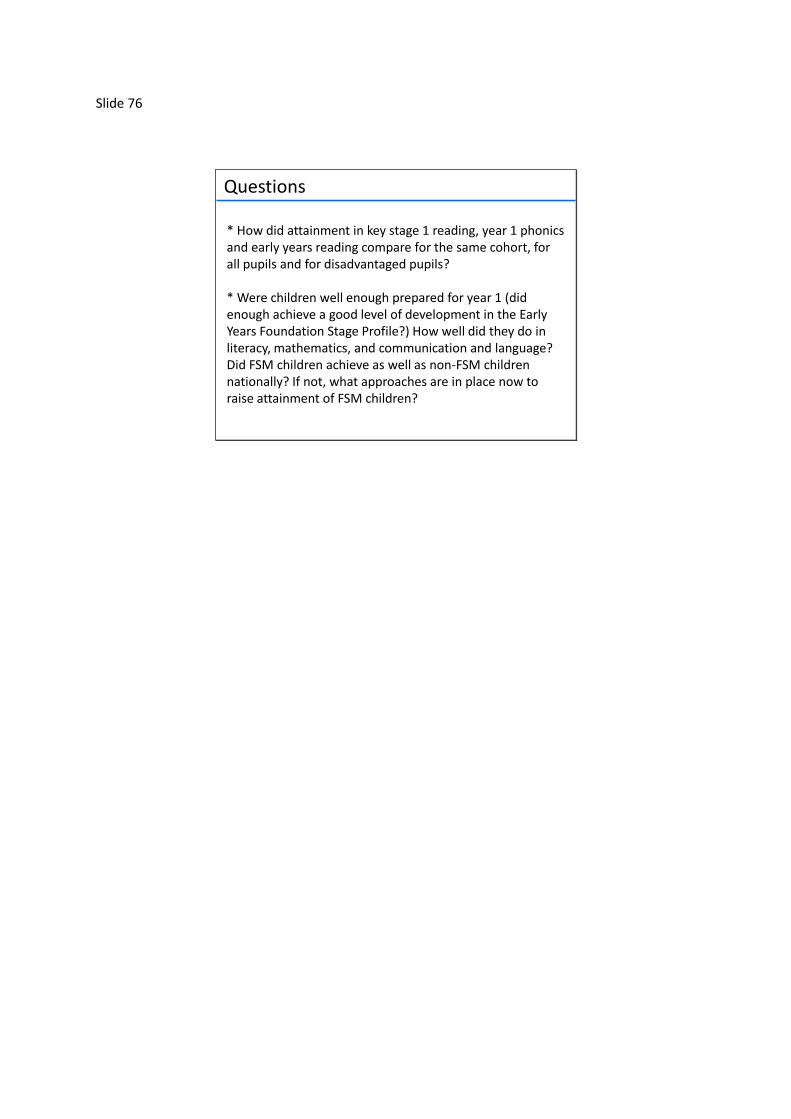
* How did attainment in key stage 1 reading, year 1 phonics and early years reading compare for the same cohort, for all pupils and for disadvantaged pupils?
* Were children well enough prepared for year 1 (did enough achieve a good level of development in the Early Years Foundation Stage Profile?) How well did they do in literacy, mathematics, and communication and language? Did FSM children achieve as well as non-FSM children nationally? If not, what approaches are in place now to raise attainment of FSM children?
Questions
Slide 77
Phonics
The data is illustrative
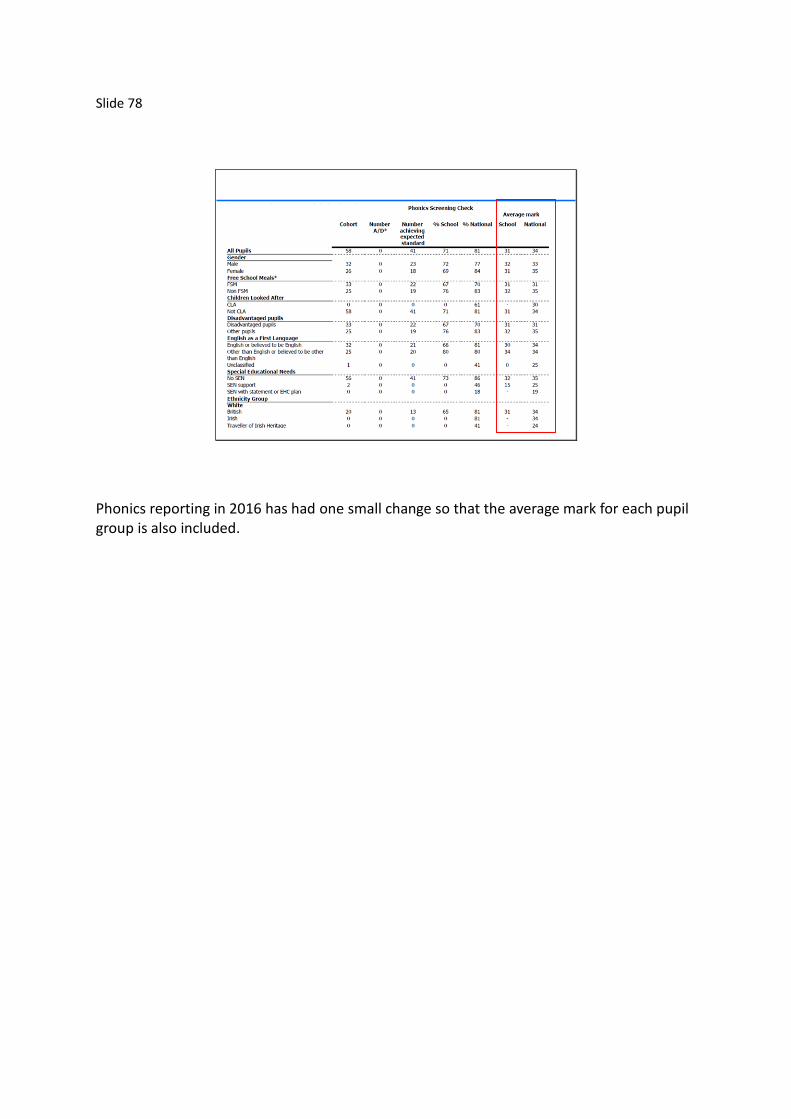
Slide 78
Phonics reporting in 2016 has had one small change so that the average mark for each pupil group is also included.

Slide 79
• Was the percentage of year 1/year 2 pupils achieving the expected standard in phonics above the national figure? Was it rising? How did the attainment of disadvantaged pupils compare with the national figure for other pupils? How did attainment vary between groups of pupils?
• How did the phonics marks in year 2 compare with those in year 1 for pupils who did not meet the expected standard in year 1? What strategies are now in place to help such pupils?
Phonics questions
Slide 80
• The final pages of a RAISEonline summary report include the context pages previously featured at the front of a summary report
• There have been no substantial changes to the nature of these reports in 2016
Context
Slide 81
• In addition to the RAISEonline summary report a shorter inspection dashboard is also available
• The inspection dashboard uses the same data as RAISEonline but presents this in a more compact form
• The inspection dashboard is intended to inform short inspections only
• Where additional detail is needed the RAISEonlinesummary report includes this and is to be used alongside the inspection dashboard
Inspection dashboard
Governors understanding of the RAISEonline summary will provide them with the understanding needed to approach the inspection dashboard and contains more detailed information. Some users prefer the visual style of the dashboard will need to understand the new concepts being used in 2016. Further guidance about the dashboard can be found in the RAISEonline library.

Slide 82
Future of RAISEonline
• The commercial arrangement to continue the service expires on 31st March 2017
• A project to secure a future replacement has begun
• We anticipate that: The DfE will build a new core service that provides schools with access
to headline measures and key underlying pupil level data;
Whilst also supporting the market’s delivery of additional services that schools can procure if they choose to, through provision of privileged early access to data.


