Embed Size (px)
Citation preview

A report from May 2017
Rainy Day Funds and State Credit RatingsHow well-designed policies and timely use can protect against downgrades

Contents
1 Overview
2 Why ratings matter
7 Clearly designate goals and objectives for rainy day funds
8 Bring the rainy day fund in line with the economy
13 Comply with rainy day fund policies
13 Determine how much to save
14 Withdraw reserves, when necessary, during downturns
16 Prioritize building reserves during economic expansion
17 Conclusion
18 Appendix: MethodologyRainy day fund identification 18Examining Moody’s credit action reports 18Assessing use’s effect on ratings 18
26 Endnotes

The Pew Charitable TrustsSusan K. Urahn, executive vice president
Project teamStephen Bailey Stephen Fehr Kil Huh Akshay Iyengar Airlie Loiaconi Jonathan Moody Patrick Murray Robert Zahradnik Alexandria Zhang
External reviewersThis report benefited from the insights and expertise of Gary Wagner, vice president and senior regional officer with the Federal Reserve Bank of Cleveland, and Matt Fabian, partner at Municipal Market Analytics. Although they reviewed the report, neither reviewer nor their organizations necessarily endorse its findings or conclusions.
AcknowledgmentsWe would like to thank the following colleagues for their assistance and guidance in the research process: Kimberly Furdell, Diane Morris, Brenna Erford, Ethan Pollack, and Alan van der Hilst. We also thank Kat Allarde, Catherine An, Maria Borden, Kimberly Burge, Steve Howard, Bronwen Latimer, Howard Lavine, Dan LeDuc, Bernard Ohanian, Lisa Plotkin, Jeremy Ratner, Anne Usher, and Liz Visser for their valuable editing and production assistance on this report. Finally, we thank the many state officials and other experts who were so generous with their time, knowledge, and expertise.
Contact: Catherine An, communications officer Email: [email protected] Project website: pewtrusts.org/fiscal-health
The Pew Charitable Trusts is driven by the power of knowledge to solve today’s most challenging problems. Pew applies a rigorous, analytical approach to improve public policy, inform the public, and invigorate civic life.

1
OverviewAfter Massachusetts lawmakers drew down the state’s budget stabilization fund in fiscal years 2013 through 2015 to cover higher spending, Standard & Poor’s (S&P) took action. The nation’s oldest credit rating agency announced in November 2015 that it had revised its outlook on the state’s finances from stable to negative and warned that it might also lower the state’s debt rating unless lawmakers replenished Massachusetts’ rainy day fund.
Governor Charlie Baker responded by asking lawmakers to approve a deposit of more than $200 million into the budget stabilization fund in the fiscal year that began July 1, 2016. In a statement, he said this action would “ensure we are saving money in good economic times to protect us from future economic downturns.” In a subsequent interview with The Pew Charitable Trusts, the governor said he thought the payment would alleviate S&P’s worry. “Their concern was that we weren’t going to make a deposit,” he said.
The step Gov. Baker took to placate Wall Street was not unique. States generally react to the warnings of S&P and similar agencies in order to protect or enhance their ratings. The higher a state’s credit rating, the lower the cost to repay bonds the state sells to investors to finance construction and renovation of roads, schools, airports, prisons, parks, water projects, and other infrastructure.
Yet research by Pew has found that even in states with the agencies’ highest rating (triple-A), policymakers often are unsure about how best to manage their rainy day funds to earn or keep high credit ratings. As a result, some state officials are reluctant to tap reserves even during recessions for fear of a ratings downgrade.
To offer policymakers advice and insight into the relationship between budget reserves and credit ratings decisions, Pew studied documents and data on state ratings from the three major rating agencies—S&P Global Ratings, Moody’s Investors Service, and Fitch Ratings—and interviewed policymakers, rating agency analysts, and others. The study is part of Pew’s ongoing look at how states are managing their finances since the Great Recession of 2007-09. In previous reports, beginning with Managing Uncertainty: How State Budgeting Can Smooth Revenue Volatility, Pew has offered recommendations on how policymakers can strengthen their state’s financial stability, including prudent design of rainy day funds.
While rainy day funds are one of several factors that inform ratings decisions, they are especially important because of the increasing volatility in state revenue. “Everyone has seen the same trend: Tax revenues have become increasingly volatile in the last one to two decades, and the cushion provided by rainy day funds helps offset that budget position,” said Gabriel Petek, a managing director in S&P’s public finance division, in an April 2016 interview with Pew.
Pew examined changes in credit ratings and the use of reserves in the 47 states that Pew classified as having a rainy day fund (all but Colorado, Illinois, and Montana). The research found that:
• Credit rating agency analysts pay attention to how states structure their reserves, whether policymakers are disciplined about controlling deposits and withdrawals, and how officials integrate rainy day fund policy with spending and revenue decisions. In an April 2016 interview with Pew, Laura Porter, who heads Fitch’s state and local ratings group, said, “Reserves are a starting place to think about overall financial management.”
• The rating agencies typically favor states that design their rainy day funds to align with the turns in the economic cycle, by depositing revenue into the fund during upturns and spending those reserves during downturns as one way to help cover budget shortfalls. Further, they tend to prefer states that consistently follow their own established rainy day fund policies.

2
• States that make withdrawals from reserves during recessions, or when an event such as a natural disaster lowers revenue, will not necessarily jeopardize their credit ratings as long as other budgetary actions meant to address the decline in revenue are also taken, according to Pew’s analysis of rainy day fund use and state general obligation bond ratings.
With that in mind, Pew recommends that state policymakers:
1. Design rainy day funds with clear, objective goals that policymakers can refer to regardless of changes in governors, legislatures, and business cycles.
2. Structure rainy day funds to be in line with the economy, so that deposits, withdrawals, and savings targets are informed by the state’s revenue volatility and the business cycle.
3. Base the decision to tap rainy day funds on the state’s fiscal situation, withdrawing money as appropriate during budget crises but resuming deposits when economic and fiscal conditions improve.
Why ratings matterAt any one time, only 10 or so states have carried a triple-A rating, indicative of a high level of confidence that these states will honor their debts.
“AAA is the best you can get, and here in Utah we won’t settle for anything less,” Governor Gary Herbert said in his January 2016 State of the State address. He later added in an interview with Pew, “It may not mean much to the average citizen, but it does have an impact on their wallet.” The higher a state’s credit rating, the lower the cost to repay its bonds. For investors, meanwhile, high ratings signal that the state can and will meet its financial obligations to pay both interest and principal.
California provides an excellent example of how higher ratings can benefit a state. On Feb. 25, 2015, Fitch Ratings upgraded the state’s credit rating from A to A+, explaining the upgrade as a result of “the institutional improvements made by the state in recent years, its disciplined approach to achieving and maintaining structural balance in recent budgets, and the consequent fiscal progress made to date by the state as it recovers from the severe budgetary and cash flow crisis of 2008-2009.”1 Two days later, California State Treasurer John Chiang announced the sale of $1.9 billion in general obligation bonds.2 As part of the issuance, the state refinanced $1 billion in previously issued bonds at a lower interest rate to take advantage of the upgraded rating, which was expected to save taxpayers almost $200 million in debt service costs over the life of the bonds.3
Comparing similar bond issuances before and after California’s ratings upgrade, Pew’s analysis found reductions in the initial offering yields, or the estimated cost for the state to borrow.4 For a 10-year bond, borrowing costs were reduced by 4 percent. Similarly, for a 15-year bond, the costs were reduced by 2 percent.5 While these reduced borrowing costs are the result of many factors, California’s improved credit rating is a major contributor to the state’s savings.
3
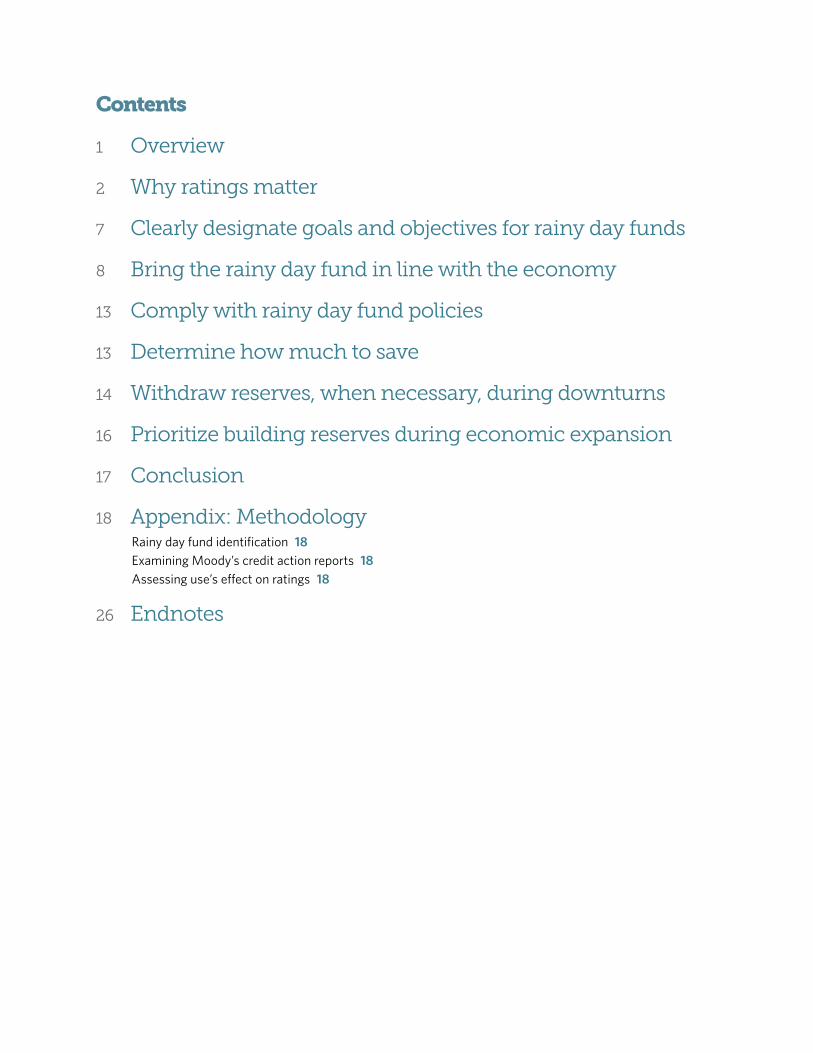
How Agencies Assign Ratings
The rating system’s origins date back to the 1860s, when the U.S. railroad system was rapidly developing. Henry Varnum Poor, a financial analyst and railroad enthusiast from Maine, compiled and released two publications describing the history, operations, and finances of the railroad system. Investors and business managers came to rely on “Poor’s Manual” to help decide where to put their money. Out of this grew the firm Standard & Poor’s, which issued its first ratings on corporate bonds and sovereign debt in 1916.6
In a manner similar to how Poor evaluated railroads, today’s public finance specialists at S&P, Moody’s, Fitch Ratings, and other ratings agencies provide an independent analysis of the credit risk of state and local government. In this way, the agencies tell investors the chances of a default on government-issued debt. Although each agency assigns ratings a little differently, all have lettered categories with notches or degrees.7 Moody’s highest rating is Aaa, while S&P’s and Fitch’s is AAA. Moody’s modifies its letters with the numbers 1, 2, and 3, while S&P and Fitch use plus and minus signs. The S&P and Fitch ratings for states drop as low as a BBB−, equivalent to Baa3 in Moody’s case. As of January 2017, Illinois was the lowest-rated state, holding a Baa2 rating from Moody’s, BBB from S&P, and BBB+ from Fitch. See Table 1 for more information on how the different ratings scales compare.
The ratings are based on both quantitative and qualitative factors. To evaluate a state’s credit, the agencies assess its performance using a variety of core criteria, such as its ability to operate across the business cycle, trends in the state’s economy, and its government’s financial performance, management, debt load, long-term costs, and political structure. States deemed able to meet their debt obligations during periods of recession or fiscal stress, or able to adapt quickly to such conditions, are typically granted the highest ratings. Conversely, states that receive lower ratings usually operate with less structurally sound budgets, exhibit less diversified economies that rely on volatile revenue, and/or experience periods of political delay or gridlock.
State-issued bonds are generally rated higher than other market segments, such as corporations and financial institutions, which do not have the flexibility to stabilize their finances during recessions and, unlike states, are at a much higher risk of defaulting on debt.
Rainy day funds and states’ broader reserves play a prominent role in the credit agencies’ evaluations. Pew researchers examined 149 credit rating action reports between 1992 and 2015 in which Moody’s changed a state’s rating up or down. Eighty-one percent mentioned reserves generally, and 42 percent specifically noted the condition of the state’s rainy day fund and cited it by name.
Continued on next page

4
Class Moody’s S&P Global Fitch
Prime Aaa AAA AAA
High investment grade
Aa1 AA+ AA+
Aa2 AA AA
Aa3 AA- AA-
Upper medium grade
A1 A+ A+
A2 A A
A3 A- A-
Lower medium grade
Baa1 BBB+ BBB+
Baa2 BBB BBB
Baa3 BBB- BBB-
Table 1
The ‘Big 3’ Rating Agencies Use Similar Scales to Assess CreditworthinessStates are considered investment grade by default with a minimum Baa or BBB rating
Note: The rating agencies have noted that they typically will not rate states below Baa or BBB due to their legal ability to raise revenue in response to added fiscal pressures or an increased need to meet obligations. Lower ratings are designated as speculative and are indicative of higher levels of risk for investors.
Source: Moody’s Investors Service, S&P Global, and Fitch Ratings.
© 2017 The Pew Charitable Trusts
5
Maryland guards its triple-A rating so fervently that state leaders rarely pull money out of budget reserves even when such withdrawals make sense to plug temporary budget gaps. The purpose of the state’s rainy day fund, the Revenue Stabilization Account, is “to retain state revenues for future needs and reduce the need for future tax increases by moderating revenue growth.”8 Confronted with multimillion dollar budget deficits during the 2007-09 recession and afterward, then-Governor Martin O’Malley raised a series of income and gasoline taxes and fees, and cut $9.1 billion in spending, the most in the state’s history. Yet at the same time, Maryland only withdrew a net $840 million from its rainy day fund, leaving a balance of almost $700 million still in savings by the end of fiscal 2009.9
“We never use ours, and that’s one of the reasons we have a triple-A rating in good economic times and bad,” said Barbara Hoffman, a former state senator from Baltimore. William Ratchford, former director of the Maryland General Assembly’s fiscal services department, said that to most legislators, the purpose of the rainy day fund is to maintain the triple-A rating. “If we have future needs, we’ll deal with that. But it’s never been, ‘Well we can always use the rainy day fund.’ It just isn’t how they approach it,” he said.
Maryland’s conservative attitude, which is similar to the philosophy of other top-rated triple-A states, suggests that many state officials do not have a clear understanding of when and how they can spend their reserves. According to the credit rating agency specialists that Pew interviewed, withdrawals from reserves are unlikely to result in a downgrade as long as they are made in response to broader economic and fiscal conditions, such as an economic downturn that shrinks revenue. In those circumstances, rainy day fund withdrawals can be part of a suite of approaches to cover budget gaps that also include spending cuts, tax increases, or both. In fact, the specialists said, relying only on spending cuts and tax increases to balance budgets, without some contribution from rainy day funds, can impede a state’s growth.
On the other hand, the rating agencies advise policymakers against making arbitrary withdrawals from rainy day funds or using reserves to address a longstanding structural budget gap—the difference between the revenue collected and what is available to cover increasing costs. “Rainy day funds are there to provide a cushion or a partial solution to a downturn,” S&P’s Petek said. “Our focus is more on the consistency of states during the expansionary periods to replenish reserves. So we evaluate rainy day fund usage in a broader context, not in a vacuum, aware of where a state is in the economic cycle.”10 Further, Pew researchers found that making withdrawals from reserves during periods of growth may be viewed as a credit negative by the rating agencies, as displayed in Figure 1.

6
Figure 1
Drawing on Rainy Day Funds During Periods of Growth Can Increase the Chance That a State Will Be DowngradedPew researchers used statistical models to estimate the likelihood that a state’s credit would be downgraded in response to various factors. While the probability of a state being downgraded is low, if the state’s rainy day fund is drawn down when revenue is above its long-term trend, the chances of a downgrade increase—especially as those reserves approach zero.
Fitch
S&P Global
Moody’s
0
2
6
4
8
10
12
14
16
18
0246810RDF ending balance as a % of general fund expenditures
% c
hanc
e of
rece
ivin
g a
cred
it do
wng
rade
Source: Pew analysis of state rainy day fund use and general obligation credit ratings.
© 2017 The Pew Charitable Trusts

7
Clearly designate goals and objectives for rainy day fundsRainy day funds should be designed with distinct, objective goals that policymakers can adhere to regardless of changes in governors, legislatures, and business cycles.
As highlighted in two previous reports, Why States Save: Using Evidence to Inform How Large Rainy Day Funds Should Grow and Building State Rainy Day Funds: Policies to Harness Revenue Volatility, Stabilize Budgets, and Strengthen Reserves, Pew research found that all but three states have rainy day funds but that the funds differ in their purpose, rules, and structure.11 The rating agencies look for states with reliable rainy day fund deposit rules that are legal requirements, not merely informal policies.
S&P and Fitch analysts emphasize that they generally view rule-based deposits—automatic mechanisms that trigger payments into the fund—positively when assessing state issuances of debt.12 Tying rule-based deposits to historical fluctuations in revenue is essential to good reserve policy, according to rating analysts.
Only 15 states have such deposit rules linked to volatility, although there is a growing awareness of their value. Notably, California and Connecticut were two of the latest states to reinforce their rainy day fund policies to include rules for depositing and withdrawing money. Both enacted deposit rules that reduce their reliance on volatile personal income tax revenue, which can vary widely depending on the strength or weakness of the economy. California now requires deposits of 1.5 percent of annual general fund revenue and of capital gains revenue when the amount exceeds 8 percent of general fund revenue.13 Starting in 2019, Connecticut will feature an automatic funding mechanism that is activated when certain revenue sources exceed an average historical growth rate.14 The rating agencies praised both states for their disciplined approach to building reserves that will better insulate them from uncontrollable swings in revenue.
The remaining 13 states tie deposits to overall revenue volatility, a single unpredictable revenue source, or the state’s general economic condition. In 1992, triple-A-rated Virginia adopted a constitutional rule linking rainy day fund deposits to growth in all major taxes, which Moody’s said is “a strong feature of its Aaa rating and will help to prepare it for future downturns.”
While deposit rules ensure that states have set aside reserve funds needed for a downturn, withdrawal rules establish the conditions under which the money can be taken out. California’s precise rules were approved by voters in 2014. To manage budget gaps, California officials may make withdrawals or forego deposits into the fund if spending is at or below the highest level of spending for the past three years, adjusted for population and inflation. To respond to emergencies, officials also can take out money or waive deposits for a natural disaster. These withdrawals are limited to half of the amount in the rainy day fund in the first year of withdrawal.15
Porter, of Fitch, noted that there is no direct correlation between a state’s credit rating and whether policymakers approve deposit and withdrawal rules, except in the broader context of a state convincing the rating agencies that it has ample reserves. According to Fitch’s rating criteria, “Established reserves that benefit from automatic funding mechanisms and clear restrictions on use are the strongest credit features, but fund balances that have been maintained consistently over time also are beneficial.”16

8
Understanding the Cost of State Debt
A number of factors drive the cost of issuing debt for a state. Typically, when a state issues bonds, it offers them at various interest rates and maturities. The interest rates are fixed and determine how much the state will pay out annually to the bondholder. This annual payment is referred to as a coupon. The maturities determine how long the state has to repay the debt, with some bonds repaid in as little as a few months and others ranging from two to 10, 20, or even 30 years in the future. Most importantly, the state will repay the bond’s face value on the date the bond matures.
A state’s credit rating influences not only the interest rate at which states can offer bonds to investors, but other factors as well. Credit ratings give investors an informed opinion about the quality of the state’s debt and how likely the state is to make bond payments in a timely manner. As such, the rating can influence the price of the bond. For instance, if a state has a low credit rating, a $1,000 bond with a 5 percent coupon (the annual payment to the bondholder) might cost an investor only $900 because the poor rating requires the state to discount the price of the bond in order to attract investors. Conversely, if the state’s rating is high, the same bond with a face value of $1,000 might sell for $1,100.17
Bring the rainy day fund in line with the economyRating agencies say that rainy day funds need to be in line with the economy, so that deposits, withdrawals, and savings targets are informed by the state’s revenue volatility and the business cycle. Policymakers should recognize that a strong, growing state economy can be critical to a high credit rating because of the impact on revenue, spending, debt, and overall fiscal health. But a robust job-producing economy does not guarantee a lofty bond rating if state policymakers do not manage their finances well, according to the rating agencies.
Topping S&P’s list of 10 management characteristics of highly rated credits in U.S. public finance is a rainy day fund that is sensitive to how the economic cycle affects revenue.18 Moody’s says triple-A states are distinguished by well-institutionalized fiscal management and governance practices. When recessions, natural disasters, and other shocks threaten these states’ ability to balance budgets, their “superior management” quickly acts to restore financial strength, a response that includes tapping reserves.19 See Table 2 for ratings for all 50 states.
Credit rating analysts from all three agencies agree that well-managed states administer rainy day funds in a way that reinforces structural balance, or a budget that is financially sustainable over several years. This means that policymakers make deposits into reserves during times of economic expansion and revenue growth, while they make withdrawals during times of distress when revenue falls. “We talk about structural balance a lot,” Emily Raimes, vice president and senior credit officer at Moody’s, told Pew.20 “Increasing a structural imbalance can be a reason for a downgrade.” For example, she said, a state would attract negative attention if it was withdrawing money from its rainy day fund during an economic recovery. In its revised rating criteria released in 2016, Fitch emphasized that rating upgrades “would likely result from the more focused consideration of the economy, while downgrades would center around the more integrated consideration of the adequacy of reserve funding.”21

9
In S&P’s annual preview of state budget conditions for the fiscal year beginning July 1, 2016, Petek stressed the link between the economic cycle and reserve funding. “States that have taken advantage of an expanding economy to shore up their budget reserves are more likely to approach the coming fiscal year [2017] on stronger footing,” he said.22
Nevada and Virginia offer lessons for policymakers on the importance of aligning budget reserves with the economic cycle. Nevada policymakers, assuming that the gaming and tourism industry was less vulnerable to swings in the business cycle, did not build up reserves during the early 2000s when revenue was soaring. When the recession hit and many Americans curtailed travel spending, Nevada’s revenue plummeted. So did its rainy day fund balance, which did not offset the deep spending cuts, tax increases, borrowing, and one-time federal stimulus money that the state needed to balance its budget. Moody’s downgraded Nevada’s credit as a result, citing the state’s reduced reserves, declining revenue, and overall weakened finances.
Virginia, on the other hand, faced some of the same economic forces as Nevada but managed to maintain its triple-A rating during the recession. The state’s revenue stabilization fund takes advantage of the turns in the economy by using a deposit formula that incorporates current and historical revenue growth and volatility during the prior six budget years in sales, and individual and corporate income taxes. The state constitution imposes further discipline by limiting withdrawals to cover only half of a budget shortfall in a fiscal year, forcing policymakers to cut spending or consider tax increases.
Energy states dependent on commodity prices experience notoriously fluctuating revenue, which challenges their policymakers to save more cash for economic downturns than states with steadier revenue. At the start of fiscal 2015, Alaska, North Dakota, and Wyoming each held reserve balances equivalent to over 25 percent of general fund revenue, compared with the national average of about 5 percent. In February 2016, S&P revised Wyoming’s credit outlook from stable to negative. This reflects the agency’s expectation that the state’s rating—assuming economic or fiscal conditions and policies remain unchanged—might need to be downgraded because low energy prices will force the state to deplete its reserves. Specifically, S&P warned that current economic conditions could widen Wyoming’s structural budget deficit. “In such an event, we believe the state could, over time, choose to draw down reserves significantly rather than make structural adjustments,” and in doing so, threaten the state’s triple-A rating.23

10
Table 2
Only 12 States Hold the Highest Rating Across All 3 Rating AgenciesIllinois and New Jersey are the lowest rated states
State Moody’s S&P Global Fitch
Alabama Aa1 AA AA+
Alaska Aa2 AA+ AA+
Arizona Aa2 AA* Not Rated
Arkansas Aa1 AA Not Rated
California Aa3 AA- AA-
Colorado Aa1 AA* Not Rated
Connecticut Aa3 AA- AA-
Delaware Aaa AAA AAA
Florida Aa1 AAA AAA
Georgia Aaa AAA AAA
Hawaii Aa1 AA+ AA
Idaho Aa1 AA+* AA+
Illinois Baa2 BBB BBB+
Indiana Aaa AAA* AAA
Iowa Aaa AAA* AAA
Kansas Aa2 AA-* Not Rated
Kentucky Aa2 A+* AA-
Louisiana Aa3 AA AA-
Continued on next page

11
State Moody’s S&P Global Fitch
Maine Aa2 AA AA
Maryland Aaa AAA AAA
Massachusetts Aa1 AA+ AA+
Michigan Aa1 AA- AA
Minnesota Aa1 AA+ AAA
Mississippi Aa2 AA AA
Missouri Aaa AAA AAA
Montana Aa1 AA AA+
Nebraska Aa2 AAA* Not Rated
Nevada Aa2 AA AA+
New Hampshire Aa1 AA AA+
New Jersey A2 A- A
New Mexico Aa1 AA+ Not Rated
New York Aa1 AA+ AA+
North Carolina Aaa AAA AAA
North Dakota Aa1 AA+* Not Rated
Ohio Aa1 AA+ AA+
Oklahoma Aa2 AA+ AA+
Oregon Aa1 AA+ AA+
Pennsylvania Aa3 AA- AA-
Rhode Island Aa2 AA AA
Continued on next page

12
State Moody’s S&P Global Fitch
South Carolina Aaa AA+ AAA
South Dakota Aaa AAA* AAA
Tennessee Aaa AAA AAA
Texas Aaa AAA* AAA
Utah Aaa AAA AAA
Vermont Aaa AA+ AAA
Virginia Aaa AAA AAA
Washington Aa1 AA+ AA+
West Virginia Aa1 AA- AA
Wisconsin Aa2 AA AA
Wyoming Not Rated AAA* Not Rated
Note: All ratings are current as of January 9, 2017 and reflect either their general obligation rating or senior-most tax-backed rating. Blue text reflects the highest rating.
* Indicates the use of an Issuer Credit Rating in place of an evaluation of general obligation debt.
Source: Moody’s, S&P Global, Fitch ratings
© 2017 The Pew Charitable Trusts
Analysts express less worry about Texas’ rainy day funds because state policymakers have more experience with factoring in how the ups and downs of oil prices will affect the state’s revenue. In a recent assessment of how the four most populous states could weather the next recession, Moody’s found Texas better prepared than California, Florida, and New York, in part because Texas’ rainy day fund “provides substantially higher” coverage of a budget shortfall than the other three states—three times’ coverage of a first-year deficit.24 “One thing we’re seeing now is that states that rely on oil revenues, which have a lot of volatility, may want to build up more of a cushion against that volatility,” Raimes, of Moody’s, said.
Few state policymakers reflect on revenue volatility when deciding how much to save in reserves, according to Pew’s research, which also showed that few states mandate a process under which officials analyze revenue and economic performance data to aid in setting funding levels. A more focused emphasis on the state’s economy would include regular study of the fluctuations in tax collections to align with the use of rainy day fund deposits and withdrawals in fat and lean times. Yet only Connecticut, Minnesota, Nebraska, Oregon, and Utah require periodic studies of revenue volatility so that lawmakers can adjust the amount needed in reserves to react to fluctuations in the economy.
13
Comply with rainy day fund policies State leaders can write sensible laws for managing a rainy day fund through the boom and bust cycles of the economy, but they need to consistently follow these laws to avoid negative considerations from the rating agencies. As in the example of Massachusetts, skipping or suspending deposits in lieu of spending on other programs can be viewed as a negative signal about the state’s financial management. California had policies in place for many years that would have allowed it to build up its rainy day fund from general fund revenue, but those policies were frequently suspended. However, in 2014, state policymakers adopted policies to strengthen the fund, which officials have pledged to follow. Petek said S&P generally views states with rainy day fund rules as having more potential for a rating upgrade than states without such policies. But it is crucial, he said, that state legislators “have a demonstrated track record of adhering to their own rules.”25
Annual budget surpluses are not a substitute for rainy day fund deposits, Fitch says, because those extra dollars often are spent on operations or special purposes instead of stashed away into reserves. Moody’s, meanwhile, will rate a state below double-A if officials address revenue volatility by borrowing long-term funds for operations instead of spending down rainy day funds.
Determine how much to saveThe rules controlling the rainy day fund must ensure that it is large enough. “More volatile financial profiles dictate larger financial cushions that will give the state time to react in a downturn,” according to Fitch.26 Moody’s noted that while most states have some type of rainy day fund on the books, some “keep it at such low funding levels that it is of little use to the state should the budget tighten.”27
How the rating agencies view the ideal size of the reserve fund has evolved in recent years, with Fitch and Moody’s allowing policymakers more latitude in determining the right level for their state.28 After revenue volatility developed into a long-term feature of many state tax systems, the credit rating analysts reconsidered their previous guidance about how much states should set aside in reserves. The analysts now advise policymakers to set a level for the rainy day fund tailored to their state’s economy, tax structure, degree of revenue volatility, and financial flexibility. “We think it is a state-by-state decision and situation,” Raimes said. “States that traditionally are more stable and don’t need to draw heavily from reserves probably don’t need a large rainy day fund compared to states with more revenue volatility.”29
While S&P notes that no one level or type of reserve is optimal,30 it and the other agencies do include rainy day fund levels among several factors that go into their rating analysis.31 Petek said S&P combines ending budget balances with rainy day fund levels in determining a state’s flexibility to manage its finances.32 Ending balances—money left in the general fund at the end of the fiscal year—speak to how well a state estimates and manages its revenue and spending assumptions at the beginning of the budget year.
Among the 47 states with rainy day funds, six—Alaska, California, New Mexico, New York, South Carolina, and Vermont—have two funds. This adds to the difficulty of recommending a minimum percentage size for all states. South Carolina, for instance, requires 5 percent of general fund revenue to be set aside in a general reserve fund, and another 2 percent allocated to a capital reserve fund.33 Vermont has two rainy day funds, which by statute have to be maintained at a maximum of 5 percent of the previous year’s appropriations.34
California, with its reliance on capital gains tax revenue, and North Dakota, whose budget growth has been fueled by proceeds from severance taxes, further demonstrate why the inherent revenue differences between states
14
argue against setting a static, 50-state size for a budget reserve. “The level of reserves is related to policy choices and revenue volatility in each state,” said Fitch’s Porter. “It’s not meaningful to come up with a percentage [target] in a vacuum.”35 In contrast to states, where there is no one-size-fits-all recommendation, Fitch does expect local governments to keep a minimum reserve level of 2 percent, reflecting the fact that states have more control—and higher ratings—than cities in managing the ups and downs of their budgets through spending cuts and tax increases.
An example is Louisiana. In 2016, two rating agencies noted that Louisiana’s finances weakened in part because officials cap the rainy day fund at 4 percent of the state’s total revenue from the previous year and limit withdrawals to one-third of the balance over two years.36 Such a low cap and burdensome rules may discourage lawmakers from tapping the fund. Louisiana covered a $940 million budget deficit in fiscal 2016 mostly with spending cuts and one-time remedies, and faced a $750 million gap in fiscal 2017.37 “This level of reserves is substantially less as a percent of budget than most other states dependent on oil and mineral extraction for economic activity and operating revenues,” Moody’s said in February 2016, explaining why it downgraded Louisiana’s debt a notch.
How Minnesota Sets Reserve Size
Policymakers should examine Minnesota’s approach when weighing the savings target for the rainy day fund. Rating agency analysts praise state economists with Minnesota Management and Budget for designing a data-driven method that takes volatility into account in setting the size of its reserve fund. Until the system went into effect in 2014, Minnesota arbitrarily capped its reserve at $653 million. But now, the state’s rainy day fund target is set as a percentage of each two-year budget’s revenue projections and can be adjusted depending on changes in tax collections. To finance the fund, lawmakers built in an automatic funding mechanism and an adjustable target. The target for the 2016-17 budget years is 4.8 percent of biennial general fund revenue, which is an increase from the 2.4 percent that economists believed was needed in the current two-year budget.38 “We draw on the motivation that state rainy day funds are not a one-size-fits-all solution,” said Matt Schoeppner, a Minnesota state economist. “Changing economic conditions and tax policy choices are unique among states.”39
Withdraw reserves, when necessary, during downturnsPolicymakers should base the decision to tap rainy day funds on their state’s financial and economic situation. The rating agencies stress that states can withdraw money as appropriate during economically driven budget crises without receiving a credit negative so long as the withdrawals are among a suite of budgetary actions taken to address the revenue shortfall and the state resumes deposits when economic and fiscal conditions improve.
Historically, analysts say, many states’ ratings and outlooks are lowered during economic downturns, which may discourage some policymakers from using rainy day funds at the very time they need the money the most. Pew’s research found that between 1994 and 2014, during which there were two recessions, the three agencies downgraded 32 states at least one time. Eight states with chronic budget volatility were rated up or down more

15
than four times during the 20-year period: California, Connecticut, Hawaii, Illinois, Louisiana, Maine, Michigan, and New Jersey.
To help clarify the relationship between withdrawals and credit downgrades, Pew researchers examined the deposit and withdrawal activities of 46 states and state general obligation bond ratings from the major credit rating agencies for 1994 through 2014.40 This analysis found a significant relationship between reserve size and whether a state’s credit is downgraded, with higher reserve balances serving as a credit positive.41
Pew research also found that countercyclical usage of rainy day funds—deposits during growth periods and withdrawals during revenue downturns—is a significant credit positive. More importantly, there does not appear to be any net credit impact when reserves are tapped during revenue downturns, because the positive effect of a “properly timed” transfer offsets the credit negative associated with a shrinking reserve balance, as displayed in Figure 2.
Figure 2
Withdrawals From Rainy Day Funds During Revenue Downturns Can Actually Reduce the Probability of a Credit DowngradeAccording to Pew’s models, the odds that a state would receive a credit downgrade are much higher when revenue is below its long-term trends. However, drawing on reserves during these times appears to reduce the chance of a downgrade, as the rainy day fund offsets some of the drop in revenue.
0
1
2
3
4
5
6
0246810
Fitch
S&P Global
Moody’s
RDF ending balance as a % of general fund expenditures
% c
hanc
e of
rece
ivin
g a
cred
it do
wng
rade
Source: Pew analysis of state rainy day fund use and general obligation credit ratings.
© 2017 The Pew Charitable Trusts

16
Georgia provides a good example of a state that has used its reserves countercyclically to maintain a high rating. The state has kept its triple-A rating since 1998 while withdrawing from reserves, slashing spending, and, as a last resort, raising taxes to manage budget shortfalls during downturns. Pew’s research showed that Georgia’s rainy day fund had swelled to $1.7 billion in fiscal 2007, before the Great Recession began taking its toll on state revenue. Officials withdrew almost all of the reserve in fiscal 2008 and 2009, ending fiscal 2010 with $268 million in the fund. Since then, Georgia gradually rebuilt its reserves to $1.6 billion by the end of fiscal 2015, which was the sixth straight year the state added to its rainy day fund.42 While Georgia has proved that a state can achieve or maintain high credit ratings while taking out reserve funds during a downturn, the state could strengthen its rainy day fund further by setting a savings target and making deposits linked to fluctuations in its main tax collections instead of building the fund solely through budget surpluses and general fund appropriations.
Contrast Georgia with triple-A-rated Delaware, one of 11 states that Pew found did not make significant withdrawals from its rainy day fund during the 2007-09 recession.43 In fact, Delaware has never withdrawn money from reserves and has no plans to do so.44 Yet the state was not immune to the revenue crunch of the past two recessions. By fiscal 2010, Delaware’s budget gap had widened to $800 million. Lawmakers closed it with a combination of spending cuts, federal economic stimulus funds, and nearly $200 million in tax hikes— but no money drawn from reserves. Tapping the rainy day fund could have mitigated the depth of the cuts and tax hikes.
Hawaii offers policymakers a dual lesson in how the credit rating agencies reward and rebuke some states for how they manage their rainy day funds. Even though the state built up its reserves before the 2007-09 recession, officials could not count on the rainy day fund alone to balance the state’s tourism-reliant budget. Moody’s downgraded Hawaii’s general obligation debt from Aa1 to Aa2 in 2011, citing in part the state’s drawdown in reserves and one-time deficit-closing solutions such as delaying tax refunds, restructuring debt, and spending its share of nonrecurring federal economic stimulus funds. By the end of fiscal 2011, lawmakers had drained the emergency budget reserve and a second, hurricane relief fund to the point where officials would have been forced to borrow money if there was a sudden need for cash. “Strong reserve levels are important for Hawaii given the state’s heightened vulnerability to national and international shifts in its essential tourism-based economy,” Moody’s analyst Nicole Johnson said in announcing the downgrade. “The currently low reserve levels leave Hawaii with reduced flexibility to address additional shortfalls that may emerge.”45 As tourism—and revenue—improved after the recession, state officials channeled increased amounts of dollars to the reserve funds. As of 2017, Moody’s has upgraded the state’s rating to Aa1 with a stable credit outlook, largely because of the state’s increased reserves. S&P was more effusive in affirming its AA rating on Hawaii general obligation bonds in 2015. “Central to our outlook regarding the state’s very strong credit quality is its financial management and demonstrated commitment to building and maintaining strong reserve levels,” Petek wrote in 2015.46
Prioritize building reserves during economic expansionThe rating agencies recommend that state lawmakers outline the circumstances under which reserves can be drawn down in law. Just as important, as S&P said, are policies and practices that “create a mechanism to rebuild reserves once they are spent.”47 Petek of S&P told Pew: “We look for it to be a fiscal priority to replenish reserves. However that is defined may vary, but you know it when you see it.”
Rating agency specialists told Pew they prefer that policymakers create well-defined deposit rules instead of a mechanism that requires the state to replenish the rainy day fund over a stipulated period of time after

17
withdrawals, because deposit rules are more sensitive to the ups and downs of the economic cycle than are static rainy day fund replenishment provisions. Fixed, unchangeable rules can hamstring states when the economic cycle changes, as Alabama and Michigan show.
In 2016, Alabama lawmakers approved a timetable calling for the state to pay back by 2026 the money it borrowed from its rainy day fund and education trust fund during the 2007-09 recession. While officials have made deposits into the funds in the past few years, such replenishment deadlines do not allow the state the flexibility to adapt to changing economic conditions, such as a downturn that would cause another drop in revenue. In fact, state lawmakers raised taxes and cut spending to plug a budget gap for fiscal 2016 stemming in part from a lingering imbalance between revenue and expenditures.48
Michigan also shows how new circumstances can complicate pledges to rebuild reserves in a specified time period. As its contribution to the so-called grand bargain allowing Detroit to escape bankruptcy, in 2014 the state withdrew $195 million from a reserve fund that officials had been slowly rebuilding after it was depleted during the state’s long economic decline of the 2000s. At the time, Governor Rick Snyder said the state would repay the money it borrowed for Detroit from tobacco settlement revenue over 20 years.49 But then came the Flint water crisis and the near-insolvency of the Detroit school system, which also required drawdowns from the rainy day fund that Gov. Snyder had proposed to repay over 10 years. S&P reacted swiftly, revising its outlook on Michigan debt from positive to stable and charging that state officials had reversed their commitment to significantly accumulate reserves. “Rising costs tied to the Flint water crisis and Detroit Public Schools’ (DPS) distressed financial position will limit the state’s ability to build reserves over the next two fiscal years,” S&P analyst Carol Spain said in March 2016, adding that the state would face uncertain legal costs from Flint-related lawsuits.50 The problem with the 10- and 20-year timetables, analysts said, is that costs from Flint and Detroit—or some other sudden crisis—might rise or another recession in the manufacturing-dependent state could put pressure on revenue and spending. Moreover, a future governor or legislature could change Gov. Snyder’s policy choices and decide to build and spend reserves in a different way during downturns and upcycles.
Conclusion Smart design and management of rainy day funds are central to how the nation’s credit rating agencies view state government fiscal health. To earn and maintain strong ratings, states should establish reserve policies that harness the revenue volatility prevalent in recent years. In times of economic expansion, the agencies will reward states that deposit growing revenue as a cushion against future budget gaps when the economic cycle declines. During downturns, rating agency analysts expect states to tap their rainy day funds in conjunction with spending cuts and tax increases, if necessary, to balance budgets. States that make withdrawals from reserves during recessions, or when an event such as a natural disaster lowers revenue, are unlikely to see their creditworthiness decline as a result.

18
Appendix: MethodologyAs part of this report, Pew conducted several analyses, each aimed at assessing the relationship among states’ rainy day funds, use of those funds, and credit ratings.
Rainy day fund identificationIn an earlier report, Building State Rainy Day Funds, Pew researchers identified and examined the statutory and constitutional guidelines in all 50 states pertaining to the mechanisms for depositing money into budget stabilization funds. States use a number of funds to set aside money for various purposes. To focus on the challenge of managing volatility, Pew narrowed the scope of this report to include only budget stabilization funds, using the definition set forth by Yilin Hou in State Budget Stabilization Funds.51 Hou’s definition identifies three key characteristics of these funds. First, there must be enabling legislation that establishes them. Second, they must operate across fiscal years and over the whole economic cycle (i.e., rather than cash flow funds for use during the fiscal year or legacy funds such as North Dakota’s). Third, they must serve as government-wide reserves for general purposes (i.e., not for Medicaid or education specifically).
To assemble the list of qualifying funds, Pew built upon previous research examining these types of reserves, collecting data from three peer-reviewed academic sources as well as the National Conference of State Legislatures and the Center on Budget and Policy Priorities.52 The researchers cross-referenced these five sources to develop a list of 52 budget stabilization funds across 46 states, then further verified them by identifying their enabling legislation.53 For all valid funds, Pew examined the enabling statute, designated purpose, and scope of the fund.
During the 2016 legislative session, Kansas lawmakers created the Budget Stabilization Fund, making the state the 47th to establish a legally defined rainy day fund. However, Kansas did not have a fund when the research supporting this report was conducted. As such, the state was excluded from these analyses.
Examining Moody’s credit action reportsTo determine how frequently rainy day funds and reserves were cited by one of the major rating agencies as a factor justifying a change in a state’s rating, Pew researchers surveyed Moody’s rating actions and identified every instance in which a state’s general obligation debt rating was upgraded or downgraded from 1994 through 2014. These changes were then traced to the corresponding rating action reports released by Moody’s. The text from these reports was then examined by Pew to locate mentions of “reserves” to indicate the consideration of a state’s broader reserves. The text was subsequently surveyed for references to states’ specific funds using each state’s respective fund name.
This approach yielded a total of 149 credit action reports across the 46 states examined—noting that at the time of this research Colorado, Illinois, Kansas, and Montana did not have a rainy day fund, according to Pew’s criteria.54 Among the 149 reports, 121 (81 percent) refer to states’ reserves or broader savings, while 62 (42 percent) mention states’ rainy day funds by name.
Assessing fund use’s effect on ratingsIn order to characterize the relationship between rainy day funds and credit ratings, Pew researchers conducted an econometric analysis of state general obligation bond ratings, rainy day fund balances and fund use, and other economic factors from 1994 through 2014. A more detailed account of the methodology and findings is available in the technical appendix.

19
Data recording credit ratings were pulled directly from Moody’s, S&P, and Fitch. Figures A.1 through A.6 offer additional detail regarding the frequency of credit rating shifts among the 50 states across each of the three major credit rating agencies.
Rainy day fund balances and use were obtained from each state’s respective treasurer, comptroller, department of revenue, or other appropriate agency charged with monitoring or managing the fund. These data were supplemented with a number of other variables designed to capture some of the economic, demographic, and other additional factors that are incorporated into the credit ratings methodologies. The data capture the credit rating across each of the three major rating agencies, the balance in the rainy day fund, net use for the state rainy day fund, the amount of any general fund ending balances, state outstanding long- and short-term debt obligations, and state population.
Pew used statistical models to estimate the likelihood a state would experience a change in its credit rating, with separate models estimated to assess both upgrades and downgrades for each of the respective credit rating agencies. The results of the models offer strong empirical evidence indicating that 1) higher reserve balances serve as a credit positive, reducing the likelihood of a credit downgrade; and, 2) there is no net credit impact when reserves are tapped during revenue downturns, because the positive effect of a “properly timed” transfer offsets the credit negative associated with a shrinking reserve balance.

20
Figure A.1
Only California, Hawaii, Illinois, Louisiana, and Michigan Saw More Than 5 Credit Rating Actions From Moody’s Between 1994 and 2014On average, states experienced 3 rating actions
0-1 Changes 2-3 Changes 4-5 Changes 5 or More Changes
AZ NM
NDMT
WY
ID
UT
OR
WA
NV
IA
MN
TN
KY
OHPA
IN
MSGA
NC
VAIL
FL
AL
WI
AK
CA
TX
OK
KS
NE
COMO
AR
NY
ME
WV
SDMI
HI
SC
MD
DE
NJ
CT
RI
MA
NH
VT
LA
Note: Values reflect the cumulative count of both upgrades and downgrades observed in annually aggregated data from 1994 through 2014.
Source: Pew analysis of Moody’s ratings
© 2017 The Pew Charitable Trusts

21
Figure A.2
Moody’s Ratings Upgraded States More Frequently Than the Other Rating Agencies From 1994 Through 2014Downgrades were more common following the 2001-02 recession but were not more likely after the Great Recession
0
2
4
6
8
10
12
14
16
18
20
22
24
26
28
30
32
34
1995
1999
2014
2013
2012
2011
2010
*
2009
2008
2007
2006
2005
2004
2003
2002
2001
2000
1996
1998
1997
Upgrades DowngradesFiscal year
Num
ber o
f rat
ing
actio
ns
Note: Rating actions were aggregated at the annual level. States were measured by examining the latest rating in a given fiscal year against the prior year to identify whether the state’s rating had been upgraded, downgraded, or remained stable. This approach obscures multiple rating actions that take place within a single fiscal year, however, it provides a clear view of whether states’ ratings were improving or worsening over time.
* Moody’s recalibrated their public finance ratings in 2010, resulting in a higher number of upgrades than in any other year.
Source: Pew analysis of Moody’s ratings
© 2017 The Pew Charitable Trusts

22
Figure A.3
Only California, Louisiana, and New Jersey Experienced More Than 5 Rating Actions by S&P Global From 1994 Through 2014S&P changes states’ credit outlooks far more frequently than credit ratings
Note: Values reflect the cumulative count of both upgrades and downgrades observed in annually aggregated data from 1994 through 2014.
Source: Pew analysis of S&P Global’s ratings
© 2017 The Pew Charitable Trusts
AZ NM
NDMT
WY
ID
UT
OR
WA
NV
IA
MN
TN
KY
OHPA
IN
LA
MSGA
NC
VAIL
FL
AL
WI
AK
CA
TX
OK
KS
NE
COMO
AR
NY
ME
WV
SDMI
HI
SC
MD
DE
NJ
CT
RI
MA
NH
VT
0-1 Changes 2-3 Changes 4-5 Changes 5 or More Changes
23
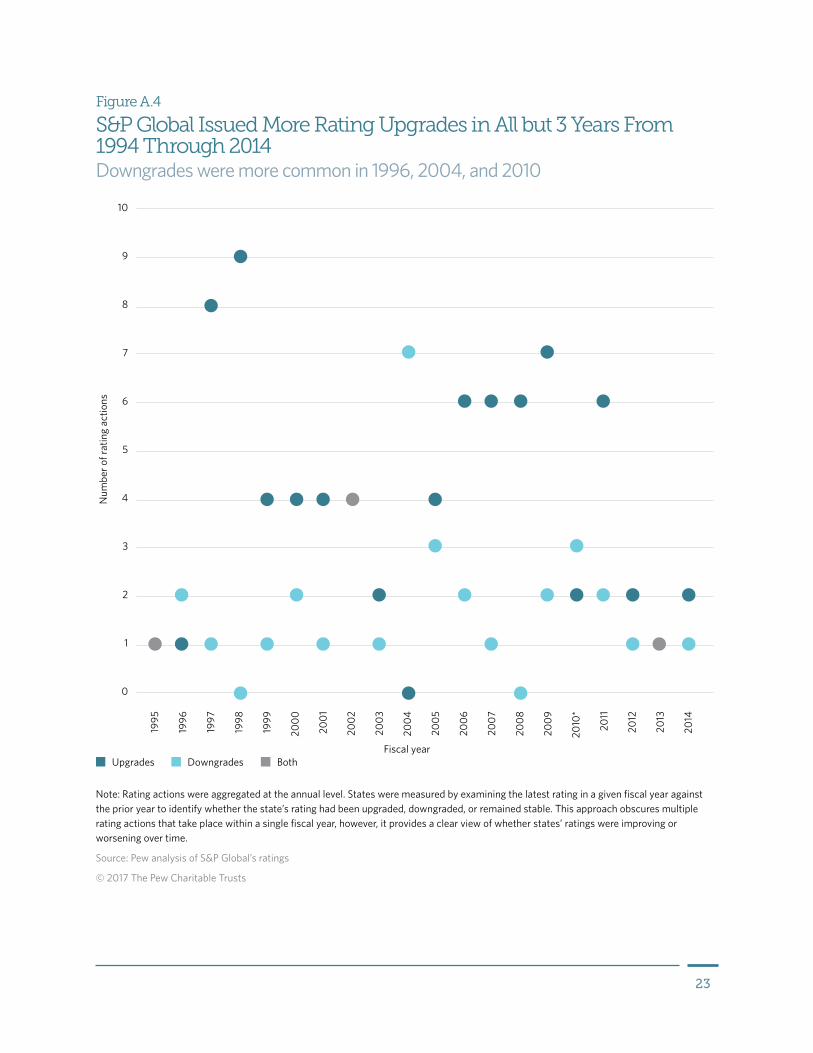
Figure A.4
S&P Global Issued More Rating Upgrades in All but 3 Years From 1994 Through 2014Downgrades were more common in 1996, 2004, and 2010
1995
1999
2011
2012
2013
2014
2010
*
2009
2008
2007
2006
2005
2004
2003
2002
2001
2000
1996
1998
1997
Upgrades Downgrades Both
10
9
8
7
6
5
4
3
2
1
0
Num
ber o
f rat
ing
actio
ns
Fiscal year
Note: Rating actions were aggregated at the annual level. States were measured by examining the latest rating in a given fiscal year against the prior year to identify whether the state’s rating had been upgraded, downgraded, or remained stable. This approach obscures multiple rating actions that take place within a single fiscal year, however, it provides a clear view of whether states’ ratings were improving or worsening over time.
Source: Pew analysis of S&P Global’s ratings
© 2017 The Pew Charitable Trusts

24
Figure A.5
California, Illinois, Louisiana, Michigan, and New Jersey Experienced More Than 5 Rating Actions From Fitch Ratings Between 1994 and 2014Fitch chooses not to rate numerous states that do not issue very much general obligation debt
AZ NM
NDMT
WY
ID
UT
OR
WA
NV
IA
MN
TN
KY
OHPA
IN
LA
MSGA
NC
VAIL
FL
AL
WI
AK
CA
TX
OK
KS
NE
COMO
AR
NY
ME
WV
SDMI
HI
SC
MD
DE
NJ
CT
RI
MA
NH
VT
Not rated 0-1 Changes 2-3 Changes 4-5 Changes 5 or More Changes
Note: Values reflect the cumulative count of both upgrades and downgrades observed in annually aggregated data from 1994 through 2014.
Source: Pew analysis of Fitch’s ratings
© 2017 The Pew Charitable Trusts

25
Figure A.6
Similar to Moody’s and S&P Global, Fitch Upgraded States More Frequently Than It Downgraded Them From 1994 Through 2014Downgrades outpaced upgrades following the 2001-02 recession and at the end of the Great Recession
Upgrades Downgrades Upgrades and downgradesFiscal year
1995
1999
2011
2012
2013
2014
2010
*
2009
2008
2007
2006
2005
2004
2003
2002
2001
2000
1996
1998
1997
30
25
20
15
10
5
0
Num
ber o
f rat
ing
actio
ns
Note: Rating actions were aggregated at the annual level. States were measured by examining the latest rating in a given fiscal year against the prior year to identify whether the state’s rating had been upgraded, downgraded, or remained stable. This approach obscures multiple rating actions that take place within a single fiscal year, however, it provides a clear view of whether states’ ratings were improving or worsening over time.
* Fitch recalibrated its public finance ratings in 2010, resulting in a higher number of upgrades than in any other year.
Source: Pew analysis of Fitch’s ratings
© 2017 The Pew Charitable Trusts

26
Endnotes1 Fitch Ratings, “Fitch Upgrades California GOs to ‘A+’; Outlook Stable,” news release, Feb. 25, 2015, https://www.fitchratings.com/site/
pr/980381.
2 Office of California State Treasurer John Chiang, “Treasurer Chiang Announces Sale of $1.9 Billion in State Bonds,” news release, Feb. 27, 2015, http://www.treasurer.ca.gov/news/releases/2015/20150227.asp.
3 Office of California State Treasurer John Chiang, “Chiang Completes $1.9 Billion Bond Sale With $198 Million in Taxpayer Savings; 30-Year Yield Lowest Since at Least 1989,” news release, March 5, 2015, http://www.treasurer.ca.gov/news/releases/2015/20150305.asp.
4 Because the state treasurer said the savings were due to the refinancing of existing debt, the Pew analysis examined the issuances of various purpose general obligation refunding bonds immediately preceding and following the upgrade. The preceding issuance closed Oct. 7, 2014, and the following issuance concluded March 18, 2015.
5 Initial offering yields were collected through Electronic Municipal Market Access (EMMA). The October 2014 issuance is available at EMMA, “Issue Details,” http://emma.msrb.org/IssueView/IssueDetails.aspx?id=EA353738; the March 2015 issuance is available at EMMA, “Issue Details,” http://emma.msrb.org/IssueView/IssueDetails.aspx?id=ER366201. The comparison examines the initial offering yields available in 2024 and 2025 for the 10-year bonds and 2029 and 2030 for the 15-year bonds. Identical coupon rates are used for both issuances.
6 Standard & Poor’s, “About Credit Ratings” and “What Credit Ratings Are & Are Not,” accessed Dec. 15, 2015.
7 Fitch’s methodology can be found at Fitch Ratings, “Tax-Supported Rating Criteria” (Aug. 14, 2012), http://www.nasra.org/Files/Topical%20Reports/Credit%20Effects/Fitch1208.pdf; Moody’s can be found at Moody’s Investors Service, “US States Rating Methodology” (April 17, 2013), http://www.nasra.org/Files/Topical%20Reports/Credit%20Effects/Moodys_State_Methodology_April_2013.pdf; Standard & Poor’s can be found at Standard & Poor’s, “U.S. State Ratings Methodology” (Jan. 3, 2011), http://www.nasra.org/Files/Topical%20Reports/Credit%20Effects/StateRatingsMethodology.pdf.
8 Maryland State Finance and Procurement Code § 7-311(b) (2015).
9 Maryland Department of Legislative Services, “Revenue Stabilization Account (Rainy Day Fund) Activity” (January 2017), http://dls.state.md.us/data/bud/bud_opebud/bud_opebud_buddat/Revenue-Stabilization-Account---The-Rainy-Day-Fund-for-Internet.pdf. Net withdrawal reflects transfers to the state general fund from the rainy day fund, minus appropriations to the fund for fiscal years 2008 and 2009.
10 Gabriel Petek (a managing director, Standard & Poor’s public finance division), interview with The Pew Charitable Trusts, April 13, 2016.
11 Pew research identified four states without rainy day funds: Colorado, Illinois, Kansas, and Montana. Kansas has since created a rainy day fund during the 2016 legislative session, reducing the number of states without such a fund.
12 These ratings are for general obligation, appropriation-backed, and moral obligation debt. Other categories of debt, such as revenue bonds, are frequently rated independently from the states. General obligation bonds are bonds issued directly by state or local governments that are backed by the issuer’s pledge and its full faith, credit, and taxing power to meet its obligations. Appropriation-backed bonds are those for which the obligation to pay debt service is contingent upon inclusion in the issuer’s adopted budget. Moral obligation bonds are those for which the state’s obligation to honor the pledge is moral rather than legal—future legislatures cannot be legally obligated to appropriate the funds required. Revenue bonds are secured by a specific stream of revenue rather than the general taxing power of a state or municipality.
13 California Office of the Attorney General, “Proposition 2: State Budget. Budget Stabilization Account. Legislative Constitutional Amendment,” Nov. 4, 2014, election, http://vig.cdn.sos.ca.gov/2014/general/pdf/proposition-2-title-summary-analysis.pdf.
14 Robert Zahradnik, “Connecticut Reforms and Strengthens Rainy Day Fund,” The Pew Charitable Trusts (June 30, 2015), http://www.pewtrusts.org/en/research-and-analysis/analysis/2015/06/30/connecticut-reforms-and-strengthens-rainy-day-fund.
15 Moody’s Investors Service, “California (State of) New Issue,” credit opinion, Feb. 23, 2016, https://www.moodys.com/credit-ratings/California-State-of-credit-rating-600023978. For more details on California’s revised rainy day fund policy, see California Office of the Attorney General, “Proposition 2.”
16 Fitch Ratings, “U.S. State Government Tax-Supported Rating Criteria” (April 2016), 10.
17 Once the bonds have been purchased, their purchase price, coupon rate, and maturity can be used to calculate the bond yield, or the total return the investor will gain by purchasing the bond. Higher yields are good for investors, but bad for states, as they indicate a higher cost to repay their bonds and to finance their capital.
18 Robin Prunty, Karl Jacob, and Horacio Aldrete-Sanchez, “Top 10 Management Characteristics of Highly Rated Credits in U.S. Public Finance,” Standard & Poor’s (July 26, 2010), http://www.ncsl.org/Portals/1/documents/fiscal/Top10Management.pdf.

27
19 Moody’s Investors Service, “U.S. States Rating Methodology.”
20 Emily Raimes (vice president and senior credit officer, Moody’s Investors Service), interview with The Pew Charitable Trusts, April 13, 2016.
21 Fitch Ratings, “Fitch Releases Exposure Draft for U.S. State & Local Government Criteria,” news release, Sept. 10, 2015.
22 Standard & Poor’s Ratings Services, “U.S. State Budget Outlooks Heading Into Fiscal 2017 Are All Over the Map” (April 27, 2016), 3.
23 Standard & Poor’s Ratings Services, “Wyoming Outlook Revised to Negative on Expected Operating Reserves Pressure,” news release, Feb. 4, 2016.
24 Moody’s Investors Service, “Fiscal Test of Most Populous States Show Texas Best Prepared for Next Recession, California Least Ready,” news release, April 21, 2016, https://www.moodys.com/research/Moodys-Fiscal-test-of-most-populous-states-show-Texas-best--PR_347649.
25 Petek, interview.
26 Fitch Ratings, “U.S. State Government Tax-Supported Rating Criteria.”
27 Moody’s Investors Service, “U.S. States Rating Methodology.”
28 Before the 2007-09 recession, the credit rating agencies had suggested that state policymakers set reserve levels of 4 percent or more of general fund revenue as a minimum best financial management practice; savings equal to or greater than 8 percent got higher ratings.
29 Raimes, interview.
30 Prunty, Jacob, and Aldrete-Sanchez, “Top 10 Management Characteristics.”
31 For example, states that set aside 8 percent or more of their budget in reserves earn a 1 (strongest) score from Moody’s; reserves at levels from 4 to 8 percent achieve a 2; 1 to 4 percent is a 3 score; those below 1 percent get the weakest scores. Both Standard & Poor’s and Fitch are less specific in their expected reserve levels.
32 This approach of examining reserves and ending balances is similar to that taken by Pew’s research into reserves and balances. The Fiscal 50 indicator on state reserves and balances examines data on rainy day funds and general fund ending balances from the National Association of State Budget Officers to provide a measure of the state’s broader reserves. See The Pew Charitable Trusts, “Fiscal 50: State Trends and Analysis” (Feb. 2, 2017), http://www.pewtrusts.org/en/multimedia/data-visualizations/2014/fiscal-50#.
33 South Carolina Department of Administration, Executive Budget Office, “Frequently Asked Questions,” accessed May 15, 2016, http://www.admin.sc.gov/budget/frequently%20asked%20questions.
34 Vermont Legislative Joint Fiscal Office, “Summary Issue Brief: Use of State Reserve Funds” (Feb. 12, 2010), http://www.leg.state.vt.us/jfo/issue_briefs_and_memos/Summary%20Issue%20Brief%20-%20Use%20of%20State%20Reserve%20Funds.pdf; Standard & Poor’s Ratings Services, “Vermont: General Obligation Bonds” (November 2014), 3.
35 Laura Porter (sector head, U.S. public finance, Fitch Ratings), interview with The Pew Charitable Trusts, April 13, 2016.
36 Marcia Van Wagner, “State of Louisiana Credit Opinion,” Moody’s Investors Service, Feb. 25, 2016.
37 Robin Respaut, “Fitch Downgrades Louisiana State Debt Amid Budget Turmoil,” Reuters, April 5, 2016, http://www.reuters.com/article/louisiana-ratings-fitch-idUSL2N1781KD.
38 Minnesota Management & Budget, “September 2015 Budget Reserve Report” (Sept. 1, 2015), https://www.leg.state.mn.us/docs/2015/mandated/151011.pdf.
39 Matthew Schoeppner (economist, Minnesota Management & Budget), presentation to the Federation of Tax Administrators Revenue Estimating Conference, Sept. 30, 2015.
40 The analysis features the 46 states that, as of 2016, were classified by Pew research as having a rainy day fund. The four states excluded from the analysis are Colorado, Illinois, Kansas, and Montana. Kansas created a rainy day fund during its 2016 legislative session, but this fund post-dates the analysis.
41 Pew’s analysis featured separate econometric models examining the probability of a state receiving a credit upgrade or downgrade across each of the three major rating agencies. Rainy day fund balances were found to have a statistically significant impact on the likelihood of a downgrade—higher balances reduce that risk.
42 State of Georgia, Comprehensive Annual Financial Report: Fiscal Year Ended June 30, 2015, 19, https://sao.georgia.gov/sites/sao.georgia.gov/files/related_files/site_page/FY15%20CAFR%20Manuscript%20FINAL.pdf.
43 A significant withdrawal represents at least 10 percent of the existing rainy day fund balance.

28
44 Moody’s Investors Service, “Moody’s Assigns Aaa Rating to Delaware’s $255 Million General Obligation Bonds,” issuer comment, Oct. 8, 2010, https://www.moodys.com/research/MOODYS-ASSIGNS-Aaa-RATING-TO-DELAWARES-255-MILLION-GENERAL-OBLIGATION-New-Issue--NIR_16661444.
45 Moody’s Investors Service, “Key Drivers of Hawaii’s Downgrade to Aa2,” issuer comment, May 17, 2011, https://www.moodys.com/credit-ratings/Hawaii-State-of-credit-rating-600024358.
46 Gabe Petek, “Hawaii’s $747 Million GO Bonds Rated AA,” Standard & Poor’s, issuer comment and rating outlook, Oct. 8, 2015.
47 Prunty, Jacob, and Aldrete-Sanchez, “Top 10 Management Characteristics.”
48 Anne Cosgrove, “State of Alabama Credit Opinion,” Moody’s Investors Service, Feb. 19, 2016.
49 State of Michigan, Comprehensive Annual Financial Report: Fiscal Year Ended Sept. 30, 2014, 8, https://www.michigan.gov/documents/budget/CAFR_FY_2014_478784_7.pdf.
50 Standard & Poor’s Ratings Services, “Michigan Outlook Revised to Stable From Positive on Weakened Reserve-Building Capacity,” outlook (March 17, 2016), https://www.globalcreditportal.com/ratingsdirect/renderArticle.do?articleId=1599284&SctArtId=382191&from=CM&nsl_code=LIME&sourceObjectId=9567138&sourceRevId=1&fee_ind=N&exp_date=20260406-23:37:49.
51 Yilin Hou, State Government Budget Stabilization: Policy, Tools, and Impacts (Studies in Public Choice Series), (New York: Springer Science + Business Media, 2013).
52 Yilin Hou, State Government Budget Stabilization; Shanna Rose and Daniel L. Smith, “Budget Slack, Institutions, and Transparency,” Public Administration Review 72, no. 2 (2011): 187–95; Gary M. Wagner and Erick M. Elder, “The Role of Budget Stabilization Funds in Smoothing Government Expenditures Over the Business Cycle,” Public Finance Review 33, no. 4 (July 2005); Daniel G. Thatcher, “State Budget Stabilization Funds,” National Conference of State Legislatures (Sept. 26, 2008), http://www.ncsl.org/research/fiscal-policy/state-budgetstabilization-funds-spring-2008.aspx; and Elizabeth McNichol and Kwame Boadi, “Why and How States Should Strengthen Their Rainy Day Funds,” Center on Budget and Policy Priorities (Feb. 3, 2011), http://www.cbpp.org/sites/default/files/atoms/files/2-3-11sfp.pdf.
53 The analysis features the 46 states that, as of 2016, were classified by Pew research as having a rainy day fund. The four states excluded from the analysis are Colorado, Illinois, Kansas, and Montana. Kansas created a rainy day fund during its 2016 legislative session, but this fund post-dates the analysis.
54 Ibid.


pewtrusts.org Philadelphia Washington

A report from May 2017
Rainy Day Funds and State Credit RatingsTechnical Appendix
Previous scholarship on this topic has centered on examining how various rainy day fund (RDF) designs affect credit ratings. These studies have not featured any analysis of reserve balances or focused on the specific effects that deposits and withdrawals from reserves have on ratings. In light of these limitations, Pew researchers set out to test the following hypotheses:
• Rainy day fund balances are a reflection of a state’s fiscal flexibility during recessions. As such, they have a significant impact on a state’s credit rating.
• The relationship between RDF balances and creditworthiness should be positive. Higher RDF balances indicate a greater availability of resources to supplement revenue during cyclical downturns, which each of the major rating agencies has identified as a credit positive.
• How states use their reserve funds should also be a significant predictor for determining whether state ratings will be upgraded or downgraded.
• The rating agencies consider RDFs as tools for states to help smooth the economic or revenue cycle. As a result, the agencies expect that rainy day funds should be used in a countercyclical fashion: deposits when revenue is above normal and withdrawals when it is below. This means that countercyclical use should have a positive relationship with credit ratings, while procyclical use will have a negative one.
DataTo evaluate these hypotheses, researchers constructed a unique dataset that recorded state credit ratings across all three major rating agencies (Moody’s Investors Service, S&P Global Inc. and Fitch Ratings); broader measures of state economic performance, provided by the Bureau of Economic Analysis and the Philadelphia Federal Reserve Bank; state general fund revenue and expenditure data, drawn from the National Association of State Budget Officers’ Fiscal Survey of the States; and accounting of rainy day fund deposits and withdrawals, as reported by state officials. These data were combined to produce a dataset recording credit ratings and rainy day fund use across 46 states from fiscal year 1994 through 2014.
Note that some tables and figures in the report provide data through 2016 and 2017. However, all statistical models were limited through fiscal 2014, as RDF use data for later years were not available.
State credit ratingsData recording each state’s respective credit ratings were collected from the major rating agencies through their websites and published credit history reports. State general obligation (GO) bonds represent the highest level of appropriations-backed debt that a state can issue, suggesting that these evaluations would provide the clearest representation for a state’s general creditworthiness. As such, state GO ratings were designated to serve as

2
the primary issuance of interest. For states that do not issue GO debt, researchers examined the “senior-most tax-backed” issuance or Issuer Credit Rating offered by the agencies. Each state’s ratings were examined using their respective fiscal calendars, with a “final rating” identified as the last rating a state held in a given fiscal year. These final ratings were used to comprise the annual data recording credit ratings.
It is well established that credit ratings do not shift at the annual level, instead moving at a lower level of temporal aggregation. As a result, one could argue that the decision to aggregate ratings to the annual level obscures some of the movement in ratings, as it is possible for states to experience a downgrade and then an upgrade to their prior position within a single fiscal year—a pair of rating actions that would not appear in the annually aggregated ratings. However, the decision to aggregate the ratings to the annual level is justifiable. First, the majority of states’ credit ratings are stable over time. As denoted in Table 2 below, states averaged roughly three rating shifts from 1994 through 2014 (S&P, 2.5; Moody’s, 3.1; Fitch, 3.2). Moreover, it is uncommon for a state’s full credit rating, unlike its outlook, to be upgraded and downgraded in a single year. In most cases when multiple actions take place in a single fiscal year, they are in the same direction—two upgrades or two downgrades—as a state’s fiscal condition improves or declines. Further, most states have relatively few rating changes (Table 2), with even fewer states experiencing multiple rating actions within a single fiscal year. Second, as a practical matter, this level of aggregation is necessary as state fiscal, economic, and RDF data are recorded annually.
Note that Table 1 below offers states’ ratings through 2014 but that Table 2 presented in the report displays ratings through January 2017. This discrepancy is because statistical analyses were limited to fiscal 2014 due to limited availability of RDF deposit and withdrawal data. Colorado, Illinois, Kansas, and Montana are excluded from all analyses for not having a rainy day fund as of 2014, according to Pew’s criteria.
State Moody’s S&P Global Fitch
Alabama Aa1 AA AA+
Alaska Aaa AAA AAA
Arizona Aa3 AA−† Not rated
Arkansas Aa1 AA Not rated
California Aa3 A A
Colorado Aa3 AA AA
Connecticut Aaa AAA AAA
Delaware Aa1 AAA AAA
Table 1
State General Obligation Credit Ratings, 2014
Continued on next page

State Moody’s S&P Global Fitch
Florida Aaa AAA AAA
Georgia Aa2 AA AA
Hawaii Aa1 AA+† AA+
Idaho Aaa AAA† AAA
Illinois Aaa AAA† AAA
Indiana Aa2 AA−† A+
Iowa Aa2 AA AA
Kansas Aa2 AA AA
Kentucky Aaa AAA AAA
Louisiana Aa1 AA+ AA+
Maine Aa2 AA− AA
Maryland Aa1 AA+ AA+
Massachusetts Aa2 AA AA+
Michigan Aaa AAA AAA
Minnesota Aa2* AA† Not rated
Mississippi Aa2 AA AA+
Missouri Aa1 AA AA+
Montana A1 A+ A+
Nebraska Aaa AA+ Not Rated
Nevada Aa2 AA AA+
New Hampshire Aa1 AA AA+
New Jersey A1 A+ A+
Continued on next page

4
State Moody’s S&P Global Fitch
New Mexico Aaa AA+ Not rated
New York Aa2 AA AA
North Carolina Aaa AAA AAA
North Dakota Aa1 AAA† Not rated
Ohio Aa1 AA+ AA+
Oklahoma Aa2 AA+ AA+
Oregon Aa1 AA+ AA+
Pennsylvania Aa2 AA AA
Rhode Island Aa2 AA AA
South Carolina Aaa AA+ AA+
South Dakota Aa2* AA+† AA+
Tennessee Aaa AA+ AAA
Texas Aaa AAA AAA
Utah Aaa AAA AAA
Vermont Aaa AA+ AAA
Virginia Aaa AAA AAA
Washington Aa1 AA+ AA+
West Virginia Aa1 AA AA+
Wisconsin Aa2 AA AA
Wyoming Not rated AAA† Not rated
Note: All ratings are through fiscal year 2014.
* Indicates that the state does not issue general obligation debt and that the rating reflects the “senior-most tax-backed rating.”
† Indicates the use of an Issuer Credit Rating in place of an evaluation of general obligation debt.
Source: Moody’s, S&P Global, Fitch ratings
© 2017 The Pew Charitable Trusts

5
To operationalize these ratings, they were converted into an ordinal scale with zero representing the lowest rating observed and a maximum value of eight representing an Aaa or AAA rating. As each of the rating agencies employs a similar rating scale, this scaling is effective and can be applied with little adjustment. It should be noted that these scales are not meant to allow for comparability across rating agencies; rather, they allow for a numerical representation of the ratings and the rating shifts.
Each shift in the rating, up or down, is reflected by a single point increase or decrease. For example, Hawaii was downgraded by both Moody’s (from Aa1 to Aa2) and Fitch (AA+ to AA) in fiscal 2011 as a result of fiscal issues that produced negative balances according to generally accepted accounting principles. This downgrade is reflected as Moody’s shifting from a 7 to a 6 and Fitch moving from a 6 to a 5.
State Moody’s S&P Global Fitch
Upgrades Downgrades Upgrades Downgrades Upgrades Downgrades
Alabama 0 0 2 1 1 0
Alaska 3 0 2 0 2 0
Arizona 2 1 2 1 0 0
Arkansas 0 0 2 1 0 0
California 5 6 4 5 6 4
Colorado --- --- --- --- --- ---
Connecticut 1 0 2 3 0 1
Delaware 1 0 2 0 1 0
Florida 2 0 1 0 2 0
Georgia 1 0 0 0 0 0
Hawaii 2 1 3 3 3 1
Idaho 2 0 3 0 4 0
Table 2
Movement in States’ Credit Ratings, 1994-2014
Continued on next page

6
State Moody’s S&P Global Fitch
Upgrades Downgrades Upgrades Downgrades Upgrades Downgrades
Illinois --- --- --- --- --- ---
Indiana 3 1 2 0 4 0
Iowa 2 0 2 0 3 0
Kansas --- --- --- --- --- ---
Kentucky 1 1 2 1 1 1
Louisiana 6 2 5 1 4 1
Maine 1 2 2 2 3 2
Maryland 0 0 0 0 0 0
Massachusetts 3 0 3 1 3 0
Michigan 2 3 4 3 4 3
Minnesota 1 1 1 1 0 1
Mississippi 1 0 1 1 2 0
Missouri 0 0 0 0 0 0
Montana --- --- --- --- --- ---
Nebraska 2 0 0 0 0 0
Nevada 1 1 2 2 2 0
New Hampshire 1 1 1 0 2 1
New Jersey 1 4 1 4 1 4
New Mexico 0 0 2 0 0 0
New York 3 0 3 1 2 1
North Carolina 0 0 1 1 0 0
Continued on next page

7
State Moody’s S&P Global Fitch
Upgrades Downgrades Upgrades Downgrades Upgrades Downgrades
North Dakota 4 0 3 0 0 0
Ohio 1 0 2 1 2 1
Oklahoma 1 0 1 1 1 0
Oregon 3 1 2 1 3 1
Pennsylvania 1 0 3 1 2 1
Rhode Island 1 0 2 0 2 1
South Carolina 1 1 0 0 0 0
South Dakota 2 0 0 0 4 0
Tennessee 2 2 2 2 2 1
Texas 2 0 2 0 1 0
Utah 0 0 0 0 0 0
Vermont 2 0 2 0 2 0
Virginia 2 0 0 0 0 0
Washington 2 1 1 0 2 1
West Virginia 2 0 3 0 4 0
Wisconsin 1 1 1 1 2 2
Wyoming 3 0 0 0 0 0
Note: Values reflect the counts of credit upgrades and credit downgrades observed in annually aggregated data from 1994 through 2014. Colorado, Illinois, Kansas, and Montana are excluded from this analysis for not having a rainy day fund as of 2014, according to Pew’s criteria.
Source: Pew analysis of general obligation credit ratings from Moody’s Investors Service, S&P Global, and Fitch Ratings.
© 2017 The Pew Charitable Trusts
8
State RDFs and their useTo measure states’ use of their reserve funds, Pew collected data from 46 states to obtain a detailed accounting of deposits, withdrawals, interest accruals, and balances for the 52 rainy day funds identified in Building State Rainy Day Funds. These data were obtained directly from state treasurers, comptrollers, departments of revenue, legislative fiscal offices, or other agencies charged with monitoring or managing the state’s fund. Data were standardized into deposits, withdrawals, and ending balances in millions of dollars for each fiscal year from 1994 through 2014.
In cases where a state has two funds, such as Alaska or California, values were aggregated across funds to reflect their total reserve position. Because many states do not track their specific deposit or withdrawal actions closely, providing only ending balances for their fund each year, it is necessary to calculate net changes from year to year without knowing whether concurrent deposits and withdrawals took place. Additionally, several states have statutes that require certain percentages of their funds to be returned to or diverted from their general fund at the end of the fiscal year.
To address these issues, fund deposits and withdrawals are standardized by subtracting their total reserve withdrawals from their total deposits for each fiscal year to produce a measurement of each state’s net RDF use. This captures the use of a state’s RDF, reflecting active decisions by state policymakers to make deposits or withdraw funds according to their respective statutory guidelines.
Lastly, net RDF use data are normalized as a percentage of each state’s total general fund expenditures using data from the National Association of State Budget Officers to control for the differences in the scale of various states’ economies, revenues, and reserves.
Other fiscal, economic, and control variables The rating agencies’ methodologies identify several other factors that play an important role in determining states’ creditworthiness. Pew researchers surveyed the existing literature and ratings methodologies to identify additional variables to supplement the credit rating and RDF use data.
State general fund revenues and expenditures are indicators of states’ fiscal performance and are important measures that proxy for the state’s position in the economic cycle. When revenue declines, state finances weaken and the likelihood of a credit downgrade has been found to increase. Because of this relationship, it is essential to control for state revenue. Both general fund revenue and expenditure data were drawn from the National Association of State Budget Officers’ fall survey of the states for fiscal 1994 through 2014 and reflect only final, audited, actual figures reported by states.
In addition to state revenue, Pew researchers identified several other factors as having a significant relationship to states’ credit ratings. Given that credit ratings assess the ability of states to meet their debt obligations, data recording long- and short-term debt obligations are collected from the Census Bureau’s Annual Survey of Government Finances. In addition, state pension liabilities have been determined to play a significant role in determining states’ creditworthiness. Unfortunately, pension funding ratio data are unavailable for the full period of examination. As a result, the share of the state population over the age of 65 is drawn from census data to serve as a proxy for the number of people making claims on the state’s pension system. Lastly, to control for differences in scale across states, census data were also used to record state populations for inclusion in all statistical models.
9
The scale of revenue, rainy day fund, and debt totals varies wildly from one state to another. To maximize comparability across states, all financial variables were converted into a percentage of total general fund expenditures. This data transformation represents the way most reserves are viewed by state lawmakers and offers a convenient way to normalize variables across states. An added benefit of this transformation is that coefficient values for the rainy day fund balance, rainy day fund use, general fund ending balance, long-term debt, and short-term debt are all directly comparable in the models, as all variables are scaled the same.
Methodology
Calculating the revenue cycle In assessing whether states are engaging in countercyclical use of their reserves, the first challenge is to produce an estimate of the economic or revenue cycle. To do this, a Butterworth filter was used to identify the trend in annual general fund revenue. This filter was selected over possible alternatives for two reasons. First, this approach relaxes the need for overly restrictive assumptions to be imposed by Pew researchers regarding the frequency or amplitude of the cycle. For instance, a Hodrick-Prescott filter requires the researcher to designate the λ term, which can significantly alter the resulting trend estimate. Second, Butterworth filters are estimated recursively, providing greater consistency and accuracy in trend estimates at the start and end of the series.
To ensure the quality of the Butterworth filter estimates, Hodrick-Prescott filters were also estimated with varying λ terms for comparison. In each case, the Hodrick-Prescott filter produced results similar to the Butterworth filter. However, the trends estimated by the Butterworth filter were used for the reasons stated above.
To capture the countercyclicality of rainy day fund use, Pew researchers compared each state’s actual general fund revenue against an anticipated revenue value, as estimated by the Butterworth filter, for each fiscal year. In years where revenue was above the trend, researchers recorded a value of 1. In cases where actual revenue was perfectly on trend, those years were coded as zeroes. All years where observed revenue was below its trend expectations were classified as -1. These classifications resulted in a new variable that provided a simplified measure of the directional deviations from the revenue trend for each state-year in the data.
States’ net rainy day fund use was then multiplied by this new revenue deviation variable. The multiplicative properties of positive and negative values between net RDF use and revenue deviations combine to produce a new “valenced” rainy day fund use variable which captures not only how much states were depositing or withdrawing, but also whether those actions were taken countercyclically. The valenced RDF use variable values and interpretations are displayed in Figure 1 below. The expectations for how each type of RDF use will be viewed by the rating agencies are offered in bold.
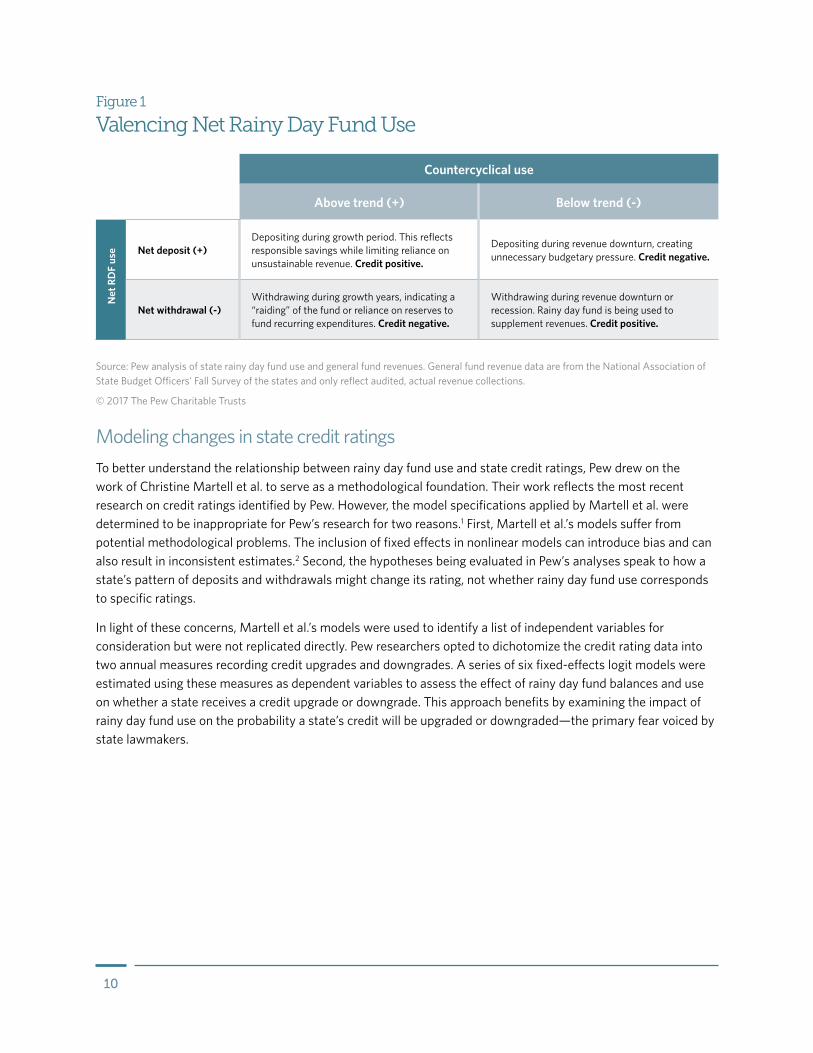
10
Figure 1
Valencing Net Rainy Day Fund Use
Source: Pew analysis of state rainy day fund use and general fund revenues. General fund revenue data are from the National Association of State Budget Officers’ Fall Survey of the states and only reflect audited, actual revenue collections.
© 2017 The Pew Charitable Trusts
Modeling changes in state credit ratings To better understand the relationship between rainy day fund use and state credit ratings, Pew drew on the work of Christine Martell et al. to serve as a methodological foundation. Their work reflects the most recent research on credit ratings identified by Pew. However, the model specifications applied by Martell et al. were determined to be inappropriate for Pew’s research for two reasons.1 First, Martell et al.’s models suffer from potential methodological problems. The inclusion of fixed effects in nonlinear models can introduce bias and can also result in inconsistent estimates.2 Second, the hypotheses being evaluated in Pew’s analyses speak to how a state’s pattern of deposits and withdrawals might change its rating, not whether rainy day fund use corresponds to specific ratings.
In light of these concerns, Martell et al.’s models were used to identify a list of independent variables for consideration but were not replicated directly. Pew researchers opted to dichotomize the credit rating data into two annual measures recording credit upgrades and downgrades. A series of six fixed-effects logit models were estimated using these measures as dependent variables to assess the effect of rainy day fund balances and use on whether a state receives a credit upgrade or downgrade. This approach benefits by examining the impact of rainy day fund use on the probability a state’s credit will be upgraded or downgraded—the primary fear voiced by state lawmakers.
Countercyclical use
Above trend (+) Below trend (-)
Net
RD
F us
e Net deposit (+)Depositing during growth period. This reflects responsible savings while limiting reliance on unsustainable revenue. Credit positive.
Depositing during revenue downturn, creating unnecessary budgetary pressure. Credit negative.
Net withdrawal (-)Withdrawing during growth years, indicating a “raiding” of the fund or reliance on reserves to fund recurring expenditures. Credit negative.
Withdrawing during revenue downturn or recession. Rainy day fund is being used to supplement revenues. Credit positive.

11
Written in regression format, the models are as follows:
Pr(Upgrade)= ∝ + β1 RDF Use+ β2 RDF Balance+ β3 GF Balance+ β4 Long Debt + β5 Short Debt+ β6 Population+ β7 Over 65+ϵ
and
Pr(Downgrade)= ∝ + β1 RDF Use+ β2 RDF Balance+ β3 GF Balance+ β4 Long Debt + β5 Short Debt+ β6 Population+ β7 Over 65+ϵ
where ∝ is a constant; RDF Use is the net rainy day fund use, valenced to reflect the state’s standing relative to the revenue cycle; RDF Balance is the rainy day fund ending balance; GF Balance is the ending balance for the state’s general fund; Long Debt is the state’s long-term debt obligations; Short Debt is the state’s short-term debt obligations; Population is the natural log of the state’s population; Over 65 is the percentage of the state’s population over the age of 65; and ϵ is the error term. Note that RDF Use, RDF Balance, GF Balance, Long Debt, and Short Debt are all measured as a percent of total general fund expenditures, making their coefficient estimates directly comparable. These models are estimated using the same specification for each of the major rating agencies, resulting in separate upgrade and downgrade models for Moody’s, S&P Global, and Fitch.
One clear omission from these models is a variable recording states’ unfunded pension liabilities, which has been identified as a significant predictor of state credit ratings. The decision not to include pension liabilities was motivated purely by data availability. While the period of analysis examines fiscal 1994 through 2014, state pension funding ratio data are only available through the early 2000s. Including a pension funding variable would require excluding more than a quarter of the available data. The share of the state’s population over 65 is inserted into the models to offer a proxy for the stress placed on states through pension obligations. Pew acknowledges that this proxy variable does not capture the state’s funding ratio, but it does capture some of the budgetary pressures states face because of pension obligations.
The results of the models for credit upgrades are detailed in Table 3, and the results of the credit downgrade models are shown in Table 4. Note that each table reports the raw coefficient estimates from the fixed effect logit models. The calculation of an average marginal effect is not possible given the model specifications, as it would require the assumption that all fixed effects are equal to zero.
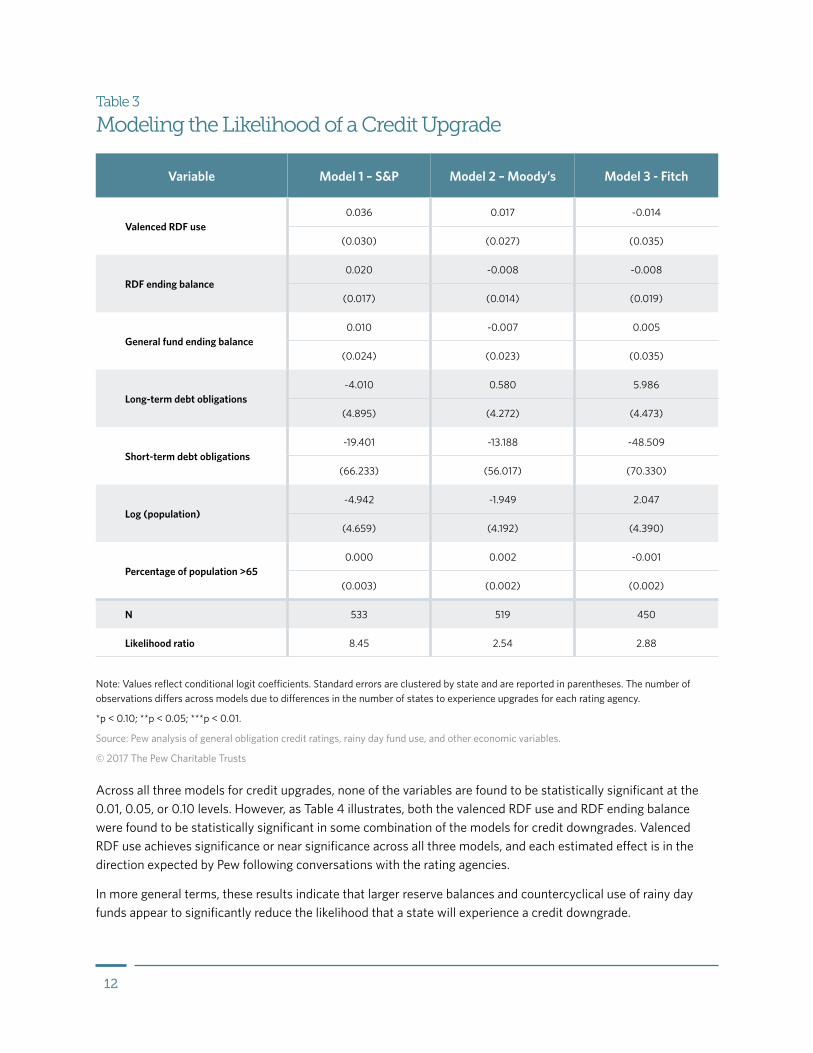
12
Variable Model 1 – S&P Model 2 – Moody’s Model 3 - Fitch
Valenced RDF use0.036 0.017 -0.014
(0.030) (0.027) (0.035)
RDF ending balance0.020 -0.008 -0.008
(0.017) (0.014) (0.019)
General fund ending balance0.010 -0.007 0.005
(0.024) (0.023) (0.035)
Long-term debt obligations-4.010 0.580 5.986
(4.895) (4.272) (4.473)
Short-term debt obligations-19.401 -13.188 -48.509
(66.233) (56.017) (70.330)
Log (population)-4.942 -1.949 2.047
(4.659) (4.192) (4.390)
Percentage of population >650.000 0.002 -0.001
(0.003) (0.002) (0.002)
N 533 519 450
Likelihood ratio 8.45 2.54 2.88
Table 3
Modeling the Likelihood of a Credit Upgrade
Note: Values reflect conditional logit coefficients. Standard errors are clustered by state and are reported in parentheses. The number of observations differs across models due to differences in the number of states to experience upgrades for each rating agency.
*p < 0.10; **p < 0.05; ***p < 0.01.
Source: Pew analysis of general obligation credit ratings, rainy day fund use, and other economic variables.
© 2017 The Pew Charitable Trusts
Across all three models for credit upgrades, none of the variables are found to be statistically significant at the 0.01, 0.05, or 0.10 levels. However, as Table 4 illustrates, both the valenced RDF use and RDF ending balance were found to be statistically significant in some combination of the models for credit downgrades. Valenced RDF use achieves significance or near significance across all three models, and each estimated effect is in the direction expected by Pew following conversations with the rating agencies.
In more general terms, these results indicate that larger reserve balances and countercyclical use of rainy day funds appear to significantly reduce the likelihood that a state will experience a credit downgrade.

13
Variable Model 1 – S&P Model 2 – Moody’s Model 3 - Fitch
Valenced RDF use-0.366** -0.288** -0.248†
(0.172) (0.121) (0.154)
RDF ending balance-0.311** -0.126 -0.187
(0.155) (0.121) (0.143)
General fund ending balance-0.119 -0.184** -0.122
(0.075) (0.084) (0.090)
Long-term debt obligations-11.098 1.038 -3.862
(7.773) (8.352) (7.151)
Short-term debt obligations86.789 270.884** 235.584**
(88.779) (112.296) (110.722)
Log (population)16.202* -2.135 8.392
(9.693) (8.193) (10.737)
Percentage of population >65-0.001 0.000 0.000
(0.003) (0.003) (0.004)
N 225 279 232
Likelihood ratio 19.65*** 22.68*** 15.85**
Table 4
Modeling the Likelihood of a Credit Downgrad
Note: Values reflect conditional logit coefficients. Standard errors are clustered by state and are reported in parentheses. The number of observations differs across models due to differences in the number of states to experience downgrades for each rating agency.
*p < 0.10; **p < 0.05; ***p < 0.01.
† The p-value here is 0.107, placing it on the verge of marginal significance.
Source: Pew analysis of general obligation credit ratings, rainy day fund use, and other economic variables.
© 2017 The Pew Charitable Trusts
Model simulationsTo better illustrate the effects that rainy day funds have on the likelihood that a state will receive a credit downgrade, four sets of predicted probabilities were generated using out-sample data. In each case, California—the state with the most movement in its credit rating—served as the foundation for the prediction datasets. Values for general fund ending balance, long-term debt, short-term debt, population, and population over age 65 are all set at California’s mean values from fiscal 1994 through 2014. These variables were all held constant to

14
isolate the effects of the rainy day fund use and balance variables. In each prediction dataset, Pew researchers artificially shifted the rainy day fund variables across a range of values to illustrate how their effects would play out. They then estimated the predicted probability that a state would receive a credit downgrade using these simulated datasets. The results are displayed in Figures 2 through 5. Note that Figures 4 and 5 here match Figures 1 and 2 from the report.
Figure 2
Rainy Day Fund Use Only Scenario
0
1
2
3
4
5
6
7
8
9
10
% C
hanc
e of
rece
ivin
g a
cred
it do
wng
rade
0246810
RDF use as a % of general fund expenditures
Fitch
S&P GlobalMoody’s
Source: Pew analysis of state rainy day fund use and general obligation credit ratings.
© 2017 The Pew Charitable Trusts

15
Figure 3
Rainy Day Fund Ending Balance Only Scenario
0
1
2
3
4
5
6
7
8
9
% C
hanc
e of
rece
ivin
g a
cred
it do
wng
rade
0246810
Fitch
S&P Global
Moody’s
RDF ending balance as a % of general fund expenditures
In both Figures 2 and 3, the predicted probabilities reflected the shift one would expect to see in a scenario where only RDF use or RDF ending balance changes. These are not realistic scenarios, as RDF use will change the RDF ending balance. But they are illustrative because they show the estimated effect of each variable in isolation.
Figure 4 displays a scenario in which changes in RDF use and balance are directly proportional to one another. The data feature an initial RDF balance of 10 percent of general fund expenditures. This balance is reduced in 0.25 percentage-point increments, while valenced RDF use also decreases by 0.25 percentage-point increments. This reflects a more realistic scenario in which changes in the RDF ending balance are the result of withdrawals being made during growth years. As noted in the report, this behavior would raise flags for the rating agencies because it would indicate a potential problem with the state’s spending practices or its ability to meet ongoing expenditures.
The results illustrate the low probability that a state will receive a credit downgrade if it holds a significant balance in its rainy day fund. However, as the balance decreases in response to the withdrawals, the probability of a credit downgrade increases significantly for all three rating agencies. These results support the rating agencies’ assertions that rainy day funds should not be drawn upon during periods with above-normal revenue.
Figure 5 illustrates a scenario in which both RDF use and balances are again proportional to one another. The difference between this scenario and the previous one is that here valenced RDF use increases in response to a
Source: Pew analysis of state rainy day fund use and general obligation credit ratings.
© 2017 The Pew Charitable Trusts

16
declining RDF balance. This scenario represents a state making withdrawals from its reserves when revenue is below the trend line—during a revenue shortfall or downturn.
Figure 4
Withdrawals During Revenue Growth Years Scenario
0246810
RDF ending balance as a % of general fund expenditures
Fitch
S&P Global
Moody’s
0
2
4
6
8
10
12
14
16
18
% C
hanc
e of
rece
ivin
g a
cred
it do
wng
rade
Source: Pew analysis of state rainy day fund use and general obligation credit ratings.
© 2017 The Pew Charitable Trusts
Unlike the previous scenario, the initial probability of a credit downgrade is higher across all three rating agencies. However, whereas the probability of a downgrade increases as the state withdraws from its rainy day fund in the previous scenario, here the probability of a downgrade decreases by more than 1 percentage point for S&P and Fitch and almost 4 percentage points for Moody’s.
These results also corroborate the statements of the credit rating agencies. The initial probability of a downgrade is higher because the state’s revenue is below its long-term trend, indicating the presence of fiscal stress resulting from a revenue downturn. But the credit negative associated with a decreased RDF balance is offset by the credit positive resulting from countercyclical rainy day fund use.
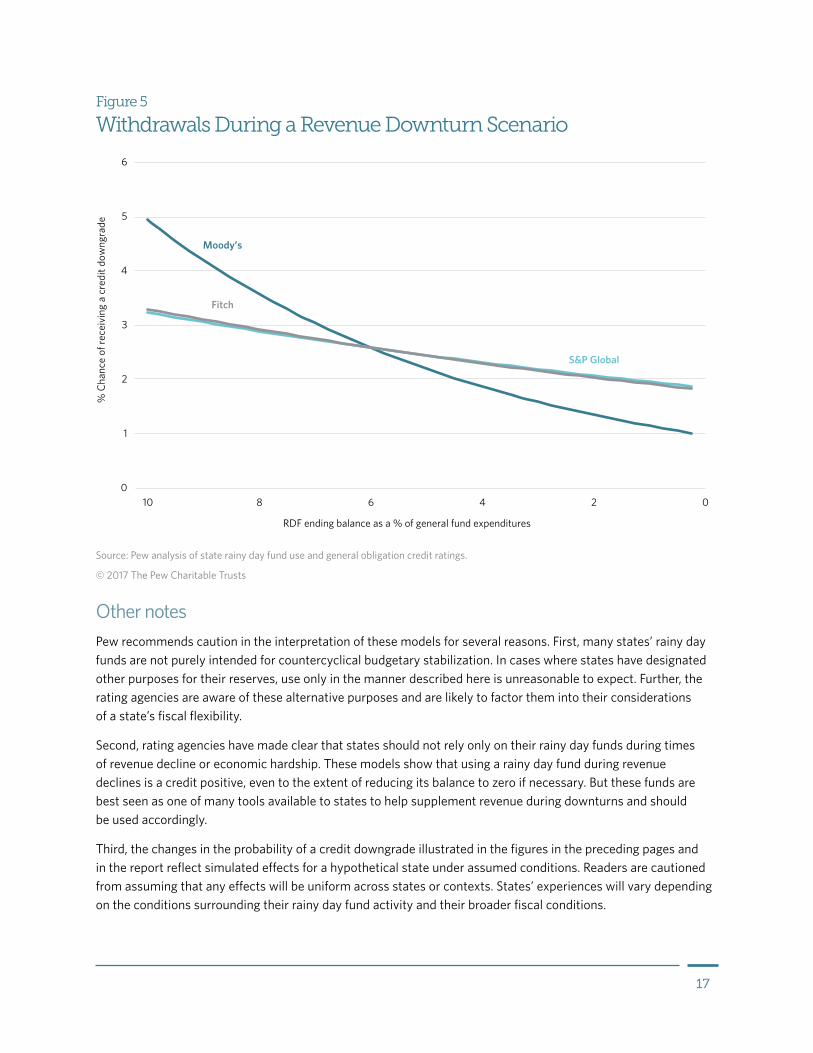
17
Figure 5
Withdrawals During a Revenue Downturn Scenario
Source: Pew analysis of state rainy day fund use and general obligation credit ratings.
© 2017 The Pew Charitable Trusts
0
1
2
3
4
5
6
% C
hanc
e of
rece
ivin
g a
cred
it do
wng
rade
0246810
RDF ending balance as a % of general fund expenditures
Fitch
S&P Global
Moody’s
Other notesPew recommends caution in the interpretation of these models for several reasons. First, many states’ rainy day funds are not purely intended for countercyclical budgetary stabilization. In cases where states have designated other purposes for their reserves, use only in the manner described here is unreasonable to expect. Further, the rating agencies are aware of these alternative purposes and are likely to factor them into their considerations of a state’s fiscal flexibility.
Second, rating agencies have made clear that states should not rely only on their rainy day funds during times of revenue decline or economic hardship. These models show that using a rainy day fund during revenue declines is a credit positive, even to the extent of reducing its balance to zero if necessary. But these funds are best seen as one of many tools available to states to help supplement revenue during downturns and should be used accordingly.
Third, the changes in the probability of a credit downgrade illustrated in the figures in the preceding pages and in the report reflect simulated effects for a hypothetical state under assumed conditions. Readers are cautioned from assuming that any effects will be uniform across states or contexts. States’ experiences will vary depending on the conditions surrounding their rainy day fund activity and their broader fiscal conditions.

18
Lastly, Pew cautions against using these models to assess the causality of the relationships between rainy day funds and credit downgrades. Similar to other comparable studies in the academic literature, these models face endogeneity concerns as fiscal decisions regarding how rainy day funds are used often affect both the fund use and the credit rating, rather than comprising a serial set of decisions and events.
SummaryBased on the results reported in Table 3, Pew finds no evidence of a significant relationship between credit upgrades and reserve fund use or ending balances. In contrast, Table 4 and Figures 3 and 4 offer clarification regarding how rainy day funds relate to credit downgrades. While downgrades are rare events, RDF use and reserve balances both significantly affect the probability that a state will experience a credit downgrade.
These results offer support for Pew’s hypotheses. Withdrawals made from reserves during times of revenue growth result in a significant increase in the likelihood of receiving a credit downgrade. And when reserves are tapped during downturns, there does not appear to be a net credit negative, as the positive effect of a countercyclical transfer offsets any penalty associated with a shrinking reserve balance.

19
Endnotes1 Christine R. Martell, Sharon N. Kioko, and Tima Moldogaziev, “Impact of Unfunded Pension Obligations on Credit Quality of State
Governments,” Public Budgeting & Finance 33, no. 3 (2013): 24–54, doi:10.1111/j.1540-5850.2013.12013.x.
2 William Greene, “The Bias of the Fixed Effects Estimator in Nonlinear Models,” unpublished manuscript, Stern School of Business, New York University (2002), http://people.stern.nyu.edu/wgreene/nonlinearfixedeffects.pdf; Gregori Baetschmann, Kevin E. Staub, and Rainer Winkelmann, “Consistent Estimation of the Fixed Effects Ordered Logit Model,” Journal of the Royal Statistical Society: Series A (Statistics in Society) 178, no. 3 (2015): 685–703, doi:10.1111/rssa.12090.

For further information, please visit: pewtrusts.org/fiscal-health
Contact: Catherine An, communications officer Email: [email protected] Project website: pewtrusts.org/fiscal-health
The Pew Charitable Trusts is driven by the power of knowledge to solve today’s most challenging problems. Pew applies a rigorous, analytical approach to improve public policy, inform the public, and invigorate civic life.