Embed Size (px)
Citation preview
PERSONNEL PSYCHOLOGY1993,46
RAINFOREST EMPIRICISM AND QUASI-RATIONALITY:TWO APPROACHES TO OBJECTIVE BIODATA
FRED A. MAELU.S. Array Research Institute
AMY C. HIRSCHNYNEX Corporation
TWo approaches to objective biodata, designed to achieve the inter-pretability and stability of rational approaches, yet minimize sociallydesirable responding, were explored. The first was a quasi-rationalattempt to derive biodata analogs to an existing temperament mea-sure, and then use them as rational scales. The second was a theory-based variant of criterion-referenced keying, termed rainforest empiri-cism. Both were utilized with two consecutive classes of U.S. MilitaryAcademy cadets (n= 2,565) to predict leadership performance overfour rating periods. The biodata analogs to the temperament mea-sure added incremental validity over the Academy's current admis-sions package and had significantly smaller correlations with a socialdesirability scale than their equivalent temperament scales. Scales de-veloped with the rainforest approach had higher incremental validi-ties and lower social desirability. Both methods demonstrated satisfac-tory stability upon cross-validation, and provided complementary in-terpretability. Advantages to each approach, and the implications fortheir use, are discussed.
Biodata inventories have been the focus of much selection researchand practice, in part because of demonstrably higher validities than mostother selection techniques (Reilly & Chao, 1982). However, issues in-volving the two most common strategies (Mumford & Owens, 1987) forassigning weights to each response alternative within an item, known askeying, have yet to be resolved. With the first strategy, empirical keying,weights are typically assigned to each alternative based on its mean scoreon the criterion of interest, so that the continuum of values within theitem is rearranged to reflect scores on the criterion. While purely em-pirical keying can lead to optimal correlations with criteria, it is highlysensitive to sample-speciflc characteristics, so that when the key is cross
Portions of this paper were presented at the Seventh Annual Conference of the Societyfor Industrial and Organizational Psychology, Montreal, Quebec, May, 1992, and at theAnnual Meeting of the American Psychological Association, Washington DC, August,1992. The contributions of William Burke, Jay Silva, and Leonard White to this researchare gratefully acknowledged. The views expresses in this paper are those of the authors anddo not necessarily reflect the views of the U.S. Army Research Institute, the U.S. MilitaryAcademy, or the Department of the Army.
Correspondence and requests for reprints should be addressed to Fred A. Mael, U.S.Army Research Institute, 5001 Eisenhower Avenue, Alexandria VA 22333.COPYRIGHT © 1993 PERSONNEL PSYCHOLOGY, INC.
719

720 PERSONNEL PSYCHOLOGY
validated, the regression coefficient is vulnerable to excessive shrinkage.It has also been derided as "dustbowl empiricism" for being atheoret-ical and failing to advance understanding of antecedents of successfulperformance (Dunnette, 1962; Pace & Schoenfeldt, 1977).
Some researchers instead champion a rational approach in whichitem alternatives are assigned a priori values based on their theorized re-lationships to specific constructs (cf. Mitchell & Klimoski, 1982; Strieker,1988). Rational biodata advocates also claim that their method willresult in less shrinkage, an assertion that has received some support(Clifton, KilcuUen, Reiter-Palmon, & Mumford, 1992; Schoenfeldt,1989), but has also been challenged (Mitchell & Klimoski, 1982). Be-cause the rational approach typically attempts to measure unitary con-structs, items that can be clearly related to a single construct, and thencombined into homogeneous scales, are preferred. In turn, this shouldgenerally lead to a preference for subjective, temperament-like itemswhich can be focused on one, and only one, construct. By contrast, per-formance of heterogeneous, objective behaviors often draws on multipleindividual characteristics, and responses to items about these behaviorsare difficult to assign to the influence of a single construct.
Therefore, a possible drawback is that even if items reflecting com-plex behaviors are used, item alternatives are still coded in terms of sin-gle constructs, even if they are a function of multiple influences. For ex-ample, a question about having served as class president may be treatedas a measure of dominance, and assigned to a dominance scale, thoughin may be equally indicative of interpersonal charm, academic achieve-ment, and other constructs. In addition, by deciding item directionalitya priori, the possibility that a behavior will prove to be beneficial forsome outcomes and counterproductive for others is ignored. In appliedsettings, where tests are likely to be used for multiple purposes and topredict multiple criteria, this could be problematic.
Researchers have also been concerned about the possibility of so-cially desirable responding and faking on self-report measures (Crowne& Mariowe, 1960; Hough, Eaton, Dunnette, Kamp, & McCloy, 1990;Shaffer, Saunders, & Owens, 1986). One proposed method of reduc-ing susceptibility to faking has been to limit biodata to objective or evenverifiable items (Atwater, 1980; Cascio, 1975). This is problematic forrational keying advocates, in that objective actions tend to be hetero-geneous and therefore diflicult to attribute to unitary constructs. Thus,limiting biodata to objective items would eliminate the homogeneousand subjective items preferred in the rational approach. What remainsis a dilemma about the types of items to be preferred. Those items thatmay be most resistant to distortion are also perceived as yielding lessunderstanding and as least stable. Conversely, items that may appear tohave the most promise for theoretical advance may be most susceptibleto distortion, and hence less useful.
MAEL AND HIRSCH 721
In the present research, two different approaches were undertakenin an attempt to bridge the gap between the empirical and rational per-spectives. The first was an attempt to gain the conceptual benefit ofmeasuring specific constructs, yet retain the less fakable properties ofobjective biodata, by using a quasi-rational approach. Objective biodataitems were empirically keyed directly to temperament scales, and thenused rationally, as scales with a priori values. The goal was to determineif biodata scales could parallel individual temperament scales in their re-lationships to criteria. This approach is rational in the sense that itemsare not keyed directly to the criterion, yet empirical in the sense that itemvalues are generated by their empirical relationship to an external refer-ent, in this case temperament scales. Hence, the term "quasi-rational."In the current effort, temperament scales and their biodata analogs werecompared in terms of their relationships with four measures of leader-ship performance and their vulnerability to faking.
A second approach was a variation of empirical keying, in which the-oretical discretion was used in the development and keying of the items,leading to a more conservative, but hopefully more meaningful deriva-tion key. In addition, patterns of item relationships were monitored, andsearched for multifaceted profiles of successful performance across thesame series of criteria. This approach, termed "rainforest empiricism"by Mael (1991), seeks to improve upon the dry, sterile, and atheoret-ical technique which has earned the metaphorically vivid sobriquet of"dustbowl empiricism." The idea behind this approach is not new; it wasadvocated in essence by researchers such as Cureton, Owens, and Otis,at a 1965 biodata conference (Henry, 1965, p. 5). Moreover, this ap-proach is implicitly endorsed in practice by numerous experienced bio-data researchers. Practical differences between the rainforest and dust-bowl perspectives are discussed below.
The research also reflects an attempt to respond to an applied prob-lem at the U.S. Military Academy at West Point (USMA). Originally,interest was expressed in using the Army's Assessment of Backgroundand Life Experiences (ABLE), a temperament measure which predictsattrition, training completion, and leadership potential (Hough et al.,1990; White, Nord, Mael, & Young, 1993), to predict leadership poten-tial and performance. But, it was decided that ABLE could prove in-appropriate for use in an admissions package, because of the nature ofthe items and concerns about the ease of choosing socially desirable re-sponses. Instead, an attempt was made to substitute objective biodataitems, and then utilize them either with the quasi-rational approach, asanalogs to ABLE temperament scales, or with the rainforest approach,as empirically keyed, stand-alone biodata. Other recent efforts at uti-lizing biodata in the prediction of leadership ratings and leadership po-tential (Fleishman et al., 1991; Mumford, Zaccaro, Harding, Fleishman,& Reiter-Palmon, in press; Russell & Kuhnert, 1992; Russell, Mattson,
722 PERSONNEL PSYCHOLOGY
Devlin, & Atwater, 1990; Strieker, 1988) have generally taken a rationalkeying strategy, unfettered by limitations on the use of subjective items.By contrast, the current effort was conducted in an environment thatmandated that only objective and primarily verifiable items be used.
In summary, two approaches to objective biodata were evaluated inthis study. The first is a quasi-rational approach in which initial-stage em-pirical keying provides biodata analogs to existing temperament scales,which are then used like rational scales. The second approach is stylisti-cally more similar to traditional empirical keying, except that theoreticalconsiderations play a larger role in choice of items and in keying deci-sions. This research examines the viability of each approach. Becausethe two approaches were undertaken with the same data set, direct com-parisons in terms of validity, incremental contribution, fakability, andinterpretability were also possible.
Method
Sample and instruments. The 1,325 incoming cadets of the USMAclass of 1994, of which 1,164 (88%) were men, completed questionnairesin July 1990 upon their arrival at USMA. Attrition throughout the periodof research accounts for the progressively smaller criterion sample sizes.For purposes of replication and cross-validation, most measures wereadministered to the 1,240 incoming cadets of the class of 1995. Thefollowing measures were included:
Assessment of Background and Life Experiences (ABLE). An 88-itemversion of the Army temperament measure ABLE was assembled for thisresearch. The measure included the following scales: a 21-item Emo-tional Stability scale; a 10-item Traditional Values scale, whose itemsdeal with endorsement of respect for rules, authority figures, and dis-cipline; a 14-item Work Orientation scale; a 12-item Dominance scale;and an 18-item Energy scale. An 11-item Social Desirability scale, de-signed to detect persons whose responses are consistently contaminatedwith socially desirable responses (Hough et al., 1990), was also included.ABLE scales have demonstrated reliability over numerous administra-tions (White et al., 1993). Because of time constraints, ABLE could beadministered only to the class of 1994.
USMA measures. The admissions measures currently used at USMAwere included in the research for the purpose of determining the incre-mental contribution of the biodata (Burke, 1992). The primary measureused for selection is the weighted composite called the Whole CandidateScore (WCS), 60% of which is based on an applicant's standardized testscores (i.e., SAT, ACT) and graduating rank in high school; 30% on theLeadership Potential Score, derived from the School Official Evaluation(an evaluation form filled out by high school instructors), and the Candi-date Activities Record, a checklist of extracurricular activities and varsitysports; and 10% on scores on the Physical Aptitude Examination. The

MAEL AND HIRSCH 723
Whole Candidate Score and each of its primary components were eval-uated both collectively and individually against the criteria.
Biodata questionnaire. A 73-item biographical data questionnairewas developed for this research. A number of the items or item topicsappeared in previous biodata forms (England, 1971; Glennon, Albright,& Owens, 1966; Richardson, Bellows, Henry, & Co., 1985), while otherswere developed for this research. Items were included if they addressedbehaviors or events hypothesized to be related to: (a) the criteria ofinterest, with leadership performance at various stages as the primarycriterion, and attrition from USMA as a secondary one; (b) the ABLEscales included in the research, especially Dominance; or (c) other as-pects of military adaptability seen by subject matter experts as poten-tially relevant to success during and after a cadet's tenure at USMA,such as membership in varsity sports teams and preference for ruggedpastimes. The ultimate aim of the research is longitudinal (i.e., pre-diction of performance as a commissioned officer after graduation fromUSMA). Thus, it was deemed inappropriate to gear the biodata items tojob-analysis based dimensions of short-term success at USMA. Rather,leadership performance was defined as broadly as possible to cover bothshort- and long-term roles. Moreover, evaluation of the interrelation-ship of the criterion measures from different periods, and their differen-tial relationships to various predictors, was seen as a critical component.
To minimize faking, items were limited to those that were histori-cal, external, objective, first-person, and mostly verifiable in principle,attributes described in Mael (1991). Recent empirical studies (Becker& Colquitt, 1992; McManus & Masztal, 1993) demonstrate that follow-ing these guidelines results in reduced faking of responses. However, bylimiting the instrument to such items, other potentially useful items hadto be abandoned.
Criterion measures. Four operational ratings of demonstrated lead-ership capability, using the same 12-dimension rating form, were uti-lized as criterion measures for this research. The 12 dimensions onthe form were duty motivation, military bearing, teamwork, influenc-ing others, consideration, professional ethics, planning and organizing,delegating, supervising, developing subordinates, decision making, andverbalAvritten communications. A single summary score, based on aweighted combination of ratings by cadet superiors and a tactical offi-cer, was provided to the researchers for each rating period. The firstrating period was the initial 6-week cadet basic training period known as"Beast Barracks," which occurs prior to the onset of classes. The secondand third periods were the fall and spring semesters of the first academicyear. The fourth rating period was cadet field training, which takes placeduring the second summer of attendance at USMA. Reliability and con-struct validity information on the USMA criteria were unavailable. Themoderate correlations between the criterion measures (ranging from .23
724 PERSONNEL PSYCHOLOGY
to .40), as well as evidence of differential relationships with the predic-tors, served as compelling grounds not to initially combine the ratings.
Keying Procedures and Strategies
In keying the biodata, a balance was struck between the rational andempirical approaches. While a priori keying was found to be inappro-priate with heterogeneous items, it was felt that a strictly empirical ap-proach could lead to coding items in illogical ways unlikely to be repli-cated with future samples. For this reason, most experienced practition-ers commonly use some judgment in empirical keying. Based on con-sultations with a number of these practitioners, the following strategiesfor logically tempering "dustbowl empiricism" with a more theoretical"rainforest empiricism" (Mael, 1991) emerged.
One issue involves possible illogical keying of items based on strictempiricism. For example, in the item "How many years did you playvarsity chess in high school?" suppose that the criterion means for re-sponses on this sample were 2.8 (not at all), 3.1 (1 year), 3.4 (2 years),3.0 (3 years), and 3.7 (4 years). Using strict empirical keying, one wouldassign a lower value to 3-year participation than 2- or 4-year participa-tion. However, barring a compelling post-hoc theory, one would be sus-picious of a sample-specific quirk, especially if the sample size was onlymoderate. Rather than code it this way and incur significant shrinkage,a more logical approach would be to fit this response within the con-tinuum, perhaps by assigning a single value to 1-3 years participation.With this strategy, the researcher accepts a smaller correlation withinthe derivation sample, in return for a more stable and better estimate oftrue population values.
Another issue concerns the keying of a non-continuous item, such as"Which of these courses did you enjoy most?" The experts advised treat-ing each response alternative as a separate item, so that those choosing"Math" were contrasted with all others, as were those choosing "En-glish," "Science," and so on. The reasoning is that the exact configura-tion of the five choices may be too idiosyncratic to be replicated consis-tently, thus leading to increased shrinkage upon cross- validation. Whentwo or more alternatives form a logical subset, they could be combined,and contrasted as a unit to the other options. Thus, this sample itemcould actually serve as multiple items (Hogan & Stokes, 1989).
Another problem regards items with alternatives chosen by few peo-ple. For example, in the question "How much sleep do you need pernight?" if only 3% respond "5 hours or less" to the question, the meanassociated with that response will likely be unreliable. Thus, followingthe experts' advice, alternatives chosen by less than 10% of the samplewere considered low-frequency alternatives, and treated in one of twoways. If the item was continuous, the low-frequency response was com-bined with an adjacent response. Thus, in the above example, the "5

MAEL AND HIRSCH 725
hours or less" response group would be merged with the "6-7 hours"response group to form one category. With a non-continuous item, low-frequency responses were set at the mean. While these adjustmentswould minimize initial correlations with the criterion, it was hoped theywould provide more conservative and stable indications of underlyingrelationships. Items having overall poor variance (i.e., lacking at leasttwo response choices each endorsed by 10% of respondents) inevitablydid not contribute to validity, and were dropped. In summary, the twoways in which the rainforest approach departs from dustbowl empiricismin this study involve the choice of items and keying of items, at each stepattempting to follow Pace and Schoenfeldt's advice to "insure that the'hand of reason' has been injected into the process" (1977, p. 165).
Biodata analogs to ABLE. In the current research, keying to ABLEwas empirical, though tempered by the logical discretion described above.Each biodata item was keyed to each ABLE scale, and, if significantlycorrelated with the scale, was retained as part of a biodata analog ofthat construct. Because of dummy-coding of categorical items, the totalnumber of potential items was greater than 73. The five developed scaleswere: Bio-Emotional Stability (22 items); Bio-ii-aditional Values (27items); Bio-Work Orientation (32 items); Bio-Dominance (57 items);and Bio-Energy (40 items). Because of the heterogeneous nature of theobjective biodata items, the item pools for each scale were not mutuallyexclusive, and no attempt was made to derive mutually exclusive scales.Examples of some of the behaviors making up each of these scales areshown in Figure 1.
Rainforest empirical keys. With this approach, biodata scales werecreated which were empirically keyed to each of the four criteria, us-ing the same rationally-bounded methodology described above. The re-sult was four predictor measures: Bio-Basic (22 items), Bio-Fall (28),Bio-Spring (3i), and Bio-Field (26). Each measure was cross-validatedthrough triple cross-validation (Silverhart, 1990). First, each sample wasdivided into thirds. A series of keys was developed on each possible com-bination of two-thirds and then cross-validated on the hold-out third. Af-ter this round robin was completed, the average of the three derivationvalidities and cross-validities for each scale was computed. In additionto within-class cross-validation, rainforest keys developed on the wholeclass of 1994 sample were cross-validated against class of 1995 criterionratings. Similarly, keys developed on the class of 1995 were utilizedwith class of 1994 data and criteria, for the purpose of cross-validation.The two methods of cross-validation have complementary appeals. Theacross-class method minimizes issues of within-sample sampling error(Murphy, 1984), and can indicate stability even in the presence of sub-stantive sample differences. In this case, the classes entered USMA be-fore and after the Desert Storm war, respectively, which could have im-pacted the decisions of applicants to enter the academy. Within-class

726 PERSONNEL PSYCHOLOGY
Cadets high in Emotional StabiHtv:
- watch less television
- when angry, exercise or walk vs. fighting or stewing
Cadets high in Tj-aditional Values:
- attend prayers more often
- spend more nights at home each week
Cadets high in Work Orientation:
- highest high school grades and class rank
- ran for elective office more often
Cadets high in Dominance:
- most likely to have been varsity sport team member or captain
- most likely to have held supervisory work position
Cadets high in Enerev Level:
- work more hours at part-time jobs
- need less sleep and sleep less on an average night
Figure 1. Sample Behaviors from the Five Quasi-Rational Biodata Scales
cross-validation can be done simultaneously, and also negates spurioussample differences in testing time and conditions, as noted below. Forthis reason, both methods were used.
Results
Comparison of ABLE arui Biodata Analogs
Correlations among the ABLE scales and the biodata analogs tothe ABLE scales appear in Table 1. The correlations between eachABLE scale and its equivalent biodata scale range between .37 and .53.Only two off-diagonal correlations between ABLE scales and the biodataanalogs of other ABLE scales were of similar magnitude.
Note that the ABLE scales were themselves not orthogonal, with cor-relations between scales as high as .57. And, because the same itemswere used in multiple biodata scales, some overlap in the off-diagonal co-efficients was inevitable. Yet, to a great extent the biodata scales approx-imated the specific ABLE constructs they were keyed to, and demon-strated discrimination in their relationships to the other ABLE scales.
Relationships to Leadership Ratings
Validation of the biodata analogs. The correlations of the ABLEscales, their biodata analogs, and the USMA predictors, with each ofthe four criterion measures, appear in Tkble 2. Each of the ABLE scaleswas related to leadership performance during basic training and field

MAEL AND HIRSCH 727
TABLE 1Intercorrelations of Able Scales and Biodata Analogs, Class of 1994
Variable
1. Emotional stability2. IVaditional values3. Work orientation4. Dominance5. Energy6. Bio-emotional stability7. Bio-traditional values8. Bio-work orientation9. Bio-dominance
10. Bio-energy
Items
21101412182227325740
1
.84
.18
.18
.36
.57
.37
.03
.09
.20
.28
2
.70
.49
.17
.38
.07d2.34.11.18
3
.84
.33
.51
.17
.50^.27.34
4
.82
.44
.31
.16
.29^2.43
5
.81
.34
.22
.27
.29M
6
.54
.08
.22
.48
.71
7
.65
.85
.30
.35
8 9 10
.70
.52 .71
.53 .66 .56
Note: Correlations above .058 are significant at p< .01. Alpha coefficients appear indiagonal. Correlations between ABLE scales and their biodata analogs are underlined,
n = 1,324
TABLE 2
Correlations of ABLE Scales, Biodata Keyed to ABLE, and USMAPredictors with Four Leadership Ratings, Class of 1994
Variable
Emotional stabilityBio-emotional stability
TVaditional valuesBio-traditional values
Work orientationBio-work orientationDominanceBio-dominance
EnergyBio-energy
Whole candidate scoreSATHigh school rank
Leader potential score
Physical aptitude exam
Basic
.17*
.17*
i l l*.02
i l l*.02.12*.08*
.18*
.16*
.07*
.02
.03
.07*
.16*
Fall
.05
.06
.17*.24*
.19*
.23*
.07*
.09*
.07*
.09*
.32*
.09*
.30*
.11*
- .02
Spring
.05
.09*
.16*
2T.28*.27*.02
m*.11*.11*.35*.10*.30*
.16*
.03
Field
.15*^ *
.09*
.08*
.12*
.10*
.17*
.21*
.20*
.20*
.10*-.04
.04
.16*
.18*
Note: Underlined coefficients are significantly higher than their ABLE or biodata equiv-alents.
n = 1,183 (Basic training and Fall); 1,145 (Spring); 1,076 (Field training)*P<.05
training. However, Emotional Stability was not related to fall or springratings, nor was Dominance related to spring ratings.
Among the biodata analogs, Bio-Dominance and Bio-Energy wererelated to each of the criteria, while the other analog scales were related

728 PERSONNEL PSYCHOLOGY
TABLE 3Rainforest Biodata Validities and Cross-Validities for Leadership
Ratings, USMA Classes of 1994 and 1995
Empirically keyed biodataLeadership ratings
Basic Fall Spring Field
Triple cross-validation within class of 1994
Average derivation and cross-validityusing triple cross-validation, class of 1994
Validity and across-class cross-validationbased on keying to total 1994 sample
Validity and across-class cross-validationbased on keying to total 1995 sample
.38 (.18) .40 (.30) .42 (.29) .36 (.28)
.32 (.21) .41 (.30) .45 (.30) .36 (.30)
.31 (.29) .44 (.28) .45 (.32) .39 (.21)
.34 (.23) .41 (.30) .44 (.30) .37 (.27)
.30 (.17) .39 (.17) .40 (.32) .34 (.14)
.31 (.19) .34 (.22) .40 (.29) .28 (.23)
Note: All values in parentheses are cross-validities.
to three of the four criteria. In only 2 of 20 comparisons was the co-efficient for an ABLE scale significantly higher than its biodata analog,as computed by the formula for testing differences between dependentcorrelations described in Cohen and Cohen (1983, p. 56-57). Con-versely, the biodata analog was significantly higher in 4 cases.
The relatively minor coefficients for Dominance and Bio-Dominance,despite their conceptual relationship to leadership, was explained byUSMA researchers. The primary role of the plebe (freshman) duringbasic training is to be a good team player, rather than to direct othercadets, while fall and spring semester ratings are given in the context ofacademic accomplishments. Thus, the importance of dominance onlyemerges at the first real opportunity for leading, field training.
Rainforest validities and cross-validities. Ihble 3 shows the validitiesand cross-validities of the rainforest biodata keys for each of the fourleadership criteria. For each criterion, the results of the triple cross-validation performed within the class of 1994 are shown, followed bythe average derivation and cross-validation score. Then, the validity forthe biodata keyed to the total class of 1994 sample, together with cross-validities in parentheses, is shown. Cross-validities were obtained byusing the class of 1994 keys with the data from the class of 1995 sample.The final row shows the reverse (i.e., the validity of the keys developedon the 1995 sample and their cross-validities with the data from the classof 1994 sample).
The results in Table 3 show that the cross-validities of the rainforest-keyed biodata were significantly related to the criteria, and did not showexcessive shrinkage. In comparing the two types of cross-validation, thewithin-class method presented a picture of greater stability than did themore conservative, across-class method.

MAEL AND HIRSCH 729
TABLE 4I Predictors withCorrelations of Biodata Keyed to ABLE and USMA Pi
Four Leadership Ratings, Class of 1995
Variable
Bio-emotional stabilityBio-traditional valuesBio-work orientationBio-dominanceBio-energyWhole candidate scoreSATHigh school rankLeader potential scorePhysical aptitude exam
Basic
.15*
.07*
.07*
.14*
.14*
.17*
.07*
.11*
.18*
.21*
Fall
.04
.23*
.24*
.09*
.04
.29*
.07*
.28*
.25*
.10*
Spring
.03
.29*
.28*
.07*
.09*
.32*
.10*
.30*
.22*
.09*
Field
.11*
.11*
.12*
.16*
.12*
.15*
.02
.10*
.17*
.16*
n = 1,192 (Basic training); 1,162 (Fall); 1,118 (Spring); 1,092 (Field training)*p<.05
TWo points need to be considered when assessing the degree ofshrinkage in across-class cross-validities. First, the 1995 sample had suf-ficient missing data on 8 of the 73 items to require dropping those items.In addition, variation between the two classes due to sampling can be ev-idenced from differences in the correlations between the USMA predic-tors and the criteria for each of the classes. To the extent that substantivedifferences between the classes exist, shrinkage cannot be blamed solelyon biodata item instability.
Cross-validation of the biodata analogs. ABLE was not administeredto the class of 1995. However, biodata analogs, created by keying itemsto ABLE scales on the class of 1994 data, were utilized with the classof 1995 in order to cross-validate that approach as well. The validitiesof the biodata analogs and the USMA predictors for the class of 1995appear in Tkble 4.
Validities for the class of 1995 were virtually identical to those ofthe first sample, with only one coefficient significantly lower than itsequivalent for the class of 1994. This indicates that shrinkage was nota problem with this method.
Incremental validity of the biodata. In order to determine the rela-tive merits of the two approaches in terms of incremental contributionto prediction with the Whole Candidate Score, a series of hierarchicalmultiple regressions were performed. These appear in Tkbles 5 and 6for the classes of 1994 and 1995, respectively. For the quasi-rational ap-proach, the unit-weighted sum of the five biodata analogs was entered af-ter the USMA Whole Candidate Score, and is referred to collectively asBioABLE. For the rainforest approach, the across-class cross-validities,representing the more conservative assessment of validity, were enteredafter the Whole Candidate Score.
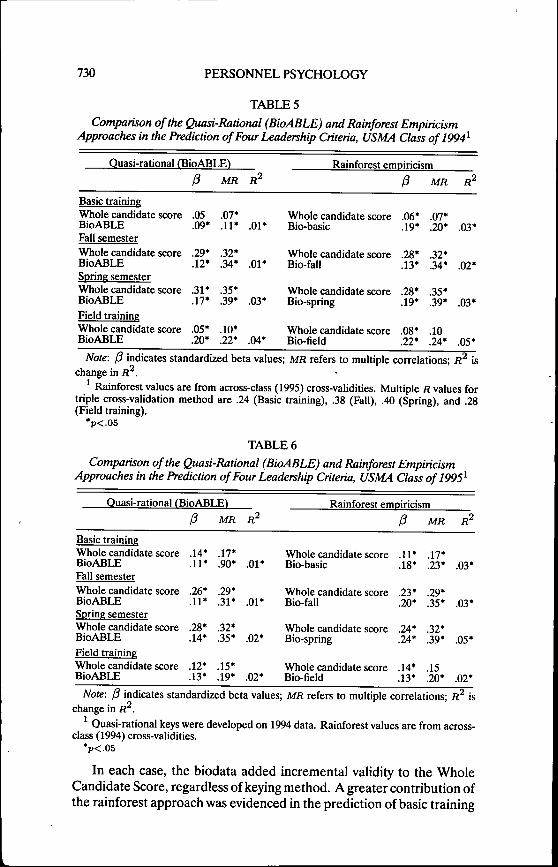
730 PERSO^fNEL PSYCHOLOGY
TABLE 5
Comparison of the Quasi-Rational (BioABLE) and Rainforest EmpiricismApproaches in the Prediction of Four Leadership Criteria, USMA Class of 1994^
Ouasi-rational fBioABLE')
Basic trainingWhole candidate scoreBioABLEFall semesterWhole candidate scoreBioABLESpring semesterWhole candidate scoreBioABLEField trainingWhole candidate scoreBioABLE
.05
.09*
.29*
.12*
.31*
.17*
.05*
.20*
MR
.07*
.11*
.32*
.34*
.35*
.39*
.10*
.22*
R^
.01*
.01*
.03*
.04*
Rainforest emDiricism
Whole candidate scoreBio-basic
Whole candidate scoreBio-fall
Whole candidate scoreBio-spring
Whole candidate scoreBio-field
.06*
.19*
.28*
.13*
.28*
.19*
,08*.22*
MR
07*.20*
.3?.*
.34*
.3S*
.39*
10.24*
.03*
,0?,*
.03*
.05*
Note: (3 indicates standardized beta values; MR refers to multiple correlations; R^ ischange in fl^.
^ Rainforest values are from across-class (1995) cross-validities. Multiple R values fortriple cross-validation method are .24 (Basic training), .38 (Fall), .40 (Spring), and .28(Field training).
*p<.05
TABLE 6
Comparison of the Quasi-Rational (BioABLE) and Rainforest EmpiricismApproaches in the Prediction of Four Leadership Criteria, USMA Class of 1995^
Ouasi-rational CBioABLE"!
Basic trainingWhole candidate scoreBioABLEFall semesterWhole candidate scoreBioABLESpring semesterWhole candidate scoreBioABLEField trainingWhole candidate scoreBioABLE
.14*
.11*
.26*
.11*
.28*
.14*
.12*
.13*
MR
.17*
.90*
.29*
.31*
.32*
.35*
.15*
.19*
.01*
.01*
.02*
.02*
Rainforest empiricism
Whole candidate scoreBio-basic
Whole candidate scoreBio-fall
Whole candidate scoreBio-spring
Whole candidate scoreBio-field
.11*
.18*
.23*
.20*
.74*
.24*
.14*
.13*
MR
,17*.23*
79*..35*
37*.39*
.11
.20*
.03*
,03*
.05*
.02*
Note: P indicates standardized beta values; MR refers to multiple correlations; fl^ ischange in F?.
^ Quasi-rational keys were developed on 1994 data. Rainforest values are from across-class (1994) cross-validities.
*P<.05
In each case, the biodata added incremental validity to the WholeCandidate Score, regardless of keying method. A greater contribution ofthe rainforest approach was evidenced in the prediction of basic training

MAEL AND HIRSCH 731
ratings, and to a lesser extent in prediction of field training ratings. Ifthe within-class triple cross-validation method were used instead, therainforest scales would demonstrate a more pronounced improvementin incremental validity (footnote, Thble 5). There were no differences inprediction of fall and spring semester for the class of 1994. The resultsin Ikble 6, which utilize cross-validities of both quasi-rational measuresand rainforest measures that were developed on the class of 1994 andapplied to the class of 1995, may be a fairer comparison. In this case,the rainforest approach had somewhat higher incremental validities inall but field training ratings for class of 1995.
Though not shown in Thble 5, additional regressions were performedfor the class of 1994 which included the five ABLE scales as well as thebiodata and Whole Candidate Score. This was done to test the hypoth-esis that the ABLE and biodata analog scales would share more over-lapping criterion variance than would the ABLE scales and rainforestkeys. This was confirmed. The contribution of the biodata analogs toincremental validity over and above that of the Whole Candidate Scoreand the ABLE scales was non-significant for two criteria (basic trainingand spring semester), marginal (p < .054) for fall semester ratings, andsignificant only for field ratings. The rainforest keys, however, providedsignificant incremental validity for each criterion. In each case, the mul-tiple correlation was higher when using the rainforest keys rather thanthe biodata analogs.
Dimensionality of the Leadership Criterion
The intercorrelations between the four criteria, and the intercorre-lations between the four rainforest keys, for both the classes of 1994 and1995, appear in Thble 7. The correlations between the biodata keys in thetwo field settings, Bio-Basic and Bio-Field, for each class, were .72 and.70, respectively. Similarly, the correlations between the keys for the twoacademic year ratings, Bio-Fall and Bio-Spring, were .79 and .68, respec-tively. By contrast, all other correlations among the empirical keys wereno higher than .30 for either of the classes. The implication is that thereare two dimensions of leadership as rated at USMA, each representedby a distinguishable constellation of items. Although the ratings them-selves were unifactorial, and may represent a degree of halo effect, thebehaviors and experiences thatpredict each dimension are demonstrablydifferent.
Further analysis of the relationships between the USMA predictorsand the rainforest scales provide some support for this premise. Highschool rank, a measure of past scholastic performance, was related tothe Bio-Fall and Bio-Spring scales, but was negatively related to the twofield predictors, Bio-Basic and Bio-Field. This pattern was repeated withthe Whole Candidate Score, which was dominated by previous academic

732 PERSONNEL PSYCHOLOGY
TABLE 7Correlations Among the Four Leadership Criteria for Classes of 1994 and 1995
Variable
Basic trainingFall semesterSpring semesterField training
Basic
.38 (.43)
.28 (.32)
.41 (.38)
Fall
.41 (.41)
.23 (.28)
Spring
.31 (.28)
Correlations Among the Four Rainforest Keys for Classes of 1994 and 1995
Variable
Bio-basicBio-fallBio-springBio-field
Bio-basic
.22 (.06)
.28 (.11)
.72 (.70)
Bio-fall
.79 (.68)
.27 (.19)
Bio-spring
.24 (.31)
Note: Coefficients for class of 1995 are in parentheses; all correlations are significant atp<.05.
achievement. Conversely, the Physical Aptitude Exam was related tothe biodata predictors of field success, but not to the predictors of aca-demic year leadership. Similar support may be derived from correlationsinvolving the ABLE scales. Three constructs that would appear to bemost important for interpersonal leadership (Emotional Stability, Dom-inance, and Energy Level) were related to the Basic and Field ratings,and to their rainforest predictors, to a greater extent than to the aca-demic year ratings. Conversely, Ti-aditional Values and Work Orienta-tion, constructs that relate more to following instructions, steadfastness,and work habits, were somewhat more related to the academic year rat-ings and their rainforest predictors.
In reviewing the items making up these rainforest scales (utilizing thescales from both classes), patterns emerge for each dimension. For thefield-related biodata scales, the dominant themes are indicators of ath-leticism and fitness, rugged and self-sufficient pastimes, and work experi-ences during high school including summer, volunteer, and supervisorywork. For the academic-year ratings, the main behavioral themes in-cluded a range of school-related leadership positions, academic accom-plishments, and more time devoted to homework, as well as similar workexperience. Thus, both dimensions appear to include situationally ap-propriate elements of leadership potential, albeit different ones, as wellas more general skills and experiences.
Social Desirability Analyses
Thble 8 shows the correlation between the ABLE Social DesirabilityDetection scale and each ABLE and Biodata scale, as well as the USMApredictors. The Social Desirability scale's correlation was significantlyhigher with each ABLE scale than with its biodata analog [Emotional
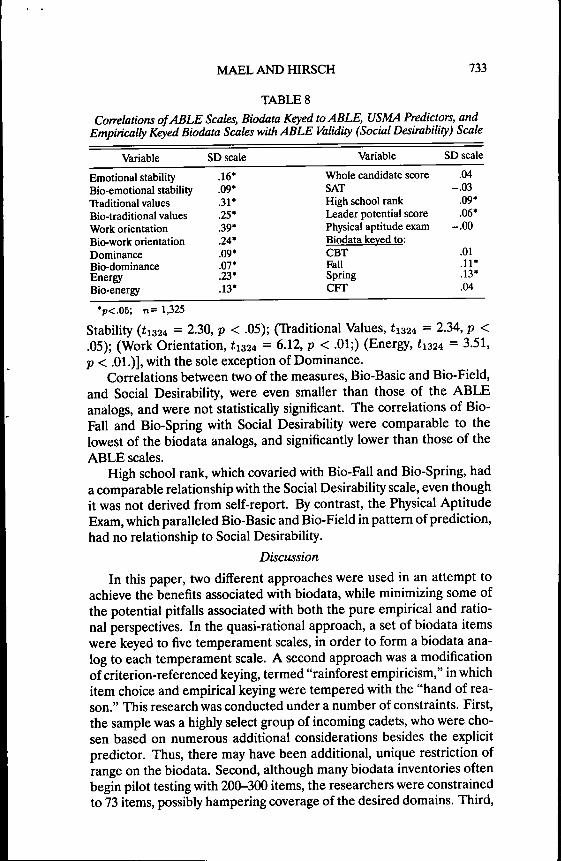
MAEL AND HIRSCH 733
TABLE 8Correlations of ABLE Scales, Biodata Keyed to ABLE, USMA Predictors, and
Empirically Keyed Biodata Scales with ABLE Validity (Social Desirability) Scale
Variable
Emotional stabilityBio-emotional stabilityll'aditional valuesBio-traditional valuesWork orientationBio-work orientationDominanceBio-dominanceEnergyBio-energy
SD scale
.16*
.09*
.31*
.25*
.39*
.24*
.09*
.07*
.23*
.13*
Variable
Whole candidate scoreSATHigh school rankLeader potential scorePhysical aptitude examBiodata keved to:CBTFallSpringCFT
SD scale
.04-.03
.09*
.06*-.00
.01
.11*
.13*
.04
*p<,05; n= 1,325
Stability (f 1324 = 2.30, p < .05); (TYaditional Values, 1̂324 = 2.34, p <.05); (Work Orientation, fi324 = 6.12, p < .01;) (Energy, 1̂324 = 3.51,p < .01.)], with the sole exception of Dominance.
Correlations between two of the measures, Bio-Basic and Bio-Field,and Social Desirability, were even smaller than those of the ABLEanalogs, and were not statistically significant. The correlations of Bio-Fall and Bio-Spring with Social Desirability were comparable to thelowest of the biodata analogs, and significantly lower than those of theABLE scales.
High school rank, which covaried with Bio-Fall and Bio-Spring, hada comparable relationship with the Social Desirability scale, even thoughit was not derived from self-report. By contrast, the Physical AptitudeExam, which paralleled Bio-Basic and Bio-Field in pattern of prediction,had no relationship to Social Desirability.
Discussion
In this paper, two different approaches were used in an attempt toachieve the benefits associated with biodata, while minimizing some ofthe potential pitfalls associated with both the pure empirical and ratio-nal perspectives. In the quasi-rational approach, a set of biodata itemswere keyed to five temperament scales, in order to form a biodata ana-log to each temperament scale. A second approach was a modificationof criterion-referenced keying, termed "rainforest empiricism," in whichitem choice and empirical keying were tempered with the "hand of rea-son." This research was conducted under a number of constraints. First,the sample was a highly select group of incoming cadets, who were cho-sen based on numerous additional considerations besides the explicitpredictor. Thus, there may have been additional, unique restriction ofrange on the biodata. Second, although many biodata inventories oftenbegin pilot testing with 200-300 items, the researchers were constrainedto 73 items, possibly hampering coverage of the desired domains. Third,

734 PERSONNEL PSYCHOLOGY
the longitudinal scope of the research, focused ultimately on all stagesof a cadet's career, precluded using job analysis of either short-term orlong-term roles as the main basis for item generation. Finally, the youthand inexperience of the cadets limited the number of objective, directly"job relevant" previous experiences available for the item pool.
Nonetheless, these findings are encouraging. With the quasi-rationalapproach, the biodata analogs were compared to the ABLE scales in re-lation to each of four criteria. Of 20 such comparisons, the biodata mea-sures had a smaller relationship to the criterion in only 2 cases, and in4 cases had higher relationships. Results with a second, cross-validationsample were comparable. Similarly, with the rainforest approach, thevalidities and cross-validities of each empirical key were significantly re-lated to the criteria, without evidencing excessive shrinkage.
Further, for each criterion, the biodata analogs added incrementalvalidity over and above the Whole Candidate Score, USMA's currentadmissions composite. The rainforest keys made greater contributionsto incremental validity for the field leadership criteria, and, dependingon the sample and cross-validation method, equivalent or greater contri-butions for the scholastic year criteria. Another difference between theapproaches involved the relative contribution of the biodata when boththe Whole Candidate Score and ABLE were included in the regression.The biodata analogs developed to approximate ABLE scales were pri-marily redundant with them, and accounted for additional variance inonly one of the four criteria. By contrast, the rainforest scales providedincremental validity in all cases.
Insofar as the biodata analogs were keyed to maximize their rela-tionship to ABLE, their redundancy with the ABLE scales was both ex-pected and desirable. These results demonstrate that it is possible todevelop biodata measures consisting of objective items that could paral-lel more subjective construct measures, should use of subjective mea-sures be unfeasible. In addition, the quasi-rational approach can in-form about the behavioral correlates of dispositional constructs, a rolepreviously envisioned for biodata (Henry, 1965, p. 14). Conversely, animplication of the higher incremental validities with the rainforest keysis that although these items could be utilized to measure a priori tem-perament constructs, some unique variance attributable to the complex,multi-dimensional components of these behaviors could be lost by us-ing that approach. In situations where both the biodata and tempera-ment measures could be used in a selection battery, clearer distinctionbetween the two types of predictors could yield the best prediction.
Another anticipated benefit of using objective items, reducing vul-nerability to socially desirable responding, was also realized. Four ofthe five individual biodata analogs had significantly smaller correla-tions with social desirability than their ABLE counterparts, and therainforest-keyed scales had even lower correlations. This appears to

MAEL AND HIRSCH 735
corroborate findings that historical, objective, and verifiable items areless amenable to faking (Becker & Colquitt, 1992; McManus & Masztal,1993). Another explanation might be that while the ABLE scales wereitem-keyed, with all options scored on an a priori continuum, the biodatawere option-keyed, an approach shown to have lower social desirability(Kluger, Reilly, & Russell, 1991). However, given that objective itemsinherently lend themselves more to option-keying, the explanations areprobably not independent.Interpretability of Empirically-Keyed Biodata
The most common complaint against empirical keying, non-interpret-ability, seems inappropriate not only to the quasi-rational approach, butalso to the rainforest approach. Multiple keyings of the same itemsagainst similar criteria allowed the emergence of topically informativeitem clusters, and provided a basis for understanding the antecedentsof success in both components of early USMA leadership ratings. Therelationship between the type of behaviors that were consistently pre-dictive and the criteria can be explained from the perspectives of boththe ecology model (Mumford & Owens, 1987; Mumford & Stokes, 1991)and social identity theory (Mael, 1991; Tlimer, 1987). For example, per-sons involved in rugged outdoor activities would generally find those en-deavors rewarding and reinforcing, and would be more likely than oth-ers to excel in military field roles requiring similar activities. Also, aperson involved in those activities would be more likely to identify withothers sharing similar affinities, an identification that would express it-self in comportment and other prototypical components of the ruggedlifestyle. Conversely, those receiving high academic semester leadershipratings demonstrated a greater predilection for academic achievement.It is notable that while this group also had a history of leadership roles, itexpressed itself primarily in structured, elected roles within the school,rather than in roles signifying emergent leadership. Certainly, a smallminority of biodata items that were predictive, such as birth order or sizeof one's hometown, are not easily included in unitary construct scales orbehavioral clusters. Moreover, grouping these items as "background ex-periences" or "childhood demographics," as is sometimes done, is con-ceptually meaningless. On the other hand, items like these often haveextensive theoretical and empirical literatures devoted to their signifi-cance, so that they have the capacity, even in isolation, to be informativeabout the qualities required of those who are successful on a given crite-rion. A single, reliable measure of an objective experience or behaviorcan be a critical indicator of a whole syndrome of behaviors leading to,or fiowing from, that single event.
Comparing the Approaches
There are practical considerations involved in the use of either of

736 PERSONNEL PSYCHOLOGY
these approaches. Because heterogeneous items and empirical keyingare utilized at the initial stage of each approach, larger item and samplepools than might be necessary with a pure rational approach would bedesirable. For the quasi-rational approach, it is necessary to specify thetemperament or attitude predictors to be linked with biodata analogsprior to item generation. Because the temperament items must also beadministered, they actually compete with potential biodata items for in-clusion in an instrument administered under time constraints. Thus, itwould be prudent to locate the most concise, orthogonal, and reliablemeasures for desired constructs. Were one to attempt to develop mutu-
\.ally exclusive biodata analogs, unlike the current effort, an even largerinitial item pool would be needed, in the hope of finding objective, yethomogeneous, items. If the testing environment does not require objec-tive items (Mael, 1991), it should be easier to develop mutually exclu-sive scales. White and Kilcullen (1992) have in fact developed biodataanalogs to ABLE with a rational approach, albeit with inclusion of sub-jective items, that also demonstrated similar validities to their ABLEcounterparts, as well as lower Social Desirability.
The quasi-rational approach is less labor intensive and easier to usein the short term. After initial keying, the scales can be used much like apriori, rational scales, without further keying. However, as Mael (1991)has argued, extended application of the rainforest model should alsoresult in items and item-clusters with known properties and nomologicalnetworks, which optimally could also be used without further keying.
To a certain extent, preference for each method may be a matter oftaste. For the researcher who is most comfortable with preconceivedpsychological constructs, the quasi-rational approach assures the type ofinterpretability to be expected before embarking on testing. Conversely,the clusters and constructs yielded by the rainforest approach often strayfrom trait and dispositional concepts, and can straddle other domainsof psychology, as well as sociology and related social sciences. A sim-ilar digression from traditional categories led Fleishman (1988) to callthe subgrouping methodology of Mumford and Owens (1987), which isanalogous to lifestyle segmentation in market research (Mitchell, 1983;Plummer, 1974), a novel and important trend in personnel selection re-search. Thus, it could be argued that the quasi-rational approach, muchlike the pure rational approach, achieves greater theoretical parsimony.In return, it sacrifices some of the richness of information embedded inthe behaviors and experiences measured by high-quality objective items.It would be possible, however, to utilize the same items in both ways, andthereby gain understanding from multiple perspectives.
In summary, the results suggest two potential methods of utilizingbiodata to predict and understand behavior, while still retaining the less
MAEL AND HIRSCH 737
fakable properties associated with objective biodata. In the current re-search, infonnation from both approaches provided complementary in-sight into the types of cadets who were most successful in their earlyleadership roles. Both approaches could yield even better validities un-der more optimal selection conditions. These would include more spe-cific jobs, which would allow for detailed job analysis and better definedcriteria, and longer testing time, allowing for a larger initial item pool.A larger item pool would also make it possible to compare the quasi-rational and rainforest forms with pure rational and pure dustbowl tech-niques. In addition to following the cadet samples through additionalcriteria, additional research with these approaches, such as widening thescope of constructs utilized and the types of populations sampled, is be-ing conducted. Both approaches should be given consideration for theirpotential role in upgrading the stature and utility of objective biodata.
REFERENCES
Atwater DC. (1980, May). Faking of an empirically keyed biodata questionnaire. Paperpresented at the Annual Meeting ofthe Western Psychological Assoc. Convention.
Becker T, Colquitt A. (1992). Potential versus actual faking of a biodata form: An analysisalong several dimensions of item type, PERSONNEL PSYCHOLOGY, 45,389-406.
Burke WP. (1992). Admissions variables through the class of 1995. Office of InstitutionalResearch (Research Report 92-003). West Point, NY: U.S. Military Academy.
Cascio WF. (1975). Accuracy of verifiable biographical infonnation blank responses. Jour-nal of Applied Psychology, 60, 767-769.
Clifton TC, Kilcullen RN, Reiter-Palmon R, Mumford MD. (1992, August). Comparingdifferent background data scaling procedures using triple cross-validation. Paper pre-sented at the Annual Convention of the American Psychological Association, Wash-ington, DC.
Cohen J, Cohen R (1983). Applied multiple regression/correlation analysis for the behavioralsciences (2nd edition). Hillsdale, NJ: Erlbaum.
Crowne DP, Marlowe D. (1960). The approval motive. New York: Wiley.Dunnette MD. (1962). Personnel management. Annual Review of Psychology. 13,285-313.England GW. (1971). Development and use of weighted application blanks (rev. ed.). Min-
neapolis: University of Minnesota, Industrial Relations Center.Fleishman EA. (1988). Some new frontiers in personnel selection research, PERSONNEL
PSYCHOLOGY, 41. 679-702.
Fleishman EA, Mumford MD, Zaccaro SJ, Levin MY, Korotkin A, Hein MB. (1991).Thxonomic efforts in the description of leader behavior: A synthesis and cognitiveinterpretation. Leadership Quarterly, 2. 245-287.
Glennon JR, Albright LE, Owens WA. (1966). A catalog of life history items. Greensboro,NC: Creativity Research Institute of the Richardson Foundation.
Heniy ER. (1965). Research conference on the use of autobiographical data as psychologicalpredictors. Greensboro, NC: The Richardson Foundation.
Hogan JB, Stokes GS. (1989, April). The influence of socially desirable responding onbiographical data of applicant versus incumbent samples: Implications for predictiveand concurrent research designs. Paper presented at the Fourth Annual Conferenceof the Society for Industrial and Organizational Psychology, Boston, MA.
Hough LM, Eaton NK, Dunnette MD, Kamp JD, McCloy RA. (1990). Criterion-relatedvalidities of personality constructs and the effect of response distortion on thosevalidities. Journal of Applied Psychology, 75.581-595.

738 PERSONNEL PSYCHOLOGY
Kluger AN, Reilly RR, Russell O . (1991). Faking biodata tests: Are option-keyed testsmore resistant? Journal of Applied Psychology, 76,889-896.
Mael FA. (1991). A conceptual rationale for the domain and attributes of biodata items.PERSONNEL PSYCHOLOGY, 44, 763-792.
McManus MA, Masztal JJ. (1993, April). Attributes of biodata: Relationships to validityand socially desirable responding. Paper presented at the Annual Conference of theSociety for Industrial and Organizational Psychology, San Francisco, CA.
Mitchell A. (1983). Nine American lifestyles: Who we are and where we are going. New York:Macmillan.
Mitchell TW, Klimoski RJ. (1982). Is it rational to be empirical? A test of methods forscoring biographical data. Journal of Applied Psychology, 67,411-418.
Mumford MD, Owens WA. (1987). Methodology review: Principles, procedures, andfindings in the application of background data measures. Applied PsychologicalMeasurement, 11,1-31.
Mumford MD, Stokes GS. ( 1991). Developmental determinants of individual action:Theory and practice in the application of background data. In Dunnette MD,Hough LM (Eds.), The handbook of industrial and organizational psychology (2nded., pp. 1-78). Oriando, FL: Consulting Psychologists Press.
Mumford MD, Zaccaro SJ, Harding FD, Fleishman EA, Reiter-Palmon R. (in press).Cognitive and temperament predictors of executive ability: Principles for developingleader capacity (Final Report). Alexandria, VA: U.S. Army Research Institute.
Murphy KR. (1984). Cost-benefit considerations in choosing among cross-validationmethods, PERSONNEL PSYCHOLOGY, J 7,15-22.
Pace LA, Schoenfeldt LF. (1977). Legal concerns in the use of weighted application blanks.PERSONNEL PSYCHOLOGY, 30, 159-166.
Plummer JT. (1974). The concept and application of life style segmentation. Journal ofMarketing, 38,34.
Reilly RR, Chao GT. (1982). Validity and fairness of some alternative employee selectionprocedures, PERSONNEL PSYCHOLOGY, J5,1-62.
Richardson, Bellows, Henry & Co. (1985). Supervisory Profile Record. Washington, DC:Author.
Russell CJ, Kuhnert KW. (1992). New frontiers in management selection systems: Wheremeasurement technologies and theory collide. Leadership Quarterly, 3,109-135.
Russell CJ, Mattson J, Devlin SE, Atwater D. (1990). Predictive validity of biodata itemsgenerated from retrospective life experience essays. Jourrml of Applied Psychology
75,569-580.
Schoenfeldt LF. (1989, August). Biographical data as the new frontier in employee selectionresearch. Address presented at the Annual Meeting of Division 5 of the AmericanPsychological Association, New Orleans, LA.
Shaffer GS, Saunders V, Owens WA. (1986). Additional evidence for the accuracy ofbiographical data: Long-term retest and observer ratings, PERSONNEL PSYCHOLOGY39, 791-809.
Silverhart TA. (1990). Career profile Australia/New Zealand validity report (Tfechnical reportMRR4-1990). Hartford, CT: LIMRA.
Strieker U . (1988, November). Assessing leadership potential at the Naval Academy witha biographical measure. Paper presented at the Annual Meeting of the MilitaryTfesting Association, San Antonio, TX.
TUmer JC. (1987). A self-categorization theory. In lUmer JC (Ed.), Rediscovering thesocial group (pp. 42-67). New York: Basil Blackwell.
White LA, Kilcullen RN. (1992, August). The validity of rational biodata scales. Paper atthe Annual Meeting of the American Psychological Association, Washington, DC.
White LA, Nord RD, Mael FA, Young M. (1993). The Assessment of Background and LifeExperiences (ABLE). In Tl-ent T, Lawrence J (Eds.), Adaptability screening for theservices (pp. 101-162). Washington, DC: Office of the Asst. Secretary for Defense.


![Phenomenology, Empiricism, and Science · 1. Husserl’s Critique of Empiricism “[Empiricism] destroys the possibility of the rational justification of mediate knowledge, and so](https://img.dokumen.tips/doc/110x75/5e82c34a6d2ded2336153c37/phenomenology-empiricism-and-1-husserlas-critique-of-empiricism-aoeempiricism.jpg)