Embed Size (px)
Citation preview

Rainfall in Western South America:
The “traditional El Niño”
versus
“Global ENSO”
C F Ropelewski and L Goddard
IRI
The Earth Institute, Columbia University
(With thanks to Yamina Silva, Instituto Geofisico Del Peru)
The 28th Climate Diagnostics and
Prediction Workshop
Reno NV, 20-23 October 2003

Traditional El Niño versus Global ENSO
El Niño – The maximum in mean annual cycle of sea surface temperature along the west coast of South America i.e. anomalies with respect to the annual mean
ENSO – Defined here as the positive displacement of the mean annual cycle of sea surface temperature in the equatorial Pacific i.e. anomalies wrt the mean annual cycle.


ENSO, El Niño and Climo

ENSO Composite Years
57 –58 (e.g. Jan 57 to Dec 58)
65 - 66
68 – 69
72 – 73
82 – 83
86 – 87
90 – 91
94 – 95
97 – 98
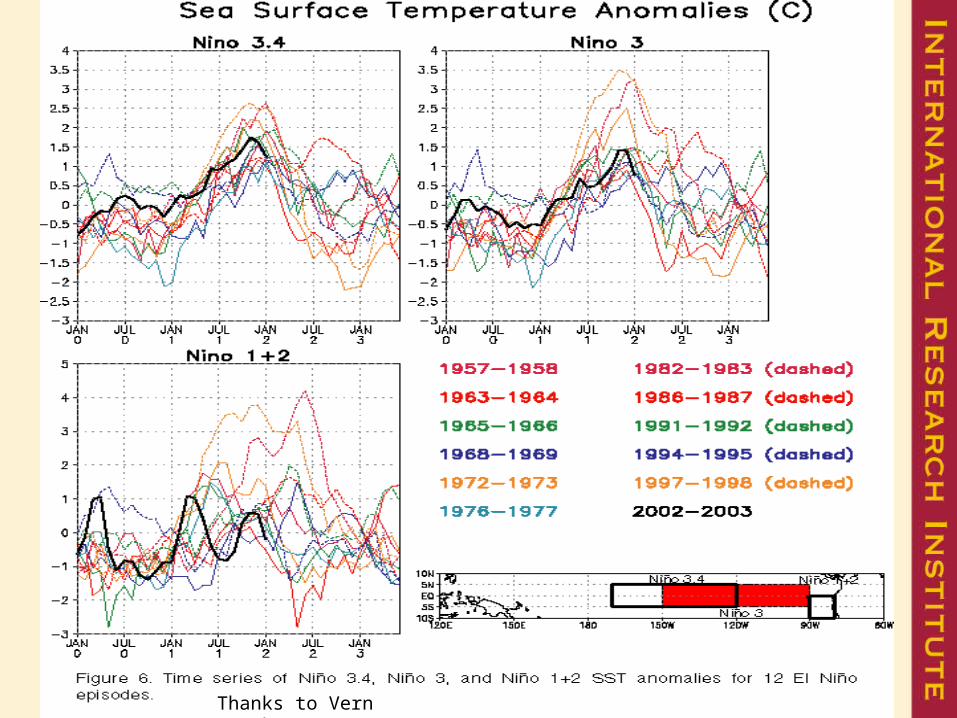
All Nino3 ,3.4, 1+2
Thanks to Vern Kousky

Event-to-Event Variability of SST Anomalies (El Niño)

SST Anomalies (1983-2003)
(Source CPC/NOAA)

Annual Cycle-Precipitation and Temperature(80.75S, 5.25W, New et al 1999)

Sea surface temperature
correlations
with FMA precipitation
in Peru

Correlations Nino1+2
-0.5 – -0.3-0.3 – 0.3 0.3 – 0.5 0.5 – 0.7 0.7 – 1.0
Thanks to YaminaSilva, InstitutoGeofisico Del Peru
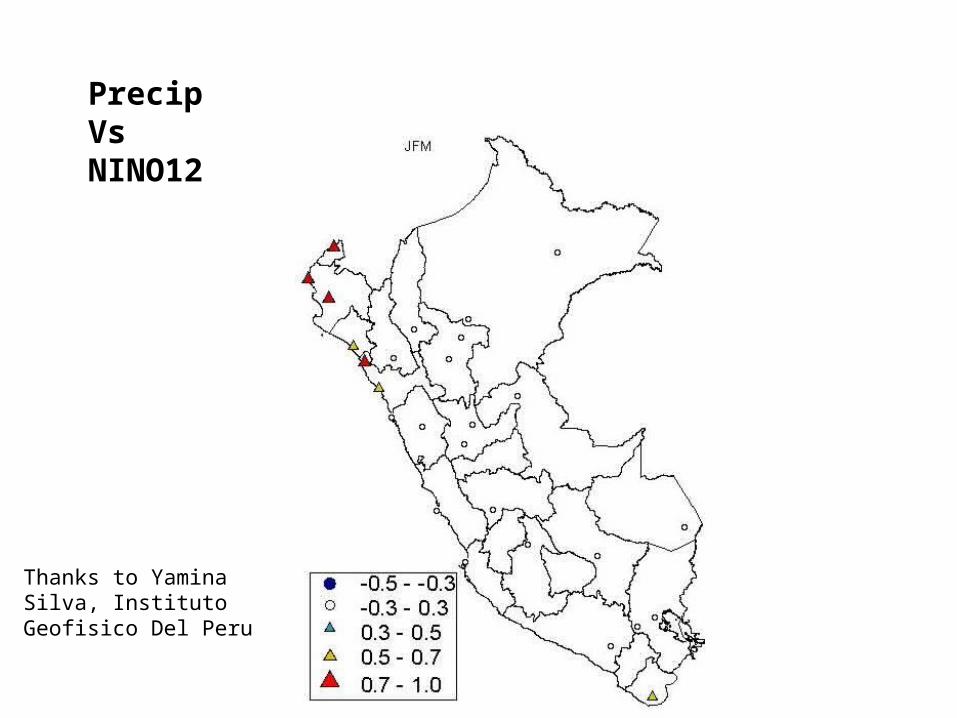
Thanks to YaminaSilva, InstitutoGeofisico Del Peru
PrecipVsNINO12
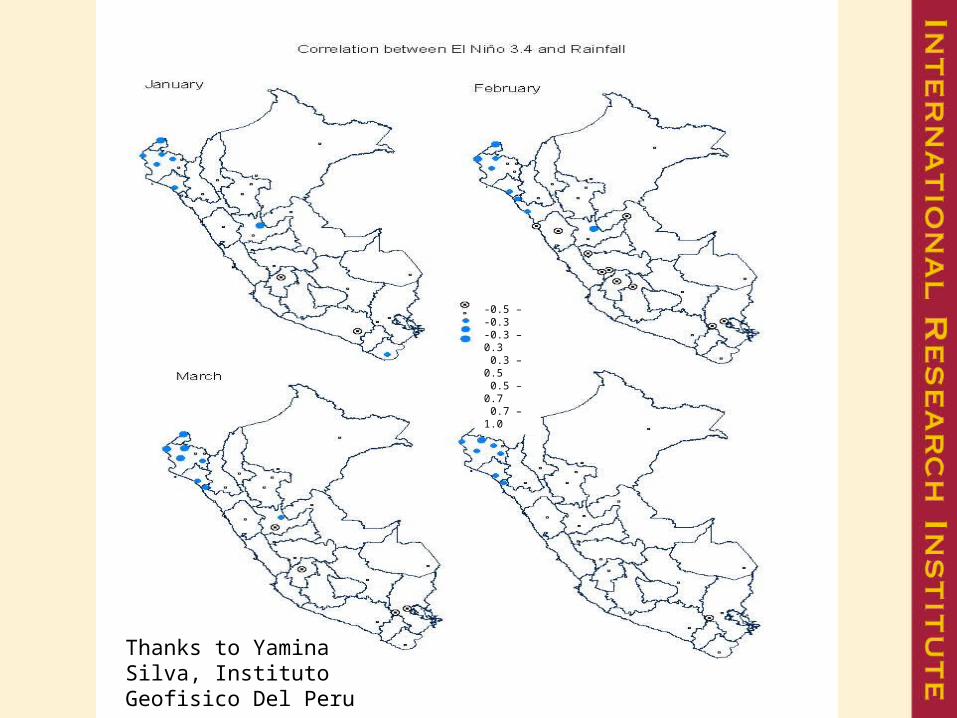
Correlations Nino 3.4
-0.5 – -0.3-0.3 – 0.3 0.3 – 0.5 0.5 – 0.7 0.7 – 1.0
Thanks to YaminaSilva, InstitutoGeofisico Del Peru

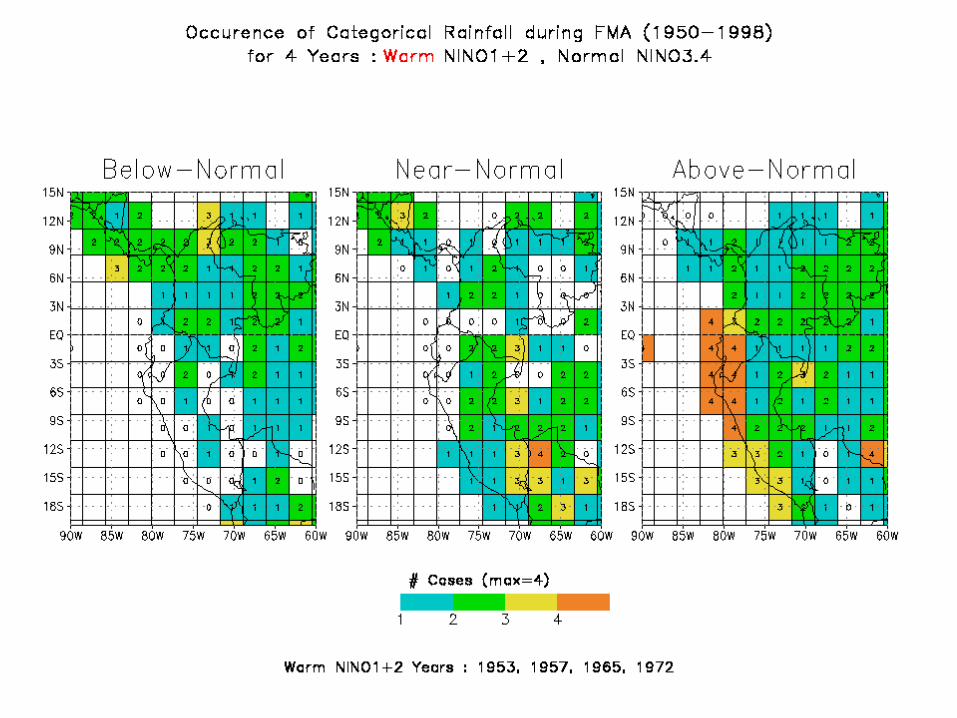
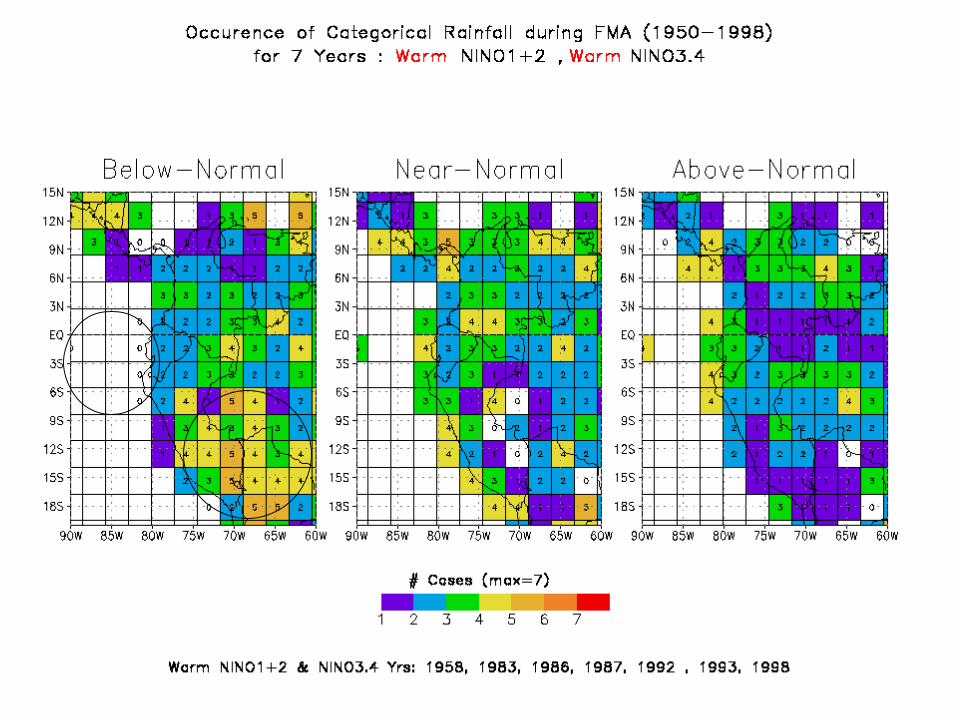
Composite precipitation
in
tercile classes
for western South America
tropics

Occurrence Nino34

Occurrence Nino1+2

FMA Circ CompsMeridional
andVertical WindsMean
(1971-2000)
10S EQ10N
CompositeAnomalyNino1&210 warmest

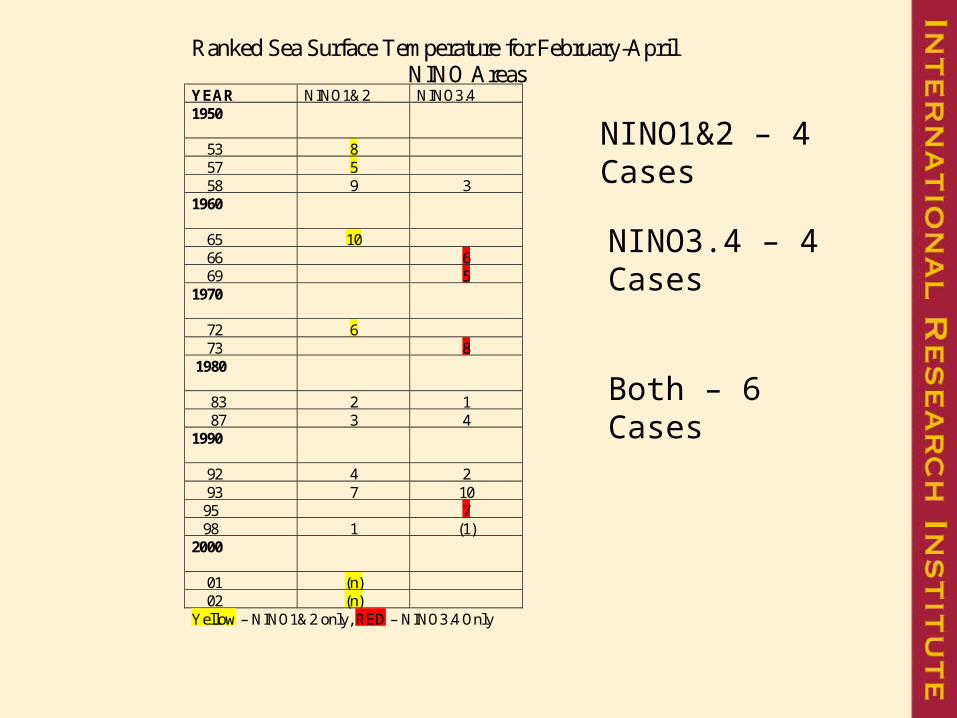
Ranked Sea Surface Temperature for February-April NINO Areas
YEAR NINO1&2 NINO3.4 1950
53 8 57 5 58 9 3 1960
65 10 66 6 69 5 1970
72 6 73 8 1980
83 2 1 87 3 4 1990
92 4 2 93 7 10 95 7 98 1 (1) 2000
01 (n) 02 (n) Yellow – NINO1&2 only, RED – NINO3.4 Only
NINO1&2 – 4 Cases
NINO3.4 – 4 Cases
Both – 6 Cases

NINO1&2WARMMARCH
1953
1957
1965
1972

NINO3.4OnlyMarch
1966
1969
1973
1995

1958
1983
1987
1992
1993
1998
March of years with both warm NINOP1&2 and NINO3.4

Summary• Rainfall in near equatorial regions of Ecuador
and Peru are sensitive to the “local” sst anomalies (NINO1&2 here) in FMA.
• Correlations i.e. teleconnections with central and western Pacific sst anomalies are weaker during the same season.
• Most large “local” FMA sst anomalies occur in conjunction with the larger scale ENSO phenomenon.
• There are some notable exceptions including: 1953, 1957, 1965, 1972 and most recently 2001 and 2002.


Nino 3.4
Thanks to Vern Kousky
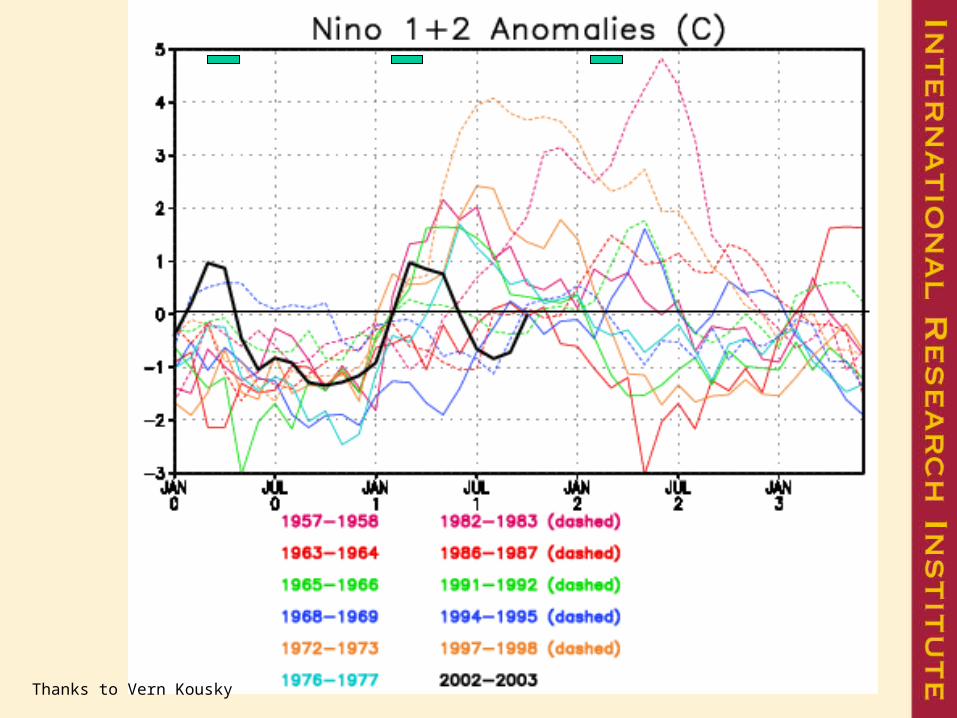
Nino 1+2
Thanks to Vern Kousky

Correlations Nino 4.0
-0.5 – -0.3-0.3 – 0.3 0.3 – 0.5 0.5 – 0.7 0.7 – 1.0
Thanks to YaminaSilva, InstitutoGeofisico Del Peru

Correlations Nino 3
-0.5 – -0.3-0.3 – 0.3 0.3 – 0.5 0.5 – 0.7 0.7 – 1.0

Thanks to YaminaSilva, InstitutoGeofisico Del Peru
January N12PrecipVsNINO12

March N12PrecipVsNINO12
Thanks to YaminaSilva, InstitutoGeofisico Del Peru


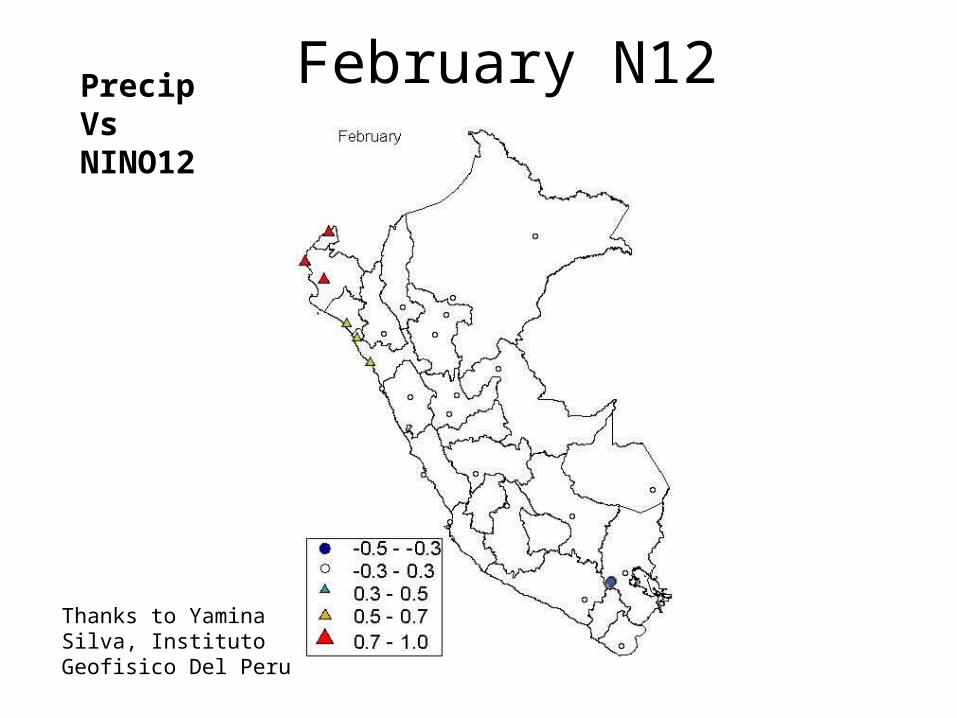
February N12
Thanks to YaminaSilva, InstitutoGeofisico Del Peru
PrecipVsNINO12