Embed Size (px)
Citation preview
1610 | Mol Ecol Resour. 2019;19:1610–1622.wileyonlinelibrary.com/journal/men
1 | INTRODUC TION
The size of an organism's genome greatly affects the cost of se-quencing its genome, which in turn affects the number of organisms for which genomic data is available (Andrews, Good, Miller, Luikart, & Hohenlohe, 2016). Large genomes are caused by numerous fac-tors such as tandem repeats, pseudogenes, paralogs, polyploidy or
a combination of these factors (Guan et al., 2016). Plant genome sizes are highly plastid (Pellicer, Hidalgo, Dodsworth, & Leitch, 2018), ranging from 13.2 Megabase pairs (Mbp) in the genome of Ostreococcus lucimarinus to over 149 Gigabase pairs (Gbp) in the octoploid Paris japonica (Pellicer, Fay, & Leitch, 2010). As a result of whole genome duplication, gymnosperm genomes are generally larger than those found in many angiosperms, ranging from ~8 Gbp
Received: 31 July 2018 | Revised: 8 August 2019 | Accepted: 9 August 2019
DOI: 10.1111/1755-0998.13085
R E S O U R C E A R T I C L E
RADseq as a valuable tool for plants with large genomes—A case study in cycads
James A. R. Clugston1,2 | Gregory J. Kenicer2 | Richard Milne1 | Isaac Overcast3 | Trevor C. Wilson4 | Nathalie S. Nagalingum5
1School of Biological Sciences, The University of Edinburgh, Edinburgh, UK2Royal Botanic Garden Edinburgh, Edinburgh, UK3The Graduate Center of the City University of New York, New York, NY, USA4Royal Botanic Gardens and Domain Trust, Sydney, NSW, Australia5California Academy of Sciences, San Francisco, CA, USA
CorrespondenceJames A. R. Clugston, The University of Edinburgh, School of Biological Sciences, The Kings Building, West Mains Road, Edinburgh, Scotland, EH9 3JN, UK.Email: [email protected]
Nathalie S. Nagalingum, California Academy of Sciences, 55 Music Concourse Dr, San Francisco, CA 94118, USA.Email: [email protected]
Funding informationBiotechnology and Biological Sciences Research Council, Grant/Award Number: 1429569
AbstractFull genome sequencing of organisms with large and complex genomes is intractable and cost ineffective under most research budgets. Cycads (Cycadales) represent one of the oldest lineages of the extant seed plants and, partly due to their age, have incredibly large genomes up to ~60 Gbp. Restriction site-associated DNA sequenc-ing (RADseq) offers an approach to find genome-wide informative markers and has proven to be effective with both model and nonmodel organisms. We tested the application of RADseq using ezRAD across all 10 genera of the Cycadales including an example data set of Cycas calcicola representing 72 samples from natural popula-tions. Using previously available plastid and mitochondrial genomes as references, reads were mapped recovering plastid and mitochondrial genome regions and nu-clear markers for all of the genera. De novo assembly generated up to 138,407 high-depth clusters and up to 1,705 phylogenetically informative loci for the genera, and 4,421 loci for the example assembly of C. calcicola. The number of loci recovered by de novo assembly was lower than previous RADseq studies, yet still sufficient for downstream analysis. However, the number of markers could be increased by relaxing our assembly parameters, especially for the C. calcicola data set. Our results demonstrate the successful application of RADseq across the Cycadales to generate a large number of markers for all genomic compartments, despite the large number of plastids present in a typical plant cell. Our modified protocol was adapted to be applied to cycads and other organisms with large genomes to yield many informative genome-wide markers.
K E Y W O R D S
cycads, illumina sequencing, large genomes, RADseq
| 1611CLUGSTON eT aL.
in Microstrobus to ~72 Gbp in Pinus and Ceratozamia (Roodt et al., 2017; Scott, Stenz, Ingvarsson, & Baum, 2016; Zonneveld, 2012a, 2012b; Zonneveld & Lindstrom, 2016). Typically, as a result of poly-ploidy, the on-average large genome size is caused by an ineffi-ciency of gymnosperms at eliminating repeat amplifications in the genome (Pellicer et al., 2018).
Next generation sequencing (NGS) permits sequencing large stretches of a genome to produce DNA sequence data in the Gbp range at relatively low cost. Full genome sequencing may be the best approach for finding informative markers that assist investigating the evolutionary history of a species (Andrews et al., 2016). However, large and complex genomes present problems of cost for existing NGS approaches (Alexeyenko et al., 2014). Further issues include generating enough repeat reads to account for over-representation of highly repeated elements in the genome (Catchen et al., 2017). Additionally, de novo assembly of larger genomes becomes problem-atic because of repeated elements, making effective repeatability of an assembly difficult (Meyers, Scalabrin, & Morgante, 2004).
Restriction site-associated DNA sequencing (RADseq), uses restriction enzymes to reduce the proportion of the genome se-quenced by cutting DNA into smaller fragments, and a subset of these fragments (typically between 200 and 600 bp) are then se-lected for sequencing (Davey & Blaxter, 2010). Thus, RADseq allows the sequencing of a reduced representation of the genome yet still at a deep level of sequence coverage, especially near specific re-striction sites; therefore, only a portion of the genome is sequenced (Andrews et al., 2016). Compared to many NGS methods such as shotgun and whole genome sequencing, RADseq is considered quick and economical under most research budgets (Peterson, Weber, Kay, Fisher, & Hoekstra, 2012; Toonen et al., 2013).
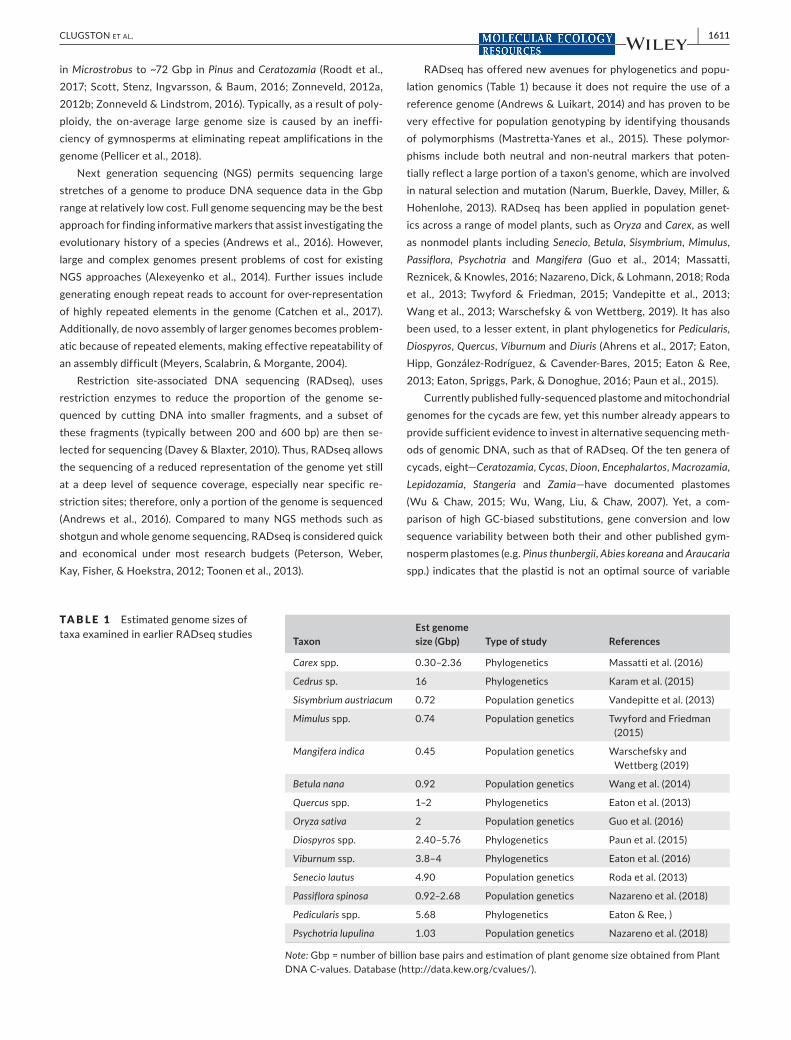
RADseq has offered new avenues for phylogenetics and popu-lation genomics (Table 1) because it does not require the use of a reference genome (Andrews & Luikart, 2014) and has proven to be very effective for population genotyping by identifying thousands of polymorphisms (Mastretta-Yanes et al., 2015). These polymor-phisms include both neutral and non-neutral markers that poten-tially reflect a large portion of a taxon's genome, which are involved in natural selection and mutation (Narum, Buerkle, Davey, Miller, & Hohenlohe, 2013). RADseq has been applied in population genet-ics across a range of model plants, such as Oryza and Carex, as well as nonmodel plants including Senecio, Betula, Sisymbrium, Mimulus, Passiflora, Psychotria and Mangifera (Guo et al., 2014; Massatti, Reznicek, & Knowles, 2016; Nazareno, Dick, & Lohmann, 2018; Roda et al., 2013; Twyford & Friedman, 2015; Vandepitte et al., 2013; Wang et al., 2013; Warschefsky & von Wettberg, 2019). It has also been used, to a lesser extent, in plant phylogenetics for Pedicularis, Diospyros, Quercus, Viburnum and Diuris (Ahrens et al., 2017; Eaton, Hipp, González-Rodríguez, & Cavender-Bares, 2015; Eaton & Ree, 2013; Eaton, Spriggs, Park, & Donoghue, 2016; Paun et al., 2015).
Currently published fully-sequenced plastome and mitochondrial genomes for the cycads are few, yet this number already appears to provide sufficient evidence to invest in alternative sequencing meth-ods of genomic DNA, such as that of RADseq. Of the ten genera of cycads, eight—Ceratozamia, Cycas, Dioon, Encephalartos, Macrozamia, Lepidozamia, Stangeria and Zamia—have documented plastomes (Wu & Chaw, 2015; Wu, Wang, Liu, & Chaw, 2007). Yet, a com-parison of high GC-biased substitutions, gene conversion and low sequence variability between both their and other published gym-nosperm plastomes (e.g. Pinus thunbergii, Abies koreana and Araucaria spp.) indicates that the plastid is not an optimal source of variable
TaxonEst genome size (Gbp) Type of study References
Carex spp. 0.30–2.36 Phylogenetics Massatti et al. (2016)
Cedrus sp. 16 Phylogenetics Karam et al. (2015)
Sisymbrium austriacum 0.72 Population genetics Vandepitte et al. (2013)
Mimulus spp. 0.74 Population genetics Twyford and Friedman (2015)
Mangifera indica 0.45 Population genetics Warschefsky and Wettberg (2019)
Betula nana 0.92 Population genetics Wang et al. (2014)
Quercus spp. 1–2 Phylogenetics Eaton et al. (2013)
Oryza sativa 2 Population genetics Guo et al. (2016)
Diospyros spp. 2.40–5.76 Phylogenetics Paun et al. (2015)
Viburnum ssp. 3.8–4 Phylogenetics Eaton et al. (2016)
Senecio lautus 4.90 Population genetics Roda et al. (2013)
Passiflora spinosa 0.92–2.68 Population genetics Nazareno et al. (2018)
Pedicularis spp. 5.68 Phylogenetics Eaton & Ree, )
Psychotria lupulina 1.03 Population genetics Nazareno et al. (2018)
Note: Gbp = number of billion base pairs and estimation of plant genome size obtained from Plant DNA C-values. Database (http://data.kew.org/cvalu es/).
TA B L E 1 Estimated genome sizes of taxa examined in earlier RADseq studies
1612 | CLUGSTON eT aL.
markers that are useful for population genetics or phylogenetic stud-ies (Jansen, Saski, Lee, Hansen, & Daniell, 2011; Ruhsam et al., 2015; Tsudzuki et al., 1992; Wu et al., 2007; Yang et al., 2016; Yi et al., 2015; Zhou, Zhao, Chen, Meng, & Zhao, 2016). As of yet, the only full mitochondrial genome that has been sequenced is that of Cycas (Wu et al., 2007). Compared to published mitochondrial genomes of the closest allies of Cycads (Ginkgo biloba and Welwitschia mirabilis), only a few number unique and polymorphic sites were found (Guo et al., 2016), which supports that this genomic compartment is equally uninformative as the plastome.
In order to test the effectiveness of RADseq for taxa with large genomes, we used a RADseq technique across a cohort of samples representing ten known cycad genera (Cycadales). We chose cycads because they have particularly large genomes, ranging from ~25 to 30 Gbp in Cycas L. to ~72 Gbp in Ceratozamia (Zonneveld, 2012a), which appears to be the result of many tandem repeats, pseudogenes, pa-ralogs and possibly whole genome duplication (Roodt et al., 2017). In addition to having on-average larger genomes, we also chose cy-cads because there is need for better methods to find more data-rich sequences for the purposes of systematic and population genomic studies. Therefore, forming part of our larger conservation genom-ics study targeting cycads, we developed a RADseq protocol that is based on a modification of the ezRAD protocol (Toonen et al., 2013). ezRAD differs from other RADseq approaches as it uses a commercially available library preparation kit and does not require specific restriction enzymes to ligate adapters to cut sites (Andrews et al., 2016). Another advantage of ezRAD when compared to other RADseq protocols is that it requires lower initial setup preparation and costs (Andrews et al., 2014).
The aim of the larger project is to understand the evolution and genetic diversity of wild Cycas populations. As a proof of concept, we tested our RADseq approach across all cycad genera. This study aimed to (a) demonstrate that RADseq can be successfully applied to organisms with large, repetitive genomes, such as cycads, (b) generate a sufficient number of loci using de novo assembly for phylogenetic and population genetic analyses and (c) develop an ef-fective method that can be used for genome skimming. Ultimately, our goal was to demonstrate the effectiveness of RADseq across large and complex genomes to allow others to follow this protocol.
2 | MATERIAL S AND METHODS
2.1 | Sampling strategy
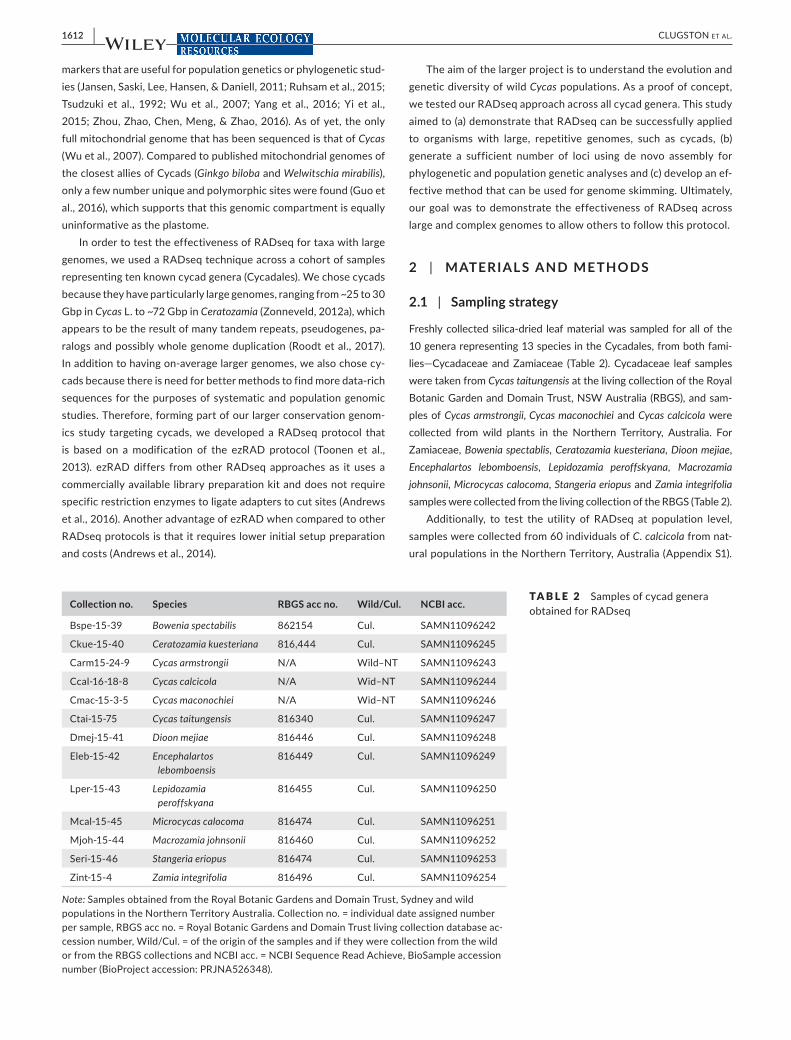
Freshly collected silica-dried leaf material was sampled for all of the 10 genera representing 13 species in the Cycadales, from both fami-lies—Cycadaceae and Zamiaceae (Table 2). Cycadaceae leaf samples were taken from Cycas taitungensis at the living collection of the Royal Botanic Garden and Domain Trust, NSW Australia (RBGS), and sam-ples of Cycas armstrongii, Cycas maconochiei and Cycas calcicola were collected from wild plants in the Northern Territory, Australia. For Zamiaceae, Bowenia spectablis, Ceratozamia kuesteriana, Dioon mejiae, Encephalartos lebomboensis, Lepidozamia peroffskyana, Macrozamia johnsonii, Microcycas calocoma, Stangeria eriopus and Zamia integrifolia samples were collected from the living collection of the RBGS (Table 2).
Additionally, to test the utility of RADseq at population level, samples were collected from 60 individuals of C. calcicola from nat-ural populations in the Northern Territory, Australia (Appendix S1).
Collection no. Species RBGS acc no. Wild/Cul. NCBI acc.
Bspe-15-39 Bowenia spectabilis 862154 Cul. SAMN11096242
Ckue-15-40 Ceratozamia kuesteriana 816,444 Cul. SAMN11096245
Carm15-24-9 Cycas armstrongii N/A Wild–NT SAMN11096243
Ccal-16-18-8 Cycas calcicola N/A Wid–NT SAMN11096244
Cmac-15-3-5 Cycas maconochiei N/A Wid–NT SAMN11096246
Ctai-15-75 Cycas taitungensis 816340 Cul. SAMN11096247
Dmej-15-41 Dioon mejiae 816446 Cul. SAMN11096248
Eleb-15-42 Encephalartos lebomboensis
816449 Cul. SAMN11096249
Lper-15-43 Lepidozamia peroffskyana
816455 Cul. SAMN11096250
Mcal-15-45 Microcycas calocoma 816474 Cul. SAMN11096251
Mjoh-15-44 Macrozamia johnsonii 816460 Cul. SAMN11096252
Seri-15-46 Stangeria eriopus 816474 Cul. SAMN11096253
Zint-15-4 Zamia integrifolia 816496 Cul. SAMN11096254
Note: Samples obtained from the Royal Botanic Gardens and Domain Trust, Sydney and wild populations in the Northern Territory Australia. Collection no. = individual date assigned number per sample, RBGS acc no. = Royal Botanic Gardens and Domain Trust living collection database ac-cession number, Wild/Cul. = of the origin of the samples and if they were collection from the wild or from the RBGS collections and NCBI acc. = NCBI Sequence Read Achieve, BioSample accession number (BioProject accession: PRJNA526348).
TA B L E 2 Samples of cycad genera obtained for RADseq
| 1613CLUGSTON eT aL.
The samples included three populations from the Litchfield National Park and three populations in the Katherine region—each popula-tion consisted of 10 individuals of varying ages. In addition, a fur-ther 13 samples were sourced from cultivated ex-situ collections of George Brown Darwin Botanic Garden (Darwin, NT, Australia) and Montgomery Botanical Centre (Miami, FL, USA).
2.2 | DNA extraction and quantification
Approximately, 0.05 g of silica-dried leaf samples were ground to a fine powder using a TissueLyser (Qiagen Inc.). When present in large amounts, trichomes were removed to improve extraction quality (specifically in C. calcicola). High molecular weight genomic DNA was extracted using a DNeasy Plant DNA Extraction Mini Kit (3.0 BR DNA assay; Qiagen). Genomic DNA was inspected using a 2% agarose gel to check for the presence of DNA and impurities. A Qubit fluorometer (3.0 BR DNA assay; Invitrogen, Life Technologies) was then used to determine the quantity (µg/ml) of the extracted DNA for each sample. The target concentration for samples was (≥) 17 µg/ml; samples that yielded less than this amount was either re-extracted or concentrated using a 1:1 ratio of Agencourt AMPure XP magnetic purification beads to sample volume (Beckman Coulter, Inc) by combining multiple extractions (For more detailed laboratory methods, please see supplementary data Appendix S2).
2.3 | DNA normalization and double digest reaction
First, genomic DNA was normalized to a concentration of 500 ng in 42 µl total volume (0.01 µg/ml) using a QIAgility liquid handling robot (Qiagen Inc.). Second, using the QIAgility, 5 µl of NEB 10x CutSmart buffer and 1 µl of bovine serum albumin (to help stabilize the enzyme digestion) were added to each well and mixed briefly for 5 s using a plate mixer (although these steps were performed using a liquid handling robot, they can be performed manually). This mix was stored at 4°C for a minimum of 5 hr—our tests showed that this helps to reduce the effect of DNA methylation, improving the cutting ac-tion of the restriction enzymes. Next, double digest reactions were set up using 1 µl of each EcoR1-HF and Mse1 restriction enzymes, mixed by pipetting manually. Reactions were run in a thermocycler for 3 hr at 37°C with a final 20 min deactivation step at 65°C. Using 2% agarose gel, samples were checked for a smear to indicate the quality of digestion. Lastly, double digest reactions were cleaned using 1.8:1.0 ratio of AMPure XP beads to sample (90 µl of AMPure XP beads to 50 µl of digested DNA) and quantified using a Qubit high sensitivity kit (3.0 HS DNA assay; Invitrogen, Life Technologies).
2.4 | Library preparation
RADseq libraries were prepared following the ezRAD protocol (Toonen et al., 2013) in which we tested two different Illumina (Illumina Inc.) library preparation kits: firstly, an Illumina TruSeq PCR-Free high throughput (HT) dual index kit, and secondly, an Illumina TruSeq nano HT dual index kit (PCR-based, FC-121-4003). Our initial
aim was to use the PCR-Free kit to help reduce the probability of PCR amplification bias. However, after multiple attempts the PCR-Free kit resulted in poor final yields when quantified using qPCR, and after multiple troubleshooting steps, it was deemed unfit for our target group (cycads). However, the Illumina TruSeq nano kit proved to be effective when the input of genomic DNA was increased by 5× the recommended input, i.e. from 100 to 500 ng, due to the amount of DNA, which is lost during clean-up and size selection. We fol-lowed the ezRAD protocol v3 using half of the recommended vol-umes of an Illumina TruSeq kit to save costs (Toonen et al., 2013).
Several quality control checks were carried out during library preparation on a select number of samples (16–24 samples) using a high performance LabChip and a Qubit fluorometer; more specif-ically, DNA size and quantity (µg/ml) were checked after digestion and after size selection. During the final step of library preparation, we modified the ezRAD protocol in the final bead clean, using a 0.8:1 ratio of AMPure XP beads to sample for the removal of excess adapt-ers observed using a LabChip. Final Illumina libraries were validated using a LabChip, cleaned using a 0.9:1 ratio of AMPure XP beads to sample, and quantified using a Qubit high sensitivity kit (3.0 HS DNA assay; Invitrogen, Life Technologies). Final libraries were normalized to 10 nM and pooled for sequencing. For more detailed laboratory methods (Appendix S1).
2.5 | Sequencing
We aimed to capture around 1 gigabyte (Gb) of sequence data per sample (in a run of 95 libraries) to account for over-representation of the plastid genome and to capture as much of the nuclear genome as possible. Genomic sequencing was carried out using an Illumina NextSeq 500 with 150 bp paired-end HT on a single flow cell. The NextSeq 500 HT run can capture up to 120 Gb of sequencing data, thereby allowing for our sequencing target of one Gb per sample. The sequencing run was also spiked with 20% PhiX sequencing con-trol V3 (Illumina) to account for low sequence diversity caused by the identical enzymatic digestion cut sites in the ezRAD protocol.
2.6 | Bioinformatics
2.6.1 | Quality control and filtering of sequence reads
The NextSeq 500 generated four fastq files for forward and reverse reads (eight files per sample). The four forward fastq files were concat-enated into a single forward fastq file and similarly a single reverse file was created, as required for the downstream RADseq assembly. The concatenated forward and reverse fastq files were screened for qual-ity using PRINSEQ v0.20.4 (Schmieder & Edwards, 2011). PRINSEQ allowed the detection of falloff in read quality for a range of samples from each population. The reads were trimmed using Trimmomatic 0.36 (Bolger, Lohse, & Usadel, 2014) using the following settings: (a) the Illumina clip function was used to remove adapters, (b) the first six bases were cropped from the start of all paired-end reads, (c) all reads
1614 | CLUGSTON eT aL.
TAB
LE 3
Re
sults
of m
appi
ng R
AD
seq
read
s ag
ains
t ref
eren
ce p
last
omes
RA
Dse
q re
ads
Refe
renc
e pl
asto
mes
Spec
ies
Num
ber o
f PE
read
s
No.
read
s m
appe
d to
re
fere
nce
% re
ads
map
ped
to
refe
renc
eAv
erag
e re
ad
dept
hM
ax. r
ead
dept
hLe
ngth
of
cons
ensu
sRe
fere
nce
cove
red
(%)
Spec
ies
Gen
Bank
acc
. no
.Le
ngth
(bp)
Bow
enia
spec
tabi
lis2,
245,
179
122,
695
5.46
81.6
581
315
8,28
596
B. se
rrul
ata
NC
_026
036
165,
695
Cera
toza
mia
ku
este
riana
5,94
1,11
864
,052
1.07
42.2
584
614
9,65
989
C. h
ildae
LC04
9068
165,
733
Cyca
s arm
stro
ngii
2,36
7,87
118
9,82
98.
0113
1.32
908
159,
061
97Cy
cas
taitu
ngen
sisA
P009
339
163,
403
Cyca
s cal
cico
la2,
373,
959
63,6
512.
6842
.93
365
157,
215
96C.
taitu
ngen
sisA
P009
339
163,
403
Cyca
s mac
onoc
hiei
2,57
1,32
911
2,18
94.
3677
.67
552
153,
610
94C.
taitu
ngen
sisA
P009
339
163,
403
Cyca
s tai
tung
ensis
1,97
2,58
514
0,53
57.
1294
.43
802
147,
868
90C.
taitu
ngen
sisA
P009
339
163,
403
Dio
on m
ejia
e2,
061,
518
37,4
371.
826
.02
342
148,
002
92D
. spi
nulo
sum
LC04
9070
161,
815
Ence
phal
arto
s le
bom
boen
sis2,
026,
350
16,2
920.
8010
.74
134
148,
986
90En
ceph
alar
tos
lehm
anni
iLC
0493
3616
5,82
2
Mac
roza
mia
john
soni
i6,
729,
621
59,8
990.
8967
.59
1,46
015
8,56
395
Mac
roza
mia
m
ount
perr
iens
isLC
0490
6916
6,34
1
Lepi
doza
mia
pe
roff
skya
na3,
799,
154
221,
486
5.82
40.5
963
815
2,95
395
Lepi
doza
mia
pe
roff
skya
naLC
0492
0716
5,93
9
Stan
geria
erio
pus
2,05
0,79
011
4,25
15.
5777
.01
771
158,
135
97St
ange
ria
erio
pus
LC04
9067
163,
671
Zam
ia in
tegr
ifolia
2,60
0,74
653
,004
2.03
35.2
323
149,
292
91Za
mia
fu
rfur
acea
LC04
0885
164,
953
Not
e: R
AD
seq
read
s fr
om s
even
cyc
ad g
ener
a an
d fo
ur C
ycas
spe
cies
wer
e m
appe
d ag
ains
t the
pla
stom
e of
the
mos
t clo
sely
rela
ted,
ava
ilabl
e sp
ecie
s. P
E =
paire
d en
d; G
bp =
num
ber b
illio
n ba
se p
airs
; Re
fere
nce
Gen
Bank
acc
. no.
= th
e re
fere
nce
num
ber o
f a u
ser s
ubm
itted
to th
e N
CBI
Gen
kBan
k on
line
data
base
htt
ps ://
ww
w.n
cbi.n
lm.n
ih.g
ov/g
enba
nk/.
% o
f rea
ds m
appe
d to
refe
renc
e =
indi
cate
s th
e pe
rcen
tage
of r
eads
map
ped
agai
nst t
he to
tal n
umbe
r of r
eads
; Ave
rage
read
dep
th =
the
aver
age
num
ber o
f rea
ds fo
rmin
g a
clus
ter o
n th
e m
appe
d re
fere
nce,
Max
. rea
d de
pth
= th
e m
axim
um d
epth
of
read
s as
sem
bled
into
clu
ster
s, L
engt
h of
con
sens
us =
the
leng
th o
f con
sens
us fo
rmed
from
the
map
ped
read
s an
d Re
fere
nce
cove
red
= pe
rcen
tage
of t
he re
fere
nce
plas
tom
e co
vere
d fr
om th
e re
ads
map
ped.
| 1615CLUGSTON eT aL.
were cropped to 120 bp in length due to lower quality ends (observed using PRINSEQ), and a sliding window was also used to delete bases with a PhredQ score less than 20 with a sliding window of four and (d) all reads less than 50 bp were discarded, and only paired reads were retained to improve merging of reads during clustering.
2.7 | Assembly of RADseq data for cycad genera
De novo assembly of the paired-end reads was performed using ipyrad 0.5.13 (https ://github.com/deren eaton/ ipyrad; Eaton & Overcast, 2014) on a high-performance cluster based at the Royal Botanic Garden Edinburgh using seven nodes, each with 12 cores and 128 Gb of RAM, totalling 84 cores and 896 Gb of RAM, running for 21 days. In ipyrad, all parameters were set to default, except for the following: data type was set to ‘pairgbs’ (most closely matches ezRAD), bases with a PhredQ score less than 30 were converted to 'N’ and reads with 15 or more uncalled bases were discarded. Reads were further filtered for adapter sequences and trimmed, and reads were discarded if they were less than 40 bp in length. The maxi-mum number of uncalled bases in consensus sequences was set to ten for forward and reserve reads. The maximum heterozygotes in consensus sequences were set at eight for both forward and reverse sequences, and the minimum number of samples per locus for out-put files was set to 4.
Data assembly followed the general ipyrad workflow. Reads were more stringently filtered for presence of adapters (after ini-tial trimming and filtering earlier in Trimmomatic). Next, clusters were identified within samples and consensus base calls were made. Finally, loci were aligned across all of the samples (four species of Cycas, and one species each of the nine other cycad genera) and out-put files were generated, after applying filters as specified in our pa-rameter settings. These settings also included the minimum samples per locus; for example, a generated site is discarded unless it meets the requirement that it is present in a minimum number of samples.
2.8 | Assembly from population data of C. calcicola
To further demonstrate the utility of our protocol, we carried out de novo assembly for 72 individuals of C. calcicola (one sample failed during sequencing). The minimum number of samples per locus was set to 43 (as opposed to 4 for the genus level assembly, above), so that each site would be present across a minimum of ~60% of sam-ples, to reduce missing data.
2.9 | Mapping of reads to published references
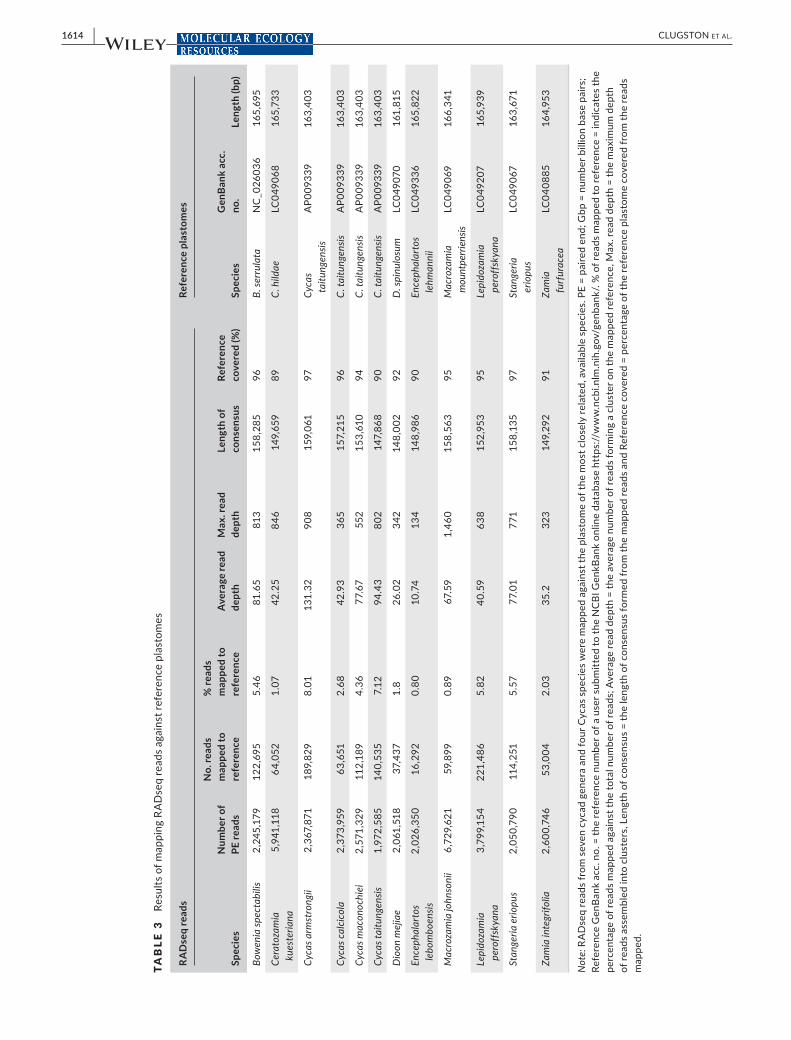
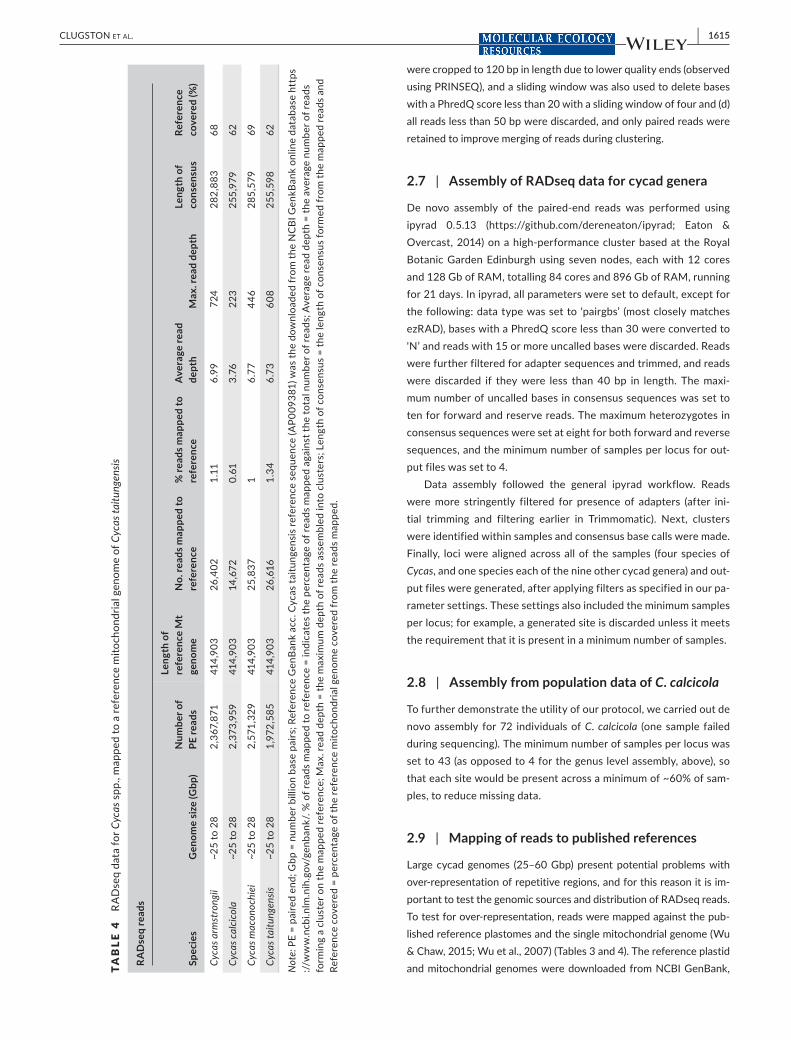
Large cycad genomes (25–60 Gbp) present potential problems with over-representation of repetitive regions, and for this reason it is im-portant to test the genomic sources and distribution of RADseq reads. To test for over-representation, reads were mapped against the pub-lished reference plastomes and the single mitochondrial genome (Wu & Chaw, 2015; Wu et al., 2007) (Tables 3 and 4). The reference plastid and mitochondrial genomes were downloaded from NCBI GenBank, TA
BLE
4
RA
Dse
q da
ta fo
r Cyc
as s
pp.,
map
ped
to a
refe
renc
e m
itoch
ondr
ial g
enom
e of
Cyc
as ta
itung
ensis
RA
Dse
q re
ads
Spec
ies
Gen
ome
size
(Gbp
)N
umbe
r of
PE re
ads
Leng
th o
f re
fere
nce
Mt
geno
me
No.
read
s map
ped
to
refe
renc
e%
read
s map
ped
to
refe
renc
eAv
erag
e re
ad
dept
hM
ax. r
ead
dept
hLe
ngth
of
cons
ensu
sRe
fere
nce
cove
red
(%)
Cyca
s arm
stro
ngii
~25
to 2
82,
367,
871
414,
903
26,4
021.
116.
9972
428
2,88
368
Cyca
s cal
cico
la~2
5 to
28
2,37
3,95
941
4,90
314
,672
0.61
3.76
223
255,
979
62
Cyca
s mac
onoc
hiei
~25
to 2
82,
571,
329
414,
903
25,8
371
6.77
446
285,
579
69
Cyca
s tai
tung
ensis
~25
to 2
81,
972,
585
414,
903
26,6
161.
346.
7360
825
5,59
862
Not
e: P
E =
paire
d en
d; G
bp =
num
ber b
illio
n ba
se p
airs
; Ref
eren
ce G
enBa
nk a
cc. C
ycas
taitu
ngen
sis
refe
renc
e se
quen
ce (A
P009
381)
was
the
dow
nloa
ded
from
the
NC
BI G
enkB
ank
onlin
e da
taba
se h
ttps
://
ww
w.n
cbi.n
lm.n
ih.g
ov/g
enba
nk/.
% o
f rea
ds m
appe
d to
refe
renc
e =
indi
cate
s th
e pe
rcen
tage
of r
eads
map
ped
agai
nst t
he to
tal n
umbe
r of r
eads
; Ave
rage
read
dep
th =
the
aver
age
num
ber o
f rea
ds
form
ing
a cl
uste
r on
the
map
ped
refe
renc
e; M
ax. r
ead
dept
h =
the
max
imum
dep
th o
f rea
ds a
ssem
bled
into
clu
ster
s; L
engt
h of
con
sens
us =
the
leng
th o
f con
sens
us fo
rmed
from
the
map
ped
read
s an
d Re
fere
nce
cove
red
= pe
rcen
tage
of t
he re
fere
nce
mito
chon
dria
l gen
ome
cove
red
from
the
read
s m
appe
d.
1616 | CLUGSTON eT aL.
TAB
LE 5
O
utpu
ts fr
om d
e no
vo a
ssem
bly
of R
AD
seq
data
Spec
ies a
nd g
enom
e si
zeFi
lterin
g of
read
sO
utpu
ts fr
om ip
yrad
Spec
ies
Gen
ome
size
(Gbp
)N
umbe
r of P
E re
ads
Read
s pas
sed
QC
% R
eads
pas
sed
QC
Tota
l pai
red
read
s m
erge
dN
o. c
lust
ers
No.
clu
ster
s hi
‐dep
thN
o. o
f loc
i
Bow
enia
spec
tabl
is~4
23,
217,
808
2,24
5,17
969
.77
2,24
5,17
91,
303,
450
37,5
2331
6
Cera
toza
mia
kue
ster
iana
~63
8,55
8,02
25,
941,
118
69.4
25,
941,
118
3,36
5,72
412
5,89
523
3
Cyca
s arm
stro
ngii
~25
to 2
83.
210,
918
2,36
7,87
174
.74
2,36
7,87
11,
319,
958
41,7
651,
697
Cyca
s cal
cico
la~2
5 to
28
3,12
3,68
32,
373,
959
75.9
92,
373,
959
1,32
3,28
443
,834
1,64
1
Cyca
s mac
onoc
hiei
~25
to 2
83,
601,
176
2,57
1,32
971
.40
2,57
1,32
91,
391,
947
47,5
621,
694
Cyca
s tai
tung
ensis
~25
to 2
82,
905,
407
1,97
2,58
567
.89
1,97
2,58
51,
098,
674
32,8
161,
705
Dio
on m
ejia
e~4
8 to
50
2,79
5,36
62,
062,
518
73.7
82,
062,
518
1,11
8,71
639
,785
201
Ence
phal
arto
s leb
ombo
ensis
~54
to 5
83,
075,
899
2,02
6,35
065
.88
2,02
6,35
01,
127,
824
39,3
3221
5
Mac
roza
mia
john
soni
i~5
49,
895,
138
6,72
9,62
168
6,72
9,62
13,
090,
462
138,
407
362
Mic
rocy
cas c
aloc
oma
~41
3,62
2,71
92,
602,
759
71.8
42,
602,
759
1,74
1,34
436
,641
125
Lepi
doza
mia
per
offs
kyan
a~5
55,
519,
262
3,79
9,15
468
.83
3,79
9,15
41,
888,
907
75,4
0333
7
Stan
geria
erio
pus
~38
3,05
8,56
32,
050,
790
67.0
52,
050,
790
1,25
2,11
932
,114
200
Zam
ia in
tegr
ifolia
~38
3,65
3,98
72,
600,
746
71.1
82,
600,
746
1,51
8,30
241
,031
192
Not
e: Q
C =
qual
ity c
ontr
ol o
f rea
ds; G
bp =
num
ber b
illio
n ba
se p
airs
; Tot
al p
aire
d re
ads
mer
ged
= nu
mbe
r of p
aire
d-en
d re
ads
mer
ged
to fo
rm a
con
sens
us re
ad; N
o. c
lust
ers
= nu
mbe
r of m
atch
ing
read
s gr
eate
r tha
n on
e fo
rmin
g a
clus
ter;
No.
clu
ster
s hi
-dep
th =
num
ber o
f clu
ster
s w
ith 6
or m
ore
read
s us
ed fo
r maj
ority
rule
bas
e ca
lling
, No.
of l
oci =
the
tota
l num
ber o
f loc
i rem
oved
per
sam
ple.
Gen
ome
size
s es
timat
ions
obt
aine
d fr
om Z
onne
veld
(201
2b).
| 1617CLUGSTON eT aL.
and the filtered paired-end reads were mapped to these references using CLC Genomics Workbench 11.0 (CLC Genomics, 2019; Qiagen Inc.) using default parameters: for read alignment mismatch costs = 2, intersection and deletion cost = 3, length fraction = 0.5, similarity frac-tion = 0.8 and auto detection of paired distances was allowed.
2.10 | Phylogenetic analysis of C. calcicola populations
The resulting RADseq sequence data provide the first opportunity to investigate the infraspecific relationships between natural popula-tions of C. calcicola. Furthermore, this approach can be used to help demonstrate the effectiveness of RADseq in differentiating natural populations. Phylogenetic reconstruction of C. calcicola populations was completed using SVDquartet plug-in for PAUP* version 4.0a158 (Swofford, 2003) because of its robust approach in analysing short gene sequences from RADseq data (Liu, Yu, Edwards, 2010; Mirarab et al., 2014). Phylogenetic trees were estimated from the concatenated gene sequence alignments using SVDquartets analysis. Settings in-cluded exhaustive quartet sampling, 100,000 bootstrap replicates and the multispecies coalescent tree model. We examined results of all analyses using at least three independent runs for multispecies coales-cent analysis by allocating samples to their respective populations. The three separate populations are at Litchfield National Park (including Tolmer Falls sites), Daly River, Katherine CDU and Spirit Hills.
3 | RESULTS
3.1 | Number and quality of reads
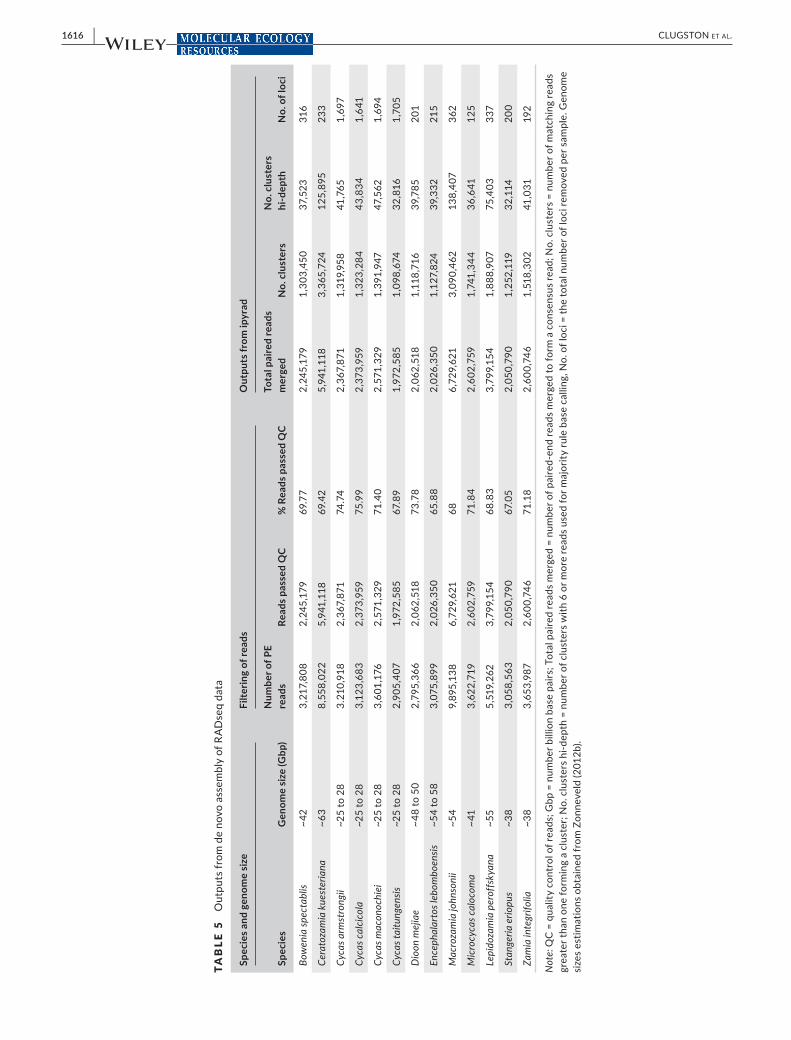
Sequencing on the Illumina NextSeq 500 platform generated ap-proximately 1.9–6.7 million 150 bp paired-end reads per sample (Tables 3‒5). The number of reads generated varied—with the few-est for S. eriopus and the greatest for M. johnsonii. For Cycas (target genus), the number of reads generated showed less variation (1.9–2.5
million) and was lowest in C. taitungensis and greatest in C. macono-chiei. The PhredQ Score distribution of the sequencing run meas-ured 75.2% at Q30 or greater, which passed the Illumina sequencing filter. Quality control of reads (measured as PhredQ score in FastQC 0.11.5) indicated that forward reads were of a higher quality with a drop-off after 135 bp, whereas reverse reads were lower quality due to drop-off after 120 bp. Due to this quality drop-off, forward and reserve reads were filtered and trimmed to 120 bp. Data accessibil-ity: the data that supported the finding of this study are archived to allow reproducibility of the assembly, and filtered sequence reads are accessible from NCBI Sequence Read Achieve, BioSample acces-sion number: PRJNA526348 (Table 2).
3.2 | Mapping of reads to published references
RADseq reads were mapped against published reference mitochon-drial and chloroplast (plastid) genomes. Plastomes ranged in size from 161,815 to 166,431 bp (Table 3). The number of reads mapped to the plastomes varied from 16,292 reads (0.80% of total reads) for E. lebomboensis to Encephalartos lehmannii and 221,486 reads (5.82% total number of reads) for M. johnsonii to M. mountperriensis (Table 6). The average read depth (Table 3) also varied between the samples and ranged from 10.74 in E. lebomboensis to 131.32 in C. armstrongii and demonstrates that no clusters were over-represented. Although the percentage of RADseq reads mapped varied, in all species 89% or greater of the reference was covered and was lowest in C. kueste-riana (89%) and greatest in S. eriopus and C. armstrongii (97%).
Reads for Cycas spp. were mapped to the mitochondrial ge-nome of C. taitungensis, which was 414,903 bp (Table 4). The num-ber of reads mapped ranged from 14,672 (0.61% total number of reads) in C. calcicola to 26,616 (8.9% total number of reads) in C. taitungensis. The number of reads covering the reference mito-chondrial genome only varied somewhat between species and was lowest in C. calcicola and C. taitungensis (62%) and highest in C. armstrongii (68%).
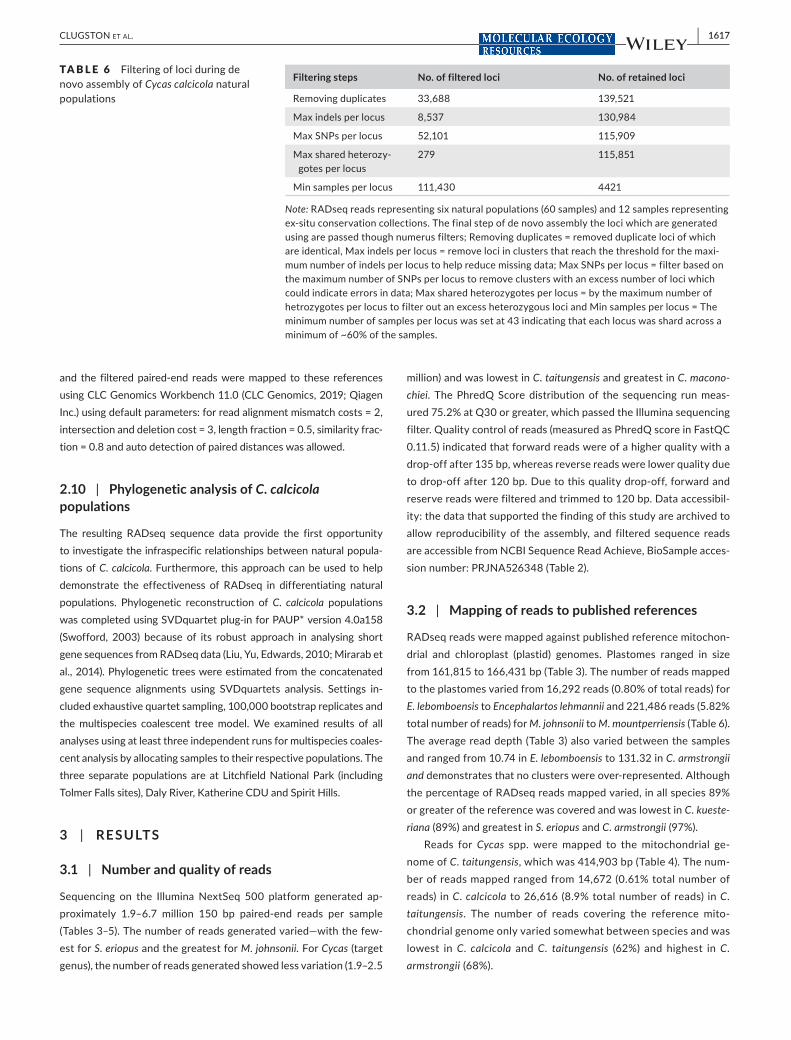
Filtering steps No. of filtered loci No. of retained loci
Removing duplicates 33,688 139,521
Max indels per locus 8,537 130,984
Max SNPs per locus 52,101 115,909
Max shared heterozy-gotes per locus
279 115,851
Min samples per locus 111,430 4421
Note: RADseq reads representing six natural populations (60 samples) and 12 samples representing ex-situ conservation collections. The final step of de novo assembly the loci which are generated using are passed though numerus filters; Removing duplicates = removed duplicate loci of which are identical, Max indels per locus = remove loci in clusters that reach the threshold for the maxi-mum number of indels per locus to help reduce missing data; Max SNPs per locus = filter based on the maximum number of SNPs per locus to remove clusters with an excess number of loci which could indicate errors in data; Max shared heterozygotes per locus = by the maximum number of hetrozygotes per locus to filter out an excess heterozygous loci and Min samples per locus = The minimum number of samples per locus was set at 43 indicating that each locus was shard across a minimum of ~60% of the samples.
TA B L E 6 Filtering of loci during de novo assembly of Cycas calcicola natural populations
1618 | CLUGSTON eT aL.
3.3 | De novo assembly of RADseq data
Initial filtering and trimming of the raw Illumina reads were carried out using TRIMMOMATIC. Approximately, 65%–75% of paired reads were retained (singletons were removed), each with a minimum PhredQ score of 20 (Table 5). The sample which yielded the lowest number of reads after filtering was C. taitungensis. During filtering, approxi-mately 1 million reads were discarded for each sample and 3 million reads were removed for M. Johnsonii; however, M. johnsonii remained the taxon with the greatest number of reads overall (Table 5). The number of clusters obtained from de novo assembly ranged from 1.0 to 3.3 million per sample. The number of high-depth clusters (contain-ing six or more reads) ranged from 32,000 in S. eriopus to 38,000 in M. johnsonii (Table 5). This lower number of high-depth clusters versus initial clusters indicates that there were a high number of clusters with less than six reads, which were discarded due to a higher likelihood of a base being miscalled. The number of recovered loci varied greatly among genera (Table 5), ranging from 1,641 in C. calcicola to 1,705 in C. taitungensis within Cycas. A lower number of loci were recovered for Zamiaceae when compared to Cycadaceae with 125 loci being ob-tained for M. calocoma and 362 for M. johnsonii (Table 5).
3.4 | Example assembly of C. calcicola
The assembly of 72 samples from natural populations of C. calcicola (Table 6) generated 1.7–4.7 million reads during sequencing, and most reads passed the ipyrad filter (after trimming). The total num-ber of clusters generated during clustering ranged from 1.3 to 3 mil-lion, and the number of high-depth clusters ranged from 22,000 to 78,000 thousand. Overall the assembly generated over 3 million in-formative SNPs across the 72 samples, and after final filtering, 4,421 loci were recovered for a minimum of 43 samples per locus (each locus was present for ~60% of samples).
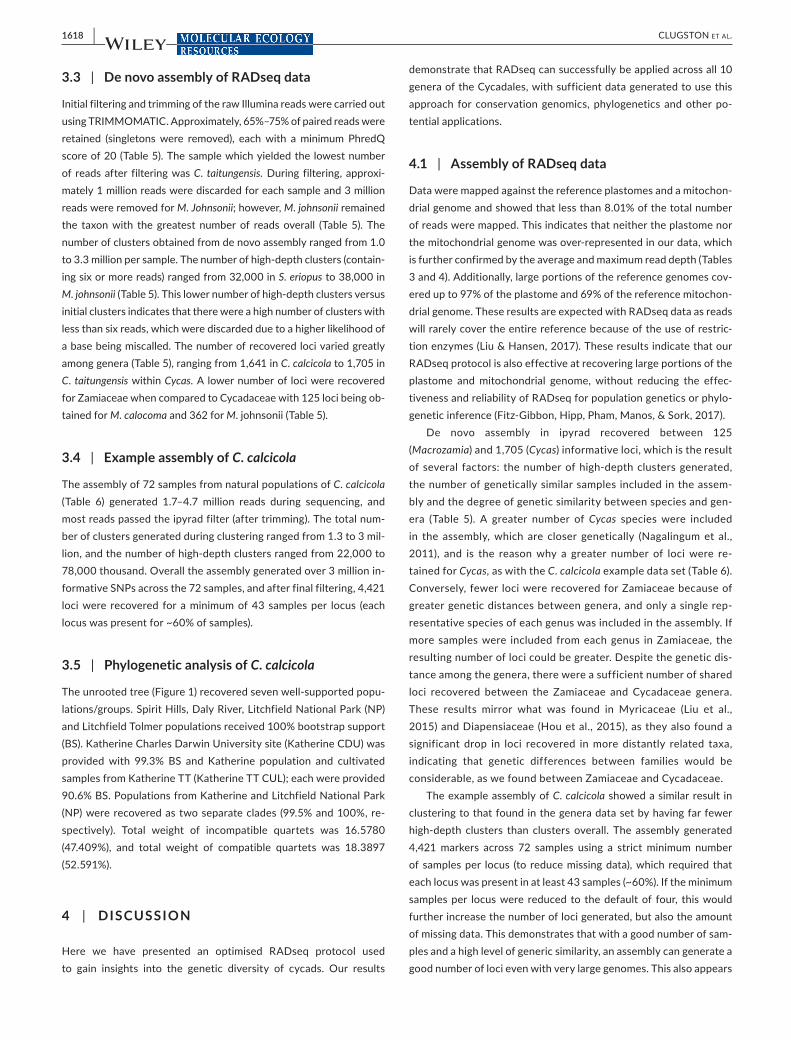
3.5 | Phylogenetic analysis of C. calcicola
The unrooted tree (Figure 1) recovered seven well-supported popu-lations/groups. Spirit Hills, Daly River, Litchfield National Park (NP) and Litchfield Tolmer populations received 100% bootstrap support (BS). Katherine Charles Darwin University site (Katherine CDU) was provided with 99.3% BS and Katherine population and cultivated samples from Katherine TT (Katherine TT CUL); each were provided 90.6% BS. Populations from Katherine and Litchfield National Park (NP) were recovered as two separate clades (99.5% and 100%, re-spectively). Total weight of incompatible quartets was 16.5780 (47.409%), and total weight of compatible quartets was 18.3897 (52.591%).
4 | DISCUSSION
Here we have presented an optimised RADseq protocol used to gain insights into the genetic diversity of cycads. Our results
demonstrate that RADseq can successfully be applied across all 10 genera of the Cycadales, with sufficient data generated to use this approach for conservation genomics, phylogenetics and other po-tential applications.
4.1 | Assembly of RADseq data
Data were mapped against the reference plastomes and a mitochon-drial genome and showed that less than 8.01% of the total number of reads were mapped. This indicates that neither the plastome nor the mitochondrial genome was over-represented in our data, which is further confirmed by the average and maximum read depth (Tables 3 and 4). Additionally, large portions of the reference genomes cov-ered up to 97% of the plastome and 69% of the reference mitochon-drial genome. These results are expected with RADseq data as reads will rarely cover the entire reference because of the use of restric-tion enzymes (Liu & Hansen, 2017). These results indicate that our RADseq protocol is also effective at recovering large portions of the plastome and mitochondrial genome, without reducing the effec-tiveness and reliability of RADseq for population genetics or phylo-genetic inference (Fitz-Gibbon, Hipp, Pham, Manos, & Sork, 2017).
De novo assembly in ipyrad recovered between 125 (Macrozamia) and 1,705 (Cycas) informative loci, which is the result of several factors: the number of high-depth clusters generated, the number of genetically similar samples included in the assem-bly and the degree of genetic similarity between species and gen-era (Table 5). A greater number of Cycas species were included in the assembly, which are closer genetically (Nagalingum et al., 2011), and is the reason why a greater number of loci were re-tained for Cycas, as with the C. calcicola example data set (Table 6). Conversely, fewer loci were recovered for Zamiaceae because of greater genetic distances between genera, and only a single rep-resentative species of each genus was included in the assembly. If more samples were included from each genus in Zamiaceae, the resulting number of loci could be greater. Despite the genetic dis-tance among the genera, there were a sufficient number of shared loci recovered between the Zamiaceae and Cycadaceae genera. These results mirror what was found in Myricaceae (Liu et al., 2015) and Diapensiaceae (Hou et al., 2015), as they also found a significant drop in loci recovered in more distantly related taxa, indicating that genetic differences between families would be considerable, as we found between Zamiaceae and Cycadaceae.
The example assembly of C. calcicola showed a similar result in clustering to that found in the genera data set by having far fewer high-depth clusters than clusters overall. The assembly generated 4,421 markers across 72 samples using a strict minimum number of samples per locus (to reduce missing data), which required that each locus was present in at least 43 samples (~60%). If the minimum samples per locus were reduced to the default of four, this would further increase the number of loci generated, but also the amount of missing data. This demonstrates that with a good number of sam-ples and a high level of generic similarity, an assembly can generate a good number of loci even with very large genomes. This also appears
| 1619CLUGSTON eT aL.
to have provided sufficient data for coalescent-based analysis since our results were provided with high support (>90% BS) for closely related populations of C. calcicola.
4.2 | Sequencing depth and large genomes
Sequencing resulted in 2.7–9.8 million paired-end-reads per sample. Although reads needed to be filtered and trimmed, the sequencing quality was generally high. We aimed to obtain 1 Gb per sample to account for the large genome size (25–63 Gbp; Zonneveld, 2012b) and over-representation of the plastome (Wu & Chaw, 2015). The amount of data (uncompressed) ranged from 1.2 Gb for S. eriopus to 3.9 Gb for M. johnsonii, hence meeting our goal.
One of the main considerations in assembling RADseq data is the clustering of reads for calling consensus sequences and SNPs, as this requires numerous repeat reads to be aligned (Eaton, 2014). In the third step of assembly in ipyrad, if two or more reads aligned, they form a cluster. Subsequently, these clusters are further assessed, and six or more reads (depending on minimum depth clustering depth set) are required for a cluster and its constituent SNPs to be considered reliable—these are termed high-depth clusters (Eaton, 2014). However, in larger genomes, it is less likely that there will be
a sufficient number of repeat reads in the sequence data to gener-ate enough high-depth clusters (except for repetitive regions; Karam, Lefèvre, Dagher-Kharrat, Pinosio, & Vendramin, 2015). In our study, we found between 1 to 3.3 million clusters in the first clustering step and 32,000 to 138,000 clusters after selecting only high-depth clus-ters, indicating that there were many clusters with fewer than six reads. This number of high-depth clusters, while relatively small com-pared to the initial number, is nonetheless sufficient for downstream phylogenetic and population genetic purposes, especially given that previous work has used significantly fewer markers (Cibrián-Jaramillo, Daly, Brenner, Desalle, & Marler, 2010; Griffith et al., 2015; Meerow et al., 2012; Nagalingum et al., 2011; Salas-Leiva et al., 2014).
Thus far, RADseq has been utilized in phylogenetics and pop-ulation genetics for a few plant groups with varying genome sizes (Table 1). The taxa with the smallest genomes (all <1 Gbp) were Carex spp., Sisymbrium austriacum and Mimulus spp, whereas those with the largest genomes include Diospyros species (2.40–5.76 Gbp), Senecio lautus (4.90 Gbp) and Pedicularis species (5.68 Gbp). In our study, RADseq was applied to genomes that are 25 to 63 Gbp—i.e. approximately 4–11 times larger than all previ-ous studies. Therefore, we have demonstrated that RADseq can successfully be applied to groups of plants with larger genomes and holds a promise for future applications of RADseq to other plant groups, especially nonflowering plants with large genomes such as ferns and gymnosperms.
5 | CONCLUSIONS
We have demonstrated that RADseq can be applied to organisms with large genomes, such as cycads. This protocol uses HT sequenc-ing to recover informative genome-wide markers. RADseq also offers the ability to multiplex and sequence many individuals simul-taneously, at relatively low cost. These markers have the potential to be used for population level and for phylogenetic studies, ultimately helping to resolve the relationships among cycads, obtain a better insight into the genetic diversity among the Cycadales species and to assist in developing informed conservation management plans for cycads and other groups in the future.
ACKNOWLEDG EMENTS
We wish to acknowledge funding received from the Australian Flora Foundation, the Australasian Systematic Botany Society's Hansjörg Eichler Scientific Research Fund and The Nature Conservatory—The Thomas Foundation for an Australian Conservation Taxonomy Award. Furthermore, we wish to acknowledge the Biotechnology and Biological Sciences Research Council (BBSRC) UK and the EASTBIO Doctoral Training Partnership for providing a studentship at the University of Edinburgh. We thank staff at the Royal Botanic Gardens and Domain Trust, in particular, Carolyn Connolly thanked her support in the molecular laboratory, Hannah McPherson for helping in the initial quality testing of data and Maureen Phelan and
F I G U R E 1 Unrooted tree network tree of Cycas calcicola's wild populations in Northern Territory, Australia. The unrooted tree shows seven well-supported populations. Spirit Hills, Daly River, Litchfield National Park (NP) and Litchfield Tolmer populations received 100% bootstrap support (BS). Katherine Charles Darwin University site (Katherine CDU) with 99.3% BS and both Katherine Katherine TT Katherine TT CUL (cultivated) provided 90.6% BS. Populations from Katherine and Litchfield National Park (NP) were recovered as two separate clades (99.5% and 100%)
0.6
Kathe
rine
CD
U
Litc
hfie
ldN
P
Spirit Hills
Daly
River
Litchfield Tolmer
Katherine TTKatherineT
TC
UL
90.6
99
.3
10
0100
1620 | CLUGSTON eT aL.
Simon Goodwin for assistance obtaining DNA samples from the liv-ing collections. We also thank the various botanic gardens that pro-vided C. calcicola tissue. At the Royal Botanic Garden Edinburgh, we wish to thank Laura Forrest and Michelle Hart for their continued support throughout the project. Daren Eaton is acknowledged for assistance with ipyrad: Robert J. Toonen for information about the ezRAD protocol and Todd McLay for support in quality checking and filtering of RADseq data.
AUTHOR CONTRIBUTIONS
J.A.R.C. was involved in writing of paper, performed research and analysed data. G.K. edited the manuscript and helped analyse data. R.M. was also involved in manuscript editing. I.O. was involved in constructing, analysing data and writing of paper methodology. T.C.W. was involved in analysing data and writing of paper meth-odology. N.S.N. was involved in writing of paper, analysed data and designed research.
DATA AVAIL ABILIT Y S TATEMENT
The data that supported the finding of this study is archived to allow reproducibility of the assembly and filtered sequence reads is ac-cessible from NCBI Sequence Read Achieve, BioSample accession number: PRJNA526348 (Table 2).
ORCID
James A. R. Clugston https://orcid.org/0000-0002-3653-6953
R E FE R E N C E S
Ahrens, C. W., Supple, M. A., Aitken, N. C., Cantrill, D. J., Borevitz, J. O., & James, E. A. (2017). Genomic diversity guides conservation strategies among rare terrestrial orchid species when taxonomy remains uncertain. Annals of Botany, 119(8), 1267–1277. https ://doi.org/10.1093/aob/mcx022
Alexeyenko, A., Nystedt, B., Vezzi, F., Sherwood, E., Ye, R., Knudsen, B., … Lundeberg, J. (2014). Efficient de novo assembly of large and com-plex genomes by massively parallel sequencing of Fosmid pools. Bmc Genomics, 15(1), 439. https ://doi.org/10.1186/1471-2164-15-439
Andrews, K. R., Good, J. M., Miller, M. R., Luikart, G., & Hohenlohe, P. A. (2016). Harnessing the power of RADseq for ecological and evolu-tionary genomics. Nature Reviews. Genetics, 17(2), 81–92. https ://doi.org/10.1038/nrg.2015.28
Andrews, K. R., Hohenlohe, P. A., Miller, M. R., Hand, B. K., Seeb, J. E., & Luikart, G. (2014). Trade-offs and utility of alternative RADseq meth-ods: Reply to Puritz et al. Tran. Molecular Ecology, 23(24), 5943–5946.
Andrews, K. R., & Luikart, G. (2014). Recent novel approaches for pop-ulation genomics data analysis. Molecular Ecology, 23(7), 1661–1667. https ://doi.org/10.1111/mec.12686
Bolger, A. M., Lohse, M., & Usadel, B. (2014). Trimmomatic: A flexible trimmer for Illumina sequence data. Bioinformatics, 30(15), 2114–2120. https ://doi.org/10.1093/bioin forma tics/btu170
Catchen, J. M., Hohenlohe, P. A., Bernatchez, L., Funk, W. C., Andrews, K. R., & Allendorf, F. W. (2017). Unbroken: RADseq remains a powerful
tool for understanding the genetics of adaptation in natural popu-lations. Molecular Ecology Resources, 17(3), 362–365. https ://doi.org/10.1111/1755-0998.12669
Cibrián-Jaramillo, A., Daly, A. C., Brenner, E., Desalle, R., & Marler, T. E. (2010). When North and South don’t mix: genetic connectivity of a recently endangered oceanic cycad, Cycas micronesica, in Guam using EST-microsatellites. Molecular Ecology, 19(12), 2364–2379. https ://doi.org/10.1111/j.1365-294X.2010.04638.x
CLC Genomics Workbench 11.0 (2019). Retrieved from https ://www.qiage nbioi nform atics.com
Davey, J. L., & Blaxter, M. W. (2010). RADSeq: Next-generation popula-tion genetics. Briefings in Functional Genomics, 9(5/6), 416–423. https ://doi.org/10.1093/bfgp/elq031
Eaton, D. A. R. (2014). PyRAD: Assembly of de novo RADseq loci for phylogenetic analyses. Bioinformatics, 30(13), 1844–1849. https ://doi.org/10.1093/bioin forma tics/btu121
Eaton, D. A. R., Hipp, A. L., González-Rodríguez, A., & Cavender-Bares, J. (2015). Historical introgression among the American live oaks and the comparative nature of tests for introgression. Evolution, 69(10), 2587–2601. https ://doi.org/10.1111/evo.12758
Eaton, D. A. R., & Overcast, I. (2016). ipyrad: interactive assembly and analysis of RADseq data sets. http://ipyrad.readt hedocs.io (accessed september 2017).
Eaton, D. A. R. (2014). PyRAD: assembly of de novo RADseq loci for phy-logenetic analyses. Bioinformatics, 30, 1844–1849.
Eaton, D. A. R., & Ree, R. H. (2013). Inferring phylogeny and introgression using RADseq data: An example from flowering plants (Pedicularis: Orobanchaceae). Systematic Biology, 62(5), 689–706. https ://doi.org/10.1093/sysbi o/syt032
Eaton, D. A. R., Spriggs, E. L., Park, B., & Donoghue, M. J. (2016). Misconceptions on missing data in RAD-seq phylogenetics with a deep-scale example from flowering plants. Systematic Biology, 66(3), 399–412. https ://doi.org/10.1093/sysbi o/syw092
Fitz-Gibbon, S., Hipp, A. L., Pham, K. K., Manos, P. S., & Sork, V. L. (2017). Phylogenomic inferences from reference-mapped and de novo as-sembled short-read sequence data using RADseq sequencing of California white oaks (Quercus section Quercus). Genome, 60(9), 743–755.
Griffith, M. P., Calonje, M., Meerow, A. W., Tut, F., Kramer, A. T., Hird, A., … Husby, C. E. (2015). Can a botanic garden cycad collection cap-ture the genetic diversity in a wild population? International Journal of Plant Sciences, 176(1), 1–10.
Guan, R., Zhao, Y., Zhang, H., Fan, G., Liu, X., Zhou, W., … Chen, W. (2016). Draft genome of the living fossil Ginkgo biloba. GigaScience, 5(1), 49. https ://doi.org/10.1186/s13742-016-0154-1
Guo, W., Grewe, F., Fan, W., Young, G. J., Knoop, V., Palmer, J. D., & Mower, J. P. (2016). Ginkgo and welwitschia mitogenomes reveal ex-treme contrasts in gymnosperm mitochondrial evolution. Molecular Biology and Evolution, 33(6), 1448–1460.
Guo, Y., Yuan, H., Fang, D., Song, L., Liu, Y., Liu, Y., … Zhang, H. (2014). An improved 2b-RAD approach (I2b-RAD) offering genotyping tested by a rice (Oryza sativa L.) F2 population. BMC Genomics, 15(1), 956–956. https ://doi.org/10.1186/1471-2164-15-956
Hou, Y., Nowak, M. D., Mirré, V., Bjorå, C. S., Brochmann, C., & Popp, M. (2015). Thousands of RAD-seq loci fully resolve the phylogeny of the highly disjunct arctic-alpine genus Diapensia (Diapensiaceae). PLoS ONE, 10(10), e0140175. https ://doi.org/10.1371/journ al.pone.0140175
Jansen, R. K., Saski, C., Lee, S.-B., Hansen, A. K., & Daniell, H. (2011). Complete plastid genome sequences of three Rosids (Castanea, Prunus, Theobroma): Evidence for at least two independent trans-fers of rpl22 to the nucleus. Molecular Biology and Evolution, 28(1), 835–847. https ://doi.org/10.1093/molbe v/msq261
Karam, M.-J., Lefèvre, F., Dagher-Kharrat, M. B., Pinosio, S., & Vendramin, G. G. (2015). Genomic exploration and molecular marker
| 1621CLUGSTON eT aL.
development in a large and complex conifer genome using RADseq and mRNAseq. Molecular Ecology Resources, 15(3), 601–612. https ://doi.org/10.1111/1755-0998.12329
Liu, L., Jin, X., Chen, N., Li, X., Li, P., & Fu, C. (2015). Phylogeny of Morella rubra and its relatives (Myricaceae) and genetic resources of Chinese Bayberry using RAD sequencing. PLoS ONE, 10(10), e0139840.
Liu, L., Yu, L., & Edwards, S. V. (2010). A maximum pseudo-likelihood ap-proach for estimating species trees under the coalescent model. BMC Evolutionary Biology, 10(1), 302.
Liu, S., & Hansen, M. M. (2017). PSMC (pairwise sequentially Markovian coalescent) analysis of RAD (restriction site associated DNA) se-quencing data. Molecular Ecology Resources, 17(4), 631–641. https ://doi.org/10.1111/1755-0998.12606
Massatti, R., Reznicek, A. A., & Knowles, L. L. (2016). Utilizing RADseq data for phylogenetic analysis of challenging taxonomic groups: A case study in Carex sect. Racemosae. American Journal of Botany, 103(2), 337–347.
Mastretta-Yanes, A., Arrigo, N., Alvarez, N., Jorgensen, T. H., Piñero, D., & Emerson, B. C. (2015). Restriction site-associated DNA sequencing, ge-notyping error estimation and de novo assembly optimization for popu-lation genetic inference. Molecular Ecology Resources, 15(1), 28–41.
Meerow, A. W., Francisco-Ortega, J., Colonje, M., Griffith, M. P., Ayala-Silva, T., Stevenson, D. W., & Nakamura, K. (2012). Zamia (Cycadales: Zamiaceae) on Puerto Rico: Asymmetric genetic differentiation and the hypothesis of multiple introductions. American Journal of Botany, 99(11), 1828–1839.
Meyers, B. C., Scalabrin, S., & Morgante, M. (2004). Mapping and se-quencing complex genomes: Let's get physical!. Nature Reviews. Genetics, 5(8), 578–588.
Mirarab, S., Reaz, R., Bayzid, M. S., Zimmermann, T., Swenson, M. S., & Warnow, T. (2014). ASTRAL: Genome-scale coalescent-based spe-cies tree estimation. Bioinformatics, 30(17), 541–548. https ://doi.org/10.1093/bioin forma tics/btu462
Nagalingum, N. S., Marshall, C. R., Quental, T. B., Rai, H. S., Little, D. P., & Mathews, S. (2011). Recent synchronous radiation of a living fossil. Science, 334(6057), 796–799. https ://doi.org/10.1126/scien ce.1209926
Narum, S. R., Buerkle, C. A., Davey, J. W., Miller, M. R., & Hohenlohe, P. A. (2013). Genotyping-by-sequencing in ecological and conser-vation genomics. Molecular Ecology, 22(11), 2841–2847. https ://doi.org/10.1111/mec.12350
Nazareno, A. G., Dick, C. W., & Lohmann, L. G. (2018). Tangled banks: A landscape genomic evaluation of Wallace's Riverine barrier hypoth-esis for three Amazon plant species. Molecular Ecology, 76(5), 1–18.
Paun, O., Turner, B., Trucchi, E., Munzinger, J., Chase, M. W., & Samuel, R. (2015). Processes driving the adaptive radiation of a tropical tree (Diospyros, Ebenaceae) in New Caledonia, a biodiversity hotspot. Systematic Biology, 65(2), 212–227.
Pellicer, J., Fay, M. F., & Leitch, I. J. (2010). The largest eukaryotic genome of them all? Botanical Journal of the Linnean Society, 164(1), 10–15.
Pellicer, J., Hidalgo, O., Dodsworth, S., & Leitch, I. J. (2018). Genome size diversity and its impact on the evolution of land plants. Genes, 9(2), 88.
Peterson, B. K., Weber, J. N., Kay, E. H., Fisher, H. S., & Hoekstra, H. E. (2012). Double digest RADseq: An inexpensive method for de novo SNP discovery and genotyping in model and non-model species. PLoS ONE, 7(5), 1–11. https ://doi.org/10.1371/journ al.pone.0037135
Roda, F., Ambrose, L., Walter, G. M., Liu, H. L., Schaul, A., Lowe, A., … Ortiz-Barrientos, D. (2013). Genomic evidence for the parallel evolu-tion of coastal forms in the Senecio lautus complex. Molecular Ecology, 22(11), 2941–2952.
Roodt, D., Lohaus, R., Sterck, L., Swanepoel, R. L., Van de Peer, Y., & Mizrachi, E. (2017). Evidence for an ancient whole genome duplica-tion in the cycad lineage. PLoS ONE, 12(9), e0184454. https ://doi.org/10.1371/journ al.pone.0184454
Ruhsam, M., Rai, H. S., Mathews, S., Ross, T. G., Graham, S. W., Raubeson, L. A., … Hollingsworth, P. M. (2015). Does complete plastid genome sequencing improve species discrimination and phylogenetic resolution in Araucaria? Molecular Ecology Resources, 15(5), 1067–1078.
Salas-Leiva, D. E., Meerow, A. W., Francisco-Ortega, J., Calonje, M., Griffith, M. P., Stevenson, D. W., & Nakamura, K. (2014). Conserved genetic regions across angiosperms as tools to develop single-copy nuclear markers in gymnosperms: An example using cy-cads. Molecular Ecology Resources, 14(4), 831–845. https ://doi.org/10.1111/1755-0998.12228
Schmieder, R., & Edwards, R. (2011). Quality control and preprocessing of metagenomic datasets. Bioinformatics, 27(6), 863–864. https ://doi.org/10.1093/bioin forma tics/btr026
Scott, A. D., Stenz, N. W. M., Ingvarsson, P. K., & Baum, D. A. (2016). Whole genome duplication in coast redwood (Sequoia sempervirens) and its implications for explaining the rarity of polyploidy in conifers. The New Phytologist, 211(1), 186–193.
Swofford, D. L. (2003). PAUP*: Phylogenetic analysis using parsimony (*and other methods). Version 4 4.0a158.
Toonen, R. J., Puritz, J. B., Forsman, Z. H., Whitney, J. L., Fernandez-Silva, I., Andrews, K. R., & Bird, C. E. (2013). ezRAD: A simplified method for genomic genotyping in non-model organisms. PeerJ, 1(14), e203–e203. https ://doi.org/10.7717/peerj.203
Tsudzuki, J., Nakashima, K., Tsudzuki, T., Hiratsuka, J., Shibata, M., Wakasugi, T., & Sugiura, M. (1992). Chloroplast DNA of black pine retains a residual inverted repeat lacking rRNA genes: Nucleotide sequences of trnQ, trnK, psbA, trnI and trnH and the absence of rps16. Molecular and General Genetics, 232(2), 206–214.
Twyford, A. D., & Friedman, J. (2015). Adaptive divergence in the monkey flower Mimulus guttatus is maintained by a chromosomal inversion. Evolution, 69(6), 1476–1486.
Vandepitte, K., Honnay, O., Mergeay, J., Breyne, P., Roldán Ruiz, I., & Meyer, T. (2013). SNP discovery using paired-end RAD-tag sequenc-ing on pooled genomic DNA of Sisymbrium austriacum (Brassicaceae). Molecular Ecology Resources, 13(2), 269–275.
Wang, N., Thomson, M., Bodles, W. J. A., Crawford, R. M. M., Hunt, H. V., Featherstone, A. W., … Buggs, R. J. A. (2013). Genome sequence of dwarf birch (Betula nana) and cross-species RAD markers. Molecular Ecology, 22(11), 3098–3111.
Warschefsky, E. J., & von Wettberg, E. J. B. (2019). Population genomic analysis of mango (Mangifera indica) suggests a complex history of domestication. The New Phytologist, 222(4), 2023–2037.
Wegrzyn, J. L., Liechty, J. D., Stevens, K. A., Wu, L. S., Loopstra, C. A., Vasquez-Gross, H. A., & Holt, C. (2014). Unique features of the lob-lolly pine (Pinus taeda L.) megagenome revealed through sequence annotation. Genetics, 196(3), 891–909.
Wu, C.-S., & Chaw, S.-M. (2015). Evolutionary stasis in cycad plastomes and the first case of plastome GC-biased gene conversion. Genome Biology and Evolution, 7(7), 2000–2009. https ://doi.org/10.1093/gbe/evv125
Wu, C.-S., Wang, Y.-N., Liu, S.-M., & Chaw, S.-M. (2007). Chloroplast ge-nome (cpDNA) of Cycas taitungensis and 56 cp protein-coding genes of Gnetum parvifolium: Insights into cpDNA evolution and phylogeny of extant seed plants. Molecular Biology and Evolution, 24(6), 1366–1379. https ://doi.org/10.1093/molbe v/msm059
Yang, Y., Zhou, T., Duan, D., Yang, J., Feng, L., & Zhao, G. (2016). Comparative analysis of the complete chloroplast genomes of five Quercus species. Frontiers in Plant Science, 7(573), 803. https ://doi.org/10.3389/fpls.2016.00959
Yi, D.-K., Yang, J. C., So, S., Joo, M., Kim, D.-K., Shin, C. H., … Choi, K. (2015). The complete plastid genome sequence of Abies koreana (Pinaceae: Abietoideae). Mitochondrial DNA Part A, 5, 2351–2353.

1622 | CLUGSTON eT aL.
Zhou, T., Zhao, J., Chen, C., Meng, X., & Zhao, G. (2016). Characterization of the complete chloroplast genome sequence of Primula veris (Ericales: Primulaceae). Conservation Genetics, 8(4), 455–458. https ://doi.org/10.1007/s12686-016-0595-y
Zonneveld, B. J. M. (2012a). Genome sizes for all genera of Cycadales. Plant Biology, 14(1), 253–256.
Zonneveld, B. J. M. (2012b). Conifer genome sizes of 172 species, covering 64 of 67 genera, range from 8 to 72 picogram. Nordic Journal of Botany, 30(4), 490–502. https ://doi.org/10.1111/j.1756- 1051.2012.01516.x
Zonneveld, B. J. M., & Lindstrom, A. J. (2016). Genome sizes for 71 species of Zamia (Cycadales: Zamiaceae) correspond with three different biogeographic regions. Nordic Journal of Botany, 34(6), 744–751.
SUPPORTING INFORMATION
Additional supporting information may be found online in the Supporting Information section at the end of the article.
How to cite this article: Clugston JAR, Kenicer GJ, Milne R, Overcast I, Wilson TC, Nagalingum NS. RADseq as a valuable tool for plants with large genomes—A case study in cycads. Mol Ecol Resour. 2019;19:1610–1622. https ://doi.org/10.1111/1755-0998.13085