Embed Size (px)
Citation preview

PNNL-21794
Prepared for the U.S. Department of Energy under Contract DE-AC05-76RL01830
Radionuclide Retention in Concrete Wasteforms DM Wellman DP Jansik EC Golovich EA Cordova September 2012

DISCLAIMER This report was prepared as an account of work sponsored by an agency of the United States Government. Neither the United States Government nor any agency thereof, nor Battelle Memorial Institute, nor any of their employees, makes any warranty, express or implied, or assumes any legal liability or responsibility for the accuracy, completeness, or usefulness of any information, apparatus, product, or process disclosed, or represents that its use would not infringe privately owned rights. Reference herein to any specific commercial product, process, or service by trade name, trademark, manufacturer, or otherwise does not necessarily constitute or imply its endorsement, recommendation, or favoring by the United States Government or any agency thereof, or Battelle Memorial Institute. The views and opinions of authors expressed herein do not necessarily state or reflect those of the United States Government or any agency thereof.
PACIFIC NORTHWEST NATIONAL LABORATORY
operated by BATTELLE
for the UNITED STATES DEPARTMENT OF ENERGY
under Contract DE-AC05-76RL01830
Printed in the United States of America
Available to DOE and DOE contractors from the Office of Scientific and Technical Information,
P.O. Box 62, Oak Ridge, TN 37831-0062; ph: (865) 576-8401 fax: (865) 576 5728
email: [email protected]
Available to the public from the National Technical Information Service, U.S. Department of Commerce, 5285 Port Royal Rd., Springfield, VA 22161
ph: (800) 553-6847 fax: (703) 605-6900
email: [email protected] online ordering: http://www.ntis.gov/ordering.htm
PNNL-21794
Radionuclide Retention in Concrete Wasteforms DM Wellman DP Jansik EC Golovich EA Cordova September 2012 Prepared for the U.S. Department of Energy under Contract DE-AC05-76RL01830 Pacific Northwest National Laboratory Richland, Washington 99352


iii
Summary
Assessing long-term performance of Category 3 waste cement grouts for radionuclide encasement requires knowledge of the radionuclide-cement interactions and mechanisms of retention (i.e., sorption or precipitation); the mechanism of contaminant release; the significance of contaminant release pathways; how wasteform performance is affected by the full range of environmental conditions within the disposal facility; the process of wasteform aging under conditions that are representative of processes occurring in response to changing environmental conditions within the disposal facility; the effect of wasteform aging on chemical, physical, and radiological properties; and the associated impact on contaminant release. This knowledge will enable accurate prediction of radionuclide fate when the wasteforms come in contact with groundwater. Data collected throughout the course of this work will be used to quantify the efficacy of concrete wasteforms, similar to those used in the disposal of LLW and MLLW, for the immobilization of key radionuclides (i.e., uranium, technetium, and iodine). Data collected will also be used to quantify the physical and chemical properties of the concrete affecting radionuclide retention.


v
Acknowledgments
Funding for this project was provided by CH2M HILL Plateau Remediation Company (Sunil Mehta). This work was conducted at Pacific Northwest National Laboratory, operated by Battelle Memorial Institute for the U.S. Department of Energy under Contract DE-AC05-76RL01830.

vii
Acronyms and Abbreviations
FY fiscal year(s)
ICP-MS inductively coupled plasma-mass spectrometry
ICP-OES inductively coupled plasma-optical emission spectrometry
LLBG Hanford Low-Level Waste Burial Grounds
LLW low-level waste
MLLW mixed low-level waste
PA performance assessment
PCT product consistency test
PUF pressurized unsaturated flow
Ti titanium
wt weight
XMT x-ray microtomography


ix
Contents
Summary ........................................................................................................................................... iii
Acknowledgments ............................................................................................................................... v
Acronyms and Abbreviations ...........................................................................................................vii
1.0 Introduction ................................................................................................................................ 1
2.0 Materials and Methods ............................................................................................................... 3
2.1 Specified Concrete Composition for Encasement .............................................................. 3
2.2 Materials and Laboratory-Scale Mixture Design ............................................................... 3
2.3 Concrete Mix and Specimen Preparation ........................................................................... 4
2.4 Pressurized Unsaturated Flow Apparatus Experiments ..................................................... 4
2.4.1 Description of the PUF Apparatus .......................................................................... 5
2.4.2 PUF Experimental Setup ......................................................................................... 6
2.4.3 Release Rate and Error Calculations ....................................................................... 7
2.5 X-Ray Microtomography ................................................................................................... 8
2.6 Product Consistency Test (PCT) Experiments ................................................................... 9
3.0 Results ........................................................................................................................................ 9
3.1 XMT Visualization of PUF Column ................................................................................ 10
3.2 PUF Column Testing ........................................................................................................ 11
3.3 PCT Experiments ............................................................................................................. 11
4.0 References ................................................................................................................................ 12

x
Figures
Figure 2.1. PUF Column Assembly ................................................................................................... 6
Figure 3.1. XMT Image of Control Concrete PUF Column ............................................................ 10
Figure 3.2. XMT Image of Iodine-Spiked Concrete PUF Column .................................................. 11
Tables
Table 1.1. Overview of Test Methods ................................................................................................ 2
Table 2.1. Material Specifications and Composition ......................................................................... 3
Table 2.2. Laboratory-Scale Material Specification and Composition ............................................... 4

1
1.0 Introduction
The Waste Management Project provides safe, compliant, and cost-effective waste management services for the Hanford Site and the DOE Complex. Part of these services includes safe disposal of Low-Level Waste (LLW) and Mixed Low-Level Waste (MLLW) at the Hanford Low-Level Waste Burial Grounds (LLBG) in accordance with the requirements listed in DOE Order 435.1, Radioactive Waste Management. To partially satisfy these requirements, Performance Assessment (PA) analyses were completed and approved. DOE Order 435.1 also requires that continuing data collection be conducted to enhance confidence in the critical assumptions used in these analyses to characterize the operational features of the disposal facility that are relied upon to satisfy the performance objectives identified in the Order.
One critical assumption is that concrete will frequently be used as a waste form or container material to control and minimize the release of radionuclide constituents in waste into the surrounding environment. Concrete encasement would contain and isolate the waste packages from the hydrologic environment and act as an intrusion barrier. Any failure of concrete encasement may result in water intrusion and consequent mobilization of radionuclides from the waste packages. The radionuclides iodine-129 (129I), selenium-75 (75Se), technetium-99 (99Tc), and uranium-238 (238U) have been identified as long-term dose contributors [1, 2], which, because of their anionic nature in aqueous solutions, may escape from the encased concrete by mass flow and/or diffusion and migrate into the surrounding subsurface environment [3-7]. Therefore, it is necessary to assess the performance of the concrete encasement structure and the ability of the surrounding soil to retard radionuclide migration. A critical component of this is to provide: (1) quantitative estimates of radionuclide retention within concrete wasteform materials (source term) similar to those used to encapsulate waste in the LLBG, and (2) measures of the effect of concrete wasteform properties on radionuclide release and migration within the near-field environment.
Computer models are essential for this purpose because impacts on groundwater resources must be projected out to time periods of 10,000 years and longer. Predictive codes require input of two main general classifications of data: 1) multiphase flow, and 2) reactive transport. Multiphase flow input is defined in the near-field hydraulic properties data package or the far-field hydraulic properties data package [8].
Laboratory testing provides a majority of the key input data required to assess the long-term performance of source-term performance and near-field radionuclide transport and fate. Details on the recommended technical strategy for developing this understanding have been published [9] and undergone review by an international panel of experts. The objective of this investigation was to implement this strategy to experimentally quantify the necessary input data for predictive simulations of radionuclide release, transport and fate from concrete source-terms in the near field environment.
The experimental materials, methods, and initial data from two principal methods, as described by McGrail et al. [9], are discussed in this data package including the pressurized unsaturated flow (PUF) test and product consistency test (PCT). Each of these test methods focus on different aspects of the concrete wasteform weathering process. Linkages between the test methods, their principal function, and the data they provide for predictive modeling is described in Table 1.1 [9].

2
Table 1.1. Overview of Test Methods
Test Method
Temperature Range
Duration Purpose Data Provided
PCT 20 to 100°C Weeks to
years
Quantitative estimates of radionuclide retention within concrete wasteform materials (source term)
Solution composition and dissolution rate as a function of surface area to solution volume ratio and temperature, secondary phases
PUF 40 – 100°C Months to
years
Measures the effect of concrete wasteform properties on radionuc1ide release and migration within the near-field environment
Effluent chemical composition and dissolution rate as a function of temperature and flow rate, secondary phases, hydraulic property changes

3
2.0 Materials and Methods
2.1 Specified Concrete Composition for Encasement
The concrete composition for the burial encasement was specified in Specification for Concrete Encasement for Contact-Handled Category 3 Waste.1 This specification was used as the basis to prepare a concrete for fabrication of test specimens. The composition includes sulfate-resistant Portland Type I or Type II cement, a pozzolanic material (Class F fly ash), fine and coarse aggregates, and steel fiber. Additional specifications include a water-to-cement ratio of 0.4 and an air content 6.0 ± 1.5%. The nominal proportions and material specifications based on this initial design are listed in Table 2.1.
Table 2.1. Material Specifications and Composition
2.2 Materials and Laboratory-Scale Mixture Design
A laboratory-scale concrete mixture (Table 2.2) was prepared based on specifications shown in Table 2.1. Because of the required small dimensions of laboratory test specimens, the size of the coarse aggregate and the dimensions of the steel fiber specified in Table 2.1 were proportionately reduced. This was accomplished by decreasing the 2-cm (~0.75 in.) coarse aggregate size in the original specification to a particle size ranging from 2.83 mm to 2 mm in the laboratory mix. The aggregate mixture passing a 7-mesh sieve and retained on a 10-mesh sieve met this particle size specification. The scaled-down steel fibers used in the laboratory mix consisted of Bekaert Dramix brand deformed steel wire fibers that were cut to a nominal length of 8 mm (0.31 in). The deformed end portions were retained for use in the concrete mixture and the straight middle section of the fiber was discarded. Based on these modifications, a concrete mix was prepared that consisted of Portland Cement (Type I & II, ASTM C-150 compliant), Class F fly ash, scaled-down coarse aggregate, fine aggregate, scaled-down deformed steel fiber, and a water-entraining agent (PolyHeed® 997). The water-entraining agent was included in the mix to facilitate the workability of the concrete. The volumes of the PolyHeed® 997 and the air-entraining agent, MB-AE™ 90, were not included in the normalization calculations because of their negligible contribution to
1 “Specification for Concrete Encasement for Contact-Handled Category 3 Waste.” 1998. Proceedings of Waste
Management.
Material Specifications Specified Field
Mix
Normalized Specification
Design
Cement Portland Type I or Type I/II sulfate-resistant cement 381 kg/m3 0.27
Fly Ash Class F fly ash; nominal 15% of cement by volume 54 kg/m3 0.04
Coarse Aggregate No. 676 or equivalent (3/4″ nominal size) 55% by volume 0.04
Fine Aggregate Sand 45% by volume 0.51
Water Nominal water-to-cement ratio: 0.4 399 kg/m3 0.10
Steel Fiber Deformed Type I, nominal length 2.5–3.8 cm (1–1.5″) 59 kg/m3 0.04
Air Content 6.0±1.5%

4
the overall mix volume. The material specification and composition for the laboratory-scale concrete mixture is given in Table 2.2.
Additionally, the water component used to prepare the respective concrete monoliths was spiked with the experimental radionuclide of interest. Technetium-bearing concrete specimens were prepared using water spiked with sodium pertechnetate to provide an equivalent concentration of 300 mg/kg technetium. Uranyl nitrate and sodium iodide were used to prepare monoliths containing 20 mg/kg uranium and 300 mg/kg iodine, respectively. The concentrations used were below saturation limits for homogeneous precipitation, but sufficient to allow for measurable release, transport, and fate measurements within the PUF column tests.
Table 2.2. Laboratory-Scale Material Specification and Composition
Material Material Specifications
for Field Mix Normalized
Laboratory DesignMaterial Specifications Used in
Revised Laboratory Mix Comparison
Cement Portland Type I or Type I/II sulfate-resistant cement
0.27 Portland Type I & II
Fly Ash Class F fly ash; nominal 15% of cement by volume
0.04 Class F fly ash; nominal 20% of cement by volume
Coarse Aggregate
No. 676 or equivalent (3/4” nominal size)
0.04 Sieve size +7 to -10 (2.83 – 2 mm size)
Fine Aggregate Sand 0.51 Sand -10 sieve size (< 2 mm)
Water Nominal water-to-cement ratio: 0.4 0.10 Water-to-cement ratio: 0.5
Steel Fiber Deformed Type I, nominal length 2.5 – 3.8 cm (1 – 1.5”)
0.04 Deformed, nominal length 8 mm (0.32 in)
PolyHeed® 997 -- 0.00375 Water-entraining agent
Air Content 6.0±1.5% 6.0±1.5% --
2.3 Concrete Mix and Specimen Preparation
Concrete monoliths were prepared with mix components added in this order: water, steel (if applicable), coarse aggregate, fine aggregate, fly ash, cement, PolyHeed® 997, and MB-AE™ 90. The concrete was mixed on medium speed using a Hobart 3-speed bench top mixer in a 4 L steel bowl. The concrete was poured into 7-mL scintillation vials in the vertical positions. After filling, the molds were lightly tapped on the laboratory bench until a significant decrease in the release of air bubbles was observed. The forms were stored in a humidity chamber to provide moisture while the concrete set.
2.4 Pressurized Unsaturated Flow Apparatus Experiments
The pressurized unsaturated flow (PUF) apparatus allows for accelerated weathering experiments to be conducted under hydraulically unsaturated conditions, thereby mimicking the vadose zone environment while allowing the weathering wasteform to achieve a final reaction state. The PUF apparatus provides the capability to vary the volumetric water content from saturation to 20% of saturation or less, minimize the flow rate to increase liquid residence time, and operate at a maximum temperature of 100°C. The PUF column operates under a hydraulically unsaturated condition by creating

5
a steady state vertical water flow, while maintaining uniform water content throughout the column, and by using gravity to assist in drainage.
The underlying principle for creating such conditions is Darcy’s Law as modified by Richards [10]
( )w mJ Kz
(1)
where Jw = volumetric flux density; m s-1 = water potential (equal to the matric potential [m] + gravitational potential [g]), m
K(m) = hydraulic conductivity as a function of matrix potential, m s-1 z = length of the column, m
It can be easily shown that if uniform moisture content is established throughout the column equation reduces to:
( )w mJ K . (2)
Equation (2) simply states that under uniform water content conditions, the volumetric flux density of water is equal to the unsaturated hydraulic conductivity.
2.4.1 Description of the PUF Apparatus
The PUF system has been previously described in other publications [11-14]. Only a general description will be provided within this document. In general, the PUF system consist of a column (7.62-cm length and 1.91-cm diameter) fabricated from a chemically inert material, polyetheretherketone (PEEK), so that weathering reactions are not influenced by interaction with the column material (Figure 2.1). A porous titanium (Ti) plate with nominal pore size of 0.2 µm is sealed in the bottom of the column to ensure an adequate pressure differential for the conductance of fluid while operating under unsaturated conditions [15]. Titanium was chosen because it is highly resistant to corrosion and has excellent wetting properties. Once the porous Ti-plate is water saturated; water but not air is allowed to flow through the 0.2-m pores, as long as the applied pressure differential does not exceed the air entry relief pressure or “bubble pressure” of the Ti-plate. If the pressure differential is exceeded, air will escape through the plate and compromise the ability to maintain unsaturated flow conditions in the column. The computer control system runs LabVIEW (National Instruments Corporation) software for logging test data to disk from several thermocouples, pressure sensors, in-line sensors for effluent pH and conductivity, and column weight from an electronic strain gauge to accurately track water mass balance and saturation level. The column also includes a “PUF port,” which is an electronically actuated valve that periodically vents the column gases. The purpose of column venting is to prevent reduction in the partial pressure of important gases, especially O2 and CO2, which may be consumed in a variety of chemical reactions.

6
Figure 2.1. PUF Column Assembly
2.4.2 PUF Experimental Setup
A total of four PUF tests were conducted: 1) control column consisting of five pieces of a concrete monolith with a total combined surface area of 2.55 x 103 mm2, 2) iodine-spiked concrete monolith with a surface area of 2.50 x 103 mm2, 3) uranium-spiked monolith with a surface area of 2.61 x 103 mm2, and 4) technetium-spiked monolith with a surface area of 2.42 x 103 mm2. The total surface area of the concrete specimens was equivalent within experimental error between the PUF tests. However, the control column consisted of five separate concrete monolith samples to afford the total surface area, whereas the others used a single concrete monolith.
Columns were packed with Hanford medium course sand and radionuclide-bearing concrete monoliths in approximately 5-g increments that were tamped and the surface was scored prior to adding subsequent layers. The columns were saturated with Hanford groundwater from the bottom up, using vacuum pressure and a flow rate of 10 mL/hr. The columns were allowed to initially desaturate by gravity drainage and also vented periodically to maintain an internal pressure less than the bubble pressure of the porous plate. The process of fully saturating the column and reducing the water content to the desired level minimizes preferential flow paths; hysteresis verifies the most consistent, uniform attainment of water content within a series of unsaturated columns, and affords a consistent method for establishing unsaturated conditions. Sediment bulk density, b (g cm-3), and volumetric water content, (cm cm-3), were determined from the mass of the sediment and water. The percent saturation was calculated from the ratio of the volumetric water content to the total porosity, , which was calculated from the bulk density and particle density, p (g cm3).
Experiments were begun under conditions that allow attainment of moisture contents of ~7 and 15 wt% and are being conducted at temperatures of 23° C. Flow was initiated with Hanford groundwater at

7
a rate of 2 mL/day under a pressure of 2 psi. Column venting was set to occur once an hour, so that the partial pressure of O2 and CO2 could remain relatively constant.
All effluent solutions were monitored for pH with in-line sensors. Prior to starting the experiments, the in-line pH probe was calibrated with National Bureau of Standards pH buffers (pH 7.00, 10.00, or 12.00 at 25°C). Precision of pH measurement was ±0.02 pH units. Effluent samples are being collected in tared sample vessels, which are acidified for elemental analysis by inductively coupled plasma-optical emission spectrometry (ICP-OES) and inductively coupled plasma-mass spectrometry (ICP-MS). The columns are being periodically analyzed using non-destructively using X-ray microtomography to evaluate, in situ, changes in porosity due to the formation of alteration phases on and from the weathering of the concrete monoliths.
2.4.3 Release Rate and Error Calculations The results from chemical analyses on collected effluent samples are used to calculate a normalized release rate according to [16]
L b2
4 ( )
(1 ) d Li i
ii
Q c cr
s f
(3)
where ri = normalized rate of release for ith element, g m-2 d-1
ciL = effluent concentration of ith element, g m-3
cib = background concentration of ith element, g m-3
d = column diameter, m
fi = mass fraction of ith element in the concrete, unitless
L = column length, m
Q = volumetric flow rate, m3 d-1
s = specific surface area of the concrete sample, m2 g-1
= porosity, unitless
= bulk concrete density, g m-3
= volumetric water content, unitless. An estimate in the uncertainty associated with the normalized rate will be calculated using standard error propagation theory, assuming the variables in Equation (3) are uncorrelated. In this case, the standard deviation of a function f(x1, x2, …xn) is given by Equation (4):
2
2
1
n
f ii
f
x
(4)
where f = standard deviation of the function f
xi = parameter i
i = standard deviation of parameter i
Assuming that the error associated with the background concentration (Ci,b), diameter (d), and column length (L) are negligible compared with the other variables, the relative standard deviation is given by

8
,
222 2 2 2 2
, ,1 1i L
i i
c
r i Q S fi B i L
rc c
(5)
Where, the tilde over the symbol signifies the relative standard deviation for the subscripted parameter. In calculating the error bounds with Equation (5) typical fixed relative standard deviations have been estimated based upon repeatability of laboratory measurements:
The value of is calculated from the variation in water content recorded by the data acquisition
system over the discrete interval between each fluid sampling. A computer macro program is available to perform this calculation directly in the ExcelTM spreadsheet used to store the sensor data.
2.5 X-Ray Microtomography
X-ray microtomography (XMT) provides a novel nondestructive imaging technique to characterize concrete samples. XMT is a method in which a sample is rotated 360º around a central axis while two-dimensional x-ray images are collected. The x-ray images are reconstructed to produce a three-dimensional representation of the sample volume. The XMT technique produces the equivalent of ‘CAT-scans.’ However, the resolution scale of the former is much finer (∼13 to 103 µm) compared with the latter. The XMT system consists of a Digital X-ray Imaging and Computed Tomography system manufactured by North Star Imaging (NSI), Inc. The X-ray generator was a Fienfocus model 160.48 160 kV Microfocus X-ray Unit with a 5 µm spot size and 10 to 160 KeV range. A computer-controlled sample manipulator with a 75-mm diameter turntable allowed 365◦ of continuous rotation and a maximum vertical travel of 150 mm. The X-ray detector was a Varian Paxscan 2520V Amorphous Silicon Cesium Scintillator with an 8” x 10” image area. The system produced cross-sectional computed tomographic (CT) images and digitized radiographs (DR). A computer data acquisition, instrument control and image reconstruction system with efx-ct software provided X-ray and sample manipulation control in addition to CT and CT Multi-Planer (MPR-3D) imaging.
Thus far, the columns have been imaged prior to saturation and initiation of the PUF tests by XMT and will continue to be re-imaged at six month intervals as discussed above (see Section 3.1). The configuration and packing of the iodine column is representative of the columns containing technetium and uranium-bearing monoliths, respectively; therefore the concrete control column and column containing the iodine-spiked monoliths have, thus far, been imaged. However, iodine absorbs x-rays. As such, XMT analysis of the iodine-spike concrete monolith provides additional features and information about the distribution of iodine within the concrete prior to initiation of testing.
The control column was imaged by XMT at 108 KeV and 337 μA, with 1 image per 0.25º of rotation or 1441 views, at a capture rate of 1.5 frames per second. The iodine-spiked concrete column was imaged at 103 KeV and 364 μA, with 1 image per ~0.25º of rotation or 1441 views, at a capture rate of 1 frame per second. For both columns, two stainless steel filters (~2 mm) were used to reduce beam hardening and detector saturation. The light field detector calibration was conducted at 75 μA and the dark field calibration was conducted with the X-Ray tube deactivated. After each sample run, a stage calibration
L L
6%, 20%, 2%
5%, 10%, 10%i i
s Q
c f

9
was conducted by imaging a NSI medium sized calibration tool at each of the sample imaging settings. Images were collected at 1 image per 6º of rotation around the central axis. The stage calibration was used by the reconstruction software to correct for errors which could be introduced by stage movement.
Two-dimensional reconstruction and three-dimensional volume rendering were conducted using efx-ct image reconstruction software. Additional advanced visualization was performed using AVIZO® Fire 7.0 image processing software. Two-dimensional slices were loaded into the AVIZO® Fire module and displayed using the voltex visualization package. Image resolution of the reconstructed column was ~28 μm/pixel.
2.6 Product Consistency Test (PCT) Experiments
The Product Consistency Test (PCT) has been standardized as an ASTM standard procedure [17]. The ASTM standard includes two methods: PCT Method A was developed specifically for verifying process control during production of vitrified HLW forms and is conducted with specific values of test parameters; PCT Method B does not specify the values of test parameters. Because the PCT Method B encompasses commonly used variations of test parameters, PCT Method B was used in this work involving concrete wasteform.
The PCTs were conducted by placing a fixed amount of concrete wasteform monolith or crushed sample with de-ionized water in a Teflon reaction vessel at 90°C. Two concrete wasteform surface-area-to-solution volume ratios (S/V) were used: 1) 1 g of concrete wasteform per 10 mL of de-ionized water to give an S/V of 2000 m-1, and 2) 1 g of concrete wasteform per 1 mL of de-ionized water to give an S/V of 20,000 m-1. The tests were conducted with concrete monoliths and crushed concrete wasteform samples. To limit water loss for long-duration experiments, the Teflon PFA reactors were sealed inside a stainless steel Parr reactor. At the end of the test, the solutions will be analyzed for the concentrations of dissolved concrete components by inductively coupled plasma-optical emission spectrometry (ICP-OES) and inductively coupled plasma-mass spectrometry (ICP-MS). Scanning-electron microscopy – energy dispersive spectrometry and z-ray diffraction will be used to analyze the solid phases and evaluate alterations in the mineralogical composition.
3.0 Results
The long-term stability of materials is controlled by solubility and the rate of dissolution. Under highly advective conditions where the rate of transport is greater than the solubility rate, the stability of the material is controlled by dissolution kinetics. Alternatively, in low to moderately advective environments where the solubility is greater than the rate of mass transport, the long-term stability of the material is based on the solubility of the phase. Complex wasteforms, such as concrete exposed to environmental conditions may exhibit complex, integrated weathering processes that include dissolution and precipitation of the wasteform itself and the secondary phases that form during reaction. Therefore, to accurately predict the long-term stability of concrete wasteforms under relevant environmental conditions, the rate of wasteform weathering and formation of secondary phases and the identity of relevant secondary phases and their impact on contaminant retention must be known.
10
3.1 XMT Visualization of PUF Column
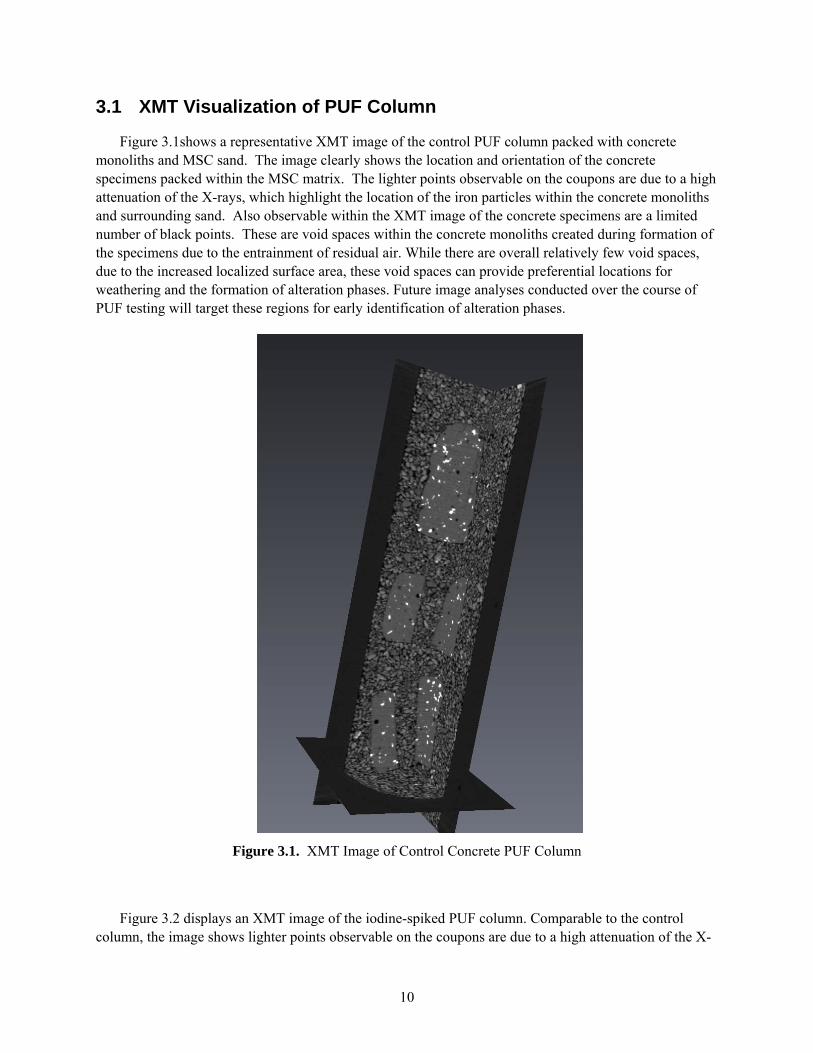
Figure 3.1shows a representative XMT image of the control PUF column packed with concrete monoliths and MSC sand. The image clearly shows the location and orientation of the concrete specimens packed within the MSC matrix. The lighter points observable on the coupons are due to a high attenuation of the X-rays, which highlight the location of the iron particles within the concrete monoliths and surrounding sand. Also observable within the XMT image of the concrete specimens are a limited number of black points. These are void spaces within the concrete monoliths created during formation of the specimens due to the entrainment of residual air. While there are overall relatively few void spaces, due to the increased localized surface area, these void spaces can provide preferential locations for weathering and the formation of alteration phases. Future image analyses conducted over the course of PUF testing will target these regions for early identification of alteration phases.
Figure 3.1. XMT Image of Control Concrete PUF Column
Figure 3.2 displays an XMT image of the iodine-spiked PUF column. Comparable to the control column, the image shows lighter points observable on the coupons are due to a high attenuation of the X-

11
rays, which highlight the location of the iron particles within the concrete monoliths and surrounding sand. However, in contrast to the control column, there is a noticeably higher percentage of light spots within the iodine-spiked column. This is a result of iodine concentrating within certain regions of the concrete matrix. Further analyses will be conducted to understand mechanisms of localized enrichment of iodine within the concrete monolith.
Figure 3.2. XMT Image of Iodine-Spiked Concrete PUF Column
3.2 PUF Column Testing
PUF column tests are still ongoing. Final results will be presented in a later report.
3.3 PCT Experiments
PCT experiments are still ongoing. Final results will be presented in a later report.

12
4.0 References
1. Mann, F.M., et al., Hanford Immobilized Low-Activity Waste Performance Assessment: 2001 Version.
2001, Pacific Northwest National Laboratory: Richland, WA. 2. Wood, M.I., et al., Performance Assessment for the Disposal of Low-Level Waste in the 218-W-5
Burial Ground. 1995, Westinghouse Hanford Company: Richland, WA. 3. Serne, R.J., et al., Leach Testing of in Situ Stabilization Grouts Containing Additives to Sequester
Contaminants. 1992, Pacific Northwest Laboratory: Richland, Washington. 4. Serne, R.J., et al., Solid-waste leach characterization and contaminant-sediment interactions. 1993,
Pacific Northwest Laboratory: Richland, WA. 5. Serne, R.J., R.O. Lokken, and L.J. Criscenti, Characterization of Grouted LLW to Support
Performance Assessment. Waste Management, 1992. 12: p. 271-287. 6. Serne, R.J., W.J. Martin, and V.L. LeGore, Leach Test of Cladding Removal Waste Grout Using
Hanford Groundwater. 1995, Pacific Northwest Laboratory: Richland, Washington. 7. Serne, R.J., et al., Leach Tests on Grouts Made with Actual and Trace Metal-Spiked Synthetic
Phosphate/Sulfate Waste. 1989, Pacific Northwest Laboratory: Richland, Washington. 8. Meyer, P.D. and R.J. Serne, Near-field hydrology data package for the immobilized low-activity
waste 2001 performance assessment. 1999, Pacific Northwest National Laboratory: Richland, WA.
9. McGrail, P.B., et al., A stategy to conduct an analysis of the long-term performance of low-activity waste glass in a shallow subsurface disposal system at Hanford. 1998, Pacific Northwest National Laboratory: Richland, WA.
10. Richards, L.A., Capillary Conduction of Liquids Through Porous Mediums. Physics, 1931. 1: p. 318-333.
11. McGrail, B.P., P.F.C. Martin, and C.W. Lindenmeier. Accelerated testing of waste forms using a novel Pressurized Unsaturated Flow (PUF) method. in Materials Research Society Symposium Proceedings. 1997.
12. McGrail, B.P., P.F.C. Martin, and C.W. Lindenmeier, Method and apparatus for measuring coupled flow, transport, and reaction processes under liquid unsaturated flow conditions, in Battelle Memorial Institute. 1999.
13. Pierce, E.M., et al., The Accelerated Weathering of a Radioactive Low-Activity Waste Glass Under Hydraulically Unsaturated Conditions: Experimental Results from a Pressurized Unsaturated Flow (PUF) Test. Nuclear Technology, 2006. 155(2): p. 149-155.
14. Wierenga, P.J. and M.T. Van Genuchten, Solute transport through small and large unsaturated soil columns. Ground water, 1989. 27(1): p. 35-42.
15. Wierenga, P.J., et al., Soil characterization methods for unsaturated low-level waste sites. 1993, Pacific Northwest Laboratory: Richland, WA. p. 7 - 16.
16. McGrail, P.B., et al., Low-activity waste glass studies: FY2000 summary report. 2000, Pacific Northwest National Laboratory: Richland, WA.
17. ASTM, Standard Test Methods for Determining Chemical Durability of Nuclear Waste Glasses: The Product Consistency Test (PCT). 1994, American Society for Testing and Materials International: West Conshohcken, PA.