Embed Size (px)
Citation preview

ANL-80-115Part I
ANL-80-1 15
MAThI
RADIOLOGICAL AND ENVIRONMENTAL
RESEARCH DIVISION ANNUAL REPORT
Fundamental Molecular Physics
and Chemistry
October 1979-September 1980
AAA
ARGONNE NATIONAL LABORATORY, ARGONNE, ILLINOIS
Prepared for the U. S. DEPARTMENT OF ENERGYunder Contract W-31-109.Eng.38
'e"; ) q I
FOREWORD
This is the tenth Annual Report on our Section's work on the physics and
chemistry of atoms, ions, and molecules - especially their interactions with
external agents such as photons and electrons. As will be seen, this year has
been one of vigorous activity.
Our main programs address themselves to some basic-science problems
fundamental to the needs of DOE and other government agencies. For instance,
the cross-section data for photoabsorption and photoonization, as well as for
electron collisions, are indispensable to a sound modeling of the action of all
ionizing radiations on matter, including biological substances. Further, the
spectroscopic data for some molecules and clusters of molecules are crucial for
the modeling of atmospheric chemistry of pollutants. Work in the above areas
is supported by the Office of Health and Environmental Research, DOE.
Another program concerns atomic physics essential to fusion-energy tech-
nology. This program is being supported by the Office of Magnetic Fusion.
More recently, new programs have been initiated in molecular spectroscopy
by the use of lasers as well as synchrotron radiation. Some of the work in these
areas is conducted under financial support from the Office of Naval Research,
Department of Defense, and other work is carried out in collaboration with the
National Bureau of Standards, U.S. Department of Commerce. We take this
opportunity to thank these agencies for their generous help which has made
possible a great expansion of the scope of our work.
The articles in the present report are loosely arranged according to the
subject matter they treat. Papers 1-20 concern photoabsorption and its con-
sequences. Note paper 20, which describes a new activity, i.e., studies on
multiphoton processes. Papers 21-28 concern electron collisions with atoms and
molecules and closely related topics. Papers 29-34 pertain to theoretical atomic
physics related to radiation physics, and papers 35-37 treat fusion-related
atomic physics.
We are pleased to announce that J. L. Dehmer and Y. -K. Kim hdve been
elected to the Fellowship of The American Physical Society for their significant

contributions to electron and atomic physics. In addition, we have enjoyed
considerable recognition in the international physics community outside the
Laboratory in several respects. First, P. M. Dehmer serves as Secretary-
Treasurer of the Division of Electronic and Atomic Physics of The American
Physical Society and is also a member of the Publication Committee. Second,
David Spcnce is spending the academic year 1980-1981 at the Joint Institute for
Laboratory Astrophysics of the University of Colorado and of the National Bureau
of Standards as a Visiting Fellow. Third, M. Inokuti was awarded a fellowship
from NORDITA (Nordisk Institut for Teorisk Atomfysik), Copenhagen, Denmark,
to serve from April to July 1980 as a Visiting Professor at the Institute of Physics,
Odense University. Finally, M. Inokuti has served as a Councilor for the
Radiation Research Society, has worked as a member of the Physics Panel for the
Department of Health, Education, and Welfare study on the Agenda for Research
into the Biological Effects of Ionizing Radiations (the final report of this work
has recently been issued by the National Institutes of Health) and continues to
work as Vice-Chairman of the Committee on Stopping Power for the International
Commission on Radiation Units and Measurements.
Mitio Inokuti
iv
TABLE OF CONTENTS
Fundamental Molecular Physics and Chemistry
Foreword
1. Photoionization and Photofragmentation of Small Clusters 1of Rare-Gas Atoms
P. M. DEHMER AND S. T. PRATT
2. Appearance Potentials of Arn Cluster Ions 5P. M. DEHMER AND S. T. PRATT
3. Autoionization of Ar2 Rydberg States Following Photoabsorption 9P. M. DEHMER AND E. D. POLIAKOFF
4. Photoionization of the Kr2 Dimer 11S. T. PRATT AND P. M. DEHMER
5. Desigr of a Photoelectron-Photoion Coincidence Spectrometer 15for Studies of Gas-Phase Cluster Species
E. D. POLIAKOFF, P. M. DEHMER, J. L. DEHMER,AND ROGER STOCKBAUER
6. The Photoelectron Spectrum of Xe3 by the Photoelectron- 18Photoion Coincidence Technique
E. D. POLIAKOFF, P. M. DEHMER, J. L. DEHMER,AND ROGER STOCKBAUER
7. Polarization of Fluorescence Following Molecular Photoionization 22E. D. POLIAKOFF, J. L. DEHMER, DAN DILL, A. C. PARR,K. H. JACKSON, AND R. N. ZARE
8. Absorption Cross Sections of the Chloromethanes from 27Threshold to 21 eV
J. C. PERSON, P. P. NICOLE, AND D. E. FOWLER
9. Microcomputer Control of Absorption Experiments 30J. C. PERSON AND P. P. NICOLE
10. Interface for Rapid Data Transfer from NIM Counters to 33SmaU Computers
JAMES C. PERSON AND PAUL P. NICOLE
11. Measurements of 6 Values and Branching Ratios in the Region 35of the 3s3p6 4p 1PO Resonance in Ar ind the 5s5p6 6p 1 PResonance in Xe 1
K. CODLING, J. B. WEST, A. C. PARR, J. L. DEHMER,AND R. L. STOCKBAUER
V

12. Triply-Differential Photoelectron Studies of Molecular 37Autoionization profiles. The 710 A - 730 1 Region of theN2 Spectrum
A. C. PARR, D. L. EDERER, B. E. COLE, J. B. WEST,R. L. STOCKBAUER, K. CODLING, AND J. L. DEHMER
13. The Effects of Autoionization on Vibrational Branching Ratios 39and Photoelectron Angular Distributions in Molecular Photo-ionization: The Formation of the Ground State of O Between574 1 and 600 1
K. CODLING, A. C. PARR, D. L. EDERER, R. STOCKBAUER,J. B. WEST, B. E. COLE, AND J. L. DEHMER
14. Vibrational-State Dependence of Partia! Cross Sections and 40Photoelectron Angular Distributions Thiough AutoionizingResonances: The n = 3 Rydberg State of the B 2E+ State ofCO
D. L. EDERER, A. C. PARR, B. E. COLE, R. STOCKBAUER,J. L. DEHMER, J. B. WEST, AND K. CODLING
15. Shape Resonances in Molecular Fields 41J. L. DEHMER AND DAN DILL
16. Pictures of Unbound Molecular Electron, Including Shape- 44Resonant States. Eigenchannel Contour Maps
D. LOOMBA, SCOTT WALLACE, DAN DILL, ANDJ. L. DEHMER
17. Shape-Resonant Features in the Photoonization Spectra of NO 46SCOTT WALLACE, DAN DILL, AND J. L. DEHMER
18. Vibrational Effects in the Shape-Resonant Photoionization 47of CO2
J. R. SWANSON, DAN DILL, AND J. L. DEHMER
19. Shape-Resonance Effects in the Photoabsorption Spectra of 50BF3
J. R. SWANSON, DAN DILL, AND J. L. DEHMER
20. Multiphoton Processes in Atoms and Molecules 51J. L. DEHMER, P. M. DEHMER, AND E. D. POLlAKOFF
21. A New Optically-Forbidden Rydberg Series in 02 Converging 53to the O c4 E~ Limit
M. A. DILLON AND DAVID SPENCE
vi

22. The Angular Dependence of Scattered Electron Spectra of 54Neon and Argon in the Region of Quasi-Discrete Auto-ionizing States
M. A. DILLON AND DAVID SPENCE
23. Studies of the 02 3 11g (V) Valence State and 3lg(R) Rydberg 55State in the Schumann-Runge Continuum from Ejected andScattered Electron Spectra
DAVID SPENCE
24. On Resonances in HF 56DAVID SPENCE
25. Energy Levels and Predissociation in Mercuric Halides 57DAVID SPENCE AND MICHAEL A. DILLON
26. Search for Long-Lived Doubly Charged Atomic Negative 63Ions
D. SPENCE, W. A. CHUPKA, AND C. M. STEVENS
27. Doubly-Differental Cross Sections of Secondary Electrons 68Ejected from Gases by Electron Impact: 25-250 eV on H 2
W. T. SHYN, W. E. SHARP, AND Y.-K. KIM
28. Cross Sections for Electron Inelastic Collisions with Argon 70E. EGGARTER AND MITIO INOKUTI
29. Spectra of the Oscillator Strength for Atoms, Molecules, 70and Solids
MITIO INOKUTI
30. Oscillator-Strength Moments, Stopping Powers, and Total 71Inelastic-Scattering Cross Sections of All Atoms ThroughStrontium
MITIO INOKUTI, J. L. DEHMER, T. BAER, ANDJ. D. HANSON
31. Bounds on Mean Excitation Energies in Terms of Oscillator- 74Strength Moments
ISAO SHIMAMURA AND MITIO INOKUTI
3z. Analytic representation of the Dipole Oscillator-Strength 75Distribution
MICHAEL A. DILLON AND MITIO INOKUTI
33. On the Fermi-Segre Formula 76MICHAEL A. DILLON
vi

34. The Future of Theoretical Atomic-Collision Physics 85MITIO INOKUTI
35. Relativistic Born Cross Sections for the Electron Impact 86Excitation
YONG-KI KIM
36. Transition Probabilities for Atoms 90YONG-KI KIM
37. Report on the Workshop on Atomic and Plasma Physics 91Requirements for Heavy Ion Fusion, Argonne NationalLaboratory, December 13-14, 1979
YONG-KI KIM
Publications 92
viW
PHOTOIONIZATION AND PHOTOFRAGMENTATION OF SMALL CLUSTERS OFRARE-GAS ATOMS
*
P. M. Dehmer and S. T. Pratt
The relative photoionization cross sections for Ar3, Ar4 , Ar 5, and Ar6 have0
been measured from threshold to 700 A at high nozzle stagnation pressures. Underthese nozzle consitions very heavy Ar clusters are formed, and their fragmenta-tion is shown to dominate the photoionization efficiency curves of the lighterclusters. The spectrum of the trimer changes dramatically as a function of nozzlestagnation pressure, clearly demonstrating the effects of fragmentation.
The relative photoionization cross sections of small rare-gas clusters have
been obtcained using a photoionization mass spectrometer which incorporates a free
supersonic molecular beam source. A brief description of the apparatus has been
given previously, and the system will be described in more detail in a future
article. The main components of the apparatus are a helium Hopfield continuum
light source, a 1-meter near-normal incidence monochromator equipped with a
1200 line/mm MgF 2 -coated Al grating, an ion focussing lens system, and a dif-
ferentially-pumped quadrupole mass filter. The wavelength selected photons are
crossed by a molecular beam from a free supersonic expansion. In the experi-
ments described here, pure argon was expanded through an orifice which was
typically 10 to 12 pm in diameter.
Figure 1 shows a plot of the pressure dependence of the Ar ion signals forn 0
n = 2 to 6 measured at a resolution of 0. 45 A and at a wavelength of 772. 5 A. At
this wavelength, which is above the Ar+ 2P1/2 ionization limit, neither the atom
spectrum nor any cluster spectrum exhibits sharp structure. It has been observed
in previous studies2-4 and can be seen in Figure 1, that the dimer can be pre-
pared in the beam over a wide range of pressures where the presence of larger
clusters is not detectable. Preparation of a beam containing only monomer, dimer,
and trimer is much more difficult, and perhaps impossible, since the tetramer and
large clusters are observed at a stagnation pressure only slightly higher than
*Thesis Parts Participant. Permanent address: Department of Chemistry, YaleUniversity, New Haven, Connecticut 06511.
1
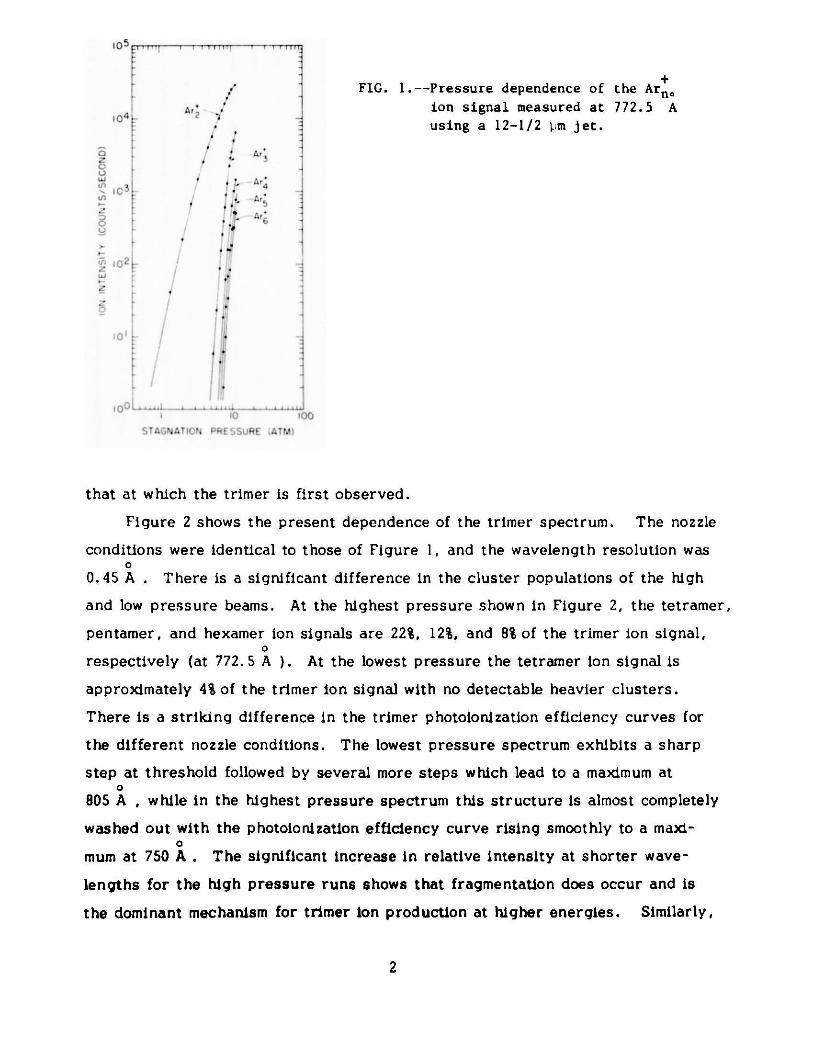
1 +FIG. 1.--Pressure dependence of the Arno
ion signal measured at 772.5 A
using a 12-1/2 pm jet.
C)
0
that at which the trimer is first observed.
Figure 2 shows the present dependence of the trimer spectrum. The nozzle
conditions were identical to those of Figure 1, and the wavelength resolution was0
0.45 A .There is a significant difference in the cluster populations of the high
and low pressure beams. At the highest pressure shown in Figure 2, the tetramer,
pentamer, and hexamer Ion signals are 22%, 12%, and 8% of the trimer ion signal,
respectively (at 772. 5 A ).At the lowest pressure the tetramer ion signal is
approximately 4% of the trimer ion signal with no detectable heavier clusters.
There is a striking difference in the trimer photoionization efficiency curves for
the different nozzle conditions. The lowest pressure spectrum exhibits a sharp
step at threshold followed by several more steps which lead to a maximum at
805 A , while in the highest pressure spectrum this structure is almost completely
washed out with the photoionization efficiency curve rising smoothly to a maxd-
mum at 750 A The significant increase in relative intensity at shorter wave-
lengths for the high pressure runs shows that fragmentation does occur and is
the dominant mechanism for trimer Ion production at higher energies. Similarly,
2
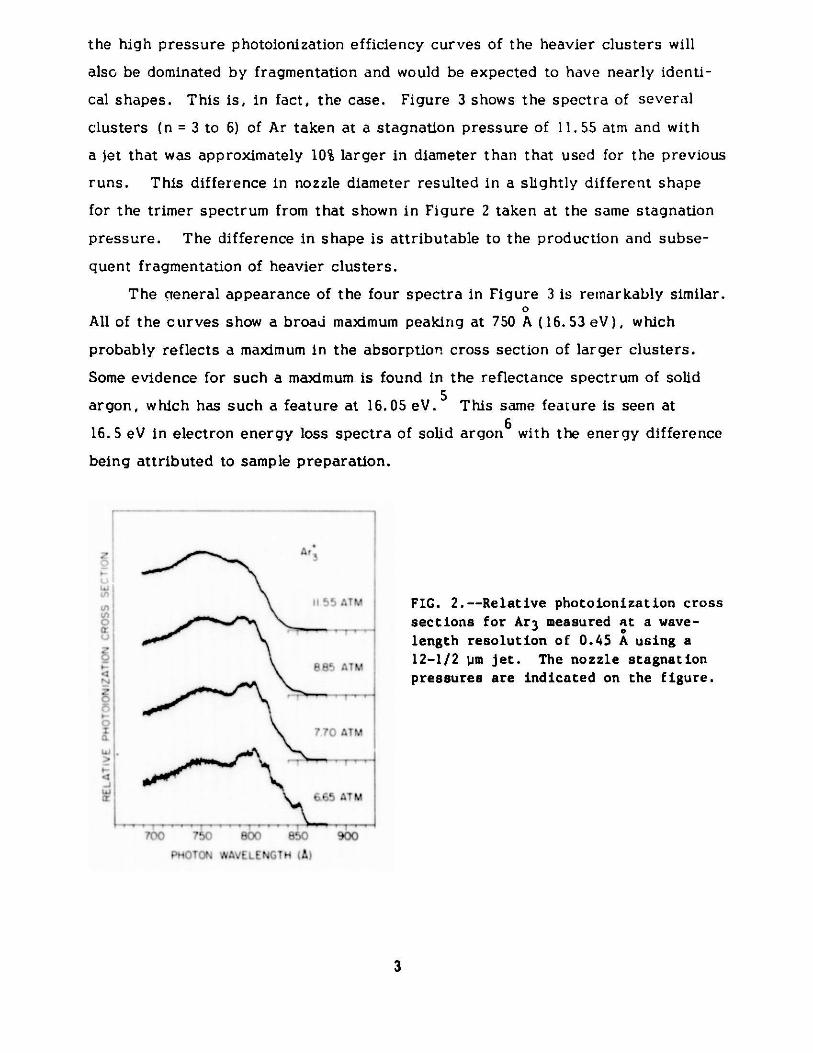
the high pressure photoionization efficiency curves of the heavier clusters will
also be dominated by fragmentation and would be expected to have nearly identi-
cal shapes. This is, in fact, the case. Figure 3 shows the spectra of several
clusters (n = 3 to 6) of Ar taken at a stagnation pressure of 11.55 atm and with
a jet that was approximately 10% larger in diameter than that used for the previous
runs. This difference in nozzle diameter resulted in a slightly different shape
for the trimer spectrum from that shown in Figure 2 taken at the same stagnation
pressure. The difference in shape is attributable to the production and subse-
quent fragmentation of heavier clusters.
The general appearance of the four spectra in Figure 3 is remarkably similar.0
All of the curves show a broad maximum peaking at 750 A (16.53 eV), which
probably reflects a maximum in the absorption cross section of larger clusters.
Some evidence for such a maximum is found in the reflectance spectrum of solid
argon, which has such a feature at 16.05 eV.5 This same feature is seen at
16. 5 eV in electron energy loss spectra of solid argon6 with the energy difference
being attributed to sample preparation.
FIG. 2.--Relative photoionization cross
sections for Ar 3 measured at a wave-length resolution of 0.45 A using a12-1/2 pm jet. The nozzle stagnationpressures are indicated on the figure.
700 750 800 900
PHOTON WAVELENGTH (A)
3

FIG. 3.--Relative photoionization cross
sections for Ar 3 to Ar 6 measured at a
wavelength resolution of 0.45 A usinga 12-1/2 pm jet. The nozzle stagna-
tion pressure was 11.55 atm for all
the runs.
PHOTON *AVfiTui- -
We are now working to understand both the low pressure trimer spectrum
(which is representative of the true trimer spectrum) and the high pressure
trimer and heavier spectra (which are representative of the spectra of all of the
heavier clusters).
References
1. P. M. Dehmer and E. D. Poliakoff, Chem. Phys. Lett. 77, 326 (1981).2. A. van Deursen, A. van Lumig, and J. Reuss, Int. J. Mass Spectrom. Ion
Phys. 18, 129 (1975).3. D. Golomb, R. E. Good, a:.d R. F. Brown, J. Chem. Phys. 52, 1545 (1970).4. D. Golomb, R. E. Good, A. B. Bailey, M. R. Busby, and R. Dawb'arn,
J. Chem. Phys. 57, 3844 (1972).5. B. Sonntag, Rare Gas Solids, Vol. II, M. L. Klein and J. A. Venables, Eds.,
Academic Press, London, pp. 1020-1117 (1977).6. J. A. Nuttall, T. E. Gallon, M. G. Devey, and' J.A.D. Matthew, J. Phys.
C 8, 445 (1975).
4
APPEARANCE POTENTIALS OF Ar+ CLUSTER IONSn
*P. M. Dehmer and S. T. Pratt
The photoionization appearance potentials for Ar2 and Ar3 were determinedat a resolution of 0. 45 using several different nozzle stagnation pressures inorder to investigate the effects of fragmentation on the threshold. The appear-ance potentials for Ar 4 , Ar 5 , and Ar4 were also determined.
As is shown by Eq. 1 below, accurate values of the adiabatic ionization
potential (IP) of the Ar ar.d Ar clusters are required to calculate the dis-n + n-i
sociation energy of the Ar molecular ion.n
D (Ar+ - Ar) =IF(Ar ) +D (Ar ) -IP(Ar ) . (1)0 n-1 n-1 0 n n
A fundamental problem for the smaller rare gas clusters is that, because of the
large change in geometry upon ionization, the Franck-Condon factor for ioniza-
tion to the vibrational ground state is extremely small. In fact, for the argon
dimer the Franck-Condon factor is negligible for approximately 0. 8 eV above
the adiabatic IP. I Although the Franck-Condon factor between the neutral and
ionic states of the trimer may be better, there is still a large geometry change,
ard direct ionization will be insignificant near the adiabatic IP. 2 Ionization is
observed, however, in the threshold region, but for the dimer and trimer (and
probably many of the heavier clusters), this ionization is due solely to auto-
ionization. Thus, the adiabatic IP will be observed only if there is a high
density of autoionizing molecular Rydberg states in the threshold region.
We have attempted to determine whether the adiabatic IPs of Ar2 and Ar3
are actually observed by making a careful study of the threshold regions of
these clusters at two different pressures. Assuming that the dissociation energy
of a neutral cluster Ar into Arn-1 + Ar is equal to the dimer dissociation energy
of 12 meV, then dissociative ionization of Ar to form Ar + Ar will have an n-1 +
threshold 12 meV above the Ar1 adiabatic ionization threshold (e. g., Ar2 will
*Thesis Parts Participant. Permanent address: Department of Chemistry, YaleUniversity, New Haven, Connecticut 06511.
5

0be formed via dissociative ionization of Ar3 at 12 meV, or approximately 0.7 A,
ahove the Ar2 adiabatic IP). Thus, a comparison of the appearance potential of
Ar2 obtained with a low pressure beam (containing only monomer and dimer) and
with a high pressure beam (containing a mixture of hedvy clusters) is very
instructive. If the appearance potential is invariant with nozzle stagnation pres-
sures, this is strong evidence that the appearance potential is actually the
adiabatic ionization potential.
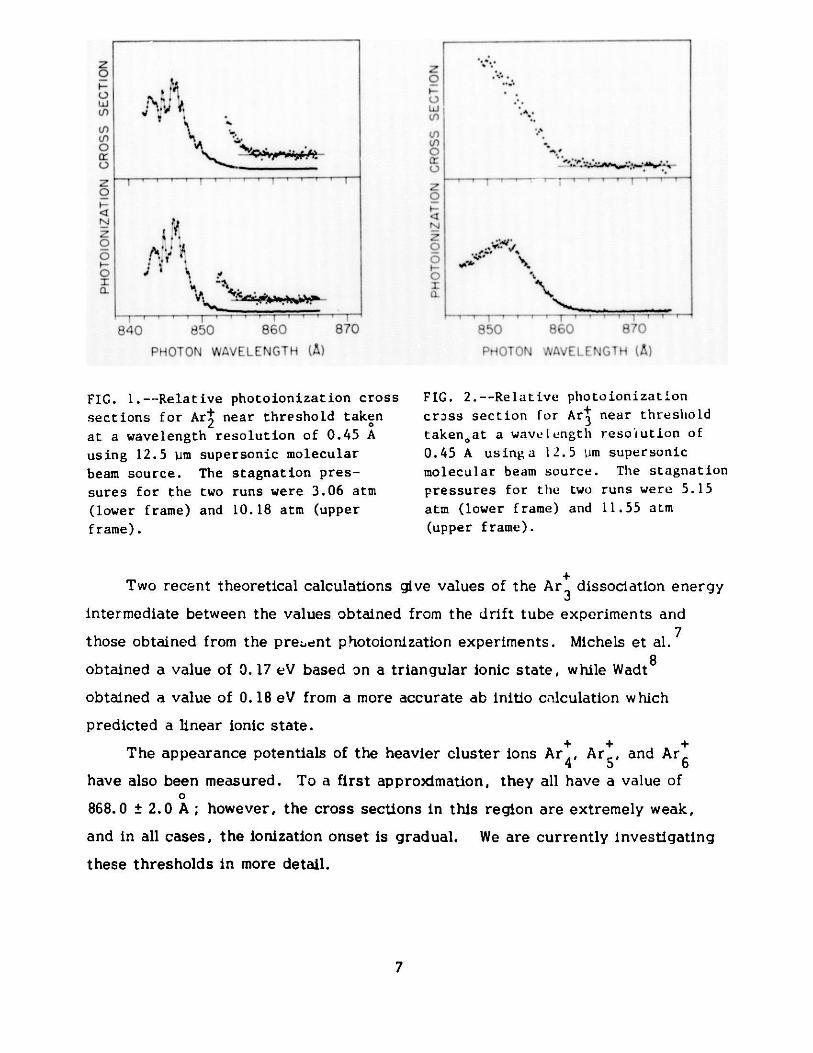
Figure 1 shows the Ar threshold region taken at a wavelength resolutiono 2
of 0. 45 A and at stagnation pressures of 3.06 and 10. 18 atm. The counting rate0
at 848 A was approximately a factor of three greater in the high pressure run.
The threshold region of the high pressure run rises more steeply than that of0
the low pressure run, but in both cases the threshold is At 855.0 1.5 A,
lower than our previously reported value, 4 and reflects the extremely conservative
estimate of the magnitude of the collisional ionization. A careful inspection of
Figure 1 shows that the structure in the two runs is identical, but that in the
high pressure run it is sup.;rimposed on a structureless background. This
background is due to fragmentation of larger clusters. The fact that the threshold
does not shift as a result of fragmentation supports the hypothesis that the
adiabatic IP actually is observed.
Figure 2 shows the Ar3 threshold region taken at a wavelength resolutionO3
of 0. 45 A and stagnation pressures of 5. 15 and 11.55 atm. These stagnation
pressures yielded 15 and 7.5 x 10³ ion counts per second, respectively, at0
800 A. From expanded versions of Figure 2 the threshold was determined to be0
865.0 1. 5 A. There is no apparent shift in the appearance potential (AP) with
pressure; however, the statistics are poorer than those of tie dimer runs.
Assuming that the appearance potentials for Ar 2 and Ar 3 are equal to the
adiabatic ionization potentials, and using a value of 12 meV for D0 (Ar3 ), the
dissociation energy of Ar3 is calculated to be 0. 18 0. 05 eV. Turner and5 6
Conway and Fehsenfeld et al. have obtained values of the dissociation energy
of Ar3 of 0.219 0.005 eV and 0. i/ eV, respectively, by studying the tempera-t + +
ture dependence of the reaction Ar 2 + A r A r 3 using the flow tube techniques.
6
z0 ]
PHOTO W EENTt()
at a aeeghrsluv no .5A
sIg
0
0~
0
840 850 860O 870
PHOTON WAVELENGTH (A)
FIG. 1.--Relative photoionization cross
sections for Ar+ near threshold taken20at a wavelength resolution of 0.45 A
using 12.5 prn supersonic molecular
beam source. The stagnation pres-
sures for the two runs were 3.06 atm
(lower frame) and 10.18 atm (upper
frame).
K01LU
0j
0
850
PHOTON WAVELENGTH (A)
FIG. 2.--Relative photoionization
crass section for Ar+ near threshold3taken~at a wavelength resolution of
0.45 A usinga 12.5 urm supersonic
molecular beam source. The stagnation
pressures for the two runs were 5.15
atm (lower frame) and 11.55 atm
(upper frame).
Two recent theoretical calculations give values of the Ar3 dissociation energy
intermediate between the values obtained from the drift tube experiments and
those obtained from the pre:.ent photoionization experiments. Michels et al.
obtained a value of 0. 17 eV based on a triangular ionic state, while Wadt 8
obtained a value of 0. 18 eV from a more accurate ab initio calculation which
predicted a linear ionic state.
The appearance potentials of the heavier cluster ions Ar , Ar , and Ar4 5 6
have also been measured. To a first approximation, they all have a value of0
868.0 2.0 A ; however, the cross sections in this region are extremely weak,
and in all cases, the ionization onset is gradual. We are currently investigating
these thresholds in more detail.
7

References
1. P. M. Dehmer and J. L. Dehmer, J. Chem. Phys. 69, 125 (1978).2. E. D. Poliakoff, P. M. Dehmer, J. L. Dehmer, and R. Stockbauer, submitted
for publication.3. R. J. LeRoy, J. Chem. Phys. 57, 573 (1972).4. P. M. Dehmer and E. D. Poliakoff, Chem. Phys. Lett. 77, 326 (1981).5. D. L. Turner and D. C. Conway, J. Chem. Phys. 71, 1899 (1979).6. F. C. Fehsenfeld, T. J. Brown, and D. L. Albritton, Bull. Am. Phys. Soc.
24, 124 (1979).7. H. H. Michels, R. H. Hobbs, and L. A. Wright, Appl. Phys. Lett. 35,
153 (1979).8. W. R. Wadt, Appl. Phys. Lett., in press.
8

AUTOIONIZATION OF Ar2 RYDBERG STATES FOLLOWING PHOTOABSORPTION
P. M. Dehmer and E. D. Poliakoff
The relative photoionization cross section of Ar was measured in the wave-
length region 775 to 860 A at a resolution of 0. 28 A. Portions of the spectrum
were taken at higher resolution. Figure 1 shows a small portion of the spectrum
taken at a resolution of 0.07 A which encompasses the first prominent structure
above the ionization threshold. Autoionization dominates this region of the
spectrum and there is no contribution from direct ionization. A comparison of
the ionization spectrum and the high resolution liquid nitrogen temperature ab-
sorption spectrum obtained by Tanaka and Yoshino 2,3 reveals significant dif-
ferences in the intensities of some of the peaks. For example, the very weak
peaks at ", 119600 cm I in the ionization spectrum are among the most intense
peaks in this region in the absorption spectrum. This suggests that predis-
sociation and/or fluorescence may be alternate decay paths for these molecular
states.
4O00 11850020000F_
ON
ft'I
SW,- - 0
ft
0
i-I ft
44
At O TA)N ENERGY cm
FIG. l.--Relative photoionization cross
section for Ar2 (Ar2)near the ioniza-tion threshold. The atomic energy
levels are also shown in the figure,
with those that are optically allowed
indicated by heavy lines. Optically
allowed molecular states dissociating
to these atomic limits are indicated.
The atomic transitions are shifted in
energy with respect to the molecular
transitions by an amount equal to Dnof the ground state; this places the
atomic and the molecular transitions
on the same energy scale assuming that
all of the molecular transitions orig-
inate in v" -0 of the ground state.
9
* * - 0
0
0C)
U1
0a.
*NSF Postdoctoral Fellow, September 1979-August 1980.
Incipient vibrational structure observed in many of the bands is the basis
for tentative Rydberg state assignments. Many of these Rydberg states are
expected to be members of series converging to excited states of the Ar molecular2
ion. The most striking feature of the spectrum in the region above the ioniza-
tion threshold is the lack of regular structure, indicating that curve crossings
and perturbations severely affect the potential energy curves.
References
1. P. M. Dehmer and J. L. Dehmer, J. Chem. Phys. 69, 125 (1978).2. Y. Tanaka and K. Yoshino, J. Chem. Phys. 53, 2012 (1970).3. Y. Tanaka, private communication.
10

PHOTOIONIZATION OF THE Kr2 DIMER
S. T. Pratt and P. M. Dehmer
Preliminary results on the photoionization of the Kr2 van der Waals moleculeare presented. Autoionization structure is observed throughout the regionstudied, and aLove the 2P3/2 atomic Kr limit the Kr+ structurestrongly resemblesthat of Kr+ but is shifted to longer wavelengths, yielding information on the dis-sociation energies of these excited states.
The relative photoionization cross section of the Kr2 dimer was determined0 0
at a resolution of 0. 15 A (FWHM) in the wavelength rcgion 900 to 970 A with a
photoionization mass spectrometer which incorporated a supersonic molecular
beam source for the production of the Kr2 van der Waals molecule. The un-
skimmed molecular beam was photoionized using monochromatized light from the
helium Hopfield continuum, and the resulting photoions were mass analyzed with
a quadrupole mass filter.1,2
Figure 1 shows the Kr2 spectrum obtained with a Lb urn orifice and a stag-
nation pressure of 2. 44 atm. At this stagnation pressure there is very little
trimer in the beam. Spectra taken at higher stagnation pressures exhibit the
same structure superimposed on a bat.sground continuum, which is due to frag-
mentation of larger clusters. The general features of the fragmentation process
have been discussed previously for Ar2 and Ar3 3 Also shown in Figure 1 is
the spectrum of atomic krypton obtained using the same orifice and a stagnation
pressure of 0. 29 atm.0 4 5,6
The equilibrium bond distance is 4.007 A in Kr2 neutral and 2.79 A
in the Kr2 ion. Because of this large difference in equilibrium geometry, direct05ionization is negligible until approximately 920 A, and autoionization accounts
for all of the observed structure, with the exception of some readily identifiable
chemi-ionization lines. Because there is no direct ionization near the lowest
threshold, we must rely on a high density of autolonizing states in this region
*
Thesis Parts Participant. Permanent address: Department of Chemistr", YaleUniversity, New Haven, Connecticut 06511.
11

FIG. 1.--Relative photoionization
cross sections for Kr and Kr 2 from
a supersonic nozzle with a 25 n
diameter orifice and stagnation
pressures of 0.29 and 2.44 atm,
respectively, both taken with
V 0.15 A resolution.
0!
% 0AA.f NG T'.
to observe the adiabatic ionization potential. The appearance potential, which0 5
we equate with the adiabatic IP is 963. 85 0.15 A. Using 16 meV as the dis-o 7
sociation energy D0 of Kr 2 neutral, and 885.63 A as the IP of atomic Kr, we
found the dissociation energy D of Kr2 to be 1.152 0.002 eV. This is in0 2 8
excellent agreement with the results of Ng et al. who measured the photoioniza--
tion cross section of Kr2 at low resolution using a skimmed supersonic beam. As
in the case of the Ar2 dimer, this indicates that collisional ionization is not a
serious problem when free, unskimmed jets are use1 to determine accurate
adiabatic IPs for van der Waals molecules. In addition, the high sensitivity due
to increased number density in the free jet makes it an extremely useful technique.
There are six electronic states of the Kr ion in the wavelength region of9 2+
Figure 1. The ground state and the first three excited states of Kr2 dissociate22
to a ground state atom and a P3/2 ion; in the nomenclature appropriate for small
internuclear distances these states are labelled A E/2 B 2 , C 2 u'2 stte ar1aele/ i2u' B 3/2g' H3/2u'2 9
and B I1 in order of increasing energy. The adiabatic thresholds of the2 + 1/2g 2 0 5
A E and B 2I states are 963. 85 and 895. 2 A, respectively. The21/2u 23/2g
C 2 and B 2 states are either very weakly bound or purely repulsive3/2u 1/2g 5,6 2
in the Iranck-Condon region, and their thresholds are very near the P3/22 2+ + /atomic It'. The next two excited states are labelled C 2I and D E and
1/2u 1/2g
12

2 9dissociate to a ground state atom and a P2P./2 ion. The adiabatic IP of the
C r1/2u state is 852. 7 A, and the D state is probably repulsive. Thus, from
threshold to 895. 2 A there are autoionizing Rydberg series converging to the
five electronically excited limits, as well as Rydberg states with vibrationally+ 1
excited A state cores. As in the case of Ar2, the occurrence of curve cross-2'ings and perturbations between the large number of states in this region removes
nearly all of the regularity in the observed structure. We are now in the
process of analyzing several of the low-lying bands in greater detail.0 2
The region between about 900 A and the P 3i2 atomic IP at 885.6 A is very
complicated owing to the large number of autoionizing molecular states and the2
chemi-ionizing atomic states converging to the P3/2 limit.23/Above the P3/ atomic IP there are only two atomic Ryclherg series, ns'
and nd', and the Kr2 spectrum becomes noticeably simpler. Even so, following10 1 *standard coupling rules, it is found that the combination of Kr( S) + Kr (ns')
0 *gives rise to two optically allowed molecular states and that Kr ( S0)+ Kr (nd' )
gives rise to six allowed states, yielding a total of eight optically allowed series.2 + 5,6
Because the D 2E/2 state is repulsive, molecular states :onverging to thisI /2g 5limit should be shifted approximately 16 meV (the Kr2 neutral dissociation
energy D0 ) to the blue of the atomic Rydberg states. Most of the dimer peaks
are shifted to the red of the atomic structure and thus appear to be in Rydberg
series converging to the C 2 1/2u limit. Although there are very few trends in
the quantum defects of these states, preliminary analysis indicates that the0
peaks at 885. 4, 874.7, and 869. 3 A are part of a Rydberg series converging to
the C 2,1/2u limit. The dissociation energies calculated for these molecular
states increase monotonically in the series toward the ionic dissociation energy,
and the quantum defects are relatively constant. Further analysis, as well
as experiments in the analogous region in Xe2 , will lead to a better understanding
of these states.
References
1. P. M. Dehmer and E. D. Poliakoff, Chem. Phys. Lett. 77, 326 (1981).
2. P. M. Dehmer, to be pubUshed.
13

3. P. M. Dehmer and S. T. Pratt, to be published.4. J. A. Barker, R. 0. Watts, J. K. Lee, T. P. Schafer, and Y. T. Lee,
J. Chem. Phys. 61, 3081 (1974).5. P. M. Dehmer and J. L. Dehmer, J. Chem. Phys. 69, 125 (1978).6. W. R. Wadt, J. Chem. Phys. 68, 402 (1978).7. K. Yoshino and Y. Tanaka, J. Opt. Soc. Am. 49, 159 (1979).8. C. Y. Ng, D. J. Trevor, B. H. Mahan, and Y. T. Lee, J. Chem. Phys.
66, 446 (1977).9. R. S. Mulliken, J. Chem. Phys. 52, 5170 (1970).
10. G. Herzberg, Spectra of Diatomic Molecules, Von Nostrand, Princeton,pp. 319-320 (1950).
14

DESIGN OF A PHOTOELECTRON-PHOTOION COINCIDENCE SPECTROMETERFOR STUDIES OF GAS-PHASE CLUSTER SPECIES*
E. D. Poliakoff, P. M. Dehmer, J. L. Dehner, and Roger Stockbauer
Clusters of atoms have properties qualitatively different from those of
either free atoms or macroscopic solids. There is great interest in the nicro-
scopic physical and chemical properties of small clusters because they are proto-
type systems for the study of catalysis and aerosol fomation. Among '*e possible
experimental probes of clusters, photoelectron spectroscopy is particularly desir-
able for several reasons. The photoelectron spectrum of a cluster yields in-
formation directly on the electronic properties of the cluster anti cluster ion,
e.g., ionization potentials and relative transition strengths. Indirectly,
structural information is obtained by correlating peak shapes with Frank-Condon
envelopes. Furthermore, there is a wealth of photoelectron spectra for free
atoms and solids, i.e., the limits of cluster behavior. Unfortunately, conven-
tional photoelectron spectroscopy of clusters is impractical because methods of
cluster production result in a broad distribution of n-mer sizes, leading to
severe difficulties in selectively probing a particular cluster. In this report
we describe an instrument that detects the ion mass in coincidence with the
photoelectron kinetic energy, and thus surmounts the primary obstacle which
prevents acquisition of unambiguous, mass-specific photoelectron spectra.
The experimental apparatus consists of a 2-in mean radius electron spectro-
meter,1 a time-of-flight mass spectrometer, a dc discharge resonance lamp
(He I, 21.21 eV), and a free-jet supersonic molecular beam source;2 see
Figure 1 for the experimental schematic. For the present measurements,
electrons ejected at 900 with respect to the radiation propagation vector passed
through a 0.080 in diameter slit and were analyzed at 5 eV pass energy,
resulting in 110 meV electron energy resolution. The mass spectrometer con-
sists of ten stack plates, followed by a drift tube, two biasing grids, and a
Summary of a paper being prepared for publication.
National Bureau of Standards, Washington, D.C. 20234.
15

I
0
FIG. l.--Schematic diagram of theexperimental apparatus. The maincomponents are:
(1) Concentric hemispheres(2) Mounting plate for hemispheres
and entrance and exit lenses(3) Herzog lenses(4) Deflector plates(5) Three-aperture "zoom" lenses(6) Exit aperture(7) Channeltron detector(8) 2-mm (i.d.) capillary leading
to lamp (not shown)(9) Entrance aperture
(10) Supersonic gas jet(11) Gas jet holde:(12) Shield and holder for capillary
tube(13) Sapphire ball bearing(14) Drive shaft(15) Mounting rods(16) Ion acceleration stack plates(17) Holder for stack plates and
drift tube(18) Drift tube(19) Drift tube-detector mounting
bracket(20) p-metal detector housing(21) "Venetian blind" electron
multiplier(22) Drift tube potential grid(23) Retarding grid
16
------- ----

detector (venetian blind electron multiplier). The gas beam intersects the VUV
radiation between the first two stack plates. The first five plates are quiescently
grounded and receive a voltage pulse to extract the ion upon detection of an
electron. The whole system is interfaced to a microcomputer via a CAMAC crate.
Sample Xe cluster spectra (see next report) require data accumulation of three
hours for a particular mass and electron energy. The false coincidences are
measured by generating a random "electron" pulse and observing the resulting
mass spectral intensities. For the present measurements, a 2. 5-pm diameter
nozzle is used. The electronics which drive this apparatus will be discussed in
a forthcoming article.3 Experimental results are given in the following report.
References
1. J. L. Dehmer and D. Dill, Phys. Rev. A 18, 164 (1978).2. P. M. Dehmer and J. L. Dehmer, J. Chem. Phys. 69, 125 (1978); 68, 3462
(1978).3. E. D. Poliakoff, P. M. Dehmer, J. L. Dehmer, and Roger Stockbauer, to be
published.
17

THE PHOTOELECTRON SPECTRUM OF Xe3 BY THE PHOTOELECTRON-PHOTOION COINCIDENCE TECHNIQUE *
E. D. Poliakoff, P. M. Dehmer, J. L. Dehmer, and Roger Stockbauer
Using the apparatus described in the previous report, we have obtained the
first photoelectron-photoion coincidence spectrum of a single component, namely
Xe3, in a mixture of clusters. Thus we have selected the photoelectron spectrum
of Xe out of overlapping photoelectron spectra of Xe, Xe, Xe3,... present in
the beam. This measurement is the first step toward elucidation of the electronic
structure changes occur ring in the condensation of free atoms to form solids.
For comparison, the photoelectron-photoion coincidence spectrum of Xe was
also measured. Because the Xe photoelectron spectrum has already been
determined by a simpler method, the dimer coincidence spectrum provides a
check for experimental artifacts. Because the dimer spectrum is so markedly
different from the trimer spectrum (as will be shown), the comparison demon-
strates the value of the coincidence technique for selective studies of cluster
species.
The stagnation pressure used to produce a beam of monomer plus dimer t
was 1.51 atm; for a beam containing monomer, dimer, trimer, and very small
amounts of higher n-mers, the stagnation pressure was 2. 19 atm. Higher stag-
nation pressure spectra of trimer were recorded to ensure that fragmentation
of higher n-mers did not significantly affect the Xe3 results.3
Portions of the coincidence spectra of Xe2 and Xe3 are shown in Figure 1, re-
vealing considerable differences. The vertical ionization potential (IP) shifts from
*
Summary of an article published in J. Chem. Phys. 75, 1568 (1981).tSurface Science Division, National Bureau of Standards, Washington, D.C. 20234.
Conditions can be obtained where only monomer and dimer are present. (SeeRefs. 1 and 2.
It should be noted that states of Xe3 that fragment will not be counted ascoincidences and thus will not appear in the Xe3 spectrum shown in Figure 1.
18

11.85 eV in Xe21 to 11. 47 0.09 eV in Xe3. The peak in the Xe3 spectrum is
also broader than the one in the Xe2 spectrum. Several sources of broadening
account for the width of this Xe3 peak. First, the 1 eV region shown is pre-+ 4
dicted to contain vertical transitions to the four lowest ionic states of Xe 3 ,
some of which undoubtedly overlap because of the 110 meV electron energy
resolution. Second, the neutral ground state geometry is triangular with inter-0 5
nuclear separations of 4. 36 A, while the ionic ground state is predicted to be06linear with an internuclear separation of 3. 47 A. Because of the extreme change
in equilibrium geometry upon excitation to the ionic ground state, a broad
Franck-Condon envelope is expected. Finally, the Xe3 clusters formed in the
supersonic expansion may be vibrationally excited, thus further contributing
to the broadening.
The relationships that exist between the photoelectron appearance potentials
and adiabatic IP's for Xe2 and Xe3 show the start of a trend. Although the
adiabatic IP of Xe3 has not been determined directly, it can be estimated from
Eq. 1.
Xe3 D(eIP(Xe) 3D (X3
Xe 3Xe +Xe . ()
D0(Xe3) Xe2 + Xe IP (Xe2
To a first approximation, D0(Xe3) can be taken as the Xe2 dissociation energy5 + 2
which is 0.024 eV. The dissociation energy of Xe3 is 0.27(2) 1V and the8
adiabatic IP of Xe2 is 11. 13(1) eV. Hence, the adiabatic IP of Xe3 is \, 10. 88(4)
eV. From Ref. 1, the Xe2 electron appearance potential was determined to be
11.76 0.01 eV. The present work shows that the Xe3 electron appearance
potential is 11. 30 0. 05 eV. Thus, as the cluster size increases from dimer to
trimer, the electron appearance poLential moves closer to the adiabatic IP.
Furthermore, the solid-state Xe photoeraission data of Schwentner et al. indicate
that the threshold for photoemission9 and the photoelectron energy distribution
curves10 yield identical appearance potentials, confirming the limit of this trend
19

Xe (Xe 2 )
103-
FIG. 1.--Photoelectron-photoiun coin-Zcidence spectra of Xe2 and Xe3. The
U Xe+ 2P3/2 state is at 12.130 eV.
UZ
5 103-
12.0 11.5IONIZATION ENERGY (eV)
as the "infinite cluster" is approached.
These observed features will serve as demanding tests for theoretical
treatments of atomic clusters. (See, for example, Refs. 6, 11, 12. ) As the
sizes of the clusters studied more thoroughly bridge the gap between free atoms
and solids, the trends that exist as condensation proceeds will become more
apparent. Furthermore, the coincidence technique will serve as an important
complement to related techniques. Studies on surface-supported clusters 1 3
can be compared with the gas-phase coincidence spectra discussed in this paper
to assess substrate-overlayer interactions, which can be significant.14 In a
similar way, matrix-cluster interactions can be assessed which may be present
in matrix isolation experiments.15,16 The interplay of the coincidence technique
with other methods undoubtedly will be a critical aspect of future studies.
References
1. P. M. Dehmer and J. L. Dehmer, J. Chem. Phys. 68, 3462 (1978).2. A. van Deursen and J. Reuss, Int. J. Mass. Spectrom. Ion Phys. 23,
109 (1977).3. E. D. Poliakoff, P. M. Dehmer, J. L. Deher, and R. Stockbauer, to be
published.4. W. R. Wadt, private communication.5. J. A. Barker, R. 0. Watts, J. K. Lee, T. P. Schafer, and Y. T. Lee,
J. Chem. Phys. 61, 3081 (1974).
20

6. W. R. Wadt, Appl. Phys. Lett., in press.7. H. Helm, Phys. Rev. A 14, 680 (1976).8. C. Y. Ng, D. J. Trevor, B. H. Mahan, and Y. T. Lee, J. Chem. Phys.
65, 4327 (1976).9. N. Schwentner, M. Skibo'Nski, and W. Steinmann, Phys. Rev. B 3, 2965
(1973).10. N. Schwentner, F.-J. hlmpsel, V. Saile, M. Skibowski, W. Steinmann, and
E. E. Koch, Phys. Rev. Lett. 34, 528 (1975).11. D. R. Salahub and R. P. Messmer, Phys. Rev. B16, 2526 (1977).12. R. L. Martin and E. R. Davidson, Mol. Phys. 35, 1713 (1978).13. S.-T. Lee, G. Apai, M. G. Mason, R. Benbow, and Z. Hurych, Phys. Rev.
B 23, 505 (1981); M. G. Mason, L. J. Gerenser, and S.-T. Lee, Phys.Rev. Lett. 39, 288 (1977) and 39, 1372 (1977); G. Apai, J. F. Hamilton,J. Stohr, and A. Thompson, Phys. Rev. Lett. 43, 165 (1979).
14. C. P. Flynn and Y. C. Chen, Phys. Rev. Lett. 46, 447 (1981).15. M. Moskovits and D. P. LiLella, J. Chem. Phys. 72, 2267 (1980).16. G. A. Thompson and D. M. Lindsay, J. Chem. Phys. 74, 959 (1981);
D. M. Lindsay, D. R. Herschbach, and A. L. Kwiram, Mol. Phys. 32,1199 (1976).
21

*POLARIZATION OF FLUORESCENCE FOLLOWING MOLECULAR PHOTOIONIZATION
E. D. Poliakoff, J. L. Dehmer, Dan Dill, A. C. Parr, 4 K. H. Jackson,and R. N. ?-re
Molecular photoionization is an inherently anisotropic process since degen-
erate ionization pathways have different symmetries and, in general, different
dipole strengths. This anisotropy will manifest itself by partial alignment of
the residual ion which depends only upon the relative dipole strengths of the
alternative photoelectron channels. We show that this alignment of molecular
ions can be probed directly by measuring the polarization of their fluorescence,
and th.t this polarization yields the relative strengths for degenerate photo-
electron channels. To demonstrate the effect, we report the first such measure-+ 2 +
ment, for the N B + state produced by photoionization of N in the range2 2, U 2
450 A < X < 660 A, and compare the results with model calculations. The
excitation-fluorescence sequence studied is given by
1 + + 2+ -+ 2+N2(X Z )+hv+ N2(B E ) + e (LO 9c~i ) N (X ) + hv' . (1)
2 g 2 u g g 2 g
In this case, photoionization proceeds via o (parallel) and -T (perpendicular)I g 2 g
transition dipoles. A quantum-mechanical analysis shows that the fluorescence
polarization is given by
P= ( - () /( + a ) ,(2)
where o and a are the cross sections for production of the B state followed1H Iby its decay to the X state by fluorescence polarized parallel and perpendicular
to the incident c-vector, respectively. These cross sections are given by
*Summary of an article published in Phys. Rev. Lett. 46, 907 (1981).
Consultant, Radiological and Environmental Research Division. Permanentaddress: Department of Chemistry, Boston University, Boston, MA 02215.
4 National Bureau of Standards, Washington, D.C. 20234.
Department of Chemistry, Stanford University, Stanford, CA 94305.
22

o = j (B -+X) (2j, + 1)2(j0 10 !jf0) 2
f*
-1 2-* -x (2t, + 1) (10,lq it q)X D , ,DI
t 1t. t. j~ j *uY 1 i f *
X 11 j0 ti )( 1'* ti P Z ji 0 ti P)(Z1 ji 0 i )(3
Here, the D , defined in Eq. 3 of Ref. 3 are photoionization emplitudes for
ejection of an electron with asymptotic orbital momentum Q and with projection
i along the molecular axis of both Q and the dipole interaction. The quantum
numbers, J.,j, and j , give the rotational momenta of the initial neutral N2 , the
excited N2, and the final (ground-state) N2. The angular correlation between
the ionization and fluorescence dipole interaction can hava harmonics t = 0, 1,2.
The angular momentum transferred from the ionizing dipole interaction to the
excited state molecular rotation is t. . The polarization is parallel for q = 0 and1
perpendicular for q = 1. Finally, the fluorescence cross section is represented
by o(B -+ X). The result is for the E + X +- E transition sequence studied here.
The general expression and its fuller discussion will be presented in a subsequent
publication. 2
For completeness, we note that a classical formulation also predicts a polar-4 2 2
ization in fluorescence. If D and D are the dipole strengths for a and iT
a 7T 2 2continuum channel ionizations, respectively, and we define R = D ID , then
'IT
Pclassical = (1 - R) /(7 + 13 R) . (4)
To illustrate the general behavior of the new theoretical formulation pre-
sented in Eq. 3, we will use dipole amplitudes D calculated using the multiple
scattering model (MSM). We emphasize, however, that Eq. 3 represents a
general theoretical framework which can be evaluated using dipole strengths
computed from a whole hierarchy of approximations, from the model calculation
used here to much moi e sophisticated calculations incorporating electron cor-
relation, vibrational effects, etc. We see from Eq. 3 that, in the quantum
23

mechanical formulation, the polarization depends both on the dipole strengths2 E - 2 2 E - 2D_ I 2,I and D D, and on the interference of the dipole
amp itu 'des for a given '. However, numerical evaluation of Eq. 3 shows that
for j. ' 5 the interference terms have negligible effect, i.e., except for very low2 2
temperatures, the polarization depends only on the dipole strength ration D /D"T ~
(Figure la). Furthermore, for j. 2 5, the polarization computed from Eq. 31
agrees precisely with that derived from the classical formulation, Eq. 4 (see
dashed curve in Figure lb). The j.= 3 and 4 curves are not shown in Figure lb,
but lie just above the j. = 5 curve. Note that a Boltzmann-weighted average is
not shown in Figure lb but is accurately represented by the j. = 5 curve. For1
low j., the quantal cotational motion and the interference terms combine to yield1
polarizations greater than the classical prediction, especially for j. = 0 for which1
P '" 20% over a very large energy range. This predicted temperature dependence
could be experimentally tested by using a supersonically-cooled expansion. We
are planning such an arrangement for future studies.
The experimental apparatus has bec'i described previously. The experi-
mental results are shown in Figure lb. Referring to Fig. ib, the threshold for2 7+ 5
the B + state production is at 18.757 eV; data were also taken between 4 andu 6
8 eV kinetic energy, but this region contains many autoionizing resonances
which could distort the results. However, data taken on a 0.25 energy mesh near0
the 554. 1 A resonance revealed no discernible resonance structure in the polar-
ization dependence. We see that the observed polarization is positive
and decreases with increasing photon energy; the highest degree of polarization
measured was P = 0.052 0.003 at an energy of 0.7 eV above threshold. Clearly
all of the experimental points in Figure lb lie substantially below the predictions
(j, = 5) based on the MSM model. This, in turn, implies the experimentally1 2 2
deduced D /D ratios will be larger than the theoretical ones, as indicated inn 0
Figure Ia. On the one hand, the agreement between the MSM-level calculation
and experiment is poor, and clearly indicates the need for improved calculations
of the dipole amplitudes. On the other hand, the MSM calculation serves to
exhibit basic aspects of the theory in Eq. 3 and acts as a point of reference for
future improvements as follows. First, the model calculation properly reflects
24

2 2- FIG. 1.--Energy dependence of D Tr/DU and the
"& t polarization, P, for the Nt(B 2 E+) state. The
photon energy corresponding to & l zero of the
graph is 18.757 eV (see Ref. 5). Note that the
020 energy scale changes at 10 eV kinetic energy.
(a) MSM predictions and experimental determin-
ation for D2/D2; (b) MSM predictions and ex-
-. - perimental determinations for P. The numbers
refer to the value of ji. The ji = curve is
dashed and is indistinguishable from the
' classical result using the MSM dipole strengths.0 I M tO 0
2 2the positive slope of D /D at low energies and the approach of this ratio to
unity at high energy, where the dynamics are dominated by the spherical environ-2 2
ment in the atomic cores. The general increase in D /D at low energy is caused11
by the suppression near threshold of the d-wave lead term of the , continuumg
wave function by centrifugal forces. Second, future improvement in the calcula-
tion can be confined to computing better dipole amplitudes, which can then be
transformed into the observable polarization by use of Eq. 3. The inaccuracy
in the MSM-based amplitudes are, of course, a consequence of the a:'proximations3
implicit in the MSM model; however, we note that 2o photoionization in Nu 2
appears to be a somewhat pathological case, e.g., the photoelectron symmetry
parameters for this channel were by far the worst in an MSM treat.nent3 of the
valence levels of N 2. This might imply the problem traces to electron correla-
tion effects or nuclear motion effects. Two possibilities are interchannel coupling7 2 + +
with states associated with the C 2E state of N2 and intrachannel coupling whichu 2would redistribute the -i oscillator strength distribution whose concentration
g 3in the ha valence state by the centrifugal barrier is probably overemphasized
gby a one-electron treatment. Third, as the temperature-dependent effects
derive mainly from geometric considerations, implicit in Eq. 3, the qualitative
aspects of the temperature dependence in Figure lb are valid, although the2 2
quantitative aspects are suspect, owing to the inaccurate D /D ratio used here.
In conclusion, the measurement of fluorescence polarization following
molecular photoionization to excited states yields the ratio of dipole strengths
25

for degenerate ionization channels. This experiment is the newest member of
a class of experiments which probes the alignment of atomic8,9 and molecular1 0
ions and which, by virtue of not detecting (integrating over) the photoelectron
ejection angle, are independent of the relative phases of the ionization channels.
Though these techniques have yet to be extensively exploited, they are important
complements to the traditional measurements of photoelectron branching ratios
and angular distributions, providing the additional information necessary to
determine the magnitudes and phases of dipole transition amplitudes separately.
Combining these complementary probes will therefore lead to a new level of
understanding of molecular photoionization dynamics.
We wish to thank Dr. M. G. White and Dr. S. Wallace for helpful discus-
sions and S. Wallace for valuable assistance in evaluating Eq. 3. We are grate-
ful to Dr. R. P. Madden and the staff of the NBS-SURF II facility for their
generous cooperation during this work.
Reference s
1. G. Herzberg, Spectra of Diatomic Molecules, Van Nostrand Reinhold Co.,New York (1950).
2. D. Dill, to be published.3. D. Dill and J. L. Dehmer, J. Chem. Phys. 61, 692 (1974). J. L. Dehmer
and D. Dill, Electron-Molecule and Photon-Molecule Collisions, T. Rescigno,V. McKoy, and B. Schneider, Eds., Plenum Publ. Corp., New York (1979);S. Wallace, D. Dill, and J. L. Dehmer, J. Phys. B 12, L417 (1979); J. L.Dehmer, D. Dill, and S. Wallace, Phys. Rev. Lett. 43, 1005 (1979).
4. E. D. Poliakoff, J. L. Dehmer, D. Dill, A. C. Parr, K. H. Jackson, andR. N. Zare, Phys. Rev. Lett. 46, 907 (1981).
5. G. R. Cook and P. H. Metzger, J. Chem. Phys. 41, 321 (1964).6. K. Codling, Astrophys. J. 143, 552 (1966).7. A. L. Roche and J. Tellinghuisen, Mol. Phys. 38, 129 (1979) and references
therein.8. C. D. Caldwell and R. N. Zare, Phys. Rev. A 16, 255 (1977); H. Klar,
J. Phys. B 13, 2037 (1980) ; W. Mauser and W. Mehlhorn, to be published.9. S. Flugge, W. Mehlhorn, and V. Schmidt, Phys. Rev. Lett. 29, 7 (1972).
10. J. L. Dehmer and D. Dill, Phys. Rev. A 18, 164 (1978).
26

ABSORPTION CROSS SECTIONS OF THE CHLOROMETHANES FROM THRESHOLDTO 21 eV*
J. C. Person, P. P. Nicole, and D. E. Fowler
The chloromethanes are an important class of industrial chemicals, and they
are sources of chlorine atoms for atmospheric photochemistry. We report our
measurements of the absorption cross section o for methyl chloride, methylene
chloride (CH 2Cl 2 ), chloroform (CHCl ), and carbon tetrachloride from the ab-
sorption threshold (near 6 eV) up to 21 eV.
Two experimental techniques were used. For photon energies below 11.7
eV, the measurements were made in an 8.49-cm long absorption cell with LIF
windows; the split-beam detector systemI uses sodium salicylate fluorescence
and two photomultipliers to measure the light absorption. At energies above
the ionization potential, we used a windowless dual ion chamber with the front
chamber 7.39 cm long and the rear chamber 21.07 cm. The monochromator was
a McPherson Model 225, and the bandpass was 0. 09-nm FWHM. The light sources
were a hydrogen discharge, used for energies below 13.2 eV, and a helium con-
tinuum for energies above 12.6 eV. Capacitive manometers (Baratrons) from
MKS Instruments were used to measure the gas pressures, and the 1-torr
Baratron was calibrated with an oil manometer.
An overall view of the data is given by Figure 1, which shows a plot of o,
where 1 Mb = 101 cm2 , over the entire energy range. For regions with sharp
structure, it is uncertain whether the bandpass is narrow enough to avoid line-
saturation errors. The data shown in Figure 1 for each gas consists of a com-
posite of results obtained for part of the energy range for four pressures, and
have not been averaged over multiple runs. Furthermore, the data from the
windowed cell are not in final form in respect to energy-scale adjustments, or
for corrections for light that is reflected at the windows and for gas fluorescence;
*Summary of a paper presented at the VI International Conference on VacuumUltraviolet Radiation Physics, Charlottesville, Virginia June 2- (, 1980.SUndergraduateResearc.h Participant from Macalester College, St. Paul. MN 55101.
27
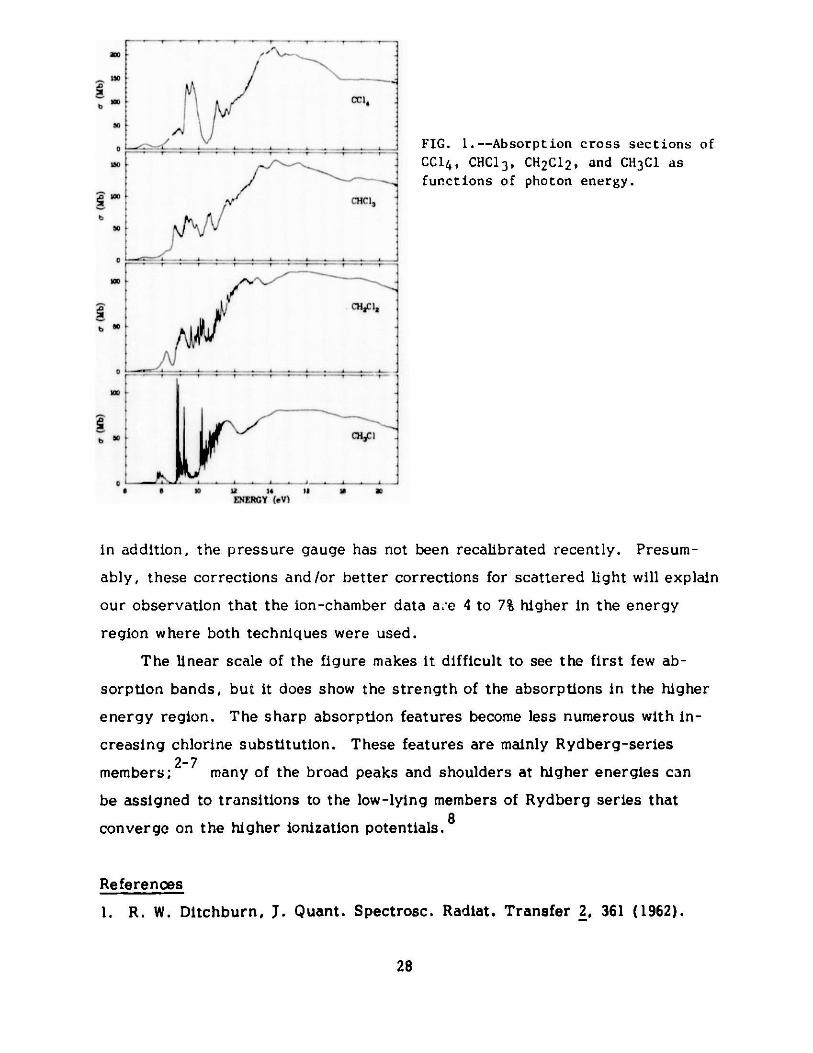
b
5O0
bo
bWO
b W CH3C 1
0 a L? 3 4 is I'm a1
ENFRGY (eV)
FIG. 1.--Absorption cross sections of
CC14 , CHC1 3, CH2C12 , and CH3C1 as
functions of photon energy.
in addition, the pressure gauge has not been recalibrated recently. Presum-
ably, these corrections and/or better corrections for scattered light will explain
our observation that the ion-chamber data are 4 to 7% higher in the energy
region where both techniques were used.
The linear scale of the figure makes it difficult to see the first few ab-
sorption bands, but it does show the strength of the absorptions in the higher
energy region. The sharp absorption features become less numerous with in-
creasing chlorine substitution. These features are mainly Rydberg-series
members;2-7 many of the broad peaks and shoulders at higher energies can
be assigned to transitions to the low-lying members of Rydberg series that
converge on the higher ionization potentials. 8
References
1. R. W. Ditchburn, J. Quant. Spectrosc. Radiat. Transfer 2, 361 (1962).
28

2. W. C. Price, J. Chem. Phys. 4, 539 (1936).3. C. R. Zobel and A.B.F. Duncan, J. Am. Chem. Soc. 77, 2611 (1955).4. B. R. Russell, L. 0. Edwards, and J. W. Raymonda, J. Am. Chem. Soc.
95, 2129 (1973).5. J. W. Raymonda, L. 0. Edwards, and B. R. Russell, J. Am. Chem. Soc.
96, 1708 (1974).6. P. Hochmann, P. H. Templet, H.-t. Wang, and S. P. McGlynn, J. Chem.
Phys. 62, 2588 (1975).7. S. Felps, P. Hochmann, P. Brint, and S. P. McGlynn, J. Mol. Spectrosc.
59, 355 (1976).8. A. W. Potts, H. J. Lemka, D. G. Streets, and W. C. Price, Philos. Trans.
R. Soc. London 268A, 59 (1970).
29

*MICROCOMPUTER CONTROL OF ABSORPTION EXPERIMENTS
J. C. Person and P. P. Nicole
An inexpensive microcomputer system is used to control experiments that
measure photoabsorption cross sections. The control includes positioning the
monochromator wavelength, positioning a filter wheel, controlling valves to
change the gas sample, timing the photomultiplier counters, and reading data
giving the temperature, pressure, and counter readings. The data are written
on magnetic tape after correction for effects such as counter dead time, scat-
tered light, and dark counts. Analog signals are output to a chart recorder to
give a visual presentation of the absorption spectrum and the lamp intensity.
There are several choices available for small computers to control laboratory
experiments. We believe that one of the major advantages of having a small
computer is the flexibility possible if one can rapidly change the computer program-
ming. This flexibility is especially valuable during the setup of a new exper-
iment when the operating procedures are being tested; flexibility is even more
important when the computer has enough capacity to do the entire calculation
so that the results are immediately available - without waiting for a larger
computer to process the data. Thus, we recommend choosing a computer
system sophisticated enough to have convenient software, yet simple enough to
be independent of outside help. The computer system should also be modular
to permit easy additions.
We believe that a computer system using the S-100 bus and the 808J or
Z-80 microcomputer chip represents a good choice because of the wide variety
of low-cost components and software available. We recommend starting with an
8" floppy-disk drive (two drives are a very good investment for ease in making
back-up disks and for certain other operations during software development).
An essential companion of the disk drive(s) is the disk-operating system, such
*Summary of a paper presented at the VI International Conference on VacuumUltraviolet Radiation Physics, Charlottesville, Virginia, June 2-6, 1980.
30
*as the CP/M or MP/M software from Digital Research. We also recommend a
FORTRAN compiler, as BASIC interpreters are often too slow and assembly-
language programs are time-consuming to develop.
There are plug-in cards available for the S-100 bus fur tasks such as
analog-to-digital conversion (ADC), digital-to-analog conversion (DAC), parallel
and serial input/output (I/O) ports, and real-time clocks. Voltages from
pressure-measuring instruments, etc., can be input to a multiplexed ADC to
provide data to the computer, and parallel I/O ports can usually be connected
to any device that provides digital outputs.
We have found that the printing counters manufactured by EG&G Ortec,
Inc. can be easily interfaced to two parallel I/O ports, and the Ortec Model
779 interface /controller module is not required in our application. With an 8080
microcmioputer with a 2-MHz clock rate, the rate of transfer of data is more than
16,000 digits/s, which is greater than the 1920-digits/s maximum rate of the
Ortec Model 779. We should also point out that this interface does not require
the printing counter to have the parallel-output option.
During the initial setup of the computer system, it is desirable to have
expert help, as there may be machine and programming errors, and it is very
difficult to learn a new system when it is not working properly. However, once
the system is set up, the user can soon become nearly independent of outside
experts. We have used static, rather than dynamic, memory, and we have
found no problems of compatibility when using components supplied by different
manufacturers. Furthermore, we have found the system to be quite reliable -
aside from a few failures during the breaking-in period.
In one test case, we found a FORTRAN program about ten times slower in
our 8080 than on a PDP 11/60 and about 100 times slower than on an IBM 3033A
under CMS. A BASIC version of the same program ran in our machine about
50 times slower. However, with the FORTRAN program, we are able to read in
data from two counters and a digital thermometer, as well as voltages giving the
*Digital Research, Box 579, Pacific Grove, CA 93950.
tEG&G Ortec, Inc., 100 Midland Road, Oak Ridge, TN 37830.
31

pressure measured by two sensors. The program subtracts the dark counts,
corrects for the dead times, calculates the gas density as well as the absorption
cross section, and sends pulses to the wavelength-stepping motor - all in a
time of 2 to 3 s. We usually count for 10 s or more at each point, and, if we
operate the counter-timer using interrupts, we have nearly all of the counting
time available for calculations so that we could make even more sophisticated
data corrections.
We position the monochromator wavelength by using a parallel output port
to send impulses to the up or down inputs (photo-isolated) on a stepping motor
translator module. The filter wheel is mounted on one lid of the McPherson
Model 225 monochromator, and it is dirven by a rotary solenoid through a rotary
vacuum feedthrough and a right-angle drive. The 115-V power on the solenoid*
coil is controlled by a photo-isolated, solid-state relay with zero-voltage AC
turn-on, and the relay is controlled by a parallel output port. We also use these
relays to control the solenoid valves on our gas-handling system. Thus, with
an S-100 main frame, an 8080 or Z-80 CPU, 32 to 64 k of memory, a dual floppy-
disk system, some I/O ports - along with the ADC and DAC, and some soft-
ware, one can assemble a rather powerful computing facility for $5000 to $7000
or $6000 to $9000 if one includes a terminal.
Reference
1. J. C. Person and P. P. Nicole, Rev. Sci. Instrum. 51, 1425 (1980); alsothis report.
32
*Opto 22, 5842 Research Drive, Huntington Beach, CA 92649

INTERFACE FOR RAPID DATA TRANSFER FROM NIM COUNTERS TO SMALLCOMPUTERS
James C. Person and Paul P. Nicole
The printing counters manufactured by EG&G Ortec, Inc. (and similar
companies such as Tennelec, Inc. ') feature data outputs that can be connected
in a print loop with up to 50 different modules daisy-chained together. These
loops usually connect to a serial interface controller, such as the Ortec Model
779 interface-controller module or the Tennelec Model TC 588 buffered printer
interface module, and the small computer then communicates with the controller
via a serial input-output (I/O) port. The serial link may be required if the
data must be transmitted over a large distance, but this limits the rate of data
transfer to 1920 digits/s. We have found that it is not necessary to use an
interface-controller module, and we wire the print loop data and control lines
directly to two parallel I/O ports on our small computer. One of the features
of the Ortec and Tennelec printing counters is that all of the data are transfer-
red one digit at a time over four data lines, which is more convenient than when
the data must be transferred with four separate lines for each digit. The
print loop also has three conti Ol lines for the data transfer, and there are two
more controls for the gate and reset lines on the counters. As a result, the
interconnecting wiring involves only four data lines to a parallel input port and
five control lines to a parallel output port.
The specific interface we constructed is for use with two Ortec Model 770
counters which are 6-decade scalers in standard NIM modules. These counters
should be representative of azy of the modules that are compatible with the
Ortec print loop. Our small computer uses the Intel 8080 COU chip, and we
have tried two different types of parallel I/O ports: one uses the Motorola
MC6820 IC (integrated circuit) and one uses the Intel 8212 IC. If pull-up
resistors are not already installed on the port, then they must be installed for
tEG&G Ortec, Inc., 100 Midland Road, Oak Ridge, TN 37830.
Iennelec, Inc., 601 Turnpike, Oak Ridge, TN 37830.
33

the four data lines in the print loop, since the Model 770 counter uses Signetics
8881 gates, which have bare output collectors. The resistance value should
be in the range of 300 to 1600 ohms; larger resistors can be used if the number
of modules in the print loop is less than 50. In addition, we found that installa-
tion of a 1-kohm resistor controlled the noise problems we experienced on the
print-advance lines.
The programming of the 8080 IC consists of a subroutine to initialize the
I/O ports, if necessary, and a series of subroutines to start, stop, and reset the
counters, and a subroutine to control the print, print advance, and previous-
module-finished lines so as to read in the four bits of binary-coded-decimal
(BCD) data for each digit in the print loop. This routine also does a logical
.OR. between the data and 3016, which converts the BCD representation into
the ASCII representation of the digit. The ASCII digits are then stored in
memory in an array that is ready for printing or to be read by FORTRAN pro-
grams for data manipulations. This subroutine transfers and converts the
12 digits from our two counters in 0.68 mn, or more than 17k digits /s.
In conclusion, this interface is easy to install, it permits rapid data
transfer, and it saves the cost of a separate interface-controller module.
Reference
1. DCL Series 8000 Handbook, Signetics Corporation, Sunnyvale, CA, Sec. 4-
5 (May 1968).
34
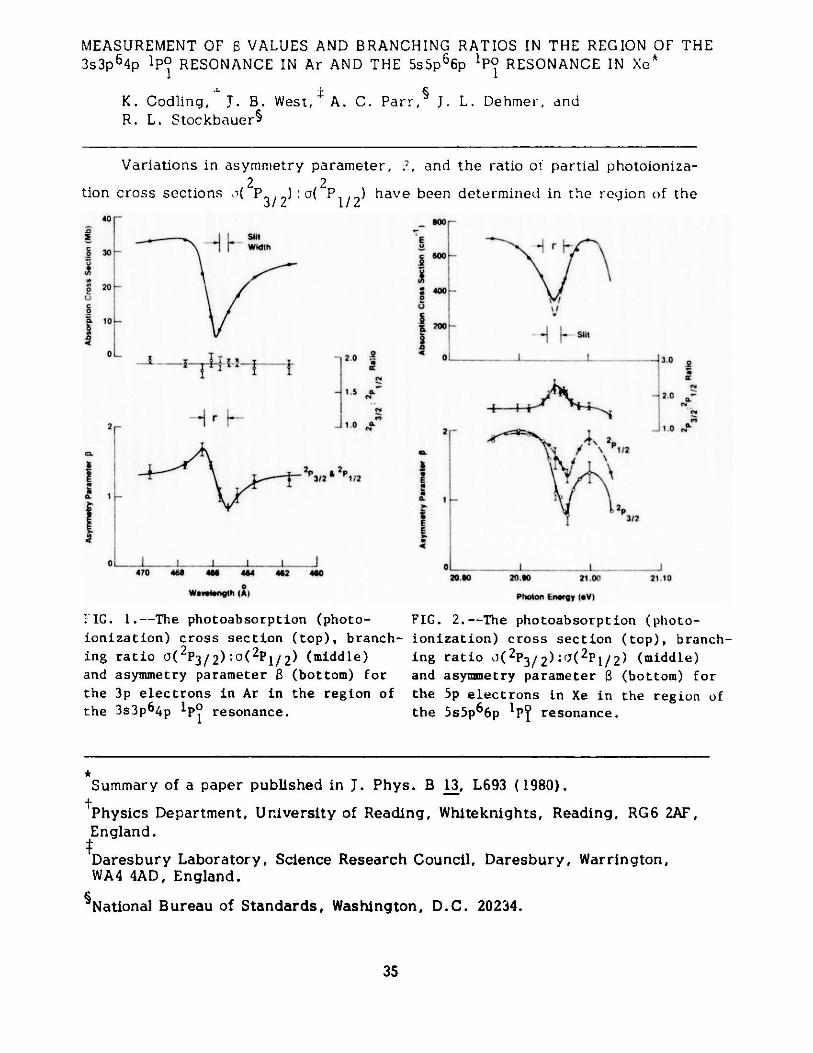
MEASUREMENT OF S VALUES AND BRANCHING RATIOS IN THE REGION OF THE3s3p 6 4p 1PO RESONANCE IN Ar AND THE 5s5p 6 6p 'PO RESONANCE IN Xe*
1 1
K. Codling, J. B. West, A. C. Parr, J. L. Dehmer, andR. L. Stockbauer
Variations in asymmetry parameter, 2, and the ratio of partial photoioniza-
tion cross sections (2 3/2 (2 P 1/2) have been determined in the region of the
I --.j-~314.j ~
600[
E
c 400r
0
200-
120 2 01
S1.5 C
1 0 a"
3/2 2 1/2
470 468 466 464 462 460
Wavelength (A
E
EE
r r
sat
P 3\ 12
20.601 I
20.60 21.0c?
Photon energy (eV)
.43.0
S2.0
1 0
12
1
21 10
;IG. L.--The photoabsorption (photo-
ionization) cross section (top), branch-
ing ratio o(2P3/ 2):(2p1/2) (middle)
and asymmetry parameter a (bottom) for
the 3p electrons in Ar in the region of
the 3s3p64p IpO resonance.
FIG. 2.--The photoabsorption (photo-
ionization) cross section (top), branch-
ing ratio j(2P3/ 2):(2p1/2) (middle)
and asymmetry parameter S (bottom) forthe 5p electrons in Xe in the region ofthe 5s5p66p 1PY resonance.
*Summary of a paper published in J. Phys. B 13, L693 (1980).
tPhysics Department, University of Reading, Whiteknights, Reading, RG6 2AF,England.
*Daresbury Laboratory, Science Research Council, Daresbury, Warrington,WA4 4AD, England.
SNational Bureau of Standards, Washington, D.C. 20234.
35
40 1 si
30
20
10L
00
2
oL
2
a.
I

3s3p 64p 1P resonance in Ar (Figure 1) and the SsSp66p P1 resonance in Xe
(Figure 2). In both cases there is a considerable variation in B through the
resonance. In Ar the B values for the spin-orbit components are similar, in
Xe significantly different. In Xe, the branching ratio shows a modest variation
through the resonance, whereas in Ar no noticeable change occurs.
36
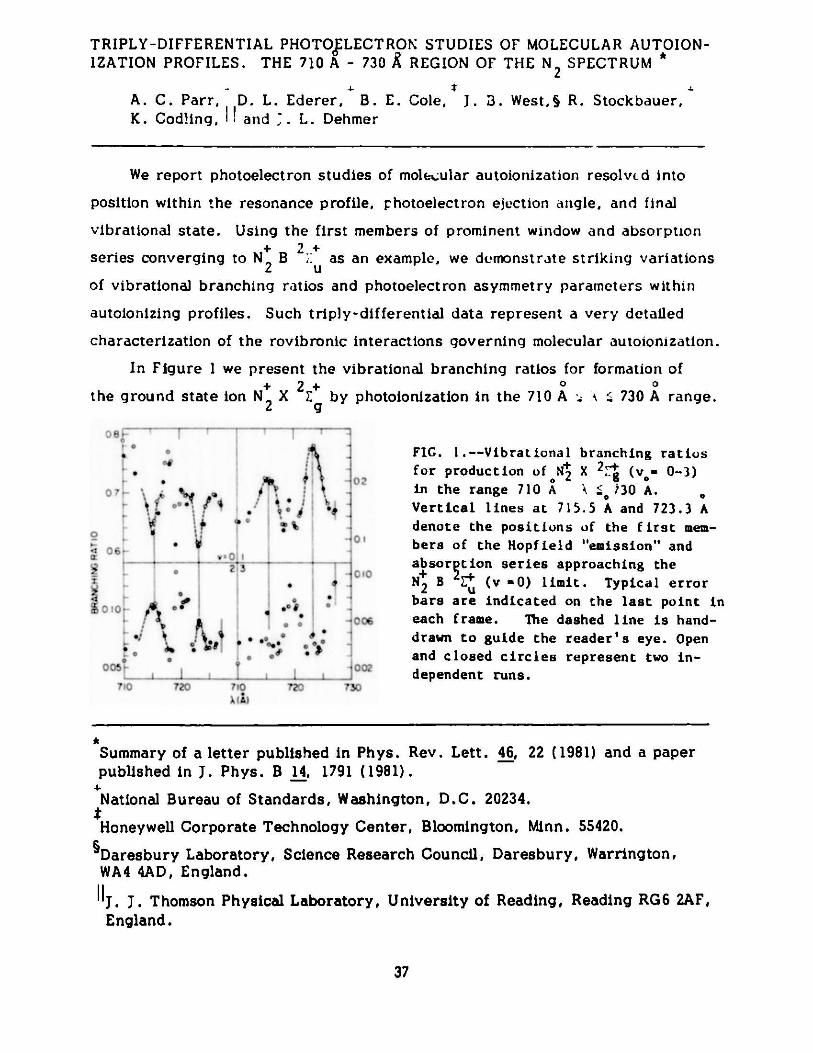
TRIPLY-DIFFERENTIAL PHOTO.LECTRON STUDIES OF MOLECULAR AUTOION-IZATION PROFILES. THE 710 A - 730 A REGION OF THE N2 SPECTRUM *
A. C. Parr, D. L. Ederer, B. E. Cole, J. 3. West, R. Stockbauer,K. Codling, I and -. L. Dehmer
4-
We report photoelectron studies of molkular autoionization resolved into
position within the resonance profile, photoelectron ejection angle, and final
vibrational state. Using the first members of prominent window and absorption+2 +
series converging to N+ B 2 as an example, we demonstrate striking variations2 u
of vibrational branching ratios and photoelectron asymmetry parameters within
autoionizing profiles. Such triply-differential data represent a very detailed
characterization of the rovibronic interactions governing molecular autoionization.
In Figure I we present the vibrational branching ratios for formation of+ 2 + 0 0
the ground state ion N+ X E by photolonization in the 710 A a k - 730 A range.2 g
0
1 06.-7-
-
* 0
05
710 72
2 3
0
M 73*
720 73(
FIG. l.--Vibrational branching ratiosfor production of X 2,+ (v,- 0--3)in the range 710 A \ 5, 130 A.Vertical lines at 715.5 A and 723.3 Adenote the positions of the first mem-bers of the Hopfield "emission" andabsorption series approaching theN B Z (v -0) limit. Typical errorbars are indicated on the last point ineach frame. The dashed line is hand-drawn to guide the reader's eye. Openand closed circles represent two in-dependent runs.
Summary of a letter published in Phys. Rev. Lett. 46, 22 (1981) and a paperpublished in J. Phys. B 14, 1791 (1981).
4-
National Bureau of Standards, Washington, D.C. 20234.*Honeywell Corporate Technology Center, Bloomington, Minn. 55420.
Daresbury Laboratory, Science Research Council, Daresbury, Warrington,WA4 4AD, England.
'J. J. Thomson Physical Laboratory, University of Reading, Reading RG6 2AF,England.
37
a
eA
0105. 2 3
00 v
S.
A~ .0
S
S 0
-05'
A
FIG. 2.--Photoelectron asymmetry para-meters corresponding to producing
2EN2 X (v - 0-1) in the range710 A ' 730 A. Other conventionsas in Figure 1.
;.
,~;
-_4
710 720 -x. (1)
S 730
Here we define the vibrational branching ratio as the ratio of the intensity of a
particular vibrational level to the sum over the whole vibrational band. In
Figure 2 the asymmetry parameter B is given for the same process. In both0
figures the positions of the Hopfield emission and absorption features at 715.5 A0
and 723.3 A, respectively, are indicated by solid lines joining the upper and
lower frames. In the vicinity of these features a hand-drawn dashed durve is
constructed only to guide the eye, and should not be taken too seriously. In
both figures, typical error bars for the data in each frame are shown 'in the
last point. Duplicate branching ratio measurements (the open circles were taken
at the magic angle and the solid dots were deduced from the angular distribution
measurements) show the reproducibility of the data.
38

THE EFFECTS OF AUTOIONIZATION ON VIBRATIONAL BRANCHING RATIOS ANDPHOTOELECTRON ANGULAR DISTRIBUTIONS IN MOLECULAR PHOTOIONIZATION:THE FORMATION OF THE GROUND STATE OF O BETWEEN 574 A and 600 E *
K. Codling, A. C. Parr,* D. L. Ederer,* R. Stockbauer,t J. B. West,B. E. Cole, and J. L. Dehmer
The partial cross sections (branching ratios) for leaving the 0 ion in the2 2ground X 9 state have been determined in the region of the v = 0 and v = I com-
ponents of the neutral excited Rydberg state (2, ) 3s - at 594. 3 ind 589. 0 Auby photoelectron spectroscopy. These cross sections have teen further subdivided
into partial cross sections for leaving the ion in a particular vibrational state. More-
over, the asymmetry parameter, 3, has been determined for each vibrational com-
ponent in this limited spectral range. Considerable variations in both cross section
and 3 are observed. As an example, the variation in a with vibrational quantum0
number is illustrated in Figure 1 at 593 A.
V 0 1 2 3 4 5P -75 -.22 .22 .45 .26 .06
50001
C
0
00
S5000
00
12 13
Binding Energy (9V)
FIG. 1.--The photoelectron spectrum ofthe 0+ X 2HI state at0 an incident
photon energy of 593 A for two angles,
e = 0* and 0 = 90*. The 3 value foreach vibrational level is given at
the top of the figure.
*
Summary of an article published in J. Phys. B 14, 657 (1981).tJ. J. Thomson Physical Laboratory, University of Reading, Reading RG6 2AF#England.
National Bureau of Standards, Washington, D.C. 20234.cience Research Council, Daresbury Laboratory, Warrington WA4 4AD, England.Honeywell Corporate Technology Center, Bloomington, Minn. 55420.
39
VIBRATIONAL-STATE DEPENDENCE OF PARTIAL CROSS SECTIONS ANDPHOTOELECTRON ANGULAR DISTRIBUTIONS THROUGH AUTOIONIZINGRESONANCES: THE n=3 RYDBERG STATE OF THE B 2+ STATE OF CO+ *
4 4.
D. L. Ederer, A. C. Parr, B. E. Cole,* 1 Stockbauer,J. L. Dehmer, J. B. West, and K. Codling
The branching ratios for leaving the CO+ ion in a particular vibrational
level of the ground X state have been determined as a function of photon
energy through the n = 3 Rydberg state of the B 2E+ state of CO0 0
(722 A < X < 729 A). These branching ratios have been converted into
absolute partial cross sections by normlaizing to existing data obtained using
line sources. The asymmetry parameter 8 has also been determined for each
vibrational level in this spectral range. Considerable variations in both have
been observed in the region of this resonance.
*Abstract of a paper to be published in Proc. R. Soc. (London).
t+National Bureau of Standards, Washington, D.C. 20234.
+ Honeywell Corporate Technology Center, Bloomington, Minn. 55420.
Daresbury Laboratory, Science Research Council, Daresbury, Warrington ,WA4 4AD, England,
J. J. Thomson Physical Laboratory, University of Reading, Reading,RG6 2AF, England.
40

SHAPE RESONANCES IN MOLECULAR FIELDS
4..
J. L. Dehmer and Dan Dill'
Shape resonances are quasibound states in which a particle is temporarily
trapped by a potential barrier, through which it may eventually tunnel and escape.
In molecular fields, such states can result from so-called "centrifugal barriers, "
which block the motion of otherwise frec olectron's in certain directions, trapping
them in a region of space with molecular dimensions. In recent years, there has
been a flurry of studies of shape resonance effects in both molecular photoioniza-
tion and electron-molecule scattering. The important role of shawe resonances in
these processes stems from several key factors: First, they arL beinq identified
in the spectra of a growing and diverse collection of molecules and now appear to
be present somewhere in the spectra of most molecules. Second, owing to their
localized quasibound nature, such resonances often produce intense, easily studied
features. Third, resonant trapping usually imparts a well-defined orbital
momentum character to the escaping electron which may be reflected in character-
istic angular distributions. Last, but not least, the essentially one-electron
nature of the phenomenon lends itself to theoretical treatment by realistic,
independent-electron methods, with the concomitant flexibility in terms of com-
plexity of molecular systems, energy ranges, and alternative physical processes.
Within the last year or so, studies of the interplay between shape resonances
and molecular vibration have led to the prediction1-3 and experimental confirma-
tion 4-8of new shape resonance effects in both molecular photoionization and
electron-molecule scattering. At the most basic level, these effects arise because
*Summary of invited talks presented at (a) 11th Annual DEAP Meeting, 10-12December 1979, Houston, Texas; (b) March APS Meeting, 24-28 March 1980,New York, N.Y.; (c) Molecular Spectroscopy and Dynamics with SynchrotronRadiation-A European Workshop, 29 September-1 October 1980, Maria Laach,West Germany; and (d) 33rd Annual Gaseous Electronics Conference, 7-10October 1980, Norman, Oklahoma.tConsultant, Radiological and Environmental Research Division. Permanent ad-dress: Department of Chemistry, Boston University, Boston, MA 02215.
41

the quasibound shape resonance exhibits dramatic changes in position and profile
as the internuclear separation varies over the range of the ground state vibra-
tion. This causes a breakdown of the Franck-Condon separation of electronic
and nuclear motion with the following effects:
In molecular photoionization, it was predicted that vibrational intensities
would exhibit large deviations from their Franck-Condon factors (formerly con-
sidered a fairly accurate guide in the absence of autoionization effects), over a
spectral range which could be several times larger than the resonance halfwidth.
Moreover, it was predicted that photoelectron angular distributions for different
final vibrational states would differ in a systematic way. 1 These basic predictions
were immediately confirmed experimentally 4,6-8 and have a far-reaching impact
on our understanding of the dynamics of molecular photoionization.
In electron-molecule scattering, it has been known for some time that shape
resonances are very effective in inducing vibrational excitation ( see, e. g., Ref. 9
and references therein). The new element in this context is the prediction2of
enhanced vibrational excitation arising from very weak shape resonances at
intermediate (10-40 eV) incident energy. Shape resonances in this energy range
lie near the top of their potential barriers and are therefore usually too broad
and weak to observe in the vibrationally elastic or total scattering cross section.
The key to their discovery was the prediction that they would be prominent
in vibrational excitation spectra, to which direct, non-resonant scattering has
minimal contribution. This picture is now supported by measurements on the
e-CO2 scattering and earlier e-N2 results, 10,11 which now take on new meaning.
Expansion, refinement, and unification of these new manifestations of
molecular shape resonances have begun in several experimental and theoretical
groups, and will provide a stimulating theme in molecular physics in the coming
years.
References
1. J. L. Dehmer, Dan Dill, and S. Wallace, Phys. Rev. Lett. 43, 1005 (1979).2. Dan Dill, J. Welch, J. L. Dohmer, and J. Siegel, Phys. Rev. Lett. 43,
1236 (1979).
42

3. J. L. Dehmer and Dan Dill, Electronic and Atomic Collisions, Invited Papersfrom the XIth Int. Conf. on the Physics of Electronic and Atomic Collisions,Kyoto, Japan, 29 August-4 September 1979, N. Oda and K. Takayanagi, Eds.,North-Holland Publ., Amsterdam, p. 195 (1980).
4. R. Stockbauer, B. E. Cole, D. L. Ederer, J. B. West, A. C. Parr, and J.L. Dehmer, Phys. Rev. Lett. 43, 757 (1979).
5. M. Trcac, R. Azria, and R. Paineau, J, Physique Lettres 40, L323 (1979).6. J. B. West, A. C. Parr, B. E. Cole, D. L. Ederer, R. Stockbauer, and
J. L. Dehmer, J. Phys. B 13, L105 (1980).7. B. E. Cole, D. L. Ederer, R. Stockbauer, K. Codling, A. C. Parr, J. B.
West, E. D. Poliakoff, and J. L. Dehmer, J. Chem. Phys. 72, 6308 (1980).8. T. A. Carlson, M. 0. Krause, T. Mehaffy, J. W. Taylor, F. A. Grimm, and
J. D. Allen, J. Chem. Phys. 73, 6056 (1980).9. G. J. Schulz, Principles of Laser Plasmas, G. Bekefi, Ed., Wiley, New York,
p. 33 (1976).10. J. L. Dehmer, J. Siegel, J. Welch, and Dan Dill, Phys. Rev. A 21, 101 (1980).11. Z. Pavlovic, M.J.W. Boness, A. Herzenberg, and G. J. Schulz, Phys. Rev.
A 6, 676 (1972).
43
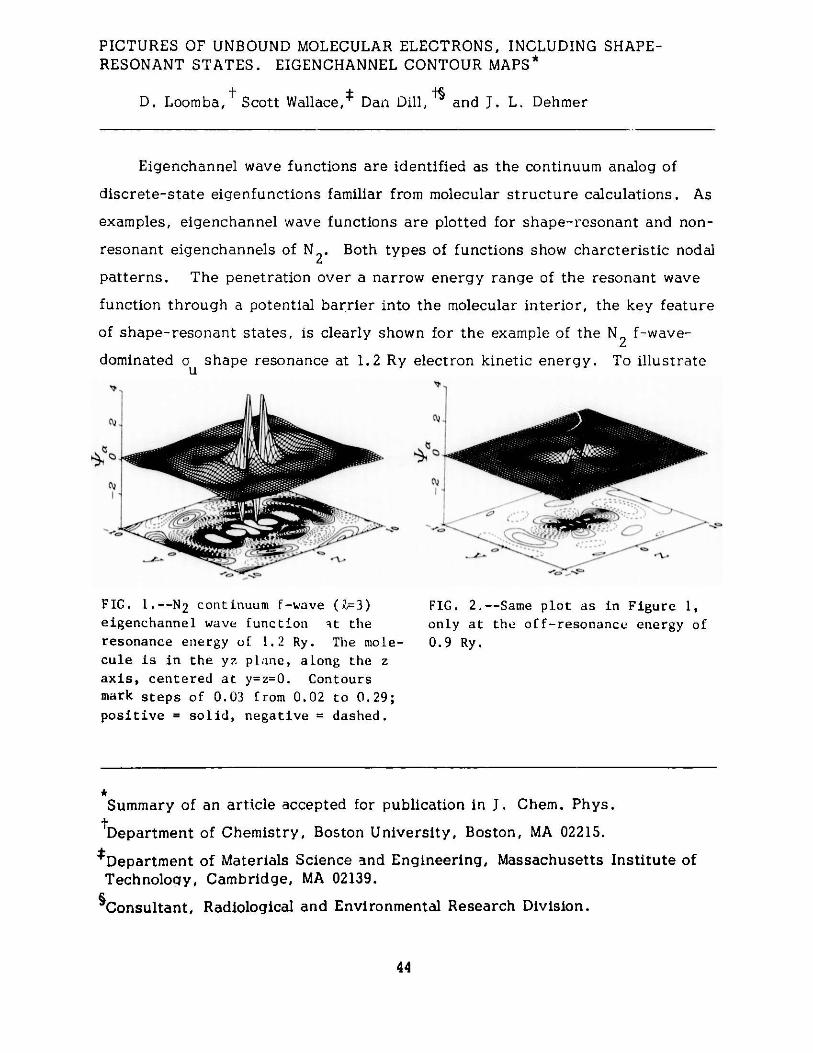
PICTURES OF UNBOUND MOLECULAR ELECTRONS, INCLUDING SHAPE-RESONANT STATES. EIGENCHANNEL CONTOUR MAPS*
D. Loomba, Scott Wallace,* Dan Dill, f and J. L. Dehmer
Eigenchannel wave functions are identified as the continuum analog of
discrete-state eigenfunctions familiar from molecular structure calculations. As
examples, eigenchannel wave functions are plotted for shape-resonant and non-
resonant eigenchannels of N Both types of functions show charcteristic nodal
patterns. The penetration over a narrow energy range of the resonant wave
function through a potential barrier into the molecular interior, the key feature
of shape-resonant states, is clearly shown for the example of the N2 f-wave-
dominated a shape resonance at 1.2 Ry electron kinetic energy. To illustrateu
FIG. 1.--N 2 continuum f-wave (Z=3) FIG. 2.--Same plot as in Figure 1,eigenchannel wave function -it the only at the of f-resonance energy ofresonance energy of 1.2 Ry. The mole- 0.9 Ry.cule is in the yz plane, along the zaxis, centered at y=z=0. Contoursmark steps of 0.03 from 0.02 to 0.29;positive = solid, negative = dashed.
*Summary of an article accepted for publication in J. Chem. Phys.
tDepartment of Chemistry, Boston University, Boston, MA 02215.
*Department of Materials Science and Engineering, Massachusetts Institute ofTechnology, Cambridge, MA 02139.
Consultant, Radiological and Environmental Research Division.
44

the appearance of a resonant continuum wave function, the eigenchannel
contour map for the a channel at the resonance energy is shown in Figure 1.u
The analogous plot at a non-resonant energy is shown in Figure 2 for contrast.
This visualization of continuum electronic amplitudes should prove to be a
significant new tool in the study of continuum electron-molecule dynamics.
45

*SHAPE-RESONANT FEATURES IN THE PHOTOIONIZATION SPECTRA OF NO
Scott Wallace, Dan Dill,A and J. L. Dehmer
Calculations of core and valence level photoionization spectra of NO are
presented and compared with available experimental data. A low-lying continu-
um shape resonance is identified in the o photoionization channel, which is the
analog of similar states found in other first-row diatomic molecules. Both partial
cross sections and photoelectron angular distributions are discussed, and the
effect of nuclear motion on these observables is treated. As an example, the
partial cross section and photoelectron asymmetry parameter for the 5G orbital
is given in Figures 1 and 2.
Reference
lS. H. Southworth, C. M. Truesdale, P.to be published.
Kobrin, D. Lindle, and D. A. Shirley,
CVJ
b
N-,
0-
o1515 20 25
hv(eV)30 35
+ 3 -1FIG. 1.--NO b ir(5c ) cross section.Dashed line is for fixed-R, equilibrium
internuclear separation; solid line has
been averaged over nuclear motion. Data
are from Ref. 1.
4
15 20 25 30 35hv(eV)
+ 3 -1FIG. 2.--NO b ii(5o ) asymmetry para-meter. Calculations were averagedover nuclear motion. Data are from
Ref. 1.
*Summary of a paper accepted for publication in J. Chem. Phys.rDepartment of Materials Science and Engineering, Massachusetts Institute ofTechnology, Cambridge, MA 02139.
*Consultant, Radiological and Environmental Research Division. Permanentaddress: Department of Chemistry, Boston University, Boston, MA 02215.
46
1
1
1
I
1
1
1
1
1
1
1
1
1
i ' 1
i
i
'

*VIBRATIONAL EFFECTS IN THE SHAPE-RESONANT PHOTOIONIZATION OF CO2
J. R. Swanson, Dan Dill, T and J. L. Dehmer
Theoretical studies of several diatomic molecules predict that photoionization
cross sections and angular distribution in spectral regions near shape resonances
are very sensitive functions of nuclear separation.1-3 This sensitivity is mani-
fested in vibrationally unresolved cross sections a and asymmetry parameters
3 by a broadening of resonant features relative to their fixed-nuclei profiles
calculated at the equilibrium geometry. For vibrationally resolved spectra, the
calculations predict large deviations from Franck-Condon vibrational intensity
distributions and a strong dependence of a on the vibrational state of the residual
ion. These predictions are supported by measurements of vibrational branching
ratios and vibrationally resolved asymmetry parameters for the photoionization of
the 5a level of CO and of the 3o level of N 6-1112 g 2In a recent letter we presented vibrationally averaged (i.e., unresolved)
cross sections for the li9 and 4o levels of CO . Both levels access the o shapeg g 2 u
resonance which occurs at electron kinetic energy 19 eV. As was the case for the
diatomics, the effect of averaging was to broaden and diminish the resonant cross
section. The intensity of the resonance was reduced 70% in the 4a channel andg
was left barely discernible in the 1T channel. Those results are complementedg
here by viLrationally averaged a's for the liT , lh , 3a , and 4o levels, and byg u u g
vibrationally resolved a's and vibrational branching ratios for the l. and hrg u
levels. The vibrationally resolved results are shown in Figures 1 and 2 as
examples. Vibrational parameters for the states resulting from ionization of the
3a and 4a levels were not available. However, we anticipate a prominent vibra-u g
tional dependence in these channels owing to the a and a shape resonances.gu
The averaged a's are in good agreement with recent synchrotron measurements.
The vibrationally resolved a's are in qualitative agreement with the recent He (I)
line-source measurements of Kreile and Schweig. 13
Summary of a paper published in J. Phys. B 14, L207 (1981).tDepartment of Chemistry, Boston University, Boston, MA 02215.tConsultant, Radiological and Environmental Research Division.
47

av=-0
0C\2 i
0i
LO b
24 2
C -4
r_10 20 30 40 50
photon energy (eV)10 20 30
photon energy (eV)
FIG. 1.--Vibrationally resolved asymmetry parameters of CO 2 for the (a) Ihrlev -1 ( , v = 0; A, v = 1) and the (b) Iru level ( 0 , v =0; 0, v =1;A, v =2; +, v =3; x, v =4). The He(I) line-source data are from KreiLe andSchweig.13
av=1
10 20
0
C?,
30 40 50 10
photon energy (eV)
b...... = ---
--- --- ---Y -- --
20V V I
30 40 50
photon energy (eV)
FIG. 2.--Vibrational branching ratios for the (a) liT and (b) lrru levels of
CO 2. The dashed lines represent the Franck-Condon branching ratios.
48
2
40
0~
0;
v=2
_T__ - __T_ I

References
1. J. L. Dehmer, D. Dill, and S. Wallace, Phys. Rev. Lett. 43, 1005 (1979).2. J. Stephens, D. Dill, and J. L. Dehmer, J. Phys. B., to be published.3. P. Dittman, D. Dill, and J. L. Dehmer, J. Chem. Phys., to be published.4. R. Stockbauer, B. E. Cole, D. L. Ederer, J. B. West, A. C. Parr, and
J. L. Dehmer, Phys. Rev. Lett. 43, 757 (1979).5. B. E. Cole, D. L. Ederer, R. Stockbauer, K. Codling, A. C. Parr, J. B.
West, E. D. Poliakoff, and J. L. Dehmer, J. Chem. Phys. 72, 6308 (1980).6. J. B. West, A. C. Parr, B. E. Cole, D. L. Ederer, R. Stockbauer, and
J. L. Dehmer, J. Phys. B 13, L105 (1980).7. T. A. Carlson, Chem. Phys. Lett. 9, 23 (1971).8. T. A. Carlson and A. E. Jonas, J. Chem. Phys. 55, 4913 (1971).9. D. M. Mintz and A. Kuppermann, J. Chem. Phys. 69, 3933 (1978).
10. W. H. Hancock and J.A.R. Samson, J. Electron Spectrosc. 9, 211 (1976).11. T. A. Carlson, M. O. Krause, D. Mehaffy, J. W. Taylor, F. A. Grimm,
and J. D. Allen, J. Chem. Phys. 73, 6056 (1980).12. J. R. Swanson, D. Dill, and J. L. Dehmer, J. Phys. B 13, L231 (1980).13. J. Kreile and A. Schweig, J. Electron Spectrosc. 20, 191 (1980).14. F. A. Grimm, J. D. Allen, Jr., T. A. Carlson, M. 0. Krause, D. Mehaffy,
P. R. Keller, and J. W. Taylor, J. Chem. Phys. 75, 92 (1981).
49

SHAPE-RESONANCE EFFECTS IN THE PHOTOABSORPTION SPECTRA OF BF3
J. R. Swanson, Dan Dill, and J. L. Dehmer
*
Multiple-scattering model calculations of cross sections for dipole transitions
from all occupied orbitals of BF3 to excited bound states ani continuum states of
electron kinetic energy < 30 eV are presented. The photoelectron angular distri-
bution asymmetry parameters 6 are also given for all occupied orbitals. The
boron and fluorine K-shell calculations are in qualitative agreement with, and
provide a clear interpretation of, the measured spectra. Two shape resonances
are found in the low energy continuum, one of a' symmetry, the other of e' sym-
metry. The resonances are found to be due to trapping of p waves on the fluorine
atoms. This atomic localization, as well as the dominance of low-Q partial waves
outside the molecule, put these shape resonances in a class distinct from those
observed in diatomic molecules. The results for the 2e' orbital of BF3 (IP % 2.3
Ry) are given in Figure 1 as an example. Both the a' and e' shape resonances
are clearly shown at hv-IP nu 7 to 8 eV.
-2
2e'o ---- FIG. l.--Partial cross sections and photoelectron7O asymmetry parameter for the 2e' subshell of BF3 .0.0 1 The lower subplots display partial cross sections;
0.5- 5 the upper subplots show the total cross section
e"l (solid lines-left scale) and asymmetry para-
0 meter (dashed lines-right scale). Note that
ZO- , the energy scale is expanded for E < 0. The
factor above the discrete spectra indicates
that the whole discrete spectrum has been0.0- multiplied by that factor.02 - 50
a'z
0.0- '"~o
1.0
06- a,
0.0-5 0 10 20 30
hv-I.P. (eV)
*S-mmary of an article to appear in J. Chem. Phys.
tDepartment of Chemistry, Boston University, Boston, MA 02215.
fConsultant, Radiological and Environmental Research Division.
50

MULTIPHOTON PROCESSES IN ATOMS AND MOLECULES
J. L. Dehmer, P. M. Dehmer, and E. D. Poliakoff
We have initiated a new program of laboratory studies of multiphoton pro-
cesses in atoms and molecules involving observation of the fluorescence, photo-
electrons, and/or molecular fragments produced by laser excitation. Emphasis
will be placed on establishing the high-resolution spectroscopy and detailed
dynamics of each successive step of the multiphoton process. Special attention
will be given to sequences of resonant steps, excited by laser beams of different
frequencies and polarization. Such a sequence is well-defined, highly selective,
and very efficient at low power levels. To implement this program, we have
recently finished assembling a unique combination of state-of-the-art instru-
mentation. This includes: (1) a high-power pulsed Nd:YAG laser and companion
commercial dye laser with nonlinear conversion capabilities, (2) a detailed de-
sign (provided by F. Tomkins, Chemistry Division) for a two-grating, Littman-
mount dye laser, several of which will be constructed at ANL for use in multi-
color experiments, (3) a high-resolution electron spectrometer, (4) a time-of-
flight mass spectrometer, (5) a fluorescence detector including capabilities for
measuring the polarization of fluorescence, and (6) an assortment of molecular
beam sources for studying rotationally-cooled species, clusters, free radicals,
and high-temperature vapors.
The multiphoton studies described here will exploit a number of special
features of excitation by pulsed lasers. First, using standard line-narrowing
techniques, very high resolution is attainable (the pump and dye laser have
limiting bandwidths of 0.01-0.05 cm ), permitting resolution of rovibronic
structure for most molecules. Second, the tunability of dye lasers permits pre-
cise state selection of the target molecule in each excitation step. Third, the
high photon flux of the pulsed laser system makes it possible for an isolated
molecule to undergo successive excitations during a single laser pulse. Fourth,
multiphoton processes can access manifolds of states forbidden by rigorous
selection rules in single-photon absorption. Fifth, the high flux of the laser
coupled with the high selectivity of resonant transitions makes multiphoton
51
processes capable of the ultimate sensitivity, i.e., ability to detect reactive,
unstable, or trace species, even in the presence of large amounts of other
species. Sixth, the high photon flux and uniphase character of the dye laser
output permits frequency conversion by means of doubling, summing, coherent
anti-Stokes shifting, four-wave mixing, etc. This allows shifting the tunable
laser frequencies into the UV so that high energy transitions (usually the lowest
electronic excitations of a molecule) can be pumped by a single photon. Seventh,
the energy content of the pulses from our Nd:YAG pump laser makes it possible
to pump many dye lasers simultaneously. This permits preparation of a com-
posite laser beam composed of component beams of selected frequency, polariza-
tion state, and flux. This "multicolor" beam can be specially designed to probe
a particular sequence of state-to-state resonant transitions in a target molecule
and to observe the spectroscopy of any stage in the excitation process by tuning
one of the component frequencies.
This program aims at providing the requisite research to develop ultra-
sensitive detection schemes for atmospheric species. In particular, the combina-
tion of the highly selective excitation mechanism and the additional detection
stages indicated above have the porential for (a) ultrasensitive detection far
behond the currently attainable level of parts per billion toward the ultimate
limit of single-molecule detection (1 parL in 1019); (b) chemical specificity.
including the ability to distinguish chemically similar molecules and the detection
of internal excitation; (c) direct monitoring, which eliminates the need for
sample handling and thus permits the study of chemically reactive and loosely
bound species.
Preliminary measurements are scheduled to begin in the spring of 1981.
52
A NEW OPTICALLY-FORBIDDEN RYDBERG SERIES IN 0 CONVERGING TO THE0 + c4 Z~ LIMIT *
2 u
M. A. Dillon and David Spence
We have measured the angular dependence of inelastically scattered
electrons in 02 in the energy-loss range 16 to 26 eV for incident electron ener-
gies between 75 eV and 400 eV, and for scattering angles between 20 and 12'.
For high incident energy and low scattering angle our energy-loss spectra
correspond to the known optical absorption spectrum. At higher scattering
angles four new structures appear in our spectra at 21.85, 23.30, 23.80, and
24. 06 eV. These four structures are the lowest members of the first optically+ 4
forbidden Rydberg series observed to converge to the 0 c E limit at 24.562 u
eV. The calculated quantum defects for these levels are about 0.75. This
value, combined with angular scattering propensity rules, indicates that the
new Rydberg states occur by promotion of an electron from the a 2s orbitalU
to npa orbitals where n = 3,4,5,6. A consideration of the propensity rules
for excitation of forbidden transitions by high energy electron impact suggests3the term symbol of the new Rydberg states to be 3E.
g
*Abstract of a paper to appear in J. Chem. Phys.
53

THE ANGULAR DEPENDENCE OF SCATTERED ELECTRON SPECTRA OF NEONAND ARGON IN THE REGION OF QUASI-DISCRETE AUTOIONIZING STATES*
M. A. Dillon and David Spence
We have measured the angular dependence of inelastically scattered
electrons in neon and argon in the energy region of quasi-discrete autoionizing
states. Our spectra, obtained for incident electron energies of 200 eV, show
that both singly and doubly excited autolonizing states exhibit angular distri-
butions of the scattered electrons which are qualitatively as predicted by the
Born approximation. Our results demonstrate that measured angular distribu-
tions of electrons scattered from quasi-discrete states can yield information on
the symmetries and term symbols of these states, in a manner analogous to the
well-known propensity rules for excitation of bound states.
54
*Abstract of a paper published in J. Chem. Phys. 74, 2654 (1981).

STUDIES OF THE 02 31 (V) VALENCE STATE AND 3Ig(R) RYDBERG STATEiN THE SCHUMANN-RUNGE CONTINUUM FROM EJECTED AND SCATTEREDELECTRON SPECTRAt
David Spence
Electron-impact energy-loss spectra are obtained in 02 in the energy-
loss range of 7 to 10 eV. These spectra contain some discrete features re-
sulting from scattered electrons following excitation of Rydberg states, and
other features from ejected electrons following decay of 02 Feshbach reso-
nances into valence electronic states in the continuum via the reaction3.- .* 3 -*
e+ O (X " )+(0 ) + '11 (V) + e From the known 02 g 2 2 g ejected. 2
energies and from measurements of the ejected electron energies, we find3
the 31 (V) state extends over an energy range of only about 0.20 eV in theg
Franck-Condon region of the ground starr. contrary to some previous experi-
mental and theoretical results. From measurements of scattered electrons,
effective excitation functions of several vibrational levels of the 3I (R)
Rydberg state are obtained. Of the many 02 Feshbach resonances known to3exist in this energy region, only one decays strongly into the II (R) state.
g
55
Abstract of a paper published in J. Chem. Phys. 74, 3898 (1981).

ON RESONANCES IN HF
David Spence
We discuss a probable explanation of the totally inconsistent nature of
some previously publishe i Feshbach resonance spectra of hydrogen fluoride
which has been provided by the recent work of Brion and Hitchcock. I We
have obtained new electron transmission spectra of HF in the energy range
12.8 to 16.0 eV, which confirm the earlier HF resonance data of Spence and
Noguchi2 and which reveal several previously unobserved resonance structures.
Those new structures are energetically coincident with the higher lying members
of a series of peaks recently found in the F /HF dissociative attachment cross
section. We explain the anomalous scattering from the HF-2H(v = 0) resonance
level in terms of the mixing of the b 3H and B 1E parent Rydberg states which
has been observed in optical absorption spectra. Finally, we point out a
possible mechanism for a Lyman-ci laser.
References
1. C. E. Brion and A. P. Hitchcock, J. Phys. B, in press.2. D. Spence and T. Noguchi, J. Chem. Phys. 63, 505-514 (1975).
Abstract of a paper published in J. Phys. B 14, L107 (1981).
56

ENERGY LEVELS AND PREDISSOCIATION IN MERCURIC HALIDES
David Spence and Michael A. Dillon
In recent years the mercuric halides have attracted considerable interest
as potential high-power electronic transition laser systems.1-3 Though the
mercuric halides have been studied for a hundred years by photoabsorptrion
and emission techniques, 4 only the energetically lowest-lying electronic states
have been cataloged. Because the symmetries and electronic structure of the
excited states of Hg X2 are not known, the detailed nature of the laser mech-
anism in the mercuric halides is incompletely understood. Although the principal
laser mechanism is believed to be
1+ hv 1 + 2 + 2HgX 2 (1 E ) HgX 2 ( E ) HgX2 (B Z )+ X( P)
followed by
HgX(B2E+) + HgX(X2Z+) + hv
1 + 4the 1 E states of HgX occur at a lower energy than the apparent onset ofu 52
fluorescence radiation upon electron impact excitation of HgX2. This suggests1+ 2that states higher in energy than 1 E may also play some role in the laser
umechanism. For example, it is feasible that some higher-lying excited states
of HgX 2 may predissociate into the products HgX(B2E+) + X( 2P).
For these reasons we have obtained electron energy-loss spectra over
an extended energy-loss range (approximately 5 to 15 eV) for incident electron
energies of 200 eV and scattering angles of 20 in the mercuric halides HgBr2
and HgCl2 , Under these conditions of impact energy and scattering angle, the6
energy-loss spectra correspond closely to optical absorption spectra, though
our energy-loss spectra extend to much higher energies than previous photo-
absorption spectra, and reveal many more excited states of these molecules
than had previously been observed.
Although analysis of our data is not yet complete, we will, in this pre-
liminary report, give our raw spectra and tentative identifications of the
principal features of these spectra.
57

Results
Electron energy-loss spectra in HgCl2 and HgBr2 are shown in Figures
1 and 2, respectively. The locations of three dipole-allowed transitions, 1 1I ,1 + 1 + 7-9u
1 E , and 2 E , which have been observed in photoabsorption and calculatedu 4 u
theoretically are indicated by the short vertical lines. All of these three fea-
tures occur as broad structures in optical absorption spectra, and the 1 1I utransition is barely discernible in Figures 1 and 2 here.
All the structures above about 8 eV correspond to electronic energy
levels not previously observed, the most prominent of these structures correspond-
ing to transitions to Rydberg states, as is usually the case for energy-loss
spectra taken for incident energies of 200 eV.
.2.
1'I*Iu-2-
-
E =200 eV2= '
I I i
6 8 10 12ELECTRON ENERGY LOSS (eV)
14
FIG. 1.--Electron energy-loss
spectrum in HgCl 2 '
T FI
'flu 2'1+
LU
E 200 eV6 20
N~rA6IS'
6 8 10 12ELECTRON ENERGY LOSS (eV)
14
FIG. 2.--Electron energy-loss
spectrum in HgBr 2 '
58
z
0-
wrz
Cro z
4/)
0-w
~LJ_) M
A
, PA, ,!V
-.. .

Interpretation of the most prominent structures in Figures 1 and 2 is
facilitated with reference to the photoelectron spectra of HgCl2 ahd HgBr210obtained by Eland. The photoelectron spectra of Eland correspond to removing
an electron from different valence orbitals, leaving an ion in either its ground
or excited state. The spectra of Rydberg states in the energy-loss spectra of
Figures 1 and 2 correspond to exciting an electron from these same initial
orbitals to Rydberg orbitals.
Rydberg orbitals are essentially nonbonding, and hence in general
electron energy-loss Rydberg state spectra usually look very similar to photo-
electron spectra. Comparison of Figure 1 with the photoelectron spectrum of
HgCl2 shows this indeed to be the case. The five lowest structures in the
photoelectron spectrum correspond to removing electrons from TT i, , o , and2 2 u u
39 orbitals, leaving the ion in the respective ionic states 23 ,9 1/2g'22 2 32 /g
23/ 2, 1/2 11 (unresolved), E and Z
The prominent structures in Figures 1 and 2 thus correspond to excited
states composed of an ionic core with term symbols listed above and an electron
in a Rydberg orbital. The symmetries of the Rydberg orbitals can be tenta-
tively assigned from a knowledge of the Rydberg state quantum defects, which
can be obtained from the Rydberg formula
E =I= RZ 2 /(n-6 )2
where En is the Rydberg state energy, I the appropriate ionization potential,
R the Rydberg constant, Z the nuclear charge, n the principal quantum number
of the Rydberg orbital, and 6 the quantum defect of that orbital. Lindholm 11
has shown how orbital symmetries of simple molecules can be determined from
the quantum defects. In Table 1, we list for HgCl 2 the initial orbitals, ex-
cited state energies E from Figure 1, the appropriate ionization potentials I10from Eland, effective quantum number n*, quantum defect 6 and tentative
excited orbital symmetry.
The close visual similarity observed in the energy loss and photoelectron 1 0
spectrum of HgC12 is not so obvious in the case of HgBr2 As one expects
occupation of similar orbitals for excitation of HgCl2 and HgBr2 , the quantt'm
59

Table 1. Observed excited state energies En Z and tentative excited statesymmetries in HgCl2'
Excited state IonizationInitial energy En , potential I, n* 6 Excited orbitalorbital eV eV0 symmetry
lfg 8.60 11.37 2I3/2g 2.22 0.78 npo
'a 8.73 11.50 2R 2.22 0.78g 1/ 2g
'u 9.65 12.13 2 3/2.l/2u 2.34 0.66 npu
a 10.40 12.74 2E 2.41 0.59 npffu u
a 12.0 13.74 2E 2.80 0.2 ndcag g
defects of these orbitals in HgBr2 must be similar to those in HgCl 2 . Because
of this, we are unable to assign one peak in the HgBr2 spectrum, i.e., that at
9. 48 eV which appears to be the lower member of a doublet structure (the split-+ 2
ting being approximately that of the HgBr 2 3/2,1/2g state). However, because
of its similarity to HgCl2, this peak cannot be a doublet associated with the2 2'221 ionic state, but may contain components of the n = 4 21 npa structures.
u gFurthermore, the similarity of the intensity ratios for energy-loss and photo-
electron spectra in HgBr2 do not hold so well in the case for HgBr2 as in HgCl 2 'For these reasons, the orbital assignments to HgBr2 shown in Table 2 must be
considered extremely tentative. However, the expected close similarities of
quantum defects in HgCl2 and HgBr2 shown in Tables 1 and 2 do lend support
to our interpretation.
In addition, one should note that all the structures in Figures 1 and 2 are
rather broad energetically, being at least 0.2 eV for the sharpest structure.
This is not a reflection of our instrumental resolution which is better than 0.05 eV
as determined from energy-loss spectra obtained in argon while running Ar-
Hg~lAr-H10HgCl2, Ar-HgBr2 mixtures. Furthermore, the photoelectron spectra of
2HgCl2 and HgBr2 show 113/2, 1/2gstructures which reflect the instrumental
10width of ". 0. 1 eV. Thus, either all the potential curves of the excited states
60

Table 2. Observed excited state energies Enk and tentative excited statesymmetries in HgBr2'
Excited state IonizationInitial energy EnZ, potential I, * 6 Excited orbitalorbital eV eV1 0 n nQ symmetry
I 7.9 10.62 211 2.24 0.76g 3/ 2g
IT 8.19 10.96 21 2.22 0.78g 1/2g
IT 8.71 11.20 23/2u 2.34 0.66
n p 7t
1 9.03 11.54 211/2u 2.33 0.67
9.48 ? ?
2a 9.76 12.09 Z 2.42 0.59 np7z
U U
a 11.75 13.39 2Z 2.88 0.12 nduu g
indicated by the structures of Figures 1 and 2 are repulsive in the Franck-
Condon region of the ground state, or the states predissociate. A simple ob-
servation of a finite width to a state indicates its quantum yield for predis-
sociation to be unity.
For reasons listed above, prime candidates for such a predissociating
state appear to be the , 13/2,1/2g) npa Rydberg states listed in Tables 1 and
2. Note that these states occur at an energy close to the observed onset of
fluorescence upon electron impact,5 and that the fluorescence yield curves as
a function of incident electron energy correspond to that expected for excita-
tion of Rydberg states. Thus, it is possible that some of these higher excited
states may be predissociating to the products HgX(B E+) + X(2P) and thus
contributing to the laser mechanism.
Finally, one should note that multiplication of the intensity of scattered
electrons in Figures 1 and 2 by the energy-loss E gives the generalized oscil-
lator strength distribution. It is clear that most of this oscillator strength
lies above the three lowest indicated dipole-allowed transitions.
61

References
1. J. H. Parkes, Appl. Phys. Lett. 31, 192 (1977).2. J. H. Parkes, Appl. Phys. Lett. 31, 297 (1977).3. J. H. Jacob, J. A. Mangano, M. Rokni, and B. Srivastava, Bull. Am. Phys.
Soc. 23, 2 (1976).4. W. R. Wadt, J. Chem. Phys. 72, 2469 (1980) and references therein.5. J. Allison and R. N. Zare, Chem. Phys. 38, 263 (1978).6. 1 \. A. Dillon and S. Spence, J. Chem. Phys., in press.7. J. Maya, J. Chem. Phys. 67, 4976 (1977).8. K. Wieland, Z. Phys. 76, 801 (1932); 77, 157 (1932).9. M. Wehrli, Helv. Phys. Acta 11, 339 (1938).
10. J.H.P. Eland, Int. J. Mass Spect. and Ion Phys. 4, 37 (1970).11. E. Lindholm, Ark, Phys. 40, 97 (1969).
62

*SEARCH FOR LONG-LIVED DOUBLY CHARGED ATOMIC NEGATIVE IONS
D. Spence, W. A. Chupka, and C. M. Stevenst
In a previous brief report we described our preliminary attempts to
detect doubly charged atomic negative ions using the ANL 100" radius double-
focussing mass spectrometer. Since that time, several other papers rporting
both negative'2,3 and positive results have appeared in the literature concern-
ing the existence of long-lived doubly charged negative ions. A recent lengthy
review article concludes that such ions definitely exist. 4 However, among the
conflicting reports in the literature, only one negative experiment has come
close to reproducing the ion source conditions of those earlier experiments which
have yielded positive results. 5 This aspect of any comparison between negative
and positive reports on the existence of such ions is important, since ion species
produced in an ion source depends crucially upon the type of ion source used,
and upon source conditions such as gas pressure and electron or discharge
currents.6 For these reasons, and because of the technological importance of
doubly charged ions if they exist, we describe in this report the results of our
experimental search for doubly charged negative ions in considerable detail.
In all of our experiments we have used the Argonne 100" radius double-
focusin mas sectomeer,7, 8focusing mass spectrometer, a schematic diagram of which is shown in
Figure 1. The ultimate mass resolution of this machine is of the order 106, and
it was, in fact, designed for precision absolute mass measurements. Such high
resolution is not required in the present experiments, and we have typically
operated at a mass resolution of 2 x 10³ to 1. 5 x 10⁴, under which conditions
the transmission of the mass spectrometer is about 95%.
An important feature of this machine is that artifact peaks (caused, for
example, by collisional dissociation of diatomic ions with the background gas
*Summary of a paper to appear in Phys. Rev. A.
Present address: Stirling Chemical Laboratories, Yale University, New Haven,Connecticut 06520.
tANL Chemistry Division.
63

ION DETECTOR
SLIT' 245'
CUs ELECTROSTATIC 3*J
NW ANALYZER SECON - ORDER
.5..RADwUS
PUMP
-2M MAGNET
ION LT-SOURCE 01 03 0s
PUMP
FIG. 1.--Schematic diagram of the ANL 100" radius double focussing mass
spectrometer
to yield an atomic ion plus neutral) do not occur. Such artifact peaks, known
as Aston peaks, if caused by dissociation of a molecular ion after acceleration but
before mass analysis in a magnetic sector, will occur at an apparent mass of
half that of an atomic ion, i.e., at the expected location of a doubly charged
negative ion. In some previous experiments Aston peaks have complicated inter-
pretation of the results. 2,3,5 In our machine the focussing conditions and back-
ground gas pressure between the electrostatic analyzer and magnetic analyzer
are such that artifact peaks do not occur, as we will demonstrate later.
In our experiments we have used both electron-impact and Penning ion-
ization type sources in order to duplicate as closely as possible previous experi-
mental conditions which do report the existence of doubly charged ions. 5,9,10
Our conditions of flight time and electrir field strengths during acceleration do
not differ enough from those of earlier work to be significant in the inter-
pretation of our results.
64

1600-. S (639442o mu)
SCALES1400- -
20momu
R200m I PENNING DISCHARGE HI
000 _ RATIO I~/S2~4 5 K 10 6 4500 (
WJ EXPECTED LOCATION 2-V)
Z o BO'.400
6 400[ '00 _U) /(U3
z 400 200 <
0 X -00
j I\ I
050 100 15O 200 0200 250 300 350 400
CHANNEL NUMBER
FIG. 2.--Mass spectra of negative ions produced in a Penning ionization source
containing HI in the region of mass 64 (SO- and S2 produced from background
impurities, channels 200 - 400) and in the mass region any I"- would beexpected to appear (mass 63.5, channels 0 + 200). From the ratio of 12-/so-and S0~/I~ measured in an electrometer, we set limits of 12-/j- :4.5 x10~16
in this experiment. Note our resolution is such that 200 channels correspond
correspond to approximately 200 millimass units (m.a.m.j.), i.e., Am/m %12,800.
We present results of our experiments as an upper limit of the ratio of
doubly charged to singly charged species, X 2- /X for different ion sources,
target gases, and negative ion species. However, the sensitivity of our machine
is such that this ratio is very small, typically 10 7 to 10- 10, and is obtained in
two stages as described below. First, we choose an arbitrary negative ion Y
(generated from impurities in the ion source region, the sensitivity being such
that an ion can be observed at most mass numbers) whose mass lies close to
that of the expected doubly charged species. The intensity of this arbitrary ion
is necessarily small, but sufficiently large to measure on the output of a photo-
multiplier with an electrometer. The ratio Y /X is measured on the electro-
meters. Then, with operation in a pulse counting mode, multiple alternate scans
of Y_ and possible X2- are stored in a multichannel analyzer. The ratio X2 /Y
is then obtained and hence X 2-/X .
65
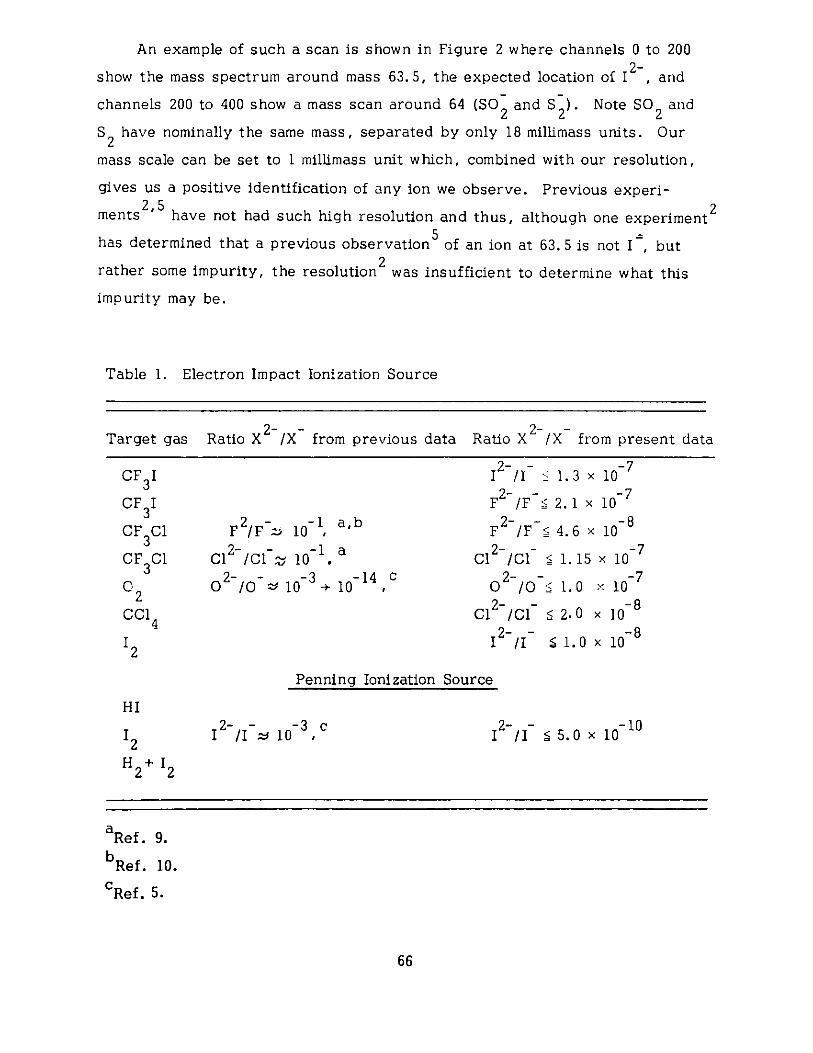
An example of such a scan is shown in Figure 2 where channels 0 to 200
show the mass spectrum around mass 63.5, the expected location of I,2- and
channels 200 to 400 show a mass scan around 64 (SO2 and S2). Note SO2 and
S2 have nominally the same mass, separated by only 18 millimass units. Our
mass scale can be set to 1 millimass unit which, combined with our resolution,
gives us a positive identification of any ion we observe. Previous experi-
ments2, have not had such high resolution and thus, although one experiment
has determined that a previous observation of an ion at 63. 5 is not I , but2 arather some impurity, the resolution was insufficient to determine what this
impurity may be.
Table 1. Electron Impact Ionization Source
Target gas Ratio X2- /X- from previous data Ratio X2/X from present data
2 - -1 a,bF /F s 10 , '2--1 a
Cl /Cl: 10-1. a2- - 1-3 -14 c
O /0^ 10 + 10 ,
2-I / 1.3
2-F IF 2.1 >x
2- -F IF I 4.6)2- -
Cl /01 5 1. 152- 1.0
0 /0 102- -
Cl /C01 2.02- -
I /I~ 51.0
x 10-
< -7
10_-o8x
1-7x 0
-710
x 1
x10_
Penning Ionization Source
2- - -3 cI /I e 10 ,
2- -0X1010
I / I 5 .
aRef. 9.b
Ref. 10.
cRef. 5.
66
CF 3I
CF3I
CF 3C1
CF3C1OF
2
CCl4
2
HI
I2
H2 +I2
X
)

It is obvious from Figure 2 that no ions are detectable above noise in the
region of mass 63.5. This figure also demonstrates the lack of any Aston peaks
in our apparatus as our ion source certainly produces copious quantities of
2-I from Figure 2 and electrometer measurements of I /SO, we can establish
2' -10limits of I /I produced in a Penning discharge in HI to be < 4.5 x- 10 in
this particular experiment.
The results of most of our experiments, using both electron impact and
Penning ionization sources, together with source conditions, are summarized in
Table 1. Under no experimental conditions did we detect any indication of a
doubly charged atomic negative ion. Thus, in light of this and other negative
experiments,2' it appears at this time that any evidence supporting the
existence of doubly charged negative ions be considered extremely tenuous.
References
1. W. A. Chupka, D. Spence, and C. M. Stevens, Radiological and Environ-mental Research Division Annual Report, July 1973-June 1974, ANL-75-3,Part I, p. 126.
2. L. Frees, E. Heinicke, and W. S. Koski, Mucl. Instrum. Methods 159,105 (1979).
3. B. Hird and S. P. Ali, J. Chem. Phys. 74, 3620 (1981).4. R. W. Kiser, Topics in Curr. Chem. 85, 89 (1979).5. H. Baumann, E. Hienicke, H. J. Kaiser, and K. Bethge, Nucl. Instrum.
Methods 95, 389 (1971).6. R. D. Mead, P. A. Schulz, C. S. Feigerle, and W. C. Lineberger, IEEE
Trans. Nucl. Sci. 28, NS-1194 (1981).7. C. M. Stevens, J. Teranay, G. Lobell, J. Wolfe, N. Beyer, and R. Lewis,
Proc. 9th Conf. on Nuclidic Masses, Hamilton, Ont., p. 403 (1960).8. C. M. Stevens and P. E. Moreland, Proc. Third Int. Conf. on Atomic
Masses, Winnipeg, Canada, p. 673 (1967).9. W. K. Stuckey and R. W. Kiser, Nature 211, 963 (1960).
10. J. E. Ahnell and W. S. Koski, Nature 245, 30 (1973).
67

DOUBLY-DIFFERENTIAL CROSS SECTIONS OF SECONDARY ELECTRONSEJECTED FROM GASES BY ELECTRON IMPACT: 25-250 eV ON H 2 .
W. T. Shyn, W. E. Sharp, and Y.-K. Kim
Doubly-differential cross sections of secondary electrons ejected from H
by electron impact have been measured by a crossed-beam method. The incident
energies used were 25, 40, 60, 100, 150, and 250 eV. The energy and angular
range of secondary electrons measured were from one-half the difference between
incident energy and ionization potential to 1. 0 eV and from 120 to 1560, respect-
ively. The present results do not agree with those of DuBois and Rudd1 for
slow secondary electrons ( < 20 eV) ejected by 100 eV primary electrons.
We present our data in Figure 1 as the Platzman plot. 2 The data by Opal,3
Beaty, and Peterson at 500 eV incident energy, E., and our data at E = 250 eV4415
are compared with the shape of the corresponding photoionization data again
in the Platzman plot (Figure 2). The total ionization cross section, G., obtained1
by integrating the energy distribution (area under the broken curves in
Figure 2) by Opal et al. is far too large. The H 2 data by Opal et al. should
Es (eV)0 5 10 20 30 50 100 500
8 1T T F 7
7- 0
6--- 1
4 I
3 /~r ~ %.
2 - o-"r
.Xk
0N
0.9 0.8 0.7 0.6 0.5 0.4 0.3 0.2R/E1
0.1
FIG. 1.--The Platzman plots of the presentresults at various incident energies, Ei.X, 25 eV; o, 40 eV; A, 60 eV; 0 , 100 eV;-, 150 eV; e, 250 eV. The abscissa is the
inverse of the energy transfer, Et, in ryd-
bergs, and the ordinate is the ratio of theenergy distribution to the Rutherford cross
section. Secondary electron energy scale
is on the top. Area under each Platzman
plot bounded by the hatched lines gives
the total ionization cross section, aG, as
explained in Ref. 2. Broken curves were
used to ob4.ain Gi from our data.0
*
Summary of a paper published in Phys. Rev. A 24, 79 (1981).tSpace Physics Research Laboratory, University of Michigan, Ann Arbor,Michigan 48109.
68
W
k
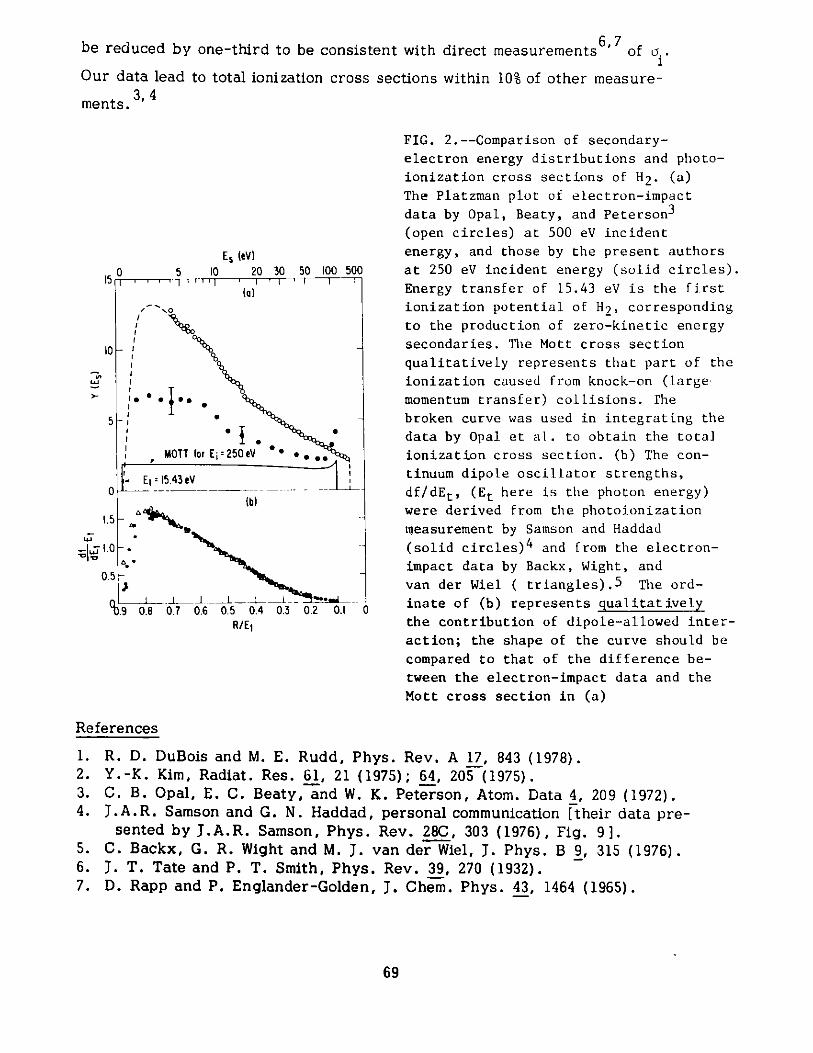
be reduced by one-third to be consistent with direct measurements6,7 of c(.1
Our data lead to total ionization cross sections within 10% of other measure-
ments. 3,4
0l5rr
Es (eV)5 10 20 30 50 100 500
(a)
eI * **Iee Og
, MOTT for Ej250eV S.
Et 15.43eV
.0
.5A 0.-filL
.9 08 0 .7 06 0.5 0.4 0.3 0.2 0.1 0R/E,
FIG. 2.--Comparison of secondary-
electron energy distributions and photo-
ionization cross sections of H2. (a)
The Platzman plot of electron-impact
data by Opal, Beaty, and Peterson 3
(open circles) at 500 eV incidentenergy, and those by the present authors
at 250 eV incident energy (solid circles).
Energy transfer of 15.43 eV is the first
ionization potential of H2, corresponding
to the production of zero-kinetic energy
secondaries. The Mott cross section
qualitatively represents that part of the
ionization caused from knock-on (large
momentum transfer) collisions. he
broken curve was used in integrating thedata by Opal et al. to obtain the totalionization cross section. (b) The con-tinuum dipole oscillator strengths,df/dEt, (Et here is the photon energy)
were derived from the photoionization
measurement by Samson and Haddad
(solid circles)4 and from the electron-
impact data by Backx, Wight, and
van der Wiel ( triangles). 5 The ord-
inate of (b) represents qualitatively
the contribution of dipole-allowed inter-
action; the shape of the curve should be
compared to that of the difference be-
tween the electron-impact data and the
Mott cross section in (a)
References
1. R. D. DuBois and M. E. Rudd, Phys. Rev. A 17, 843 (1978).2. Y.-K. Kim, Radiat. Res. 61, 21 (1975); 64, 205 (1975).3. C. B. Opal, E. C. Beaty, and W. K. Peterson, Atom. Data 4, 209 (1972).4. J.A.R. Samson and G. N. Haddad, personal communication [their data pre-
sented by J.A.R. Samson, Phys. Rev. 28C, 303 (1976), Fig. 9 ].5. C. Backx, G. R. Wight and M. J. van der Wiel, J. Phys. B 9, 315 (1976).6. J. T. Tate and P. T. Smith, Phys. Rev. 39, 270 (1932).7. D. Rapp and P. Englander-Golden, J. Chem. Phys. 43, 1464 (1965).
69
D0
5
0
..Iz
0
- - - -
1

CROSS SECTIONS FOR ELECTRON INELASTIC COLLISIONS WITH ARGON
E. Eggarter and Mitio Inokuti
We present in tabular form a complete set of optical oscillator strengths and
electron-impact cross sections for the argon atom. A large variety of experi-
mental data and theoretical calculations was studied, and -arious checks based
on theory (including the constraint of sum rules) were critically performed.
Data were analyzed mainly by a semiempirical method that stresses the close
relation of photoabsorption with electron-atom collisions.
*A complete report of this work appears in Argonne Report ANL-80-58 (July 1980).
4 iniversidad Nacional de San Luis, Facultad de Ciencias Fisico, Matematicasy Naturales, Escuela de Fisica, Chacabuco y Pedernera, 5700 San Luis, Argentinc.
SPECTRA OF THE OSCILLATOR STRENGTH FOR ATOMS, MOLECULES, ANDSOLIDS
Mitio Inokuti
The spectral distribution of the dipole oscillator strength over the entire
energy range is a basic electronic property of any given material; it character-
izes the response of the material to a spatially uniform but time-dependent electric
field. Thus, the distribution governs many physical phenomena such as absorption
and dispersion of light and long-range interactions with a fast charged particle,
and the van der Waals forces. Two recent decades have been notable progress in
the understanding of the distribution and of the dynamics that govern it. The
lecture illustrates some of the recent results selected from current topics of re-
search; examples include the evaluation of the mean excitation energy for stopping
power, a comprehensive study on metallic aluminum, and near-threshold structure
of the K-shell spectra of atoms and molecules.
*Summary of an invited lecture presented at the Spring Meeting of the DanishPhysical Society, Atomic Physics Section and Solid State Section, May 1980,Helsing6r, Denmark. The author acknowledges Nordisk Institut for TeoretiskAtomfysik, Copenhagen, Denmark, for the Visiting Professorship that supportedthe sojourn from April to July 1980 at Odense University.
70
OSCILLATOR-STRENGTH MOMENTS, STOPPING POWERS, AND TOTAL INELASTIC-SCATTERING CROSS SECTIONS OF ALL ATOMS THROUGH STRONTIUM*
Mitio Inokuti, J. L. Dehmer, T. Baer, and J. D. Hansont
Systematics of the atomic properties named in the title and of other related
quantities have been comprehensively studied. Our calculations are based on a
single-electron approximation using the Hartree-Slater central potential - a model
that represents a reasonable compromise between two goals, namely, a realistic
description of the major features of atomic dynamics and an economical computa-
tion necessary for a survey of many atoms. Our results not only quantify the
general trends of the atomic properties as qualitatively expected from the periodic
table, but also provide a sensible guide to experiment (on atoms for which no
other data are available), to theory (for which we suggest several specific aims
of more advanced analysis), and to applications including radiological physics
and charged -particle microscopy.
Figures 1-3 show selected examples of our results. Figure 1 shows the
mean excitation energy I in the Bethe stopping-power formula. 1,2 Our calcula-
tions explain the general trends of experimental data: The ratio I/ Z, where Z
is the atomic number, varies periodically with Z, reflecting the outer-shell
structure; and the variations damp at high Z because outer-shell contributions
become less and less important for higher and higher Z.
Figure 2 gives the total inelastic-scattering cross section 'tot for 50-keV
electrons. The cross section aot for any fast charged particles depends on Z
in roughly the same way, and the dependence on Z is important for many
applications such as energy-deposition analysis in radiological physics and charged-
particle microscopy. Here the prominent periodic variations are due primarily
to the outer-shell structure
*Summary of a paper published in Phys. Rev. A 23, 95 (1981).
tPresent address: Joint Institute for Laboratory Astrophysics, University ofColorado, Boulder, Colorado 80309.
present address: Department of Applied Physics, Cornell University, Ithaca,New York 14850.
71
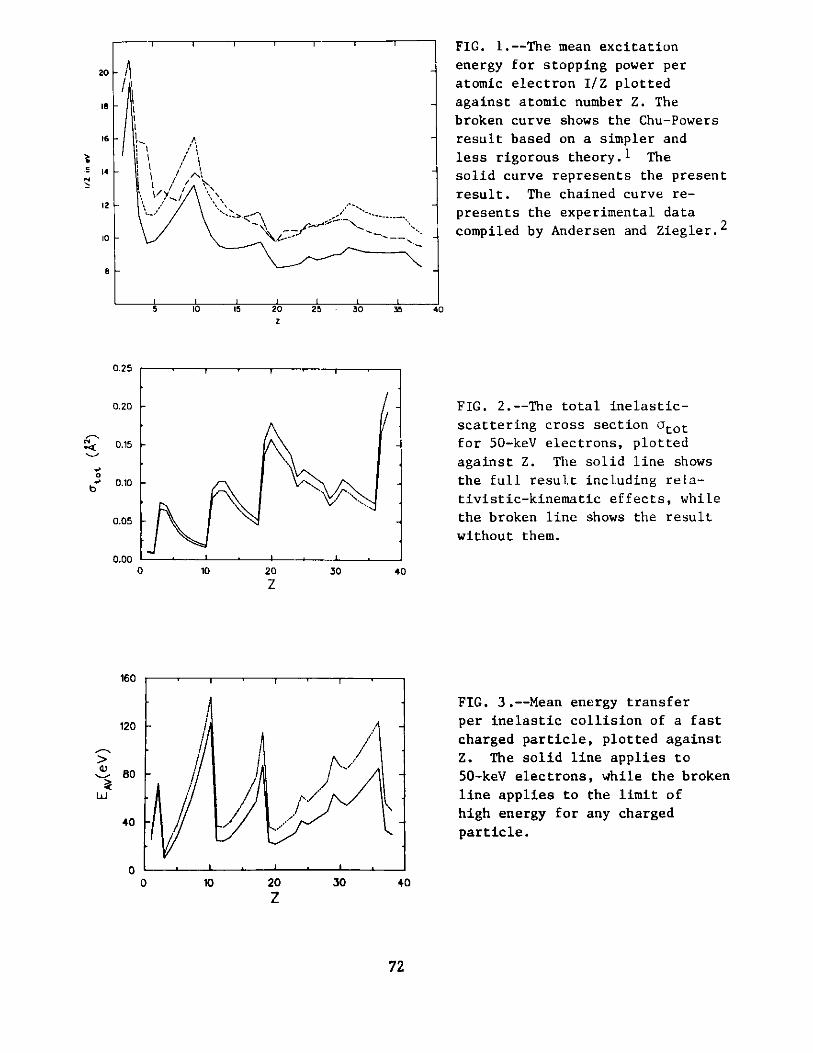
FIG. 1.--The mean excitation
20-_ energy for stopping power peratomic electron I/Z plotted
against atomic number Z. Thebroken curve shows the Chu-Powers
16 - -result based on a simpler and
4>1 less rigorous theory.1 The- ~solid curve represents the present
result. The chained curve re-12 -
presents the experimental data
compiled by Andersen and Ziegler.2
8 - -
5 0 15 20 25 30 35 40z
0.25
0.20 FIG. 2.--The total inelastic-
scattering cross section atot0.15 for 50-keV electrons, plotted
against Z. The solid line shows
b 0.10 the full result including rela-
tivistic-kinematic effects, while
0.05 the broken line shows the result
without them.
0.000 10 20 30 40
z
160
FIG. 3.--Mean energy transfer
120 per inelastic collision of a fast
charged particle, plotted against> Z. The solid line applies to
80 /- 50-keV electrons, while the broken
Ui line applies to the limit of
40..high energy for any charged
particle.
030 10 20 30 40
Z
72
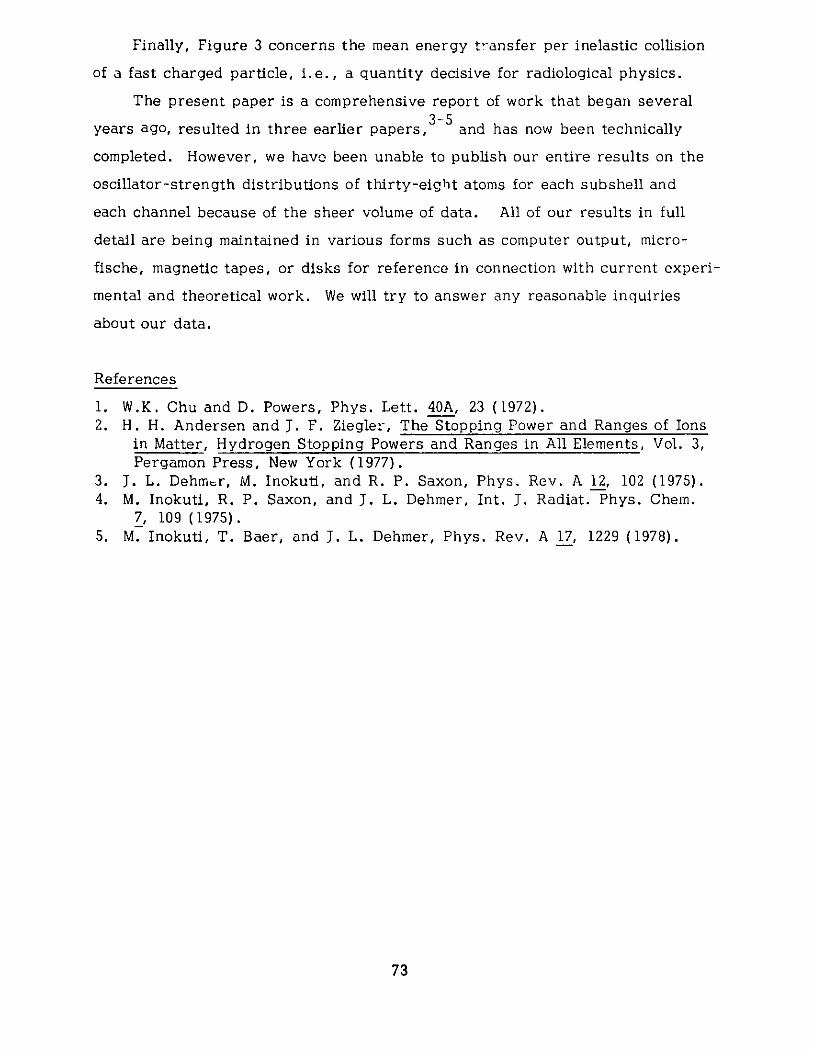
Finally, Figure 3 concerns the mean energy transfer per inelastic collision
of a fast charged particle, i.e., a quantity decisive for radiological physics.
The present paper is a comprehensive report of work that began several
years ago, resulted in three earlier papers,3-5 and has now been technically
completed. However, we have been unable to publish our entire results on the
oscillator-strength distributions of thirty-eight atoms for each subshell and
each channel because of the sheer volume of data. All of our results in full
detail are being maintained in various forms such as computer output, micro-
fische, magnetic tapes, or disks for reference in connection with current experi-
mental and theoretical work. We will try to answer any reasonable inquiries
about our data.
References
1. W.K. Chu and D. Powers, Phys. Lett. 40A, 23 (1972).2. H. H. Andersen and J. F. Ziegler, The Stopping Power and Ranges of Ions
in Matter, Hydrogen Stopping Powers and Ranges in All Elements, Vol. 3,Pergamon Press, New York (1977).
3. J. L. Dehmtr, M. Inokuti, and R. P. Saxon, Phys. Rev. A 12, 102 (1975).4. M. Inokuti, R. P. Saxon, and J. L. Dehmer, Int. J. Radiat. Phys. Chem.
7, 109 (1975).5. M. Inokuti, T. Baer, and J. L. Dehmer, Phys. Rev. A 17, 1229 (1978).
73

BOUNDS ON MEAN EXCITATION ENERGIES IN TERMS OF OSCILLATOR-STRENGTH MOMENTS*
Isao Shimamura and Mitio Inokuti
The logarithmic mean excitation energies that determine, for fast charged
particles, the total inelastic scattering cross section, the stopping power, and
the straggling are bounded from above and below by sirr le expressions in-
volving moments of the oscillator-strength distribution. A general condition
under which the set of elementary inequalities gives tight bounds is indicated,
and is illustrated in several examples. Effective oscillator-strength distribu-
tions that are constructed on the basis of variational principles lead to tighter
bounds in terms of some of the moments and the oscillator strengths for some
discrete excitations.
74
*Abstract of a paper published in Phys. Rev. A 23, 2914 (1981).Institute of Space and Astronautical Science, Tokyo 153, Tapan.

ANALYTIC REPRESENTATION OF THE DIPOLE OSCILLATOR-STRENGTHDISTRIBUTION *
Michael A. Dillon and Mitio Inokuti
It is possible to represent an essential factor of the dipole oscillator-
strength distribution for a single-electron continuum in terms of a compact ex-
pression involving a polynomial of several degrees in a suitable variable. The
factor, which may be called the reduced oscillator-strength distribution, is
defined in terms of the radial dipole matrix element with respect to the final-
state wave function normalized in an energy-independent way near the origin.
The key variable is g = E/ (E: + I), where E is the kinetic energy of the ejected
electron and I is the ionization threshold energy. The structure of the analytic
representation has been identified through a study of the analytic properties
of the dipole matrix element as a function of E. For illustration, H, He, Li, and
Na atoms are treated explicitly. Implications of our results to molecules and
multichannel cases are also indicated. The present findings will be especially
useful for interpolation and extrapolation of experimental data.
*Abstract of a paper published in J. Chem. Phys. 74, 6271 (1981).
75

ON THE FERMI-SEGRE FORMULA
Michael A. Dillon
The Fermi-Segre normalization expression is rederived for arbitrary orb-ital angular momentum 9 within the context of a generalized WBK method. Re-sults from the approximation are xrr pared with calculations employing Hartree-Slater atomic potentials.
Introduction
The amplitude of a normalized continuum wave function at the nucleus is
one of the main factors that determine the energy dependence of a photoioniza-
tion cross section.1 The same quantity in a discrete-state wave function plays
an important role in the discussion of neutral currents and hyperfine splitting. 3,
In the case of s bound states, an estimate of this amplitude may be obtained from
a formula first introduced by Fermi and Segre nearly fifty years ago.5 The
Fermi-Segre expression was rederived by Foldy6 with a view to giving it a more
rigorous and understandable theoretical basis. Subsequently, his treatment
was extended by Bouchiat and Bouchiat (hereafter referred to as BB) to in-
clude states with 9 # 0.
The method devised by Foldy was, in fact, a particular example of a
general theoretical development reported a few years earlier by Miller et al.7,8
All of the techniques nientioned here involve a variant of the WKB approximation.
Thus, implementation of Miller's approach in conjunction with parallel develop-
ments 911 should considerably simplify the combined treatments of Foldy and BB.
Also, the application of a more general but generically similar theory should
provide some insight into the limitations of the WKB approach to similar
problems.
Theory
Let I (r) be a normalized single-electron radial wave function with the
usual limiting property
TP\ C r + a... , (1)
76

where r is the radial coordinate. The point of this discussion is to find an ap-
proximate form for C2 in terms of the energy W, angular momentum number Z,
and the atomic number Z. We begin with the unnormalized wave function, 1,
defined through the reduced radial function P(r) by
P = r $ . (2)
P is the solution of the ordinary differential equation
d2P/dr2+ f2 P= 0 (3)
where
f2= 2W - V - L2/r 2,(4)2
and ( 9 + 1) = L Here atomic units are used. The potential V possesses the
properties
V +-2Z/r as r +0 ; V +-2/r as r+-* . (5)
We wish to approximate $ by applying a kind of asymptotic perturbation
theory known as the generalized WKB method.7,8 In the ordinary WKB approach,
P is approximated by a product function
P T(r) $(S) , (6)
1/2 - 1/2where S = S(r), $ = exp[1 i(2W)/SI and T = S' . Of course, the exponential
function itself is a solution of the differential equation
d2$/dS2 -F2 $= 0 , (7)
with F2 = 2W. An obvious generalization of the WKB method is to extend the
definition of F2 in Eq. 7 to
F2=2E - U - L2S2 , (8)
and at the same time retain the ansatz 6. Ultimately we shall be concerned with
the bound states of Eqs. 3 and 7. However, W and E in Eqs. 4 and 8 are to
remain continuous unless otherwise specified as subscripted quantities.
Inserting Eq. 6 into Eq. 3 and using Eqs. 7 and 8, we get
(T"/T-SF/2F2+ f2)T4 + (2T'/T + S"/S')TS' d$dS = 0 . (9)
Then, in the spirit of the WKB method, let
T = S'-1/ 2 (10)
77

and Eq. 9 becomes
T"/T - S1/2 F2+ f2 =0.(11)
As the first step of an interative solution of Eq. 11, T"/T ", 0 and
S' = f/F . (12)
Equation 12 gives S to zeroth order; therefore to zeroth order,
P (F/f)1/2lS) 5'/2 $(S) . (13)
Since P + O(r9+1) as r + 0, it will be convenient to choose U in Eq. 8 so that
$(S) +O(S ) as S + 0 . (14)
This limit imposes a further condition on S(r), namely
S(r) -+ Ak r as r + 0 . (15)
Then, Eqs. 4, 8, 14, and 15 show that the approximate P given by Eq. 13
approaches O(rZ+1) at small r. Specifically,
2.+1/2 2%+1P -* (Ak) r as r -* 0 , (16)
which is the required form.
Unlike WKB-type wave functions, P of Eq. 13 can be made continuous
across the classical turning points. Let r1 , r2' S , and S2 be the inner and
outer turning points of the respective radial equations 3 and 7. Then impose
the conditions
S(r1 ) = S1 and S(r2 ) =2 '(17)
In any realistic application of this approximation, f and F in Eq. 12 will have
zeros of the same order at r1 and S, respectively. Hence, in contrast to the
ordinary WKB method, T in Eq. 6 will be continuous at the classical turning
points in Eq. 3.
Equation 12 may be rewritten
fFdS = ffdr . (18)
Then explicit application of conditions 17 give for the region 0 r r1 ,
0 5S 5S ,
78

S
[2 E X 2 - 2UX2 - L 2 ]1/ 2 X~ 1 dX= [2 WX2 -2VX2 _ 2 1 /2 X ~1 dX
0 0 (19)
and for the region between the turning points,
2 2 2 1/2 -1 r2 2 2 1/2 -1( [2EX2 - 2UX -L21 X dX = [2WX - 2VX -L2] X dX
S 1r 1 (20)
It will be shown that Eq. 19 suffices to determine A. It is also clear that Eq.
20 determines the approximate eigenenergy W in terms of E . With both quan-n n
tities A and W known, numerical integration of Eq. 12 becomes a simple matter.n
We need to examine briefly certain normalization properties of P and '7,11
For arbitrary (negative) W in Eq. 3, there exists an independ.L pair of solu-
tions P1 and P2 with the following properties:1 2+
P 1+O(r ) as r+0 P +coasr + co(21a)
P2 + O(r as r+0,P2 +0asr+co . (21b)
The two functions become equivalent at the eigenenergies. That is
P = P = P , whenW=W1 2 n' n
Yngve,11 improving on an earlier result by Furry,9 has shown that
2 2 dP n2 dr = N = -- (P P2 ' - P2P' ) (22)
0 n dW 12 2 1 W=Wn
Of course, since $ is also an eigenfunction, it must be true that
2 S -_2 =d (3
$1dS = 0 dE 1 2 2 1')1. =23
n
We note that-1/2dP d S'1$/d$
1 -/ r1-sdsdr dr d
79

and substitute the required forms into Eq. 22 with an obvious change of variable;
the P normalization becomes
-2 dE dN -dW dE 1 2 2 1') . (24
N = ~ - ~ W=W (4n
Equations 23 and 24, together with the fact that W = W when E = E , provide2 n n
an approximate form for N ,
2 2 dW(2N ~N -- . (25)
E=En
Finally, we obtain C2 from Eqs. 1, 2, 16, and 25
2 (N P(0) 2= 2 dWI2Z+1C =1 ~3 N -- (A) .(26)r 9+j 0 dE E kr /)2 E=E
n
With the derivation of Eq. 26, the problem is practically solved. There remains
the relatively simple task of employing the usual hydrogenic models to find A.
Thus, we may put
J = 2Z/S (27)
in Eq. 8, and rewrite V in Eq. 4 as
V = -(2Z/r) T(r) . (28)
In Eq. 27, Z = 1 and Z = Z tests the two obvious possibilities. Then with U
given by Eq. 27, we have for En
E =-Z2/(2n2=ZE2 E (29)n cn
and for No 2
2 _ 2 +n1 2 + Z) 22?3 2 -22+3N - = N Z .(30)
0 [(2k+1)! (n- Z-1)! 22+4 cZ'L J n
Equation 26 becomes
2 2 - 2Z+l dW 22+1C2= N Z -- (A ) , (31)c dE A
c E=Enc
80

where the subscript c refers to the corresponding hydrogenic parameters. The
derivative in Eq. 31 may be written in a more familiar way,
dW 3 dW= n - .(32)J E DEE dn
cn
Also, when n is large,
N 2 2 n+1 2-3c (2Z+1)! n so that
[ 2+1 2 dW 2+1
C2 (2Z+1)!] Z d ( asn+ (33)
Equation 31 is now in the exact form reported by Iwinski et al.12,13 They con-
tinue by calculating A within the framework of an analytical perturbation theory.
The present method employs Eq. 19 written in the form of the limit
S1 r[2E X2 - 2ZX - L2] 1/2 X-1dX - [2W X2 - 2ZnX - L2 1/2 X~1dX + 0
S=Arr
as r + 0, which may be shown to give
2 -/2 [1-(2L2E ) 1/2]2L2/rln A =(2L2E )-/ in 2 n 1/ 1 -1icn (1-(2L2E )1/2 Z(1 -2L2E )1/2
cn cn
2W
+-[ X + n X 2 ]1 2 X 1dX . (34)0 L L
2An important consequence of Eq. 34 is that C is independent of Z. Hence, it
makes no difference whether one uses U = 1/2S or U = Z/S as a reference po-
tential in Eq. 8. At the ionization limit W = E = 0 and Eq. 34 becomesn cn
1 Mi 1/2-1In A.=InM(2L/Zr 1 )-2+ { 1 - /2X dX . (35)0 L
81
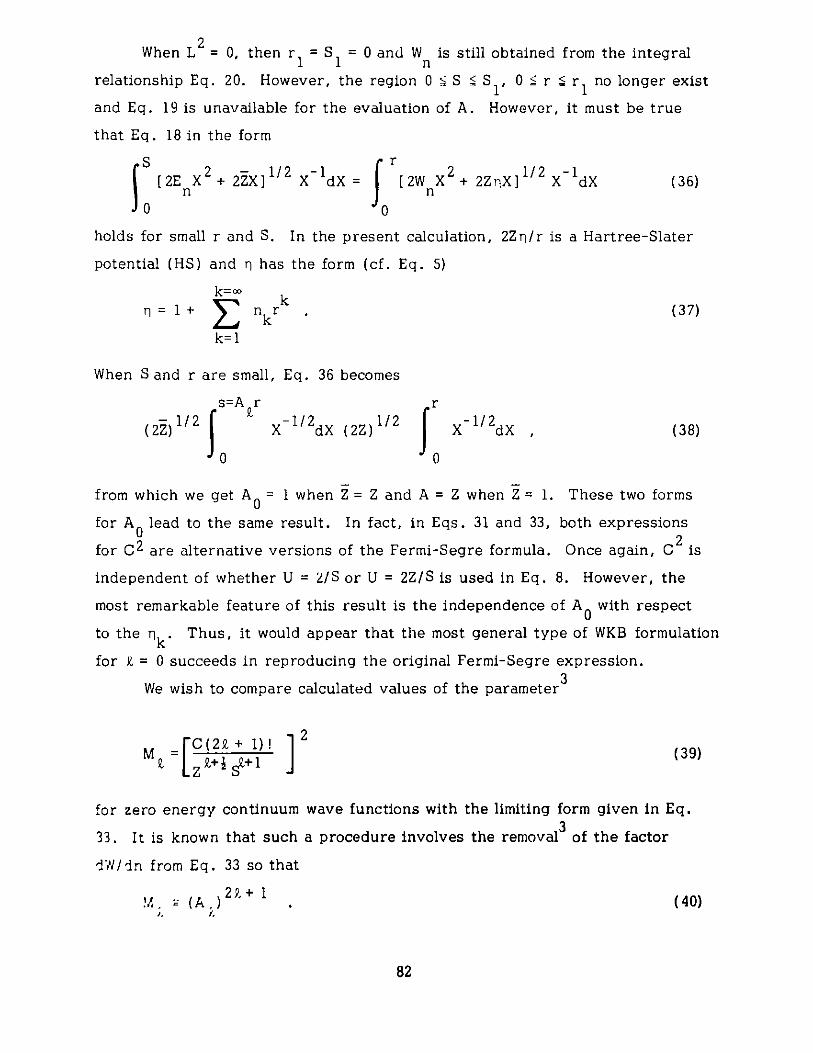
2When L = 0, then r1 = S =0 and W is still obtained from the integral
1 1 nrelationship Eq. 20. However, the region 0 < S Si, 0 r r1 no longer exist
and Eq. 19 is unavailable for the evaluation of A. However, it must be true
that Eq. 18 in the form
Sp r2 - 1/2 - 1 2 1/2 -1
[X2EJ[ X + 2ZX X dX = 2W X + 2ZnX] X dX (36)
0 0
holds for small r and S. In the present calculation, 2Zn/r is a Hartree-Slater
potential (HS) and Ti has the form (cf. Eq. 5)
k=o k+ 3 nkrk . (37)
k=1
When S and r are small, Eq. 36 becomes
- 1/2 s=AZrX-(1/2 Z 1/2 Jr-1/2(2Z) X dX (2Z) X dX (38)
0 0
from which we get A0 = 1 when Z = Z and A = Z when Z = 1. These two forms
for A0 lead to the same result. In fact, in Eqs. 31 and 33, both expressions
for C2 are alternative versions of the Fermi-Segre formula. Once again, C is
independent of whether U = 2/S or U = 2Z/S is used in Eq. 8. However, the
most remarkable feature of this result is the independence of A0 with respect
to the rk. Thus, it would appear that the most general type of WKB formulation
for 9 = 0 succeeds in reproducing the original Fermi-Segre expression.
We wish to compare calculated values of the parameters
M, [C(2k+ 1)! (39)
for zero energy continuum wave functions with the limiting form given in Eq.
33. It is known that such a procedure involves the removal of the factor
dW/dAn from Eq. 33 so that
2P + 1M , (A,)(A (40)
82
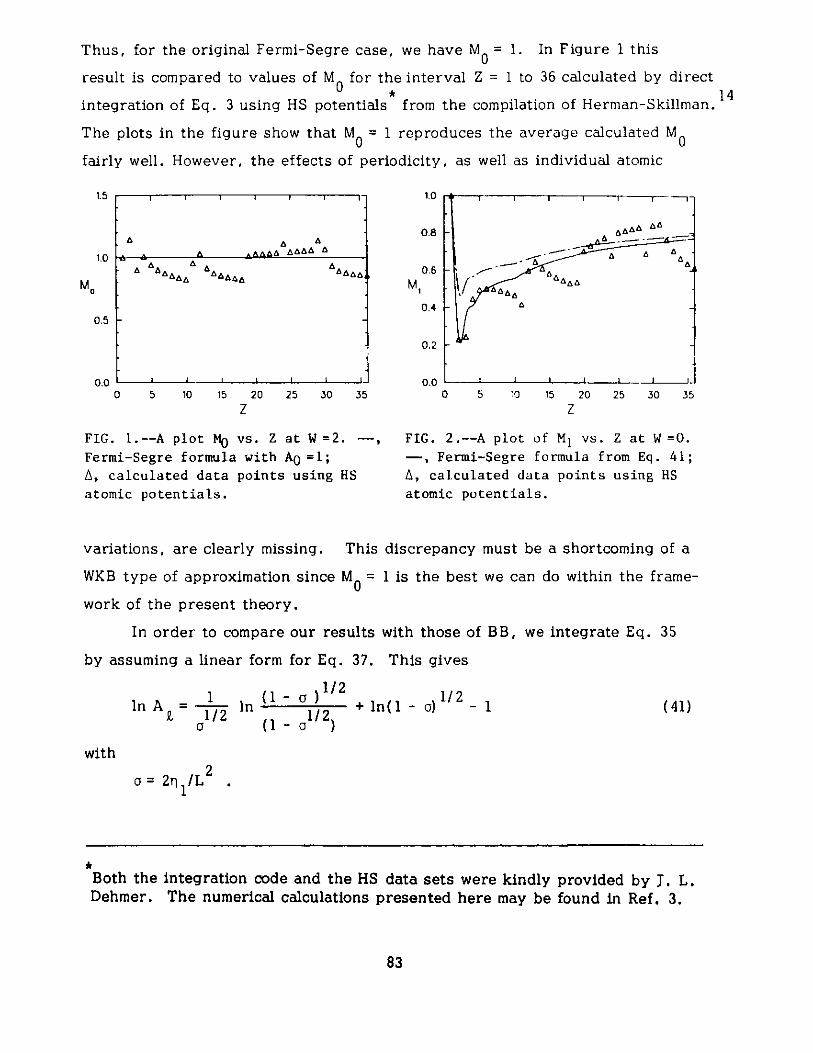
Thus, for the original Fermi-Segre case, we have MO = 1. In Figure 1 this
result is compared to values of M for the interval Z = 1 to 36 calculated by direct0 *
integration of Eq. 3 using HS potentials from the compilation of Herman-Skillman.
The plots in the figure show that MO = 1 reproduces the average calculated M0fairly well. However, the effects of periodicity, as well as individual atomic
1.5
1.0
M0
0.5
0.0
A A A A A AA&
e e e e
e I I I I e jj
1.0
0.8
0.6
0.4
0.2
0.00 5 10 15 20 25 30 35
z
FIG. 1.--A plot MO vs. Z at W =2. -,
Fermi-Segre formula with A0 =1;
A, calculated data points using HS
atomic potentials.
- -
0 5 "0 15 20
z25 30 35
FIG. 2.--A plot of M, vs. Z at W =0.-, Fermi-Segre formula from Eq. 41;
A, calculated data points using HS
atomic potentials.
variations, are clearly missing. This discrepancy must be a shortcoming of
WKB type of approximation since MO = 1 is the best we can do within the frame
work of the present theory.
In order to compare our results with those of BB, we integrate Eq. 35
by assuming a linear form for Eq. 37. This gives
1 (1 - ) 1/21/2nA = ln -y2 + ln(1 - /)2 1 (4
9. 1/2 1/2a (1- a )
with
a
ne-
1)
2a=2n /L
83
*Both the integration code and the HS data sets were kindly provided by J. L.Dehmer. The numerical calculations presented here may be found in Ref. 3.
W.v

The amplitude (A )2 obtained from Eq. 41 may be expanded to first order
in a to yield
(A ) ~ -(22+ 1) k (Z+ 1) ri1/3 (42)
This form of (A ) is identical to the result of BB for W = 0. In Figure 2,3 n
M, = (A ) from both Eqs. 41 and 42 are compared with values of M derived15
from the integration of Eq. 3 employing HS potentials. The parameters n1 used
in a of Eq. 41 were computed from the same potentials. Again, the effects of
periodicity observed in the computed points are missing from approximations
(Eqs. 41 and 42). The approximate curves, especially the one intengrated by
Eq. 41, smoothly follow the calculated points. The structure in the calculated
points clearly follows from the full utilization of the HS potentials in the inte-
gration of Eq. 3. In contrast, the approximate M uses only T of Eq. 37,
while M0 is entirely independent of the model potential.
References
1 M. A. Dillon and M. Inokuti, J. Chem. Phys., in press.2. M. A. Bouchiat and C. Bouchiat, J. Phys. 35, 899 (1974).3. U. Fano, C. E. Theodosiou, and J. L. Dehmer, Rev. Mod. Phys. 48, 49
(1976).4. M. F. Crawford and A. L. Schawlow, Phys. Rev. 76, 1310 (1949).5. E. Fermi and E. Segre, Z. Physik 82, 729 (1933).6. L. L. Foldy, Phys. Rev. 111, 1093 (1958).7. S. C. Miller, Jr. and R. G. Good, Jr., Phys. Rev. 91, 174 (1953).8. S. C. Miller, Jr., Phys. Rev. 94, 1345 (1954).9. W. H. Furry, Phys. Rev. 71, 360 (1947).
10. N. Froman and P. 0. Frmnan, Phys. Rev. A 6, 2064 (1972).11. S. Yngve, J. Math. Phys. 13, 324 (1972).12. Z. R. Iwinski, Y. S. Kim, and R. H. Pratt, Phys. C 19, 1924 (1979).13. Z. R. Iwinski, Y. S. Kim, and R. H. Pratt, Phys. Rev. A 22, 1358 (1980).14. F. Herman and S. Skillman, Atomic Structure Calculations (Prentice-Hall,
Englewood Cliffs, N. J., 1963).15. J. L. Dehmer, Radiological and Environmental Research Division, private
communication (1980).
84

THE FUTURE OF THEORETICAL ATOMIC-COLLISION PHYSICS*
Mitio Inokuti
Several important issues must be resolved for the establishment of an
eventual theory of inelastic collisions of electrons with atoms and molecules;
some of the issues are also relevant to collisions between atoms or molecules.
Some lines of approach that are likely to contribute to substantial progress
are suggested.
85
*Summary of a;i article published in Comments At. Mol. Phys. 10, 99 (1981).

RELATIVISTIC BORN CROSS SECTIONS FOR THE ELECTRON IMPACTEXCITATION*
Yong-Ki Kim
Relativistic effects in electron-atom collisions have three origins: (a) From
atomic structure (intermediate coupling, changes in orbital sizes, etc.); this
effect is important in heavy atoms. (b) From relativistic kinematics (correct
energy-momentum formulas); this is important for fast incident electrons. (c)
From relativistic interactions (transverse virtual photon); this is also important
for fast incident electrons.
To understand the relative'significance of these effects, Born cross sections
for electron-impact excitations of Li-like gold ion, Au76+, were calculated both
in relativistic and nonrelativistic forms.
The relativistic Born cross section for the excitation from the initial state
0) to an excited state In) is1
2 2 2 +4- + 12da 4Tra a a IFI(K)I|-G (K)
2 2 11+ t n 22 'dQ 2Q [Q - (E /2R) 2]2
n
where a = 1/137, a = 0.529A, R = 13.6 eV, E is the excitation energy,2 0 n
Q = (Ka ) with momentum transfer KA, 3 = v/c with incident electron velocity
V, and 0 is the component of Stperpendicular to K. The form factors F (K)
and G (K) are defined asn
F (K) =2(nleiK-r j 0) , (2)
and
c (K)= (n | e j|0) ,(3)
where the summation is over all bound electrons, r. is the position vector of
*Summary of a paper presented at the 7th Int. Conf. on Atomic Physics held atMassachusetts Institute of Technology, August 4-8, 1980.
86
the jth electron, and a is the Dirac matrix. The form factor Fn(K) represents
the longitudinal (nonrelativistic Coulomb) interaction, and G (K) the transverse
interaction (equivalent to the Breit interaction). In the nonrelativistic Born
formula, only F (K) appears.2In an earlier analysis, Fano showed that the transverse interaction peaks
sharply at very small angles. He also showed that the integrated cross section
for the excitations,
0n =f(d o/dQ)dQ ,
should have the form (commonly known as the Bethe formula
2 2-2 2 2 2a = 4'ra 0 a2 (A {ln[2 1(1 - (3)] - (3 }+ B ) , (4)
n n n
where constants A and B depend only on the properties of the target.n n
In Figures 1-3, we compare a calculated in four different ways; (i) with
nonrelativistic formula (i.e., only with F (K) and nonrelativistic wave functions),n
(ii) with relativistic longitudinal interaction only (i.e., only with F (K) but withn
relativistic wave functions), (iii) with relativistic longitudinal and transverse
interactions (i.e., with F (K), (K) and relativistic wave functions), and
finally with the Bethe formula, Eq. 4, where A and B are determined fromn n
relativistic wave functions. The difference A results from the relativistic atomic
structure as embodied in the relativistic wave functions. The difference B
originates from the kinematics, the difference between relativistic and nonrela-
tivistic kinematics. The difference C represents the contribution from the
transverse interaction.
From Figures 1-3, we conclude as follows:
(a) The relativistic atomic structure and kinematics are important in both allowed
and forbidden transitions. One must use relativistic formulas and wave functions.
(b) The transverse interaction is significant only for allowed transitions and
very fast incident electrons ( 32 > 0. 9). (c) The Bethe formula for the inte-
grated cross section (Eq. 4) agrees well with the correct Born cross sections
for fast electrons. The Bethe parameters, however, must be computed from
the relativistic wave functions of the target.
87

76+Au ,2s 1 2-'2p 312
10F
10 100INCIDENT ELECTRON ENERGY IN keV
I I I I II11 I I I I I I Ifill I - I --- 1 1 11 1
... ... .A
02 2
102
zZ0
10 -3
V)
OCU,
0
-5
5i0
2,0
-310
104
S000
I I S I ''I I I I I 1111
76+
1/..1/
I I I I I I I*
100INCIDENT ELECTRON ENERGY IN kh
FIG 13.--Cross section for the 2s -3s excitation of Au 76 by electronimpact. Symbols as in Figure 1.
1000
88
Z
0I-
VI)(!)
-3 -- .
i i I i i lA i , Is, I --1 1v 1
.Z51 J00
10 100INCIDENT ELECTRON ENERGY IN keV
z 10s0
U
0
10I I I i i 1 1
1 1 1 1 1 1 1 1 1 1 1 1 1 1111 I 1 1 1 1 ! 1
_I 1 I l 1 1 1 1 I l I I I I I I I I -- L--"
FIG. 1.--Cross section for the 2si -
2pi, excitation of Au7 6 + by electronimpact (i) Nonrelativistic formula
and wave functions, .... ; (ii) Longi-tudinal interaction only with rela-
tivistic wave functions, -;(iii)
Longitudinal and transverse inter-
actions with relativistic wave
functions, ---- ; (iv) The Bethe form-
ula with relativistic wave functions,
-.-.-.-. See the text for the ex-
planation of A, B, and C.
FIG. 2.--Cross section for the 2s2 -2P3/2 excitation of Au 7 6 by electron
impact. Symbols as in Figure 1.
r
:
I1
1/
(1
-'-,..-
'" --
T 1 I I I I I I I I I I I I I I

References
1. U. Fano, Ann. Rev. Nucl. Sci. 13, 1 (1963).2. U. Fano, Phys. Rev. 102, 385 (1956).3. H. A. Bethe, in Handbuch der Physik, Vol. 24/1, Springer, Berlin (1933).
89

*TRANSITION PROBABILITIES FOR ATOMS
Yong-Ki Kim
The current status of advanced theoretical methods for transition probabili-
ties for atoms and ions is summarized in Table 1. An experiment on the f values
of the resonance transitions of the Kr and Xe isoelectronic sequences is suggested
as a test for the theoretical results.
Table 1. Current Status of Advanced Theories for Transition Probabilities
MCHFa RPAb MBPTc
Open shell Yes Not yet Yes, in principle
Relativity Yes Yes Not yet
Continuum Indirect, Direct, Direct,correlation difficult RPA equation brute force
Gauge invariance No Yes Depends
Accuracy Good Better Best, in principle
Isoelectronic Yes Yes, but limited Not yetsequences
aMulticon figuration Hdrtree-Fock method.bRandom phase approximation.
cMany-body perturbation theory.
Summary of an invited talk presented at the Workshop on Atomic Physics at theNational Synchrotron Light Source, Brookhaven National Laboratory, September15-17, 1980, Report No. BNL-28832, pp. 33-41.
90

REPORT ON THE WORKSHOP ON ATOMIC AND PLASMA PHYSICS REQUIREMENTS
FOR HEAVY ION FUSION, ARGONNE NATIONAL LABORATORY, DECEMBER
13-14, 1979*
Yong-Ki Kim
The workshop, which was organized by Y.-K. Kim and G. R. Maggelssen
(ANL Accelerator Research Facilities Division), identified atomic, molecular, and
plasma physics areas relevant to intertial confinement fusion by energetic heavy
ions. Discussions were confined to problems related to the design of heavy ion
accelerators, accumulation of ions in storage rings, and the beam transport in a
reactor vessell. The atomic and molecular data needed are listed in Table 1 with
recommended priorities.
Table 1. Atomic and molecular data relevant to heavy-ion fusion. Prioritiesdepend very much on the accelerator and reactor pressure under consideration.
Where they PreferredType of data are needed Priority method
Ion-gas charge-changing Induction Linac Primary Experimentcross-section (< 109cm/sec)
Ion-gas stripping cross- re linac, Secondary Theorysections ( 109 cm/sec) synchrotron
(storage ring)
Ion-ion charge-changing rf linac Primary Experimentcross sections synchrotron(< 108 cm/sec) (storage ring)
Charge states Reactor Primdry Theory with(< 10-3 Torr) benchmark
experiment
Charge states Reactor Secondary Theory with(10-3 - 10 Torr) benchmark
experiment
Secondary-electron Reactor Secondary Experimentdistribution
Electron degradation Reactor Secondary Theory
Plasma diagnostics Reactor Secondary Experiment
*Summary of Argonne National Laboratory Report ANL-80-17 (available from theNational Technical Information Service, U.S. Dept. of Commerce, Springfield,Va. 22161).
91

PUBLICATIONS BY THE STAFF OF THE FUNDAMENTAL MOLECULAR PHYSICSAND CHEMISTRY SECTION FOR THE PERIOD OCTOBER 1979-SEPTEMBER 1980.
MAJOR PAPERS
K. T. Cheng, I.-K. Kim, and J. P. Desclaux, Electric dipole, quadrupole, andmagnetic dipole transition probabilities of ions isoelectronic to the first-rowatom ., Li through F, Atomic Data and Nuclear Tables 24(2), 111 (1979).
B. E. Cole, D. L. Ederer, R. Stockbauer, K. Codling, A. C. Parr, J. B. West,E. D. Poliakoff, and J. L. Dehmer, Wavelength and vibrational-statedependence of photoelectron angular distribution. Resonance effects in5a photoionization of CO, J. Chem. Phys. 72, 6308 (1980).
J. L. Dehmer, Jon Siegel, J. Welch, and Dan Dill, Origin of enhanced vibration-al excitation in N 2 by electron impact in the 15-35 eV region, Phys. Rev.A 21(1), 101-104 (1980).
P. M. Dehmer and W. A. Chupka, Predissociation of the 3p 1flu state in H 2 , HD,and D 2 , Chem. Phys. Letters 70(1), 127-130 (February 1980).
P. M. Dehmer, J. L. Dehmer, and W. A. Chupka, Effect of vibronic interactionand autoionization on the photoelectron spectrum of N 20, J. Chem. Phys.73(1), 126-133 (July 1980).
J. P. Desclaux, K. T. Cheng, and Y.-K. Kim, Relativistic energy levels ofFe XXI, J. Phys. B: Atom. Molec. Phys. 12(23), 3819-3825 (December 1979),
D. Dill, J. Welch, J. L. Dehmer, and J. Siegel, Shape-resonance-enhancedvibrational excitation at intermediate energies (10-40 eV) in electron-moleculescattering, Phys. Rev. Lett. 43, 1236 (1979).
E. Eggarter and Mitio Inokuti, Cross sections for electron inelastic collisionswith argon, ANL-80-58 (July 1980).
K. N. Huang, W. R. Johnson, and K. T. Cheng, Totally polarized electronsfrom photolonization of outer P1/2 subshells of rare gases: A relativisticrandom phase approximation calculation, Phys. Letters 77A(4), 234-236(May 1980).
Mitio Inokuti, Atomic processes pertinent to radiation physics, Electronic andAtomic Collisions, Eds., N. Oda and K. Takayanagi (North-Holland Publ.Co., 1980), pp. 31-45.
Mitio Inokuti, Disturbing the Universe, by Freeman Dyson. (Book review),Proc. Phys. Soc. Japan 35, 541 (June 1980) (in Japanese).
92

M. Inokuti, H. Sekine, and T. Mura, General use of the Lagiange multiplierin nonlinear mathematical physics, in Variational Methods in the Mechanicsof Solids. Proceedings of the IUTAM Symposium on Variational Methodsin the Mechanics of Solids, 11-13 September 1978, Evanston, Illinois,edited by S. Nemet-Nasser (Pergamon, London, 1980), pp. 156-162.
Mitio Inokuti, Atomic and Molecular Collisions, by Sir Harrio Mas :ey (Book Review),American Scientist 68, 320 (May-June 1980).
Mitio Inokuti, On the evaluation of the Born partial-wu. e amplitude for electronscattering by an electrostatic multipole field, J. Phys. B: Atom. Molec.Phys. 13, 1221-1227 (March 1980).
Mitio Inokuti, D. A. Douthat, and A.R.P. Rau, Statistical fluctuations in theionization yield and their relation to the electron degradation spectrum,Phys. Rev. A 22(2), 445-453 (August 1980).
Yong-Ki Kim and Kwok-tsang Cheng, Stopping power for partially stripped ions,Phys. Rev. A 22(1), 61-67 (July 1980).
Maureen G. Lynch, Dan Dill, Jon Siegel, and J. L. Dehmer, Elastic electronscattering by CO2, OCS, and CS2 from 0 to 100 eV, J. Chem. Phys.71(11), 4249-4254 (December 1979).
S. T. Manson and M. Inokuti, Near-threshold structure in the atomic K-shellspectra for ionization by photons or by fast charged particles, J. Phys.B: Ato:a. Molec. Phys. 13, L323-L326 (May 1980).
P. P. Nicole, Removal of volatile materials from forepump oil, J. Vac. Sci.Technol. 17, 1384 (1980).
A. C. Parr, Roger Stockbauer, B. E. Cole, D. L. Ederer, J. L. Dehmer, andJ. B. West, An angle resolved photoelectron spectrometer for atoms andmolecules, Nucl. Instrum. Methods 172, 357-361 (May 1980).
J. C. Person and P. P. Nicole, Interface for rapid data transfer from NIMcounters to small computers, Rev. Sci. Instrum. 51, 1425-1426 (1980).
E. Shiles, Taizo Sasaki, Mitio Inokuti, and D. Y. Smith, Self-consistency andsum-rule tests in the Kramers-Kronig analysis of optical data: Applicationto aluminum, Phys. Rev. B 22(4), 1612-1628 (August 1980).
Jon Siegel, J. L. Dehmer, and Dan Dill, Differential cross sections for e-LiFscattering, J. Phys. B: Atom. Molec. Phys. 13, L215-L219 (1980).
Jon Siegel, J. L. Dehmer, and Dan Dill, Elastic-electron-scattering cross sectionsfor N 2 from 0 to 1000 eV. Energy-dependent exchange potentials,Phys. Rev. A 21(1), 85-94 (January 1980).
93
David Spence, A technique to enhance and separate negative ions from neutralautoionising features in scattered electron spectra in the ionisationcontinuum: Application to negative ions in neon, J. Phys. B: Atom.Molec. Phys. 13, 1611-1624 (1980).
David Spence and P. D. Burrow, Cross sections for excitation of the 2s22p 3s Pand (2s2p4 ) 4 P states of atomic nitrogen by near-threshold electron impact,J. Phys. B: Atom. Molec. Phys. 13, 2809-2815 (1980).
David Spence, Measurements of the ratio of the He 2 S/23S energy-integratedtotal cross sections from threshold to 0.10 WV. Comparison with theory,J. Phys. B: Atom. Molec. Phys. 13, L73-L77 (1980).
J. R. Swanson, D. Dill, and J. L. Dehmer, Nuclear motion effects in the photo-ionization of CO2 , J. Phys. B 13, L231 (1980).
J. B. West, A. C. Parr, B. E. Cole, D. L. Ederer, R. Stockbauer, and J. L.Dehmer, Shape- resonance-induced non-Franck-Condon vibrationalintensities in 3Cg photolonization of N 2 , J. Phys. B: Atom. Molec. Phys.13(3), L105-L108 (February 1980).
CONFERENCE PAPERS AND ABSTRACTS
XIth Annual Meeting of the Division of Electron and Atomic Physics, the AmericanPhysical Society, Houston, Texas, 10-12 December 1979. Bull. Am. Phys. Soc.24(9) (November 1979).
P. M. Dehmer and P. S. Dardi, Predissociation decay rates for selectedvibrational levels of the 3pr lRu state in H 2, HD, and D 2, P- 1191-
P. M. Dehmer and P. S. Dardi, High-resolution study of photoabsorptionand photolonization in HD and D 2 , p- 1201.
S. T. Manson and M. Inokuti, Generalized oscillator strength for ionizationof the K and L shells of atoms. II, p. 1171.
J. L. Dehmer (invited paper), Interaction of electronic and vibrationalmotion in molecular photoionization. Recent experiments and theory, p. 1188.
J. Siejel, J. L. Dehmer, and D. Dill, Hybrid calculation of e-LIF scatter-ing, p. 1170.
1980 Annual Meeting of the American Physical Society, January 21-24, 1980, Chicago.Bull. Am. Phys. Soc. 25(1) (January 1980).
M. Inokuti and D. A. Douthat, Statistical fluctuations in the ionizationyield upon electron degradation of gases, p. 37.
94

A. C. Parr, R. Stockbauer, J. L. Dehmer, B. E. Cole, D. L. Ederer, andJ. B. West, Triply-differential photoionization studies of small molecules,Book ol abstracts, 28th Annual Conference on Mass Spectrometry andAllied Topics, 25-30 May 1980, New York, New York.
VI International Conference on Vacuum Ultraviolet Radiation Physics, 2-6 June1980, University of Virginia, Charlottesville, Virginia. Abstracts appear inBook of Extended Abstracts.
E. D. Poliakoff, J. L. Dehmer, A. C. Parr, D. Dill, K. H. Jackson, andR. N. Zare, Polariz-d fluorescence excitation spectroscopy of N 2 , 11-25.
S. Wallace, J. R. Swanson, D. Dill, and J. L. Dehmer, Molecular photo-electron branching ratios and angular distributions from 0 to 10 Ry.Effects of shape resonances and vibration, 11-13.
K. Codling, J. B. West, A. C. Parr, J. L. Dehmer, B. E. Cole, D. L.Ederer, and R. Stockbauer, Partial cross sections, vibrational branchingratios, and angular distributions in the 570-600 1 window resonancesin 02'11-14.
A. C. Parr, J. L. Dehmer, B. E. Cole, D. L. Ederer, R. L. Stockbauer,and J. B. West, An angle-resolved photoelectron spectrometer for triply-differential photoionization studies, III-70.
J. L. Dehmer, A. C. Parr, J. B. West, K. Codling, D. L. Ederer, B. E.Cole, E. D. Poliakoff, and R. Stockbauer, Effects of shape resonanceson vibrational branching ratios and photoelectron angular distributionsin molecular photolonization, 11-86.
R. Stockbauer, A. C. Parr, J. L. Dehmer, B. E. Cole, D. L. Ederer,J. B. W st, and K. Codling, Perturbation of vibrational intensity andangular distributions by autoionization in molecular photoionization, II-15.
J. C. Person and P. P. Nicole, Microcomputer control of absorptionexperiments, 111-31.
J. C. Person, P. P. Nicole, and D. E. Fowler, Absorption cross sectionsof the chloromethanes from threshold to 21 eV, 11-79.
Vilth International Conference on Atomic Physics, Massachusetts Institute ofTechnology, August 4-8, 1980. Book of Abstracts.
Yong-Ki Kim, Relativistic Born cross sections for the electron impactexcitation, p. 111.
W. R. Johnson, K. T. Cheng, K.-N. Huang, and M. le Dourneuf, Analysisof Beutler-Fano autoionizing resonances in the rare gas atoms using therelativistic multichannel quantum defect theory, p. 68.
95

K.-N. Huang, W. R. Johnson, and K. T. Cheng, Angular distributionand spin polarization of photoelectrons from noble gases, p. 182.
Molecular Spectroscopy and Dynamics with Synchrotron Radiation - A EuropeanWorkshop, 28 September-1 October 1980, Maria Laach, West Germany. Bookof Abstracts:
J. L. Dehmer and D. Dill, Shape resonances in molecular photoionization(Invited talk), pp. 43-45.
K. Codling, J. B. West, A. C. Parr, J. L. Dehmer, and R. L. Stockbauer,Photoelectron angular distribution measurements through autoionizingresonances in argon and xenon, pp. 52-54.
96