Embed Size (px)
Citation preview

Radioactivity in Food andthe Environment, 1995
Ministry of Agriculture,Fisheries and Food, 1996
RIFE - 1


1
MINISTRY OF AGRICULTURE, FISHERIES AND FOOD
Radioactivity in Foodand the Environment, 1995
1996

2
© Crown copyright, 1996
Requests for reproduction of material contained in this report should be addressed to MAFF
This is the first joint surveillance report published by MAFF covering information previously issued in the TerrestrialRadioactivity Monitoring Report (TRAMP) and the Aquatic Environment Monitoring Report (AEMR).
The report was compiled and written by W. C. Camplin BSc MSc MSRP, of the Directorate of Fisheries Research(DFR) at Lowestoft for the Radiological Safety Division of the Food Science and Safety Group in London.

3
CONTENTS Page
SUMMARY
1. Introduction .................................................................................................................................................. 11
2. Disposals of radioactive waste ...................................................................................................................... 112.1 Radioactive waste disposal from, and in, sites on land ........................................................................ 112.2 Solid radioactive waste disposal at sea ................................................................................................ 12
3. Sampling programme .................................................................................................................................... 123.1 Nuclear sites ......................................................................................................................................... 12
3.1.1 The aquatic programme ........................................................................................................... 123.1.2 The terrestrial programme ........................................................................................................ 13
3.2 Industrial and landfill sites ................................................................................................................... 133.3 Chernobyl fallout ................................................................................................................................. 143.4 Regional monitoring ............................................................................................................................. 14
3.4.1 Milk and crops .......................................................................................................................... 143.4.2 Total Diet study (TDS) .............................................................................................................. 143.4.3 Isle of Man and Channel Islands .............................................................................................. 143.4.4 Seawater survey ........................................................................................................................ 14
4. Methods of measurement .............................................................................................................................. 144.1 Sample analysis .................................................................................................................................... 154.2 Measurement of dose rates ................................................................................................................... 154.3 Dry cloths ............................................................................................................................................. 15
5. Presentation of results ................................................................................................................................... 15
6. Assessment of results ..................................................................................................................................... 176.1 Radiation protection standards ............................................................................................................. 176.2 Methods and data ................................................................................................................................. 17
7. British Nuclear Fuels plc (BNFL) ................................................................................................................ 197.1 Sellafield and Drigg, Cumbria ............................................................................................................. 19
7.1.1 The aquatic monitoring programme ......................................................................................... 197.1.2 The terrestrial monitoring programme ..................................................................................... 24
7.2 Springfields, Lancashire ....................................................................................................................... 267.3 Capenhurst, Cheshire ........................................................................................................................... 26
8. United Kingdom Atomic Energy Authority (UKAEA) .............................................................................. 278.1 Harwell, Oxfordshire ............................................................................................................................ 278.2 Winfrith, Dorset ................................................................................................................................... 27
9. Nuclear power stations operated by Nuclear Electric plc ......................................................................... 279.1 Berkeley, Gloucestershire and Oldbury, Avon ..................................................................................... 289.2 Bradwell, Essex .................................................................................................................................... 289.3 Dungeness, Kent .................................................................................................................................. 289.4 Hartlepool, Cleveland .......................................................................................................................... 299.5 Heysham, Lancashire ........................................................................................................................... 299.6 Hinkley Point, Somerset ....................................................................................................................... 309.7 Sizewell, Suffolk .................................................................................................................................. 309.8 Trawsfynydd, Gwynedd ....................................................................................................................... 319.9 Wylfa, Gwynedd................................................................................................................................... 31
10. Defence establishments ................................................................................................................................. 3210.1 Aldermaston, Berkshire ........................................................................................................................ 3210.2 Barrow, Cumbria .................................................................................................................................. 3210.3 Chatham, Kent ...................................................................................................................................... 3210.4 Devonport, Devon ................................................................................................................................ 3210.5 Greenwich, London .............................................................................................................................. 32
/continued:

4
11. Amersham International plc ........................................................................................................................ 3311.1 Amersham, Buckinghamshire .............................................................................................................. 3311.2 Cardiff, South Glamorgan .................................................................................................................... 33
12. Minor sites and Euratom sampling ............................................................................................................. 3312.1 Imperial College Reactor Centre, Ascot, Berkshire ............................................................................. 3412.2 Imperial Chemical Industries plc, Billingham, Cleveland ................................................................... 3412.3 Rolls Royce plc, Derby, Derbyshire ..................................................................................................... 3412.4 Universities Research Reactor Centre, Risley, Cheshire ...................................................................... 3412.5 Euratom sampling ................................................................................................................................ 34
13. Industrial sites ............................................................................................................................................... 3513.1 Albright and Wilson Ltd., Whitehaven, Cumbria ................................................................................ 3513.2 Other industrial sites ............................................................................................................................ 36
14. Landfill sites .................................................................................................................................................. 36
15. Chernobyl fallout .......................................................................................................................................... 37
16. Regional monitoring ...................................................................................................................................... 3716.1 Isle of Man ........................................................................................................................................... 3816.2 Channel Islands .................................................................................................................................... 3816.3 Diet in England and Wales ................................................................................................................... 3816.4 Milk from dairies in England, Wales and Northern Ireland ................................................................. 3916.5 Crops in England and Wales ................................................................................................................ 3916.6 Seawater surveys .................................................................................................................................. 40
17. Research in support of the monitoring programme ................................................................................... 40
18. References ...................................................................................................................................................... 40
Tables 1-51 .......................................................................................................................................................... 44-119
Appendix 1. Monitoring of the marine environment near nuclear sites in Scotland, 1995 ............................ 121
Appendix 2. Abbreviations ................................................................................................................................... 132
Appendix 3. Consumption, handling and occupancy rates ................................................................................ 133
Appendix 4. Dosimetric data ................................................................................................................................ 136
Appendix 5. Estimates of concentrations of radionuclides due to natural sources ......................................... 137
Appendix 6. Modelling of activity in milk and livestock .................................................................................... 138

5
SUMMARY
1. This report is the first in a series which combines the results of the radioactivity monitoring programmespreviously published by MAFF in two documents: the �Terrestrial Radioactivity Monitoring Programme(TRAMP) Report: Radioactivity in food and agricultural products in England and Wales� and the �AquaticEnvironment Monitoring Report: Radioactivity in surface and coastal waters of the British Isles(AEMR).
2. These programmes required the taking of approximately 1500 samples of terrestrial and aquatic foodstuffstogether with approximately 3700 samples of environmental indicators and dose rate measurements from sitesthroughout England and Wales. These samples were subjected to approximately 16000 analyses for theirradioactive content or dose rate measurement. The essential conclusion of this report is that foodstuffsproduced in England and Wales and seafoods produced in the waters surrounding the British Isles areradiologically safe to eat.
3. The programmes are managed by the Ministry of Agriculture, Fisheries and Food on behalf of the ScottishOffice, the Welsh Office, the Department of the Environment for Northern Ireland, the Manx Government andthe Channel Island States. They act as a key component of the UK Government�s strategy to protect thesafety of the food chain and the marine environment. The main objective of the programmes is to verify thatradioactivity present in foodstuffs is acceptable and to ensure that the resulting public radiation exposure iswithin internationally accepted limits. The bulk of the report concerns England and Wales. However, data onthe marine environment of the British Isles including Scotland are included to be consistent with earlierreports and because the effects of discharges of liquid effluents are detectable in areas remote from the pointof origin.
4. A substantial part of the cost of the programmes is recouped from industries discharging wastes in accordancewith the �polluter pays� principle.
5. Disposals of liquid, gaseous and solid wastes from major nuclear sites in England and Wales are regulated bythe Environment Agency using powers in the Radioactive Substances Act, 1993. Disposals from all sites in1995 were within the authorised limits except where specified in the text.
6. Measurements in 1995 included the analysis of samples of food and other materials from the environment anddetection of beta and gamma dose rates in the environment. The results showed that radionuclideconcentrations and radiation dose rates were generally similar to those in 1994. However, near Sellafield,superimposed on the general downward trend in radionuclide concentrations due to Sellafield discharges,there were some changes in concentrations of particular radionuclides in the marine environment reflectingoperations at the site. These operations included processing of stored wastes and the operation of theEnhanced Actinide Removal Plant (EARP). The Thermal Oxide Reprocessing Plant (THORP) continued itscommissioning phase in 1995 and had little effect on food and the marine environment. The results of themonitoring have been interpreted in terms of public radiation exposures using data from food and localsurveys to establish �critical groups� of people likely to be most exposed.
7. Public radiation doses received in 1995 from discharges of radioactive waste are presented in the SummaryTable and in Figures 1-3. The exposures are expressed in terms of �committed effective dose� calculated onthe basis of the methodology in ICRP-60. Where appropriate, doses to skin are also given. Exposures wereall within the dose limit of 1 mSv for members of the public or the skin dose limit of 50 mSv as appropriate.Figures 1 and 2 present the numerical data in graphical form for aquatic and terrestrial sectors, respectively.Figure 3 combines these data and represents the most exposed group doses for each site from all food andaquatic pathways in 1995.
8. The highest exposures due to the nuclear industry were from discharges of liquid radioactive wastes fromSellafield. Exposures of high-rate fish and shellfish consumers due to artificial radionuclides near Sellafieldincreased in 1995 (0.12 mSv), as compared with 1994 (0.08 mSv), due to increased consumption of molluscsand increased concentrations of technetium-99 in crustaceans. These individuals also received a doseresulting from discharges from the Albright and Wilson works at Whitehaven. Exposures of people associatedwith fisheries at Whitehaven, Morecambe Bay and Dumfries and Galloway were similar in 1995 to exposuresin 1994. Exposures from people associated with fisheries at Fleetwood reduced because of a reduction inconsumption of seafood. These exposures include a contribution due to activity discharged in years prior to 1995.

6
Summary Table: Estimates of public radiation exposure from discharges of radioactive waste in
England and Wales
Establishment Radiation exposure pathway Critical group Exposure, mSva
British Nuclear Fuels plcSellafield and Driggb Fish and shellfish consumption Local fishing community 0.12
Terrestrial foods Local consumers at Sellafield <0.081� � � � Drigg <0.035� � � � Ravenglass <0.037External Houseboat dwellers (River Ribble) 0.091Externalc Fishermen (Whitehaven) 0.060� Anglers 0.13External � 0.84d
Handling of fishing gear Local fishing community 0.30d
Porphyra/laverbread consumption Consumers in South Wales <0.005Trout consumption Local consumers at Sellafield 0.046
Springfields External Houseboat dwellers (River Ribble) 0.091� Anglers 0.042� (skin) � 2.6d
Terrestrial foodsg Local consumers <0.007f
Capenhurst Inadvertent ingestion of water and Local community <0.005sedimentTerrestrial foods Local consumers <0.005f
United Kingdom Atomic Energy AuthorityHarwell Fish consumption and external Anglers 0.017
Terrestrial foods Local consumers <0.005Winfrith Fish and shellfish consumption Local fishing community <0.005
Terrestrial foods Local consumers <0.005
Nuclear Electric plcBerkeley and Oldbury Fish and shellfish consumption Local fishing community 0.010
and externalTerrestrial foods Local consumers <0.005
Bradwell Fish and shellfish consumption Houseboat dwellers 0.011and externalTerrestrial foods Local consumers <0.005
Dungeness Fish and shellfish Bait diggers 0.008consumption and externalTerrestrial foods Local consumers <0.013
Hartlepool Fish and shellfish consumption Local fishing community <0.005Terrestrial foods Local consumers <0.009
Heysham Fish and shellfish consumption Local fishing community 0.073and externalTerrestrial foods Local consumers <0.012
Hinkley Point External Local fishing community 0.008Terrestrial foods Local consumers <0.013
Sizewell Fish and shellfish consumption Local fishing community <0.005and externalTerrestrial foods Local consumers <0.008
Trawsfynydd Fish consumption and external Local fishing community 0.035Terrestrial foodsg Local consumers <0.014
Wylfa Fish and shellfish consumption Local fishing community 0.005and externalTerrestrial foods Local consumers <0.006
Defence EstablishmentsAldermaston Fish consumption Anglers <0.005
and externalTerrestrial foods Local consumers <0.005f
Barrow External Local community 0.023Chatham External Houseboat dwellers 0.005Devonport Fish and shellfish consumption Local community 0.012
and external
Amersham International plcAmersham Fish consumption and external Anglers <0.005
Terrestrial foods Local consumers <0.011Cardiff Fish and shellfish consumption Local fishing community 0.012
and externalTerrestrial foods Local consumers <0.027
Abright and Wilson LtdWhitehavene Fish and shellfish consumption Local fishing community 0.29
a Unless otherwise stated represents committed effective dose calculated using methodology of ICRP-60 to be compared with the dose limit of 1mSv (see section 6). Exposures due to marine pathways include the far-field effects of discharges of liquid waste from Sellafield. All exposuresfor terrestrial pathways include a component from radionuclides which were found to be below the limits of detection. Unless stated otherwise,the critical group for terrestrial pathways is represented is represented by the 1 year old age group
b The estimates for marine pathways include the effects of liquid discharges from Drigg, but exclude the effects of naturalradionuclides. The contribution due to Drigg is negligible. The exposure due to enhanced concentrations of natural radionuclides for seafoodconsumers in 1995 was 0.21 mSv
c Includes a small contribution due to consumption of seafoodd Exposure to skin including a component due to natural sources of beta radiation, to be compared with the dose limit of 50 mSv (see section 6)e These estimates include the effects of enhanced concentrations of natural radionuclides but exclude a small contribution from the effects of
artificial radionuclides from other sites. They assume a gut uptake of 0.8 for polonium which is based on studies of seafood consumption (seesection 6). The exposure due to artificial radionuclides in 1995 was 0.054 mSv
f Includes a component due to natural sources of radionuclidesg Adults

7
Dose limit tomembers of thepublic is 1 mSv
Hartlepool
Dungeness
Sizewell
Bradwell
Winfrith
Aldermaston
AmershamHarwell
Hinkley
Cardiff
Trawsfynyd
CapenhurstWylfa
Springfields
Heysham
Sellafield
Figure 2. Radiation exposures in England andWales due to gaseous radioactivedischarges, 1995
Berkeley/Oldbury
Dose limit tomembers of thepublic is 1 mSv
Hartlepool
Sizewell
Bradwell
ChathamHarwell
Amersham
Dungeness
Winfrith
Aldermaston
Devonport
Hinkley
Berkeley/Oldbury
Trawsfynydd
Capenhurst
WylfaSpringfields
HeyshamBarrow
Figure 1. Radiation exposures in England andWales due to liquid radioactive wastedischarges, 1995. (Historic dischargesfrom Sellafield have a significant effecton exposures throughout the Irish Sea.Exposures at Whitehaven andSellafield include the effects ofenhanced concentrations of naturalradionuclides)
SellafieldWhitehaven
Cardiff

8
Hartlepool
Dungeness
Sizewell
Bradwell
Winfrith
Aldermaston
Amersham
Harwell
Hinkley
Trawsfynyd
CapenhurstWylfa
Springfields
Heysham
Dose limit tomembers of thepublic is 1 mSv
Chatham
Devonport
Berkeley/Oldbury
Figure 3. Radiation exposures in England andWales due to radioactice discharges,1995. (Historic discharges fromSellafield have a significant effect onexposures throughout the Irish Sea.Exposures at Whitehaven and Sellafieldinclude the effects of enhancedconcentrations of natural radio-nuclides)
WhitehavenSellafield
Cardiff
Barrow
9. The most exposed group from discharges of gaseous wastes was also at Sellafield. The dose to the mostexposed group of terrestrial food consumers, including a contribution from fallout, was less than 0.081 mSv,an increase from the value for 1994 because of a change in the method of assessment to account for thepresence of daughter nuclides with some radionuclides and increased levels of sulphur-35 in milk.Consumers of trout from a farm near Sellafield received a dose of <0.046 mSv. Exposures due toconsumption of terrestrial foods at all nuclear sites were well within the dose limit of 1 mSv.
10. Those most exposed to external radiation in connection with liquid discharges from Sellafield were a group ofanglers who dig their own bait near Sellafield. Their dose in 1995 was 0.13 mSv, similar to the value for1994. The exposure of the small group of houseboat dwellers in the Ribble estuary reduced from 0.14 mSv(1994) to 0.091 mSv in 1995 because of a reduction in dose rates and occupancies on the boat. All exposuresdue to artificial radionuclides discharged in liquid wastes were well within the dose limit of 1 mSv.
11. Concentrations in seafood of the key radionuclides discharged from Whitehaven Works (Albright and WilsonLtd) have reduced further in 1995, as expected, due to earlier reductions in liquid discharges and radioactivedecay. As a consequence, exposures of the most exposed group of fish and shellfish consumers due to theenhancement of concentrations of natural radionuclides have reduced. Taking an upper estimate of the guttransfer of polonium, the dose in 1995 was cautiously estimated to be 0.29 mSv compared with 0.34 mSv in1994. This group also received a dose from discharges from Sellafield. Further reductions in concentrationsof radionuclides in shellfish are expected in 1996.
12. No evidence was found for enhancement of radionuclide levels near non-nuclear industrial sites other than atAlbright and Wilson Ltd, Whitehaven. However, there was limited evidence to support the observation thattritium is to be found leaching from some landfill sites. The radiological significance of the levels found wasnegligible. Further monitoring around landfill sites was carried out on behalf of HMIP (HMIP 1995).

9
13. The collective dose from seafood consumption to the UK and other European populations in 1995 was 3 and20 man-Sv respectively, similar to the values for 1994. The most significant waste discharges giving rise tocollective dose were those of radiocaesium from Sellafield.
14. Regional monitoring showed that exposures on the Isle of Man and the Channel Islands from artificialradioactivity were low, at less than 3% of the dose limit of 1 mSv in the case of the Isle of Man and lower inthe Channel Islands. Analyses of general diet throughout England and Wales and foodstuffs produced remotefrom nuclear sites continued to demonstrate that natural radionuclides are by far the most dominant source ofexposure through the food chain.

10
♦
Hartlepool
Dungeness
Bradwell
Sizewell
Devonport
Winfrith
AscotAldermaston
Harwell
Burghfield
Amersham
Wylfa
Oldbury
Berkeley
Trawsfynydd
Capenhurst
Springfields
HeyshamBarrow
Sellafieldand Drigg
RisleyDerby
Billingham
BNFL Establishment
UKAEA Establishment
Nuclear Electric Power Station
MOD Establishment
Amersham Int. plc Establishment
Other Establishmentn
l
Figure 4. Principal sources of radioactive waste disposal in England and Wales
Cardiff Greenwich
HinkleyPoint

11
1. INTRODUCTION
This report is the first in a series which combines theresults of the radioactivity monitoring programmespreviously published by the Ministry of Agriculture,Fisheries and Food (MAFF) in two documents: the�Terrestrial Radioactivity Monitoring Programme(TRAMP) Report: Radioactivity in food and agriculturalproducts in England and Wales� (e.g. MAFF, 1995) andthe �Aquatic Environment Monitoring Report:Radioactivity in surface and coastal waters of the BritishIsles� (e.g. Camplin, 1995).
The data in this report are for 1995 and the combinedprogramme is managed by MAFF on behalf of theScottish Office, the Welsh Office, the Department ofthe Environment for Northern Ireland, the ManxGovernment and the Channel Island States. Togetherwith the monitoring sponsored by Her Majesty�sInspectorate of Pollution a (e.g. HMIP, 1995), theprogramme supports statutory functions under theRadioactive Substances Act, 1993 (United Kingdom -Parliament, 1993) (replacing the RadioactiveSubstances Act, 1960 (United Kingdom - Parliament,1960)). It is set up to verify that radioactivity presentwithin foodstuffs is acceptable and to ensure that theresulting public radiation exposure is withininternationally accepted limits. The monitoring isindependent of similar programmes carried out bynuclear site operators as a condition of theirauthorisations to discharge radioactive wastes. Thebulk of the report concerns the environment of Englandand Wales and adjacent sea areas. However, data onthe marine environment of the whole of the BritishIsles are included to be consistent with earlier reportsand because the effects of discharges of liquid effluentsare detectable remote from their point of origin.Where appropriate, the monitoring data for nuclearsites are supplemented by results from other projectsrelated to the behaviour of radioactivity in theenvironment. A summary of all monitoringprogrammes as undertaken by nuclear site operatorsand local and central government is available (Cotter etal., 1992) and details of monitoring programmesspecifically related to Scotland have been published(e.g. Scottish Office, 1996).
To set the monitoring results from the programme incontext, radioactive waste disposals from nuclearestablishments in England and Wales in 1995 are firstsummarised (Tables 1, 2 and 3). Before the results arepresented, an explanatory section gives details ofmethods of sampling, analysis and presentation andexplains how results are interpreted in terms of publicradiation exposures. Information on liquid radioactivewaste discharges from nuclear sites in Scotland andassociated environmental monitoring is contained in
Appendix 1. A glossary of terms and abbreviations isprovided at Appendix 2.
2. DISPOSALS OFRADIOACTIVE WASTE
2.1 Radioactive waste disposal from,and in, sites on land
Data on radioactive waste disposals are publishedannually by the Department of Environment(Department of the Environment, 1996), the latestavailable publication being for the year 1994. Details ofthe discharges from individual sites are available fromthe Environment Agency. A summary of 1995discharges is included here and this enables the resultsof monitoring presented in this report to be consideredin the context of the relevant disposals. The sites whichare the principal sources of waste containing man-maderadionuclides are shown in Figure 4 for England andWales. Our programme includes monitoring at each ofthese sites. For completeness, it should be noted thatsmall disposals of radioactive waste are also authorisedfrom other sites such as hospitals, chemical works andresearch establishments. Small amounts of solid wasteare also disposed of in specified landfill sites. In generalthese disposals are so insignificant that environmentalmonitoring of their effects is not required for individualsites. Enhanced levels of radioactivity in foodstuffsresulting from discharges from such sites would bedetected within the regional samples.
Tables 1, 2 and 3 list the principal disposals of liquid,gaseous and solid radioactive waste respectively fromnuclear establishments in England and Wales during1995. The Tables also list the disposal limits which areauthorised or, in the case of Crown operators,administratively agreed. In some cases, theauthorisations specify limits in greater detail than can besummarised in a single table: in particular, periodsshorter than one year are specified at some sites. Theauthorised limits are usually very much lower than thelevels of activities which could be released withoutexceeding the dose limits which are recommended bythe International Commission on RadiologicalProtection (ICRP), and embodied in national policy(United Kingdom - Parliament, 1995a). Thepercentages of the authorised (or agreed) limits taken upin 1995 are also stated in the Tables. These indicate thatdisposals from all sites were within the limits set by theAuthorities (see also section 9.9).
Where changes in the rates of disposal in 1995 havematerially affected the levels of radioactivity in theenvironment, comments are made to this effect in therelevant part of the subsequent text.
a With effect from April 1996, this HMIP function has been transfered to The Environment Agency.

12
2.2 Solid radioactive waste disposalat sea
In addition to receiving most of the liquid discharges,the marine environment has also, in the past, receivedpackaged solid waste of low specific activity, mainlydisposed of in an area of the deep Atlantic Ocean. Themost recent such disposal was in 1982. Theenvironmental impact of the deep ocean disposals isdetermined by mathematical modelling and has beenshown to be negligible (OECD (NEA), 1985).Disposals of small amounts of waste also took placefrom 1950 to 1963 in a part of the English Channelknown as the Hurd Deep. The results of environmentalmonitoring of this area in 1995 are presented in Section16, which confirms the negligible radiologicalsignificance of these disposals.
3. SAMPLING PROGRAMME
The basis for the main part of the sampling programmeis to provide data permitting calculation of exposures tomembers of the public for comparison with nationallimits. In this context sampling is taken to include notonly collection of samples from the environment forlaboratory analysis (which is mainly directed at foodpathways), but also direct measurements in theenvironment of dose rates to assess external exposurepathways. Subsidiary objectives for the programme are:(i) to establish a baseline from which to judge theimportance of accidental releases of radioactivity shouldthey occur; (ii) to determine whether undeclared releasesof radioactivity have occurred from sites; and (iii) toprovide information on radioactivity in the diet of thegeneral population and to aid calculation of collectiveradiation exposures.
Sampling is generally focused at nuclear sites licensedby the Health and Safety Executive under the NuclearInstallations Act, 1965 (United Kingdom - Parliament,1965) where the programme serves to provideinformation to assist government bodies to fulfil theirstatutory duties under the Radioactive Substances Act,1993 b .
However, additional sampling is carried out remote fromnuclear sites in order that the government bodies canestablish the general safety of the foodchain and theenvironment as affected by, for example, atmosphericfallout from past nuclear weapons testing and theaccident at Chernobyl and discharges from nuclear sitesin other nations.
The combined programme can be divided into four mainsectors largely on the basis of the origin of radioactivityin the environment:
1. Nuclear sites2. Other industrial and landfill sites3. Chernobyl fallout4. Regional monitoring
The scope of these sectors is summarised in Table 4 anddescribed in the following sub-sections.
3.1 Nuclear sites
Nuclear sites are the prime focus of the programme asthey are responsible for the largest discharges ofradioactive material. Monitoring is carried out inrelation to each of the given sites in Figure 4. Mostsampling and direct monitoring is conducted in the site�simmediate vicinity. However, because of the ability todetect the effects of discharges of liquid effluent fromBNFL Sellafield in many parts of north-Europeanwaters, the programme for this site extends beyondnational boundaries.
Whilst the development of aquatic and terrestrialcomponents of the programme has historically takenplace under separate management, the common goal inboth areas is the estimation of exposures for those smallgroups of people who are most at risk from disposals ofradioactive waste. In the aquatic environment, thepathways which are most relevant to such a programmeare ingestion of seafood, freshwater fish and drinkingwater and external exposure from contaminatedmaterials. In the terrestrial environment they areingestion of terrestrial foods, inhalation of airborneactivity and external exposure from material in the airand deposited on land. The drinking water pathway isgenerally considered as part of HMIP�s programme(HMIP, 1995). Inhalation of airborne activity andexternal exposure from airborne material and surfacedeposition are difficult to assess by direct measurementand are more amenable to assessment usingenvironmental models. The main thrust of themonitoring is therefore directed at foodstuffs of all kindsand external exposure on the shores of seas, rivers andlakes.
3.1.1 The aquatic programme
The general scope of the aquatic programme in 1995 issummarised in Table 5. The detailed programme can bededuced by reference to the results given later in this
b Ministry of Defence sites are excluded from statutory regulation under the Radioactive Substances Act, 1993 although similarcontrols are exercised by administrative means. In April 1996, the distribution of functions within government bodies wasamended by the Environment Act, 1995 (United Kingdom - Parliament, 1995b).

13
report. The two main components were: (i) samplingand laboratory analysis of a wide range of seafood andindicator materials; and (ii) direct measurements ofexternal dose rates in areas of known or suspectedcontamination. In both cases the frequency ofmeasurement is dependant on the level of environmentalimpact from the source under scrutiny, the intervalsbetween measurements varying between 1 month and 1year. In addition, large-area contamination monitoringis carried out along beaches at selected sites to establishwhether there is any unusual localised radioactivitywhich may be missed by the sediment sampling andmeasurement regime which is by definition selective.
The types of material sampled and the locations wheresamples are taken from are chosen to be representativeof existing exposure pathways. Knowledge of suchpathways is gained from local habits surveys and othersources. As a consequence the programme varies fromsite to site and, indeed from year to year, according tolocal circumstances. For example, shrimps are animportant fishery at Hinkley Point and are a keyfoodstuff in the programme at this site. At Springfieldsvery little commercial fishing takes place and the bulk ofthe monitoring addresses external exposure pathways.
Measurements of indicator materials, such as sedimentsand seaweeds, whilst less directly relevant to dose, stillperform an important function by, for example,providing information on trends in contamination levelsat a site. These materials can concentrate particularradionuclides and can offer a cost-effective means ofmeasurement. In the case of sediments, there is animmediate use for activity concentration data inassessments. Such data can be used to help distinguishcontributions to the overall dose rates from artificial andnatural radionuclides and different sources of artificialradioactivity.
3.1.2 The terrestrial programme
The general scope of the terrestrial programme in 1995is summarised in Table 5. The main focus of thisprogramme is the sampling and analysis of foodstuffswhich may be affected by gaseous discharges althoughin some cases where food availability is limited,environmental indicator materials such as grass aremonitored in place of food. Grass and soil are alsosampled and analysed under obligations under theEuratom Treaty (see section 12.5).
The types of foodstuff sampled are chosen on a site bysite basis to reflect local availability, however, the basisof the choice is to provide information on the maincomponents of diet; milk, meat and cereals, and onproducts most likely to be contaminated by discharges,such as leafy green vegetables or soft fruit. Minor foodssuch as mushrooms and honey, which are known toaccumulate radioactivity in some circumstances, are alsosampled when available.
For monitoring purposes cows� milk is generally themost important foodstuff as grass is an efficient collectorof atmospheric contaminants and many of the moreimportant radionuclides are rapidly passed from grassinto milk. In addition, milk is a convenient product toregularly sample and analyse and is an important part ofthe diet, especially for young children and infants. Inaddition cows graze a large area of pasture and thereforethe monitoring of milk provides a method of carryingout surveillance of large areas. For most analyses weeklycollections are bulked to provide four quarterly samplesfor analysis each year, although some analyses such assulphur-35 and carbon-14 may be carried out monthly.The frequency of analysis of other foodstuffs isgenerally annual in order to allow for as wide a range ofsample types as possible. Samples are collected fromlocations as close to the sites as practicable as these willshow the highest levels of contamination. In the case ofmilk, sampling may take place at several farms and theseare labelled either as �near� or �far� in the tables ofresults depending on their distance from the site. Thethreshold for distinguishing between near and far farmsis generally 8 km.
The analyses carried out on terrestrial samples reflectthe relative magnitude of radionuclide dischargesthrough the gaseous route and the transfer processeswhich exist for terrestrial pathways. Analysis of grassand soil is carried out in accordance with therequirements under Article 35 of the Euratom Treaty.Results are sent to the Joint Research Council in Italyfor incorporation into the Radioactivity EnvironmentalMonitoring database.
�Dry cloth� detectors comprise a cloth mounted on aframe. They are positioned at several locations aroundeach nuclear site and are analysed for alpha, beta andgamma activity each month. They provide a simplemethod of sampling airborne activity and results areproduced quickly to provide an indication of grosschanges in discharge. If such changes are found thensampling of materials which can provide a quantitativeassessment of food chain impact is considered.
3.2 Industrial and landfill sites
Whilst the main focus of the combined programme is thenuclear industry, a watching brief is kept on otheractivities which may have a radiological impact in thefood chain. This part of the programme considers theimpact of discharges of natural radionuclides fromchemical works and of disposal into landfill sites otherthan at the BNFL disposal site at Drigg.
A limited number of industrial sites are chosen for studybecause either they are known from previous research tohave measurable impact on the environment or theyrepresent a type of industrial activity which has potentialeffects on the environment. These sites do not requirelicensing under the Nuclear Installations. In 1995, the

14
chemical works studied were at Whitehaven in Cumbria,where discharges of liquid effluent containing naturalradionuclides have been shown to increase exposuresthrough seafood consumption (Camplin et al., in press),at Eggborough in North Yorkshire (a coal-fired powerstation), at Ellesmere Port in Cheshire (an oil refinery)and at Milford Haven in Pembrokeshire (an oil refinery).In the case of the Whitehaven site, the survey wasdirected at seafood sampling and analysis. At the othersites monitoring of grass, soil or animals took placebecause the main interest is in any possible terrestrialfood chain impact.
The landfill sites studied were in Lancashire, Cleveland,Gwynedd and Cambridgeshire. These landfill siteswhich are amongst those licensed to receive very lowlevels of radioactivity for controlled burial are studied toassess the extent, if any, of the contamination leachingfrom the site and re-entering the terrestrial environmentand hence the foodchain.
3.3 Chernobyl fallout
The main effort to monitor the effects of the Chernobylaccident in 1986 was in relation to the continuingrestrictions on the movement and sale of sheep inCumbria and North Wales. Monitoring of otherfoodstuffs is now at a much reduced rate as levels havedeclined since the accident, but there remains a smallscale survey of caesium radionuclides in freshwater fishtaken from a few upland lakes.
3.4 Regional monitoring
In addition to the previous programmes which addressspecific sources of contamination in England and Wales,we also consider the levels of radionuclides in theenvironment more remotely from these sources as anindication of general contamination of the food supply.The component parts of this programme are:
• sampling of milk and crops;• dietary surveys;• monitoring of the Isle of Man and the Channel
Islands;• seawater surveys.
3.4.1 Milk and Crops
The milk sampling is carried out within England, Walesand Northern Ireland in two networks: a �sparse�network of 3 dairies where samples are determined to asignificantly lower level of detection than is routine; anda �dense� network of 27 dairies which affords nation-wide coverage at higher limits of detection. Samples aretaken monthly and are reported to the EU to allowcomparison of results with those from other Europeancountries.The crop sampling complements the regional dairyprogramme. Samples are taken from twenty locations
covering ten regions throughout England and Wales andthe results give an indication of background levels ofradioactive contamination from natural andanthropogenic sources (weapons tests and Chernobylfallout) for comparison with samples collected fromaround nuclear sites.
3.4.2 Total Diet Study (TDS)
The purpose of the dietary surveys is to provideinformation on radionuclides in the general food supplyto supplement that for other contaminants.Representative mixed diet samples are collected fromnine regions throughout England and Wales. Each dietsample is prepared as for consumption and combined inamounts which reflect their relative importance in theaverage UK diet.
3.4.3 Isle of Man and theChannel Islands
Monitoring on the Isle of Man for terrestrial foodstuffsis carried out on behalf of the Department of LocalGovernment and the Environment. It comprisessampling of a range of foodstuffs and analysis forChernobyl, Sellafield and Heysham relatedradionuclides. Monitoring of seafood is primarilydirected at the effects from Sellafield.
Channel Islands monitoring is carried out on behalf ofthe Channel Island States. It comprises sampling andanalysis of seafood and indicator materials as a measureof the potential effects of UK and French discharges intothe English Channel and also of historic disposal ofsolid waste in the Hurd Deep.
3.4.4 Seawater survey
Seawater surveys are carried out in the Irish Sea,Scottish waters and the North Sea to provideinformation on radionuclide levels and fluxes in thecoastal seas of northern Europe. Such information isused to support international studies of the health of theseas under the aegis of the Oslo and Paris Conventions(OSPAR, 1993a) to which the UK is a signatory. Thesesurveys are mounted using research vessels every fewyears and are supplemented by a continuous small scaleprogramme of spot sampling of seawater at coastallocations.
4. METHODS OFMEASUREMENT
There are two basic types of measurement made: (i)samples are collected from the environment andanalysed for their radionuclide content in a laboratory;and (ii) dose rates are measured directly in theenvironment.

15
4.1 Sample analysis
The analyses carried out on samples vary according tothe nature of the source under investigation. The typesof analysis can be broadly categorised in two groups: (i)gamma spectrometry; and, (ii) radiochemical methods.The former is a cost-effective method of detecting awide range of radionuclides commonly found in wastesand is used for most samples. The latter comprises arange of analyses involving chemical treatments toisolate the radionuclides under study. They are sensitivemethods but costly. They are therefore only used whenthere is clear expectation that information is needed onspecific radionuclides which are not detectable usinggamma spectrometry.
Currently four laboratories analyse samples in theprogrammes described in this report. DFR isresponsible for analysis of aquatic samples and of drycloths, VLA and NRPB for gamma spectrometry andradiochemistry of terrestrial samples excluding uraniumanalysis and CARE for uranium analysis of terrestrialsamples. Each laboratory operates a quality controlprocedure to the standards required by MAFF involvingregular calibration of detectors and intercomparisonexercises with other laboratories. The methods ofmeasurement used are summarised in Table 6.
Corrections are made for the radioactive decay ofradionuclides between the time of sample collection andmeasurement in the laboratory. This is particularlyimportant for radionuclides with relatively short half-lives such as sulphur-35 and iodine-131. Where bulkingof samples is undertaken, the date of collection of thebulked sample is assumed to be in the middle of thebulking period. Otherwise the actual collection date forthe sample is used. In a few cases where short-livedradionuclides are part of a radioactive decay chain, theingrowth of activity from their parent radionuclides aftersample collection is also considered. Corrections to theactivity present at the time of measurement are made totake this into account for protactinium-233 and thorium-234.
The analysis of foodstuffs is carried out on that part ofthe sampled material which is normally eaten, e.g. theshells of shellfish and the pods from legumes are usuallydiscarded before analysis. Foodstuff samples areprepared in such a way so as to minimise losses ofactivity during the analytical stage, e.g. most shellfishsamples are boiled soon after collection to minimiselosses from the digestive gland. For a fewradionuclides, some activity may be lost in the cookingprocess. However, these losses are to be expected in thenormal cooking process for the foodstuff.
4.2 Measurement of dose rates
Measurements of gamma dose in air over intertidal areasare normally made at 1 m above the ground using MiniInstruments c environmental radiation meters type 6-80with compensated G-M tubes type MC-71. When thehuman activity resulting in exposure justifies it, forexample for people living on boats or for wildfowlerslying on the ground, measurements at other distancesfrom the ground may be made. External beta doses aremeasured on contact with the source, for example,fishing nets, using Berthold*LB 1210B contaminationmonitors. These portable instruments are calibratedagainst recognised reference standards.
4.3 Dry Cloths
The dry cloth programme provides a simple and cheapmethod of sampling airborne radioactive contaminationaround each of the major nuclear licensed sites. The drycloth assembly consists of a v-shaped cloth mounted topivot on a 2 metre rod. The assembly is set up in arelatively exposed area and is free to turn in the wind tomaximise collection. The cloths are changed each monthand analysed for alpha, beta and gamma activity. Around2000 cloths are analysed each year. Each set of results iscarefully examined so that any unusual levels of activitycan be followed up by further sampling or investigationat the site.
5. PRESENTATION OFRESULTS
The tables of monitoring results contain summarisedvalues of observations obtained during the year underreview. Where more significant figures are provided bythe contributing laboratories, the data are generallyrounded to two significant figures but it should be notedthat values near to the limits of detection will not havethe precision implied by using two significant figures.Observations of a given quantity may vary throughoutthe year; in general, any variations are larger than theanalytical uncertainty inherent in the observations. Thevariations may, for example, be due to changes in ratesof discharge or to different conditions in the receivingenvironment. The presentation of the summarisedresults reflects the purpose of this monitoring which isinterpreted in terms of public radiation exposures. Themethod of interpretation is described more fully inSection 6. The appropriate integration period forcomparison with recommended limits is one year;standard practice is to combine annual rates ofconsumption or occupancy of the small group of peoplewho are the most exposed (the critical group) with thearithmetic means of observed radioactivity
c The reference to proprietary products in this report should not be construed as an official endorsement of these products, nor
is any criticism implied of similar products which have not been mentioned.

16
concentrations or dose rates, respectively, during theyear at the appropriate locations. The use of, forexample, the one-off highest observed radioactivityconcentration, where a series of measurements havebeen made over the year, with an annual consumptionrate would not generally provide a realistic basis forcomparison with the recommended limits. However, inthe case of terrestrial foods excluding milk, such as meatand potatoes, it is recognised that the potential forstorage of foods harvested at a particular time has to betaken into account. In such cases, we have presented themaximum concentration observed of each radionuclidein 1995 as well as the mean value. The maximum islabelled �Max.� in the tables and forms the basis for theassessment of dose. For milk samples, the appropriatequantity for use in assessments is the arithmetic mean atan individual farm where the highest concentrations areobserved. This is also labelled �Max.� in the tables todistinguish it from the values which are averaged over arange of farms.
The tables of concentrations are based on three types ofresults for individual samples. These are: (i) positivelydetected values above the detection limits; (ii) values atthe minimum reporting level (MRL) or limit of detection(LoD); and (iii) results which are �not detected� (ND) bythe methods used. In the case of the latter category, anND result is indicated for aquatic samples when theuncertainty in the measurement due to counting statisticsexceeds a threshold value. �Less than� values arereported at the LoD or the MRL for terrestrial sampleswhen the radionuclide is one which is likely to bedischarged or when a positive result is detected in anyother sample from the site in 1995. Limits of detectionare governed by various factors relating to themeasurement method used and these are described inearlier reports (MAFF, 1995). The minimum reportinglevel is a quantity related to the radiological significanceof a particular concentration of activity. In certain cases,whilst a limit of detection may be relatively low, therequirements for reporting from analytical laboratoriesare defined at a higher level, that is the MRL. Theconcepts and values of MRL�s are discussed further inearlier reports (e.g. MAFF, 1995).
When assembling data in the tables of concentrationsfrom the analytical laboratories, for calculation of dosesvalues to be included are calculated assuming that �lessthan� activities are present in the sample at �less than�levels for those nuclides which are specified in thedischarge authorisation. If a result is �not detected� thenthe activity is taken to be nil.
Uncertainties in the results are reported in the tableswhere appropriate. For all samples except dry cloths,the uncertainties are due to counting statistics and areexpressed at the 95% confidence interval. When resultsin the tables wholly comprise �less than� or �notdetermined� results, no uncertainties are quoted.However when they include such results, the combined
uncertainty for a mean or maximum result is calculatedassuming the uncertainty for an individual sample is nilif the result for that sample is not positive. Thecombined uncertainties are calculated by taking thesquare root of the sum of squared uncertainties dividedby the number of observations.
The majority of the analyses undertaken of terrestrialfoodstuffs are carried out to routine LoD�s and MRL�swhich are chosen to represent a small percentage of thedose limit for members of the public. In some cases it isuseful to carry out analyses to below these routine levelsto provide information on the actual concentrations ofactivity present and therefore facilitate more realisticassessment of activity intake by the local population andto illustrate geographical variations and time trends inresults. Such results are labelled �sub-sets� in the tables.
The results for certain measurements, particularlyconcentrations of alpha, beta, gamma, carbon-14 anduranium-238 and thorium-232 decay chains and doserates of beta and gamma radiation, include acontribution due to natural radioactivity. Whereappropriate, the assessment of exposures takes intoaccount these contributions as discussed in Section 6.
The tables of results give an indication of the number ofobservations made for each material. For measurementsof dose rates, each observation consists of the mean of anumber of individual instrument readings at a givenlocation.
The number of farms which are sampled to provideinformation on activities in milk are indicated in thetables of results. Otherwise, the number of samplingobservations in the tables of concentrations refers to thenumber of samples which were prepared for analysisduring the year. In the case of small animals such asmolluscs, one sample may include several hundredindividual animals. The number of samplingobservations does not necessarily indicate the number ofindividual analyses carried out for a particularradionuclide. In particular, determinations byradiochemical methods are sometimes carried out lessfrequently than those by gamma spectrometry.However, the results are based on bulking of samplessuch that the resulting determination remainsrepresentative.
In keeping with normal practice, the concentrations ofvery short-lived (<3 days half-life) radionuclides whichare supported by their parents are not reported in thetables. However, the concentrations of parents arequoted and it can be assumed that the concentrations ofthe daughter products are approximately equal to thoseof the parents. Examples of such very short-livedradionuclides are yttrium-90, rhodium-103m, rhodium-106m, barium-137m and protactinium-234m which areformed by decay of, respectively, strontium-90,ruthenium-103, ruthenium-106, caesium-137 and

17
thorium-234. Account is taken of the presence of thesedaughter nuclides when performing the calculations ofexposure.
6. ASSESSMENT OFRESULTS
6.1 Radiation protection standards
The monitoring results in this report are interpreted interms of radiation exposures of the public. Thestandards against which these exposures are judged areembodied in national policy on radioactive waste(United Kingdom - Parliament, 1995a). The NationalRadiological Protection Board (NRPB) advises the UKGovernment on appropriate standards, including therecommendations of the ICRP. Current UK practicerelevant to the general public is based on therecommendations of the ICRP as set out in ICRPPublications 26 (ICRP, 1977) and 60 (ICRP, 1991). TheEuratom Directive on basic radiation safety standards(Commission of the European Communities, 1980), withwhich UK legislation complies, is based on therecommendations of ICRP-26, but has been revised totake account of the changes in radiological protectioncriteria recommended in ICRP-60; new United Kingdomlegislation will be promulgated in due course. TheInternational Atomic Energy Agency (IAEA) and itsrelated inter-governmental organisations have nowpublished their own, revised, Basic Safety Standards forRadiation Protection based on ICRP-60 (IAEA, 1996).
The ICRP-60 dose limitation system for practicesinvolving radiation includes, within appropriate doselimits to individuals, the requirement that �all exposuresshall be kept as low as reasonably achievable...�(ALARA). This requirement involves consideration ofcollective, as well as individual, doses in radiologicalcontrol procedures. Collective doses from radioactivewaste discharges are kept under review as describedlater and by NRPB (Hughes and O�Riordan, (1993)).The ICRP and the NRPB do not recommend a dose limitfor populations; such a limit might be regarded assuggesting the acceptability of a higher populationexposure than may be either necessary or probable.
The condition that doses should meet the ALARAobjective is subject to compliance with appropriateindividual dose limits. Control of individual exposuresis intended to limit stochastic effects (i.e. those whoseprobability depends on the dose) to an acceptable leveland to prevent non-stochastic or deterministic(threshold) effects. For stochastic effects, it isrecommended that the risk should be equal whether thewhole body is irradiated uniformly or non-uniformly;weighting factors proportional to the risk are defined fordifferent organs. The weighted sum of organ doses iscalled effective dose in ICRP-60. Exposures fromintakes of radioactivity can continue for a number of
years, depending upon body retention time. The ICRP-60 committed effective dose represents the integratedexposure following an intake. The maximum doseaccepted by the UK Government (United Kingdom -Parliament, 1995a) is 1 mSv in a year; this limit appliesto the sum of the effective dose resulting from externalexposure during one year and the committed effectivedose from that year�s intake of radionuclides. ICRP-60distinguishes between �practices� which add exposures,can be controlled and to which the dose limits apply, asopposed to �interventions� which reduce exposures froma pre-existing situation and to which the dose limits donot apply. However, it is accepted that exposures arisingfrom past controlled releases should be included in anycomparison with the dose limit to avoid any relaxationof the control of public exposure presently exercised.The dose limitation criteria for members of the publicapply at each site to the mean dose received by �criticalgroup�, which is that small group of people who,because of their habits and other aspects of behaviourwhich affect the doses received, are the most exposed.
In this report, the committed effective doses to the mostexposed groups in 1995 calculated from the monitoringdata are therefore compared with the dose limit of 1mSv. For external exposures, specific non-stochastic(deterministic) limits are appropriate. For example, theICRP continues to recommend (ICRP, 1991) the limitfor skin of 50 mSv in a year; this limit is applicable, forexample, in the case of handling of fishing gear.
A new recommendation in ICRP-60 is that optimisationshould be subject to appropriate constraints which applywithin the overall limits. The UK Government hasaccepted that the dose constraint for a single new sourceshould not exceed 0.3 mSv year-1 and that, in general, itshould be possible for existing plant to be operated sothat the dose from a controlled source does not exceed0.3 mSv year-1. In cases where the 0.3 mSv doseconstraint cannot be met the operator must demonstratethat the doses resulting from the continued operation ofthe plant are as low as reasonably achievable and withinthe range of tolerable risk. In addition, a �siteconstraint� of 0.5 mSv year-1 should apply to current andfuture operations from a number of sources withcontiguous boundaries at a single location when the sitecannot be optimised as an integral whole. The use ofconstraints is suitable for predictive assessments whichdo not include the effects of past discharges, but forthose based on monitoring data, which may include theeffects of several sources and past operations, use of thedose limit is appropriate.
6.2 Methods and data
Calculations of exposures of members of the publicfrom waste disposal are based on the environmentalmonitoring data for 1995. These data provideinformation on two main pathways: (i) ingestion offoodstuffs; and (ii) external exposure from contaminated

18
materials in the aquatic environment. In both cases, theassessment sets out to estimate exposures from thesepathways for potential critical groups, that is the groupsof people who are likely to be most exposed. There arethree factors to consider in the assessment of theingestion pathway: (i) the concentrations ofradionuclides in foodstuffs; (ii) the amounts of foodeaten; and (iii) the dose coefficients relating an activityintake to a dose.
In nearly all cases, the activities in the media aredetermined by monitoring and are given later in thisreport. The Sellafield and Isle of Man related terrestrialassessments are supplemented by information frommodels (see Appendix 6). In all cases theconcentrations chosen for the assessment are intended tobe representative of the intakes of the most exposed inthe population. All of the concentrations where apositive result was determined are included irrespectiveof the origin of the radionuclide. In some cases thismeans that the calculated exposures includecontributions due to discharges from other sites as wellas from weapon test fallout and activity depositedfollowing the Chernobyl accident. For aquaticfoodstuffs, the mean concentrations from the areaswhere harvesting of seafood near the site in question isknown to take place are used. Positive determinationsare often found for aquatic samples. Therefore, where anuclide is �not detected�, it is assumed that itsconcentration is nil. For milk, the mean concentrationsat a farm close to site are taken. The farm is chosen byreference to the data on concentrations such that thehighest values of any farm are used in the assessment.This procedure accounts for the possibility that any farmclose to a site can act as the sole source of supply ofmilk to high rate consumers. For other foodstuffs, themaximum concentrations are selected for the assessmentto allow for the possibility of storage of food harvestedat a particular time when the peak levels in a year mayhave been present in the environment.
Whereas positive determinations are generally found foraquatic samples, this is not the case for terrestrialsamples. It is therefore more important to take accountof the possibility of activity being present when nopositive determination is found, albeit at a level belowthe limit of detection or minimum reporting level. Sucha possibility is taken into account by assuming that allradionuclides which are specified in the dischargeauthorisation, or have been detected in other samples atthe site and are reported as being �less than� a certainlevel, are indeed present at that level. This will ensurethat estimated exposures are unlikely to be understated.
The amounts of seafood consumed are determined by sitespecific habits surveys. Data are collected primarily bydirect interviews with potential high-rate consumers whoare often found in fishing communities. Techniques haveincluded the use of consumption logging sheets (Leonardet al., 1982; Leonard, 1984) and consumption rate data
have been interpreted using techniques based upon ICRPrecommendations (Hunt et al., 1982) to select appropriategroups of higher-rate consumers. Consideration ofchildren�s consumption rates has been included in thisselection process (Leonard and Hunt, 1985).
The amounts of other food consumed (e.g. milk) arederived from recent national surveys of diet and aregrouped for three age groups, adults, 10 year oldchildren and 1 year old infants (Byrom et al., 1995).For each food type, consumption rates at the 97.5thpercentile of consumers have been taken to representthese people who consume a particular foodstuff athigher than average levels. For foodstuffs where there isa marked variability in local availability, for examplehoney, or in personal preference, for example offal, dietsurveys undertaken among local populations can provideadditional data (Stewart et al., 1990). A programme ofsuch surveys is being undertaken by MAFF aroundnuclear sites. However, it has been found that when avariety of staple foodstuff consumption rates areexamined, the contribution of cows� milk in the infantdiet is generally the single most important pathway forradionuclide intake.
The foodstuff consumption rates are given in Appendix 3.
The assessment of exposures through consumption ofterrestrial foods is based on the assumptions: (i) that thefoodstuffs eaten by the most exposed group which aremost affected by site operations are those that aresampled for the purposes of environmental monitoring;and (ii) that the rates of consumption of such foodstuffsare sustained wholly by local sources. The two foodgroups resulting in the highest dose are taken to beconsumed at �critical group� consumption rates, whilethe remainder are consumed at average rates. Thechoice of two food groups at the higher consumptionrates is based on statistical analysis by MAFF ofnational diet surveys which showed that only a verysmall percentage of the population were critical rateconsumers in more than two food groups (Day & Rees,personal communication). Locally grown cereals are notconsidered in the assessment of exposures as it isconsidered highly unlikely that cereals will be made intolocally consumed (as opposed to nationally consumed)foodstuffs and consumed at the critical group rates.
Dose calculations for intakes of radionuclides are basedon committed effective doses per unit intake (dosecoefficients) taken from:
(i) ICRP Publication 67 (ICRP, 1994)(ii) ICRP Publication 69 (ICRP, 1995) and(iii) Phipps et al. (1991)
Where there is a choice of dose coefficients in thesource references, the most recent information is used.The dose coefficients used in this report are provided inAppendix 4 for ease of reference.

19
The dose assessments include consideration of childrenand the use of appropriate gut transfer factors. Wherethere is a choice of gut transfer factors for a radionuclidewe have generally chosen the one which results in thehighest predicted exposure. However, we have alsotaken into account specific research work of relevance tothe foods considered in this report. This affects theassessments for polonium, plutonium and americiumradionuclides.
The current ICRP advice for polonium is that a factor of0.5 is appropriate for dietary intakes by adults (ICRP,1994). A study involving the consumption of crab meatcontaining natural levels of polonium-210 has suggestedthat the factor could be as high as 0.8 (Hunt andAllington, 1993). Estimates of the exposures due topolonium intake have therefore been calculated using theconservative assumption that a factor of 0.8 applies to allseafood. We have retained a factor of 0.5 for other food.
Studies using adult human volunteers have suggested afactor of 0.0002 in connection with the consumption ofplutonium and americium in winkles from nearSellafield (Hunt et al., 1986, 1990). For these and otheractinides in food in general, the NRPB considers a guttransfer factor of 0.0005 to be a reasonable best estimate(NRPB, 1990). In this report, when estimating doses toconsumers of winkles from Cumbria, a gut transferfactor of 0.0002 is used for plutonium and americium.For other foods and for winkles outside Cumbria thefactor of 0.0005 is used for these radioelements.
In the assessment of external exposure there are twofactors to consider: (i) the dose rate from the source and(ii) the time spent near the source. In the case ofexternal exposure to penetrating gamma radiation,uniform whole body exposure has been assumed. Themeasured quantity is air kerma rate. When interpretingthis in terms of radiological effect, an air kerma rate of 1mGy h-1 has been taken as producing an effective doseequivalent rate of 0.87 mSv h-1 (Spiers et al., 1981).This factor does not change significantly for effectivedose under ICRP-60 (NRPB, 1993). For externalexposure of skin, the measured quantity is contaminationin Bq cm-2. In this case, dose rate factors in Sv year-1
per Bq cm-2 are used which are calculated for a depth intissue of 7 mg cm-2 (Kocher and Eckerman, 1987). Theexposure of gonads from beta radiation is assessed usingthe methods described by Hunt (1992). The times spentnear sources of external exposure are determined by sitespecific habits surveys in a similar manner toconsumption rates of seafood. The occupancy andhandling times are given in Appendix 3.
When assessing the man-made effect on externalexposures to gamma radiation and internal exposuresdue to ingestion of carbon-14 and radionuclides in theuranium and thorium decay series in seafood, estimatesof dose rates and concentrations, as appropriate, due tonatural background levels are subtracted. Background
carbon-14 concentrations in terrestrial foods are alsosubtracted. The estimates of background concentrationsare given in Appendix 5. On the basis of measurementsmade previously as part of the programmes reportedhere, the gamma dose rate backgrounds in the aquaticenvironment were taken to be 0.05 µGy h-1 for sandysubstrates, 0.07 µGy h-1 for mud and salt marsh and0.06 µGy h-1 for other substrates. These data arecompatible with those presented by McKay et al.(1995). However, where it is difficult to distinguish theresult of a dose rate measurement from naturalbackground, the method of calculating exposures basedon the concentrations of man-made radionuclides insediments (Hunt, 1984) has been used. Estimates ofexternal exposures from beta radiation include acomponent due to natural sources because of thedifficulty in distinguishing between natural and man-made contributions. Such estimates are thereforeconservative when compared with the relevant dose limitwhich excludes natural sources of radiation.
7. BRITISH NUCLEAR FUELSPLC (BNFL)
BNFL is concerned mainly with the design andproduction of fuel for nuclear reactors and itsreprocessing after irradiation. The company alsooperates a solid waste disposal site and nuclear powerplant supplying electricity to the national grid. Regularmonitoring is carried out of the environmentalconsequences of discharges of radioactive waste fromfour BNFL sites in England, namely Sellafield, Drigg,Springfields and Capenhurst.
7.1 Sellafield and Drigg, Cumbria
Operations and facilities at Sellafield include fuelelement storage and decommissioning, the Magnox andoxide fuel reprocessing plants and the Calder HallMagnox nuclear power station. Radioactive wastedischarges include a very minor contribution from theadjoining UKAEA Windscale facilities. The mostsignificant discharges are made from the BNFL fuelelement storage ponds and the reprocessing plants,through which pass irradiated Magnox and oxide fuelfrom the UK nuclear power programme, and some fuelfrom abroad. Small discharges are made from the Driggsite whose main function is to receive solid radioactivewastes from Sellafield and other UK sites and to disposeof them in engineered trenches on land.
7.1.1 The aquatic monitoringprogramme
Liquid radioactive wastes from both Sellafield andDrigg are discharged under separate authorisationseffectively to the same body of water on the Irish Seacoastline. The sites are therefore considered togetherfor the purpose of aquatic environmental monitoring.

20
Discharges from the Sellafield pipelines during 1995 aresummarised in Table 1. Discharges of tritium, carbon-14, cobalt-60 , technetium-99 and iodine-129 increasedin 1995 because of the continuing treatment of storedwastes and the operation of the Thermal OxideReprocessing Plant (THORP). However, the dischargesof radiocaesium were at the low levels typical of recentyears and discharges of plutonium and americiumreduced because of the operation of the EnhancedActinide Removal Plant (EARP).
Total alpha and beta discharges were 0.397 and 188TBq respectively (1994: 1.04 and 126 respectively).The increase in total beta discharges was mainly causedby beta emitters in releases of treated stored wastes. Alldischarges were within the limits set by HMIP andMAFF.
The main function of the Drigg site is to receive solidradioactive wastes from Sellafield and other UK sitesand to dispose of them in engineered trenches on land.The authorisation for disposals allows for the dischargeof leachate from the trenches through a 1 km marinepipeline. The limits for activity to be dischargedthrough the marine pipeline and for concentrations ofresidual activity in the Drigg Stream are given in Table 1.These discharges are small compared with thosedischarged from the Sellafield site. MAFF marinemonitoring of the Drigg site is subsumed within theSellafield programme which is described in theremainder of this sub-section. The contribution toexposures due to Drigg discharges is negligiblecompared with that due to Sellafield and any effects ofDrigg discharges could not be detected in 1995 abovethose due to Sellafield. Monitoring of the Drigg Streamis carried out by HMIP (HMIP, 1995).
Regular monitoring of the marine environment nearSellafield continued during 1995. Important radiationexposure pathways were consumption of fish andshellfish and external exposure to gamma rays and betaparticles from occupancy over sediments, with otherpathways being kept under review. In 1995, as inprevious recent years, there was no harvesting ofPorphyra in west Cumbria for manufacture oflaverbread, but monitoring continued because thepathway remains potentially important. A generalreview of radioactivity in the Irish Sea has beencompiled by Kershaw et al. (1992). In addition, Hunt(1995) has recently provided a reconstruction ofexposures due to Sellafield liquid discharges from thebeginning of operations in 1952 through to 1993.
7.1.1.1 The fish and shellfishconsumption pathway
7.1.1.1.1 Concentrations of radioactivity
Concentrations of beta/gamma activity in fish from thevicinity of the Irish Sea and from further afield are given
in Table 7. Data are listed by location of sampling orlanding point, in approximate order of increasingdistance from Sellafield. Samples taken near othernuclear establishments which reflect Sellafielddischarges are given later in this report. The �SellafieldCoastal Area� extends 15 km north and south ofSellafield from St Bees Head to Selker and 11 kmoffshore; most of the local fish and shellfish consumedby the local most exposed group is taken from this area.Specific surveys are carried out in the smaller �SellafieldOffshore Area� where experience has shown that goodcatch rates may be obtained. This area consists of arectangle, one nautical mile wide by two nautical mileslong, situated south of the pipelines with the long sideparallel to the shoreline; it averages about 5 km from thepipeline outlet.
The results generally reflect the progressive dilution ofradiocaesium with increasing distance from Sellafield,but the rate of decline of radiocaesium concentrationswith distance is not as marked as was the case someyears ago, because of the significant reductions indischarges since that time. Radiocaesium in fish fromthe Baltic is not due to Sellafield discharges but issubstantially from the Chernobyl accident.Concentrations of radiocaesium in fish known to havebeen caught in Icelandic waters remained typical ofthose from weapons-test fallout, at a value of about 0.3Bq kg-1 for caesium-137 in cod. Data for the BarentsSea are similar. In the Irish Sea, the ratios of caesium-137 to caesium-134 were generally higher than those inrecent discharges from Sellafield, even allowing forresidence time in the water and uptake into fish; thissuggests that a significant contribution from agedradiocaesium is present, due to remobilisation from thesediment of the Irish Sea (Hunt and Kershaw, 1990).
Concentrations of caesium-137 in rainbow trout from asmall lake near Sellafield are included this year. Theabsence of any detected caesium-134 in the samplesuggests that fallout from Chernobyl, which is detectedin other freshwater fish in Cumbria, is unlikely to be thesource of activity. The other possible sources areSellafield itself and fallout from atmospheric weapontests carried out by nuclear powers between 1945 and1980.
There were small increases in concentrations of cobalt-60 and technetium-99 in fish from the eastern Irish Seain 1995 reflecting changes in discharges from the site.However, the trend of reducing concentrations ofradiocaesium in fish continued.
For shellfish, a wide range of radionuclides contribute toradiation exposure of consumers owing to generallygreater uptake in these organisms than in fish. Table 8lists concentrations of beta/gamma-emitting nuclides(except plutonium-241) and total beta activity inshellfish from the Irish Sea and further afield. Molluscs

21
are of particular radiological importance to the mostexposed group near to Sellafield, as described later inthis section. In addition to sampling by MAFF, suppliesof winkles, mussels and limpets were obtained fromconsumers who collected them in the Sellafield CoastalArea exploited by this most exposed group near toSellafield.
Concentrations of artificial radionuclides in shellfish, aswith fish, diminish with increasing distance fromSellafield. There are substantial variations betweenspecies: for example, lobsters tend to concentrate moretechnetium-99 when compared to crabs. In addition,molluscs tend to concentrate the less mobile nuclides toa greater extent than crustaceans, which in turn tend toconcentrate them more than fish. The reverse behaviourhas also been true for mobile nuclides in the past.However, since the importance of caesium-137associated with sediment has increased relative tocurrent discharges, concentrations of this nuclide inmolluscs have tended to be higher than or similar tothose for crustaceans. There were both increases anddecreases of concentrations of beta/gamma-emittingradionuclides in shellfish in 1995. Increases occurredfor carbon-14, cobalt-60 and technetium-99 anddecreases for zirconium-95 and niobium-95. Thesechanges reflect changes in discharges of theseradionuclides but the magnitude of the change indischarge was not necessarily matched by an equivalentchange in concentration. For example, the technetium-99 concentrations in some shellfish from west Cumbriahave increased by more than a factor of 3 whereas thedischarges have increased by a factor of 3. Suchdifferences are caused by several factors including thetiming of sampling and the rate at which biota respondto their environment reflecting the increases which tookplace in 1994.
Analyses for transuranics are labour-intensive; as inprevious years, a selection of samples of fish and shellfishchosen mainly on the basis of potential radiologicalsignificance was analysed for transuranic nuclides. Thedata for 1995 are presented in Table 9. Transuranics areless mobile than radiocaesium in sea water; this isreflected in higher concentrations of transuranics inshellfish as compared to fish, and a rapid reduction withdistance from Sellafield in concentrations of transuranics,particularly in shellfish. Over the past decade dischargesof transuranic nuclides from Sellafield have reducedsignificantly, resulting in overall decreases inconcentrations of these nuclides in fish and shellfish.However, the non-mobile nature of these nuclides causesa delayed effect in the environment (Hunt, 1985) such thata contribution to present concentrations is provided bydischarges in earlier years. In 1995, concentrations oftransuranic nuclides in fish and shellfish were generallysimilar when compared with 1994.
Concentrations of natural radionuclides in fish andshellfish in the Sellafield area are presented in Section 13.
7.1.1.1.2 Individual dose
Table 10 summarises doses in 1995 from artificialradionuclides in seafood. The committed effective doseto the local most exposed group of seafood consumerswas 0.12 mSv. The increase in dose from 0.08 mSvreported for 1994 (Camplin, 1995) is largely due to theincrease in consumption of molluscs by the mostexposed group and the increased concentrations oftechnetium-99, particularly in crustaceans.
Data for natural radionuclides in fish and shellfish arediscussed in Section 13; however, the effects on theSellafield most exposed group of controlled dischargesof natural radionuclides from another west Cumbriansource, Albright and Wilson Ltd, Whitehaven, areconsidered here to enable the total dose to be comparedto the limit. The exposure of the local group of seafoodconsumers due to the enhancement of concentrations ofnatural radionuclides in the Sellafield area in 1995 was0.22 mSv using a gut uptake factor for polonium of 0.8.Most of this was due to the polonium-210 and lead-210content of shellfish. This gives a total dose to this groupof 0.34 mSv. These doses may be compared with anaverage dose rate of approximately 2.2 mSv year-1 tomembers of the UK public from all natural sources ofradiation (Hughes and O�Riordan, 1993) and are wellwithin the limit of 1 mSv.
Exposures of groups representative of the wider fishingcommunities associated with fisheries in Whitehaven,Dumfries and Galloway, Fleetwood and the MorecambeBay area have been kept under review (Table 10). Thedoses received by these groups are significantly lessthan that for the local Sellafield group because of thelower concentrations observed further afield. The dosesat Whitehaven, Dumfries and Galloway and MorecambeBay were similar in 1995 to those in 1994 (0.03, 0.06and 0.08 mSv respectively) (Camplin, 1995). Dosesreceived by the Fleetwood group reduced to 0.031 mSv(1994: 0.05 mSv) because of changes to theconsumption rates in the group as established by a recenthabits survey. All doses were well within the dose limitfor members of the public of 1 mSv.
The committed effective dose equivalent from artificialradionuclides, appropriate to a consumption rate of 15kg year-1 of fish from landings at Whitehaven andFleetwood, is also given in Table 10. This consumptionrate represents an average for typical fish-eatingmembers of the public. The dose in 1995 was <0.002mSv, the same as that for 1994 (Camplin, 1995).
The exposure of consumers of trout from a local fishfarm were also considered in 1995. Their exposure,based on consumption rate data obtained by interview,was 0.046 mSv or 5% of the dose limit of 1 mSv. Thisincludes a contribution due to fallout.

22
7.1.1.1.3 Collective dose
Collective doses, received during 1995 fromconsumption of fish and shellfish, have been estimatedfor the UK and other European countries. In general,the method used has been to combine data on actual fishand shellfish landings from relevant sea areas withaverage radioactivity concentrations in fish and shellfishcaught in these areas. This method differs from thatbased on modelling of water movements and a (usually)fixed catch rate for different sea areas; the modellingmethod generally derives the collective dose to bereceived over a number of years as a result of dischargesduring the year under review, and the results are notreadily comparable with those based on the presentmethod. Sea areas considered in this assessment includethe Irish Sea, Scottish waters, the North Sea, the EnglishChannel, Baltic Sea, Norwegian Sea, Spitzbergen/BearIsland area and the Barents Sea. Corrections have beenmade for the fraction of fish or shellfish consumed. Thecontribution of weapons-test fallout to the radioactivityconcentrations has been subtracted. Consideration hasbeen given to the pathway due to fish offal and industrialfisheries, the product of both of which is fish meal whichis fed to pigs, poultry, ruminants and farm-reared fish.Consumption of food products from these animals givesrise to a small contribution to the collective dose, andthis has been included.
Liquid radioactive waste discharges from Sellafield arethe main source of collective dose; by comparison, theeffect of liquid discharges from other establishments isvery small. The small contribution due to fallout fromthe Chernobyl reactor accident to the Irish Sea, Scottishwaters and the North Sea has been included. Most ofthe collective dose is due to radiocaesium in edible fish;however, approximately one quarter of the total dose isdue to plutonium and americium radionuclides inshellfish. Strontium-90 also makes a small contributionto the collective dose, about 5% of the total. The resultsfor 1995, of 3 man-Sv for the UK and 20 man-Sv forother European countries are similar to those reportedfor 1994.
The collective dose to the UK population due to theeffects of liquid discharges may be compared to thatfrom other sources. In Hughes and O�Riordan, 1993 thecollective dose to the UK population from all sources ofnatural background radiation is given as 127,000 man-Sv and that from all source of artificial radiation as23,000 man-Sv. Therefore the UK collective dosedelivered in 1995 through the seafoods pathway as aresult of liquid radioactive waste discharges was lessthan 0.01 % of the total from all sources of radiation.
7.1.1.2 External exposure
A further important pathway leading to radiationexposure as a result of Sellafield discharges derivesfrom uptake of gamma-emitting radionuclides by
intertidal sediments in areas frequented by the public. Ingeneral, it is the fine-grained muds and silts prevalent inestuaries and harbours, rather than the coarser-grainedsands to be found on open beaches, which adsorb theradioactivity more readily. Gamma dose rates currentlyobserved in intertidal areas are mainly due toradiocaesium and natural radionuclides.
A range of coastal locations are regularly monitored,both in the Sellafield vicinity and further afield, usingportable gamma-radiation dosemeters. Table 11 lists thelocations monitored together with the dose rates in air at1 m above ground. Monitoring in Scotland is carriedout on behalf of the Scottish Office. Dose rates on IrishSea shorelines, near other nuclear establishments whichreflect Sellafield discharges, are given later in thisreport. Variations in sediment type from place to placeaccount for the quite marked fluctuations in dose rate,superimposed on a general decrease with increasingdistance from Sellafield. Dose rates over intertidal areasthroughout the Irish Sea in 1995 showed smallreductions as compared with data for the same locationsin 1994 (Camplin, 1995). Data for the River Caldercontinued to show an excess above natural backgroundand it is likely that the main cause is direct radiationfrom Calder Hall. However, there may also be acontribution due to radionuclides in small patches ofsediments in the river. The occupancy by members ofthe public, for example anglers, of this section of theriver is low. It is unlikely that more than a few tens ofhours per year is spent near the sediment patches and, onthis basis, the resulting exposures were much less thanthose of intertidal areas discussed subsequently in thissub-section.
Radioactivity concentrations in surface sediments arealso regularly monitored, both because of relevance todose rates and in order to keep under reviewdistributions of adsorbed radioactivity. Concentrationsof beta/gamma radioactivity and transuranics, in mostcases at the same locations as the dose rate measurements,are given in Table 12. Variations due to similar causesto those of the variation in dose rates are observed, andcomparison with results for 1994 (Camplin, 1995)shows small general reductions of radioactivity. Datafor small patches of sediment in the River Calder arealso included in Table 12. Cobalt-60 is present in thesesamples and this may be due to deposition of authoriseddischarges to air from Calder Hall.
In western Cumbria the maximum exposure in 1995 was0.13 mSv for anglers who dig for bait near to Sellafieldand who fish in the Cumbrian Coastal Area. Their dose,which was similar to that for 1994 (0.11 mSv) includesan assessment of the contribution to effective dose frombeta emitting radionuclides in sediments and due toconsumption of locally caught fish. Dose rates on, andoccupancy of, fishing vessels in Whitehaven harbourreduced in 1995 so that the dose received by fishermenreduced from 0.10 mSv in 1994 (Camplin, 1995) to

23
0.060 mSv in 1995. Both estimates include a smallcontribution due to consumption of seafood. In thewider area, including Cumbria, Lancashire and the northSolway coast it is considered that houseboat dwellers inthe Ribble estuary are representative of those whoreceive the highest external exposures from the effectsof discharges from Sellafield. Making an allowance fornatural background using a dose rate of 0.07 µGy h-1
their external exposure in 1995 was 0.091 mSv, which isless than the value for 1994 of 0.14 mSv calculated onthe same basis. The reduction was due to a decrease inoccupancies and gamma dose rates on the boat. Most ofthe external exposure of the houseboat dwellers was dueto the radioactivity already in the environment as a resultof past discharges from Sellafield.
It is to be noted that inhalation of resuspended beachsediments and inadvertent ingestion of the same materialgive rise to only minor radiation exposures to the publiccompared with the external radiation pathwayconsidered in this sub-section (Wilkins et al., 1994). Inareas of salt marsh and sea-washed pastures such as theRavenglass estuary exposures from pathways other thanthose due to external radiation need consideration, andthis is currently being given from the point of view ofregular monitoring needs. Meanwhile, doses includingexternal radiation in such areas were cautiously assessedfor 1989 to be well within the dose limit of 1 mSv(Wilkins et al., 1994). This would also have been thecase in 1995 because relevant concentrations of activityand dose rates in such areas have reduced since 1989.Monitoring in the Ravenglass estuary is consideredfurther in sub-section 7.1.2.
7.1.1.3 Fishing gear
During immersion in sea water, fishing gear may entrainparticles of sediment on which radioactivity is adsorbed.Fishermen handling this gear may be exposed to externalradiation, mainly to skin from beta particles. Fishinggear is regularly monitored using portable betadosimeters. Results for 1995 are presented in Table 13.Measured dose rates were generally less than those for1994 (Camplin, 1995). Habits surveys keep underreview the amounts of time spent by fishermen handlingtheir gear; for those most exposed, a time handling netsand pots of 2500 h year-1 was appropriate for 1995. Theexposure from handling of fishing gear in 1995,including a component due to natural radiation, was 0.30mSv, which is less than 1% of the dose limit appropriatefor exposures to skin of members of the public.Handling of fishing gear therefore continues to be aminor radiation exposure pathway.
7.1.1.4 Contact dose-rate monitoring ofintertidal areas
Contact beta and gamma dose rates in intertidal areasare regularly monitored using purpose built large areadetectors to locate and remove any material with unusual
levels of contamination. A single item was found inJune 1995 with a contact dose rate of less than0.1 mGy h-1. A routine programme of measurements ofbeta dose rates on contact with shoreline sediments wasbegun in 1994 in order to establish the contribution toeffective dose made by exposures of people, such as baitdiggers, who handle sediments regularly, and to estimatetheir skin exposures for comparison with the non-stochastic dose limit of 50 mSv. The results of themeasurements made using portable beta dosimeters arepresented in Table 15.
The skin exposure of anglers who dig bait, based on atime handling sediment of 600 h year-1, was 0.84 mSv in1995 which is 2% of the appropriate dose limit. Thecontribution this source of exposure makes to effectivedose is included in the assessment in sub-section 7.1.1.2.
7.1.1.5 Other surveys
In addition to the monitoring described above, which isrelated to the most (or potentially most) significantradiation exposure pathways as a consequence ofSellafield discharges, a number of further investigationsare undertaken. Some of these are of a research nature;however, they also enable pathways of lower currentimportance to be kept under review.
Seaweeds are useful indicator materials; they mayconcentrate certain radionuclides, so they greatlyfacilitate measurement and assist in the tracing of theseradionuclides in the environment. Table 14 presents theresults of measurements in 1995 on marine plants fromshorelines of the Irish Sea and further afield. Althoughsmall quantities of samphire and Rhodymenia may beeaten, concentrations of radioactivity were of negligibleradiological significance. Fucus seaweeds are usefulindicators, particularly of fission product radionuclidesother than ruthenium-106; samples of Fucusvesiculosus were collected both in the Sellafield vicinityand further afield, and the results are presented here.These clearly showed the effects of increases indischarges of technetium-99 from Sellafield in 1995.Such seaweeds are occasionally used as fertilisers andsoil conditioners. However, the exposures fromconsumption of crops grown on land to which seaweedhas been applied would have been very low. Monitoringof concentrations of radionuclides in seaweeds inScotland is carried out on behalf of the Scottish Office.Analyses of similar samples collected in NorthernIreland are carried out on behalf of the DOE(NI).
No harvesting of Porphyra in west Cumbria, forconsumption after being made into laverbread, wasreported in 1995; this pathway has therefore remainedessentially dormant. However, monitoring hascontinued in view of its potential importance, historicalsignificance and the value of Porphyra as an indicatormaterial. Samples of Porphyra are regularly collected

24
from selected locations along UK shorelines of the IrishSea. Results of analyses for 1995 are presented in Table14. Samples of laverbread from the majormanufacturers are regularly collected from markets inSouth Wales and analysed. Results for 1995 are alsopresented in Table 14. The exposure of criticallaverbread consumers in South Wales was much lessthan 0.005 mSv, confirming the virtual abeyance of thisexposure pathway.
7.1.2 The terrestrial monitoringprogramme
Because of the proximity of the sites, environmentalmonitoring at Sellafield and Drigg are consideredtogether in this sub-section. In addition, the programmearound the Ravenglass estuary approximately 10 kmsouth of the Sellafield is included. The purpose of thatprogramme is to investigate contamination of sea-washed land resulting from disposals of liquid wastefrom Sellafield.
7.1.2.1 Sellafield
Discharges of gaseous wastes from Sellafield aresummarised in Table 2. They were generally similar tothose in 1994, however, the operation of the THORPplant increased discharges of krypton-85 from 38 PBq in1994 to 97 PBq in 1995. This radionuclide ischemically inert and therefore has no effect on theexposures due to consumption of terrestrial foods.Atmospheric discharges of carbon-14 were reduced, ascompared with 1994, due to diversion of this nuclide tothe liquid discharge pathway.
The sampling programme for terrestrial foods in thevicinity of Sellafield was the most extensive of those forthe nuclear sites in England and Wales in order to reflectthe scale of the operations on the site. A wide range offoodstuffs were sampled including milk, fruit,vegetables, eggs, meat and offal, mushrooms, game,honey, cereals and indicator materials such as grass andsoil. Samples were obtained from different locationsaround the site in order to encompass the possiblevariations in activity levels due to the influence of winddirection on the dispersal of gaseous discharges. Theanalyses undertaken included gamma spectrometry andspecific measurements for tritium, carbon-14, sulphur-35, strontium-90, technetium-99, iodine-129,radiocaesium, polonium-210, uranium and transuranics.The polonium-210 analyses were carried out to give anindication of any historic contamination from pastdischarges and also to confirm that there is nocontinuing source of this nuclide at Sellafield.
The results of monitoring in 1995 are presented in Table16. The concentrations of all radionuclides were lowand there was no indication of widespread contaminationfrom the site. However, small enhancements of someradionuclides were found close to the site.
The ratio of the mean concentration in milk collectedfrom near and far farms was close to 1 for allradionuclides except sulphur-35 when it was 2. Strongerevidence was found for a site related effect byexamination of the maximum concentrations at singlefarms. In this case, ratios greater than 1 were also foundfor carbon-14 (2), strontium-90 (2) and caesium (2). Aswill be shown later, taken together it is thoseradionuclides in milk which make the greatestcontribution to exposures of consumers of localproduced food. Concentrations in milk were similar tothose in 1994 (MAFF, 1995) with the exception of thosefor sulphur-35 where small increases were observed.This increase is probably a consequence of theenhanced levels of sulphur-35 discharged from theCalder Hall reactors during May 1995.
Enhanced discharges of iodine-129 took place duringAugust 1995. No impact on the food chain or theenvironment could be detected as a consequence of thisincrease, although the highest levels of iodine-129 in cropsdetected was in runner beans harvested about this time.
Samples of apples, blackberries and elderberries wereanalysed in 1995. All three fruits were good indicatorsof the local effects of discharges from Sellafield.Plutonium concentrations, whilst much lower than thosefound in seafood, gave isotopic ratios ((239+240)/238)significantly less than 10. With a ratio of about 40expected for background fallout, these data demonstratea local source. Concentrations of carbon-14 in fruitsamples was also in excess of the concentrationsassumed as representative of background values(Appendix 5). Concentrations of other radionuclides,for example tritium, sulphur-35 and cobalt-60 andstrontium-90 also provided evidence of a local effect.Where it was possible to compare data for fruit in 1995with those for 1994, similar or increased concentrationsof activity were found. However, in view of the limitednumber of samples obtained, no conclusion can bedrawn as to whether there is a significant trend in levelsof any particular radionuclide.
Levels of activity in bovine and ovine meat and offalcontinued to be analysed in 1995. Concentrations ofradionuclides were low, with limited evidence for theeffects of Sellafield discharges in data for tritium,carbon-14, sulphur-35 and the plutonium isotopic ratio.
Both barley and oats were sampled as beingrepresentative of cereals in 1995. Sulphur-35 wasdetected in both samples, indeed cereals contained thehighest levels of this radionuclide when compared withother food groups. In common with meat and offalsamples limited evidence for the effects of Sellafielddischarges was also found in data for tritium, carbon-14,sulphur-35 and the plutonium isotopic ratio. Thevegetables sampled in 1995 were cabbage, carrots,lettuce, peas, potatoes, runner beans, spinach andturnips. Concentrations of transuranic radionuclides invegetables were very low and did not provide as distinct

25
a Sellafield signal in the plutonium isotopic ratio assome other food groups. Evidence of the effects ofSellafield was also weak for other radionuclides invegetables with two possible exceptions. Carrots andrunner beans contained some of the highestconcentrations of strontium-90 (5.6 Bq kg-1) and iodine-129 (0.14 Bq kg-1) in all of the terrestrial foods sampled.
Finally, the most distinctive features of the data for eggs,game, mushrooms and honey were:
• Eggs contained the highest iodine-129concentration in all terrestrial foods from Sellafield(0.20 Bq kg-1)
• Eggs contained the second highest tritiumconcentration in terrestrial foods from Sellafield(34 Bq kg-1)
• Hare and rabbit contained relatively high levels ofcaesium (~5 Bq kg-1)
The dose received by the most exposed group ofterrestrial food consumers was calculated using themethods and data presented in Section 6. The results arepresented in Table 17. Calculations were performed forthree age groups (adults, 10y and 1y) and the dosesreceived by the 1 year old age group were found to bethe highest, at <0.081 mSv (Adult: <0.042; 10y:<0.047). The most significant contributions to this dosewere from sulphur-35, strontium-90 and carbon-14. Themost important foodstuff is milk which accounts for70% of the dose. The exposure is an upper estimate ofthe effects of Sellafield discharges because: (i) it isbased on the assumption that a radionuclide which is notdetected in a sample is present at a concentrationequivalent to the limit of detection; (ii) the effects of thebackground of artificial nuclides in the area from falloutare included; and (iii) it is assumed that most foodconsumed is locally produced.
The exposure of the group increased in 1995 (1994:<0.051 mSv) because of two main factors. Firstly, anincrease in the dose coefficient for strontium-90 used inthe calculations was required by the need to account forthe ingrowth of its daughter product, yttrium-90 in theperiod between the strontium-90 being incorporated inthe foodstuff and consumption. It is recognised that incase of milk that the period between incorporation of thestrontium-90 in the milk and consumption is short andequilibrium may not have been reached. However,consumption data for milk includes milk products suchas cheese and butter in which equilibrium will bereached. thus this conservative assumption is justified .Secondly, the maximum observed concentration ofsulphur-35 in milk increased from 3 to 9 Bq kg-1.Despite this, the exposure of the most exposed groupwas less than 10% of the dose limit of 1 mSv.
The dose received by an average consumer obtainingfood from the vicinity of Sellafield, <0.023 mSv, wasmuch less than this.
7.1.2.2 Ravenglass
The main interest in monitoring of terrestrial foodstuffsin the Ravenglass area is in determining whether there isa significant transfer of radionuclides from sea to land.In order to establish this samples of milk, crops, fruitand livestock are collected and analysed forradionuclides which are released in liquid effluentdischarges from Sellafield. In addition analyses forsulphur-35 are also undertaken for comparison withresults for the immediate area around Sellafield.
The results of measurements in 1995 are presented inTable 18. Modelling was also carried out to supplementthe monitoring data. Details of this monitoring are givenin Appendix 6. In general, the data are similar to thosefor 1994 (MAFF, 1995) and show lower concentrationsthan are found in the Sellafield vicinity. Evidence forsea to land transfer is limited. The clearest indication isgiven by the results for mushrooms. Concentrations ofplutonium in mushrooms demonstrate an isotopic ratiowhich is more characteristic of liquid effluent dischargesthan fallout; in addition values for plutonium-239+240and americium-241 at about 1 Bq kg-1 (wet weight) aremore than an order of magnitude higher than those nearSellafield. The exposure due to consumption of theRavenglass mushrooms was <0.008 mSv. Theradiological significance of this observation is thereforesmall.
No evidence for the transfer of technetium-99 toterrestrial foodstuffs was found. All results were belowthe limits of detection. However, concentrations ofcaesium in ovine samples were about a factor of twohigher than in samples from Sellafield. This may be dueto sea to land transfer but it could equally be due to thenatural variability in levels of Chernobyl or weapon testfallout in west Cumbria. The only other strongindication of the effects of Sellafield is found in barleywhere a low concentration of sulphur-35 was detected.This would have been due to gaseous discharges fromthe site.
The exposure due to consumption of terrestrial foodsfrom Ravenglass in 1995 is given in Table 17. The 1year old age group received the highest exposures.Their exposure, including contributions from Chernobylor weapon test fallout, was less than 0.037 mSv or 4% ofthe dose limit of 1 mSv. This is about half the value forthe same age group near Sellafield. From this evidence,sea to land transfer in this area is not having a majoreffect on the terrestrial food chain.
7.1.2.3 Drigg
No gaseous discharges are authorised from Drigg. Themonitoring programme is therefore primarily directed atthe potential migration of radionuclides from the wasteburial site via ground water. The results are given inTable 19.

26
Low concentrations of tritium which may have leachedfrom the site were found in blackberries andmushrooms, however they were of negligibleradiological significance. Other than this there was noevidence to suggest migration of activity from the sitewas taking place. In general concentrations of otherradionuclides detected were lower than those found nearSellafield. The radiation exposure of the most exposedgroup, including a component due to Chernobyl orweapon test fallout was less than 0.035 mSv or 4% ofthe dose limit of 1 mSv.
7.2 Springfields, Lancashire
This establishment is mainly concerned with themanufacture of fuel elements for nuclear reactors andthe production of uranium hexafluoride. Radioactiveliquid waste arisings consist mainly of thorium anduranium and their decay products; liquid discharges aremade by pipeline to the Ribble estuary. Discharges ofbeta radionuclides, which result in the greaterradiological impact, were similar in 1995 (112 TBq) ascompared with 1994 (114 TBq) and remained wellwithin authorised limits. Discharges of gaseouseffluents remained very low at a similar level to thosefor 1994. The authorisation was changed in 1995 tospecify a limit for uranium activity.
Public radiation exposure in this vicinity, as a result ofsite discharges, is relatively low; there is, however, agreater contribution in the estuary due to Sellafielddischarges. The most important marine pathway isexternal exposure, due to adsorption of radioactivity onthe muddy areas of river banks and in salt marshes. Themost exposed group consists of people who live on ahouseboat moored in a muddy creek of the Ribbleestuary. Other activities which have significantoccupancies are wildfowling which takes place inintertidal areas and marshes bordering the estuary andangling which is popular in the Preston area (Hunt,1992). A survey of recreational pathways was carriedout by Mudge et al. (1994). Gamma and beta dose ratesare regularly monitored in relevant areas includingmuddy creeks where houseboats are moored, and someof these measurements are supported by analyses ofsediments. In 1995, locally-obtained fish and shellfishcontinued to be sampled though consumption of seafoodfrom the estuary is considered to be low. A study (Rolloet al., 1994) has shown that exposures due to airborneradionuclides which may have come from discharges tothe estuary are negligible.
Monitoring of terrestrial foods included sampling ofmilk, fruit, vegetables and duck. Indicator materialsincluding dry cloths, grass, soil and animals faeces werealso sampled.
Results for 1995 are shown in Tables 20(a) and (b).Radionuclides detected which were partly or wholly due
to Springfields discharges were isotopes of thorium,uranium and their decay products. Natural sources alsocontributed to these activities. Other radionuclidespresent were mainly from Sellafield.
Gamma dose rates over intertidal areas in 1995 weresimilar to or less than those in 1994. The results of betadose rate measurements are variable with increases anddecreases observed in different parts of the estuary. In1995 the exposure of the most exposed group ofhouseboat dwellers including the Sellafield componentwas 0.091 mSv, a decrease from the value for 1994(0.14 mSv) because of a reduction in occupancies anddose rates on the boat. Most of this exposure was due tothe radioactivity already in the environment as a resultof past discharges from Sellafield. The whole-bodyexposure of anglers and wildfowlers were assessed asbeing 0.042 and 0.029 mSv respectively in 1995. Asignificant proportion of the dose is due to Springfieldsdischarges.
The most exposed group for skin irradiation was anglerswith skin exposures, including a component due tonatural radiation, of 2.6 mSv in 1995. This is 5% of therelevant dose limit for members of the public.
The most exposed group of terrestrial food consumerswere adults consuming vegetables and potatoes at highrates. Their dose in 1995, including a contribution dueto fallout and natural sources, was <0.006 mSv, a majorpart of which was due to thorium radionuclides.
7.3 Capenhurst, Cheshire
The main functions undertaken on the Capenhurst siteare enrichment of uranium and dismantling of redundantplant. The enrichment facility is operated by URENCOCapenhurst Ltd. Radioactive waste arisings, mainly ofuranium and its daughter products, and technetium-99and neptunium-237 from recycled fuel, are minor; in1995 BNFL had authorisations to dispose of smallamounts of radioactivity in gaseous wastes via stacksand in liquid wastes to the Rivacre Brook and to theNorth Wirral sewage outfall at Meols. The authorisationfor the latter pathway was revoked in late 1995. Anenvironmental monitoring programme is carried out relatedto the pathways which could be of radiological significancedue to all disposal routes. Plants, animal faeces, soil anddry cloths are also sampled as indicator materials.
Results for 1995 are presented in Table 21.Concentrations of radionuclides in materials from theland and from the Rivacre Brook were similar to thosefor 1994. The hypothetical most exposed group forliquid discharges from the site is considered to be peoplewho may inadvertently ingest water and sediment fromthe Brook. Taking pessimistic assumptions about theiringestion rates, the exposure of the group was very low,at less than 0.005 mSv in 1995. The concentrations ofartificial radioactivity in marine samples are consistent

27
with values expected at this distance from Sellafield.The exposure of the most exposed group of terrestrialfood consumers was also very low, at less than 0.005mSv in 1995.
8. UNITED KINGDOMATOMIC ENERGYAUTHORITY
The United Kingdom Atomic Energy Authority(UKAEA) operates in England at Harwell, Winfrith andWindscale, adjacent to the BNFL Sellafield site. Allthree sites have reactors that are currently beingdecommissioned. Discharges of radioactive waste arerelated to decommissioning and decontaminationoperations and the nuclear related research that isundertaken at all sites. Discharges from the Windscalesite are negligible compared to Sellafield. Regularmonitoring of the environment in relation to Harwell andWinfrith is undertaken and discharges from Windscaleare monitored by the Sellafield programme.
8.1 Harwell, Oxfordshire
Discharges of radioactive wastes from Harwellcontinued in 1995 with liquid discharges made underauthorisation to the River Thames at Sutton Courtenayand to the Lydebank Brook north of the site whilegaseous discharges were made to the atmosphere.Discharges of alpha and beta particulates to theatmosphere were reduced, as compared to previousyears, due to the installation of new extract plants on theDIDO and Pluto reactors. The monitoring programmecomprised of sampling of milk, other terrestrialfoodstuffs, freshwater fish and indicator materialstogether with measurements of gamma dose rates aroundthe liquid discharge points.
The results of measurements of radioactivityconcentrations and dose rates are shown in Tables 22(a)and (b). Tritium was detected in apples, elderberriesand rhubarb collected near the site at low levels similarto those observed in local foodstuffs in previous years.The exposure of the most exposed group of terrestrialfood consumers was estimated to be less than 0.005 mSvor 0.5% of the dose limit of 1 mSv.
Some nuclides, notably cobalt-60 and caesium-137,were enhanced close to the outfall for liquid wastes, butthe levels were very small in terms of any radiologicaleffect. Those found in Lydebank Brook were lower still.
Habits surveys have identified anglers as the mostexposed group affected by direct discharges into the
river. Their occupancy of the river bank has beenassessed to estimate their external exposures.Consumption of freshwater fish was not found, but it isconsidered prudent to include a component in theassessment of the angler�s exposure equivalent to ahypothetical consumption of fish at a rate of 1 kg year-1.On this basis, and excluding a background dose rate of0.06 µGy h-1, the radiation dose to anglers in 1995 was0.017 mSv, or less than 2% of the dose limit of 1 mSv.
8.2 Winfrith, Dorset
Discharges of radioactive wastes from this sitecontinued in 1995 at the low rates typical of recent yearsfollowing the shutdown of the Steam Generating HeavyWater Reactor (SGHWR) in September 1990. Liquidwastes are disposed of under authorisation to deep waterin Weymouth Bay. The monitoring programmecomprised sampling of milk, crops, fruit, seafood andindicator materials and measurements of gamma doserates on the foreshore. Data are presented in Tables23(a) and (b).
Increased levels of ventilation in the Gaseous Tritium LightDevice facility resulted in increased levels of tritiumdischarge until the operations in the facility were ceased.
Results for terrestrial samples gave no indication of aneffect due to gaseous discharges. Levels of carbon-14detected were typical of the background concentrationsto be expected. The most exposed group for gaseousdischarges comprised the 1 year old age group who wereestimated to receive an exposure of less than 0.005 mSvor 0.5% of the dose limit of 1 mSv. Concentrations ofradionuclides in the marine environment continued theirdecline in 1995 as compared with previous years; thiswas due to the lower level of discharges from the sitesince the closure of the SGHWR. The radiation dose tothe most exposed group of fish and shellfish consumersremained low in 1995 at less than 0.005 mSv or 0.5% ofthe dose limit.
9. NUCLEAR POWERSTATIONS OPERATED BYNUCLEAR ELECTRICPLC d
In 1995 Nuclear Electric were authorised to dispose ofwastes from 11 establishments in England and Wales.All were operational power stations with the exceptionof Berkeley and Trawsfynydd power stations which wereundergoing decommissioning, and Berkeley TechnologyCentre which provided research facilities for theCompany.
d On 31 March 1996 the Nuclear Power stations operated by Nuclear Electric PLC were transferred to two new companies,Nuclear Electric Ltd and Magnox Electric PLC. During the period covered by this report these stations were operated byNuclear Electric PLC and this company is referred to throughout the report.

28
9.1 Berkeley, Gloucestershire andOldbury, Avon
Berkeley Power Station ceased electricity generation inMarch 1989, but small amounts of radioactive wastesstill needed to be disposed of as part ofdecommissioning operations. In addition there is acomponent of the discharge from the adjoining BerkeleyTechnology Centre. The Oldbury Power Station hascontinued operation and because the effects of both sitesare on the same area, Berkeley and Oldbury areconsidered together for the purposes of environmentalmonitoring. Liquid radioactive wastes are discharged tothe Severn estuary.
Habits surveys have established that the two criticalpathways for public radiation exposure in the aquaticenvironment are internal radiation followingconsumption of locally-caught fish and shellfish, andexternal exposure from occupancy of muddy intertidalareas. Therefore, samples of fish and shellfish areanalysed and gamma dose rates are monitored. Inaddition, measurements of external exposure aresupported by analyses of intertidal mud, and Fucusvesiculosus is collected as an indicator material. Thefocus for terrestrial sampling remained on the tritium,carbon-14 and sulphur-35 content of milk, crops andfruit, supported by analysis of dry cloths.
Data for 1995 are presented in Tables 24(a) and (b).Gamma dose rates and concentrations in the aquaticenvironment were similar to those in recent years. Mostof the artificial radioactivity detected was due to carbon-14 and radiocaesium. Concentrations of radiocaesiumrepresent the combined effect of discharges from thesites, other nuclear establishments discharging into theBristol Channel, fallout, and possibly a small Sellafield-derived component. Most of the carbon-14 is due todischarges from Cardiff. Very small concentrations ofother radionuclides were detected but taken together,were of low radiological significance. The totalexposure of the most exposed group of fish and shellfishconsumers including external radiation was low, at 0.010mSv or 1% of the dose limit of 1 mSv.
An unplanned reactor blowdown at Oldbury in the lastquarter of the year led to the Quarterly NotificationLevel for argon-41 being exceeded. This nuclide ischemically inert and therefore does not have an impacton the foodchain. Disconnection of the thermal shieldair cooling stacks as part of the decommissioning atBerkeley has led to a reduction in the discharges to theatmosphere. Tritium and sulphur-35 were not detected inany of the terrestrial food samples monitored. Carbon-14 was detected in local milk and crops at levelsgenerally consistent with background values, thoughdata for blackberries and runner beans suggest that theremay be a small enhancement above background forthese food groups. Nevertheless, the most exposedgroup dose continued to be low and was estimated to beless than 0.005 mSv or 0.5% of the dose limit.
9.2 Bradwell, Essex
This power station, powered by Magnox reactors, isauthorised to discharge gaseous wastes to the localenvironment and liquid wastes to the estuary of theRiver Blackwater. Terrestrial sampling is similar to thatfor other power stations including analyses of milk andcrop samples for tritium, carbon-14 and sulphur-35.Aquatic sampling was directed at external exposure ofpeople who live on houseboats in muddy areas of theestuary and consumption of locally-caught fish andshellfish. It included the commercial oyster fishery ofimportance in the northern part of the estuary. Gammadose rate measurements are supported by analyses ofintertidal sediment, and Fucus vesiculosus is analysed asan indicator material.
Measurements for 1995 are summarised in Tables 25(a)and (b). Gamma dose rates confirmed the importance ofdirect radiation from the reactors in the immediatevicinity of the site. Further afield, dose rates could notbe distinguished from the natural background. Lowconcentrations of artificial radioactivity were detected inaquatic materials due to the combined effects ofdischarges from the station, Sellafield discharges, andfallout. Apportionment of the effects of these sources isdifficult because of the low levels detected;concentrations were similar to those for 1994 (Camplin,1995). A calculation based on concentrations ofradionuclides in sediments has been used to estimate theexternal exposure of the houseboat dwellers who werethe most exposed group in 1995. Their exposureincluding the effects of consumption pathways, wassmall, amounting to 0.011 mSv or 1% of the dose limitof 1 mSv.
Concentrations of activity were also low in terrestrialsamples. There was nevertheless an indication in localfruit that carbon-14 levels had been enhanced by theoperation of the power station. Despite this, the mostexposed group exposure was estimated to be less than0.005 mSv or 0.5% of the dose limit of 1 mSv,confirming that the radiological impact of authoriseddischarges from Bradwell was very low.
9.3 Dungeness, Kent
There are two, essentially separate, �A� and �B� nuclearpower stations on this site; the �A� station is powered byMagnox reactors and the �B� station by advanced gas-cooled reactors (AGRs). Discharges are made viaseparate, but adjacent, outfalls and stacks and for thepurposes of environmental monitoring are consideredtogether.
Analyses for tritium, carbon-14 and sulphur-35 interrestrial samples, were supplemented by a smallnumber of analyses for strontium-90, iodine-131 andcaesium-137 taken primarily for comparison withSellafield samples. Marine monitoring included gamma

29
and beta dose rate measurements on beaches andanalysis of seafood and indicator materials. The resultsfor 1995 are given in Tables 26(a) and (b).
Concentrations of radiocaesium in marine materials areattributable to discharges from the stations and toweapons test�s fallout with a contribution due todischarges from Sellafield. Apportionment is difficult atthese low levels. Trace levels of cobalt-60 in somemarine materials are likely to be due to the combinedeffects of discharges from the site and from other siteson the English Channel coast. The small concentrationsof transuranics in whelks and mud were typical of levelsexpected at other sites remote from Sellafield. The mostexposed group in 1995 continued to be represented bylocal bait diggers who also eat fish and shellfish.Gamma dose rates over intertidal sediments, measuredusing portable instruments, were difficult to distinguishfrom the natural background, thus the external exposureof the most exposed group has been based on acalculation using concentrations of radionuclides insediment. The radiation exposure of the aquatic mostexposed group was low, at less than 0.008 mSv or 0.8%of the dose limit of 1 mSv.
Activity concentrations in most terrestrial foods wereless than the limits of detection. Levels of carbon-14discharged from the �A� station were increased, ascompared to 1994, but levels were generally within therange of activity concentrations observed forbackground sources with the exception of blackberrieswhere a small enhancement was observed. Lowconcentrations of sulphur-35 and caesium-137 weredetected in sea kale; the former is likely to be due tostation discharges, and the latter to marine sources. Themaximum exposure due to gaseous discharges wasreceived by the 1 year old age group. Their exposure in1995 was estimated to be less than 0.013 mSv or 1% ofthe dose limit.
9.4 Hartlepool, Cleveland
This station is powered by twin AGRs. Theauthorisations were revised in 1995 to set lower limitson discharges and to be more prescriptive in terms of thetypes of radioactivity specified in the authorisations (seeTables 1 and 2). The critical pathway for radiationexposure due to liquid effluent discharges is internalirradiation following consumption of local fish andshellfish. Collection of small coal, which is washedashore along this stretch of coast, is used to represent thehighest beach occupancies. The sampling andmeasurement programmes at Hartlepool were similar tothose for other power station sites. However technetiumanalysis in Fucus vesiculosus is used as a specificindication of the far-field effects of discharges to seafrom Sellafield.
Results of the monitoring programme carried out in1995 are shown in Tables 27(a) and (b). The effects of
gaseous discharges from the site were not clearlydetectable in foodstuffs, though a slight enhancements ofcarbon-14 levels in sloes cannot be ruled out. The mostexposed group exposure in 1995 was less than 0.009mSv or 0.9% of the dose limit of 1 mSv.
The only detectable effect of liquid effluent dischargesfrom the power station was observed in an increasedlevel of tritium in seawater (16 Bq l-1). Discharges oftritium from the power station are discontinuous andlevels in the environment vary accordingly. Camplin etal (1990) has observed concentrations in excess of100000 Bq l-1 immediately after a discharge. Even atthis level the radiological significance of the dischargeswas minor because of the very low radiotoxicity of thenuclide. An increase in the level of technetium-99 inFucus vesiculosus was also observed in 1995 (30 Bq kg-1:1995; 9.0 Bq kg-1: 1994). This is due to increaseddischarges of this radionuclide from BNFL Sellafield.Low-levels of iodine-131 detected were likely to befrom local hospitals. Concentrations of radiocaesiumand transuranics were mainly due to discharges fromSellafield and to weapons tests� fallout. Gamma andbeta dose rates were difficult to distinguish from naturalbackground with the exception of measurements atPaddy�s Hole. In this location, waste slag from a steelworks can be found containing enhanced levels ofgamma emitting natural radionuclides. The radiationexposure of the most exposed group of local fish andshellfish consumers was low, at less than 0.005 mSv or0.5% of the dose limit of 1 mSv.
9.5 Heysham, Lancashire
This establishment comprises two, essentially separate,nuclear power stations both powered by AGRs.Discharges of radioactive waste from both stations aremade under authorisation via adjacent outfalls inMorecambe Bay and stacks and for the purposes ofenvironmental monitoring are considered together.Revisions to the authorisations in 1995 set lower limitsfor the majority of the radionuclides discharged andwere more prescriptive in terms of the types ofradioactivity specified. The monitoring programme forthe effects of gaseous discharges was similar to that forother power stations. That for liquid discharges wasalso similar, including sampling of fish, shellfish andindicator materials and measurements of gamma doserates, but for completeness the data considered in thissub-section includes all of that for Morecambe Bay.Parts of the programme are therefore in place in order tomonitor the effects of Sellafield. Samphire is alsocollected and analysed because of its use as a foodstuff.
The results for 1995 are given in Tables 28(a) and (b).Concentrations of carbon-14 and technetium-99increased in marine materials due to discharges fromSellafield. Otherwise similar levels to those for 1994(Camplin, 1995) were observed and the effect of liquiddischarges from Heysham was not detectable above the

30
Sellafield observed background. The radiation exposurein 1995 to the most exposed group of fishermenincluding a component due to external radiation was0.073 mSv which is well within the dose limit of 1 mSv.This represents a small decrease from the estimate for1994 of 0.08 mSv (Camplin, 1995). Most of thisexposure was due to the effects of discharges fromSellafield though the increased levels of carbon-14 andtechnetium-99 noted above made only a smallcontribution to the assessed dose. Concentrations ofradioactivity in samphire were of negligible radiologicalsignificance.
The effects of gaseous discharges were also notdetectable in 1995. All observations were less than thelimits of detection with the exception of activityconcentrations of carbon-14 which were consistent withthe range of background values to be expected. Themost exposed group dose was estimated to be less than0.012 mSv or 1% of the dose limit of 1 mSv.
9.6 Hinkley Point, Somerset
At this establishment there are two, essentially separate,�A� and �B� nuclear power stations; the �A� station ispowered by Magnox reactors and the �B� station byAGRs. Environmental monitoring considers the effectsof the two power stations together. Small changes weremade to the authorisation to dispose of liquid waste tothe Bristol Channel in 1995 to reflect changingoperations on the �B� site. Analyses of milk and cropswere undertaken to measure activity concentrations oftritium, carbon-14, sulphur-35 and gamma emitters.Analyses of seafood and marine indicators materials andmeasurements of external radiation over muddyintertidal areas were also carried out.
The results for 1995, presented in Tables 29 (a) and (b)indicate a small effect due to discharges of gaseouswastes. Activity concentrations of tritium and gammaemitters in terrestrial materials were all below the limitsof detection. Concentrations of sulphur-35 in fodderbeet were lower than those in 1994 (MAFF, 1995) whilstthose of carbon-14 were similar. Some of theconcentrations of carbon-14 in fruit and crops werehigher than the default values used to representbackground levels (Appendix 5), but given the expectedrange of background carbon-14 concentrations within afood group, the evidence is inconclusive as to thepotential of a local source. The estimated most exposedgroup from radioactivity in the terrestrial environmentexposure was less than 0.013 mSv or 1% of the doselimit of 1 mSv.
The concentrations observed in the Bristol Channel weregenerally similar to those in 1994, but there were smallincreases in manganese-54, cobalt-60, zinc-65 andcerium-144 which may have reflected increases indischarges from the �A� station. The concentration oftritium in seawater also increased in 1995 but, as
discussed for Hartlepool, the results of suchmeasurements are highly variable and, in any case, ofvery low radiological significance.
Concentrations of other radionuclides in the aquaticenvironment represent the combined effects of releasesfrom the stations, from other establishments whichdischarge into the Bristol Channel, from Sellafield, andfrom fallout. Apportionment is generally difficult at thelow levels detected. However the carbon-14 content inseafood was likely to have been due to discharges fromAmersham International, Cardiff. The concentrations oftransuranic nuclides were of negligible radiologicalsignificance. Gamma radiation dose rates over intertidalsediment, measured using portable instruments, weredifficult to distinguish from the natural background withthe exception of the measurements close to the stationwhich were affected by direct radiation from thereactors. The most exposed group from liquiddischarges from the site in 1995 were represented byfishermen on the River Parrett who were estimated toreceive an exposure of 0.008 mSv or 0.8% of the doselimit of 1 mSv.
9.7 Sizewell, Suffolk
At this establishment there are two stations. The �A�station is powered by Magnox reactors whilst the �B�station is powered by a PWR. Station �B� beganoperation in 1995. Authorised discharges of radioactiveliquid effluent from both power stations are dischargedvia adjacent outfalls to the North Sea. Gaseous wastesare discharged via separate stacks to the localenvironment. Environmental monitoring for the powerstations is considered in a single programme coveringthe area likely to be affected. The results of monitoringin 1995 are shown in Tables 30 (a) and (b).
The aquatic programme comprised analysis of seafoodand indicator materials and measurements of gamma andbeta dose rates in intertidal areas. Concentrations ofartificial radionuclides were low and mainly due to thedistant effects of Sellafield discharges and to fallout.Trace levels of activation products were likely to havebeen due to discharges from the power stations thoughthere was no conclusive evidence of the effects of thenew �B� station. In 1995, the radiation exposure of localfish and shellfish consumers was low, at less than 0.005mSv or 0.5% of the dose limit of 1 mSv. Measuredgamma and beta dose rates were indistinguishable fromthe natural background with the exception of themeasurements close to the stations which were affectedby direct radiation. The above exposure of the mostexposed group includes a contribution for their externalexposure based on a calculation using radionuclideconcentrations in sediment.
Unplanned reactor blowdowns at the �A� station in thelast quarter of the year led to the Quarterly NotificationLevel for carbon-14 being exceeded. However, gamma

31
spectrometry and analysis of tritium, carbon-14 andsulphur-35 in milk, crops and fruit showed very low levelsof artificial radioactivity near the power stations. Tracequantities of sulphur-35 were detected in a single sample ofblackberries. The estimated exposure of the most exposedgroup of consumers eating such foods was less than 0.008mSv or 0.8% of the dose limit of 1 mSv. There has been nodetectable increase in levels of radioactivity in foodstuffsdue to the operation of the PWR.
9.8 Trawsfynydd, Gwynedd
This station is being decommissioned. Low leveldischarges continued during 1995 under authorisation ofthe Welsh Office and HMIP. Discharges of liquidradioactive waste were made to a freshwater lakemaking the power station unique in UK terms. Theaquatic monitoring programme is directed at consumersof freshwater fish caught in the lake and externalexposure over the lake shoreline; the importantradionuclides are those of caesium and to a lesser extent,strontium-90. Habits surveys have established thatspecies of fish regularly consumed are brown trout,rainbow trout and a small amount of perch. Perch andmost brown trout are indigenous to the lake but rainbowtrout are introduced from a hatchery. Because of thelimited period which they spend in the lake, introducedfish generally exhibit lower radiocaesium concentrationsthan those of indigenous fish.
The results of the terrestrial programme, including thosefor local milk, crops and indicator materials are shown inTables 31 (a) and (b). Concentrations of activity in allterrestrial foods were low, the most significant being thoseat about 10 Bq kg-1 of radiocaesium in ovine muscle andoffal. The most likely source of radiocaesium in theseand other samples is fallout from Chernobyl and weaponstests though it is conceivable that a small contributionmay be made by resuspension of lake activity. Inrecognition of this potential mechanism, monitoring oftransuranic radionuclides was also carried out in crop andanimal samples. In all cases, detected activities were low,and similar to observations in other areas of England andWales, where activity was attributable to backgroundweapons fallout. No evidence was therefore found thatresuspension of lake activity contributed to exposure fromtransuranic radionuclides in 1995.
The most exposed group for terrestrial foods atTrawsfynydd in 1995 were adults who were high rateconsumers of ovine muscle and offal. Their exposureswere less than 0.014 mSv or about 1% of the dose limitof 1 mSv. This assessed dose is dominated by thecaesium activity detailed above and therefore contains asignificant contribution from Chernobyl fallout.
In the lake itself, there remains clear evidence for theeffects of discharges from the power station.Concentrations of caesium exceed 1000 Bq kg-1 in themud from the bed of the lake and in peat from below the
hydroelectric power station at Maentwrog though lowervalues tend to be found on the shoreline whereoccupancy by anglers is relevant. The water level of thelake was lower than usual in 1995 and the programme ofmeasurement of gamma dose rates on the shoreline wasincreased to ensure that exposures remained well withinlimits. Small increases in gamma dose rates wereobserved but their overall significance, as indicatedbelow, remained low.
There were also increases in the concentrations ofcaesium-137 in lake water which remain above those forwater coming into the lake via the Afon Prysor. Howeverthese increases were small, and indeed, concentrations ofcaesium and other radionuclides in fish fell in 1995.Taking this and the results of measurements of gammadose rates into account, the exposure of the most exposedgroup of anglers was 0.035 mSv in 1995, or less than 4%of the dose limit of 1 mSv. In 1994, their estimatedexposure was 0.03 mSv (Camplin, 1995).
9.9 Wylfa, Isle of Anglesey
Gaseous and liquid wastes from this station weredischarged in 1995 under authorisation of the WelshOffice and HMIP. Environmental monitoring of theeffects on the Irish Sea and the local environment iscarried out on behalf of the Welsh Office. Suchdischarges and effects are very low. The results of theprogramme in 1995 are given in Tables 32 (a) and (b).
The data for artificial radionuclides related to the Irish Seacontinue to reflect the distant effects of Sellafield dischargesthough trace levels of activation products were likely to havebeen due to discharges from the station. The concentrationswere generally similar to or less than those for 1994 thoughthe increase in beta activity in Fucus vesiculosus may havebeen due to the sensitivity this species has as an indicator ofincreased discharges of technetium-99 from Sellafield. Theexposure of the most exposed group of high-rate fish andshellfish consumers was low, at 0.005 mSv or 0.5% of thedose limit of 1 mSv. Gamma dose rates, measured usingportable instruments, continued to be difficult to distinguishfrom the natural background, but a small contribution due toexternal exposure of the most exposed group has beenincluded in the total above.
In relation to gaseous wastes, the mis-identification of awaste drum resulted in the limit for the activity in thematerial fed into the site incinerator being exceeded inAugust 1995. The level of activity involved was smalland there was no detectable impact on the foodchain. Areview of procedures has been carried out to prevent a re-occurrence.
The results for terrestrial foods indicate a small effectdue to the total gaseous discharges from the powerstation. This is seen in the data for sulphur-35 in milkand barley. However, the exposure of high rate foodconsumers remained low at less than 0.006 mSv or 0.6%of the dose limit.

32
10. DEFENCEESTABLISHMENTS
10.1 Aldermaston, Berkshire
The Atomic Weapons Establishment at Aldermaston isauthorised to discharge low levels of radioactive wasteto the environment. Liquid discharges are made to theRiver Thames at Pangbourne and to the sewage works atSilchester. The monitoring programme comprised ofsampling of milk, other terrestrial foodstuffs, freshwaterfish and indicator materials together with measurementsof gamma dose rates near the main outfall on the RiverThames. Monitoring of the aquatic environment atNewbridge is undertaken to indicate background levelsremote from nuclear establishments.
The results of measurements of radioactivityconcentrations and dose rates are shown in Tables 33(a)and (b). The concentrations of artificial radioactivitydetected in the Thames catchment were generally verylow. Leakage was discovered, in March, from a valve pitin the liquid discharge pipeline. As the area isoccasionally used for rough grazing analyses ofvegetation samples taken by AWE staff was carried out.This indicated that there was no significant impact onthe foodchain. Iodine-131 was detected (110 Bq kg(dryweight)) in mud in Foudry Brook but the source of thisnuclide is most likely to have been associated withmedical applications. The gamma dose rate on the riverbank at Pangbourne was indistinguishable from naturalbackground. External exposures were thereforecalculated using a model based on concentrations ofradionuclides in sediment. Habits surveys haveestablished that the most exposed group affected bydischarges into the river comprises anglers whoseoccupancy of the river bank has been assessed toestimate their external exposures. No consumption offreshwater fish has been established, however theassessment has conservatively included consumption offish at a low rate of 1 kg year-1. The overall radiologicalsignificance of liquid discharges was very low: theradiation dose to anglers was much less than 0.005 mSvor 0.5% of the dose limit of 1 mSv.
The concentrations of radioactivity in milk, vegetables,fruit and terrestrial indicator materials were also verylow. Results for tritium, uranium and transuranicradionuclides were similar to those for 1994 (MAFF,1995). The most likely source of the radionuclidesdetected was natural background or weapons testsfallout. The maximum dose was assessed to be for the 1year old age group. The dose in 1995, includingcontributions from the natural and fallout sources, wasless than 0.005 mSv or 0.5% of the dose limit of 1 mSv.
10.2 Barrow, Cumbria
Whilst the site operated by Vickers Shipbuilding andEngineering Ltd at Barrow is not strictly a defence
establishment, the small amounts of liquid radioactivewastes discharges to the Irish Sea are related tosubmarine activities and are therefore included in thissection for completeness. The monitoring programmecomprises measurements of gamma dose rates andanalysis of sediments collected near the outfall. Theresults, given in Tables 34(a) and (b), show noenhancement due to site activities above the backgroundto be expected in the Irish Sea at this distance fromSellafield. The external exposure of the most exposedgroup at the site was estimated to be 0.023 mSv,representing less than 3% of the dose limit of 1 mSv.Most of this exposure was due to historic dischargesfrom Sellafield.
10.3 Chatham, Kent
Discharges of radioactive waste from Chatham no longertake place, however a small programme of gamma doserate measurement and sediment analysis has continuedin surveillance of the effects of past discharges. Theresults (Tables 34(a) and (b)) show that gamma doserates continued to be indistinguishable from naturalbackground and, that low levels of radioactivity weredetected in sediments. The external exposure of themost exposed group was 0.005 mSv or 0.5% of the doselimit of 1 mSv.
10.4 Devonport, Devon
Discharges of liquid radioactive waste are made underauthorisation by Devonport Management Ltd and theMinistry of Defence into the Tamar Estuary. Themonitoring programme in 1995 comprisedmeasurements of gamma dose rates and analysis ofseafood and indicator materials. The results (Tables34(a) and (b)) were similar to those in 1994 (Camplin,1995). Trace quantities of fission and activationproducts and actinides were detected. The detection ofiodine-131 is most likely to be related to its medicaluses. The exposure of the most exposed group takingaccount of consumption of marine foods and occupancytimes was estimated to be 0.012 mSv or 1% of the doselimit of 1 mSv. The radiological significance of this, incommon with other defence establishments, continued tobe low.
10.5 Greenwich, London
In order to monitor the potential effects of the smalldischarges of gaseous activity from the Royal NavalCollege at Greenwich, grass is sampled and analysed bygamma spectrometry. Two samples were analysed in1995. One sample contained a small amount ofcaesium-137 above the limit of detection (1.0 ± 0.2 Bqkg-1). This activity is typical of that expected due to theresidual but radiologically insignificant effects ofweapons tests and Chernobyl fallout in the area.Therefore there was no detected impact in theenvironment due to the operation of the site in 1995.

33
11. AMERSHAMINTERNATIONAL PLC
This company manufactures radioactive materials foruse in medicine, research and industry. The company�sprincipal establishment is located in Amersham,Buckinghamshire and it also operates from Cardiff inSouth Glamorgan and on the Harwell site. Dischargesfrom the Amersham International PLC facility on theHarwell site are covered by the Harwell monitoringprogramme.
11.1 Amersham, Buckinghamshire
Discharges of liquid radioactive wastes are made underauthorisation to the Maple Lodge sewage works;releases enter the Grand Union Canal and the RiverColne. Discharges of gaseous wastes are alsoauthorised. The monitoring programme consists ofmeasurements of gamma dose rates on the river bank ofthe Union Canal and analysis of fish, milk, crops andindicator materials. Monitoring at Newbridge on theThames acts as an indication of background levels in thecatchment. Monitoring of non-food pathways is carriedout by HMIP (HMIP, 1995).
The results of the measurements are presented in Tables35(a) and (b). The concentration of carbon-14 in fishwas enhanced above the background level (24 Bq kg-1
(wet weight)) but its radiological significance was low.Concentrations of other radionuclides, e.g. cobaltisotopes, were also slightly enhanced close to the outfall.However, the gamma dose rates on the river bank wereindistinguishable from natural background.
The activity concentrations in milk and crops weregenerally lower than the limits of detection. However,low levels of sulphur-35 and iodine-125 were detectedin a few crop samples.
Habit surveys have identified anglers as the mostexposed group affected by discharges into the canal/river system. Their occupancy of the river bank hasbeen assessed to estimate their external exposures.Consumption of freshwater fish was also considered butnone was found. Nevertheless, it is considered prudentto include a component in the assessment of the anglersexposure and a hypothetical consumption of fish at arate of 1 kg year-1 was assumed. The anglers exposurein 1995 was much less than 0.005 mSv or 0.5% of thedose limit of 1 mSv.
The exposure of the most exposed group of terrestrialfood consumers was assessed as being less than 0.011mSv or 1% of the dose limit.
11.2 Cardiff
A second laboratory, situated near Cardiff, produceslabelled compounds used in research and diagnostic kits
used in medicine for the in vitro testing of clinicalsamples. Revised authorisations were issued by HMIPand the Welsh Office in 1995 to regulate disposals ofwaste from the establishment. These new authorisationsreduced the limits on the discharges. Liquid wastes aredischarged into the Severn estuary via the sewer system.
Monitoring, carried out on behalf of the Welsh Office,includes consideration of consumption of food andexternal exposure over muddy, intertidal areas.Measurements of external exposure are supported byanalyses of intertidal sediment. Indicator materialsincluding seawater, Fucus seaweed, grass, rape, silageand dry cloths provide additional information.
The results of monitoring in 1995 are presented inTables 36(a) and (b). The main effect of liquiddischarges is seen in increases of carbon-14 activitiesabove those expected due to background. Similar valuesto those found in 1994 were observed (Camplin, 1995).Concentrations of other radionuclides in aquatic sampleswere low and can be explained by other sources such asfallout and discharges from other establishments.Gamma dose rates over sediment, as measured usingportable instruments, were difficult to distinguish fromthose expected from the natural background. Theexposure of the most exposed group of fish and shellfishconsumers including external radiation was 0.012 or1% of the dose limit of 1 mSv.
The main effects of gaseous discharges were seen inresults for tritium and carbon-14, and levels of the latterwere increased, as compared to 1994, due to anincreased workload at the site. Concentrations oftritium, organically bound tritium and carbon-14 werefound to be higher in milk sampled from farms close tothe site than from farms far from the site. Whencompared with data for other sites, relatively highconcentrations of these nuclides were also detected inother terrestrial samples such as barley and grass.However, the concentrations of other radionuclides werelow and rarely above the limits of detection. Calcium-45was detected in grass (7.2 Bq/kg) and in oilseed rape (11Bq/kg) but was not measured above the limit ofdetection in foodstuffs consumed directly by man. Thesemeasurements are not of radiological significance.
The maximum estimated exposure from foodconsumption was to the 1 year old age group. The mostexposed group dose received <0.027 mSv or 3% of thedose limit of 1 mSv. The largest contribution was fromcarbon-14 in milk.
12. MINOR SITES ANDEURATOM SAMPLING
Four minor sites with very low levels of discharge aremonitored using a small programme of samplingindicator materials. The results, given in the following

34
sub-sections, show that there was no detected impact onthe environment in 1995 due to operation of these sites.This section also presents the results of indicatorsampling around the major nuclear sites carried out inrelation to the Euratom Treaty.
12.1 Imperial College ReactorCentre, Ascot, Berkshire
Four grass samples were analysed by gammaspectrometry. All results in 1995 were less than thelimits of detection.
12.2 Imperial Chemical Industriesplc, Billingham, Cleveland
Three grass samples were analysed by gammaspectrometry. All results in 1995 were less than thelimits of detection with the exception of a single samplewhich contained a small amount of caesium-137. Themean concentration of caesium-137 was 0.6 ± 0.1 Bqkg-1 which is typical of that expected due to the residualbut radiologically insignificant effects of weapons testsand Chernobyl fallout in the area.This reactor ceased operation on 28 June 1996.
12.3 Rolls Royce plc, Derby,Derbyshire
Results of monitoring at Derby are presented in Table37. Uranium activity detected in grass and soil sampleswas similar to results obtained in 1994 (MAFF, 1995).Isotopic analysis of the grass samples confirmed that theactivity was not enriched in uranium-235. The activitiesdetected are therefore due to natural sources.
In September 1995 a power failure resulted in enhancedlevels of uranium discharge. Additional monitoring wascarried out and no impact on the food chain orenvironment could be detected.
12.4 Universities Research ReactorCentre, Risley, Cheshire
Eight grass samples were analysed by gammaspectrometry. All results in 1995 were less than thelimits of detection. This site has now beendecommissioned and will not therefore be monitored inthe future.
12.5 Euratom sampling
In accordance with the requirements of Articles 35 and36 of the Euratom Treaty, each member state is obliged tomonitor levels of radioactivity near nuclear facilities andprovide information from this programme to theCommission. A programme of grass and soil monitoringto fulfil these requirements was established in 1993 inEngland and Wales (MAFF, 1995). The results of the
programme in 1995 are presented in this sub-section andwill be submitted to the Commission of the EuropeanUnion in fulfilment of the Treaty obligation. Supplementaryinformation on grass and soil analyses is provided forsome sites in the foregoing site-specific sub-sections.
The programme consists of annual sampling of pairedgrass and soil samples from three permanent plots ateach site, generally situated 500 m from the siteperimeter along the three dominant landward winddirections. In 1995 samples continued to be analysedfor carbon-14, strontium-90, caesium-137 andplutonium-239+240. Tritium, sulphur-35, plutonium-238 and americium-241 analyses were also performed in1995 on all or a sub-set of the samples obtained in orderto meet a change in the programme specification. Theresults are given in Table 38.
The mean concentrations of tritium ranged from 13 to690 Bq kg-1 in grass. However, at only one site, Cardiff,did the mean concentration exceed 100 Bq kg-1. Themaximum concentration observed, 1500 Bq kg-1, wasalso observed at this site. The next highestconcentration, 170 Bq kg-1, was found at Winfrith. Noanalyses were performed at Sellafield. Taken togetherthese results are to be expected given the relativedischarges of tritium from each site (Table 2).
Carbon-14 activity concentrations depend on the carboncontent of the samples and are highly variable.Interpretation of the data without a knowledge of thecarbon content is therefore difficult. Nevertheless, takenwith other site-specific data some general conclusionsmay be drawn. Typical ranges of mean concentrationsin grass and soil were 100-200 and 10-20 Bq kg-1
respectively. Sites where concentrations were foundwell outside these ranges were
• Cardiff 620 Bq kg-1 in grass73 Bq kg-1 in soil
• Dungeness 98 Bq kg-1 in soil and• Trawsfynydd 48 Bq kg-1 in soil
Of these sites, the carbon-14 signal is clearest at Cardiffand is supported by data on other materials (see Cardiffsub-section). The observation of a significantenhancement of carbon-14 levels near Sellafield in 1994(MAFF, 1995) was not repeated in 1995. This isprobably due to the large reduction in discharges of thisnuclide in gaseous wastes from this site (1993: 7.4 TBq;1994: 1.0 TBq; 1995: 0.71 TBq). Gaseous wastes havebeen diverted to a liquid stream.
Mean concentrations of sulphur-35 in grass and soil weretypically in the ranges 5-20 and 1-5 Bq kg-1 respectively.Significant variations outside these ranges were found at
• Amersham 47 Bq kg-1 in grass• Oldbury 200 Bq kg-1 in grass and• Hinkley Point 10 Bq kg-1 in soil

35
The high level detected in grass at Oldbury was notreflected in the results of other monitoring carried out inthe vicinity of the site.
Means concentrations of strontium-90 were generallyless than 10 Bq kg-1 in grass and soil and similar tovalues for 1994 (MAFF, 1995). Those in excess of thislevel were found at
• Sellafield 45 Bq kg-1 in grass24 Bq kg-1 in soil and
• Dungeness 26 Bq kg-1 in soil
Evidence of enhancement of strontium-90 due to sitedischarges from Sellafield has been found previously(MAFF, 1995) and is reflected in samples of othermaterials from the site. In contrast, there is no strongevidence to suggest that the observation of a relativelyhigh level of strontium-90 in soil at Dungeness is linkedto discharges from the site and fallout from weapons testis the most likely source.
Mean caesium-137 concentrations in grass and soil weregenerally similar to those in 1994, with levels in grassbeing less than 10 Bq kg-1 and in soil being less than100 Bq kg-1. As previously found, higher levels wereobserved at Sellafield, Trawsfynydd and Dungeness.The long term effects of fallout from weapons tests andChernobyl would have played a significant part indetermining these differences.
As was found in 1994, mean plutonium-239+240concentrations detected in grass from Sellafield, ~1 Bqkg-1, were significantly higher than those at other siteswhich were in the range <0.010-0.05 Bq kg-1. In soil,higher concentrations than the norm were found atDungeness (3.5 Bq kg-1), Sellafield (16 Bq kg-1) andTrawsfynydd (2.7 Bq kg-1). A typical level at other siteswas less than 0.5 Bq kg-1. Fallout from weapons testingwill have had a major influence on these levels.However, taken with the observations for plutonium-238, there is evidence for a site related effect atSellafield. The expected ratio of plutonium-239+240/plutonium-238 in fallout is about 40. That in recentdischarges from Sellafield is less than 10. The observedratios in grass and soil near Sellafield in 1995 were 8and 19 respectively.
An indication of the potential radiological significanceof these measurements can be given by comparing thelevels with the appropriate Generalised Derived Limits(GDLs) for these radionuclides. GDLs for grass andsoil are activity concentrations which correspond to anexposure of 1 mSv. They are based on simple,conservative models and as such do not provide arealistic assessment of exposures (Attwood et al 1996).Their main use is in screening monitoring results toestablish whether specific studies should be undertaken.Table 39 compares the highest observed concentrationsin grass and soil with the relevant GDLs. This
comparison is not strictly valid as GDLs are derived forwell mixed soil to a depth of 300 mm whereas the soilsamples taken as part of this programme are to a depthof 70 mm. Generally, the highest mean concentrationsobserved were lower than, often very much lower than,the 10% trigger level for site-specific investigations.However at Cardiff and Dungeness, values in excess of10% were observed. The site-specific assessments forthese sites were considered in earlier sub-sections of thisreport. These assessments evaluate the dose receivedusing the activities found in locally produced foods andshow that the doses were significantly less than 0.1 mSv.
13. INDUSTRIAL SITES
13.1 Albright and Wilson Ltd,Whitehaven, Cumbria
In view of the radiological importance of naturalradionuclides to fish and shellfish consumers (Pentreathet al., 1989; Rollo et al., 1992; Camplin et al., in press),a small programme of monitoring for theseradionuclides in the UK marine environment hascontinued. Previous surveys (Rollo et al., 1992) haveestablished that an important man-made source was theAlbright and Wilson chemical plant at Whitehaven inCumbria which has manufactured phosphoric acid fromimported phosphate ore. Phosphogypsum, a wasteproduct of this process, has been discharged as a liquidslurry by pipeline to Saltom Bay. The radioactive wastedischarges are authorised by HMIP and contain lowlevels of natural radioactivity consisting mainly ofthorium, uranium and their daughter products.Discharge rates during 1995 were much less than thosemade previously due to changes in waste treatmenttechniques and the cessation of use of phosphate ore in1992.
The results of monitoring for natural radioactivity nearthe site in 1995 are shown in Table 40.
Analytical effort has focused on lead-210 andpolonium-210 which concentrate in marine species andare the important radionuclides in terms of potentialdose to the public. Concentrations of polonium-210 andother natural radionuclides are enhanced nearWhitehaven but quickly reduce to background levelsfurther away. Concentrations of polonium-210 and lead-210 were generally lower than in 1994 due to reductionsin discharges and radioactive decay of activity already inthe environment. Figure 5 shows how concentrations ofpolonium-210 in winkles have decreased substantiallysince 1989. It also demonstrates the seasonal variationsin concentrations which have been previously observed(Rollo et al., 1992). The critical radiation exposurepathway is internal irradiation, due to the ingestion ofnatural radioactivity in local fish and shellfish. In thisassessment, the contribution due to background levels ofnatural radionuclides has been subtracted. The most

36
exposed group consists of people who consume seafoodcollected from Saltom Bay and Parton. Consumptionrates were reviewed in 1995 and small changes to fishand shellfish data were made. The exposure to the mostexposed group in 1995 was 0.18 mSv on the basis ofthe current generic ICRP advice for a gut transferfactor of 0.5 for polonium. This advice is to be appliedin the absence of specific information.
As discussed in Section 6, a specific research studyinvolving the consumption of crab meat containingnatural levels of polonium-210 provides evidence for agut transfer factor of 0.8 for polonium. Estimates ofexposures due to polonium intakes due to consumptionof seafood have therefore also been calculated using theconservative assumption that the value of 0.8 applies tothe total intake of polonium. These data indicate thatthe most exposed group dose has reduced from0.34 mSv in 1994 (Camplin, 1995) to 0.29 mSv in 1995.The estimated doses in 1995 are therefore well withinthe dose limit for members of the public of 1 mSv.
The fish and shellfish consumed by the most exposedgroup also contains artificial radionuclides due toSellafield discharges. The additional exposure due toartificial radionuclides has been calculated using datafrom Section 4. In 1995 these exposures added a further0.054 mSv to the doses above resulting in a total dose tothis group of 0.34 mSv.
13.2 Other industrial sites
Levels of natural radionuclides in gaseous wastes fromsome large scale industrial activities also have thepotential to raise the radionuclide concentrations infoodstuffs. Examples of such activities are combustionof fossil fuels and metal or phosphate ore processing.Since 1991, a small rolling programme to examine theeffects of these activities has been carried out. In 1995three sites were chosen for study:
• Eggborough, North Yorkshire, - a coal fired powerstation
• Ellesmere, Cheshire, - an oil refinery and• Milford Haven, Pembrokeshire, - an oil refinery
Marloes, Pembrokeshire was chosen as a control site forpurposes of comparison.
The results of the sampling of grass, soil and animals in1995 is given in Table 41. The analyses performedincluded ones for man-made radionuclides in order torule out the possibility that there was an unforeseenmechanism whereby the general levels of such nuclideswere enhanced.
The concentrations of natural radionuclides in grass andsoil were all within the ranges expected for naturalsources. Monitoring at Eggborough in 1994 hadproduced results indicating that the power station mayhave contributed measurable amounts of unsupportedpolonium-210 to some grass samples (MAFF, 1995).However this was not observed in 1995.
The concentrations of man-made radionuclides in allsamples were all low and typical of those to be expecteddue to sources such as weapons tests and Chernobylfallout.
14. LANDFILL SITES
Some landfill waste disposal sites are authorised byHMIP to receive solid wastes containing very low levelsof radioactivity. There is potential for the radioactivityin wastes disposed of in this way to migrate ingroundwater and in leachates to surrounding farmland.Monitoring of leachates is carried out by HMIP (HMIP,1995). Once covered over, landfill sites may also beconverted back to agricultural use. In recognition ofthis, the programme includes monitoring of indicatormaterials (plants) collected near such sites. In 1995 thesites chosen were:
• Clifton Marsh, Lancashire• Cowpen Bewley, Cleveland• Cilgwyn Quarry, Gwynedd and· Milton, Cambridge
Grass samples were collected at each site exceptCilgwyn, where samples of nettles were obtained. Meanconcentrations of tritium up to 100 Bq kg-1 weredetected which were of the same order as valuesdetected in 1994. These values are an order ofmagnitude lower than those which can be detected ingrass in the vicinity of some nuclear sites and are ofnegligible radiological significance. Nevertheless,results for individual samples at Clifton Marsh, Cilgwynand Milton were observed in excess of 100 Bq kg-1
giving support to the observation that this nuclide ispresent in some landfill sites (HMIP, 1995). The resultsfor other nuclides were typical of those expected due tonatural background, weapons tests or Chernobyl fallout.These results are summarised in Table 42.
1989
1990
1991
1992
1993
1994
1995
400
300
200
100
0
Bq
per
kilo
gram
me
(wet
)
Time (years)
Figure 5. Polonium-210 in Parton winkles

37
15. CHERNOBYL FALLOUT
The programme of monitoring in relation to the effectsof fallout from this accident has continued in 1995.Caesium is still being detected in sheep grazing certainupland areas in the UK which were subjected to heavyrainfall after the Chernobyl accident in 1986.Restrictions are still in place on the movement andslaughter of sheep from these areas in order to preventanimals with high levels of caesium entering the foodchain.
In the summer of 1995 an intensive monitoring survey ofover 100,000 sheep in the post-Chernobyl restrictedareas of Cumbria and North Wales was carried out. Theresults of the survey enabled restrictions to be lifted onmore than 30 holdings leaving fewer than 410 within therestricted areas. This represents a reduction of 94 %since 1986 when over 6770 holdings were underrestriction.
In addition, the radiocaesium monitoring of sheepcarcasses at slaughter-houses has continued. The meanresult of all English and Welsh samples analysed in 1995was 40 Bq/kg and the highest result was 414 Bq/kg. Thiscompares with the action level of 1000 Bq/kg ofcaesium recommended by the EC expert committee in1986.
Further information and results are published in a MAFFnews release (MAFF 1996) (reference MAFF 15/96 of17 January 1996 ) and a Welsh Office press release(Welsh Office 1996)
Sampling locations for freshwater fish were mostly inareas of relatively high deposition of fallout fromChernobyl, namely Cumbria, North Wales and parts ofScotland. Samples from areas of low deposition inEngland were also obtained for completeness andcomparison.
Table 43 presents concentrations of caesium-134 and -137 in fish and water. Artificial radionuclides, otherthan those of radiocaesium were, in 1995, no longerdetectable from the Chernobyl accident.
Concentrations of radiocaesium in freshwater fish variedbetween locations, reflecting the areas of deposition ofradioactivity from Chernobyl and the small samplingprogramme. Perch had the highest concentrations of anyof the freshwater species but, as they are not eaten inlarge quantities, their radiological significance is low.Concentrations in all species were less than 1000 Bq kg-1.Where there are data for the same species and locationsto compare with results for 1994 (Camplin, 1995) thereare likely to be large statistical fluctuations because ofthe small sampling programme, but concentrations ofradiocaesium were generally similar in 1995 to those in1994. Figure 6 shows a plot of mean total radiocaesium
Figure 6. Radiocaesium in brown trout �Ennerdale Water
1200
1000
800
600
400
200
0
Bq
per
kilo
gram
me
(wet
)
1986
1987
1988
1989
1990
1991
1992
1993
1994
1995
Time (years)
concentrations in brown trout from Ennerdale Wateragainst time. In recent years the rate of decline hasreduced and it is likely that levels have now becomemore stable.
Radiation exposures have been estimated using aprocedure based on cautious assumptions, as previously(Camplin, 1995). A consumption rate of brown trout of37 kg year-1, sustained for one year, was taken to be anupper estimate for adults subject to the highestexposures. Actual exposures are likely to be lower, notonly because this consumption rate is cautious (Leonardet al., 1990) but also because, in practice, hatchery-reared or farmed fish of much lower radiocaesiumconcentrations may contribute to the diet. In 1995,estimated exposures were less than 0.1 mSv.
The ICRP (ICRP, 1993) provides guidance in thecontext of emergencies, which includes suggested levelsof averted dose above which particular countermeasureswould almost certainly be justified. It recommends thatintervention should be taken by restricting a singlefoodstuff if the averted effective dose is in excess of 10mSv in a year. Given that the dose estimates here arecautious, it is clear that the residual contamination offreshwater fish from fallout from Chernobyl is only ofminor radiological importance.
16. REGIONAL MONITORING
This section presents the results of regional monitoring inareas of the British Isles. The component parts of theprogramme considered in subsequent sub-sections cover:
• The Isle of Man
• The Channel Islands
• General diet in England and Wales
• Milk in England, Wales and Northern Ireland
• Crops in England and Wales and
• Seawater surveys in the British Isles

38
16.1 Isle of Man
MAFF carries out an on-going programme ofradioactivity monitoring on behalf of the Department ofLocal Government and the Environment on the Isle ofMan for a wide range of terrestrial foodstuffs. Resultsare reported in Isle of Man Government press releases inaddition to this report. Results of monitoring of aquaticfoodstuffs are presented in Section 7.
Radioactivity monitoring of terrestrial foods on the Islandserves two purposes: firstly to monitor the continuingeffects of radiocaesium deposition resulting from theChernobyl accident in 1986 and secondly to respond topublic concern over the effects of the nuclear industry.The potential sources of exposure from the UK nuclearindustry are: (i) liquid discharges into the Irish sea andsea-to-land transfer; and (ii) gaseous discharges of tritium,carbon-14 and sulphur-35 and atmospheric transport.
The results of monitoring for 1995 are presented inTable 44. Tritium, cobalt-60, ruthenium-106 andcerium-144 activity was not detected above the LoD inany of the Manx food samples monitored. Carbon-14was detected in local milk and crops at activityconcentrations similar to the natural background valuesobserved in the regional network of sampling locationsremote from nuclear sites. Levels of strontium-90,caesium-137, plutonium isotopes and americium-241detected in local milk and crops were all similar to thevalues observed in the regional networks of UK dairiesand crop sampling locations remote from nuclear sites,at those locations known to have received similar levelsof Chernobyl and weapons fallout. Levels of theseradionuclides in local animals were also similar to levelsin animals from other sampling locations unaffected bySellafield discharges. These results demonstrate thatthere was no measurable impact on Manx agriculturefrom operation of mainland nuclear installations in1995.
These 1995 data were similar to results obtained inprevious years. The exposure of the most exposedgroup from consumption of these Manx foodstuffsmonitored in 1995 was less than 0.024 mSv or 3% of thedose limit of 1 mSv.
16.2 Channel Islands
Marine environmental samples provided by the ChannelIsland States have continued to be analysed, mainly insurveillance of the effects of radioactive liquiddischarges from the French reprocessing plant at Cap dela Hague. The programme also serves to monitor thepotential effects of historic disposals of solid waste inthe Hurd Deep. Fish and shellfish are monitored inrelation to the internal irradiation pathway; sediment isanalysed with relevance to external exposures. Seawater and seaweeds are sampled as indicator materialsand, in the latter case, because of their use as fertilisers.
The results for 1995 are given in Table 45.Concentrations of activity in fish and shellfish were lowand similar to those in previous years. Apportionmentto different sources, including fallout, is difficult in viewof the low levels detected. A theoretical assessmentbased on a pessimistic choice of consumption rates andoccupancy gives an estimated exposure of 0.009 mSv in1994 or 0.9% of the dose limit for members of thepublic. The concentrations of artificial radionuclides inthe marine environment of the Channel Islands thereforecontinued to be of negligible radiological significance.
16.3 Diet in England and Wales
As part of MAFF�s general responsibility for foodsafety, radioactivity in whole diet is determined on aregional basis. Measurements are made on samples ofmixed diet from nine regions in England and Wales.The system of sampling mixed diet rather thanindividual foodstuffs from specific locations, providesmore accurate assessments of radionuclide intakesbecause people rarely obtain all their food from a localsource (Mondon and Walters, 1990). Radionuclides ofboth natural and man-made origins were measured insamples in 1995. The results are provided in Table 46.
All of the results for man-made radionuclides were lowand of little radiological significance. Concentrations oftritium were variable ranging from 4.5 to 82 Bq kg-1,however, there was no discernible regional pattern to thedistribution when compared with data for 1993 and1994 (MAFF, 1995). Sulphur-35, strontium-90,caesium-137 and actinide activity concentrations resultswere below or close to the limit of detection and weresimilar to levels in previous years.
Exposures as a result of consuming diet at average ratesat the concentrations given in Table 46 have beenassessed for adults, infants and ten year old children. Inall cases the exposures of infants were higher than otherage groups. The data are summarised in Table 47. Themost important man-made radionuclide was strontium-90, derived from weapons tests� fallout. The nationwidemean exposure for all man-made radionuclides was0.008 mSv with a range from region to region of 0.004to 0.016 mSv. These exposures are not directlycomparable with those published for 1993 and 1994because calculations have been carried out for 10 yearolds in the past. However, when data for the same agegroups are compared, doses have been found to changelittle from year to year.
The mean concentration of carbon-14 in diet in 1995was 43 Bq kg-1 with a range from 35 to 61 Bq kg-1. Inprevious years, the mean values have been 33 and 38 Bqkg-1 for 1993 and 1994, respectively. Given thevariability of results from region to region, it is unlikelythat the trend of a small increase from year to year issignificant, though the general expectation is for a smallreduction from year to year due to the Suess effect (the

39
diluting of carbon-14 by carbon-12 released by theburning of fossil fuels) and dispersion of weapons tests�fallout (Collins et al., 1995). This situation willcontinue to be monitored in 1996.
Concentrations of lead-210 varied by an order ofmagnitude in samples of diet but the meanconcentration, 0.049 Bq kg-1 was similar to that forpolonium-210 of 0.039 Bq kg-1. Concentrations ofradium-226 and uranium were similar to those in 1994(MAFF 1995).
The mean exposure due to consumption of naturalradionuclides was 0.12 mSv, ranging from 0.091 to 0.20mSv across the regions. The most importantradionuclides were lead-210 and polonium-210 asestablished in earlier studies (MAFF, 1995). Significantcontributions would also have been made by potassium-40 e and other members of the uranium-238 and thorium-232 decay series which were not determined in thisyear�s analytical schedule. Further data for thesenuclides is provided by MAFF (1995). Nevertheless itremains true that the results continue to demonstrate thatnatural radionuclides are by far the most dominant sourceof exposure in the average diet in England and Wales.
16.4 Milk from dairies in England,Wales and Northern Ireland
The programme of milk sampling in England, Wales andNorthern Ireland continued in 1995. Samples werecollected monthly from twenty five counties andanalysed for natural and man-made radionuclides.Measurements for lead-210 and polonium-210 wereincluded for the first time this year, and the analyses foruranium and plutonium were extended to include allcounties. The programme, together with that for cropspresented in the following sub-section, provides usefulinformation with which to compare data from farmsclose to nuclear sites and other establishments whichmay enhance concentrations above background levels.
Where measurements are comparable, detected activityconcentrations of all radionuclides in 1994 were similarto those for previous years. These results aresummarised in Table 48. Uranium and plutonium resultswere either very close to or below their respective limitsof detection. Results for tritium were consistently belowthe routine limit of detection of 10Bql-1. Where lower limits of detection were used, themaximum concentration observed was 3.0 Bq l-1 whichis similar to the value detected in rain of 4.8 Bq l-1
(Playford et al., 1995). Mean and maximum values forcarbon-14 from all dairies were similar and at expectedbackground levels.
Most of the results for strontium-90 were below the limit ofdetection. Where lower limits were specified for selectedcounties, the concentration detected was approximately0.04 Bq l-1 which is in good agreement with results fromother surveillance studies (Smith et al., 1994a).
The levels of radiocaesium in dairy milk were highestfrom regions that received the greatest amounts ofChernobyl fallout. Thus highest concentrations weredetected in samples from dairies in Northern Ireland.The results were in good agreement with those from theNRPB surveillance programme which showed meanlevels in England and Wales of 0.04 and 0.05 Bq l-1
respectively, and those in Northern Ireland to be 0.22 Bq l-1
(Smith et al., 1994a).
The assessed doses from consumption of dairy milk ataverage rates were highest to the one year old infant agegroup. They ranged from <0.026 to <0.061 mSv andwere dominated by the presence of the naturalradionuclides lead-210 and polonium-210. Man-maderadionuclides contributed no more than a few µSv tothese exposures.
16.5 Crops in England and Wales
The programme of monitoring natural and man-maderadionuclides in crops continued in 1995. Tritiumactivity was below the limit of detection in all samplesexcept one of leafy green vegetables from Cheshirewhere 26 Bq kg-1 was detected. The radiologicalsignificance of this level of activity is negligible but itsdetection lends support to the thesis that the widespreaduse and disposal of tritium activity in, for example, lightsources is becoming detectable in the widerenvironment. Such observations are unlikely to beconnected with the disposal of wastes from the nuclearindustry. The activities of carbon-14 detected in cropsamples were those expected from consideration ofbackground sources.
The highest levels of strontium-90 activity were detectedin crop samples from the south west of England as in1994. This supports the observation made previously(MAFF, 1995) that the distribution of strontium-90activity is related to the pattern of fallout from nuclearweapons testing. Caesium activity was largely below thelimit of detection though a few samples from Cornwalland Cumbria yielded positive values. However, all werebelow 1 Bq kg-1. Plutonium and americium-241 resultswere all low, below 0.003 Bq kg-1, and were similar tothose observed for 1994 (MAFF, 1995).
Levels of the natural radionuclides, lead-210, polonium-210, thorium-232 and uranium were also similar to thoseobserved in 1994 (MAFF, 1995).
e The body content of potassium is homeostatically controlled thus an increased intake of potassium containing the equilibriumconcentration of potassium-40 will not result in a higher dose.

40
16.6 Seawater surveys
Seawater surveys support international studiesconcerned with the quality status of coastal seas (e.g.OSPAR, 1993b) and provide information which can beused to distinguish different sources of man-maderadioactivity (e.g. Kershaw and Baxter, 1995). Inaddition, the distribution of radioactivity in sea wateraround the British Isles is a major factor in determiningthe variation in individual exposures at coastal sites aswell as collective doses. Therefore a programme ofsurveillance into the distribution of key radionuclides ismaintained using research vessels and other means ofsampling. Detailed historical data on radiocaesium insea water have been published in a series of reports toaid model development (Camplin and Steele, 1991;Baxter et al., 1992; Baxter and Camplin 1993(a-c)) andhave been used to derive dispersion factors for nuclearsites (Baxter and Camplin, 1994). The research vesselprogramme on radionuclide distribution currentlycomprises cruises in the Irish Sea, Scottish waters andthe North Sea every two or three years. The results ofthe 1993 cruises have been summarised by Camplin(1994) and further cruises are planned for 1996. Datafrom shoreline sampling in the Irish Sea and Scottishwaters in 1995 are given in Table 50.
Concentrations of caesium-137 typical of the north-eastern Irish Sea and northern Scottish waters were ofthe order of 0.05-0.5 Bq l-1 and 0.01-0.02 Bq l-1
respectively. These data show similar levels to thoseobserved from the more detailed sampling in 1993, thegeneral distribution being one of falling concentrationsas the distance from Sellafield increases. Thisdistribution is governed by recent discharges from theSellafield site and the effects of activity previouslydischarged which had become associated with seabedsediments but is now being remobilised into the watercolumn. However the concentrations now observed areonly a small percentage of those prevailing in the late1970s, typically 30 Bq l-1 (Baxter et al., 1992), whendischarges were substantially higher.
17. RESEARCH IN SUPPORTOF THE MONITORINGPROGRAMME
MAFF has an extramural programme of specialsurveillance investigations and supporting research anddevelopment studies to complement the routinesurveillance undertaken. This additional work has thefollowing objectives:
• to evaluate the significance of potential sources ofradionuclide contamination of the foodchain;
• to identify and investigate specific topics notcurrently addressed by the routine surveillanceprogrammes and the need for their inclusion infuture routine surveillance;
• to develop and maintain site-specific habit andagricultural practice data, in order to improve therealism of dose assessment calculations;
• to develop more sensitive and/or efficient analyticaltechniques for measurement of radionuclides innatural matrices;
• to evaluate the competence of laboratoriesradiochemical analytical techniques for specificradionuclides in food;
• to develop improved methods for handling andprocessing surveillance data.
A list of related R & D projects completed in 1995 ispresented in Table 51. Copies of the final reports for eachof these projects are available from the MAFF library atNobel House. Table 51 also provides information onprojects which are currently underway. The results ofthese projects will be made available in due course.
18. REFERENCES
ATTWOOD, C.A., TITLEY, J.G.., SIMMONDS, J.R., AND
ROBINSON, C.A.,1996. Generalised derived limits forradioisotopes of strontium, ruthenium, iodine, caesium,plutonium, americium and curium. Docs. NRPB 7(1).NRPB, Chilton, 34pp.
BAXTER, A.J., CAMPLIN, W.C. AND STEELE, A.K., 1992.Radiocaesium in the seas of northern Europe: 1975-79.Fish. Res. Data Rep., MAFF Direct. Fish. Res.,Lowestoft, (28): 1-166.
BAXTER, A.J. AND CAMPLIN, W.C., 1993(a).Radiocaesium in the seas of northern Europe: 1970-74.Fish. Res. Data Rep., MAFF Direct. Fish Res.,Lowestoft, (30): 1-111.
BAXTER, A.J. AND CAMPLIN, W.C., 1993(b).Radiocaesium in the seas of northern Europe: 1962-69.Fish. Res. Data Rep., MAFF Direct. Fish. Res.,Lowestoft, (31): 1-69.
BAXTER, A.J. AND CAMPLIN, W.C., 1993(c).Radiocaesium in the seas of northern Europe: 1985-89.Fish. Res. Data Rep., MAFF Direct. Fish. Res.,Lowestoft, (32): 1-179.
BAXTER, A.J. AND CAMPLIN, W.C., 1994. The use ofcaesium-137 to measure dispersion from dischargepipelines at nuclear sites in the UK. Proc. Instn. Civ.Engrs. Wat., Marit. And Energy, 106: 281-288.
BRENK, H.D., ONISHI, Y., SIMMONDS, J.R. AND
SUBBARATNAM, T., (UNPUBLISHED). A practicalmethodology for the assessment of individual andcollective radiation doses from radionuclides in theenvironment. International Atomic Energy Authoritydraft working document no. 1987-05-06, Vienna.

41
BYROM, J., ROBINSON, C.A., SIMMONDS, J.R. AND
WALTERS, C.B.., 1995. Food consumption rates for usein generalised radiological dose assessments. J. Rad.Prot., 15(4) 335-342.
CAMPLIN, W.C., TIPPLE, J.R., DODDINGTON, T.C.,THURSTON, L.M. AND HILLER, R., 1990. A survey oftritium in sea water in Tees Bay, July 1986. Fish. Res.Data Rep., MAFF Direct. Fish. Res., Lowestoft, (23):
CAMPLIN, W.C AND STEELE, A.K., 1991. Radiocaesium inthe seas of northern Europe: 1980-84. Fish. Res. DataRep., MAFF Direct. Fish. Res., Lowestoft, (25): 1-174.
CAMPLIN, W.C., 1994. Radioactivity in surface andcoastal waters of the British Isles, 1993. Aquat.Environ. Monit. Rep., MAFF Direct. Fish. Res.,Lowestoft, (42): 1-107.
CAMPLIN, W.C., 1995. Radioactivity in surface andcoastal waters of the British Isles, 1994. Aquat.Environ. Monit. Rep., MAFF Direct. Fish. Res.,Lowestoft, (45): 1-111.
CAMPLIN, W.C., BAXTER, A.J. AND ROUND, G.D., (IN
PRESS). The radiological impact of discharges ofnatural radionuclides from a phosphate plant in theUnited Kingdom. Int. Environ.
COLLINS, C. AND OTLET, R., 1995. Carbon-14 levels inUK foodstuffs. MAFF Project B1408.
COTTER, A.J.R., MYATT, A., HUNT, G.J. AND WALTERS,C.B., 1992. Monitoring of radioactivity in the UKenvironment: an annotated bibliography of currentprogrammes. Fish. Res. Data Rep., MAFF Direct.Fish. Res., Lowestoft, (27): 1-51.
COMMISSION OF THE EUROPEAN COMMUNITIES, 1980.Council directive of 15 July 1980 amending thedirectives laying down the revised basic safetystandards for the health protection of the general publicand workers against the dangers of ionising radiation.Off. J. Eur. Commun., 23 (L246): 1-2.
DEPARTMENT OF THE ENVIRONMENT, 1996. Digest ofenvironmental statistics, (18): 1-226. DoE, London.
HMIP, 1995. Monitoring programme. RadioactiveSubstances Report for 1994. Her Majesty�sInspectorate of Pollution, London, 37 pp.
HUGHES, J.S., AND O�RIORDAN, M.C., 1993. Radiationexposure of the UK population - 1993 review.National Radiological Protection Board, Chilton, 61pp(NRPB-R263)
HUNT, G.J., 1984. Simple models for prediction ofexternal radiation exposure from aquatic pathways.Radiat. Prot. Dosim., 8: 215-224.
HUNT, G.J., 1985. Timescales for dilution anddispersion of transuranics in the Irish Sea nearSellafield. Sci. Total Environ., 46: 261-278.
HUNT, G.J., 1992. External doses to the public frombeta-emitters in the aquatic environment nearSpringfields and Sellafield, J. Radiol. Prot., 12(4):233-238.
HUNT, G.J., 1995. Radiation doses to critical groupssince the early 1950s due to discharges of liquidradioactive waste from Sellafield. In: �InternationalSymposium on Environmental Impact of RadioactiveReleases�. IAEA, Vienna, IAEA-SM-339/16.
HUNT, G.J. AND KERSHAW, P.J., 1990. Remobilisation ofartificial radionuclides in the sediment of the Irish Sea.J. Radiol. Prot., 10(2): 147-151.
HUNT, G.J., HEWITT, C.J. AND SHEPHERD, J.G., 1982. Theidentification of critical groups and its application tofish and shellfish consumers in the coastal area of thenorth-east Irish Sea. Hlth Phys., 43: 875-889.
HUNT, G.J., LEONARD, D.R.P. AND LOVETT, M.B., 1986.Transfer of environmental plutonium and americiumacross the human gut. Sci. Total Environ., 53: 89-109.
HUNT, G.J., LEONARD, D.R.P. AND LOVETT, M.B., 1990.Transfer of environmental plutonium and americiumacross the human gut. Sci. Total Environ., 90: 273-282.
HUNT, G.J.AND ALLINGTON, D.J., 1993. Absorption ofenvironmental polonium-210 by the human gut. J.Radiol. Prot. 13 (2), 119-126.
INTERNATIONAL ATOMIC ENERGY AGENCY, 1996.International basic safety standards for protectionagainst ionizing radiation and for the safety ofradiation sources. Saf. Ser. No. 115 Int. Atom. En.Ag., Vienna.
INTERNATIONAL COMMISSION ON RADIOLOGICAL PROTECTION,1977. Recommendations of the InternationalCommission on Radiological Protection. Annal. ICRP1(3). Pergamon Press, Oxford, 53pp. (ICRP Publ.(26)).
INTERNATIONAL COMMISSION ON RADIOLOGICAL PROTECTION,1991. 1990 Recommendations of the InternationalCommission on Radiological Protection. Annal. ICRP21 (1-3). Pergamon Press, Oxford, 201pp. (ICRP Publ.(60)).
INTERNATIONAL COMMISSION ON RADIOLOGICAL PROTECTION,1993. Principles for intervention for protection of thepublic in a radiological emergency. Annal. ICRP 22(4). Pergamon Press, Oxford, 30pp. (ICRP Publ. (63)).
INTERNATIONAL COMMISSION ON RADIOLOGICAL PROTECTION,1994. Age-dependent doses to members of the publicfrom intake of radionuclides: Part 2 Ingestion dosecoefficients. Annal. ICRP 23 (3/4). Pergamon Press,Oxford, 167pp. (ICRP Publ. (67)).

42
INTERNATIONAL COMMISSION ON RADIOLOGICAL PROTECTION,1995. Age-dependent doses to members of the publicfrom intake of radionuclides: Part 3 Ingestion dosecoefficients. Annal. ICRP 25(1). Pergamon Press,Oxford, 74pp. (ICRP Publ. (69))
KERSHAW, P.J. AND BAXTER, A.J., 1995. The transfer ofreprocessing wastes from north-west Europe to theArctic. Deep-Sea Res. II, 43 (6) 1413-1448.
KERSHAW, P.J., PENTREATH, R.J., WOODHEAD, D.S. AND
HUNT, G.J., 1992. A review of radioactivity in the IrishSea. Aquat. Environ. Monit. Rep., MAFF Direct. Fish.Res., Lowestoft, (32): 1-65.
KOCHER, D.C. AND ECKERMAN, K.F., 1987. Electrondose-rate conversion factors for external exposure ofthe skin from uniformly deposited activity on the bodysurface. Hlth. Phys., 53: 135-141.
LEONARD, D.R.P., 1984. Investigation of individualradiation exposures: comparative use of interview andlogging techniques in habits surveys of the Cumbriancoastal fishing community. Pp.763-766. In: A. Kaul,R. Neider, J. Pensko, F.-E. Stieve and H. Brunner(Eds.) �Radiation-Risk-Protection, Vol. II. Proc. 6thInt. Congr. Int. Radiat. Prot. Assoc., Berlin�.Fachverband für Strahlenschutz e.V., Julich.
LEONARD, D.R.P. AND HUNT, G.J., 1985. A study of fishand shellfish consumers near Sellafield: assessment ofthe critical groups including consideration of children.J. Soc. Radiol. Prot., 5: 129-139.
LEONARD, D.R.P., HUNT, G.J. AND JONES, P.G.W., 1982.Investigation of individual radiation exposures fromdischarges to the aquatic environment: techniques usedin habits surveys. pp. 512-517. In: �Proc. 3rd Int.Symp. Soc. Radiol. Prot., Inverness, 2� Society ofRadiological Protection.
LEONARD, D.R.P., CAMPLIN, W.C. AND TIPPLE, J.R.,1990. The variability of radiocaesiumconcentrations in freshwater fish caught in the UKfollowing the Chernobyl nuclear reactor accident: anassessment of potential doses to critical groupconsumers. pp. 247-256. In: �Proc. Int. Symp. onEnvironmental Contamination Following a MajorNuclear Accident�. IAEA, Vienna, IAEA-SM-306/15.
McKAY, W.A. et al., 1995. Site specific backgrounddose rates in coastal areas. DoE/HMIP/RR/94/037. HerMajesty�s Inspectorate of Pollution, London.
MINISTRY OF AGRICULTURE, FISHERIES AND FOOD, 1995.Terrestrial radioactivity monitoring programme(TRAMP) report for 1994. Radioactivity in food andagricultural products in England and Wales. MAFF,London, TRAMP/9, 223pp.
MINISTRY OF AGRICULTURE, FISHERIES AND FOOD, 1996.Removal of post-Chernobyl sheep controls in Cumbria.MAFF News Release, 15/96, London, 3pp 17 January1996.
MONDON, K.J., AND WALTERS, B., 1990. Measurementsof radiocaesium, radiostrontium and plutonium inwhole diets following deposition of radioactivity in theUK originators from the Chernobyl power plantaccident. Food Additives and Contaminants. 7 (6):837-848.
MUDGE, S.M., 1994. A survey of radioactivity in theRibble Estuary II: Radiological assessment. Env. SeriesRep. No. 3. Her Majesty�s Inspectorate of Pollution,London.
NATIONAL RADIOLOGICAL PROTECTION BOARD, 1990. Guttransfer factors. Docs. NRPB 1(2). NRPB, Chilton,26pp.
NATIONAL RADIOLOGICAL PROTECTION BOARD, 1993. Dosequantities for protection against external radiations.Docs. NRPB 4(3). NRPB, Chilton, 51pp.
ORGANISATION FOR ECONOMIC CO-OPERATION AND
DEVELOPMENT, NUCLEAR ENERGY AGENCY, 1985.Review of the continued suitability of the dumping sitefor radioactive waste in the North-East Atlantic.OECD, Paris, 448pp.
OSPAR, 1993a. OSPAR Convention. In: MinisterialMeeting of the Oslo and Paris Commissions, Paris 21-22 Sept. 1992, Annex 1, pp75-112. Oslo and ParisCommissions, London.
OSPAR, 1993b. North-Sea quality status report. Osloand Paris Commissions, London.
PENTREATH, R.J., CAMPLIN, W.C. AND ALLINGTON, D.J.,1989. Individual and collective dose rates fromnaturally-occurring radionuclides in seafood. Pp. 297-300. In: E. P. Goldfinch (Ed.), �Radiation ProtectionTheory and Practice, Proc. 4th Int. Symp. Soc. Radiol.Prot., Malvern, 4-9 June 1989�. Institute of Physics,Bristol and New York.
PHIPPS, A.W., KENDALL, G.M., STATHER, J.W. AND FELL,T.P., 1991. Committed equivalent organ doses andcommitted effective doses from intakes ofradionuclides. HMSO, London, 92pp (NRPB-R245).
PLAYFORD, K., TOOLE, J. AND SANDERS, T., 1995.Radioactive fallout in air and rain: results to the end of1993. DOE/RAS/94.004. DOE, London.
ROLLO, S.F.N., CAMPLIN, W.C., ALLINGTON, D.J. AND
YOUNG, A.K., 1992. Natural radionuclides in the UKmarine environment. In: �Proceedings of the FifthInternational Symposium on Natural RadiationEnvironment, Saltzburg, September 22-28, 1991�.Radiat. Prot. Dosim., 45, 1/4: 203-210.

43
ROLLO, S.F.N., CAMPLIN, W.C., DUCKETT, L., LOVETT,M.B. AND YOUNG, A.K., 1994. Airborne radioactivityin the Ribble Estuary. pp277-280. In: �Proc. IRPBRegional Congress on Radiological Protection, 6-10June 1994, Portsmouth, UK�. Nuclear TechnologyPublishing.
SCOTTISH OFFICE, 1996. Environmental monitoring forradioactivity in Scotland, 1989 to 1993. Env/1996/2.SO, Edinburgh, 78pp.
SIMMONDS, J.R., LAWSON, G. AND MAYALL, A., 1995.Radiation Protection 72; Methodology for assessingthe radiological consequences of routine releases ofradionuclides to the environment. Report EUR 15760EN. Office for Official Publications of the EuropeanCommunity, Luxembourg.
SMITH, D.M., BULLOCH, K.A., CLARK, I.E. AND GOW,C., 1994a. Environmental radioactivitysurveillance programme; results for 1992. NRPB-M457. National Radiological Protection Board,Chilton.
SPIERS, F.W., GIBSON, J.A.B. AND THOMPSON, I.M.G.,1981. A guide to the measurement of environmentalgamma-ray dose rate. National Physical Laboratory,Teddington, 107pp.
STEWART, T.H., FULKER, M.J. AND JONES, S.R., 1990. Asurvey of habits of people living close to the Sellafieldnuclear reprocessing plant. J. Radiol. Prot. 10, 115-122.
UNITED KINGDOM - PARLIAMENT, 1960. RadioactiveSubstances Act, 1960. HMSO, London, 28 pp.
UNITED KINGDOM - PARLIAMENT, 1965. NuclearInstallations Act, 1965. HMSO, London.
UNITED KINGDOM - PARLIAMENT, 1995a. Review ofRadioactive Waste Management Policy. HMSO,London, 55pp. (Cm 2919).
UNITED KINGDOM - PARLIAMENT, 1993. RadioactiveSubstances Act, 1993. HMSO, London, 44pp.
UNITED KINGDOM - PARLIAMENT, 1995b. EnvironmentAct, 1995. HMSO, London, 394pp.
WELSH OFFICE. Press Release reference WO W96016 of17 January 1996.
WILKINS, B.T., SIMMONDS, J.R. AND COOPER, J.R., 1994.Assessment of the present and future implications ofradioactive contamination of the Irish Sea coastalregion of Cumbria. HMSO, London, 231pp. (NRPB-R267).

44

45
Table 1. Principal discharges of liquid radioactive waste from nuclear establishments in Englandand Wales, 1995
Establishment Radioactivity Discharge limit Discharges during 1995(annualequivalent), TBq TBqa % of limitb
British Nuclear Fuels plc
Sellafieldc Alpha 1 0.397 40 Sea pipelines Beta 400 188 47
Tritium 1.8 104 2670 15Carbon-14 20.8 12.4 60Cobalt-60 13 1.28 9.9Strontium-90 48 27.7 58Zirconium-95+Niobium-95 9 0.743 8.3Technetium-99 200 192 96Ruthenium-106 63 7.26 12Iodine-129 1.3 0.253 19Caesium-134 6.6 0.511 7.7Caesium-137 75 12.2 16Cerium-144 8 1.10 14Plutonium alpha 0.7 0.311 44Plutonium-241 27 7.69 18Americium-241 1.3 0.112 37Uraniumd 2040 1345 66
Factory sewer Alpha 0.0033 4.3 10-5 1.3Beta 0.0135 8.2 10-4 6.1Tritium 0.132 0.0179 14
Drigg Sea pipeline Alpha 0.1 9.22 10-4 <1
Betae 0.3 0.0219 7.3Tritium 120 2.70 2.3
Streamf Alpha 9.0 10 4 65.9 <1Betae 1.2 10 6 5720 <1Tritium 6.0 10 8 2.6 10 5 <1
Springfields Alpha 4 0.115 2.9Beta 240 112 46Technetium-99 0.6 0.0301 5.0Thorium-230 2 0.0565 2.8Thorium-232 0.2 0.00159 <1Neptunium-237 0.04 1.9 10-4 <1Uranium 0.15 0.0477 32
Capenhurst Rivacre Brook Uranium 0.02 0.00181 9.1
Uranium daughters 0.02 0.0068 34Non-uranic alpha 0.003 1.01 10-4 3.4Technetium-99 0.1 0.00528 5.3
Meols outfall Technetium-99 0.148 Nil NilOthers 0.00148 � �
United Kingdom Atomic EnergyAuthority
Harwell (pipeline) Alpha 0.001 5.02 10-5 5.0Betae 0.02 0.00357 18Tritium 4 0.0612 1.5Cobalt-60 0.007 4.81 10-4 1.5Caesium-137 0.007 4.04 10-4 5.8
Harwell (Lydebank Brook) Alpha 5 10-4 4.59 10-5 9.2Betae 0.002 3.21 10-4 16Tritium 0.1 0.0302 30
Winfrith (inner pipeline) Alpha 0.3 0.00186 <1Tritium 650 0.770 <1Cobalt-60 10 0.00181 <1Zinc-65 6 1.51 10-4 <1Other radionuclides 80 0.0261 <1
Winfrith (outer pipeline) Alpha 0.004 1.54 10-4 3.8Tritium 1 0.0233 2.3Other radionuclides 0.01 2.41 10-4 2.4
Nuclear Electric plc
Berkeley Tritium 8 0.0395 <1Caesium-137 0.2 0.0403 20Other radionuclides 0.4 0.0934 23
Bradwell Tritium 30 2.08 6.9Caesium-137 0.75 0.366 49Other radionuclides 1 0.440 44

46
Table 1. continued
Establishment Radioactivity Discharge limit Discharges during 1995(annualequivalent), TBq TBqa % of limitb
Dungeness �A� Station Tritium 35 0.217 <1
Caesium-137 1.2 0.508 42Other radionuclides 1.4 0.294 21
�B� Station Tritium 650 15.1 2.3Sulphur-35 2 0.0203 1Cobalt-60 0.03 0.00259 8.6Other radionuclides 0.25 0.0249 9.9
Hartlepoolg Tritium 1850 139 13Sulphur-35 7.5 0.179 4.1Other radionuclides 4 0.00147 <1
Tritium 1200 98.4 20Sulphur-35 3 0.176 14Cobalt-60 0.03 0.00300 24Other radionuclides 0.3 0.00184 1.5
Heysham Station 1g Tritium 1850 131 12
Sulphur-35 7.5 0.0574 1.3Other radionuclides 4 0.00459 <1
Tritium 1200 120 24Sulphur-35 2.8 0.0552 4.7Cobalt-60 0.03 4.57 10-4 3.7Other radionuclides 0.3 0.00241 1.9
Station 2g Tritium 1200 214 31Sulphur-35 7 0.0433 1.1Cobalt-60 0.036 5.57 10-4 2.7Other radionuclides 0.45 0.00355 1.4
Tritium 1200 119 24Sulphur-35 2.3 0.0112 1.2Cobalt-60 0.03 3.25 10-4 2.6Other radionuclides 0.3 0.00520 4.2
Hinkley Point 'A' Station Tritium 25 0.756 3.0
Caesium-137 1.5 0.605 40Other radionuclides 1 0.376 38
'B' Stationh Tritium 650 81.5 50Sulphur-35 2 0.368 74Cobalt-60 0.035 4.3 10-5 <1Other radionuclides 0.25 0.00235 3.8
Tritium 620 350 75Sulphur-35 5 0.980 26Cobalt-60 0.033 3.61 10-4 1.5Other radionuclides 0.235 0.0138 7.8
Oldbury Tritium 25 0.232 1.0Caesium-137 0.7 0.048 6.8Other radionuclides 1.3 0.315 24
Sizewell�A� Station Tritium 35 6.69 19
Caesium-137 1.0 0.171 17Other radionuclides 0.7 0.223 32
�B� Station Tritium 40 10.7 27Other radionuclides 0.2 0.0172 8.6
Trawsfynydd Total activitye,i,j 0.72 0.0114 1.6Tritium 12 0.232 1.9Strontium-90 0.08 0.00198 2.5Caesium-137 0.05 0.0112 22
Wylfa Tritium 40 7.56 19Other radionuclides 0.15 0.0528 35
Ministry of Defence
Aldermaston (pipeline)k Alpha 1.5 10-4 6.60 10-6 4.4Tritium 0.05 0.0104 21Plutonium-241 6.0 10-4 2.64 10-5 4.4Other radionuclides 1.5 10-4 6.13 10-6 4.1
Aldermaston (Silchester) k Alpha 1.0 10-4 1.45 10-5 14Beta 3.0 10-4 5.86 10-5 20
Barrow l Tritium 0.02 4.90 10-4 2.5Manganese-54 2.5 10-7 5.57 10-9 2.2Cobalt-58 7.0 10-7 3.71 10-9 <1Cobalt-60 7.0 10-8 8.56 10-9 12Tin-113 2.5 10-7 6.47 10-9 2.6Antimony-124 2.0 10-6 3.99 10-9 <1Other radionuclides 3.5 10-6 1.03 10-8 <1

47
Table 1. continued
Establishment Radioactivity Discharge limit Discharges during 1995(annualequivalent), TBq TBqa % of limitb
Burghfieldk Alpha 2.0 10-6 2.13 10-8 1.1Other radionuclides 1.2 10-5 4.25 10-8 <1
Devonportm,n (sewer) Beta NilTritium �Cobalt-60 �
Devonportm,n (river) Beta �Tritium �Cobalt �
Devonport n,o (sewer) Total activity 6.13 10-4
Cobalt-60 5.20 10-4
Devonporto (pipeline) Total activitye,p 0.002 3.91 10-5 2.0Tritium 0.12 0.0603 50Cobalt-60 0.016 1.35 10-4 <1
Greenwich Beta 2.4 10-6
Amersham International plc
Amersham Alpha 3.0 10-4 5.32 10-5 18Beta >0.4 MeV 0.1 0.00936 9.4Tritium 0.2 0.00983 4.9Iodine-125 0.2 0.00117 <1Caesium-137 0.005 1.38 10-5 <1Other radionuclides 0.3 0.164 55
Cardiff q Beta/gammar 0.096 0.00208 13Tritium 1400 79 34Carbon-14 2 0.162 49
Tritium 900 379 51Carbon-14 2 1.09 65Phosphorus-32/33 0.01 7.3 10-5 <1Iodine-125 0.05 0.0145 35Others 5.0 10-4 1.8 10-4 46
Imperial College Reactor Centre
Ascot Tritium 1.0 10-4 8.71 10-6 9Other radioactivity 4.0 10-5 3.64 10-6 9
Imperial Chemical Industries plc
Billingham Beta/gamma 0.36 4.06 10-5 <1
Rolls Royce plc
Derby Alpha 0.00666 3.39 10-4 5.1
Universities Research Reactor Centre
Risleys Alpha 9.36 10-9
Beta 5.72 10-7
a Some discharges are upper estimates because they include �less than� data derived from analyses of effluents at limits of detection. Dataquoted to 3 significant figures except where fewer significant figures are provided in source documents
b Data quoted to 2 significant figures except when values are less than 1%c New limits came into effect from 1 January 1995 for total alpha, strontium-90, zirconium-95+niobium-95, ruthenium-106,
cerium-144, plutonium alpha and plutonium-241d The limit and discharge data are expressed in kge Excluding tritiumf Discharges and limits are expressed in terms of concentrations of activity in Bq m-3g Authorisation was revised with effect from August 1995. The first block of data relates to the period 1 January 1995 to 31 July 1995;
the second block of data relates to the period 1 August 1995 to 31 December 1995. �% limit� refers to equivalent limit for 7 and 5months respectively
h Authorisation was revised with effect from 1 April 1995. The first block of data relates to the period 1 January 1995 to 31 March 1995:the second block of data relates to the period 1 April 1995 to 31 December 1995. �% limit� refers to equivalent limit for 3 and 9 monthsrespectively
i Excluding caesium-137j Excluding strontium-90k Discharges are made by Hunting-BRAE Ltdl Discharges from Barrow are included with those from MoD sites because they are related to submarine activities. Discharges are made
by Vickers Shipbuilding and Engineering Ltdm Discharges are made by the Ministry of Defencen The authorisation includes a limit on concentration of total activity of 4 10-6 TBq m-3. At no time did the concentration exceed the limito Discharges are made by Devonport Management Ltdp Excluding cobalt-60q Authorisation was revised with effect from 1 March 1995. The first block of data relates to the period 1 January 1995 to 28 February
1995: the second block of data relates to the period 1 March 1995 to 31 December 1995. �% limit� refers to equivalent limit for 2 and10 months respectively
r Excluding tritium, carbon-14 and radioisotopes of calcium and strontiums The authorisation includes limits on concentrations of alpha and beta activity of 1.11 10-7 and 3.7 10-6 TBq m-3 respectively. At no time
did the concentrations exceed the limits

48
Table 2. Principal discharges of gaseous radioactive wastes from nuclear establishments in Englandand Wales, 1995
Establishment Radioactivity Discharge limit Discharges during 1995(annualequivalent), TBq TBq % of limit
British Nuclear Fuels plc
Sellafielda,b Alpha 0.0017 1.53 10-4 9.0Beta 0.048 0.00536 11Tritium 1400 590 42Carbon-14 8.4 0.71 8.5Sulphur-35 0.21 0.14 67Argon-41 3700 2400 65Cobalt-60 9.2 10-4 5.5 10-5 6.0Krypton-85 3.5 105 9.7 104 28Strontium-90 0.0016 9.5 10-5 5.9Ruthenium-106 0.046 8.0 10-4 1.7Antomony-125 0.005 0.001 20Iodine-129 0.067 0.020 30Iodine-131 0.055 0.0012 2.2Caesium-137 0.0073 6.1 10-4 8.4Plutonium (alpha) 8.4 10-4 5.3 10-5 6.3Plutonium-241 0.0051 7.6 10-4 15Americium-241 and curium-242 3.6 10-4 3.8 10-5 11
Springfieldsc Alpha d 6.63 10-4
Uranium 0.006 9.46 10-5 9.5Capenhurst Uranium 1.0 10-4 5.04 10-6 5.0
United Kingdom Atomic EnergyAuthority
Harwell Alpha 7.0 10-6 2.1 10-7 3.0Beta 4.5 10-4 6.3 10-6 1.4Tritium 150 8.43 5.6
Windscale Alpha 1.2 10-5 2.25 10-7 1.9Beta 0.005 6.98 10-6 < 1
Tritium 2.3 0.0376 1.6Krypton-85 14 0.202 1.4Iodine-131 0.0012 7.23 10-6 <1
Winfrith Alpha 2.0 10-6 6.0 10-9 <1Beta 2.5 10-5 1.8 10-8 <1Tritium 15 12.0 80Carbon-14 0.3 4.8 10-4 <1Krypton-85 150 0.061 <1
Nuclear Electric plce
Berkeley Technology Centre Alpha and beta 2.0 10-5 2.0 10-6 10
Power Station and Alpha and beta 2.0 10-4 2.10 10-6 1.1 Technology Centre Tritium 2 0.0109 <1
Carbon-14 0.2 5.26 10-4 <1Sulphur-35 0.006 6.47 10-8 <1
Bradwell Beta 0.001 1.56 10-4 16Tritium 1.5 1.27 85Sulphur-35 0.2 0.0427 21Carbon-14 0.6 0.363 61Argon-41 1000 662 66
Dungeness �A� Station Beta 0.001 3.8 10-4 38
Tritium 2 0.62 31Carbon-14 5 3.6 72Sulphur-35 0.4 0.093 23Argon-41 2000 1200 60
�B� Station Beta 0.001 1.2 10-5 1.2Tritium 15 2.4 16Carbon-14 5 0.16 3.2
Sulphur-35 0.45 0.0074 1.6Argon-41 150 6.9 4.6Iodine-131 0.005 3.3 10-6 <1
Hartlepool f Sulphur-35 7.5 0.0166 <1Argon-41 750 6.9 <1Iodine-131 0.5 1.0 10-4 <1
Beta 0.001 1.46 10-5 1.5Tritium 6 0.426 7.1Carbon-14 5 0.452 9.0Sulphur-35 0.16 0.0131 8.2Argon-41 60 3.73 6.2Iodine-131 0.005 9.17 10-5 1.8

49
Table 2. continued
Establishment Radioactivity Discharge limit Discharges during 1995(annualequivalent), TBq TBq % of limit
Heyshamg
Station 1 Sulphur-35 7.5 0.00916 <1Argon-41 750 11.8 1.6Iodine-131 0.5 7.16 10-4 1.4
Beta 0.001 1.99 10-5 4.8Tritium 6 0.72 29Carbon-14 4 0.37 22Sulphur-35 0.12 0.00753 15Argon-41 60 15.3 61Iodine-131 0.005 5.0 10-4 24
Station 2 Beta 0.006 1.73 10-5 <1Tritium 36 1.11 5.3Carbon-14 4 0.569 24Sulphur-35 1.8 0.00538 <1Argon-41 300 13.9 7.9Iodine-131 0.005 1.76 10-4 6.0
Beta 0.001 9.6 10-6 2.3Tritium 15 1.0 16Carbon-14 3 0.34 27Sulphur-35 0.3 0.0051 4.1Argon-41 85 8.6 24Iodine-131 0.005 1.1 10-4 5.3
Hinkley Point �A� Station Beta 0.001 1.57 10-4 16
Tritium 25 2.62 10Carbon-14 4 1.06 26Sulphur-35 0.2 0.0973 49Argon-41 4500 3200 71
�B� Station Beta 0.001 7.68 10-5 7.7Tritium 30 2.46 8.2Carbon-14 8 0.843 11Sulphur-35 0.4 0.0991 25Argon-41 300 41.8 14Iodine-131 0.005 1.95 10-5 <1
Oldbury Beta 0.001 1.01 10-4 10Tritium 5 1.89 38Carbon-14 6 3.75 63Sulphur-35 0.8 0.261 35Argon-41 500 250 50
Sizewell �A� Station Beta 0.001 3.43 10-4 34
Tritium 7 1.33 19Carbon-14 1.5 0.91 61Sulphur-35 0.6 0.185 31Argon-41 3000 1950 65
�B� Station (outlets 1-3) Nobel gases 295 4.15 1.4Halogens 0.0027 8.0 10-5 3.0Beta 0.01 1.92 10-5 0.2Tritium 7.8 0.141 1.8Carbon-14 0.59 0.0123 2.1
� (Approved places) Nobel gases 5 Nil NilHalogens 3.0 10-4 � �Tritium 0.2 0.003 1.5Carbon-14 0.01 Nil Nil
Trawsfynydd Beta 0.002 3.09 10-6 <1Tritium 10 0.156 1.6Carbon-14 5 0.00102 <1Sulphur-35 0.4 4.6 10-4 <1Argon-41 350 Nil Nil
Wylfa Beta 0.001 9.99 10-5 10Tritium 20 10.3 52Carbon-14 2.4 1.15 48Sulphur-35 0.5 0.259 52Argon-41 120 19.2 16
Ministry of Defence
Aldermastona Alpha 9.0 10-7 1.29 10-7 14Betah 4.6 10-6 1.21 10-7 2.6Tritium 340 4.47 1.3Krypton-85 0.4 4.8 10-3 1.2
Barrow i Tritium 3.2 10-6 NilArgon-41 0.08 �
Burghfielda Alpha 2.0 10-8 6.4 10-10 3Tritium 0.35 1.24 10-4 < 1Krypton-85 1 0.0082 < 1
Greenwichd Argon-41 0.057

50
Table 2. continued
Establishment Radioactivity Discharge limit Discharges during 1995(annualequivalent), TBq TBq % of limit
Amersham International plc
Amersham Alpha 2.0 10-6 6.1 10-7 31Other (penetrating) 0.05 1.7 10-4 <1
� Other (non-penetrating) 0.5 0.018 3.6Tritium 40 0.18 <1Selenium-75 0.03 0.0011 11Iodine-131 0.05 0.0044 8.8Radon-222 10 1.6 16
Cardiff j Soluble tritium 1000 30.3 18Soluble carbon-14 10 0.37 22Iodine-125 0.1 0.0017 7.0
Soluble tritium 400 149 45Insoluble tritium 1000 359 43Carbon-14 6 3.28 66Phosphorus-32/33 2.0 10-4 7.93 10-5 48Iodine-125 5.0 10-4 9.67 10-5 23Other activity 0.04 1.9 10-4 <1
Imperial College Reactor Centre
Ascot Tritium 5.0 10-4 1.89 10-4 38Argon-41 2.5 0.928 37
Imperial Chemical Industries plc
Billingham Tritium 2 0.098 4.9Argon-41 2 8.4 10-6 <1
Johnson and Johnson Clinical Diagnostics Ltdk
Cardiff Iodine-125 0.015 0.0044 39
Other activity 5.0 10-4 2.9 10-5 7.7
Rolls Royce plc
Derby Alpha d 1.0 10-6
University Research Reactor Centre
Risley Argon-41 d 2.0 10-9
URENCO
Capenhurst Uranium 2.5 10-6 2.7 10-8 1.1
a Discharge limits and discharges are aggregated from data for individual locations on the site. Percentages are given as a general guideto usage of the limits but should strictly be calculated for individual locations. All discharges were below the appropriate limit for eachlocation.
b Some limits are related to the operation of the THORP plant and may thus vary from year to yearc Authorisation was revised with effect from 1 November 1995. The first row of data relates to the period 1 January 1995 to 31 October
1995; the second row relates to the period 1 November 1995 to 31 December 1995. �% limit� refers to the equivalent limit for 2 monthsd There are no numerical limits for this discharge. However, the authorisation stipulates that the Best Practicable Means should be used
to control the dischargee Discharges are also authorised from incinerators at Nuclear Electric sitesf Authorisation was revised with effect from 15 August 1995. The first block of data relates to the period 1 January 1995 to 31 July 1995;
the second block of data relates to the period 1 August 1995 to 31 December 1995. �% limit� refers to equivalent limit for 7 and 5months respectively
g Authorisations were revised with effect from 10 August 1995. For each station, the first block of data relates to the period 1 January1995 to 31 July 1995; the second block of data relates to the period 1 August 1995 to 31 December 1995. �% limit� refers to equivalentlimit for 7 and 5 months respectively
h Excluding tritium and plutonium-241i Discharges from Barrow are included with those from MoD sites because they are related to submarine activities. Discharges are made
by Vickers Shipbuilding and Engineering Ltdj Authorisation was revised with effect from 1 March 1995. The first block of data relates to the period 1 January 1995 to 28 February
1995; the second block of data relates to the period 1 March 1995 to 31 December 1995. �% limit� refers to the equivalent limit for 2and 10 months respectively
k Authorisation took effect from 27 March 1995. �% limit� refers to the equivalent limit for 9 months

51
Table 4. Scope of the monitoring programmes
Programme Sub-programme Main purpose
Nuclear sitesa - Support for RSA 93, assessment of waste disposalGrass and soil Support for EURATOM Treaty
Industrial sitesb Chemical works Support for RSA 93, assessment of waste disposalLandfill sites �
Chernobyl fallout Sheep monitoring Support for FEPA 85,guidance on restrictions
Freshwater fish Support for FEPA 85, trend analysis
Regionalb Milk and crops General food safetyDiet �Isle of Man �Northern Ireland �Channel Islands �Seawater Support for OSPAR Convention
a The terrestrial parts of this programme, excluding most grass and soil sampling and all drycloth sampling, are known as TRAMP(Terrestrial Radioactivity Monitoring Programme)
b The terrestrial parts of these programmes are known as FARM (Food and Agriculture Monitoring Programme)
Table 3. Disposals of solid radioactive waste to Drigg, 1995
Radioactivity Disposal limit, Disposals during 1995TBq
TBq % of limit
Tritium 10 0.191 1.9
Carbon-14 0.05 0.00735 15Cobalt-60 2 0.297 15Iodine-129 0.05 0.00169 3.4
Radium-226 plus thorium-232 0.03 0.00356 12
Uranium 0.3 0.0214 7.1
Other alphaa 0.3 0.0836 28
Othersa,b 15 4.22 28
a With half-lives greater than three monthsb Other beta emitting radionuclides but including iron-55 and cobalt-60

52
Table 5. Scope of the nuclear site sampling in 1995*
Measurement Frequency of Analyses Types of material Detailed species/materialsmeasurement or measurements
Aquatic programme
Analysis of foods Annually to monthly Total beta, gamma Fish, crustaceans, molluscs, Cod, plaice, grey mullet, bass, dab, ray, herring, flounder, sea trout, dogfish,spectrometry, 3H, 14C, 35S, edible aquatic plants whitebait, fish oil, salmon, sole, spurdog, saithe, mackerel, haddock, crabs,90Sr, 99Tc, 147Pm, 134/137Cs lobsters, winkles, native oysters, mussels, limpets, whelks, cockles,Th, U, transuranics Nephrops, pacific oysters, shrimps, squid, scallops, queens, Porphyra
laverbread, samphire, pike, elvers, brown trout, rainbow trout, perch andspider crabs
Analysis of indicator Annually to weekly � Water, sediments, salt Fish meal, mud, sand, coal, clay, salt marsh, peat, turf, seawater, freshwater,materials marsh, seaweeds, aquatic Fucus spp., Rhodymenia spp., Fontinalis, Cladophoraceae spp.,
plants and coarse fish Elodia canadensis, Nupha lutea, rudd
Gamma dose rates Annually to monthly - On beaches, harbours, marshes -riverbanks, lakesides and boats
Beta dose rates Annually to quarterly - On nets, pots, sedimentsand saltmarsh
Contamination survey Annually to monthly - On beaches -
Terrestrial programmeAnalysis of foods Annually to monthly Total alpha, beta and gamma Milk, crops and animals Cows� and goats� milk, beef meat, kidney and liver, sheep meat and
gamma spectrometry offal, geese, eggs, hares, duck, rabbits, honey, mushrooms, hazelnuts,3H, organic 3H, 14C, 32P, 35S, oats, wheat, barley, rhubarb, elderberries, sloes, damsons, apples,45Ca, 90Sr, 99Tc, Ru, 131I, 129I, blackberries, strawberries, raspberries, cabbage, sea kale, lettuce,147Pm, Cs, 210Po, U, potatoes, green and runner beans, turnips, leeks, carrots, swede, sprouts,transuranics celery, spinach, peas and cauliflower
Analysis of indicator Annually to monthly � Grass, soil, faeces, dry Grass, soil, silage, animal faeces, rape, fodder beet, lucerne andmaterials cloths and animal food dry cloths
* The frequency of measurement, the types of analysis and the materials sampled vary from site to site. Not all analyses are carried out on all materials. Detailed information on the scope of the programmeat individual sites is given in the tables of results. The information in this table is for the programme related to nuclear sites in England and Wales. The routine programme is supplemented by additionalmonitoring when necessary, for example in relation to site incidents. The results of such monitoring are included in this report

53
Table 6. Analytical methods
Radionuclides Sample type Method of measurement
3H 3H (organic) 32P 35S 45Ca All Beta counting by liquid scintillation147Pm 241Pu
90Sr High-level aquatic samples Cerenkov counting by liquid scintillation
90Sr Terrestrial and low-level Beta counting using gas proportional detectorsaquatic samples
99Tc 210Pb All �
Beta Dry cloths �
Beta Aquatic samples �
103+106Ru 131I 144Ce 134+137Cs Terrestrial samples �
125I 129I Terrestrial samples Gamma counting by solid scintillation
134Cs 137Cs Seawater �
Gamma Dry cloths �
51Cr 54Mn 57Co 58Co 60Co 59Fe All Gamma spectrometry using65Zn 95Nb 95Zr 110mAg 125Sb germanium detectors134Cs 137Cs 144Ce 154Eu 155Eu241Am 233Pa 234Th
129I 131I Aquatic samples �
U Terrestrial samples Activation and delayed neutron counting
210Po 226Ra 234U 235+236U 238U All Alpha spectrometry237Np 228Th 230Th 238Pu239+240Pu 241Am 242Cm 243+244Cm
226Ra Terrestrial samples Alpha counting using thin windowproportional detectors
Alpha Dry cloths �

54
Table 7. Beta/gamma radioactivity in fish from the Irish Sea vicinity and further afield, 1995
Locationa Material No. of Mean radioactivity concentration (wet), Bq kg-1
samplingobserv- Totalationsb 14C 60Co 90Sr 99Tc 134Cs 137Cs 147Pm beta
Sellafield coastal area Cod 8 - * - - 0.11 17 - 190±0.12 ±0.5
� Plaice 4 - * - - 0.06 17 - 190±0.08 ±0.6
� Grey mullet 1 - * - - * 23 - -±0.3
� Bass 1 - * - - * 33 - -±0.7
Sellafield offshore area Cod 1 87 * 0.10 4.6 * 14 - -±8.3 ±0.01 ±0.4 ±0.5
� Plaice 1 110 0.09 0.11 23 0.08 11 * -±8.2 ±0.06 ±0.01 ±1.8 ±0.07 ±0.2
� Dab 1 - * - - * 13 - -±0.3
Ravenglass Cod 8 - * - - 0.05 14 - -±0.07 ±0.4
� Plaice 8 - 0.02 - - 0.01 9.9 - -±0.03 ±0.03 ±0.4
� Salmon 1 - * - - * 0.33 - -±0.11
Whitehaven Cod 4 53 * 0.051 - * 5.4 - -±7.8 ±0.003 ±0.2
� Plaice 4 - * 0.047 - * 7.3 - -±0.005 ±0.3
� Ray 4 - * - - * 7.5 - -±0.3
Parton Cod 4 - * - - 0.08 17 - -±0.08 ±0.4
Morecambe Bay (Flookburgh) Flounder 4 87 * - - 0.02 32 - -±8.8 ±0.03 ±0.7
� (Morecambe) Plaice 5 - * - - 0.03 10 - -±0.06 ±0.3
� � Bass 2 - * - - * 29 - -±0.4
� (Sunderland Point) Whitebait 1 - * 0.15 - * 8.4 - -±0.03 ±0.2
River Derwent Sea trout 1 - * - - * 7.1 - -±0.3
River Ehen � 1 - * - - * 3.6 - -±0.2
River Calder � 1 - * - - * 2.2 - -±0.3
Calder Farm Rainbow trout 1 - * - - * 480 - -±7.5
Fleetwood Cod 4 57 * - - * 8.8 - -±7.5 ±0.2
� Plaice 4 - * - - 0.01 8.8 - -±0.03 ±0.2
� Fish mealc 4 - * 0.20 - * 1.7 - -±0.02 ±0.3
� Fish oilc 4 - * - - * * - -Isle of Man Cod 4 - * - - * 3.6 - -
±0.2� Plaice 4 36 * - - * 2.6 - -
±8.3 ±0.2� Herring 3 - * - - * 2.4 - -
±0.1Inner Solway Flounder 4 50 * 0.042 1.0 * 28 - -
±8.3 ±0.003 ±0.1 ±0.8� Sea trout 1 - * - - * 3.3 - -
±0.5� Salmon 1 - * - - * 0.85 - -
±0.17Kirkcudbright Plaice 2 - * - - * 5.0 - -
±0.3North Anglesey Ray 4 - * - - * 2.0 - -
±0.1� Plaice 2 31 * - - * 1.8 - -
±9.1 ±0.1Ribble Estuary Flounder 1 - * - - * 12 - -
±0.3� Salmon 1 - * - - * 0.57 - -
±0.23� Sea trout 1 - * - - * 3.6 - -
±0.2

55
Table 7. continued
Locationa Material No. of Mean radioactivity concentration (wet), Bq kg-1
samplingobserv- Totalationsb 14C 60Co 90Sr 99Tc 134Cs 137Cs 147Pm beta
Northern Ireland Cod 7 22 * - - * 4.0 - -±6.8 ±0.1
� Whiting 6 - * - - * 5.2 - -±0.1
� Herring 1 - * - - * 1.4 - -±0.2
� Spurdog 8 - * - - * 4.0 - -±0.4
� Saithe 4 - * - - * 7.3 - -±0.3
Sound of Mull Salmon 1 - * - - * 1.8 - -±0.1
Minch Cod 4 - * - - * 1.2 - -±0.1
� Plaice 4 - * - - * 0.75 - -±0.07
� Mackerel 2 43 * 0.015 - * 0.29 - -±15 ±0.003 ±0.16
� Haddock 4 - * - - * 0.73 - -±0.09
� Herring 3 - * - - * 0.44 - -±0.11
Shetland Fish mealc 4 - * 0.032 - * 0.95 - -±0.002 ±0.45
� Fish oilc 4 - * - - * * - -
Northern North Sea Cod 3 - * 0.011 - * 0.56 - -±0.001 ±0.09
� Plaice 3 - * - - * 0.72 - -±0.08
� Herring 3 - * - - * 0.50 - -±0.12
� Haddock 3 32 * - - * 0.41 - -±8.0 ±0.07
Mid-North Sea Cod 4 - * 0.015 - * 0.75 - -±0.001 ±0.08
� Plaice 4 24 * 0.0094 - * 0.45 - -±8.4 ±0.0011 ±0.09
� Herring 3 - * - - * 0.71 - -±0.13
Southern North Sea Cod 2 - * 0.0079 - * 0.51 - -±0.0011 ±0.09
� Plaice 2 - * 0.0063 - * 0.31 - -±0.0010 ±0.07
� Herring 2 - * - - * 0.69 - -±0.15
English Channel Cod 2 - * 0.023 - * 0.52 - -±0.002 ±0.11
� Plaice 2 - * 0.021 - * 0.30 - -±0.002 ±0.06
� Mackerel 3 - * - - * 0.37 - -±0.10
Skagerrak Cod 3 - * - - 0.02 0.76 - -±0.03 ±0.07
� Herring 2 - * - - * 1.3 - -±0.1
Norwegian Sea Cod 1 - * - - * 0.32 - -±0.06
Iceland area � 1 - * - - * 0.26 - -±0.05
Icelandic processed � 1 16 * - - * 0.32 - -±7.0 ±0.08
Barents Sea � 4 - * - - * 0.47 - -±0.07
Baltic Sea � 2 - * - - 0.41 16 - -±0.14 ±0.3
� Herring 3 - * - - 0.22 7.1 - -±0.09 ±0.2
- not analysed* not detected by the method useda Sampling area or landing pointb See section 5 for definitionc Concentrations refer to weight of sample as supplied

56
Table 8. Beta/gamma radioactivity in shellfish from the Irish Sea vicinity and further afield, 1995
Locationa Material No. of Mean radioactivity concentration (wet), Bq kg-1
samplingobserv-ationsb 14C 60Co 65Zn 90Sr 95Zr 95Nb 99Tc 103Ru 106Ru
Sellafield coastal area Crabs 8 140 1.1 * 7.4 * * 140 * 1.2±11 ±0.2 ±0.2 ±14 ±0.9
� Lobsters 8 190 1.1 * 0.75 * * 8300 * 1.9±11 ±0.2 ±0.04 ±700 ±1.8
� Winklesc 4 140 4.6 * 3.6 * * 890 * 35±10 ±0.4 ±0.1 ±70 ±3.9
� Musselsc 4 - 2.8 * 2.6 * * - * 18±0.2 ±0.1 ±1.6
� Limpetsc 4 90 2.8 * 10 * * 2300 * 28±11 ±0.3 ±0.3 ±180 ±2.9
� Whelks 2 - 2.0 0.14 - * * - * 9.0±0.2 ±0.19 ±2.7
St Bees Winkles 4 140 5.9 * 8.5 * * 490 0.14 37±9.3 ±0.2 ±0.3 ±38 ±0.15 ±1.8
� Mussels 4 - 3.1 * - 0.12 0.25 - 0.14 34±0.2 ±0.09 ±0.11 ±0.09 ±2.0
� Limpets 4 - 1.9 * - * * - * 20±0.2 ±2.1
Nethertown Winkles 12 170 9.2 * 10 0.22 0.29 1600 0.05 44±10 ±0.4 ±0.3 ±0.22 ±0.39 ±140 ±0.06 ±3.4
� Mussels 4 290 4.5 * - 0.14 0.37 360 0.16 45±11 ±0.2 ±0.12 ±0.12 ±34 ±0.10 ±1.7
Whitriggs Shrimps 1 - 1.2 * - * * - * 3.0±0.2 ±2.0
Drigg Winkles 4 230 12 * - 0.20 0.33 2600 * 71±10 ±0.5 ±0.30 ±0.46 ±250 ±4.6
Ravenglass Mussels 4 - 3.9 * - * * 380 0.05 28±0.2 ±30 ±0.05 ±1.8
� Cockles 5 250 6.7 * 2.0 0.06 0.05 98 0.08 20±9.5 ±0.3 ±0.1 ±0.07 ±0.07 ±8.6 ±0.12 ±1.9
� Crabs 4 - 0.43 * 1.0 * * 25 * 0.73±0.16 ±0.1 ±2.1 ±0.97
� Lobsters 4 - 0.66 * 0.42 * * 4600 * *±0.19 ±0.02 ±410
Tarn Bay Winkles 4 - 5.7 * - 0.17 0.36 - 0.17 45±0.3 ±0.22 ±0.27 ±0.13 ±2.8
Saltom Bay � 4 - 2.6 * - * * - * 10±0.2 ±1.8
Whitehaven Nephrops 4 67 * * 0.14 * * 620 * *±7.6 ±0.03 ±53
Parton Winkles 4 - 2.7 * - * * - * 11±0.3 ±2.3
� Crabs 4 - 0.47 * - * * - * *±0.24
� Lobsters 4 - 0.14 * - * * - * *±0.10
Haverigg Cockles 2 - 3.4 * - * * - * 9.3±0.2 ±1.4
Millom Mussels 2 - 1.3 * - * * - * 6.3±0.2 ±1.3
Roosebeck Pacific oysters 4 - 0.39 * - * * - * 0.94±0.10 ±0.47
Morecambe Bay Shrimps 4 110 * * 0.12 * * 21 * *(Flookburgh) ±10 ±0.02 ±1.7
� Mussels 4 110 0.44 * - * * 250 * 1.6(Morecambe) ±9 ±0.08 ±20 ±0.6

57
Table 8. continued
Locationa Material No. of Mean radioactivity concentration (wet), Bq kg-1
samplingobserv- Totalationsb 110mAg 125Sb 134Cs 137Cs 144Ce 147Pm 154Eu 155Eu beta
Sellafield coastal area Crabs 8 8.3 0.09 * 3.6 0.04 0.46 0.01 * 210±0.5 ±0.20 ±0.2 ±0.07 ±0.02 ±0.02
� Lobsters 8 15 0.05 * 5.5 * 1.0 * * 6100±0.7 ±0.11 ±0.2 ±0.04
� Winklesc 4 14 1.9 * 21 0.57 1.7 0.33 * -±0.7 ±0.7 ±0.5 ±0.63 ±0.1 ±0.28
� Musselsc 4 * 1.6 * 4.7 0.32 - 0.45 0.13 -±0.4 ±0.2 ±0.36 ±0.24 ±0.16
� Limpetsc 4 19 6.5 * 22 1.1 - 0.58 * -±0.7 ±0.9 ±0.4 ±0.9 ±0.36
� Whelks 2 31 0.53 * 2.3 * - * * -±0.8 ±0.56 ±0.2
St Bees Winkles 4 29 2.5 * 18 1.0 2.5 0.45 0.27 -±0.5 ±0.4 ±0.2 ±0.4 ±0.1 ±0.24 ±0.15
� Mussels 4 1.3 2.0 * 4.4 0.85 - 0.22 * -±0.3 ±0.4 ±0.2 ±0.59 ±0.18
� Limpets 4 15 3.7 * 17 0.59 - 0.21 0.29 -±0.5 ±0.7 ±0.3 ±0.40 ±0.14 ±0.23
Nethertown Winkles 12 31 2.3 * 21 1.6 3.3 0.53 0.11 1700±0.9 ±0.7 ±0.4 ±0.8 ±0.1 ±0.35 ±0.17
� Mussels 4 0.90 2.3 * 5.6 1.3 - 0.43 0.12 470±0.21 ±0.4 ±0.2 ±0.5 ±0.30 ±0.14
Whitriggs Shrimps 1 1.4 * 0.48 17 * - * * -±0.4 ±0.17 ±0.3
Drigg Winkles 4 33 2.6 * 20 3.4 4.6 0.74 0.33 2300±1.0 ±0.9 ±0.5 ±1.3 ±0.2 ±0.39 ±0.43
Ravenglass Mussels 4 0.06 1.7 * 4.2 0.40 - 0.32 * -±0.08 ±0.4 ±0.2 ±0.47 ±0.21
� Cockles 5 1.3 0.89 * 7.5 0.89 - 0.87 0.39 270±0.3 ±0.35 ±0.2 ±0.50 ±0.40 ±0.25
� Crabs 4 4.1 * * 2.5 * - * * 120±0.5 ±0.2
� Lobsters 4 16 * * 4.7 * - * * 3300±0.7 ±0.3
Tarn Bay Winkles 4 19 1.6 * 20 1.3 - 0.57 0.19 -±0.6 ±0.6 ±0.4 ±0.6 ±0.26 ±0.26
Saltom Bay � 4 5.4 2.6 0.04 13 * - 0.15 0.20 -±0.3 ±0.5 ±0.09 ±0.3 ±0.18 ±0.17
Whitehaven Nephrops 4 0.31 * * 7.7 * - * * 530±0.2 ±0.2
Parton Winkles 4 6.2 1.2 * 18 * - 0.13 0.13 -±0.4 ±0.5 ±0.4 ±0.26 ±0.19
� Crabs 4 3.5 * * 3.5 * - * * -±0.5 ±0.3
� Lobsters 4 2.9 * * 5.2 * - * * -±0.3 ±0.2
Haverigg Cockles 2 * 0.45 * 7.0 0.30 - 0.28 0.17 -±0.28 ±0.2 ±0.31 ±0.21 ±0.16
Millom Mussels 2 * 0.49 * 2.6 0.35 - * * -±0.29 ±0.2 ±0.48
Roosebeck Pacific oysters 4 3.3 0.06 * 2.6 * - * * -±0.2 ±0.08 ±0.1
Morecambe Bay Shrimps 4 * * * 10 * - * * -(Flookburgh) ±0.3
� Mussels 4 * 0.35 * 3.0 * - * 0.05 -(Morecambe) ±0.16 ±0.1 ±0.10

58
Table 8. continued
Locationa Material No. of Mean radioactivity concentration (wet), Bq kg-1
samplingobserv-ationsb 14C 60Co 65Zn 90Sr 95Zr 95Nb 99Tc 103Ru 106Ru
Morecambe Bay (North-west) Mussels 2 - 0.39 * - * * - * 0.92
±0.11 ±0.45
� (North-west) � d 1 - 0.40 * - * * - * 2.2±0.08 ±0.7
� (Flookburgh) Cockles 2 110 0.98 * 0.71 * * 26 * 2.0±8.1 ±0.07 ±0.05 ±2.0 ±0.4
� (Middleton Sands) � 2 - 1.0 * - * * - * 1.3±0.1 ±0.5
Fleetwood Squid 1 - * * - * * - * *
� Whelks 4 55 0.10 * - * * - * 0.36±10 ±0.07 ±0.38
Isle of Man Scallops 3 - * * - * * - * *
Inner Solway Shrimps 4 - * * 0.16 * * 2.5 * *±0.01 ±0.2
Southerness Winkles 4 - 0.75 * 1.9 * * 430 * 1.9±0.14 ±0.1 ±34 ±1.1
Kirkcudbright Scallops 3 - 0.03 * - * * - * *±0.03
� Queens 4 - 0.02 * - * * - * *±0.03
North Solway coast Crabs 4 67 0.15 * 0.34 * * 14 * *±11 ±0.06 ±0.03 ±1.1
� Lobsters 4 59 0.05 * 0.08 * * 850 * *±10 ±0.08 ±0.03 ±66
� Winkles 4 - 0.78 * - * * - * 1.9±0.21 ±1.4
� Cockles 4 43 0.81 * 1.2 * * 18 * 1.5±5.7 ±0.07 ±0.05 ±1.5 ±0.4
� Mussels 4 - 0.36 * - * * - * 1.3±0.13 ±0.8
Wirral Shrimps 2 - * * - * * 4.7 * *±0.4
� Cockles 4 - 0.13 * - * * 60 * *±0.08 ±4.7
Conwy Mussels 2 - * * - * * - * *
Northern Ireland Nephrops 6 - * * - * * 42 * *±3.3
� Winkles 4 - 0.03 * - * * - * *±0.02
� Mussels 1 - * * - * * 22 * *±1.7
Minch Nephrops 4 - * * - * * - * *
Northern North Sea � 4 - * * - * * - * *
Mid North Sea Musselse 1 - * * - * * - * *
Southern North Sea Cockles 2 - 0.37 * - * * - * *±0.07
� � f 2 - 0.15 * - * * - * *±0.07
� Mussels 4 - * * - * * - * *

59
Table 8. continued
Locationa Material No. of Mean radioactivity concentration (wet), Bq kg-1
samplingobserv- Totalationsb 110mAg 125Sb 134Cs 137Cs 144Ce 147Pm 154Eu 155Eu beta
Morecambe Bay (North-west) Mussels 2 * 0.23 * 4.1 * - * 0.09 -
±0.14 ±0.2 ±0.09
� (North-west) � d 1 * 0.40 * 3.3 * - * * -±0.15 ±0.1
� (Flookburgh) Cockles 2 * 0.24 * 6.1 * - 0.24 * -±0.15 ±0.1 ±0.14
� (Middleton Sands) � 2 * 0.18 * 4.6 * - 0.08 0.06 -±0.12 ±0.1 ±0.11 ±0.06
Fleetwood Squid 1 * * * 1.8 * - * * -±0.2
� Whelks 4 0.47 * * 1.6 * - * * -±0.18 ±0.2
Isle of Man Scallops 3 * * * 0.72 * - * * -±0.09
Inner Solway Shrimps 4 0.08 * * 12 * - * * -±0.06 ±0.4
Southerness Winkles 4 2.0 0.61 * 12 * - 0.08 * -±0.3 ±0.35 ±0.2 ±0.13
Kirkcudbright Scallops 3 0.08 * * 0.47 * - * * -±0.06 ±0.05
� Queens 4 0.06 * * 0.44 * - * * -±0.04 ±0.09
North Solway coast Crabs 4 1.4 0.05 * 2.2 * - * * -±0.3 ±0.08 ±0.2
� Lobsters 4 1.2 * * 3.1 * - * * -±0.3 ±0.2
� Winkles 4 2.7 0.51 * 4.2 * - * * -±0.4 ±0.43 ±0.2
� Cockles 4 0.01 0.27 * 5.7 0.05 - 0.28 0.11 -±0.02 ±0.12 ±0.1 ±0.07 ±0.14 ±0.09
� Mussels 4 * 0.25 * 3.7 * - 0.04 * -±0.18 ±0.2 ±0.09
Wirral Shrimps 2 * * * 2.8 * - * * -±0.1
� Cockles 4 * * * 2.9 * - * * -±0.2
Conwy Mussels 2 * * * 0.60 * - * * -±0.09
Northern Ireland Nephrops 6 * * * 1.9 * - * * -±0.2
� Winkles 4 0.03 * * 0.60 * - * * -±0.04 ±0.16
� Mussels 1 * * * 0.82 * - * * -±0.41
Minch Nephrops 4 * * * 1.2 * - * * -±0.1
Northern North Sea � 4 * * * 0.19 * - * * -±0.11
Mid North Sea Musselse 1 * * * * * - * * 28
Southern North Sea Cockles 2 * * * * * - * * -
� � f 2 * * * 0.06 * - * 0.06 -±0.04 ±0.06
� Mussels 4 * * * 0.26 * - * * -±0.24
- not analysed c Samples collected by Consumer 116* not detected by the method used d Uncooked samplea Sampling area or landing point e Landed in Denmarkb See section 5 for definition f Landed in Holland

60
Table 9. Transuranic radioactivity in fish and shellfish from the Irish Sea vicinity and furtherafield, 1995
Locationa Material No. of Mean radioactivity concentration (wet), Bq kg-1
samplingobserv- 239Pu+ 243Cm+ationsb 237Np 238Pu 240Pu 241Pu 241Am 242Cm 244Cm
Sellafield coastal area Cod 2 - 0.0012 0.0058 - 0.0092 * 0.000052±0.0001 ±0.0002 ±0.0006 ±0.000026
� Plaice 1 - 0.0014 0.0067 - 0.014 * *±0.0001 ±0.0003 ±0.0005
� Crabs 2 0.010 0.094 0.43 8.1 1.9 0.0011 0.0010±0.001 ±0.005 ±0.01 ±0.3 ±0.1 ±0.0013 ±0.0008
� Lobsters 2 0.044 0.095 0.43 6.3 6.3 * 0.014±0.004 ±0.004 ±0.01 ±0.3 ±0.2 ±0.007
� Winklesc 1 0.061 2.0 10 130 19 0.027 0.041±0.005 ±0.1 ±0.3 ±3.9 ±0.4 ±0.024 ±0.014
� Musselsc 1 - 2.3 11 140 20 0.031 0.040±0.1 ±0.3 ±4.2 ±0.5 ±0.025 ±0.016
� Limpetsc 1 - 3.0 15 200 25 0.063 0.053±0.1 ±0.4 ±4.9 ±0.6 ±0.039 ±0.020
� Whelks 1 - 0.37 1.7 23 3.4 * 0.0062±0.02 ±0.05 ±0.7 ±0.1 ±0.0035
Sellafield offshore area Cod 1 - 0.0033 0.016 - 0.028 0.000046 0.000047±0.0001 ±0.0005 ±0.001 ±0.000033 ±0.000018
� Plaice 1 0.0022 0.015 0.072 - 0.11 * 0.00013±0.0003 ±0.001 ±0.002 ±0.004 ±0.00009
St Bees Winkles 1 0.082 3.4 17 220 31 0.072 0.056±0.008 ±0.2 ±0.4 ±5.4 ±0.7 ±0.047 ±0.020
� Mussels 2 - 1.6 7.7 110 14 0.015 0.025±0.1 ±0.2 ±3.0 ±0.4 ±0.011 ±0.011
� Limpets 1 - 2.9 13 - 23 0.037 0.076±0.1 ±0.3 ±0.6 ±0.027 ±0.024
Nethertown Winkles 4 0.087 4.5 21 280 37 0.095 0.064±0.008 ±0.2 ±0.5 ±7.2 ±0.9 ±0.067 ±0.027
� Mussels 4 - 2.1 9.7 - 18 0.028 0.040±0.1 ±0.3 ±0.5 ±0.019 ±0.016
Whitriggs Shrimps 1 - - - - 0.39 - -±0.13
Drigg Winkles 4 0.11 5.3 25 340 47 0.17 0.078±0.01 ±0.3 ±0.8 ±11 ±1.5 ±0.17 ±0.039
Ravenglass Cod 1 - 0.00093 0.0043 - 0.0062 * 0.000063±0.00007 ±0.0002 ±0.0005 ±0.000039
� Plaice 1 - 0.0018 0.009 - 0.016 * 0.000058±0.0001 ±0.00003 ±0.001 ±0.000022
� Crabs 1 - 0.050 0.24 3.6 1.1 0.0026 0.0024±0.002 ±0.01 ±0.3 ±0.03 ±0.0022 ±0.0011
� Lobsters 1 - 0.044 0.23 3.1 2.9 * 0.0059±0.006 ±0.02 ±0.2 ±0.1 ±0.0027
� Mussels 1 - 1.7 8.0 110 15 * 0.038±0.1 ±0.2 ±2.2 ±0.4 ±0.013
� Cockles 1 - 2.2 11 140 32 * 0.077±0.1 ±0.3 ±3.9 ±0.7 ±0.026
Tarn Bay Winkles 1 - 2.7 12 160 27 0.042 0.067±0.1 ±0.3 ±4.5 ±0.7 ±0.036 ±0.026
Whitehaven Cod 1 - 0.00035 0.0018 - 0.0034 * 0.0000090±0.00002 ±0.0001 ±0.0001 ±0.0000039
� Plaice 1 - 0.00064 0.0033 - 0.0060 * 0.000018±0.00005 ±0.0001 ±0.0003 ±0.000012
� Ray 1 - 0.00040 0.0020 - 0.0031 * *±0.00004 ±0.0001 ±0.0001
� Nephrops 1 - 0.030 0.16 - 0.65 * 0.0015±0.003 ±0.01 ±0.02 ±0.0007
Saltom Bay Winkles 4 - - - - 15 - -±0.6

61
Table 9. continued
Locationa Material No. of Mean radioactivity concentration (wet), Bq kg-1
samplingobserv- 239Pu+ 243Cm+ationsb 237Np 238Pu 240Pu 241Pu 241Am 242Cm 244Cm
Parton � 1 - 2.5 12 150 20 * 0.03±0.1 ±0.3 ±4.1 ±0.5 ±0.01
� Crabs 4 - - - - 0.74 - -±0.39
� Lobsters 4 - - - - 0.95 - -±0.46
Haverigg Cockles 1 - 1.4 7.1 - 20 * 0.042±0.1 ±0.2 ±0.6 ±0.018
Millom Mussels 1 - 0.61 2.9 - 5.7 0.0098 0.015±0.02 ±0.1 ±0.1 ±0.0064 ±0.005
Roosebeck Pacific 1 - 0.18 0.88 - 0.79 * 0.0014oysters ±0.01 ±0.04 ±0.02 ±0.0005
Morecambe Bay (Flookburgh) Flounder 1 - 0.00064 0.0033 - 0.0045 * 0.000011±0.00004 ±0.0001 ±0.0001 ±0.000004
� (Morecambe) Whitebait 1 - 0.024 0.13 1.5 0.18 * *±0.001 ±0.004 ±0.2 ±0.005
� (Flookburgh) Shrimps 1 - 0.0048 0.025 0.62 0.039 * 0.000068±0.0003 ±0.001 ±0.36 ±0.001 ±0.000037
� (Morecambe) Mussels 1 - 0.29 1.5 - 2.6 * 0.0072±0.02 ±0.04 ±0.1 ±0.0028
� (Flookburgh) Cockles 1 - 0.65 3.4 41 8.4 * 0.015±0.03 ±0.1 ±1.2 ±0.2 ±0.007
� (Middleton Sands) � 1 - 0.34 1.8 - 4.9 * 0.011±0.02 ±0.1 ±0.1 ±0.004
� (North-west) Mussels 1 - 0.25 1.3 - 2.3 * 0.0049±0.01 ±0.04 ±0.1 ±0.0022
� � � d 1 - - - - 2.2 - -±0.2
Fleetwood Cod 1 - 0.00021 0.0011 - 0.0022 * 0.0000030±0.00002 ±0.0001 ±0.0001 ±0.0000020
� Plaice 1 - 0.00065 0.0032 - 0.0058 * 0.00012±0.00004 ±0.0001 ±0.0002 ±0.00006
� Fish meale 1 - 0.0053 0.028 - 0.048 * *±0.0003 ±0.001 ±0.002
� Whelks 1 - 0.095 0.47 5.8 0.87 * 0.0015±0.005 ±0.01 ±0.5 ±0.03 ±0.0009
Isle of Man Cod 1 - 0.00051 0.0025 - 0.0046 * 0.00084±0.0004 ±0.0001 ±0.0002 ±0.00033
� Plaice 1 - 0.00015 0.0080 - 0.0016 * 0.0000040±0.00002 ±0.00005 ±0.0001 ±0.0000020
� Herring 1 - 0.00028 0.0014 - 0.0020 * *±0.00003 ±0.0001 ±0.0001
� Scallops 1 - 0.024 0.12 - 0.027 * *±0.001 ±0.004 ±0.001
Inner Solway Flounder 1 - 0.0038 0.020 - 0.031 0.000026 0.000051±0.0001 ±0.001 ±0.001 ±0.000014 ±0.000012
� Sea trout 1 - 0.00044 0.0021 - 0.0032 * 0.0000080±0.00005 ±0.0001 ±0.0002 ±0.0000059
� Shrimps 1 - 0.0036 0.019 - 0.032 * *±0.0002 ±0.001 ±0.001
Southerness Winkles 1 - 0.88 4.3 54 7.3 0.015 0.014±0.03 ±0.1 ±1.2 ±0.2 ±0.013 ±0.007
Kirkcudbright Plaice 1 - 0.00060 0.0032 - 0.0060 * 0.000012±0.00005 ±0.0001 ±0.0002 ±0.000006
� Scallops 1 - 0.016 0.085 - 0.060 * 0.00012±0.001 ±0.002 ±0.002 ±0.00006
� Queens 1 - 0.020 0.10 - 0.093 * 0.00015±0.001 ±0.004 ±0.003 ±0.00009

62
Table 9. continued
Locationa Material No. of Mean radioactivity concentration (wet), Bq kg-1
samplingobserv- 239Pu+ 243Cm+ationsb 237Np 238Pu 240Pu 241Pu 241Am 242Cm 244Cm
North Solway coast Crabs 1 - 0.033 0.16 2.0 0.93 * 0.0026±0.003 ±0.01 ±0.1 ±0.04 ±0.0014
� Lobsters 1 - 0.022 0.11 1.4 0.70 * 0.0016±0.002 ±0.01 ±0.1 ±0.03 ±0.0010
� Winkles 1 - 0.46 2.6 31 4.2 * 0.0081±0.03 ±0.1 ±1.0 ±0.1 ±0.0035
� Cockles 4 0.20 0.81 4.3 52 11 0.0020 0.021±0.02 ±0.05 ±0.1 ±1.7 ±0.3 ±0.0034 ±0.009
� Mussels 1 - 0.61 3.1 - 5.2 * 0.0072±0.03 ±0.1 ±0.1 ±0.0035
Wirral Cockles 1 - 0.16 0.85 - 2.1 0.0046 0.0074±0.01 ±0.03 ±0.1 ±0.0036 ±0.0028
Conwy Mussels 1 - 0.026 0.14 - 0.23 * 0.00066±0.002 ±0.005 ±0.01 ±0.00033
North Anglesey Rays 1 - 0.00010 0.00047 - 0.00081 * *±0.00002 ±0.00004 ±0.00005
Northern Ireland Whiting 1 - 0.00099 0.0055 - 0.0088 * 0.000015±0.00005 ±0.0002 ±0.0002 ±0.000006
� Nephrops 1 - 0.0067 0.037 - 0.093 * 0.00019±0.0004 ±0.001 ±0.003 ±0.00010
� Winkles 1 - 0.048 0.25 - 0.19 * 0.00034±0.002 ±0.01 ±0.01 ±0.00014
Minch Cod 1 - 0.00016 0.00086 - 0.0012 * 0.0000040±0.00002 ±0.00005 ±0.0001 ±0.0000020
� Haddock 1 - 0.00022 0.0012 - 0.0015 * 0.0000040±0.00002 ±0.0001 ±0.0001 ±0.0000020
� Mackerel 1 - 0.000017 0.000091 - 0.000044 * *±0.000008 ±0.000020 ±0.000014
� Nephrops 1 - 0.00091 0.0052 - 0.0084 * 0.000013±0.00007 ±0.0002 ±0.0003 ±0.000008
Shetland Fish meale 1 - 0.00066 0.0057 - 0.0013 * 0.000010±0.00004 ±0.0002 ±0.0001 ±0.000008
Northern North Sea Cod 1 - 0.000026 0.00015 - 0.00025 * *±0.000006 ±0.00002 ±0.00002
� Haddock 1 - 0.000039 0.00024 - 0.00024 * *±0.000010 ±0.00003 ±0.00003
� Nephrops 1 - 0.00015 0.0014 - 0.0016 * *±0.00003 ±0.0001 ±0.0001
Mid North Sea Musselsf 1 - 0.00019 0.0023 - 0.0011 * 0.0000080±0.00003 ±0.0001 ±0.0001 ±0.0000059
Southern North Sea Cockles 1 - 0.0020 0.0059 - 0.016 0.000097 0.0025±0.0001 ±0.0002 ±0.0005 ±0.000045 ±0.0001
� � g 1 - 0.0029 0.0093 - 0.011 0.000055 0.0012±0.0002 ±0.0004 ±0.0004 ±0.000041 ±0.0001
� Mussels 1 - 0.0031 0.019 - 0.0072 * *±0.0002 ±0.001 ±0.0003
Icelandic processed Cod 1 - 0.000056 0.00029 - 0.00043 * *±0.000012 ±0.00003 ±0.00003
- not analysed * not detected by the method useda Sampling area or landing pointb See section 5 for definitionc Samples collected by Consumer 116d Uncleansed samplee Concentrations refer to weight as suppliedf Landed in Denmarkg Landed in Holland

63
Table 10. Individual radiation exposures due to consumption of Irish Sea fish and shellfish, 1995
Exposed populationd Critical foodstuffs Nuclide Exposure mSva
Consumers in local fishing Plaice and cod 14C 0.003 community Crabs and lobsters 90Sr 0.003
Winkles and other molluscs 99Tc 0.018106Ru 0.003137Cs 0.007238Pu 0.005239+240Pu 0.027241Pu 0.007241Am 0.047Others <0.001Total 0.12
Consumers associated with Plaice and cod 14C 0.002 commercial fisheries: Nephrops 99Tc 0.009Whitehaven Whelks 137Cs 0.008
238Pu 0.001239+240Pu 0.006241Pu 0.001241Am 0.011Others <0.002Total 0.039
Consumers in Dumfries Plaice, cod and salmon 14C 0.001 and Galloway Crabs and Nephrops 99Tc 0.004
Winkles and cockles 137Cs 0.004238Pu 0.001239+240Pu 0.007241Pu 0.002241Am 0.013Others <0.001Totalb 0.053
Consumers in Morecambe Flounders and plaice 14C 0.004 Bay area Shrimps 99Tc 0.002
Cockles and mussels 137Cs 0.020238Pu 0.002239+240Pu 0.011241Am 0.020Others <0.002Totalc 0.073
Consumers associated Plaice and cod 14C 0.004 with commercial fisheries: Shrimps 99Tc 0.001 Fleetwood Whelks 137Cs 0.016
239+240Pu 0.003241Am 0.005Others <0.003Total 0.031
Typical member of the Plaice and cod 137Cs 0.001 fish-eating public Others <0.001 consuming fish landed at Total 0.002 Whitehaven/Fleetwood
a Due to artificial radionuclides: see text for exposures due to natural radionuclidesb Including exposure due to 1000 h year-1 occupancy over intertidal sedimentsc Including exposure due to 900 h year-1 occupancy over intertidal sedimentsd Representative of people most exposed unless stated otherwise

64
Table 11. Gamma radiation dose rates over areas of the Cumbrian coast and further afield, 1995
Location Ground type No. of sampling Mean gamma dose rate in air at 1 m,observationsa µGy h-1
Cumbria
Rockliffe Marsh Salt marsh 4 0.083Burgh Marsh � 4 0.097Port Carlisle Mud and sand 3 0.084� Mud, sand & stones 1 0.092Greenend Salt marsh 4 0.082� Mud and sand 2 0.072� Sand 2 0.071Cardurnock Marsh Salt marsh 4 0.10Newton Arlosh � 4 0.12Silloth - silt pond Grass 2 0.070� - boat area Mud and sand 2 0.099Allonby Sand 2 0.076Maryport - Christchurch Mud 4 0.11� - outer harbour � 4 0.11Siddick Sand 4 0.075Workington Harbour Mud 4 0.14Harrington Harbour Mud and sand 4 0.13Whitehaven - outer harbour � 12 0.10 � � Coal and sand 12 0.13Whitehaven - inner harbour Mud 1 0.37� � Mud and sand 11 0.27� - yacht basin Mud 11 0.26� � Mud and sand 1 0.29Fishing vessel A Cabinb 4 0.093� B � 4 0.085� R � 2 0.083� U � 4 0.089St Bees Sand 4 0.069Nethertown Winkle bed 4 0.10Sellafield Sand 4 0.074R. Calder (Pos. A) Mud, sand and stones 1 0.10� � (Pos. B) Grass 1 0.25� � (Pos. C) � 1 0.54� � (Pos. D) � 1 0.11� � (Pos. E) � 1 0.080Seascale Sand 4 0.071
Drigg pipeline � 8 0.070Drigg Barn Scar Mussel bed 4 0.097Saltcoats Salt marsh 4 0.22Muncaster Bridge � 4 0.22Ravenglass - Carleton Marsh � 4 0.26Ravenglass - salmon garth Mud and sand 4 0.14� � Sand and stones 4 0.086� � Mussel bed 4 0.092� - boat area Mud and sand 12 0.092� � Sand 4 0.065� - ford Mud and sand 4 0.11� - River Mite Salt marsh 4 0.23� - Ravenvilla Mud 1 0.12� � Mud and sand 11 0.12� � Salt marsh 12 0.24� - Eskmeals Nature Reserve � 4 0.25Newbiggin Mud 1 0.21� Mud and sand 3 0.21� Salt marsh 4 0.27� - west of bridge Mud, sand & stones 4 0.11� � Salt marsh 4 0.25Tarn Bay Sand 2 0.066Silecroft � 2 0.058Haverigg Mud 1 0.094� Mud and sand 4 0.083� Sand 3 0.067Millom Mud and sand 4 0.094Low Shaw Salt marsh 4 0.13Askham � 4 0.16Tummer Hill Marsh � 4 0.17Walney Channel Mud and sand 4 0.089� - Vickers shore Mud 1 0.10� � Mud and sand 3 0.080� - west shore Sand 4 0.060Roa Island Mud and sand 4 0.076Greenodd Salt marsh 2 0.086Sand Gate Marsh � 4 0.11Flookburgh Mud and sand 4 0.075High Foulshaw Salt marsh 4 0.094Arnside Mud and sand 4 0.069� Salt marsh 4 0.11

65
Table 11. continued
Location Ground type No. of sampling Mean gamma dose rate in air at 1 m,observationsa µGy h-1
Lancashire, Merseysideand North Wales
Sunderland Point Mud and sand 4 0.086Sunderland Mud, sand & stones 4 0.080Colloway Marsh Salt marsh 4 0.16Lancaster � 4 0.11Aldcliffe Marsh � 4 0.14Conder Green Mud 1 0.096� Mud and sand 3 0.10� Salt marsh 4 0.13Cockerham Marsh � 4 0.11Heads - River Wyre � 2 0.14Height o� th� hill - River Wyre � 4 0.14Hambleton Mud 3 0.12� Mud and sand 1 0.11� Salt marsh 4 0.13Fleetwood Sand 4 0.063� Docks Salt marsh 4 0.15Skippool Creek Mud 5 0.098� Mud and sand 2 0.12� (boat 1) Cabinb 3 0.074� (boat 2) � 2 0.085� (boat 3) � 3 0.075Blackpool Sand 4 0.053Crossen Marsh Mud 4 0.11� Salt marsh 4 0.11Ainsdale Sand 4 0.052New Brighton Mussel bed 4 0.071West Kirby Mud and sand 2 0.060Rock Ferry Mud 3 0.091� Mud and sand 1 0.093Little Neston Marsh � 2 0.077� Salt marsh 2 0.084Flint Mud 4 0.092� Salt marsh 4 0.12Prestatyn Sand 2 0.054Rhyl Mud and sand 2 0.071Llandudno Gravel 2 0.080Caerhun Salt marsh 2 0.097Llanfairfechan � 2 0.080
South-west Scotland
Piltanton Burn Salt marsh 4 0.076Garlieston Mud 3 0.090� Mud and sand 1 0.080Innerwell Mud 3 0.085� Mud and sand 1 0.087Bladnoch Mud 4 0.095Creetown Salt marsh 4 0.13Carsluith Mud 3 0.082� Mud and sand 1 0.077Skyreburn Bay (Water of Fleet) Salt marsh 4 0.091Cumstoun � 4 0.12Kirkcudbright � 4 0.10Cutters Pool Winkle bed 2 0.085Rascarrel Bay � 2 0.11Palnackie Harbour Mud 4 0.096Gardenburn Salt marsh 4 0.13Kippford - Slipway Mud and sand 4 0.089� - Merse Salt marsh 4 0.15Carsethorn Mud 1 0.10� Mud and sand 3 0.085Glencaple Harbour � 4 0.085
a See section 5 for definitionb In the cabin of a boat or houseboat

66
Table 12. Radioactivity in sediment from the Cumbrian coast and further afield, 1995
Location Material No. of Mean radioactivity concentration (dry), Bq kg-1
samplingobserva-tionsa 60Co 95Zr 95Nb 106Ru 110mAg 125Sb 134Cs 137Cs 144Ce 154Eu
Cumbria
Newton Arlosh Turf 4 2.9 * * * * * 1.6 990 * 4.7±1.1 ±1.3 ±8.8 ±3.0
Maryport - Christchurch Mud 4 18 * * 140 * 8.8 0.42 720 13 14±2.2 ±23 ±5.5 ±0.67 ±8.9 ±7.9 ±6.0
Harrington Harbour � 4 12 * * 96 * 6.8 1.3 530 8.8 11±1.9 ±18 ±4.3 ±1.2 ±6.6 ±6.7 ±3.5
Whitehaven - yacht basin � 4 9.0 * * 110 * 7.6 2.2 1100 3.5 16±1.5 ±19 ±4.7 ±1.5 ±8.2 ±4.7 ±3.7
Whitehaven - outer harbour Sand 1 1.0 * * 5.3 * * * 140 * 1.9±0.5 ±5.0 ±2.1 ±1.9
St Bees � 4 2.0 * * * * * * 98 * 1.8±0.5 ±1.4 ±0.9
Sellafield � 4 2.2 * * 2.9 * 0.80 * 130 * 3.8±0.4 ±2.5 ±0.71 ±1.3 ±1.3
River Calder (Pos. A) Mud & sand 1 * * * * * * 2.2 130 * *±1.2 ±2.8
� (Pos. B) Mud 1 30 * * 41 * * 8.1 570 14 3.9±2.7 ±21 ±2.1 ±7.5 ±8.4 ±2.3
� (Pos. C) � 1 400 * * * * 9.3 24 3400 * 10±7.4 ±9.1 ±3.9 ±16 ±5.6
� (Pos. D) � 1 830 * * * * * 8.4 670 * *±9.6 ±3.9 ±7.8
� (Pos. E) � 1 1.2 * * * * * * 45 * *±0.5 ±1.5
Seascale Sand 4 1.3 * * * * 0.38 * 82 * 2.7±0.4 ±0.51 ±1.2 ±1.1
Drigg - N of pipeline � 4 2.1 * * 6.2 * 1.0 * 74 * 3.4±0.6 ±4.1 ±1.1 ±1.4 ±1.6
River Mite estuary Mud 4 12 1.1 0.88 160 * 9.3 * 410 18 14±1.7 ±1.4 ±1.5 ±19 ±4.5 ±5.5 ±8.1 ±4.5
Ravenglass - Carleton Marsh � 4 38 2.6 3.3 590 2.2 19 1.9 880 58 27±1.8 ±1.5 ±1.4 ±21 ±1.6 ±5.1 ±1.4 ±6.0 ±8.5 ±3.5
� - Ravenvilla Mud & sand 4 12 0.78 1.1 130 * 11 * 330 16 11±1.5 ±0.86 ±1.0 ±15 ±4.7 ±4.7 ±7.6 ±3.4
Newbiggin Mud 4 14 * * 160 * 10 0.41 430 19 12±1.1 ±13 ±3.7 ±0.39 ±4.0 ±6.5 ±2.5
Millom Mud & sand 4 3.8 * * 32 * 1.9 * 210 2.2 3.7±0.7 ±8.5 ±1.2 ±2.9 ±2.4 ±1.9
Low Shaw Turf 4 3.0 * * 8.8 * * 2.7 700 * 9.5±1.1 ±10 ±1.2 ±7.1 ±4.0
Flookburgh Mud and sand 4 * * * * * * * 110 * *±1.6
Sand Gate marsh Turf 4 1.0 * * * * * * 250 * *±0.8 ±3.7
Lancashire, Merseyside and north Wales
Sunderland Point Mud & sand 4 2.9 * * 11 * 1.7 0.35 210 * 0.84±0.7 ±5.8 ±1.5 ±0.60 ±2.4 ±1.1
Conder Green Turf 4 2.0 * * * * 3.4 0.51 590 * 2.3±1.1 ±3.1 ±0.83 ±8.0 ±3.1
Hambleton � 4 3.1 * * * * 3.1 1.6 1300 * 5.9±1.3 ±3.2 ±1.5 ±10 ±3.5
Skippool Creek Mud 4 2.7 * * 9.4 * 4.4 1.5 550 * 3.3±1.1 ±7.2 ±4.0 ±1.2 ±6.6 ±2.7
Fleetwood Sand 4 * * * * * * * 25 * *±0.8
Blackpool � 4 * * * * * * * 8.7 * *±0.6

67
Table 12. continued
Location Material No. of Mean radioactivity concentration (dry), Bq kg-1
samplingobserva- 155Eu 238Pu 239Pu+ 241Pu 241Am 242Cm 243Cm+ Totaltionsa 240Pu 244Cm beta
Cumbria
Newton Arlosh Turf 4 * - - - 260 - - -±13
Maryport - Christchurch Mud 4 5.6 100 500 - 800 0.44 1.6 -±4.1 ±4.1 ±11 ±16 ±0.38 ±0.5
Harrington Harbour � 4 3.0 - - - 550 - - -±2.5 ±13
Whitehaven - yacht basin � 4 8.6 100 510 - 800 * 1.9 2900±5.3 ±4.1 ±11 ±20 ±0.7
Whitehaven - outer harbour Sand 1 * - - - 180 - - 660±3.3
St Bees � 4 0.25 - - - 160 - - -±0.46 ±3.9
Sellafield � 4 1.2 - - - 210 - - -±0.9 ±3.7
River Calder (Pos. A) Mud & sand 1 2.8 - - - * - - -±2.0
� (Pos. B) Mud 1 * - - - 16 - - -±2.8
� (Pos. C) � 1 7.7 - - - 180 - - -±5.6 ±9.8
� (Pos. D) � 1 * - - - 38 - - -±11
� (Pos. E) � 1 * - - - 6.6 - - -±3.6
Seascale Sand 4 1.2 - - - 170 - - -±0.9 ±3.6
Drigg - N of pipeline � 4 1.9 - - - 210 - - -±1.2 ±3.6
River Mite estuary Mud 4 6.1 100 470 6100 730 * 2.0 -±3.6 ±5.4 ±15 ±170 ±18 ±0.7
Ravenglass - Carleton Marsh � 4 13 - - - 1500 - - -±3.8 ±14
� - Ravenvilla Mud & sand 4 4.7 - - - 580 - - -±3.3 ±10
Newbiggin Mud 4 5.7 96 460 5800 700 0.81 1.9 1500±3.1 ±3.9 ±11 ±130 ±17 ±0.64 ±0.6
Millom Mud & sand 4 1.8 - - - 200 - - -±1.2 ±7.1
Low Shaw Turf 4 0.77 - - - 520 - - -±1.5 ±12
Flookburgh Mud and sand 4 0.50 - - - 39 - - -±0.59 ±2.7
Sand Gate marsh Turf 4 * - - - 82 - - -±4.6
Lancashire, Merseyside and north Wales
Sunderland Point Mud & sand 4 2.5 - - - 87 - - -±1.2 ±3.6
Conder Green Turf 4 3.0 - - - 230 - - -±3.2 ±11
Hambleton � 4 5.2 - - - 360 - - -±4.1 ±12
Skippool Creek Mud 4 * - - - 230 - - -±12
Fleetwood Sand 4 * - - - 17 - - -±2.5
Blackpool � 4 * - - - 3.9 - - -±0.9

68
Table 12. continued
Location Material No. of Mean radioactivity concentration (dry), Bq kg-1
samplingobserva-tionsa 60Co 95Zr 95Nb 106Ru 110mAg 125Sb 134Cs 137Cs 144Ce 154Eu
Lancashire, Merseyside and north Wales continued
New Brighton Mud & sand 1 * * * * * * * 29 * *±0.7
� Sand 1 * * * * * * * 7.9 * *±0.6
Rock Ferry Mud 4 * * * * * * * 290 * 0.71±5.2 ±1.2
Rhyl � 2 * * * * * 1.7 * 87 * *±1.1 ±1.3
Caerhun Turf 2 * * * * * * 0.80 260 * *±0.86 ±4.5
Cemlyn Bay Mud 2 * * * * * * * 180 * *±3.1
Llanfairfechan Turf 2 * * * * * * 0.76 150 * *±0.85 ±3.4
South-west Scotland
Garlieston Mud 4 2.3 * * 20 * 2.4 * 260 * 6.4±1.1 ±12 ±2.8 ±4.9 ±3.6
Innerwell � 2 2.7 * * 25 * 1.7 * 270 * 3.8±1.5 ±11 ±1.7 ±3.9 ±2.5
Bladnoch � 4 3.3 * * 25 * 3.7 0.91 470 * 6.1±0.9 ±8.3 ±2.5 ±0.84 ±3.9 ±2.1
Carsluith � 4 2.6 * * 21 * 2.9 0.36 270 * 4.2±1.0 ±9.0 ±2.3 ±0.57 ±3.8 ±2.2
Kippford Merse Salt marsh 4 3.6 * * 37 * 2.9 0.25 550 * 6.8±1.4 ±17 ±2.5 ±0.37 ±6.4 ±3.4
� Slipway Mud 4 2.2 * * 28 * 2.6 0.56 280 3.0 2.8±0.9 ±13 ±3.3 ±0.98 ±4.8 ±5.4 ±2.4
Palnackie Harbour � 4 3.0 * * 26 * 1.2 * 320 * 3.4±1.1 ±12 ±1.1 ±4.8 ±2.3
Carsethorn � 2 2.5 * * 25 * 2.1 0.80 430 * 4.8±0.9 ±7.2 ±2.6 ±0.69 ±4.6 ±2.2
Isle of Man
Douglas � 1 * * * * * * * 13 * *±0.7
Northern Ireland
Lough Foyle � 2 * * * * * * * 2.4 * *±1.0
Portrush Sand 2 * * * * * * * 1.1 * *±0.4
Ballymacormick Mud 2 * * * * * * * 55 * *±1.2
Strangford Lough � 2 * * * * * * * 35 * - Nickey�s Pt ±1.1
Dundrum Bay � 1 * * * * * * * 10 * *±0.8
� Mud & sand 1 * * * * * * * 10 * *±0.7
Carlingford Lough Mud 2 * 0.81 * * * * * 120 * *±0.70 ±1.8
Oldmill Bay � 2 * * * * * * * 54 * *

69
Table 12. continued
Location Material No. of Mean radioactivity concentration (dry), Bq kg-1
samplingobserva- 155Eu 238Pu 239Pu+ 241Pu 241Am 242Cm 243Cm+ Totaltionsa 240Pu 244Cm beta
Lancashire, Merseyside and north Wales continued
New Brighton Mud & sand 1 * - - - 12 - - -±2.1
� Sand 1 * - - - 2.6 - - -±0.6
Rock Ferry Mud 4 0.74 - - - 79 - - -±1.4 ±5.8
Rhyl � 2 0.92 - - - 26 - - -±0.65 ±1.7
Caerhun Turf 2 1.9 - - - 57 - - -±1.7 ±5.7
Cemlyn Bay Mud 2 * 4.2 23 - 33 * 0.061 -±0.3 ±0.8 ±0.9 ±0.027
Llanfairfechan Turf 2 * - - - 31 - - -±4.6
South-west Scotland
Garlieston Mud 4 2.9 27 130 - 210 * 0.52 -±2.8 ±1.1 ±2.9 ±6.1 ±0.22
Innerwell � 2 2.7 - - - 240 - - -±2.0 ±6.4
Bladnoch � 4 4.3 - - - 320 - - -±2.4 ±7.8
Carsluith � 4 2.6 25 120 - 190 * 0.34 1100±2.0 ±1.7 ±4.4 ±6.7 ±0.21
Kippford Merse Salt marsh 4 2.9 54 260 - 400 * 0.96 -±2.6 ±3.0 ±7.9 ±12 ±0.41
� Slipway Mud 4 2.7 16 83 - 140 * 0.14 -±3.3 ±1.1 ±2.9 ±3.9 ±0.09
Palnackie Harbour � 4 3.0 30 150 - 240 * 0.54 -±2.6 ±2.0 ±5.4 ±7.0 ±0.24
Carsethorn � 2 * - - - 220 - - -±6.7
Isle of Man
Douglas � 1 1.1 - - - 1.2 - - -±0.8 ±0.6
Northern Ireland
Lough Foyle � 2 0.91 0.66 3.9 - 4.2 * 0.010 -±0.75 ±0.04 ±0.1 ±0.2 ±0.005
Portrush Sand 2 * - - - * - - -
Ballymacormick Mud 2 2.2 2.8 15 - 20 * 0.065 -±1.3 ±0.1 ±0.3 ±0.7 ±0.027
Strangford Lough � 2 1.9 0.91 4.9 - 5.0 * * - - Nickey�s Pt ±1.1 ±0.06 ±0.2 ±0.2
Dundrum Bay � 1 * - - - * - - -
� Mud & sand 1 * - - - 0.83 - - -±0.63
Carlingford Lough Mud 2 0.72 2.2 13 - 7.7 * 0.012 -±0.77 ±0.1 ±0.4 ±0.2 ±0.007
Oldmill Bay � 2 * 1.8 9.7 - 13 * 0.019 -±0.1 ±0.3 ±0.4 ±0.009
- not analysed* not detected by the method useda See section 5 for definition

70
Table 13. Beta radiation dose rates on contact with fishing gear onvessels operating off Sellafield, 1995
Vessel Type of gear No. of sampling Mean beta dose rate inobservationsa tissue, µSv h-1
A Nets 4 0.19Ropes 4 *
B Nets 5 0.15Ropes 5 0.27
D Gill nets 4 0.16Pots 1 0.15
E Gill nets 4 0.041Nets 3 0.27
R Nets 4 0.091
S Pots 1 *Nets 1 *
T Gill nets 4 0.052Pots 1 0.23
U Nets 4 0.17Ropes 4 *
a See section 5 for definition* Not detected by the method used

71
Table 14. Radioactivity in aquatic plants from the Cumbrian coast and further afield, 1995
Locationa Material No. of Mean radioactivity concentration (wet), Bq kg-1
samplingobserv-ationsb 14C 60Co 90Sr 95Zr 95Nb 99Tc 103Ru 106Ru 110mAg 125Sb 129I 131I 134Cs
EnglandSt Bees Fucus vesiculosus 4 61 3.6 3.6 0.12 0.06 21000 * 2.9 2.1 1.8 4.5 * 0.05
±4.8 ±0.1 ±0.2 ±0.11 ±0.13 ±1800 ±0.8 ±0.2 ±0.3 ±1.2 ±0.07
� Porphyra 4 83 0.81 0.18 * * 17 * 19 0.07 1.4 - * *±4.3 ±0.14 ±0.01 ±1.3 ±1.4 ±0.12 ±0.3
� Rhodymenia spp. 2 - 2.3 - 0.29 * - * 21 1.2 0.53 - * 0.23±0.2 ±0.20 ±1.4 ±0.2 ±0.25 ±0.10
Braystones south Porphyra 4 - 1.0 - * * - 0.13 26 0.40 1.7 - * *±0.1 ±0.09 ±1.3 ±0.17 ±0.3
Sellafield Fucus vesiculosus 4 - 7.0 4.1 0.11 * 56000 * 6.3 4.6 2.2 - * 13±0.3 ±0.1 ±0.12 ±4500 ±1.8 ±0.4 ±0.4 ±0.15
Seascale Porphyra 52c - 1.3 - * * - 0.01 29 0.07 1.8 - * *±2.6 ±0.02 ±57 ±0.13 ±3.6
River Calder (Pos. A)Fontinalis 1 - 0.57 - * * - * * * * - * *±0.31
River Calder (Pos. B) � 1 - 1.8 - * * - * * * 0.33 - * *±0.1 ±0.24
River Calder (Pos. C) � 1 - 3.7 - * * - * 3.7 * 0.50 - * 0.76±0.2 ±1.6 ±0.36 ±0.18
River Calder (Pos. D) � 1 - 2.2 - * * - * * * * - * *±0.3
River Calder (Pos. E) � 1 - 2.6 - * * - * * * * - * 0.83±0.6 ±0.65
Rabbit Cat How, Ravenglass Samphire 1 - * - * * 1.4 * * * * - * *
±0.1
Cockerham Marsh � 1 - 0.02 - * * - * * * * - * *±0.02
WalesPortmadoc Fucus vesiculosus 1 - * - * * - * * * * - * *
Fishguard � 1 - * - * * 2.6 * * * * - * *±0.2
Lavernock Point Fucus serratus 2 - * - * * - * * * * - 2.4 *±0.2
South Wales, Manufacturer A Laverbread 4 - * - * * - * * * * - * *
Manufacturer C � 4 - * - * * - * * * * - * *
Manufacturer D � 4 - * - * * - * * * * - * *
ScotlandPort William Fucus vesiculosus 4 - 0.08 - * * 1500 * * * 0.15 - * *
±0.06 ±120 ±0.09
Garlieston � 4 - 0.46 - * * 2800 * 0.18 0.03 0.22 - * *±0.13 ±220 ±0.32 ±0.06 ±0.15
Auchencairn � 4 - 0.46 - * * 4100 * * 0.12 0.57 - * *±0.13 ±330 ±0.10 ±0.28
Knock Bay Porphyra 4 - 0.02 - * * 1.2 * 0.12 * * - * *±0.01 ±0.1 ±0.15
Cape Wrath Fucus vesiculosus 1 - * - * * 86 * * * * - * *±6.8
Wick � 1 - * - * * - * * * * - * *
Northern IrelandArdglass � 4 - * - * * 310 * * * * - * *
±24
Portrush Fucus serratus 3 - 0.01 - * * - * * * * - * *±0.02
Strangford Lough Rhodymenia spp. 4 - * - * * 38 * * * * - * *±3.0
Isles of Scilly Fucus vesiculosus 1 - * - * * 0.84 * * * * - * *±0.08

72
Table 14. continued
Locationa Material No. of Mean radioactivity concentration (wet), Bq kg-1
samplingobserv- 239Pu+ 243Cm+ Totalationsb 137Cs 144Ce 154Eu 155Eu 238Pu 240Pu 241Pu 241Am 242Cm 244Cm beta
EnglandSt Bees Fucus vesiculosus 4 9.9 * 0.10 0.16 1.9 8.9 - 3.7 0.0078 0.0070 -
±0.1 ±0.13 ±0.14 ±0.1 ±0.2 ±0.1 ±0.0054 ±0.0026
� Porphyra 4 2.3 * * * 0.47 2.3 29 4.2 * 0.0066 210±0.1 ±0.03 ±0.1 ±0.8 ±0.1 ±0.0026
� Rhodymenia spp. 2 19 0.27 0.21 0.11 0.94 4.7 - 12 0.012 0.025 -±0.2 ±0.27 ±0.19 ±0.14 ±0.05 ±0.1 ±0.3 ±0.010 ±0.009
Braystones south Porphyra 4 2.4 * 0.05 * 0.59 2.7 34 4.6 0.0084 0.0083 -±0.1 ±0.08 ±0.04 ±0.1 ±1.0 ±0.1 ±0.0058 ±0.0035
Sellafield Fucus vesiculosus 4 13 0.26 * * 3.1 14 - 6.3 0.0099 0.011 36000±0.3 ±0.33 ±0.1 ±0.3 ±0.2 ±0.0079 ±0.005
Seascale Porphyra 52c 2.7 0.04 0.01 * - - - 5.8 - - -±5.3 ±0.8 ±0.02 ±11
River Calder (Pos. A) Fontinalis 1 3.6 * * 1.1 - - - * - - -±0.5 ±0.8
River Calder (Pos. B) � 1 17 * * 1.2 - - - * - - -±0.3 ±0.3
River Calder (Pos. C) � 1 71 3.2 1.1 1.8 - - - 3.8 - - -±0.5 ±1.0 ±0.3 ±0.4 ±0.5
River Calder (Pos. D) � 1 8.8 * * 0.79 - - - * - - -±0.4 ±0.52
River Calder (Pos. E) � 1 15 * * 1.7 - - - * - - -±0.9 ±1.3
Rabbit Cat How, Ravenglass Samphire 1 2.7 * * * - - - 1.5 - - -
±0.1 ±0.2
Cockerham Marsh � 1 3.6 * * * - - - 1.4 - - 44±0.1 ±0.1
WalesPortmadoc Fucus vesiculosus 1 0.38 * * 0.14 - - - * - - -
±0.05 ±0.11
Fishguard � 1 0.23 * * * - - - * - - 170±0.23
Lavernock Point Fucus serratus 2 0.29 * * 0.08 - - - * - - 220±0.05 ±0.08
South Wales, Manufacturer A Laverbread 4 0.04 * * * - - - * - - -
±0.04
Manufacturer C � 4 * * * * - - - * - - -
Manufacturer D � 4 0.23 * * * - - - 0.07 - - 79±0.12 ±0.03
ScotlandPort William Fucus vesiculosus 4 3.0 * * * - - - 0.53 - - -
±0.1 ±0.20
Garlieston � 4 6.3 * * * - - - 3.4 - - -±0.2 ±0.4
Auchencairn � 4 10 * * * - - - 3.1 - - -±0.2 ±0.3
Knock Bay Porphyra 4 0.39 * * * - - - 0.32 - - -±0.07 ±0.15
Cape Wrath Fucus vesiculosus 1 0.63 * 0.27 * - - - * - - 240±0.05 ±0.08
Wick � 1 0.28 * * * - - - * - - 210±0.07
Northern IrelandArdglass � 4 1.1 * * * - - - 0.06 - - -
±0.1 ±0.05
Portrush Fucus serratus 3 0.42 * * * - - - * - - -±0.06
Strangford Lough Rhodymenia spp. 4 2.5 * * * 0.069 0.37 - 0.52 * 0.0013 -±0.2 ±0.005 ±0.01 ±0.02 ±0.0006
Isles of Scilly Fucus vesiculosus 1 * * * * - - - * - - 87
- not analysed* not detected by the method used

73
Table 15. Beta radiation dose rates over intertidal areas of theCumbrian coast, 1995
Location Ground No. of µSv h-1
type samplingobserva-tionsa
Whitehaven outer harbour Mud and sand 2 0.67� yacht basin Mud 2 2.2St Bees Sand 2 0.19Nethertown Winkle bed 2 0.43Braystones Sand 2 0.31Sellafield pipeline � 2 0.35River Ehen Saltmarsh 2 1.5Seascale Sand 2 0.13Drigg � 2 0.14Drigg Barn Scar Mussel bed 2 0.47Ravenglass - Raven Villa Saltmarsh 2 0.88� - salmon garth Mussel bed 2 0.48Tarn Bay Sand 2 *
a See section 5 for definition* Not detected by the method used

74
Table 16. Radioactivity in terrestrial food and the environment near Sellafield, 1995
Material Selectiond Farms/ Mean radioactivity concentration (wet)a, Bq kg-1
samplesb
3H 14C 35S 60Co 90Sr 99Tc 106Ru 125Sb 129I 131I
Milk Near farmsc 12 <10 19 <2.1 <0.44 <0.22 <0.04 <2.9 <0.83 <0.016 <0.20±1.6 ±3.3 ±0.3 ±0.01 ±0.003
� � max <13 29 <9.2 <0.48 0.39 <3.1 <0.90 <0.018±4.3 ±3.6 ±0.7 ±0.02 ±0.005
� � sub-sets 4 - - - <0.33 0.15 - <1.7 <0.52 - <0.10±0.01
� � max <0.37 0.18 <0.60±0.01
� Far farmsc 4 <10 17 <1.0 <0.43 <0.20 <0.04 <2.9 <0.86 <0.017 -±3.3
� � max 18 <0.48 <3.3 <0.90 <0.018±3.3
� � sub-sets 1 - - - - 0.075 - - - - -±0.010
Apples 2 <10 19 <1.3 <0.45 <0.20 <0.10 <2.6 <0.85 <0.050 -±3.5 ±0.3
� max 24 1.6 <0.50 <3.1 <0.90±4.0 ±0.4
Barley 1 <10 120 17 <0.60 1.4 - <3.4 <0.90 <0.050 -±15 ±0.7 ±0.1
Blackberries 1 41 66 6.4 <0.50 7.8 - <2.9 <1.1 <0.050 -±5.0 ±5.0 ±0.9 ±0.4
Bovine kidney 1 <10 23 <3.0 <0.40 <0.20 - <3.9 <0.80 - -±9.0
� liver 1 <10 54 <3.0 <0.40 <0.20 <0.10 <2.7 <0.90 <0.050 -±8.0
� muscle 1 <10 34 7.0 <0.60 <0.20 <0.10 <2.7 <1.2 <0.050 -±8.0 ±7.0
Cabbage 1 - - - - - - - - - -
Carrots 1 21 13 <1.0 <0.30 5.6 <0.10 <3.5 <1.1 <0.060 -±5.0 ±4.0 ±0.3
Eggs 1 34 37 2.7 <0.60 <0.20 - <3.8 <0.60 0.20 -±5.0 ±5.0 ±0.5 ±0.07
Elderberries 1 29 36 1.4 1.8 3.6 - <4.0 <1.1 0.066 -±5.0 ±6.0 ±0.7 ±0.2 ±0.2 ±0.065
Goats milk 2 <10 15 <1.0 <0.40 0.45 - <3.1 <0.55 <0.082 -±3.5 ±3.0 ±0.02 ±0.016
� max 10 0.68 <3.3 <0.60 0.11±5.0 ±0.02 ±0.02
Goose 1 <10 54 <3.0 <0.50 <0.20 <0.10 <4.0 <1.0 <0.050 -±8.0
Hare 1 <10 38 7.1 <0.40 <0.20 <0.10 <3.9 <1.0 <0.050 -±8.0 ±1.6
Honey 1 <10 78 <1.0 <0.50 <0.20 - <3.8 <1.0 <0.050 -±16
Lettuce 1 <10 <15 <1.0 <0.30 1.1 - <3.8 <0.90 <0.050 -±0.1
Mushrooms 1 <10 22 <1.0 <0.60 0.26 - <4.0 <1.4 0.082 -±3.0 ±0.04 ±0.061
Oats 1 16 130 8.9 <0.50 6.0 - <3.9 <0.50 0.14 -±8.0 ±16 ±0.9 ±0.3 ±0.07
Ovine kidney 1 <10 28 - - - - - - - -±5.0
� kidney/liver 1 <10 28 <3.0 <0.50 <0.20 - <4.0 <1.5 - -±5.0
� muscle 2 <14 36 <3.0 <0.40 <0.20 <0.10 <3.0 <0.85 <0.058 -±5.7 ±6.0 ±0.041
� � max 17 52 <0.50 <3.2 <0.90 0.065±8.0 ±7.0 ±0.058
Peas 1 <10 12 <1.0 <0.70 <0.20 - <3.9 <1.3 <0.050 -±3.0
Potatoes 2 17 20 <1.0 <0.40 0.72 - <3.4 <0.90 <0.06 -±5.0 ±3.5 ±0.05
� max 22 25 1.2 - <0.07 -±5.0 ±4.0 ±0.1
� sub-sets 1 - - - <0.40 - - <2.0 <0.70 - -
Rabbit 1 <10 24 <3.0 <0.40 0.47 <0.10 <3.9 <1.1 <0.050 -±12 ±0.05
Runner beans 1 <10 13 <1.0 <0.50 0.39 - <2.7 <0.80 0.14 -±4.0 ±0.04 ±0.06
Spinach 1 - - - - - - - - <0.050 -
Turnips 1 - - - - - - - - - -
Fodder beet 1 25 26 1.7 <0.50 1.9 - <2.3 <0.90 <0.050 -±5.0 ±3.0 ±0.4 ±0.1
Grass 2 - - 270 - - <0.10 - - - -±14
Soil 2 - - - - - - - - - -
Dry cloths 346 - - - - - - - - - -

75
Table 16. continued
Material Selection Farms/ Mean radioactivity concentration (wet)a, Bq kg-1
samplesb
134Cs 137Cs Total Cs 144Ce 210Po Total U 238Pu
Milk Near farmsc 12 <0.33 <0.50 <0.27 <1.8 <0.010 - <0.00020±0.04 ±0.02 ±0.004
� � max <0.38 <0.55 0.50 <1.9 <0.011±0.09 ±0.03 ±0.005
� � sub-sets 4 <0.21 <0.43 - <1.2 - - <0.00020±0.09
� � max <0.23 0.77 <1.4±0.10
� Far farmsc 4 <0.30 <0.47 <0.21 <1.8 - - -±0.02
� � max <0.33 <0.48 <0.23 <1.9±0.04
� � sub-sets 1 - - - - - - -
Apples 2 - - 0.32 <1.3 0.028 - <0.0003±0.07 ±0.004 ±0.00021
� max 0.43 <1.7 0.00040±0.08 ±0.00030
Barley 1 - - 0.95 <2.0 - - 0.00070±0.11 ±0.00040
Blackberries 1 - - 2.5 <0.90 - - 0.0058±0.1 ±0.0013
Bovine kidney 1 - - 0.65 <1.8 0.025 - -±0.09 ±0.009
� liver 1 - - 0.78 <1.3 0.35 - <0.00070±0.09 ±0.08
� muscle 1 - - 0.58 <1.6 2.5 - <0.00020±0.09 ±0.2
Cabbage 1 - - - - 0.033 - -±0.007
Carrots 1 - - 0.28 <1.9 - - <0.00020±0.08
Eggs 1 - - <0.20 <1.7 - - 0.00030±0.00030
Elderberries 1 - - 11 <2.9 - - 0.030±0.6 ±0.005
Goats milk 2 - - 1.1 <2.0 - - <0.00020±0.1
� max 1.5±0.1
Goose 1 - - 0.92 <2.3 - - <0.00020±0.14
Hare 1 - - 4.5 <2.0 - - <0.00020±0.2
Honey 1 - - 1.1 <1.2 - - 0.00050±0.1 ±0.00040
Lettuce 1 - - 1.9 <1.9 0.71 - 0.00050±0.1 ±0.05 ±0.00040
Mushrooms 1 - - 0.77 <1.1 - - 0.0012±0.11 ±0.0005
Oats 1 - - 2.1 <1.6 - - 0.0068±0.1 ±0.0020
Ovine kidney 1 - - - - - - -
� kidney/liver 1 - - 1.4 <2.4 0.56 - 0.00030±0.1 ±0.16 ±0.00030
� muscle 2 - - 1.4 <1.5 0.015 - <0.00020±0.1 ±0.006
� � max 1.6 <2.1±0.1
Peas 1 - - <0.20 <1.8 <0.010 - <0.00020
Potatoes 2 - - <0.34 <1.9 0.021 - <0.0004±0.06 ±0.004 ±0.00028
� max - - 0.49 0.00060±0.08 ±0.00040
� sub-sets 1 - - - <1.2 - - -
Rabbit 1 - - 5.5 <2.2 0.037 - <0.00020±0.3 ±0.017
Runner beans 1 - - <0.20 <2.0 - - <0.00020
Spinach 1 - - - - - <0.025 -
Turnips 1 - - - - 0.017 0.018 -±0.003 ±0.005
Fodder beet 1 - - 0.24 <1.2 - - <0.00020±0.08
Grass 2 - - - - - - -
Soil 2 - - - - 64 - -±7.8
Dry cloths 346 - - - - - - -

76
Table 16. continued
Material Selectiond Farms/ Mean radioactivity concentration (wet)a, Bq kg-1
samplesb239Pu + 241Pu 241Am Total Total Total240Pu alpha beta gamma
Milk Near farms 12 <0.00021 <0.10 <0.00020 - - -±0.00008
� � max <0.00023±0.00015
� � sub-sets 4 - - - - - -
� � max
� Far farmsc 4 - - - - - -
� � max
� � sub-sets 1 - - - - - -
Apples 2 0.00065 <0.10 0.0011 - - -±0.00045 ±0.0006
� max 0.00070 0.0017±0.00050 ±0.0007
Barley 1 0.0049 <0.10 0.0045 - - -±0.0014 ±0.0016
Blackberries 1 0.042 0.47 0.025 - - -±0.007 ±0.10 ±0.006
Bovine kidney 1 - - - - - -
� liver 1 <0.00050 <0.26 0.0014 - - -±0.0008
� muscle 1 <0.00020 <0.10 <0.00020 - - -
Cabbage 1 - - - - - -
Carrots 1 0.012 <0.10 0.0051 - - -±0.002 ±0.0018
Eggs 1 0.00040 0.21 0.00030 - - -±0.00040 ±0.19 ±0.00030
Elderberries 1 0.17 2.2 0.063 - - -±0.03 ±0.2 ±0.014
Goats milk 2 <0.00020 <0.10 <0.00020 - - -
� maxGoose 1 <0.00030 <0.10 <0.00030 - - -
Hare 1 0.00080 <0.10 0.0012 - - -±0.00040 ±0.0006
Honey 1 0.0023 0.21 0.0012 - - -±0.0013 ±0.21 ±0.0007
Lettuce 1 0.0082 <0.10 0.0045 - - -±0.0022 ±0.0015
Mushrooms 1 0.024 0.11 0.011 - - -±0.004 ±0.02 ±0.005
Oats 1 0.072 0.47 0.038 - - -±0.015 ±0.15 ±0.015
Ovine kidney 1 - - - - - -
� kidney/liver 1 0.0012 - <0.00070 - - -±0.0006
� muscle 2 <0.00025 <0.10 <0.00020 - - -±0.00021
� � max 0.00030±0.00030
Peas 1 <0.00020 <0.10 0.00020 - - -±0.00020
Potatoes 2 0.010 <0.10 0.0031 - - -±0.003 ±0.0013
� max 0.020 0.0059±0.004 ±0.0018
� sub-sets 1 - - - - - -
Rabbit 1 0.00030 <0.10 <0.00020 - - -±0.00030
Runner beans 1 0.00030 <0.10 0.00040 - - -±0.00030 ±0.00030
Spinach 1 - - - - - -
Turnips 1 - - - - - -
Fodder beet 1 0.0070 <0.10 0.0026 - - -±0.0014 ±0.0009
Grass 2 - - - - - -
Soil 2 - - - - - -
Dry cloths 346 - - - 0.64 2.7 1.5±1.3 ±3.2
- not analyseda except for milk where units are Bq l-1and for dry cloths where units are Bq per clothb see section 5 for definitionc the concentration of 3H (organic) was <10 Bq l-1d data are arithmetic means unless stated as �max�. �Max� data are selected to be maxima. If no �max� value is given, the mean is
also the maximum. See section 5 for definition

77
Table 17. Individual radiation exposures due to consumption of terrestrial foodstuffs nearSellafield and Drigg, 1995
Exposed populationb Critical foodstuffs Nuclide Exposure, mSva
Consumers near Milk 14C <0.011Sellafield aged 1 y Root vegetables 35S <0.016
60Co <0.00490Sr <0.024106Ru <0.009125Sb <0.001129I <0.002131I <0.006134Cs <0.002137Cs <0.004Others <0.002Total <0.081
Consumers near Milk 35S <0.002Drigg aged 1 y Potatoes 60Co <0.005
90Sr <0.00595Zr <0.003106Ru <0.008125Sb <0.002129I <0.002134Cs <0.002137Cs <0.002144Ce <0.003Others <0.001Total <0.035
Consumers near Milk 35S <0.002Ravenglass aged 1 y Fruit 60Co <0.004
90Sr <0.00495Zr <0.002106Ru <0.009125Sb <0.002129I <0.002134Cs <0.002137Cs <0.002144Ce <0.004Others <0.004Total <0.037
Typical adult member of Milk 14C <0.002the public eating food Wildfruit 35S <0.001grown near Sellafield 90Sr <0.008
106Ru <0.003129I <0.002137Cs <0.004Others <0.004Total <0.023
a Excluding natural radionuclidesb Representative of people most exposed unless stated otherwise

78
Table 18. Radioactivity in terrestrial food and the environment near Ravenglass, 1995
Material and Farms/ Mean radioactivity concentration (wet)a, Bq kg-1
selectiond samplesb
3H 14C 35S 60Co 90Sr 95Zr 95Nb 99Tc 106Ru 125Sb 129I 134Cs
Milkc 5 <10 17 <1.0 <0.44 <0.20 <0.88 <0.77 <0.040 <3.0 <0.86 <0.016 <0.29±3.0
� max 18 <0.55 <0.95 <0.90 <3.5 <0.96 <0.020 <0.33±3.0
� sub-sets 3 - - - <0.28 0.078 <0.60 <0.57 - <1.9 <0.60 - <0.25±0.011
� max <0.35 0.088 <0.70 <0.60 <0.70 <0.30±0.011
Apples 1 <10 <15 <1.0 <0.50 <0.20 <0.70 <0.50 - <3.3 <0.70 <0.050 -
Barley 1 <10 79 1.3 <0.50 0.58 <1.1 <0.70 - <2.7 <1.1 <0.050 -±19 ±0.60 ±0.05
Blackberries 1 <10 22 <1.0 <0.50 0.75 <1.0 <0.80 - <2.9 <0.80 <0.050 -±5.0 ±0.05
Bovine kidney 1 <10 25 <3.0 <0.50 0.45 <1.6 <1.5 - <3.8 <0.80 - -±6.0 ±0.04
� liver 1 <10 24 <3.0 <0.50 <0.20 <1.0 <0.90 <0.10 <2.7 <0.70 <0.050 -±6.0
� muscle 1 <10 31 <3.0 <0.70 <0.20 <1.7 <1.3 <0.10 <3.3 <1.0 <0.050 -±5.0
Cabbage 1 <10 <15 <1.0 <0.40 0.55 <0.90 <0.50 <0.10 <3.1 <0.90 <0.050 -±0.05
Carrots 1 <10 <15 <1.0 <0.50 0.27 <1.2 <0.80 <0.10 <2.5 <0.70 <0.050 -±0.04
Damsons 1 - - - - - - - - - - - -
Duck 1 <10 110 <3.0 <0.50 <0.20 <1.8 <2.9 - <3.9 <0.5 - -±7.0
Mushrooms 1 <10 <15 <1.0 <0.80 0.42 <3.1 <4.3 - <3.8 <2.0 - -±0.04
Ovine kidney/liver 2 <10 36 <3.0 <0.55 <0.20 <0.95 <0.95 - <3.7 <0.90 - -±7.5
� max 41 <0.70 <1.1 <1.1 <1.0±7.0
� muscle 2 <10 41 <3.0 <0.40 <0.20 <1.2 <1.1 <0.10 <2.4 <1.0 <0.050 -±7.5
� max 44 <1.4 <1.5 <2.6±8.0
Potatoes 1 <10 21 <1.0 - <0.20 - - - - - <0.050 -±3.0
� sub-sets 1 - - - <0.40 - <0.50 <0.60 - <1.9 <0.50 - -
Runner beans 1 <10 <15 <1.0 <0.60 <0.20 <0.70 <0.60 - <2.8 <0.80 <0.050 -
Turnips 1 - - - - - - - - - - - -
Grass 2 - - - - - - - <3.7 <0.10e - - -±0.3
� max 7.4±0.4
Soil 2 - - - - - - - - - - - -
� max

79
Table 18. continued
Material and Farms/ Mean radioactivity concentration (wet)a, Bq kg-1
selection samplesb
239Pu +137Cs Total Cs 144Ce 147Pm 210Po Total U 238Pu 240Pu 241Pu 241Am
Milkc 5 <0.49 <0.22 <1.9 <0.53 <0.010 - <0.00021 <0.00021 <0.10 <0.00023±0.02 ±0.00007 ±0.00007 ±0.00009
� max <0.51 <0.24 <2.2 <0.60 <0.00025 <0.00023 <0.0003±0.02 ±0.00015 ±0.00012 ±0.00012
� sub-sets 3 <0.33 - <1.1 - - - - - - -
� max <0.40 <1.2
Apples 1 - <0.20 <1.8 - - - <0.00020 0.00040 <0.10 0.00040±0.00030 ±0.00040
Barley 1 - 0.37 <1.4 - - - 0.00020 0.00080 <0.10 0.0020±0.10 ±0.00020 ±0.00050 ±0.0009
Blackberries 1 - 0.52 <1.5 - - - 0.00050 0.0037 <0.10 0.0047±0.09 ±0.00040 ±0.0010 ±0.0013
Bovine kidney 1 - 0.84 <1.8 - - - - - - -±0.09
� liver 1 - 0.79 <2.3 - - - 0.00090 0.0037 <0.10 0.0054±0.13 ±0.00040 ±0.0009 ±0.0015
� muscle 1 - 1.0 <2.5 - - - <0.00020 0.00030 <0.10 <0.00020±0.1 ±0.00030
Cabbage 1 - 0.25 <1.1 - - - <0.00020 <0.00020 <0.10 <0.00020±0.07
Carrots 1 - <0.20 <1.5 - - - 0.00030 0.00060 <0.10 0.0011±0.00030 ±0.00040 ±0.0006
Damsons 1 - - - - - <0.048 - - - -
Duck 1 - 6.6 <2.3 - - - - - - -±0.3
Mushrooms 1 - 4.7 <2.7 - - - 0.13 0.62 7.7 2.2±0.2 ±0.02 ±0.09 ±0.5 ±0.3
Ovine kidney/ 2 - 2.0 <1.3 - - - 0.0029 0.014 0.30 0.013liver ±0.1 ±0.0009 ±0.003 ±0.11 ±0.004
� max 2.5 <1.5±0.1
Ovine muscle 2 - 3.4 <1.7 - - - <0.00020 <0.00055 <0.10 0.0014±0.2 ±0.00035 ±0.0006
� max 3.5 <2.0 0.00090 0.0023±0.2 ±0.00050 ±0.0008
Potatoes 1 - 0.25 - - - - <0.00020 0.00090 <0.10 0.0011±0.07 ±0.00040 ±0.0004
� sub-sets 1 - - <1.5 - - - - - - -
Runner beans 1 - <0.20 <1.6 - - <0.00020 <0.00020 <0.10 <0.00020
Turnips 1 - - - - - 0.044 - - - -±0.012
Grass 2 - - - - - - - - - -
� max
Soil 2 - - - - - 75 - - - -±8.1
� max 89
- not analyseda except for milk where units are Bq l-1 and for soil where dry concentrations applyb see section 5 for definitionc The concentration of 3H (organic) was <10 Bq l-1d data are arithmetic means unless stated as �max�. �Max� data are selected to be maxima. If no �max� value is given, the mean is
also the maximum. See section 5 for definitione Total Ru

80
Table 19. Radioactivity in terrestrial food and the environment near Drigg, 1995
Material Farms/ Mean radioactivity concentration (wet)a, Bq kg-1
and selectiond samplesb
3H 14C 35S 60Co 90Sr 95Zr 95Nb 99Tc 106Ru 125Sb 129I
Milkc 1 <10 16 <1.0 <0.47 <0.20 <0.84 <0.78 <0.040 <3.1 <0.93 <0.020±3.0
� sub-sets - - - - 0.12 - - - - - -±0.01
Blackberries 1 14 30 <1.0 <0.20 2.0 <0.70 <0.40 - <2.0 <0.50 <0.050±5.0 ±4.0 ±0.1
Cabbage 1 <10 <15 <1.0 <0.60 0.26 <1.2 <1.1 <0.10 <3.6 <1.2 <0.050±0.04
Honey 1 <10 71 <1.0 <0.60 <0.20 <1.4 <1.1 - <3.5 <0.60 <0.050±15
Mushrooms 1 16 <15 <1.0 <0.70 <0.20 <1.4 <0.90 <0.10 <3.6 <1.0 <0.050±5.0
Ovine muscle 1 <10 31 <3.0 <0.60 <0.20 <1.1 <1.2 <0.10 <3.8 <0.9 <0.050±9.0
Potatoes 1 <10 19 <1.0 <0.40 <0.20 <0.70 <0.60 <0.10 <3.7 <0.80 <0.050±4.0
Rabbit 1 <10 19 <3.0 <0.40 <0.20 <1.9 <2.3 <0.10 <3.4 <1.1 <0.050±11
Grass 2 - - - - - - - <0.10 - - -±0.03
� max 0.11±0.04
Soil 2 - - - - - - - - - - -
� max
Material Farm/ Mean radioactivity concentration (wet)a, Bq kg-1
and selectiond samplesb
239Pu +134Cs 137Cs Total Cs 144Ce 147Pm Total U 238Pu 240Pu 241Pu 241Am
Milkc 1 <0.32 <0.53 0.30 <1.94 <0.50 - <0.00020 <0.00020 <0.10 <0.00027±0.03 ±0.03 ±0.00012
� sub-sets - - - - - - - - - -
Blackberries 1 - - 0.32 <1.2 - - 0.00060 0.0064 <0.10 0.0060±0.07 ±0.00040 ±0.0016 ±0.0020
Cabbage 1 - - <0.20 <2.5 - <0.023 <0.00020 <0.00020 <0.10 0.00030±0.00030
Honey 1 - - <0.20 <1.4 - - 0.00030 0.0010 <0.10 0.0013±0.00020 ±0.0004 ±0.0007
Mushrooms 1 - - 0.43 <2.7 - - 0.0022 0.024 <0.10 0.015±0.08 ±0.0008 ±0.004 ±0.004
Ovine muscle 1 - - 5.8 <2.5 - - <0.00030 0.00040 <0.10 <0.00040±0.2 ±0.00040
Potatoes 1 - - <0.20 <1.6 - <0.026 <0.00020 0.0010 <0.10 0.00080±0.0005 ±0.00040
Rabbit 1 - - 1.0 <2.6 - <0.00030 0.00060 0.13 0.0011±0.1 ±0.00050 ±0.13 ±0.0005
Grass 2 - - - - - 0.11 - - - -±0.03
� max 0.14±0.04
Soil 2 - - - - - 68 - - - -±7.8
� max 100±9.4
- not analyseda except for milk where units are Bq l-1 and for soil where dry concentrations applyb see section 5 for definitionc The concentration of 3H (organic) was <10 Bq l-1d data are arithmetic means unless stated as �max�. �Max� data are selected to be maxima. If no �max� value is given, the mean is
also the maximum. See section 5 for definition.

81
Table 20(a). Radioactivity in food and the environment near Springfields, 1995
Material Locationb or No. of Mean radioactivity concentration (wet)a, Bq kg-1
selectionc samplingobserv-ationsd 60Co 90Sr 99Tc 106Ru 125Sb 134Cs 137Cs Total Cs 154Eu
Aquatic samples
Flounder Ribble Estuary 1 * - - * * * 12 - *±0.3
Salmon � 1 * - - * * * 0.57 - *±0.23
Sea trout � 1 * - - * * * 3.6 - *±0.2
Shrimps � 1 * - 3.3 * * * 4.2 - *±0.3 ±0.3
Turf Hesketh Bank 4 1.6 - - 2.0 3.5 0.56 570 - 3.6±0.6 ±2.6 ±2.2 ±0.63 ±3.8 ±1.8
Mud Becconsall 4 1.4 - - * 2.4 * 390 - *±1.3 ±3.1 ±6.3
� Pipeline 4 2.6 - - * 2.4 * 480 - 2.9±1.3 ±1.9 ±6.0 ±2.3
Mud & sand � 4 0.36 - - * 3.6 * 160 - *±0.61 ±2.8 ±3.5
� Deepdale Brook 4 0.32 - - * 1.3 * 18 - *±0.40 ±1.3 ±1.1
Mud Savick Brook 4 2.7 - - 3.4 0.92 * 530 - *±1.2 ±5.5 ±1.6 ±6.8
� Penwortham 4 2.7 - - * 1.2 * 510 - 2.3±1.7 ±2.0 ±8.1 ±2.4
Terrestrial samples
Milk Near farms 5 - - - - - - - - -
� Far farms 1 - - - - - - - - -
Blackberriese,f 1 <0.6 0.30 - <3.3 <1.1 - - <0.20 <0.4±0.04
Carrots 1 <0.5 <0.20 - <3.8 <1.2 - - <0.20 <0.5
Cauliflower/Lettuce 1 - - - - - - - - -
Duckf 1 <0.4 <0.20 - <3.9 <0.8 - - 3.2 <0.5±0.3
Potatoese,f 1 <0.3 <0.20 - <2 <0.9 - - <0.20 <0.3
Runner Beans 1 - <0.20 - - - - - <0.20 -
Bovine Faeces 3 - - - - - - - - -
� max
Ovine Faeces 2 - - - - - - - - -
� max
Grass 4 - - - - - - - - -
� max
Sileage 4 - - - - - - - - -
� max
Soil 4 - - - - - - - - -
� max
Dry cloths 135 - - - - - - - - -

82
Table 20(a). continued
Material Locationb or No. of Mean radioactivity concentration (wet)a, Bq kg-1
selectionc samplingobserva- 235U+tionsd 155Eu 228Th 230Th 232Th 234Th 233Pa 234U 236U 238U Total U
Aquatic samples
Flounder Ribble Estuary 1 * - - - * * - - - -
Salmon � 1 * - - - * * - - - -
Sea trout � 1 * - - - * * - - - -
Shrimps � 1 * - - - * * - - - -
Turf Hesketh Bank 4 3.1 - - - 300 * - - - -±1.1 ±19
Mud Becconsall 4 1.5 24 - 20 30000 * 15 * 12 -±0.9 ±1.0 ±0.6 ±100 ±0.5 ±0.5
� Pipelines 4 * 26 - 22 60000 * 31 1.5 23 -±1.9 ±1.3 ±150 ±1.0 ±0.2 ±0.8
Mud & sand � 4 * 11 - 9.2 220000 * 93 5.5 76 -±0.4 ±0.3 ±250 ±3.1 ±0.3 ±2.6
� Deepdale Brook 4 3.5 24 - 20 1100 8.6 1000 46 940 -±1.3 ±1.0 ±0.6 ±3.9 ±25 ±1.7 ±23
Mud Savick Brook 4 2.2 31 - 24 350000 * - - - -±1.4 ±2.1 ±1.3
� Penwortham 4 3.4 31 - 24 120000 * 34 1.7 25 -±1.7 ±1.1 ±0.7 ±200 ±1.2 ±0.2 ±1.0
Terrestrial samples
Milk Near farms 5 - - - - - - - - - <0.0064
� Far farms 1 - - - - - - - - - <0.0064
Blackberriesc,f 1 <0.7 - <0.0050 <0.0050 - - - - - -
Carrots 1 <0.6 - 0.011 <0.0050 - - - - - -±0.006
Cauliflower/Lettuce 1 - - 0.19 0.14 - - - - - 0.44±0.04 ±0.03 ±0.04
Duckf 1 <0.6 - <0.0050 <0.0050 - - - - - -
Potatoesc,f 1 <0.4 - <0.0050 <0.0050 - - - - - -
Runner Beans 1 - - - - - - - - - -
Bovine faeces 3 - - - - - - - - - 1.8±0.1
� max 2.7±0.1
Ovine faeces 2 - - - - - - - - - 9.6±0.4
� max 10±0.4
Grass 4 - - - - - - - - - 2.8±0.2
� max 6.4±0.3
Sileage 4 - - - - - - - - - 0.72±0.08
� max 1.2±0.1
Soil 4 - - - - - - - - - 150±11
� max 290±15
Dry cloths 135 - - - - - - - - - -
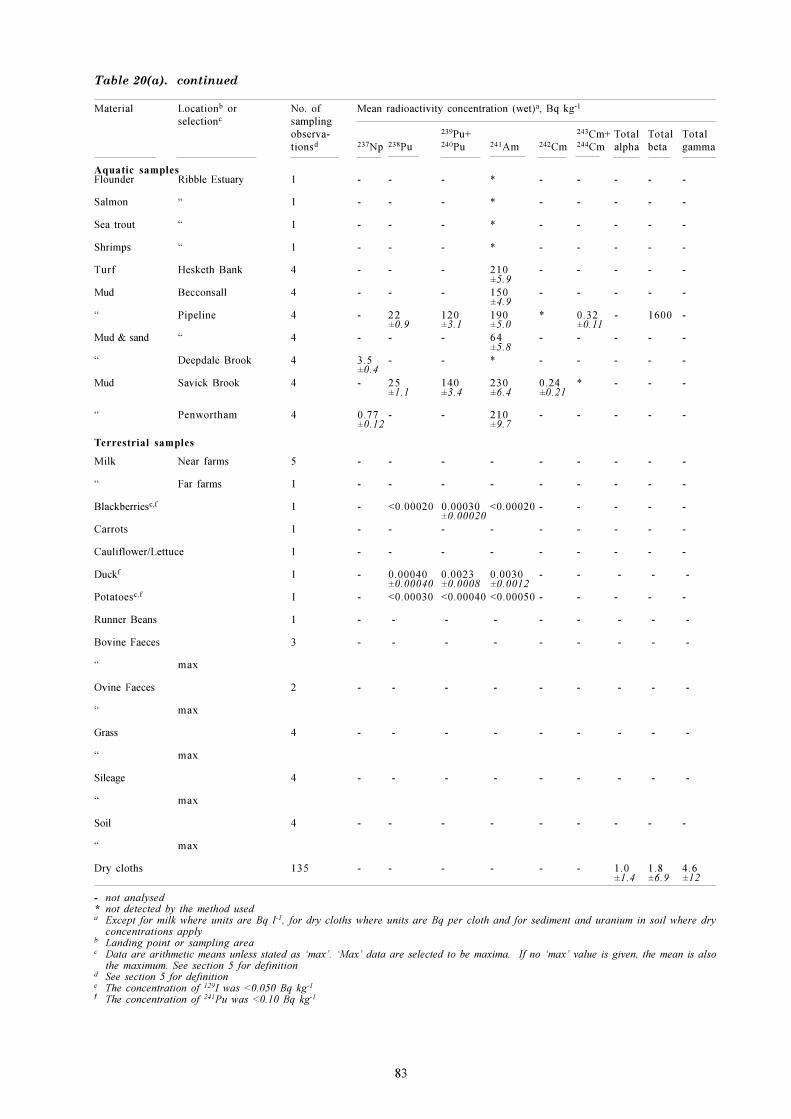
83
Table 20(a). continued
Material Locationb or No. of Mean radioactivity concentration (wet)a, Bq kg-1
selectionc samplingobserva- 239Pu+ 243Cm+ Total Total Totaltionsd 237Np 238Pu 240Pu 241Am 242Cm 244Cm alpha beta gamma
Aquatic samplesFlounder Ribble Estuary 1 - - - * - - - - -
Salmon � 1 - - - * - - - - -
Sea trout � 1 - - - * - - - - -
Shrimps � 1 - - - * - - - - -
Turf Hesketh Bank 4 - - - 210 - - - - -±5.9
Mud Becconsall 4 - - - 150 - - - - -±4.9
� Pipeline 4 - 22 120 190 * 0.32 - 1600 -±0.9 ±3.1 ±5.0 ±0.11
Mud & sand � 4 - - - 64 - - - - -±5.8
� Deepdale Brook 4 3.5 - - * - - - - -±0.4
Mud Savick Brook 4 - 25 140 230 0.24 * - - -±1.1 ±3.4 ±6.4 ±0.21
� Penwortham 4 0.77 - - 210 - - - - -±0.12 ±9.7
Terrestrial samples
Milk Near farms 5 - - - - - - - - -
� Far farms 1 - - - - - - - - -
Blackberriesc,f 1 - <0.00020 0.00030 <0.00020 - - - - -±0.00020
Carrots 1 - - - - - - - - -
Cauliflower/Lettuce 1 - - - - - - - - -
Duckf 1 - 0.00040 0.0023 0.0030 - - - - -±0.00040 ±0.0008 ±0.0012
Potatoesc,f 1 - <0.00030 <0.00040 <0.00050 - - - - -
Runner Beans 1 - - - - - - - - -
Bovine Faeces 3 - - - - - - - - -
� max
Ovine Faeces 2 - - - - - - - - -
� max
Grass 4 - - - - - - - - -
� max
Sileage 4 - - - - - - - - -
� max
Soil 4 - - - - - - - - -
� max
Dry cloths 135 - - - - - - 1.0 1.8 4.6±1.4 ±6.9 ±12
- not analysed* not detected by the method useda Except for milk where units are Bq l-1, for dry cloths where units are Bq per cloth and for sediment and uranium in soil where dry
concentrations applyb Landing point or sampling areac Data are arithmetic means unless stated as �max�. �Max� data are selected to be maxima. If no �max� value is given, the mean is also
the maximum. See section 5 for definitiond See section 5 for definitione The concentration of 129I was <0.050 Bq kg-1
f The concentration of 241Pu was <0.10 Bq kg-1

84
Table 20(b). Monitoring of radiation dose rates near Springfields, 1995
Location Material or No. of µGy h-1
ground type samplingobserva-tionsa
Gamma dose rates at 1 m over intertidal areas
Lytham - Boatyard Mud 4 0.11� - Windmill Marsh Salt marsh 1 0.12� (boat 1) Cabinb 2 0.082Warton Marsh Mud 4 0.14� � c 4 0.15� Salt marsh 4 0.14The Naze � 1 0.14Banks marsh Mud 4 0.15� � c 4 0.16Salt marsh 4 0.18Hesketh Bank Mud 4 0.12� � c 4 0.13� Salt marsh 4 0.13Freckleton Mud 4 0.12River Douglas Grass 1 0.20Becconsall Mud 4 0.10� (boat 1) Cabinb 1 0.088� (boat 2) � 14 0.088� � Mud 10 0.12� (boat 4) Cabinb 1 0.066Hutton Marsh Mud 4 0.17� Salt marsh 4 0.17Pipeline Mud 3 0.12� Mud and sand 1 0.10Pipeline (south bank) Mud 1 0.11� Mud and sand 3 0.12� Salt marsh 4 0.17Savick Brook - tidal limit Mud 3 0.20� - A583 bridge � 4 0.20� - confluence
with Ribble � 3 0.18� � Mud and sand 1 0.12Penwortham Mud 3 0.17� Mud and sand 1 0.096Lower Penwortham Mud 3 0.15� Mud and sand 1 0.089� Grass 4 0.081Penwortham Railway Bridge Mud 3 0.14� Sand and stones 1 0.081� Grass 4 0.084River Darwen Mud 2 0.10� Mud, sand
and stones 1 0.086� Grass 3 0.089
Beta dose rates µSv h-1
Lytham - Windmill Marsh Salt marsh 1 1.0� - Boatyard Mud 4 4.8Warton Marsh � 4 3.0� Salt marsh 4 1.5The Naze � 1 1.3Banks Marsh Mud 4 2.7� Salt marsh 4 1.5Hesketh Bank Mud 4 3.5� Salt marsh 4 1.4Freckleton Mud 4 9.8River Douglas Grass 1 1.1Deepdale Brook Mud and sand 4 0.67Becconsall Mud 4 6.3Hutton Marsh � 4 1.6� Salt marsh 4 2.2Pipeline Mud 3 22� Mud and sand 1 3.1Pipeline (south bank) Mud 1 9.7� Mud and sand 3 4.6� Salt marsh 4 1.6Savick Brook - tidal limit Mud 3 24� � Mud and sand 1 0.69� - A583 bridge Mud 4 78� - confluence
with Ribble � 3 33� � Mud and sand 1 8.3Penwortham Mud 3 33� Mud and sand 1 0.85Lower Penwortham Mud 3 15� Mud and sand 1 0.41� Grass 4 3.3Penwortham Railway Bridge � 4 1.4� Mud 3 17� Sand and stones 1 0.35River Darwen Mud 2 5.4� Mud, sand
and stones 1 17� Grass 4 3.2Ribble estuary Gill net 2 0.47� Shrimp net 2 0.35
a See section 5 for definitionb In the cabin of a houseboatc 15 cm above substrate

85
Table 21. Radioactivity in food and the environment near Capenhurst, 1995
Material Location or No. of Mean radioactivity concentration (wet)a, Bq kg-1
selectionc samplingobserva- Total Total Totaltions 3H 60Co 99Tc 137Cs 155Eu 234Th 233Pa 234U 235+236U 238U Total U 237Np 238Pu 239+240Pu 241Am 242Cm 243+244Cm alpha beta gamma
Aquatic samples
Shrimps Hoylake 2 - * 4.7 2.8 * * - - - - - - - - * - - - - -±0.2 ±0.1
Cockles Dee estuary 4 - 0.13 60 2.9 * 0.85 * - - - - - 0.16 0.85 2.1 0.005 0.007 - - -±0.08 ±4.7 ±0.2 ±1.1 ±0.01 ±0.03 ±0.07 ±0.004 ±0.003
Cladophoraceae sp. Rivacre Brook 1 - * 350 0.58 0.53 150 21 35 1.8 27 - 10 - - * - - - 530 -±27 ±0.13 ±0.27 ±2.3 ±0.3 ±1.9 ±0.9
Elodea canadensis � 2 - 0.06 270 0.98 0.18 140 20 - - - - 8.5 - - * - - - 720 -±0.03 ±24 ±0.06 ±0.14 ±0.8
Mud � 1 - * 1700 13 8 590 130 - - - - 48 - - * - - - - -±130 ±0.6 ±4.3
Mud & sand � 1 - * 200 5.7 * 59 12 66 3.9 40 - 6.4 - - * - - - - -±16 ±0.4 ±4.0 ±0.7 ±2.7 ±0.6
Freshwater � 2 350 - 6.6 - - - - 0.34 0.024 0.32 - 0.024 - - - - - - - -±2.4 ±0.7 ±0.02 ±0.003 ±0.02 ±0.002
Material Location or No. of Mean radioactivity concentration (wet)a, Bq kg-1
selectionc samplingobserva- Total Total Totaltions 99Tc Total U alpha beta gamma
Terrestrial samples
Milk Near farms 1 <0.040 <0.0064 - - -
� Far farms 1 <0.040 <0.0064 - - -±0.0013
Celery 1 <0.10 <0.026 - - -
Potatoes 1 <0.10 0.12 - - -±0.03
Strawberries 1 <0.10 <0.0066 - - -
Grass/Faeces 4 <0.10 - - - -
Bovine faeces 8 - 2.0 - - -±0.3
� max 5.2±0.8
Grass 8 - <0.10 - - -±0.03
� max 0.16±0.05
Silage 4 - 0.45 - - -±0.07
� max 1.3±0.1
Soil 4 - 53 - - -±6.9
� max 57±7.3
Dry cloths 128 - - 0.20 1.2 0.62±0.17 ±0.8 ±0.45
- not analysed* not detected by the method useda Except for milk and water where units are Bq l-1, for dry cloths where units are Bq per cloth and for soil and sediment where dry concentrations applyb See section 5 for definitionc Data are arithmetic means unless stated as �Max� in this column. �Max� data are selected to be maxima. If no �max� value is given, the mean is also the maximum. See section 5

86
Table 22(a). Radioactivity in food and the environment near Harwell, 1995
Material Location or No. of Mean radioactivity concentration (wet)a, Bq kg-1
selectionc samplingobserva- Total Total Totaltions 3H 57Co 51Cr 60Co 65Zn 90Sr 134Cs 137Cs 155Eu 238Pu 239+240Pu 241Am 243+244Cm alpha beta gamma
Aquatic samples
Pike Outfall (Sutton Courtenay) 1 - * * * * 0.0083 0.008 7.1 * 0.000027 0.00016 0.00015 * - - -±0.0035 ±0.07 ±0.1 ±0.000008 ±0.00003 ±0.00003
� Newbridge 1 - * * * * 0.0091 * 0.05 * 0.000046 0.00020 0.00023 * - - -±0.0036 ±0.03 ±0.000016 ±0.00003 ±0.00004
� Staines 1 - * * * * - * 0.31 * - - * - - - -±0.08
Nuphar lutea Outfall (Sutton Courtenay) 1 - * 2.3 0.75 * - * 1.6 * - - * - - - -±1.6 ±0.14 ±0.1
� Newbridge 1 - * * * * - * * * - - * - - - -
� Staines 1 - 0.15 * * 0.13 - * 0.18 * - - * - - 310 -±0.02 ±0.06 ±0.02
Mud & Sand Staines 1 - 0.67 * 1.8 * - * 22 2.0 - - 2.4 - - 1000 -±0.21 ±0.5 ±0.8 ±0.7 ±1.9
Outfall (Sutton Courtenay) 2 - * * 11 * - * 570 * - - * - - - -±1.1 ±4.7
Mud Newbridge 1 - * * * * - * 8.6 2.1 0.11 1.1 0.45 0.0023 - - -±0.5 ±1.2 ±0.008 ±0.04 ±0.03 ±0.0013
� Lydebank/Ginge Brook 1 - * * 3.0 * - * 25 1.0 - - - - - - -confluence ±0.4 ±0.6 ±0.6
Material Location or No. of Mean radioactivity concentration (wet)a, Bq kg-1
selectionc samplingobserva- Total Total Totaltions 3H 60Co 134Cs 137Cs alpha beta gamma
Terrestrial samples
Milkd Near farms 4 <10 <0.46 <0.33 <0.44 - - -
� Far farms 1 <10 <0.53 <0.3 <0.43 - - -
Apples 1 33 <0.3 <0.2 <0.5 - - -±5.0
Elderberries 1 18 <1 <0.7 <0.9 - - -±4.0
Honey 1 <10 <0.5 <0.4 <0.4 - - -
Potatoes 1 <10 <0.5 <0.4 <0.4 - - -
Rhubarb 1 31 <0.5 <0.4 <0.6 - - -±5.0
Runner beans 1 <10 <0.5 <0.4 <0.4 - - -
Dry cloths 95 - - - - 0.21 0.79 0.67±0.15 ±0.52 ±0.46
- not analysed* not detected by the method useda Except for milk where units are Bq l-1 and for sediment where dry concentrations applyb See section 5 for definitionc Data are arithmetic means unless stated as �max� in this column. �Max� data are selected maxima.
If no �max� value is given, the mean is also the maximum. See section 5 for definition.d The concentration of 3H (organic) was <10 Bq l-1
Table 22(b). Monitoring of radiation dose ratesnear Harwell, 1995
Location Ground No. of µGy h-1
type samplingobserva-tionsa
Gamma dose rates at 1 m over river bank
Outfall (Sutton Courtenay) Mud 1 0.083� Soil 1 0.085Position �E�b Mud 1 0.096� Soil 1 0.093Lydebank/Ginge Brook confluence Mud 1 0.058� Mud and sand 1 0.053Newbridge Mud 1 0.065
a See section 5 for definitionb Near the outfall

87
Table 23(a). Radioactivity in food and the environment near Winfrith, 1995
Material Locationb or selectiond No. of Mean radioactivity concentration (wet)a, Bq kg-1
samplingobserv- 239Pu + 243Cm + Total Total Totalationsc 3H 14C 60Co 131I 137Cs 155Eu 238Pu 240Pu 241Am 244Cm alpha beta gamma
Aquatic samplesPlaice Weymouth Bay 1 - - * * 0.20 * - - * - - - -
±0.11Cod � 1 - - * * 0.29 * - - * - - - -
±0.05Crabs Chapman�s Pool 1 - - 1.3 * * * - - * - - - -
±0.1� Lulworth Banks 1 - - 3.1 * * * - - * - - - -
±0.2Pacific Oysters Poole 1 - - 0.28 * 0.10 * - - * - - - -
±0.06 ±0.05Cockles � 1 - - 1.8 * 0.06 * - - * - - - -
±0.1 ±0.03Whelks Weymouth Bay 1 - - 1.1 * * * - - * - - - -
±0.2� Poole 1 - - 1.2 * * * 0.0013 0.0061 0.008 0.00010 - - -
±0.2 ±0.0001 ±0.0003 ±0.0004 ±0.00003Fucus serratus Kimmeridge 2 - - 2.0 * * * - - * - - 220 -
±0.2� Bognor Rock 2 - - 1.9 0.59 0.09 0.05 - - * - - - -
±0.1 ±0.19 ±0.04 ±0.06Mud & sand Kimmeridge 2 - - 1.7 * 1.1 0.38 - - * - - - -
±0.4 ±0.4 ±0.38� Parkstone Bay 2 - - 2.1 * 0.75 * 0.063 0.32 0.25 0.0025 - - -
±0.6 ±0.40 ±0.005 ±0.01 ±0.01 ±0.00083Mud Hardway 2 - - 8.5 * 3.7 0.83 - - * - - - -
±0.6 ±0.4 ±0.80
Material Locationb or selectiond No. of Mean radioactivity concentration (wet)a, Bq kg-1
samplingobserv- Total Total Totalationsc 3H 14C 60Co 137Cs alpha beta gamma
Terrestrial samplesMilk Near farmse 4 <10 17 <0.44 <0.44 - - -
±3.4� � max 19
±3.5� Far farmse 1 <10 16 <0.45 <0.43 - - -
±3.5Apples 1 <10 15 <0.4 <0.4 - - -
±5.0Cabbagee 1 <10 <15 <0.5 <0.4 - - -
Carrots 1 <10 <15 <0.3 <0.5 - - -
Honey 1 <10 59 <0.8 0.60 - - -±16 ±0.20
Lettucee 1 <10 - - - - - -
Potatoes 1 <10 22 <0.4 <0.4 - - -±6.0
Raspberries 1 <10 15 <0.4 <0.4 - - -±3.0
Grasse 4 <11 - - - - - -±3.5
Dry cloths 106 - - - - 0.10 0.59 0.32±0.10 ±0.50 ±0.24
- not analysed* not detected by the method useda Except for milk where units are Bq l-1, for dry cloths where units are Bq per cloth and for sediment where dryconcentrations applyb Landing point or sampling area.c See section 5 for definitiond Data are arithmetic means unless stated as �max� in this column. �Max� data are selected to be maxima.
If no �max� value is given, the mean is also the maximum. See section 5e The concentration of 3H (organic) was <10 Bq l-1
Table 23(b). Monitoring of radiation dose ratesnear Winfrith, 1995
Location Ground No. of µGy h-1
type samplingobserva-tionsa
Gamma dose rates at 1 m over intertidal areas
Kimmeridge Mud and sand 2 0.070
Parkstone Bay Mud 2 0.052Hardway � 2 0.065
a See section 5 for definition

88
Table 24(a). Radioactivity in food and the environment near Berkeley and Oldbury nuclear power stations, 1995
Material Location or selectionc No. of Mean radioactivity concentration (wet)a, Bq kg-1
samplingobserv- 239Pu+ 241Am 243Cm+ Total Total Totalationsb 3H 14C 35S 60Co 134Cs 137Cs 144Ce 155Eu 238Pu 240Pu 244Cm alpha beta gamma
Aquatic samples
Dover sole Lydney 2 - 210 - * * 0.42 * * - - * - - - -±9 ±0.08
Elvers Littleton Warth 1 - - - * * 0.09 * * - - * - - - -±0.03
Shrimps Lydney 2 - 120 - * * 0.28 * * 0.00018 0.0010 0.0010 0.000009 - - -±7 ±0.05 ±0.00003 ±0.0001 ±0.0001 ±0.000006
Fucus vesiculosus Pipelinee 2 - - - 0.12 * 0.82 * 0.17 - - * - - 170 -±0.04 ±0.06 ±0.12
Mud � 2 - - - * 0.75 22 * 1.6 - - * - - - -±0.42 ±0.6 ±0.7
� Lydney 2 - - - 0.21 0.75 31 * 2.2 - - * - - - -±0.16 ±0.43 ±0.5 ±0.7
� Hills Flats 2 - - - 0.27 0.49 31 1.1 2.2 - - * - - - -±0.25 ±0.48 ±0.7 ±1.0 ±0.7
� 1km south of Oldbury 2 - - - 0.22 0.21 30 * 2.5 - - * - - - -±0.24 ±0.33 ±0.7 ±1.0
Material Location or selectionc No. of Mean radioactivity concentration (wet)a, Bq kg-1
samplingobserv- Total Total Totalationsb 3H 14C 35S 60Co 134Cs 137Cs 144Ce alpha beta gamma
Terrestrial samples
Milkd Near farms 8 <10 17 <1.0 <0.23 <0.24 <0.23 <1.08 - - -±3.1
� � max 20±3.0
Apples 1 <10 <15 <1.0 <0.4 <0.2 <0.4 <1.3 - - -
Blackberries 1 <10 29 <1.0 <0.6 <0.3 <0.5 <2 - - -±5.0
Cabbage 1 <10 <15 <1.0 <0.3 <0.2 <0.3 <1 - - -
Carrots 1 <10 16 <1.0 <0.4 <0.4 <0.4 <1.7 - - -±4.0
Honey 1 <10 73 <1.0 <0.4 <0.4 <0.4 <1.6 - - -±16
Potatoes 1 <10 22 <1.0 <0.4 <0.3 <0.6 <2.3 - - -±5.0
Runner Beans 1 <10 37 <1.0 <0.3 <0.4 <0.5 <1 - - -±5.0
Wheat 1 <10 100 <1.0 <0.6 <0.4 <0.4 <2.5 - - -±18
Dry cloths 168 - - - - - - - 0.15 0.79 0.49±0.16 ±0.54 ±0.38
- not analysed* not detected by the method useda Except for milk where units are Bq l-1, for dry cloths where units are Bq per cloth and for sediment where dry concentrations applyb See section 5 for definitionc Data are arithmetic means unless stated as �Max� in this column. �Max� data are selected to be maxima.
If no �max� value is given, the mean is also the maximum. See section 5d The concentration of 3H (organic) was <10 Bq l-1e Berkeley
Table 24(b). Monitoring of radiation dose ratesnear Berkeley and Oldbury nuclearpower stations, 1995
Location Ground No. of µGy h-1
type samplingobserva-tionsa
Gamma dose rates at 1 m over intertidal areas
1 km south of Oldbury Mud 2 0.0862 km south west of Berkeley� 2 0.065Guscar Rocks � 2 0.083Lydney Locks � 2 0.069Berkeley pipeline (new) � 1 0.089� Shale 1 0.097Sharpness Mud 2 0.073Hills Flats � 1 0.070� Salt marsh 1 0.073
a See section 5 for definition

89
Table 25(a). Radioactivity in food and the environment near Bradwell nuclear power station, 1995
Material Location No. of Mean radioactivity concentration (wet)a, Bq kg-1
or selectionc samplingobserva- 239Pu+ 243Cm+ Total Total Totaltionsb 3H 14C 35S 60Co 65Zn 99Tc 125Sb 134Cs 137Cs 55Eu 238Pu 240Pu 241Am 242Cm 244Cm alpha beta gamma
Aquatic SamplesSole Bradwell 2 - - * * * - * * 0.84 * - - * - - - - -
±0.12Bass Pipeline 1 - - - * * - * 0.48 2.2 * - - * - - - - -
±0.10 ±0.1Mullet � 1 - - - * * - * 0.39 1.9 * - - * - - - - -
±0.09 ±0.1Native oysters Tollesbury N Channel 2 - 13 * 0.04 1.5 - * 0.10 0.35 * 0.00042 0.0017 0.0048 0.0000410.00030 - - -
±5.4 ±0.03 ±0.1 ±0.06 ±0.05 ±0.00004 ±0.0001 ±0.0002 ±0.00002±0.00003Pacific oysters Goldhanger Creek 1 - - - 0.44 1.7 - * * 0.44 * - - * - - - - -
±0.07 ±0.2 ±0.07Winkles Pipeline 2 - - - 0.78 0.98 - * 0.14 0.59 * - - * - - - - -
±0.10 ±0.21 ±0.08 ±0.09Fucus vesiculosus Waterside 2 - - - 0.63 * 2.5 * 0.30 1.4 * - - * - - - - -
±0.09 ±0.2 ±0.08 ±0.1Mud Pipeline 2 - - - 5.0 0.25 - 0.62 2.4 19 1.4 - - 0.55 - - - 230 -
±0.5 ±0.15 ±0.59 ±0.6 ±0.6 ±0.8 ±0.38� West Mersea 2 - - - 1.3 * - * 1.8 16 1.1 - - * - - - - -
±0.4 ±0.6 ±0.7 ±0.6� Maldon 2 - - - 4.9 * - * 6.7 64 1.9 - - 0.48 - - - - -
±0.7 ±0.8 ±12 ±1.1 ±0.65
Material Location No. of Mean radioactivity concentration (wet)a, Bq kg-1
or selectionc samplingobserva- Total Total Totaltionsb 3H 14C 35S 60Co 134Cs 137Cs alpha beta gamma
Terrestrial samplesMilk Near farmsd 3 <10 17 <1.0 <0.44 <0.35 <0.43 - - -
±3.3� � max 18
±3.3� Far farmsd 3 <10 17 <1.0 <0.43 <0.2 <0.3 - - -
±3.4� � max 19
±3.8Apples 2 <10 <18 1.6 <0.45 <0.5 <0.5 - - -
±2.8 ±1.0� max 20 2.1
±4.0 ±1.2Blackberries 1 <10 28 <1.0 <0.3 <0.3 <0.4 - - -
±6.0Cabbage 1 <10 <15 <1.0 <0.5 <0.3 <0.5 - - -
Leeks 1 <10 <15 <1.0 <0.9 <0.5 <0.7 - - -
Potatoes 1 <10 25 <1.0 <0.3 <0.2 <0.3 - - -±4.0
Rabbit 1 <10 29 <3.0 <0.5 <0.2 <0.3 - - -±6.0
Wheat 1 <10 89 <1.0 <0.5 <0.2 <0.4 - - -±14
Lucerne 1 <10 21 1.3 <0.5 <0.4 <0.5 - - -±6.0 ±0.6
Dry cloths 120 - - - - - - 0.23 1.4 0.9±0.16 ±1.0 ±0.61
- not analysed* not detected by the method useda Except for milk where units are Bq l-1, for dry cloths where units are Bq per cloth
and for sediment where dry concentrations applyb See section 5 for definitionc Data are arithmetic means unless stated as �max� in this column. �Max� data are selected to be maxima.
If no �max� value is given, the mean is also the maximum. See section 5d The concentration of 3H (organic) was < 10 Bq l-1
Table 25(b). Monitoring of radiation dose rates nearBradwell, 1995
Location Ground No. of µGy h-1
type samplingobserva-tionsa
Gamma dose rates at 1 m over intertidal areas
Pipeline Mud 2 0.241.5 km east of pipeline � 1 0.072Waterside � 2 0.063West Mersea � 2 0.064Maldon � 2 0.057
a See section 5 for definition

90
Table 26(a). Radioactivity in food and the environment near Dungeness nuclear power stations, 1995
Material Location or selectionc No. of Mean radioactivity concentration (wet)a, Bq kg-1
samplingobserv- 239Pu+ 243Cm+ Total Total Totalationsb 3H 14C 35S 90Sr 60Co 131I 134Cs 137Cs 155Eu 238Pu 240Pu 241Am 242Cm 244Cm alpha beta gamma
Aquatic samplesPlaice Pipeline 2 - - - - * * * 0.20 * - - * - - - - -
±0.10Cod � 2 - - - - * * * 0.28 * - - * - - - - -
±0.07Bass � 1 - - - - * * * 0.65 * - - * - - - - -
±0.15Spiny spider crabs Hastings 1 - - - - 1.4 * * * * - - * - - - - -
±0.4Shrimps Pipeline 2 - 28 - - 0.12 * 0.06 0.31 * - - * - - - - -
±10 ±0.08 ±0.04 ±0.09Whelks � 2 - - - 0.014 0.42 * * 0.05 * 0.0010 0.0036 0.0049 0.00002 0.00059 - - -
±0.004 ±0.08 ±0.04 ±0.0001 ±0.0002 ±0.0002 ±0.00002±0.00053Fucus vesiculosus Copt Point 2 - - - - 0.73 0.09 * 0.15 * - - * - - - 200 -
±0.09 ±0.07 ±0.07Mud & sand Rye Harbour 1 - - - - 3.7 * * 1.8 * 0.080 0.38 0.27 0.0018 0.019 - - -
±0.5 ±0.3 ±0.007 ±0.02 ±0.01 ±0.0015 ±0.003Sand Camber Sands 2 - - - - 1.0 * * 0.14 * - - * - - - - -
±0.3 ±0.12� Pilot Inn 2 - - - - 1.7 * * 0.94 0.66 - - * - - - - -
±0.3 ±0.19 ±0.53Sea water Pipeline 2 * - - - - - - - - - - - - - - - -
Material Location or selectionc No. of Mean radioactivity concentration (wet)a, Bq kg-1
samplingobserv- 239Pu+ Total Total Totalationsb 3H 14C 35S 90Sr 60Co 131I 134Cs 137Cs 238Pu 240Pu 241Am alpha beta gamma
Terrestrial samplesMilkf Far farmsd 2 <10 <23 <1.0 - <0.45 <0.33 * <0.45 - - - - - -
±3.9� � � max <24
±4.0� � � sub-setsd 1 - - - - <0.3 <0.10 <0.3 <0.30 - - - - - -
Barley 1 <10 87 <1.0 - <0.6 - <0.4 <0.40 - - - - - -±13
Blackberriesd 1 <10 27 <1.0 - <0.5 - <0.3 <0.40 - - - - - -±6.0
Green Beansd 1 <10 <15 <1.0 - <0.3 - <0.4 <0.50 - - - - - -
Honey 1 <10 65 <1.0 - <0.5 - <0.4 <0.40 - - - - - -±17
Potatoesd 1 <10 14 <1.0 - <0.2 - <0.2 <0.30 - - - - - -±3.0
Sea Kaled 1 <10 14 2.2 - <0.4 - <0.2 1.1 - - - - - -±3.0 ±0.6 ±0.1
Ovine Muscled 1 <10 26 <3.0 <0.20 <0.4 - - <0.20e <0.0002 <0.0002 <0.0005 - - -±10
Ovine Offald 1 <10 30 <3.0 0.73 <0.4 - - 0.29e <0.0002 <0.0002 <0.0003 - - -±6.0 ±0.05 ±0.07
Dry cloths 96 - - - - - - - - - - - 0.34 1.9 1.2±0.27 ±1.3 ±0.82
- not analysed* not detected by the method useda Except for milk and seawater where units are Bq l-1, for dry cloths where units are Bq per cloth and for sediment where dry concentrations applyb See section 5 for definitionc Data are arithmetic means unless stated as �max� in this column. �Max� data are selected to be maxima.
If no �max� value is given, the mean is also the maximum. See section 5d The concentration of 3H (organic) was 10 Bq l-1e Total Csf There are no farms producing milk near this site
Table 26(b). Monitoring of radiationdose rates near Dungenessnuclear power stations,1995
Location Ground type No. of µGy h-1
samplingobserva-tionsa
Gamma dose rates at 1 m over intertidal areas
Camber Sands Sand 2 0.052
Old Lifeboat Station Stones 2 0.045
Pilot Inn Sand 2 0.055
Rye Harbour Mud and sand 2 0.064
Beta dose rates µSv h-1
Rye Harbour Mud and sand 1 *
a See section 5 for definition* Not detected by the method used

91
Table 27(a).Radioactivity in food and the environment near Hartlepool nuclear power station, 1995
Material Locationb or selectiond No. of Mean radioactivity concentration (wet)a, Bq kg-1
samplingobserv- 239Pu + 243Cm + Total Total Totalationsc 3H 14C 35S 99Tc 131I 137Cs 155Eu 238Pu 240Pu 241Am 242Cm 244Cm alpha beta gamma
Aquatic samplesPlaice Pipeline 2 - 31 - - * 0.38 * - - * - - - - -
±7.7 ±0.05Cod � 2 - - - - * 1.2 * - - * - - - - -
±0.1Crabs � 2 - - - - * 0.26 * 0.00030 0.0018 0.0015 * * - - -
±0.12 ±0.00003 ±0.0001 ±0.0001Winkles South Gare 2 - - - - * 0.40 * 0.0093 0.051 0.034 0.000054 0.000056 - - -
±0.09 ±0.0004 ±0.001 ±0.001 ±0.000039 ±0.000022Fucus vesiculosus Pilot Station 2 - - - 30 15 0.51 * - - * - - - 250 -
±2.4 ±0.8 ±0.07Mud Greatham Creek 2 - - - - * 12 2.6 - - * - - - - -
±0.6 ±0.8� Paddy�s Hole 2 - - - - * 22 1.0 - - * - - - - -
±1.1 ±1.0Coal & sand Little Scar 2 - - - - * 2.3 0.69 - - * - - - - -
±0.3 ±0.44Sea water Pipeline 2 16 - - - - - - - - - - - - - -
±1.8
Material Locationb or selectiond No. of Mean radioactivity concentration (wet)a, Bq kg-1
samplingobserv- Total Total Totalationsc 3H 14C 35S 131I 137Cs alpha beta gamma
Terrestrial samplesMilk Near farmse 1 <10 20 <1.0 <0.20 <0.5 - - -
±4.0 ±0.5� � sub-sets 1 - - - <0.10 <0.3 - - -
� Far farmse 4 <10 <18 <1.0 <0.20 <0.44 - - -±3.8
� � max 20±3.7
� � sub-sets 2 - - - <0.10 - - - -
Cabbagee 3 <10 <15 <1.0 - <0.45 - - -� sub-sets 1 - - - - <0.3 - - -Cauliflowere 1 <10 <15 <1.0 - <0.7 - - -Honey 1 <10 78 <1.0 - <0.6 - - -
±20Potatoese 1 <10 21 <1.0 - <0.4 - - -
±5.0Sloe Berriese 1 <10 24 <1.0 - <0.4 - - -
±5.0Swedee 1 <10 <15 <1.0 - <0.5 - - -Wheat 1 <10 120 <1.0 - <0.4 - - -
±21Dry cloths 120 - - - - - 0.37 1.7 1.2
±0.36 ±1.2 ±1.0
- not analysed* not detected by the method useda Except for milk and seawater where units are Bq l-1, for dry cloths where units are Bq per cloth and for sediment where
dry concentrations applyb Landing point or sampling areac See section 5 for definitiond Data are arithmetic means unless stated as �max� in this column. �Max� data are selected to be maxima.
If no �max� value is given, the mean is also the maximum. See section 5e The concentration of 3H (organic) was <10 Bq l-1
Table 27(b). Monitoring of radiation dose ratesnear Hartlepool nuclear powerstation, 1995
Location Ground type No. of µGy h-1
samplingobserva-tionsa
Gamma dose rates at 1 m over intertidal areas
Greatham Creek Mud and sand 2 0.072
Little Scar Coal and sand 2 0.054
North Gare Sand 2 0.055
Paddy�s Hole Mud 2 0.086
Beta dose rates µSv h-1
Little Scar Coal and sand 2 0.099
a See section 5 for definition

92
Table 28(a). Radioactivity in food and the environment near Heysham nuclear power stations, 1995
Material Locationb No. of Mean radioactivity concentration (wet)a, Bq kg-1
or selectionc samplingobserv- 239Pu+ationsd 3H 14C 35S 54Mn 60Co 90Sr 99Tc 106Ru 110mAg 125Sb 131I 134Cs 137Cs 154Eu 155Eu 238Pu 240Pu
Aquatic samplesFlounder Flookburgh 4 - 87 - * * - - * * * - 0.02 32 * * 0.00064 0.0033
±8.8 ±0.03 ±0.7 ±0.00004 ±0.0001Plaice Morecambe 5 - - - * * - - * * * - 0.03 10 * * - -
±0.06 ±0.3Bass � 2 - - - * * - - * * * - * 29 * * - -
±0.4Whitebait Sunderland Point 1 - - - * * 0.15 - * * * - * 8.4 * * 0.024 0.13
±0.03 ±0.2 ±0.001 ±0.004Cockles Middleton Sands 2 - - - * 1.0 - - 1.3 * 0.18 - * 4.6 0.08 0.06 0.34 1.8
±0.1 ±0.5 ±0.12 ±0.1 ±0.11 ±0.06 ±0.02 ±0.1� Flookburgh 2 - 110 - * 0.98 0.71 26 2.0 * 0.24 - * 6.1 0.24 * 0.65 3.4
±8.1 ±0.07 ±0.05 ±2.0 ±0.4 ±0.15 ±0.1 ±0.14 ±0.03 ±0.1Winkles Red Nab Point 4 - - - * 0.49 - - 1.6 0.83 0.35 - * 5.1 * * 0.31 1.8
±0.08 ±0.7 ±0.14 ±0.15 ±0.1 ±0.02 ±0.1Shrimps Flookburgh 4 - 110 - * * 0.12 21 * * * - * 10 * * 0.0048 0.025
±10 ±0.02 ±1.7 ±0.3 ±0.0003 ±0.001Mussels Morecambe 4 - 110 - * 0.44 - 250 1.6 * 0.35 - * 3.0 * 0.05 0.29 1.5
±9.0 ±0.08 ±20 ±0.6 ±0.16 ±0.1 ±0.1 ±0.02 ±0.04� NW Morecambe Bay 2 - - - * 0.39 - - 0.92 * 0.23 - * 4.1 * 0.09 0.25 1.3
±0.11 ±0.45 ±0.14 ±0.2 ±0.09 ±0.01 ±0.04� � e 1 - - - * 0.40 - - 2.2 * 0.40 - * 3.3 * * - -
±0.08 ±0.7 ±0.15 ±0.1Fucus vesiculosus Half Moon Bay 4 - - - * 0.53 - 10000 * * 0.89 - * 12 * 0.06 - -
±0.10 ±830 ±0.29 ±0.2 ±0.06Samphire Cockerham Marsh 1 - - - * 0.02 - - * * * - * 3.6 * * - -
±0.02 ±0.1Mud & sand Flookburgh 4 - - - * * - - * * * - * 110 * 0.50 - -
±1.6 ±0.59� Half Moon Bay 3 - - - 0.20 4.6 - - 17 * 2.7 - 0.29 250 2.3 2.7 14 71
±0.25 ±0.6 ±6.3 ±1.6 ±0.39 ±2.4 ±1.2 ±1.7 ±0.6 ±1.6� Sunderland Point 4 - - - * 2.9 - - 11 * 1.7 - 0.35 210 0.83 2.5 - -
±0.7 ±5.8 ±1.5 ±0.60 ±2.4 ±1.1 ±1.2� Morecambe 4 - - - * 2.9 - - 19 * 1.5 - * 230 2.4 2.0 - -
Central Pier ±0.8 ±6.7 ±1.2 ±2.6 ±1.5 ±1.7Turf Conder Green 4 - - - * 2.0 - - * * 3.4 - 0.51 590 2.3 3.0 - -
±1.1 ±3.1 ±0.83 ±8.0 ±3.1 ±3.2� Sand Gate Marsh 4 - - - * 1.0 - - * * * - * 250 * * - -
±0.8 ±3.7Mud Half Moon Bay 1 - - - * 4.1 - - 17 * 4.0 - * 270 2.4 2.2 - -
±0.5 ±5.1 ±1.7 ±2.2 ±1.0 ±1.3Sea water Pipeline 2 11 - - - - - - - - - - - - - - - -
±2.1� Half Moon Bay 1 - - - - - - - - - 0.004 0.38 - - - - - -
±0.002 ±0.002Terrestrial samplesMilk Near farmsf 8 <10 <18 <1.0 - <0.4 - - <3.22 <0.54 - <0.20 <0.35 <0.44 - - - -
±0.9 ±3.6� � max <11 21 <0.48
±2.5 ±4.1� � sub-sets 2 - - - - <0.3 - - <1.78 <0.35 - <0.10 <0.25 <0.30 - - - -
� Far farmsf 2 <10 <16 <1.0 - <0.4 - - <3.43 <0.56 - - <0.33 <0.44 - - - -±3.2
� � max <17 <0.45±3.3
Applesf 1 <10 16 <1.0 - <0.5 - - <3.2 <0.2 - - <0.3 <0.40 - - - -±3.0
Barley 1 <10 70 <1.0 - <0.5 - - <3.8 <0.6 - - <0.4 <0.40 - - - -±18
Blackberriesf 1 <10 <15 <1.0 - <0.7 - - <4 <1.4 - - <0.9 <1.0 - - - -Cabbagef 1 <10 13 <1.0 - <0.3 - - <2 <0.3 - - <0.2 <0.30 - - - -
±3.0Potatoesf 1 <10 17 <1.0 - <0.6 - - <3.9 <0.6 - - <0.4 <0.50 - - - -
±4.0Sproutsf 1 <10 15 <1.0 - <0.6 - - <3.9 <0.6 - - <0.6 <0.80 - - - -
±4.0Dry cloths 95 - - - - - - - - - - - - - - - - -

93
Table 28(a). continued
Material Locationb No. of Mean radioactivity concentration (wet)a, Bq kg-1
or selectionc samplingobserva- 243Cm+ Total Total Totaltionsd 241Pu 241Am 242Cm 244Cm alpha beta gamma
Aquatic samplesFlounder Flookburgh 1 - 0.0045 * 0.000011 - - -
±0.0001 ±0.000004Plaice Morecambe 5 - * - - - - -
Bass � 2 - * - - - - -
Whitebait Sunderland Point 1 1.5 0.18 * * - - -±0.2 ±0.001
Cockles Middleton Sands 2 - 4.9 * 0.011 - - -±0.1 ±0.004
� Flookburgh 2 41 8.4 * 0.015 - - -±1.2 ±0.2 ±0.007
Winkles Red Nab Point 4 - 2.9 * 0.0057 - - -±0.1 ±0.0026
Shrimps Flookburgh 4 0.62 0.039 * 0.000068 - - -±0.36 ±0.001 ±0.000037
Mussels Morecambe 4 - 2.6 * 0.0072±0.1 ±0.0028
� NW Morecambe Bay 2 - 2.3 * 0.0049 - - -±0.1 ±0.0022
� � e 1 - 2.2 - - - - -±0.2
Fucus vesiculosus Half Moon Bay 4 - 1.0 - - - 6900 -±0.3
Samphire Cockerham Marsh 1 - 1.4 - - - 44 -±0.1
Mud & sand Flookburgh 4 - 39 - - - - -±2.7
� Half Moon Bay 3 - 110 * 0.099±3.3 ±0.073
� Sunderland Point 4 - 87 - - - - -±3.6
� Morecambe 4 - 150 - - - - - Central Pier ±5.0
Turf Conder Green 4 - 230 - - - - -±11
� Sand Gate Marsh 4 - 82 - - - - -±4.6
Mud Half Moon Bay 1 - 140 - - - - -±3.2
Sea water Pipeline 2 - - - - - - -
� Half Moon Bay 1 - - - - - - -Terrestrial samplesMilk Near farmsf 8 - - - - - - -� � max� � sub-sets 2 - - - - - - -� Far farmsf 2 - - - - - - -� � maxApplesf 1 - - - - - - -Barley 1 - - - - - - -
Blackberriesf 1 - - - - - - -
Cabbagef 1 - - - - - - -
Potatoesf 1 - - - - - - -
Sproutsf 1 - - - - - - -
Dry cloths 95 - - - - 0.18 1.0 0.58±0.18 ±0.9 ±0.42
Table 28(b). Monitoring of radiation dose ratesnear Heysham nuclear powerstations, 1995
Location Ground No. of µGy h-1
type samplingobserva-tionsa
Gamma dose rates at 1 m over intertidal areas
Greenodd Salt marsh 2 0.086Sand Gate marsh � 4 0.11Flookburgh Mud and sand 4 0.075High Foulshaw Salt marsh 4 0.094Arnside Mud and sand 4 0.069� Salt marsh 4 0.11Morecambe Central Pier Mussel bed 4 0.078� Mud 2 0.078� Mud and sand 2 0.086Half Moon Bay � 4 0.082Pipeline � 4 0.075Red Nab Point Mud and sand 4 0.080Sunderland Point � 4 0.086Sunderland Mud, sand
and stones 4 0.080Colloway Marsh Salt marsh 4 0.16Lancaster � 4 0.11Aldcliffe Marsh � 4 0.14Conder Green Mud 1 0.096� Mud and sand 3 0.10� Salt marsh 4 0.13Cockerham Marsh Salt marsh 4 0.11
a See section 5 for definition
- not analysed* not detected by the method useda Except for milk and seawater where units are Bq l-1, for dry cloths where
units are Bq per cloth and for sediment where dry oncentrations applyb Landing point or sampling area.c Data are arithmetic means unless stated as �max�. �Max� data are selected
to be maxima. If no �max� value is given, the mean is also the maximum.See section 5 for definition.
d See section 5 for definitione Uncooked samplef The concentration of 3H (organic) was <10 Bq l-1

94
Table 29(a). Radioactivity in food and the environment near Hinkley Point nuclear power stations, 1995
Material Locationb or No. of Mean radioactivity concentration (wet)a, Bq kg-1
selectiond samplingobserv- 239Pu+ 243Cm+ Totalationsc 3H 14C 35S 54Mn 60Co 65Zn 95Zr 131I 134Cs 137Cs 144Ce 155Eu 238Pu 240Pu 241Am 242Cm 244Cm beta
Aquatic samples
Flounder Stolford 2 - 110 * * * * * * 0.05 0.66 * * - - * - - -±9.4 ±0.03 ±0.14
Shrimps � 2 - 83 * * * * * * 0.13 0.65 * * 0.00044 0.0017 0.0021 0.00038 0.000063 -±8.0 ±0.05 ±0.06 ±0.00004 ±0.0001 ±0.0001 ±0.00007 ±0.00002
Fucus vesiculosus Pipeline 2 - - - 2.9 3.4 0.58 * * 1.6 6.4 0.74 * - - * - - 240±0.1 ±0.1 ±0.17 ±0.1 ±0.2 ±0.54
Mud & sand � 2 - - - 0.71 1.5 * * * 4.1 19 3.5 * - - * - - -±0.50 ±0.4 ±0.7 ±0.8 ±2.4
� River Parrett 2 - - - 0.43 0.21 * * * 2.5 40 * 1.8 - - * - - -±0.3 ±0.30 ±0.7 ±1.0 ±1.3
Mud 1.6km east 2 - - - * 0.52 * 0.90 * 3.4 31 * 1.9 - - * - - -of pipeline ±0.33 ±1.0 ±1.0 ±1.1
Sea water Pipeline 2 380 - - - - - - - - - - - - - - - - -±5.3
Material Locationb or No. of Mean radioactivity concentration (wet)a, Bq kg-1
selectiond samplingobserv- Total Total Totalationsc 3H 14C 35S 60Co 95Zr 131I 134Cs 137Cs 144Ce alpha beta gamma
Terrestrial samples
Milk Near farmse 7 <10 <19 <1.0 <0.44 <1.36 <0.20 <0.31 <0.4 <1.71 - - -±3.5
� � max <28±4.5
� � sub-sets 2 - - - <0.3 <1.1 <0.10 <0.2 <0.27 <1.02 - - -
� Far farmse 2 <10 <18 <1.0 <0.44 <1.44 - <0.33 <0.42 <2.04 - - -±3.5
� � max <20±3.7
Applese 1 <10 16 <1.0 <0.4 <0.9 - <0.2 <0.4 <1.5 - - -±4.0
Blackberriese 1 <10 28 <1.0 <0.4 <0.7 - <0.3 <0.4 <1.7 - - -±4.0
Honey 1 <10 93 <1.0 <0.5 <1.7 - <0.4 <0.5 <1.4 - - -±13
Kalee 1 <10 16 <1.0 <0.5 <1.7 - <0.2 <0.5 <2.6 - - -±3.0
Leekse 1 <10 <15 <1.0 <0.6 <2.4 - <0.4 <0.7 <0.9 - - -
Potatoese 1 <10 39 2.5 <0.3 <0.6 - <0.2 <0.3 <1 - - -±5.0 ±0.5
Wheat 1 <10 110 14 <0.6 <0.8 - <0.3 <0.5 <2 - - -±13 ±1.4
Fodder Beete 1 <10 19 <1.0 <0.5 <0.5 - <0.3 <0.5 <2 - - -±5.0
Dry cloths 107 - - - - - - - - - 0.28 1.5 1.1±0.24 ±0.98 ±0.73
- not analysed* not detected by the method useda Except for milk and seawater where units are Bq l-1, for dry cloths where units are Bq per cloth and for sediment where
dry concentrations applyb Landing point or sampling area.c See section 5 for definitiond Data are arithmetic means unless stated as �max� in this column. �Max� data are selected to be maxima.
If no �max� value is given, the mean is also the maximum. See section 5e The concentration of 3H (organic) was <10 Bq l-1
Table 29(b). Monitoring of radiation dose rates near Hinkley Point nuclear power stations, 1995
Location Ground type No. of µGy h-1
samplingobserva-tionsa
Gamma dose rates at 1 m over intertidal areas
0.8 km east of pipeline Mud 1 0.059
� Mud and sand 1 0.097
0.8 km west of pipeline Mud 1 0.23
� Mud and sand 1 0.21
1.6 km east of pipeline Mud 1 0.068
� Mud and sand 1 0.083
Pipeline Mud 1 0.11
� Mud and sand 1 0.11
River Parrett Mud 1 0.079
� Mud and sand 1 0.070
a See section 5 for definition

95
Table 30(a). Radioactivity in food and the environment near Sizewell nuclear power stations, 1995
Material Locationb No. of Mean radioactivity concentration (wet)a, Bq kg-1
or selectionc samplingobserv- 239Pu+ 243Cm+ Total Total Totalationsd 3H 14C 35S 58Co 60Co 65Zn 137Cs 155Eu 238Pu 240Pu 241Am 244Cm alpha beta gamma
Aquatic samplesCod Sizewell 1 - - - * * * 0.69 * - - * - - - -
±0.08Dover sole � 1 - - - * * * 0.43 * - - * - - - -
±0.19Shrimps � 1 - - - * * * 0.89 * 0.00029 0.0015 0.0025 * - - -
±0.19 ±0.00006 ±0.0002 ±0.0002Crabs � 2 - 30 - 0.08 0.13 * 0.26 * 0.00021 0.0012 0.0025 0.00006 - - -
±11 ±0.07 ±0.08 ±0.07 ±0.00004 ±0.0001 ±0.0001 ±0.00020Pacific oysters Blyth estuary 1 - - - * * 0.13 0.21 * - - * - - - -
±0.08 ±0.05Whelks Dunwich 1 - - - * 0.16 * * * - - * - - - -
±0.10Mud Southwold 2 - - - 0.52 3.6 * 14 0.83 - - * - - 760 -
±0.26 ±0.7 ±1.0 ±0.68Sand Rifle Range 2 - - - * * * 0.37 * - - * - - - -
±0.16� Aldeburgh 2 - - - * * * 0.30 * - - * - - - -
±0.15Sea water � 2 * - - - - - - - - - - - - - -
Material Locationb No. of Mean radioactivity concentration (wet)a, Bq kg-1
or selectionc samplingobserv- Total Total Totalationsd 3H 14C 35S 60Co 137Cs alpha beta gamma
Terrestrial samplesMilke Near farms 3 <10 <17 <1.0 <0.43 <0.44 - - -
±3.5� � max <18 <0.53 <0.48 - - -
±3.3� � sub-sets 1 - - - <0.23 <0.23 - - -
� Far farms 4 <10 <18 <1.0 <0.46 <0.46 - - -±3.2
� � max 20 <0.50 <0.50 - - -±3.3
Apples 1 <10 14 <1.0 <0.40 <0.40 - - -±4.0
Blackberries 1 <10 <15 1.1 <0.40 <0.40 - - -±0.8
Cabbage 1 <10 <15 <1.0 - - - - -
� sub-sets 1 - - - <0.30 <0.30 - - -
Carrots 1 <10 12 <1.0 <0.30 <0.40 - - -±3.0
Honey 1 <10 79 <1.0 <0.50 <0.60 - - -±18
Potatoes 1 <10 22 <1.0 <0.40 <0.40 - - -±3.0
Runner Beans 1 <10 <15 <1.0 <0.40 <0.40 - - -
Wheat 1 <10 91 <1.1 <0.60 <0.50 - - -±12
Dry cloths 117 - - - - - 0.21 1.2 0.94±0.16 ±0.99 ±0.88
- not analysed* not detected by the method useda Except for milk and seawater where units are Bq l-1, for dry cloths where units are Bq per cloth and for sediment where dry concentrations applyb Landing point or sampling area.c Data are arithmetic means unless stated as �max�. �Max� data are selected to be maxima.
If no �max� value is given, the mean is also the maximum. See section 5 for definition.d See section 5 for definitione The concentration of 3H (organic) was <10 Bq l-1
Table 30(b). Monitoring of radiation dose rates nearSizewell nuclear power station, 1995
Location Ground type No. of µGy h-1
samplingobserva-tionsa
Gamma dose rates at 1 m over intertidal areas
Pipeline Sand 2 0.14Dunwich � 2 0.045Rifle range � 2 0.045Sizewell Hall � 2 0.046Aldeburgh Sand and gravel 2 0.045Southwold Harbour Mud 2 0.062
Beta dose rates µSv h-1
Southwold Harbour Mud 2 0.23
a See section 5 for definition

96
Table 31(a). Radioactivity in food and the environment near Trawsfynydd nuclear power station, 1995
Material Location or No. of Mean radioactivity concentration (wet)a, Bq kg-1
selectionc samplingobserva-tionsb 3H 14C 35S 60Co 90Sr 106Ru 125Sb 134Cs 137Cs 144Ce 154Eu 155Eu 238Pu 239+240Pu 241Pu 241Am
Freshwater samplesBrown trout Lake 6 - 30 * * 7.8 * * 9.1 140 * * * 0.00013 0.00037 - 0.00054
±8.4 ±0.1 ±0.4 ±1.4 ±0.00002 ±0.00003 ±0.00004Rainbow trout � 6 - - * * 0.68 * * 0.45 6.4 * * * 0.000077 0.00029 - 0.00054
±0.01 ±0.21 ±0.4 ±0.000014 ±0.00002 ±0.00004� Hatchery 1 - - - * - * * 0.39 5.6 * * * - - - *
±0.15 ±0.2Perch Lake 4 - - * * 4.7 * * 20 330 * * * 0.00020 0.00060 - 0.0010
±0.1 ±1.2 ±3.4 ±0.00002 ±0.00004 ±0.00006Rudd � 1 - - - * - * * 21 310 * * * - - - *
±0.9 ±2.9Fontinalis Afon Prysor 2 - - - * - * * 0.22 11 * * 1.4 - - - *
±0.24 ±0.5 ±0.5� Gwylan Stream 2 - - - 25 - 18 31 4.9 100 * 2.0 4.6 - - - 3.7
±1.2 ±5.9 ±2.0 ±1.0 ±1.6 ±1.5 ±0.8 ±0.4Mud Pipeline 2 - - - 47 - 130 85 140 2100 47 16 11 - - - 40
(bankside) ±2.9 ±23 ±11 ±3.9 ±12 ±11 ±4.3 ±5.1 ±5.1� Hot lagoon 2 - - - 97 - 86 330 150 6100 23 37 20 40 100 2200 160
±8.9 ±66 ±36 ±9.7 ±42 ±19 ±15 ±9.7 ±3.5 ±6.6 ±100 ±5.1� Barrier wall 2 - - - 130 - 280 700 230 6500 76 51 31 - - - 180
±6.9 ±58 ±28 ±7.8 ±28 ±24 ±11 ±12 ±20� South end of lake 3 - - - 2.1 - 3.0 13 24 920 * * 2.4 - - - 2.2
±0.5 ±4.7 ±3.9 ±1.4 ±5.0 ±1.6 ±2.0Mud, sand and Gwylan Stream 2 - - - 6.9 - * 37 40 1500 * * * - - - *stones ±1.1 ±6.7 ±1.9 ±8.5Peat Below Maentwrog 1 - - - 670 - 520 770 160 3200 110 64 46 - - - 120
power station ±10 ±48 ±21 ±7.4 ±18 ±22 ±8.6 ±11 ±20Water Bailey bridge 4 2.1 - - - - - - 0.010 0.091 - - - - - - -
±1.7 ±0.003 ±0.003� Cold lagoon 4 - - - - - - - 0.0064 0.067 - - - - - - -
±0.0030 ±0.002� Afon Prysor 2 - - - - - - - * 0.0060 - - - - - - -
±0.0014Terrestrial samplesMilk Near farmsd 1 <10 16 <1.0 <0.5 <0.20 <2.5 <0.75 - <0.22e <2.25 <0.45 <0.7 <0.0002 <0.0002 <0.1 <0.0002
±3.3 ±0.01� sub-sets 1 - - - <0.2 0.082 <1.7 <0.5 <0.2 <0.3 <1.25 <0.3 <0.4 - - - -
±0.009 ±0.07� Far farmsd 1 <10 17 <1.0 <0.4 <0.20 <3.38 <0.8 - <0.24e <1.8 <0.43 <0.58 <0.0002 <0.0002 <0.1 <0.0002
±2.9 ±0.02Blackberries 1 <10 16 <1.0 <0.4 - <2.8 <0.7 <0.3 1.2 <1.7 <0.5 <0.6 <0.0002 <0.0002 - 0.0003
±3.0 ±0.1 ±0.0003Cabbage 1 <10 <15 <1.0 <0.6 - <1.8 <0.8 <0.3 <0.50 <1.7 <0.6 <0.6 <0.0002 0.0004 - <0.0007
±0.0003Eggs 1 <10 20 <1.0 <0.4 - <3.1 <0.8 <0.3 <0.40 <1.4 <0.4 <0.6 <0.0002 <0.0002 - 0.0003
±4.0 ±0.0003Hazelnuts 1 <10 66 <1.0 <0.5 - <3.8 <1.6 <0.6 6.9 <1.6 <0.4 <0.5 <0.0002 <0.0002 - <0.0002
±9.0 ±0.4Ovine muscle 2 <10 30 <3.0 <0.65 <0.2 <3.8 <1.7 - 9.2e <2.65 <0.6 <0.85 <0.0002 <0.0002 - <0.0003
±8.0 ±0.6 ±0.0002� Max 32 15e
±8.0 ±0.8Ovine offal 2 <10 43 <3.0 <0.5 0.44 <3.9 <1.1 - 14e <2.45 <0.45 <0.65 - - - -
±8.5 ±0.05 ±0.8� Max 44 0.63 22e
±8.0 ±0.05 ±1.1Potatoes 1 <10 32 <1.0 <0.4 - <1.9 <0.6 <0.3 0.30 <1.3 <0.4 <0.4 <0.0002 0.0014 - 0.0006
±8.0 ±0.10 ±0.0004 ±0.0003Spinach 1 <10 <15 <1.0 <0.4 - <2.2 <0.9 <0.3 <0.50 <1.6 <0.4 <0.6 <0.0002 0.0006 - 0.0007
±0.0003 ±0.0005Grassd 2 <10 - - - - - - - - - - - - - - -
Dry cloths 123 - - - - - - - - - - - - - - - -

97
Table 31(a). continued
Material Location or No. of Mean radioactivity concentration (wet)a, Bq kg-1
selectionc samplingobserva- Total Total Totaltionsb 242Cm 243+244Cm alpha beta gamma
Freshwater samplesBrown trout Lake 6 * 0.000019 - - -
±0.000006Rainbow trout � 6 * 0.000010 - - -
±0.000004� Hatchery 1 - - - - -
Perch Lake 4 0.000009 0.000029 - - -±0.000008 ±0.000008
Rudd � 1 - - - - -
Fontinalis Afon Prysor 2 - - - - -
� Gwylan Stream 2 - - - - -
Mud Pipeline 2 - - - - - (bankside)
� Hot lagoon 2 0.67 5.3 - 7100 -±0.33 ±0.7
� Barrier wall 2 - - - - -
� South end of lake 3 - - - - -
Mud, sand and Gwylan Stream 2 - - - - -stonesPeat Below Maentwrog 1 - - - - -
power stationWater Bailey bridge 4 - - - - -
� Cold lagoon 4 - - - - -
� Afon Prysor 2 - - - - -
Terrestrial samplesMilk Near farmsd 1 - - - - -� sub-sets 1 - - - - -� Far farmsd 1 - - - - -Blackberries 1 - - - - -Cabbage 1 - - - - -Eggs 1 - - - - -Hazelnuts 1 - - - - -Ovine muscle 2 - - - - -� maxOvine offal 2 - - - - -� maxPotatoes 1 - - - - -Spinach 1 - - - - -Grassd 2Dry cloths 123 - - 0.29 1.6 0.63
±0.29 ±1.2 ±0.37
- not analysed* not detected by the method useda Except for milk and water where units are Bq l-1, for dry cloths where units are Bq per cloth
and for sediment where dry concentrations applyb See section 5 for definitionc Data are arithmetic means unless stated as �max� in this column. �Max� data are selected to be maxima.
If no �max� value is given, the mean is also the maximum. See section 5 for definitiond The concentration of 3H (organic) was <10 Bq l-1e Total Cs
Table 31(b). Monitoring of radiation dose rates nearTrawsfynydd nuclear power station,1995
Location Ground No. of µGy h-1
type samplingobserva-tionsa
Gamma dose rates at 1 m over areas near lake shoreline
Bailey Bridge Peat 2 0.081� Rock 1 0.092South end of lake Peat 4 0.081� Mud 1 0.085� Stones 1 0.088Cae Adda boat mooring Peat 3 0.071Footbridge Rock 1 0.10Nant Islyn Bay Mud, sand and
stones 1 0.094West of footbridge Stones 1 0.099
a See section 5 for definition

98
Table 32(a). Radioactivity in food and the environment near Wylfa nuclear power station, 1995
Material Location No. of Mean radioactivity concentration (wet)a, Bq kg-1
or selectionc samplingobserva- Total Total Totaltionsb 3H 14C 35S 60Co 65Zn 99Tc 110mAg 125Sb 137Cs 238Pu 239+240Pu 241Pu 241Am 243+244Cm alpha beta gamma
Aquatic samples
Plaice Pipeline 2 - 31 - * * - * * 1.8 - - - * - - - -±9.1 ±0.1
Crabs � 2 - - - 0.017 * 1.3 0.69 * 0.55 0.0050 0.023 - 0.18 * - - -±0.01 ±0.1 ±0.11 ±0.08 ±0.0003 ±0.001 ±0.006
Winkles Cemaes Bay 2 - - - * 0.32 - * * 1.6 0.060 0.32 4.4 0.41 0.0011 - - -±0.31 ±0.2 ±0.003 ±0.007 ±0.5 ±0.01 ±0.0005
Fucus vesiculosus � 2 - - - * * - * 0.17 1.8 - - - * - - 710 -±0.15 ±0.1
Mud Cemlyn Bay 2 - - - * * - * * 180 4.2 23 - 33 0.061 - - -±3.1 ±0.3 ±0.8 ±0.9 ±0.027
Seawater Cemaes Bay 1 - - - - - - - - 0.01 - - - - - - - -±0.01
Material Location No. of Mean radioactivity concentration (wet)a, Bq kg-1
or selectionc samplingobserva- Total Total Totaltionsb 3H 14C 35S 60Co 110mAg 137Cs alpha beta gamma
Terrestrial samples
Milk Near farmsd 5 <10 <17 <1.1 <0.46 <0.56 <0.44 - - -±3.4 ±0.2
� � max 19 <1.3 <0.50±3.6 ±0.4
� � sub-sets 2 - - - <0.28 <0.3 <0.30 - - -
� Far farmsd 1 <10 17 <1.0 <0.48 <0.58 <0.45 - - -±3.3
Apples 1 <10 18 <1.0 <0.4 <0.5 <0.40 - - -±5.0
Barley 1 <10 110 4.6 <0.6 <0.4 <0.40 - - -±15 ±0.4
Blackberries 1 <10 13 <1.0 <0.4 <0.4 <0.40 - - -±4.0
Cabbage 1 <10 <15 <1.0 <0.8 <1 <0.80 - - -
Carrots 1 <10 <15 <1.0 <0.5 <0.5 <0.50 - - -
Goats milk 2 <10 19 <1.0 <0.45 <0.5 <0.40 - - -±3.5
� max 21±4.0
Mushrooms 1 <10 <15 <1.0 <0.8 <1 <0.70 - - -
Potatoes 1 <10 23 <1.0 <0.6 <0.6 <0.50 - - -±5.0
Runner beans 1 <10 <15 <1.0 <0.7 <0.8 <0.70 - - -
Dry cloths 94 - - - - - - 0.28 1.7 0.66±0.20 ±0.9 ±0.46
- not analysed* not detected by the method useda Except for milk and sea water where units are Bq l-1, for dry cloths where units are Bq per cloth
and for sediment where dry concentrations applyb See section 5 for definitionc Data are arithmetic means unless stated as �max� in this column. �Max� data are selected to be maxima.
If no �max� value is given, the mean is also the maximum. See section 5d The concentration of 3H (organic) was <10 Bq l-1
Table 32(b). Monitoring of radiation dose ratesnear Wylfa nuclear power station,1995
Location Ground No. of µGy h-1
type samplingobserva-tionsa
Gamma dose rates at 1 m intertidal areas
Cemaes Bay Sand 4 0.053Cemlyn Bay Mud 4 0.078
a See section 5 for definition

99
Table 33(a). Radioactivity in food and the environment near Aldermaston, 1995
Material Location or selectionc No. of Mean radioactivity concentration (wet)a, Bq kg-1
samplingobservationsb Total
57Co 60Co 65Zn 90Sr 131I 137Cs 155Eu 238Pu 239+240Pu 241Am beta
Aquatic samplesPike Newbridge 1 * * * 0.0091 * 0.05 * 0.000046 0.00020 0.00023 -
±0.0036 ±0.03 ±0.000016 ±0.00003 ±0.00004� Outfall (Pangbourne) 1 * * * - * 0.59 * 0.000085 0.00039 0.00036 -
±0.06 ±0.000022 ±0.00003 ±0.00005� Staines 1 * * * - * 0.31 * - - * -
±0.08Nuphar lutea Newbridge 1 * * * - * * * - - * -
� Outfall (Pangbourne) 1 * 0.11 * - * 0.14 * - - * -±0.06 ±0.04
� Staines 1 0.15 * 0.13 - * 0.18 * - - * -±0.02 ±0.06 ±0.02
Clay Outfall (Pangbourne) 1 * 0.51 * - * 0.15 0.21 - - * 430±0.19 ±0.30 ±0.41
Mud & sand Staines 1 0.67 1.8 * - * 22 2.0 - - * 310±0.21 ±0.5 ±0.8 ±0.7
Mud Foudry Brook 1 * * * - 110 5.6 2.1 - - * -±3.4 ±0.5 ±1.1
� Newbridge 1 * * * - * 8.6 2.1 - - * -±0.5 ±1.2
Material Location or selectionc No. of Mean radioactivity concentration (wet)a, Bq kg-1
samplingobservationsb Total Total Total Total
3H 60Co 137Cs U 238Pu 239+240Pu 241Am alpha beta gamma
Terrestrial samplesMilk Near farmsd 4 <10 <0.475 <0.425 <0.0068 <0.0002 <0.0002 <0.0002 - - -
±0.0007� Max <0.0078
Apples 1 <10 <0.6 <0.4 0.011 <0.0002 <0.0002 <0.0003 - - -±0.003
Blackberries 2 <10 <0.65 <0.75 <0.025 <0.0002 <0.0002 <0.0005 - - -±0.006 ±0.0006
� Max 0.035 0.0008±0.008 ±0.0008
Carrots 1 <10 <0.5 <0.4 0.050 <0.0002 0.0002 0.0003 - - -±0.015 ±0.0002 ±0.0003
Honey 1 <10 <0.6 <0.6 <0.011 <0.0002 <0.0002 <0.0003 - - -
Lettuce 1 25 <0.7 <0.7 0.56 <0.0002 0.0012 0.0004 - - -±5.0 ±0.04 ±0.0004 ±0.0003
Potatoes 1 <10 <0.6 <0.5 0.044 <0.0002 <0.0002 0.0003 - - -±0.006 ±0.0003
Runner Beans 1 <10 <0.5 <0.4 <0.011 <0.0002 <0.0002 <0.0002 - - -
Wheat 1 <10 <0.5 <0.4 0.028 <0.0002 <0.0002 0.0004±0.009 ±0.0003
Grass 4 - - - - 0.002 0.053 - - - -±0.0008 ±0.006
� Max 0.0034 0.11±0.0011 ±0.01
Soil 9 - - - 41 0.0091 0.36 - - - -±6.1 ±0.0042 ±0.04
� Max 46 0.016 0.56±6.5 ±0.008 ±0.06
Dry cloths 94 - - - - - - - 0.18 0.64 0.45±0.22 ±0.46 ±0.30
- not analysed* not detected by the method useda Except for milk where units are Bq l-1, for dry cloths where units
are Bq per cloth and for sediment and soil where dry concentrations applyb See section 5 for definitionc Data are arithmetic means unless stated as �max� in this column.�Max� data are selected to be maxima.
If no �max� value is given, the mean is also the maximum. See section 5 for definition.d The concentration of 3H (organic) was also <10 Bq l-1
Table 33(b). Monitoring of radiation doserates near Aldermaston, 1995
Location Ground No. of µGy h-1
type samplingobserva-tionsa
Gamma dose rates at 1 m over river bank
Pangbourne Grass 1 0.058Newbridge � 1 0.065
a see section 5 for definition

100
Table 34(a). Radioactivity in food and the environment near naval establishments, 1995
Material Locationb No. of Mean radioactivity concentration (wet)a, Bq kg-1
samplingobserva- 239Pu+ 243Cm+tionsc 14C 60Co 106Ru 125Sb 131I 137Cs 154Eu 155Eu 238Pu 240Pu 241Am 244Cm
BarrowMud and sand Walney channel 2 - 3.7 29 2.7 * 240 2.6 1.4 - - 160 -
(outfall) ±1.1 ±9.1 ±2.6 ±4.1 ±1.1 ±1.6 ±6.3� � (Vickerstown 4 - 3.9 32 1.8 * 190 2.4 2.1 - - 210 -
church) ±0.7 ±6.7 ±1.2 ±3.0 ±1.7 ±1.5 ±4.8ChathamMud Commodores Hard 1 - 3.2 * * * 11 * 1.2 - - * -
±0.6 ±0.6 ±0.7� Hoo Marina 1 - 2.8 * * * 16 * 1.8 - - * -
±0.7 ±0.7 ±1.3DevonportDogfish Plymouth Sound 1 - * * * * 0.37 * * - - * -
±0.11Crabs � 1 28 * * * * * * * - - * -
±10Fucus vesiculosusKinterbury 2 - * * * 2.5 0.16 * 0.13 - - * -
±0.4 ±0.08 ±0.11Mud � 2 - 0.16 * * * 5.0 * 2.2 0.023 0.39 0.13 0.0012
±0.22 ±0.4 ±1.1 ±0.003 ±0.01 ±0.009 ±0.0008� Torpoint Ferry East 2 - 0.35 * * * 7.9 * 0.86 - - * -
±0.33 ±0.6 ±0.55� Torpoint South 2 - * * * * 3.2 * 0.80 - - * -
±0.6 ±0.70� Calstock 1 - * * * 6.1 9.8 * * - - * -
±1.2 ±0.9� Lopwell 2 - 0.23 * * * 10 * 1.5 - - * -
±0.20 ±0.4 ± 0.6� Wilcove 1 - 0.48 * * * 4.5 * 1.6 - - * -
±0.31 ±0.4 ±0.9
- not analysed* not detected by the method useda Except for sediment where dry concentrations applyb Landing point or sampling areac See section 5 for definition Table 34(b). Monitoring of radiation dose rates near naval establishments, 1995
Establishment Location Ground No. of µGy h-1
type samplingobserva-tionsa
Gamma dose rates at 1 m over intertidal areas
Barrow Walney Channel (1 km south of outfall) Mud 1 0.10 � � � Mud and sand 3 0.081� � (Vickerstown church) � 4 0.089Chatham Commodores Hard Mud 1 0.053� Hoo Marina � 1 0.056� Medway Yacht Club � 1 0.056Devonport Kinterbury � 2 0.073� Brunel Bridge East � 2 0.074� Torpoint Ferry East � 2 0.070� Stonehouse � 2 0.070� Torpoint South � 2 0.085� Calstock � 1 0.094� Lopwell � 2 0.079� Wilcove � 1 0.083
a See section 5 for definition

101
Table 35(a). Radioactivity in food and the environment near Amersham, 1995
Material Location or selectionc No. of Mean radioactivity concentration (wet)a, Bq kg-1
samplingobservationsb Total
14C 57Co 58Co 60Co 65Zn 75Se 90Sr 131I 137Cs 155Eu 238Pu 239+240Pu 241Am beta
Aquatic samples
Pike Newbridge 1 - * * * * * 0.0091 * 0.05 * 0.000046 0.00020 0.00023 -±0.0036 ±0.03 ±0.000016 ±0.00003 ±0.00004
� Outfall (Grand Union Canal) 1 43 0.05 * * * * - * 0.34 * - - * -±7.9 ±0.02 ±0.07
� Staines 1 - * * * * * - * 0.31 * - - * -±0.08
Nuphar lutea Newbridge 1 - * * * * * - * * * - - * -
� Outfall (Grand Union Canal) 1 - 0.37 0.08 * 0.37 * - * 0.03 * - - * -±0.02 ±0.04 ±0.08 ±0.02
� Staines 1 - 0.15 * * 0.13 * - * 0.18 * - - * -±0.02 ±0.06 ±0.02
Mud Outfall (Grand Union Canal) 1 - 11 2.9 0.54 6.6 * - * 8.9 * - - * 290±0.4 ±0.5 ±0.26 ±0.8 ±0.5
Mud & sand Staines 1 - 0.67 * 1.8 * * - * 22 2.0 - - * 310±0.21 ±0.5 ±0.8 ±0.7
Mud Newbridge 1 - * * * * * - * 8.6 2.1 - - * -±0.5 ±1.2
Material Location or selectionc No. of Mean radioactivity concentration (wet)a, Bq kg-1
samplingobservationsb Total Total Total
3H 35S 60Co 75Se 125I 131I 137Cs alpha beta gamma
Terrestrial samples
Milk Near farmsd 2 <10 <1.0 <0.41 <0.54 <0.050 <0.20 <0.41 - - - � � max <0.55 � � sub-sets 2 - - <0.25 <0.40 - <0.10 <0.3 - - -
� Far farmsd 1 <10 <1.0 <0.5 <0.55 <0.050 <0.20 <0.5 - - - � � sub-sets 1 - - <0.2 <0.35 - - <0.2 - - -
Apples 1 <10 <1.0 <0.3 <0.40 <0.069 - <0.4 - - -
Beans 1 <10 1.1 <0.7 <0.60 <0.072 - <0.7 - - -±0.6
Blackberries 1 <10 <1.0 <0.3 <0.40 <0.089 - <0.5 - - -
Cabbage 1 <10 <1.0 <0.4 <0.20 <0.18 - <0.3 - - -
Wheat 1 <10 4.4 <0.4 <0.40 0.30 - <0.5 - - -±0.80 ±0.23
Dry cloths 71 - - - - - - - 0.14 0.71 0.51±0.12 ±0.40 ±0.38
- not analysed* not detected by the method useda except for milk where units are Bq l-1, for dry cloths where units are Bq per cloth and for sediment where dry concentrations applyb See section 5 for definitionc Data are arithmetic means unless stated as �max� in this column. �Max� data are selected to be maxima.
If no �max� value is given, the mean is also the maximum. See section 5 for definition.d The concentration of 3H (organic) was <10 Bq l-1
Table 35(b). Monitoring of radiation dose rates near Amersham, 1995
Location Ground No. of µGy h-1
type samplingobserva-tionsa
Gamma dose rates at 1 m over river bank
Grand Union Grass and 1 0.049Canal concrete
Newbridge Mud 1 0.065
a See section 5 for definition

102
Table 36(a). Radioactivity in food and the environment near Cardiff, 1995
Material Locationb or selectionc No. of Mean radioactivity concentration (wet)a, Bq kg-1
samplingobserva- Totaltions 3H 14C 35S 57Co 125I 131I 134Cs 137Cs 155Eu beta
Aquatic samplesFlounder East of new pipeline 3 - 650 * * * * * 0.42 * -
±13 ±0.12Mussels Orchard Ledges 2 - 510 - * * * * 0.42 * -
±8.7 ±0.12Fucus vesiculosus � 2 - 15 - * * 3.2 * 0.39 0.07 -
±3.3 ±0.3 ±0.05 ±0.06Fucus spiralis East of new pipeline 2 - 15 - * * 3.1 * 0.31 * 180
±2.9 ±0.2 ±0.04Mud � 2 - 18 - * * * * 15 2.1 -
±2.9 ±0.6 ±0.8� West of new pipeline 2 - 31 - * * * 0.33 20 1.6 -
±2.8 ±0.30 ±0.5 ±0.8Sea water Orchard Ledges East 2 17 - - - - - - - - -
±0.4
Material Locationb or selectionc No. of Mean radioactivity concentration (wet)a, Bq kg-1
samplingobserva- 3H Total Total Totaltions (organic) 3H 14C 32Pe 35S 45Ca 57Co 125I 134Cs 137Cs alpha beta gamma
Terrestrial samplesMilk Near farms 4 <36 72 28 <0.69 <1.0 <2.0 <0.31 <0.050 <0.28 <0.41 - - -
±5.7 ±6.3 ±3.8 ±0.20� � max <56 <110 34 <0.75 <0.33 - - -
±4.3 ±6.9 ±3.6 ±0.20� � sub-sets 1 - - - - - - <0.20 - <0.23 <0.25 - - -
� Far farms 3 10 11 19 - <1.0 <2.0 <0.30 <0.050 <0.33 <0.42 - - -±1.2 ±1.1 ±4.1 ±0.27
� � max <11 <14 23 <1.1±1.7 ±1.9 ±5.1 ±0.5
Barley 1 - 84 160 - <1.0 <2.0 <0.40 <0.092 <0.5 <0.5 - - -±9.0 ±22
Cabbage 2 <23 <59 <16 - <2.2 <2.0 <0.20 <0.11 <0.2 <0.4 - - -±3.5 ±5.0 ±2.8 ±0.57
� max 36 110 3.4 <0.15 - - -±5.0 ±7.0 ±0.8
Honey 1 - 83 100 - <1.0 <2.0 <0.20 <0.10 <0.3 <0.4 - - -±9.0 ±13
Potatoes 1 17 50 26 - <1.0 <2.0 <0.20 <0.20 <0.3 <0.4 - - -±5.0 ±6.0 ±5.0
Raspberries 1 10 62 37 - <1.0 <2.0 <0.20 <0.12 <0.3 <0.4 - - -±2.0 ±6.0 ±5.0
Spinach 1 28 77 26 - <1.0 <2.0 <0.30 <0.11 <0.4 <0.5 - - -±6.0 ±6.0 ±4.0
Turnips 1 9.0 33 13 - <1.0 <2.0 <0.10 <0.20 <0.5 <0.6 - - -±4.0 ±6.0 ±4.0
Grass 2 210 480 52 - <1.0 7.2 <0.30 <0.20 <0.4 <0.4 - - -±17 ±26 ±4.0 ±2.4
� max 290 660 67±21 ±33 ±4.0
Rape 1 64 210 37 - 2.3 11 <0.20 <0.20 <0.4 <0.6 - - -±6.0 ±8.0 ±5.0 ±0.8 ±1.4
Silage 1 91 130 45 - - - - - - - - - -±17 ±7.0 ±6.0
Dry cloths 94 - - - - - - - - - - 0.18 0.64 0.45±0.22 ±0.46 ±0.30
- not analysed* not detected by the method useda except for milk and sea water where units are Bq l-1, for dry cloths where units are Bq per cloth and for sediment where dry concentrations applyb landing point or sampling area.c Data are arithmetic means unless stated as �max� in this column. �Max� data are selected to be maxima.
If no �max� value is given, the mean is also the maximum. See section 5 for definition.d The concentration of 3H (organic) was <10 Bq l-1e only two samples were analysed
Table 36(b). Monitoring of radiation dose rates near Cardiff,1995
Location Ground No. of µGy h-1
type samplingobserva-tionsa
Gamma dose rates at 1 m over intertidalareas
East of pipeline Mud 2 0.079West of pipeline � 2 0.063
Beta dose rates µSv h-1
West of pipeline � 1 *
a See section 5 for definition* Not detected by the method used

103
Table 37. Radioactivity in the environment near Derby, 1995
Material No. of Mean radioactivity concentration, Bq kg-1
samplesU 234U 235U 238U
Grassa 4 0.53 0.14 <0.012 0.12±0.08 ±0.02 ±0.003 ±0.02
� max 0.75 0.23 0.016 0.20±0.10 ±0.03 ±0.005 ±0.03
Soilb 4 85 - - -±8.3 - - -
� max 110±9.3
a fresh weightb dry weight- not analysed

104
Table 38. Radioactivity in grass and soil near nuclear sites - EURATOMc sampling, 1995
Site/material No. of Selectionb Mean radioactivity concentration (dry)a
samples3H 14C 35S 90Sr 137Cs 238Pu 239+240Pu 241Am
Grass
Aldermaston 3 <25 96 4.2 6.1 <1.0 <0.010 <0.014 -±9.8 ±14 ±1.7 ±0.4 ±0.003
max 56 100 5.3 6.6 0.021±17 ±15 ±1.3 ±0.4 ±0.003
Amersham 3 <14 100 47 6.4 2.4 <0.010 0.05 -±3.5 ±13 ±4.7 ±0.6 ±1.9 ±0.01
max 19 130 55 9.1 3.4 0.066±4.4 ±16 ±4.6 ±0.7 ±1.8 ±0.008
Cardiff 3 690 620 4.8 4.2 <1.0 <0.010 <0.02 -±58 ±53 ±2.1 ±0.3 ±0.003
max 1500 840 9.0 5.8 0.026±94 ±67 ±2.0 ±0.4 ±0.004
Berkeley 3 45 110 19 2.3 <1.0 <0.010 <0.010 -±11 ±12 ±2.3 ±0.3
max 82 130 23 4.0±17 ±13 ±2.3 ±0.4
Bradwell 3 <19 110 12 <1.9 <1.5 <0.010 <0.010 -±8.5 ±15 ±2.0 ±0.23 ±1.5
max 29 110 18 3.9 2.6±14 ±16 ±2.5 ±0.3 ±2.6
Capenhurst 3 - 110 <7.5 3.9 <2.0 <0.010 <0.010 -±13 ±1.2 ±0.3 ±2.0
max 110 18 4.3 3.1±12 ±1.7 ±0.3 ±2.6
Dungeness 2 <20 180 14 4.8 7.6 <0.010 <0.049 -±19 ±1.9 ±0.4 ±2.7 ±0.002 ±0.004
max 30 240 22 8.6 11 0.010 0.089±14 ±24 ±2.1 ±0.5 ±2.9 ±0.002 ±0.006
Hartlepool 3 52 100 <1.8 1.5 <1.0 <0.010 <0.010 -±11 ±14 ±1.5 ±0.3
max 83 100 2.6 2.6±17 ±12 ±1.7 ±0.2
Harwell 3 70 93 <7.0 2.0 <1.0 <0.010 <0.014 <0.010±14 ±12 ±1.1 ±0.5 ±0.003
max 87 100 19 2.3 0.020±7.2 ±15 ±1.9 ±0.7 ±0.004
Heysham 3 44 150 <3.1 3.4 <1.7 <0.010 0.014 -±14 ±17 ±2.3 ±0.3 ±1.6 ±0.002
max 68 180 5.3 4.1 2.4 0.020±17 ±18 ±3.5 ±0.3 ±1.9 ±0.003
Hinkley Point 3 56 140 31 4.0 <1.0 <0.010 <0.010 -±11 ±13 ±2.9 ±0.5
max 61 190 57 5.9±6.5 ±16 ±4.0 ±0.5
Oldbury 3 46 170 200 <2.0 <1.0 <0.010 <0.010 -±13 ±18 ±15 ±0.3
max 53 250 450 2.9±16 ±25 ±24 ±0.4
Sellafield 3 - 220 24 45 11 0.10 0.75 0.43±22 ±7.5 ±2.4 ±3.6 ±0.01 ±0.05 ±0.04
max 270 55 52 13 0.15 1.1 0.55±25 ±12 ±2.8 ±3.1 ±0.02 ±0.1 ±0.05
Sizewell 3 21 120 39 4.1 <2.8 <0.010 <0.010 <0.010±9.3 ±16 ±2.9 ±0.31 ±1.8
max 40 130 59 4.5 6.4±15 ±17 ±3.7 ±0.3 ±3.1
Springfields 3 13 110 <2.0 4.8 <1.7 <0.010 <0.032 -±7.3 ±15 ±1.0 ±0.33 ±1.5 ±0.004
max 17 130 4.1 7.2 2.9 0.051±8.6 ±17 ±1.7 ±0.4 ±1.8 ±0.006
Trawsfynydd 3 - 120 <2.3 8.7 39 <0.010 <0.012 -±15 ±0.6 ±0.5 ±5.5 ±0.002
max 130 4.9 10 78 0.017±14 ±1.1 ±0.6 ±7.5 ±0.003
Winfrith 3 96 109 3.1 6.3 7.6 <0.010 <0.017 -±18 ±15 ±1.6 ±0.5 ±3.5 ±0.003
max 170 120 4.6 9.2 15 0.031±26 ±16 ±1.3 ±0.6 ±5.1 ±0.005
Wylfa 3 - 120 20 6.8 <2.9 <0.010 <0.010 -±15 ±1.9 ±0.5 ±2.2 ±0.001
max 140 36 9.5 5.4 0.011±17 ±2.6 ±0.7 ±3.3 ±0.002

105
Table 38. continued
Site/material No. of Selectionb Mean radioactivity concentration (dry)a
samples3H 14C 35S 90Sr 137Cs 238Pu 239+240Pu 241Am
Soi l
Aldermaston 3 - 7.9 <1.0 4.7 13 <0.011 0.20 -±2.7 ±0.5 ±2.1 ±0.004 ±0.02
max 10 6.9 18 0.011 0.24±2.5 ±0.5 ±2.2 ±0.005 ±0.02
Amersham 3 - 18 2.3 5.1 12 0.019 0.26 -±2.6 ±1.5 ±0.4 ±1.9 ±0.007 ±0.03
max 22 2.9 10 13 0.031 0.28±2.8 ±1.1 ±0.7 ±2.2 ±0.009 ±0.03
Cardiff 3 - 73 <1.0 4.4 21 <0.021 0.40 -±6.1 ±0.4 ±2.6 ±0.006 ±0.03
max 130 8.6 28 0.034 0.56±8.9 ±0.5 ±2.8 ±0.008 ±0.04
Berkeley 3 - 24 <2.3 6.3 23 0.029 0.66 -±3.5 ±1.1 ±0.5 ±2.6 ±0.005 ±0.04
max 43 5.0 7.9 36 0.052 1.2±4.6 ±1.9 ±0.5 ±3.2 ±0.007 ±0.1
Bradwell 3 - 12 <1.0 5.4 12 <0.011 0.12 -±2.4 ±0.5 ±2.0 ±0.004 ±0.02
max 25 10 29 0.013 0.22±3.0 ±0.7 ±2.7 ±0.007 ±0.03
Capenhurst 3 - 16 <1.1 2.5 19 <0.014 0.37 -±3.4 0.52 ±0.4 ±2.7 ±0.005 ±0.03
max 21 1.3 3.2 30 0.018 0.55±3.8 ±0.9 ±0.4 ±3.0 ±0.007 ±0.04
Dungeness 2 - 98 <1.0 26 180 0.15 3.5 -±13 ±1.5 ±13 ±0.02 ±0.2
max 130 35 210 0.16 3.8±14 ±1.9 ±14 ±0.02 ±0.2
Hartlepool 3 - 17 <1.0 <3.4 17 0.021 0.34 -±3.0 ±0.3 ±2.2 ±0.007 ±0.03
max 19 5.9 21 0.031 0.50±3.1 ±0.4 ±2.5 ±0.008 ±0.04
Harwell 3 - 16 <3.6 <7.5 26 0.11 1.3 0.35±3.4 ±3.9 ±0.6 ±2.8 ±0.02 ±0.1 ±0.04
max 28 8.1 13 44 0.223 1.9 0.53±4.0 ±5.5 ±0.9 ±3.6 ±0.033 ±0.1 ±0.05
Heysham 3 - 16 <1.0 3.6 32 0.035 0.40 -±3.0 ±0.4 ±3.4 ±0.008 ±0.03
max 23 7.0 53 0.061 0.58±3.5 ±0.5 ±4.5 ±0.001 ±0.04
Hinkley Point 3 - 18 10 8.9 11 <0.016 0.24 -±3.2 ±3.2 ±0.8 ±2.3 ±0.003 ±0.20
max 39 18 21 21 0.029 0.41±4.4 ±4.4 ±1.3 ±3.5 ±0.006 ±0.03
Oldbury 3 - 25 <2.8 4.1 32 0.044 0.51 -±3.6 ±1.1 ±0.4 ±3.6 ±0.009 ±0.04
max 34 6.5 5.2 39 0.095 0.54±4.2 ±1.9 ±0.4 ±3.5 ±0.012 ±0.04
Sellafield 3 - 21 <2.5 24 150 0.84 16 4.7±3.6 ±1.2 ±2.0 ±11 ±0.12 ±1.1 ±0.6
max 40 4.9 39 300 1.6 31 10±4.5 ±1.5 ±2.2 ±18 ±0.2 ±1.8 ±1.0
Sizewell 3 - 9.1 <1.0 2.1 10 <0.011 0.13 0.041±3.4 ±0.4 ±1.5 ±0.003 ±0.02 ±0.012
max 16 2.5 16 0.012 0.23 0.067±5.0 ±0.2 ±2.0 ±0.005 ±0.02 ±0.011
Springfields 3 - 12 <1.0 3.3 17 0.022 0.30 -±2.6 ±0.3 ±2.2 ±0.006 ±0.02
max 14 5.3 21 0.035 0.35±2.8 ±0.4 ±2.3 ±0.007 ±0.03
Trawsfynydd 3 - 48 <2.8 11 180 0.092 2.7 -±6.7 ±1.8 ±0.9 ±14 ±0.013 ±0.1
max 67 3.8 24 260 0.14 4.5±9.4 ±2.6 ±1.4 ±18 ±0.02 ±0.2
Winfrith 3 - 13 <1.2 5.5 24 0.019 0.49 -±2.7 ±0.9 ±0.5 ±2.8 ±0.008 ±0.04
max 16 1.4 8.6 38 0.026 0.66±3.2 ±1.0 ±0.7 ±3.8 ±0.011 ±0.05
Wylfa 3 - 9.4 5.4 2.9 32 <0.019 0.30 -±2.5 ±1.9 ±0.4 ±3.0 ±0.005 ±0.03
max 11 11 4.3 33 0.027 0.32±2.8 ±1.3 ±0.5 ±3.1 ±0.004 ±0.03
- not analyseda Except for 3H where wet concentrations applyb Data are arithmetic means unless stated as �max� in this column
�Max � data are selected to be maxima. If no �max� value is given,the mean is also the maximumc Other data for grass and soil samples near nuclear sites can be found in the site-specific tables

106
Table 39. Comparison of highest observed grass and soil concentrations with Generalised DerivedLimitsb, 1995
Mean activity concentration Bq kg-1 (dry)
Grass Soil
Observed GDL % Site Observed GDLa % Site
3H 690 30000 2 Cardiff -
14C 620 4000 16 Cardiff -
35S 200 20000 1 Oldbury 10 30000 <1 Hinkley
90Sr 45 2000 2 Sellafield 26 400 7 Dungeness
137Cs 39 3000 1 Trawsfynydd 180 1000 18 Dungeness
238Pu - 0.84 5000 <1 Sellafield
239+240Pu - 16 5000 <1 Sellafield
241Am - 4.7 5000 <1 Sellafield
- not availablea Assumed to be well mixed soil, 0-30 cmb Based on Attwood et al, 1996 and MAFF assessments

107
Table 40. Natural radioactivity in fish and shellfish from the Irish Sea, 1995
Material Locationa No. of Mean radioactivity concentration (wet), Bq kg-1
samplingobserv-ations 210Po 210Pb 226Ra 228Th 230Th 232Th 234U 235U 238U
Winkles Saltom Bay 4 15 2.6 - - - - - - -±0.6 ±0.2
� Parton 4 21 4.6 1.8 0.66 1.8 0.45 1.4 0.045 1.3±0.9 ±0.3 ±0.1 ±0.05 ±0.1 ±0.03 ±0.1 ±0.02 ±0.1
� North Harrington 4 18 - - - - - - - -±0.7
� Fleswick Bay 4 14 - - - - - - - -±0.7
� Nethertown 4 11 - - - - - - - -±0.5
� Drigg 4 - - - 1.1 1.5 0.8 - - -±0.1 ±0.1 ±0.1
� Tarn Bay 4 10 - - - - - - - -±0.4
Mussels Parton 2 50 - - - - - - - -±2.0
� Nethertown 4 32 2.7 - - - - - - -±1.0 ±0.2
Limpets St Bees 4 12 1.8 - - - - - - -±0.6 ±0.2
Crabs Parton 4 22 0.17 - 0.095 0.025 0.010 0.054 0.0021 0.051±1.1 ±0.03 ±0.005 ±0.002 ±0.001 ±0.004 ±0.0006 ±0.004
� St Bees 4 13 0.67 - - - - - - -±0.9 ±0.07
� Sellafield coastal area 4 11 0.19 - - - - - - -±0.6 ±0.03
Lobsters Parton 4 13 0.07 - 0.044 0.016 0.0062 0.024 0.0008 0.023±0.9 ±0.01 ±0.003 ±0.001 ±0.0008 ±0.002 ±0.0004 ±0.002
� St Bees 4 10 0.002 - - - - - - -±0.4 ±0.0002
Cod Parton 4 0.64 0.011 - 0.022 0.0036 0.0015 0.0048 0.00015 0.0046±0.04 ±0.002 ±0.001 ±0.0002 ±0.0002 ±0.0004 ±0.00008 ±0.0004
Flounder Whitehaven 1 4.3 - - - - - - - -±0.1
- not analyseda landing point or sampling area

108
Table 41. Radioactivity in food and the environment near industrial sites, 1995
Site Material No. of Mean radioactivity concentration (dry)a, Bq kg-1
samples134Cs 137Cs 210Pb 210Po 226Ra 232Th 238Pu 239+240Pu
Eggborough, North Yorkshire Grass 4 <0.80 <0.76 17 11 1.7 0.81 <0.00040 <0.00041±0.42 ±3.3 ±3.1 ±0.3 ±0.07 ±0.0001
Soil 4 <0.60 16 31 30 25 24 0.0092 0.28±2.0 ±3.1 ±1.4 ±4.2 ±2.2 ±0.0032 ±0.02
Rabbit 1 <0.20 0.30 0.15 0.10 0.060 <0.0050 <0.00030 0.00040±0.1 ±0.03 ±0.01 ±0.02 ±0.0002
Ellesmere, Cheshire Grass 3 <0.70 1.1 15 7.5 1.1 0.67 <0.00039 <0.00040±0.6 ±1.7 ±0.5 ±0.2 ±0.05
Soil 3 <0.40 12 22 22 13 11 0.0070 0.18±1.4 ±2.3 ±0.9 ±2.1 ±0.8 ±0.003 ±0.01
Milford Haven, Dyfed Grass 3 <0.90 <0.79 21 7.8 0.91 0.55 <0.00056 <0.00044±0.35 ±2.2 ±0.6 ±0.15 ±0.08 ±0.00018
Soil 3 <0.60 8.6 33 33 24 27 0.0095 0.20±1.0 ±3.5 ±1.5 ±3.9 ±1.7 ±0.0033 ±0.015
Sheep 2 <0.25 <0.25 <0.007 0.005 0.013 0.002 <0.00025 <0.00021±0.001 ±0.003 ±0.001 ±0.00005
Marloes, Dyfed b Grass 1 <0.80 <0.80 19 8.1 1.3 0.41 <0.00050 0.00070±1.0 ±0.5 ±0.2 ±0.05 ±0.0002
- not analyseda except for animal samples where wet concentrations applyb control for Milford Haven
Table 42. Radioactivity in plants near landfill sites, 1995
Sampling location Material No. of Mean radioactivity concentration (dry)a, Bq kg-1
samples3H 14C 90Sr 125I 134Cs 137Cs 238Pu 239+240Pu
Clifton Marsh, Lancashire Grass 4 61 110 2.5 <1.0 <0.80 <2.1 <0.00028 <0.00040±15 ±20 ±0.1 ±0.5 ±0.00022
Cowpen Bewley, Cleveland � 4 41 110 0.57 <0.68 <0.90 <0.83 <0.00020 <0.00025±10 ±20 ±0.05
Cilgwyn Quarry, Gwynedd Nettles 3 99 130 13 <2.2 <0.90 1.7 <0.00070 <0.00060±24 ±23 ±0.4 ±0.6 ±0.00027
Milton Landfill, Cambridgeshire Grass 4 84 130 0.86 <0.70 <1.0 <0.88 <0.00020 <0.00045±22 ±19 ±0.05 ±0.25
a Results are available for other artificial nuclides detectable by gamma spectrometryAll such results are less than the limit of detection

109
Table 43. Caesium radioactivity in the freshwaterenvironment, 1995
Location Material No. of Mean radioactivitysampling concentrationobserva- (wet)a, Bq kg-1
tions134Cs 137Cs
England
Branthwaite Rainbow trout 1 * 0.42±0.13
Narborough � 1 * 0.16±0.08
Ennerdale Water Water 1 * 0.0046±0.0008
Devoke Water Perch 1 6.8 310±1.0 ±5.3
� Brown trout 1 2.2 74±0.6 ±1.7
� Water 1 * 0.024±0.009
Wales
Llyn Hiraethlyn Perch 1 3.1 110±0.5 ±1.9
� Water 1 * 0.013±0.001
Scotland
Loch Dee Brown trout 1 4.8 180±0.5 ±2.9
� Water 3 * 0.027±0.0009
* not detected by the method useda except for water where units are Bq l-1

110
Table 44. Radioactivity in terrestrial food from the Isle of Man, 1995
Material or selectionc No. of Mean radioactivity concentration (wet)a, Bq kg-1
samplingobserva-tionsb 3H 14C 35S 60Co 90Sr 99Tc 106Ru 129I Total Cs 147Pm 144Ce 238Pu 239+240Pu 241Pu 241Am
Milkd 4 <10 <15 <1.0 <0.48 <0.19 <0.040 <2.6 <0.018 <0.20 <0.38 <0.20 <0.00020 <0.00020 <0.10 <0.00023
±3.1 ±0.01
� max 17 <0.53 <0.20 <2.9 <0.020 <0.21 <0.60 <2.2 <0.00030±3.8 ±0.01
� subsets 3 - - - <0.30 0.058 - <1.9 - <0.30e - <1.2 - - - -±0.010
� max 0.068 <2.0 <1.4±0.010
Apples 1 <10 14 <1.0 <0.40 <0.20 - <2.8 - <0.20 - <1.4 - - - -
±5.0
Cabbage 1 <10 <15 <1.0 <0.60 1.3 <0.040 <3.1 <0.050 0.35 <0.00030 <2.6 <0.00020 <0.00020 <0.10 0.0003
±0.1 ±0.07 ±0.00030
� subsets 1 - - - <0.50 - - <1.7 - 0.6e - <1.7 - - - -±0.1
Honey 1 <10 50 <1.0 <0.60 <0.20 - <3.8 - 3.7 - <2.2 - - - -±17 ±0.2
Ovine muscle 1 <10 31 <3.0 <0.40 <0.20 <0.040 <3.9 <0.070 2.9 - <1.8 <0.00030 <0.00030 <0.10 <0.00030±6.0 ±0.2
Ovine offal 1 <10 33 <3.0 <0.3 0.34 <0.040 <2.8 <0.050 1.4 - <1.7 <0.00020 <0.00020 <0.10 0.00050±8.0 ±0.04 ±0.1 ±0.00040
Potatoes 1 <10 16 <1.0 <0.20 <0.20 <0.040 <1.7 <0.040 <0.20 <0.30 <1.2 <0.00020 0.00080 <0.10 0.00040±3.0 ±0.00040 ±0.00020
Runner beans 1 <10 <15 <1.0 <0.50 <0.20 - <2.8 - <0.20 - <2.1 - - - -
- not analysed* not detected by the method useda except for milk where units are Bq l-1b See section 5 for definitionc Data are arithmetic means unless stated as �max in this column. �Max� data are selected to be maxima
If no �max� value is given, the mean is also the maximum. See section 5 for definitiond The concentration of 3H (organic) was <10 Bq l-1e Caesium-137

111
Table 45. Radioactivity in seafood and the environment near the Channel Islands, 1995
Material Locationb No. of Mean radioactivity concentration (wet)a, Bq kg-1
samplingobserv- 239Pu + 243Cm+ Totalationsc 3H 14C 54Mn 60Co 90Sr 99Tc 106Ru 110mAg 125Sb 129I 137Cs 155Eu 238Pu 240Pu 241Am 242Cm 244Cm beta
Crabs Guernsey 1 - - * 0.31 - - * * * - * * 0.00082 0.0031 0.0065 0.000047 0.00066 95±0.07 ±0.00007 ±0.0002 ±0.0003 ±0.000041 ±0.00007
� Jersey 1 - - * 0.26 - - * * * - * * 0.00038 0.00082 0.0027 0.000025 0.00070 79±0.03 ±0.00005 ±0.00007 ±0.0001 ±0.000018 ±0.00006
� Alderney 2 - 26 * 0.44 - 0.16 * * * - 0.07 * 0.00088 0.0022 0.0050 0.000058 0.0013 69±9.4 ±0.10 ±0.06 ±0.06 ±0.00006 ±0.0001 ±0.0002 ±0.000027 ±0.0001
Lobsters Guernsey 1 - - * 0.18 - - * * * - * * 0.00063 0.0017 0.010 0.00019 0.0024 49±0.12 ±0.00007 ±0.0001 ±0.0004 ±0.00009 ±0.0001
� Jersey 1 - - * 0.21 - - * * * - 0.13 * 0.00024 0.00066 0.0016 * 0.00021 100±0.11 ±0.08 ±0.00004 ±0.00007 ±0.0001 ±0.00004
� Alderney 1 - - * 0.11 - - * * * - * * 0.0017 0.0077 0.029 0.00017 0.0046 63±0.09 ±0.0001 ±0.0003 ±0.001 ±0.00006 ±0.0002
Winkles Alderney 1 - - * 3.1 0.22 - * * * - 0.18 * 0.014 0.029 0.055 0.00025 0.012 40±0.3 ±0.02 ±0.16 ±0.001 ±0.001 ±0.003 ±0.00022 ±0.001
Oysters Jersey 1 - - * 0.33 - - * 0.19 * - * * 0.0052 0.011 0.013 0.000073 0.0028 70±0.07 ±0.10 ±0.0002 ±0.0004 ±0.001 ±0.000045 ±0.0002
Limpets Guernsey 1 - - * * - - * * * - * * - - * - - 48
� Jersey La Rozel 1 - - * 0.24 - - * * * - * * 0.0056 0.012 0.018 0.00013 0.0034 58
±0.07 ±0.0003 ±0.0004 ±0.001 ±0.00008 ±0.0002
� Alderney 1 - - * 0.49 - - 0.54 * * - * * 0.0093 0.016 0.033 0.00018 0.0075 71±0.08 ±0.47 ±0.0003 ±0.001 ±0.002 ±0.00013 ±0.0007
Ormers Guernsey 1 - - * 0.14 - - * * * - * * - - * - - 89±0.08
Porphyra Guernsey Fermain Bay 4 - - * * - - 0.10 * * - 0.01 * 0.0012 0.0035 0.0052 0.000027 0.00083 110
±0.13 ±0.01 ±0.0001 ±0.0002 ±0.0003 ±0.000026 ±0.00010
� Jersey Plemont Bay 4 - - * 0.16 - - 0.25 * * - 0.07 * - - * - - 340
±0.08 ±0.16 ±0.04
� Alderney Quenard Point 4 - - * 0.15 - - 0.69 * * - 0.02 * - - * - - 120
±0.06 ±0.39 ±0.03

112
Table 45. continued
Material Locationb No. of Mean radioactivity concentration (wet)a, Bq kg-1
samplingobserv- 239Pu + 243Cm+ Totalationsc 3H 14C 54Mn 60Co 90Sr 99Tc 106Ru 110mAg 125Sb 129I 137Cs 155Eu 238Pu 240Pu 241Am 242Cm 244Cm beta
Fucus vesiculosus Alderney Quenard Point 3 - - * 0.62 0.17 - * * * 1.3 0.09 * 0.0087 0.018 0.010 0.000056 0.0030 120
±0.05 ±0.01 ±0.5 ±0.03 ±0.0003 ±0.0004 ±0.0004 ±0.000037 ±0.0002Fucus serratus Guernsey
Fermain Bay 4 - - * 0.66 0.11 - * * * - 0.04 * 0.012 0.032 0.012 0.000058 0.0027 170±0.18 ±0.01 ±0.02
� Jersey La Rozel 4 - - * 1.0 0.15 - * * * - 0.15 0.03 0.025 0.050 0.023 0.00023 0.0050 270
±0.1 ±0.01 ±0.07 ±0.04 ±0.001 ±0.002 ±0.001 ±0.00010 ±0.0003� Alderney
Quenard Point 2 - - * 0.92 - - * * * - 0.12 0.12 - - * - - 110±0.09 ±0.06 ±0.09
Laminaria digitata Jersey Verclut 3 - - * 0.09 - - * * * - 0.17 * - - * - - 370
±0.05 ±0.05Mud Jersey
St Helier 1 - - 0.77 26 - - * * * - 6.1 1.7 1.2 2.6 4.4 0.018 0.81 570±0.47 ±0.8 ±0.4 ±1.1 ±0.1 ±0.1 ±0.1 ±0.011 ±0.05
Mud & sand Guernsey Bordeaux Harbour 1 - - * 0.52 - - * * * - 1.9 * 0.087 0.31 0.28 * 0.043 450
±0.38 ±0.3 ±0.006 ±0.01 ±0.01 ±0.004Sand Alderney
Lt. Crabbe Harbour1 - - * 1.6 - - * * 0.49 - 2.2 0.56 - - * - - 370±0.2 ±0.35 ±0.2 ±0.36
Sea water Guernsey 4 - - - - - - - - - - 0.005 - - - - - - -±0.001
� Jersey 1 - - - - - - - - - - 0.005 - - - - - - -±0.0004
� Alderney 3 * - - - - - - - - - 0.007 - - - - - - -±0.001
- not analysed* not detected by the method useda Except for seawater where units are Bq l-1 and for sediment where dry concentrations applyb Landing point or sampling areac See section 5 for definition

113
Table 46. Radioactivity in regional diet, 1995
Region Mean radioactivity concentration (dry)a, Bq kg-1
3H 14C 35S 40K 90Sr 137Cs 210Pb 210Po 226Ra U 238Pu 239+240Pu 241Am
Wales 14 43 <1.0 70 <0.40 0.20 0.02 0.036 0.043 0.023 <0.0001 <0.0001 <0.0002±1.0 ±5.0 ±8.0 ±0.10 ±0.01 ±0.004 ±0.007 ±0.005
East Midlands 9.3 35 <1.0 72 0.26 <0.20 0.20 0.022 0.08 0.022 <0.0002 <0.0002 <0.0002±5.0 ±4.0 ±8.0 ±0.07 ±0.10 ±0.009 ±0.01 ±0.005
South West 17 37 <1.0 72 <0.50 <0.1 0.013 0.036 0.045 0.019 <0.0002 <0.0002 <0.0001±5.0 ±5.0 ±8.0 ±0.008 ±0.004 ±0.007 ±0.005
North East 5.0 44 <1.0 76 <0.40 0.30 0.021 0.039 0.047 0.017 <0.0001 <0.0001 <0.0003±3.0 ±7.0 ±9.0 ±0.10 ±0.007 ±0.004 ±0.007 ±0.005
South East 11 61 <1.0 75 0.11 <0.20 0.05 0.036 0.039 0.020 <0.0001 <0.0002 <0.0009±6.0 ±6.0 ±9.0 ±0.05 ±0.02 ±0.006 ±0.009 ±0.006
West Midlands 7.0 39 <1.0 78 0.20 <0.20 0.03 0.046 0.034 0.017 <0.0001 <0.0001 <0.0001±5.0 ±4.0 ±9.0 ±0.10 ±0.01 ±0.005 ±0.007 ±0.005
East 82 46 <1.0 79 0.10 <0.10 0.037 0.039 0.035 0.015 <0.0001 <0.0002 <0.0002±10 ±4.0 ±9.0 ±0.10 ±0.007 ±0.003 ±0.008 ±0.005
South 4.5 42 <1.0 80 <0.70 <0.20 0.05 0.035 0.042 0.023 <0.0001 <0.0002 <0.0003±4.0 ±5.0 ±9.0 ±0.01 ±0.009 ±0.006 ±0.005
North West 12 42 <1.0 79 0.10 <0.20 0.033 0.06 0.037 0.020 <0.0001 <0.0002 <0.0002±10 ±4.0 ±9.0 ±0.08 ±0.007 ±0.03 ±0.008 ±0.005
a Results are available for other artificial nuclides detectable by gamma spectrometry (60Co, 95Zr, 103Ru, 110mAg, 134Cs, 144Ce)All such results are less than the limit of detection
Table 47 . Estimates of radiation exposure from radionuclides in regional diet, 1995
Exposure, mSvb
Nuclidea Mean Range
Man-made radionuclides
Tritium 0.0002 0.00004-0.0008Sulphur-35 0.001 0.001-0.001Strontium-90 0.006 0.002-0.014Caesium-137 0.0004 0.0002-0.0007Plutonium-238 0.000009 0.000008-0.00002Plutonium-239+240 0.00001 0.000008-0.00002Americium-241 0.00002 0.000007-0.00007
Sub-total 0.008 0.004-0.016
Natural radionuclides
Carbon-14 0.013 0.011-0.019Lead-210 0.035 0.009-0.14Polonium-210 0.066 0.038-0.10Radium-226 0.008 0.006-0.015Uranium 0.0005 0.0004-0.0006
Sub-total 0.12 0.091-0.20
Total 0.13 0.10-0.21
a Tritium is also produced by natural means and carbon-14 by man. Levels of natural radionuclides may be enhancedby man�s activities
b To a 1 year old child consuming at average rates

114
Table 48. Radioactivity in milk remote from nuclear sites, 1995
County Selectiona No. of Mean radioactivity concentration, Bq l-1
samplingobserva- 239Pu+tionsb 3H 14C 90Sr Total Cs 210Pb 210Po Total U 238Pu 240Pu
Co. Antrim 12 <10 <17 <0.10 0.37 0.038 0.011 <0.0064 <0.00020 <0.00020±3.3 ±0.03 ±0.016 ±0.005
max 28 0.51±4.0 ±0.04
Co. Armagh 12 <10 17 <0.10 <0.20 0.056 <0.010 <0.0064 <0.00020 <0.00020±3.7 ±0.018
max 23±5.0
Cambridgeshire 12 <2.0 16 0.029 0.047 0.081 0.015 <0.0064 <0.00020 <0.00020±3.6 ±0.006 ±0.012 ±0.029 ±0.007
max 22 0.043 0.061±4.0 ±0.007 ±0.015
Denbighshire 12 <10 <17 <0.10 <0.20 0.048 0.016 <0.0064 <0.00020 <0.00020±3.2 ±0.039 ±0.004
max 26±3.0
Cornwall 23 <10 18 <0.10 <0.20 <0.023 0.019 <0.0064 <0.00020 <0.00020±3.4 ±0.018 ±0.006
max 27 0.025 0.021±4.0 ±0.025 ±0.006
Co. Down 12 <10 <16 <0.10 <0.20 <0.019 <0.010 <0.0064 <0.00020 <0.00020±3.2
max 20±4.0
Co. Fermanagh 12 <10 <16 <0.10 <0.25 0.036 <0.010 <0.0064 <0.00020 <0.00020±3.0 ±0.03 ±0.017
max 21 0.39±3.0 ±0.03
Gloucestershire 12 <10 <18 <0.10 <0.20 0.072 <0.010 <0.0064 <0.00020 <0.00020±3.4 ±0.028
max 29±5.0
Gwent 8 <2.1 <20 0.043 0.083 <0.021 0.014 0.0065 <0.00020 <0.00020±1.0 ±3.4 ±0.006 ±0.013 ±0.005 ±0.0025
max 3.0 27 0.057 0.23±2.0 ±4.0 ±0.006 ±0.02
Gwynedd 12 <10 <17 <0.10 <0.20 <0.025 0.013 <0.0064 <0.00020 <0.00020±3.3 ±0.005
max 22±3.0
Hampshire 12 <10 <15 <0.10 <0.20 0.025 0.018 <0.0064 <0.00020 <0.00020±3.3 ±0.025 ±0.005
max 21±4.0
Humberside 12 <10 <15 <0.10 <0.20 0.055 <0.010 <0.0064 <0.00020 <0.00020±3.2 ±0.036
max 22±4.0
Kent 12 <10 16 <0.10 <0.20 <0.025 0.017 <0.0064 <0.00020 <0.00020±3.5 ±0.005
max 20±4.0

115
Table 48. continued
County Selectiona No. of Mean radioactivity concentration, Bq l-1
samplingobserva- 239Pu+tionsb 3H 14C 90Sr Total Cs 210Pb 210Po Total U 238Pu 240Pu
Lancashire 12 <10 <18 <0.10 <0.20 <0.026 0.013 <0.0064 <0.00020 <0.00020±3.5 ±0.01 ±0.007
max 22 0.24±4.0 ±0.03
Lincolnshire 12 <10 <16 <0.10 <0.20 0.068 0.015 <0.0064 <0.00020 <0.00020±3.4 ±0.039 ±0.004
max 23±4.0
Co. Londonderry 11 <10 18 <0.10 <0.22 0.055 <0.010 <0.0064 <0.00020 <0.00020±3.7 ±0.02 ±0.023
max 24 0.35±4.0 ±0.03
Norfolk 12 <10 <16 <0.10 <0.20 0.031 0.016 <0.0064 <0.00020 <0.00020±2.6 ±0.031 ±0.004
max 21±5.0
North Yorkshire 12 <10 <16 <0.10 <0.20 0.040 0.011 <0.0064 <0.00020 <0.00020±3.0 ±0.039 ±0.004
max 22±3.0
Oxfordshire <10 <15 <0.10 <0.20 0.022 <0.010 <0.0064 <0.00020 <0.00020±3.4 ±0.022
max 22±4.0
Shropshire 12 <10 <16 <0.10 <0.20 <0.021 0.012 <0.0064 <0.00020 <0.00020±3.1 ±0.004
max 19±3.0
Somerset 12 <10 <17 <0.10 <0.20 <0.025 0.019 <0.0064 <0.00020 <0.00020±3.5 ±0.005
max 26±6.0
Suffolk 12 <10 19 <0.10 <0.20 0.029 0.018 <0.0064 <0.00020 <0.00020±3.9 ±0.029 ±0.004
max 27±4.0
Tyneside 12 <10 <15 <0.10 <0.20 <0.026 0.015 <0.0064 <0.00020 <0.00020±2.8 ±0.004
max 18±3.0
Co. Tyrone 12 <2.0 18 0.036 0.17 0.047 <0.010 <0.0064 <0.00020 <0.00020±3.8 ±0.006 ±0.01 ±0.020
max 27 0.049 0.22±5.0 ±0.006 ±0.02
West Midlands 12 <10 <16 <0.10 <0.20 <0.025 0.014 <0.0064 <0.00020 <0.00020±3.3 ±0.004
max 20±4.0
a Data are arithmetic means unless stated as �max�. �Max� data are selected to be maximaIf no �max� value is given, the mean is also the maximum. See section 5 for definition
b See section 5 for definition

116
Table 49. Radioactivity in crops remote from nuclear sites, 1995b
Location Material No of Mean radioactivity concentration (wet), Bq kg-1
samplesa239Pu +
3H 14C 90Sr Total Cs 210Pb 210Po 226Ra 232Th Total U 238Pu 240Pu 241Am
Cheshire Macclesfield Beetroot 1 <10 13 0.53 <0.20 0.12 0.066 0.091 0.020 0.09 <0.00020 0.00070 0.00060
±6.0 ±0.05 ±0.02 ±0.009 ±0.006 ±0.006 ±0.019 ±0.00040 ±0.00050Leafy Green Veg. 1 26 <15 <0.20 <0.20 0.060 0.019 0.0080 <0.0050 <0.0089 <0.00020 <0.00020 <0.00020
±3.0 ±0.042 ±0.005 ±0.0040Potatoes 1 <10 16 <0.20 <0.20 0.069 0.030 0.038 0.027 0.095 <0.00020 0.0013 <0.00030
±5.0 ±0.042 ±0.006 ±0.004 ±0.005 ±0.011 ±0.0005Clwyd Rhyl Honey 1 <10 68 <0.20 <0.20 <0.038 0.030 0.0060 <0.0050 <0.029 <0.00020 <0.00030 <0.00040
±12 ±0.018 ±0.006 ±0.0030Silage 1 <10 36 0.88 0.37 0.93 0.59 0.17 0.010 <0.13 <0.00030 0.0017 0.0033
±6.0 ±0.06 ±0.09 ±0.04 ±0.06 ±0.01 ±0.006 ±0.0009 ±0.0018Damsons 1 <10 21 <0.20 <0.20 0.15 0.059 0.012 <0.0050 0.029 <0.00020 <0.00020 <0.00030
±5.0 ±0.05 ±0.009 ±0.003 ±0.00030Cornwall Bude Fodder Beet 1 <10 14 0.53 <0.20 0.13 0.10 0.13 0.025 0.072 <0.00020 0.00080 0.00090
±6.0 ±0.05 ±0.03 ±0.01 ±0.01 ±0.005 ±0.021 ±0.00040 ±0.00060Leafy Green Veg. 1 <10 13 1.8 <0.20 3.0 0.78 0.023 0.0060 <0.045 <0.00020 <0.00020 <0.00030
±3.0 ±0.1 ±0.1 ±0.06 ±0.005 ±0.0050
Bodmin Kale 1 <10 <15 1.8 0.72 - - - - - <0.00020 <0.00020 <0.00040±0.1 ±0.09
Turnips 1 <10 12 1.1 <0.20 - - - - - <0.00040 <0.00020 <0.00040±4.0 ±0.1
Cumbria Keswick Carrots/Swedes 1 <10 <15 0.48 0.35 - - - - - <0.00020 0.0011 0.00030
±0.04 ±0.08 ±0.0004 ±0.00030Leafy Green Veg. 1 <10 <15 0.50 <0.20 - - - - - <0.00020 <0.00020 0.00060
±0.04 ±0.00040Soft Fruit 1 <10 25 0.7 <0.20 - - - - - <0.00020 <0.00020 0.00030
±7.0 ±0.04 ±0.00030
Ambleside Plums 1 <10 14 <0.20 0.23 0.12 0.041 0.0080 <0.0050 <0.032 <0.00020 <0.00020 0.00040±4.0 ±0.08 ±0.06 ±0.007 ±0.0030 ±0.00040
Potatoes 1 <10 18 <0.20 0.35 <0.040 0.042 0.019 0.012 0.075 <0.00020 0.00050 0.00030±4.0 ±0.07 ±0.007 ±0.004 ±0.005 ±0.011 ±0.00030 ±0.00030
Spinach 1 <10 <15 1.3 0.36 1.2 0.36 0.12 0.012 <0.052 <0.00020 0.00060 0.00030±0.1 ±0.08 ±0.1 ±0.03 ±0.01 ±0.004 ±0.00030 ±0.00030
Gloucestershire Cirencester Leafy Green Veg. 1 <10 <15 0.48 <0.20 0.88 0.28 <0.0050 0.019 0.039 <0.00020 <0.00020 <0.00050
±0.04 ±0.04 ±0.03 ±0.005 ±0.015Root Veg 1 <10 21 <0.20 <0.20 0.046 0.043 0.041 0.043 0.20 <0.00020 0.00030 <0.00050
±6.0 ±0.015 ±0.007 ±0.004 ±0.006 ±0.03 ±0.00020Soft Fruit 1 <10 18 <0.20 <0.20 0.085 0.029 <0.0050 <0.0050 <0.0070 <0.00020 <0.00020 <0.00030
±3.0 ±0.018 ±0.006Humberside Hull Sprouts 1 <10 <15 - - - - - - - - - -
Driffield Swede 1 <10 <15 0.28 <0.20 - - - - - <0.00020 0.0024 <0.00070±0.04 ±0.0008
Lincolnshire Sleaford Cabbage 1 <10 <15 <0.20 <0.20 - - - - - <0.00020 0.00030 0.00040
±0.00020 ±0.00040Plums 1 <10 <15 <0.20 <0.20 - - - - - <0.00020 <0.00020 <0.00020
Potatoes 1 <10 16 <0.20 <0.20 - - - - - <0.00020 <0.00020 <0.00020±5.0
Norfolk Kings Lynn Leafy Green Veg. 1 <10 16 <0.20 <0.20 0.18 0.092 0.0070 <0.0050 0.12 <0.00020 <0.00020 0.00030
±4.0 ±0.03 ±0.011 ±0.0040 ±0.02 ±0.00020Root Veg. 1 <10 16 0.22 <0.20 <0.025 0.030 0.018 <0.0050 <0.042 <0.00020 <0.00020 0.00030
±5.0 ±0.03 ±0.006 ±0.003 ±0.00030Soft Fruit 1 <10 15 <0.20 <0.20 <0.025 0.061 0.023 <0.0050 <0.034 <0.00030 <0.00020 0.00030
±5.0 ±0.008 ±0.004 ±0.00030

117
Table 49. continued
Location Material No of Mean radioactivity concentration (wet), Bq kg-1
samplesa239Pu +
3H 14C 90Sr Total Cs 210Pb 210Po 226Ra 232Th Total U 238Pu 240Pu 241Am
Northamptonshire Kettering Blackberries 1 <10 23 <0.20 <0.20 0.22 0.080 0.029 <0.0050 <0.012 <0.00020 <0.00020 0.00030
±4.0 ±0.06 ±0.011 ±0.006 ±0.00030
Leafy Green Veg. 1 <10 <15 <0.20 <0.20 0.10 0.031 <0.0050 <0.0050 <0.017 <0.00020 <0.00020 <0.00030±0.02 ±0.007
Potatoes 1 <10 20 <0.20 <0.20 <0.040 0.020 0.023 0.040 0.069 <0.00020 <0.00020 0.00030±4.0 ±0.005 ±0.004 ±0.006 ±0.011 ±0.00030
Suffolk Ipswich Leafy Green Veg. 1 <10 <15 0.47 <0.20 - - - - - <0.00020 <0.00020 0.00050
±0.04 ±0.00040
Parsnips 1 <10 19 0.24 <0.20 - - - - - <0.00020 <0.00020 0.00060±4.0 ±0.04 ±0.00050
Root Veg 1 <10 19 0.24 <0.20 - - - - - <0.00020 <0.00020 0.00060±4.0 ±0.04 ±0.00050
Soft Fruit 1 <10 17 <0.20 <0.20 - - - - - <0.00020 <0.00020 <0.00030±4.0
Surrey Reigate Carrots 1 <10 <15 0.23 <0.20 0.11 0.029 0.15 0.016 0.081 <0.00020 0.00090 0.0032
±0.04 ±0.03 ±0.005 ±0.01 ±0.004 ±0.011 ±0.00040 ±0.0014Lettuce 1 <10 <15 0.24 <0.20 0.27 0.11 0.030 0.035 0.10 <0.00020 <0.00020 <0.0010
±0.04 ±0.04 ±0.02 ±0.004 ±0.007 ±0.01Strawberries 1 <10 <15 <0.20 <0.20 0.23 0.092 0.075 0.0090 0.036 <0.00030 <0.00020 0.00040
±0.04 ±0.011 ±0.006 ±0.0030 ±0.013 ±0.00030
Guildford Leafy Green Veg. 1 <10 <15 <0.20 <0.20 0.16 0.054 0.031 0.027 0.20 <0.00020 0.00040 <0.00040±0.06 ±0.007 ±0.004 ±0.008 ±0.02 ±0.00030
Root Veg. 1 <10 15 0.21 <0.20 0.054 0.034 0.021 0.016 - <0.00020 <0.00020 <0.00020±5.0 ±0.04 ±0.053 ±0.006 ±0.005 ±0.006
Soft Fruit 1 <10 16 <0.20 <0.20 0.13 0.05 0.039 <0.0050 <0.019 <0.00020 <0.00020 0.00030±3.0 ±0.02 ±0.008 ±0.004 ±0.00030
Tyneside Newcastle Cabbage 1 <10 <15 0.29 <0.20 - - - - - <0.00020 <0.00020 <0.00030
±0.04
Potatoes 1 <10 20 <0.20 <0.20 - - - - - <0.00020 <0.00020 <0.00040±6.0
Warwickshire Warwick Apples 1 <10 15 <0.20 <0.20 - - - - - <0.00020 <0.00020 0.00050
±4.0 ±0.00040Blackberries 1 <10 19 <0.20 <0.20 - - - - - <0.00020 <0.00020 0.00030
±5.0 ±0.00030
Carrots 1 <10 <15 0.33 <0.20 - - - - 0.071 <0.00020 <0.00020 0.00030±0.04 ±0.014 ±0.00030
Sprouts 1 <10 <15 - - - - - - - - - -
Wiltshire Swindon Apples 1 <10 <15 <0.20 <0.20 0.052 0.028 0.0060 <0.0050 <0.029 <0.00020 <0.00020 <0.00040
±0.017 ±0.006 ±0.0030Cabbage 1 <10 <15 0.41 <0.20 0.33 0.12 <0.0050 <0.0050 <0.044 <0.00020 <0.00020 <0.00050
±0.04 ±0.03 ±0.01Carrots 1 <10 <15 0.22 <0.20 0.12 0.046 0.062 0.018 0.073 <0.00020 <0.00020 0.00040
±0.03 ±0.02 ±0.007 ±0.006 ±0.004 ±0.017 ±0.00030 Salisbury Grapes 1 <10 17 <0.20 <0.20 - - - - - <0.00020 <0.00020 <0.00020
±4.0Leafy Green Veg. 1 <10 <15 1.2 <0.20 - - - - - <0.00020 <0.00020 <0.00030
±0.1Sugar Beet 1 <10 <15 0.29 <0.20 - - - - - <0.00020 <0.00020 <0.00050
±0.03Wolverhampton Cotshall Cabbage 1 <10 <15 0.56 <0.20 - - - - - <0.00020 <0.00020 <0.00030
±0.05
Damsons 1 <10 25 <0.20 <0.20 - - - - - <0.00020 <0.00020 <0.00020±4.0
Potatoes 1 <10 20 <0.20 <0.20 - - - - - <0.00020 0.00090 <0.00030±5.0 ±0.00030
- not analyseda see section 5 for definitionb Results are available for other artificial nuclides detectable by gamma spectrometry. All such results are less than the limit of detection

118
Table 50. Radioactivity in sea water from the Irish Sea and Scottish waters, 1995
Location No. of Mean radioactivity concentration,sampling Bq l-1
observa-tions 3H 99Tc 134Cs 137Cs
Seascale 4 - - 0.0074 0.25±0.0017 ±0.002
St Bees 4 13 0.48 0.0047 0.23±2.1 ±0.04 ±0.0016 ±0.002
Whitehaven 1 - - 0.0017 0.31±0.002 ±0.002
Maryport 1 - - 0.0027 0.4±0.0015 ±0.002
Silloth 1 - - 0.0032 0.62±0.0015 ±0.003
Silecroft 1 - - * 0.0033±0.0008
Walney-west shore 4 12 - 0.0039 0.059±2.1 ±0.0015 ±0.001
Isle of Whithorn 1 - - * 0.13±0.001
Drummore 1 - - * 0.066±0.001
Half Moon Bay 1 - - 0.0043 0.38±0.0017 ±0.002
Rossal (Fleetwood) 1 - - 0.0044 0.27±0.0017 ±0.002
Ainsdale 1 - - 0.0033 0.21±0.0016 ±0.002
New Brighton 1 - - 0.0015 0.13±0.0016 ±0.002
Ross Bay 1 - - 0.0027 0.16±0.0015 ±0.002
North of Larne 12 - 0.029 0.0017 0.046±0.002 ±0.0014 ±0.001
Seafield 4 8.6 - 0.0032 0.34±1.9 ±0.0017 ±0.002
Southerness 4 10 - 0.0040 0.41±2.0 ±0.0016 ±0.002
Knock Bay 4 * - 0.0042 0.063±0.0025 ±0.002
Prestatyn 1 - - * 0.042±0.001
Llandudno 1 - - * 0.044±0.001
Cemaes Bay 1 - - * 0.014±0.0008
Holyhead 4 * - * 0.014±0.0008
Cape Wrath 4 - - * 0.018±0.0008
Pentland Firth 4 - - * 0.015±0.0008
Fair Isle 3 - - * 0.0076
±0.0008
Aberdeen 4 - - * 0.013±0.0008
- not analysed* not detected by the method used

119
Table 51. Extramural projects in support of the monitoring programmes
Targetcompletion date
1. Radioactivity in terrestrial wild foods Complete2. 14C in UK grown foods �3. Natural radionuclides in beer �4. 210Po and 210Pb in UK terrestrial foods �5. Inter-laboratory comparison of 210Pb and 210Po measurements in foodstuffs Dec-966. Radioactivity in tide washed pastures Complete7. Radioactivity in UK produced beverages �8. Evaluation of ion chromatagraphic separations for actinide elements in diet �9. Development of a sensitive method for the determination of 35S in food �10. Database for nuclear operators environmental monitoring data �11. Care and maintenance of radiocaesium samples �12. 35S, 14C and tritium in air, grass and crops �13. Sensitivity analysis of critical group assessments Mar-9614. Chernobyl radiocaesium in Cumbrian grass Complete15. The dynamics of radionuclides in sheep May-9616. Hot particles in the foodchain Complete17. Collective dose determination from surveillance data Sep-9618. Radionuclides in macrofungi Feb-9719. Radionuclide analyses: landfill, industrial and diet Mar-9720. Decision aiding tool to optimise surveillance programmes Aug-9721. The radiological impact of free foods Dec-9722. Quality control of foodstuff surveillance Mar-9823. Food production near nuclear sites Mar-9824. Dietary studies near nuclear installations Mar-0025. Variability of natural nuclides in crops Feb-98

120

121
APPENDIX 1. Monitoring of the marine environment nearnuclear sites in Scotland, 1995
1.1 Introduction
This Appendix presents the results of the aquatic environmental monitoring programme carried out in Scotlandduring 1995 by staff of the Ministry of Agriculture, Fisheries and Food�s (MAFF�s) Directorate of Fisheries Research(DFR), Lowestoft. This programme was carried out on behalf of the Scottish Office to support statutory functionsunder the Radioactive Substances Act, 1993 (United Kingdom - Parliament, 1993). Its primary purposes are to verifythe satisfactory control of liquid radioactive waste discharges and to ensure that the resulting public radiationexposure is within nationally-accepted limits.
To set the monitoring results from the regular programme in context, liquid radioactive discharges from Scottish nuclearestablishments in 1995 are first summarised. The results for individual sites then follow. The information on the aquaticenvironment in the main text of this report give details of the methods of sampling, analysis and presentation andassessment of results. The programme for sites in Scotland is carried out with the same basis and to the same standards asthat for sites in England and Wales. The programme in Scotland, taken with that in other areas discussed in the main text ofthis report, provides information on radioactivity covering the whole of the surface and coastal waters of the British Isles.
1.2 Discharges of radioactive waste
Table 1.1 lists the principal discharges of liquid radioactive waste from Scottish nuclear establishments during 1995.The locations of these establishments are shown in Figure 1.1. Table 1.1. also lists the discharge limits which areauthorised. These are usually very much lower than the levels of activities which could be released withoutexceeding the dose limits which are recommended by the International Commission on Radiological Protection andembodied in national policy (United Kingdom - Parliament, 1995a). The percentages of the authorised limits taken upin 1995 are also stated in Table 1.1. No site discharged waste above the authorised limits in 1995.
Dounreay
Faslane
RosythHunterston
Chapelcross
Torness
UKAEA Establishment
Scottish Nuclear Power Station
MOD Establishment
Figure 1.1. Principal sources of radioactive wastedisposal in Scotland, 1995
♦
♦
♦♦

122
1.3 Chapelcross, Annandale and Eskdale
At this establishment, BNFL operates a magnox-type nuclear power station. Liquid waste is discharged to theSolway Firth under authorisation from the Scottish Office. Discharges in 1995 were similar to those in 1994. Habitssurveys have established that three groups of people could receive radiation exposures of potential importance. Thefirst of these groups comprises fishermen who consume local seafood and are exposed to external radiation whilsttending stake nets. The second group are fishermen who receive skin exposures whilst handling nets and the thirdare wildfowlers who are exposed whilst on salt marshes. The scope of monitoring reflects these pathways. Samplesof sea water and Fucus vesiculosus, as useful indicators, are also analysed. The results of monitoring in 1995 arepresented in Tables 1.2(a) and (b).
Concentrations of artificial radionuclides in the Chapelcross vicinity are mostly due to Sellafield discharges, and thegeneral levels of nuclides given in Table 1.2(a) are consistent with values expected at this distance from Sellafield.Concentrations of radiocaesium in 1995 were generally similar to, or less than, those in 1994. The total beta activity inFucus vesiculosus increased due to increases in discharges, particularly of technetium-99, from Sellafield. Theexposure of the critical group of fishermen who consume seafood and are exposed to external radiation over intertidalareas was 0.026 mSv in 1995 which is 3% of the dose limit of 1 mSv for members of the public. The exposure of theskin of local fishermen, including a component due to natural radiation was 0.088 mSv corresponding to less than0.2% of the dose limit appropriate for exposures to skin of members of the public. Wildfowlers received a dose of0.024 mSv. The magnitude of the Chapelcross discharges indicates that the local contribution to dose was a tinyfraction of these exposures, most of it being due to Sellafield discharges.
1.4 Dounreay, Caithness
Liquid radioactive waste discharges from this UKAEA establishment are made to the Pentland Firth underauthorisation by the Scottish Office. Discharges include a minor contribution from the adjoining reactor site (VulcanNaval Reactor Test Establishment) which is operated by the Ministry of Defence (Procurement Executive).Discharges from Dounreay in 1995 were generally similar to those in 1994 reflecting the campaigns of reprocessing ofreactor fuel. Monitoring in 1995 continued to include sampling of fish and shellfish from the area of the Dounreayoutfall and other materials further afield, associated beta and gamma dose rate measurements and a survey inSandside Bay for particulate contamination. The results are presented in Tables 1.3(a) and (b). No particulatecontamination was found in Sandside Bay.
Habits surveys have confirmed the existence of four potentially critical exposure pathways, three of which involveexternal irradiation. The first of these is due to radioactivity adsorbed mainly on fine particulate matter becomingentrained on fishing gear which is regularly handled. This results in skin dose, mainly from beta particles, to thehands and forearms of fishermen. The most exposed group is represented by a small number of people who operate asalmon fishery from Sandside Bay, close to Dounreay. The skin exposure of these fishermen has been assessedincluding a component due to natural radiation. The dose in 1995 was 0.17 mSv, or less than 0.4% of the dose limit of50 mSv for skin exposures.
The second potentially critical pathway arises also from the uptake of radioactivity by particulate material whichaccumulates in rocky areas of the foreshore and presents a potential source of exposure, mainly to gamma radiation,of those who visit these areas. In 1995, monitoring of sludge at Oigin�s Geo showed decreased concentrations ofradionuclides compared with 1994. However, there is known to be significant variability in these concentrations. Themore important measurements of gamma dose rates above areas of the foreshore remained unchanged. Publicradiation exposure via this pathway remained low, at 0.008 mSv or 0.8% of the dose limit of 1 mSv.
The third potentially critical pathway involves internal exposure of consumers of locally-collected fish and shellfish;fish, crabs, lobsters and winkles from the outfall area are sampled to enable this pathway to be kept under review.Additionally, sea water and seaweed were sampled as indicator materials. Concentrations of radionuclides in 1995were generally similar to those for 1994, although there were some small increases observed. Despite these,exposures from consumption of fish and shellfish continued to be low: for high-rate consumers the radiation dosewas less than 0.005 mSv or 0.5% of the dose limit of 1 mSv.
The fourth potential critical pathway is due to consumption of molluscs and external exposure during collection.Gamma dose rates were measured over collecting areas and winkles were analysed for their radioactivity content.Gamma dose rates over the main collecting areas were unchanged in 1995 and the radiation dose due to acombination of consumption of molluscs and external exposure during collection was still low at 0.030 mSv or 3% ofthe dose limit of 1 mSv. This pathway was the critical one at Dounreay in 1995.

123
1.5 Hunterston, Cunninghame
This establishment comprises �A� and �B� stations; the �A� station was designed for magnox-type reactors and the �B�station for AGRs. The �A� station ceased power production at the end of March 1990. Liquid radioactive wastedischarges are made to the Firth of Clyde under authorisation of the Scottish Office. A recent habits survey hasconfirmed that there are two pathways which contribute to the radiation exposure of the most exposed group: fishand shellfish consumption leading to internal irradiation, and occupancy of intertidal areas leading to externalexposure. Therefore, the main part of the monitoring programme comprises sampling of fish and shellfish andmeasurement of gamma dose rate on the foreshore. Samples of sand are also analysed in support of the gamma doserate measurements and sea water and Fucus seaweed are analysed as indicator materials. The results of monitoringin 1995 are shown in Tables 1.4(a) and (b). The concentrations of artificial radioactivity in this area are predominantlydue to Sellafield discharges, the general values being consistent with those to be expected at this distance fromSellafield. Small concentrations of activation products such as manganese-54 were probably due to discharges fromthe site; however, these were of negligible radiological significance. In 1995, the exposure, including externalradiation, of members of the most exposed group of fish and shellfish consumers near Hunterston was low, at 0.018or 2% of the dose limit of 1 mSv.
1.6 Torness, East Lothian
This station, which is powered by two AGRs, came into operation at the end of 1987. Discharges of radioactive wastesto the North Sea are authorised by the Scottish Office. A habits survey has shown that potentially critical pathways forradiation exposure of the public are internal irradiation from consumption of local fish and shellfish and externalexposure from occupancy of intertidal areas during leisure activities and whilst collecting shellfish. These pathwaysform the basis of the regular monitoring programme. Samples of fish and shellfish are collected and analysed, andsamples of sea water and Fucus vesiculosus are monitored as indicator materials. Measurements are also made ofgamma dose rates over intertidal areas, supported by analyses of sediment, and beta dose rates on fishing gear.
Results of this monitoring in 1995 are shown in Tables 1.5(a) and (b). Concentrations of artificial radionuclides weremainly due to the distant effects of Sellafield discharges and to fallout, though trace levels of activation productswere likely to have been due to discharges from the station. In 1995, the group of fish and shellfish consumers andthe group subject to external radiation both received very low exposures at less than 0.005 mSv, or 0.5% of the doselimit of 1 mSv. The beta radiation from fishermen�s nets and pots was typical of that due to natural radiation.
1.7 Naval establishments
Liquid wastes containing small quantities of radioactivity are discharged from the establishments at Faslane andRosyth under authorisation of the Scottish Office (Table 1.1). DFR carry out monitoring programmes near theseestablishments and also Holy Loch in surveillance of the effects of past discharges.
Public radiation exposures due to the effects of any discharges from these establishments are primarily due toexternal radiation from sediments, the nuclide of main importance being cobalt-60. Regular assessments of doses tomost exposed groups take account of the effects of discharges from other nuclear establishments (e.g. Sellafield) aswell as exposure pathways additional to external radiation, such as any consumption of fish and shellfish.Measurements of gamma dose rates are regularly carried out near all establishments; these are supported byanalyses of sediments. Marine foodstuffs and sea water are also analysed where appropriate.
Results of monitoring in 1995 are presented in Tables 1.6(a) and (b). The small concentrations of cobalt-60 mainlyreflect discharges from the establishments; levels of other radionuclides are mainly due to discharges from Sellafieldand to weapons-test fallout. Gamma dose rates over intertidal sediments, directly measured using portableinstruments, were generally difficult to distinguish from the natural background. The gamma dose rate at Carnbanboatyard near Faslane increased in 1995 but this was due to direct radiation from a source of stored waste, and not tothe effects of liquid waste discharges. In 1995, the exposure of most exposed groups, including the effects of othersources and taking account of consumption of marine foods and occupancy times, continued to remain low nearthese naval establishments, at less than 0.020 mSv year-1. This represents less than 2% of the dose limit of 1 mSv.
1.8 Conclusions
• Discharges of liquid radioactive wastes from major nuclear sites in Scotland were controlled by the ScottishOffice using powers in the Radioactive Substances Act, 1993. Discharges from all sites in 1995 were within theauthorised limits.

124
• MAFF operated a radioactivity monitoring programme to check the safety of these discharges on behalf of theScottish Office. The programme considered all relevant pathways of exposure and included detection of betaand gamma dose rates in the environment and the analyses of samples of seafood and other materials from theenvironment. Dose rates and activity concentrations were generally similar in 1995 to those in 1994.
• Public radiation exposures from discharges of liquid radioactive waste in 1995 are presented in Table 1.7 andFigure 1.2. Doses were similar to those in 1994 and were all well within the dose limit of 1 mSv for members ofthe public or the skin dose limit of 50 mSv as appropriate.
Rosyth
Dose limit tomembers of thepublic is 1 mSv
Faslane
Hunterston
Chapelcross
Torness
Dounreay
Figure 1.2. Radiation exposures in Scotland dueto liquid radioactive wastedischarges, 1995. (Historic dischargesfrom Sellafield contribute toexposures at Scottish sites)
Holy Loch

125
Table 1.1. Principal discharges of liquid radioactive waste from nuclear establishments in Scotland,1995
Establishment Radioactivity Discharge limit Discharges during 1995(annualequivalent), TBq TBqa % of limitb
British Nuclear Fuels plc
Chapelcross Total alpha 0.1 6.61 10-4 <1Total betac 25 0.158 <1Tritium 5.5 0.504 9.2
United Kingdom Atomic EnergyAuthority
Dounreay Total alphad 0.75 0.0856 11Total betac 110 6.98 6.3Tritium 130 1.09 <1Cobalt-60 1 0.0270 2.7Strontium-90 12 0.604 5.0Zirconium-95+Niobium-95 6 0.133 2.2Ruthenium-106 12 0.758 6.3Silver-110m 0.4 0.0060 1.5Caesium-137 50 3.72 7.4Cerium-144 12 0.0331 <1Plutonium-241 15 0.548 3.7Curium-242 1 0.0065 <1
Scottish Nuclear Ltd
Hunterston �A� Station Total activityc 2 0.150 7.5
Tritium 5 0.0413 <1
�B� Station Total activityc,e 3.7 0.0235 <1Tritium 1480 449 30Sulphur-35 26 1.70 6.5
Torness Total alpha 0.0045 0.00000932 <1Beta activityc,e,f 0.45 0.00163 <1Tritium 1200 270 23Sulphur-35 10 0.0417 <1Cobalt-60 0.05 0.000665 1.3
Ministry of Defence
Faslane Alpha activity 2.0 10-4 1.4 10-5 7Beta activityc,f 5.0 10-4 3.11 10-4 62Tritium 1 0.0939 9.4Cobalt-60 5.0 10-4 2.03 10-4 40
Rosythg Total alpha 1.0 10-6 4.96 10-7 50Beta activityc,f 0.01 2.62 10-4 2.6Tritium 0.01 0.00652 65Cobalt-60 0.055 7.11 10-4 1.3
a Some discharges are upper estimates because they include �less than� data derived from analyses of effluents at limits of detection.Data quoted to 3 significant figures except where fewer significant figures are provided in source documents.
b Data quoted to 2 significant figures except when values are less than 1%c Excluding tritiumd Excluding curium-242e Excluding sulphur-35f Excluding cobalt-60g Discharges are made by Babcock Rosyth Defence Ltd

126
Table 1.2(a). Radioactivity in seafood and the environment near Chapelcross nuclear power station, 1995
Material Locationb No. of Mean radioactivity concentration (wet)a, Bq kg-1
samplingobserva- 239Pu+ 243Cm+ Totaltionsc 3H 14C 60Co 90Sr 99Tc 106Ru 110mAg 125Sb 134Cs 137Cs 154Eu 155Eu 238Pu 240Pu 241Pu 241Am 242Cm 244Cm beta
Flounder Inner Solway 4 - 50 * 0.042 1.0 * * * * 28 * * 0.0038 0.020 - 0.031 0.000026 0.000051 -±8.3 ±0.002 ±0.1 ±0.8 ±0.0001 ±0.0006 ±0.0006 ±0.000014 ±0.000012
Seatrout � 1 - - * - - * * * * 3.3 * * 0.00044 0.0021 - 0.0032 * 0.0000080 -±0.5 ±0.00005 ±0.0001 ±0.0002 ±0.0000059
Salmon � 1 - - * - - * * * * 0.85 * * - - - * - - -±0.17
Shrimps � 4 - - * 0.16 2.5 * 0.08 * * 12 * * 0.0036 0.019 - 0.032 * * -±0.01 ±0.2 ±0.06 ±0.3 ±0.0002 ±0.0006 ±0.001
Winkles Southerness 4 - - 0.75 1.9 430 1.9 2.0 0.61 * 12 0.08 * 0.88 4.3 54 7.3 0.015 0.014 -±0.14 ±0.1 ±34 ±1.1 ±0.3 ±0.35 ±0.2 ±0.13 ±0.03 ±0.1 ±1.2 ±0.2 ±0.013 ±0.007
Fucus vesiculosus Pipeline 4 - - 0.56 - 2200 * * 0.11 * 27 * 0.30 0.65 3.3 - 3.7 0.0063 0.0055 1500±0.13 ±200 ±0.11 ±0.3 ±0.20 ±0.03 ±0.1 ±0.1 ±0.0051 ±0.0029
Mud Bladnoch 4 - - 3.3 - - 25 * 3.7 0.91 470 6.1 4.3 - - - 320 - - -±0.9 ±8.3 ±2.5 ±0.84 ±3.9 ±2.1 ±2.4 ±7.8
Mud and sand Pipeline 4 - - 1.2 - - 10 * 0.72 0.11 280 1.3 0.74 9.1 46 - 73 * 0.074 -±0.45 ±6.4 ±0.94 ±0.26 ±2.5 ±0.5 ±0.43 ±0.6 ±1.5 ±2.3 ±0.055
Sea water � 4 4.3 - - - - - - - 0.0032 0.34 - - - - - - - - -±0.7 ±0.0017 ±0.002
� Southerness 4 10 - - - - - - - 0.0040 0.41 - - 0.00045 0.0023 - 0.0021 0.000001 0.0000035 -±1.9 ±0.0020 ±0.002 ±0.00002 ±0.0001 ±0.0001 ±0.000001 ±0.0000016
- not analysed* not detected by the method useda Except for sea water where units are Bq l-1 and for sediment where dry concentrations applyb Landing point or sampling areac see section 5 for definition
Table 1.2(b). Monitoring of radiation dose ratesnear Chapelcross, 1995
Location Ground No. of µSv h-1
type samplingobserva-tionsa
Beta dose rates on nets
Seafield Stake nets 3 0.35
Gamma dose rates at 1 m over intertidal areas µGy h-1
Seafield Mud and sand 4 0.082� Salt marsh 4 0.090Battle Hill Mud and sand 4 0.084Browhouses � 3 0.11� Mud, sand and
stones 1 0.11Dornoch Brow Mud and sand 2 0.086� Salt marsh 4 0.095Powfoot Mud and sand 4 0.078Priestside Bank Salt marsh 4 0.084� b � 4 0.087Southerness Winkle bed 2 0.064
a See section 5 for definitionb 15 cm above subsrate

127
Table 1.3(a). Radioactivity in seafood and the environment near Dounreay, 1995
Material Locationb No. of Mean radioactivity concentration (wet)a, Bq kg-1
samplingobserva- 239Pu+ 243Cm+ Total Total Totaltionsc 3H 14C 54Mn 58Co 60Co 95Zr 95Nb 99Tc 106Ru 110mAg 125Sb 134Cs 137Cs 144Ce 154Eu 155Eu 238Pu 240Pu 241Am 242Cm 244Cm alpha beta gamma
Cod Pipeline 4 - 18 * * * * * - * * * * 0.77 * * * 0.00013 0.00065 0.0011 * 0.0000024- - -±6.9 ±0.06 ±0.00002 ±0.00005 ±0.00005 ±0.000002
Crabs � 4 - - * * * * * - * 0.55 * 0.05 0.31 * * * 0.0037 0.012 0.017 0.0022 0.00030 - - -±0.14 ±0.05 ±0.09 ±0.0001 ±0.0003 ±0.0003 ±0.0001 ±0.00003
Lobsters � 4 - - * * 0.12 * * - * 8.2 * 0.06 0.77 * * * 0.014 0.036 0.16 0.010 0.0033 - - -±0.05 ±0.5 ±0.04 ±0.21 ±0.0004 ±0.001 ±0.003 ±0.0004 ±0.0001
Winkles Brims Ness 4 - - 0.05 0.07 0.87 * * - 1.4 19 * 0.05 0.41 0.17 * * 0.14 0.40 0.39 0.030 0.0068 - - -±0.04 ±0.06±0.18 ±1.0 ±0.58 ±0.04 ±0.09 ±0.21 ±0.01 ±0.01 ±0.011 ±0.004 ±0.0010
� Sandside Bay 4 - - 0.03 0.04 0.82 * * - 0.78 19 0.06 0.04 0.47 0.06 * 0.02 0.13 0.39 0.36 0.036 0.0058 - - -±0.04 ±0.04±0.11 ±0.76±0.36 ±0.07 ±0.06 ±0.10 ±0.10 ±0.05 ±0.005 ±0.01 ±0.01 ±0.006 ±0.0012
Sludge Oigins Geo 3 - - 68 18 120 14 9.3 - 2300 97 290 7.9 210 73 17 21 250 710 540 5.9 2.4 - - -±4.1 ±3.8 ±5.5 ±5.0 ±4.2 ±53 ±7.3 ±13 ±3.0 ±4.7 ±11 ±6.1 ±4.7 ±4.5 ±17 ±9.6 ±1.3 ±0.5
Sand Sandside Bay 4 - - * * 0.12 * * - * * * * 5.3 * 1.1 1.3 2.6 10 9.4 0.089 0.12 - - -±0.14 ±0.3 ±0.6 ±0.6 ±0.2 ±0.4 ±0.3 ±0.032 ±0.02
Fucus vesiculosus� 4 - - 0.12 0.07 0.94 0.04 0.03 250 0.50 1.2 0.04 0.15 1.4 0.08 * 0.06 - - 0.23 - - - 410 -
±0.06 ±0.04±0.09 ±0.04±0.03 ±20 ±0.37±0.1 ±0.05 ±0.06 ±0.07 ±0.08 ±0.05 ±0.12� Brims Ness 4 - - 0.10 0.09 1.0 0.13 0.12 - 0.53 0.94 * 0.06 0.96 0.32 0.02 0.11 - - 0.32 - - - - -
±0.07 ±0.06±0.1 ±0.08±0.13 ±0.36±0.15 ±0.06 ±0.08 ±0.17 ±0.03 ±0.09 ±0.15Sea water Sandside Bay 4 * - - - - - - - - - - * 0.03 - - - - - - - - - - -
±0.0009Dry cloths 71 - - - - - - - - - - - - - - - - - - - - - 0.16 0.99 0.47
±0.15 ±0.91±0.45
- not analysed* not detected by the method useda Except for sea water where units are Bq l-1, and for sediment where dry concentrations applyb Landing point or sampling areac See section 5 for definition
Table 1.3(b). Monitoring of radiation dose ratesnear Dounreay, 1995
Location Ground No. of µGy h-1
type samplingobserva-tionsa
Gamma dose rates at 1 m over substrate
Oigins Geo Intertidal sediment 4 0.15Sandside Bay Sand 1 0.074� Winkle bed 4 0.15� Net store 1 0.097Castletown Harbour Mud 2 0.077
Beta dose rates on fishing gear µSv h-1
Sandside Bay Gill nets 1 0.18Pipeline offshore Pots 1 0.35
a See section 5 for definition

128
Table 1.4(a). Radioactivity in seafood and the environment near Hunterston nuclear power station, 1995
Material Locationb No. of Mean radioactivity concentration (wet)a, Bq kg-1
samplingobserv- Totalationsc 3H 51Cr 54Mn 58Co 60Co 65Zn 110mAg 124Sb 134Cs 137Cs 155Eu 238Pu 239+240Pu 241Am 242Cm 243+244Cm Beta
Cod Millport 2 - * * * * * * * * 2.9 * - - * - - -±0.1
Saithe � 1 - * * * * * * * * 5.6 * - - * - - -±0.2
Crabs � 2 - * * * * * * * * 0.75 * 0.0062 0.03 0.034 * 0.00012 -±0.12 ±0.0002 ±0.0005 ±0.0008 ±0.00003
Nephrops � 2 - * * * * * * * * 3.3 * - - * - - -±0.1
Velvet swimming crabs Largs 1 - * * * * * * * * 0.39 * - - * - - -±0.20
Lobsters � 1 - * * * * * * * * 0.62 * - - * - - -±0.25
Oysters Fairlie 1 - * 0.25 * 0.23 0.19 0.82 * * 0.66 * - - * - - -±0.06 ±0.06 ±0.09 ±0.10 ±0.05
Winkles Pipeline 2 - 21 6.0 0.39 3.6 0.52 6.3 * * 1.2 0.06 0.048 0.18 0.083 0.002 0.0029 -±9.6 ±0.2 ±0.23 ±0.2 ±0.25 ±0.3 ±0.1 ±0.08 ±0.001 ±0.003 ±0.002 ±0.0005 ±0.0003
Fucus spiralis � 2 - 3.8 7.5 1.1 6.0 0.60 2.3 0.11 0.13 4.2 * - - 0.046 - - 350±0.9 ±0.1 ±0.09 ±0.1 ±0.12 ±0.1 ±0.06 ±0.09 ±0.1 ±0.042
Sand � 2 - * 7.9 * 1.5 * * * * 12 0.32 - - 0.29 - - -±0.4 ±0.3 ±0.5 ±0.34 ±0.17
Sea water � 12 3.1 - - - - - - - 0.002 0.06 - - - - - - -±1.9 ±0.002 ±0.001
- not analysed* not detected by the method useda Except for sea water where units are Bq l-1and for sediment where dry concentrations applyb Landing point or sampling areac See section 5 for definition Table 1.4(b). Monitoring of radiation dose rates
near Hunterston nuclear powerstation, 1995
Location Ground No. of µGy h-1
type samplingobserva-tionsa
Gamma dose rates at 1 m over intertidal areas
0.5 km north of pipeline Sand 2 0.0550.5 km south of pipeline Sand and stones 2 0.073Ardrossan Mud and sand 1 0.067Bogside flats Saltmarsh 2 0.071
a See section 5 for definition

129
Table 1.5(a). Radioactivity in seafood and the environment near Torness nuclear power station, 1995
Material Locationb No. of Mean radioactivity concentration (wet)a, Bq kg-1
samplingobserv- Totalationsc 3H 54Mn 60Co 110mAg 125Sb 137Cs 155Eu 238Pu 239+240Pu 241Am 242Cm 243+244Cm beta
Cod Pipeline 2 - * * * * 1.0 * - - - - - -±0.1
Crabs Cove 2 - * * * * 0.09 * - - - - - -±0.08
Lobsters � 1 - * * * * 0.23 * - - - - - -±0.23
Nephrops Dunbar 4 - * * * * 0.62 * 0.00071 0.0039 0.0061 0.000018 0.000027 -±0.10 ±0.00005 ±0.0001 ±0.0002 ±0.000014 ±0.00001
Winkles Pipeline 1 - * 0.43 1.6 * 0.51 * - - - - - 38±0.29 ±0.6 ±0.25
Fucus vesiculosus � 2 - 0.27 0.97 0.76 * 0.62 * - - - - - 290±0.08 ±0.10 ±0.08 ±0.08
Mud Eyemouth Harbour 1 - * * * * 32 0.73 - - - - - -±0.5 ±0.66
Mud and sand Dunbar inner harbour 2 - * * * * 19 1.5 - - 0.43 - - -±0.7 ±0.9 ±0.44
� Barns Ness 1 - * * * 0.48 9.8 1.9 - - - - - -±0.34 ±0.4 ±0.5
Sand Thornton Loch Beach 2 - * * * * 3.1 0.41 - - - - - -±0.3 ±0.37
Seawater Pipeline 12 3.4 - - - - 0.016 - - - - - - -±1.3 ±0.001
- not analysed* not detected by the method useda except for sea water where units are Bq l-1and for sediment where dry concentrations applyb landing point or sampling areac see section 5 for definition
Table 1.5(b). Monitoring of radiation dose ratesnear Torness, 1995
Location Ground No. of µSv h-1
type samplingobserva-tionsa
Beta dose rates on nets
Cove Pots 2 0.083Dunbar Harbour Nets 3 0.055
Gamma dose rates at 1 m over intertidal areas µGy h-1
Barns Ness Mud, sand and stones 1 0.056
� Mud and sand 1 0.066Skateraw Harbour Sand 1 0.052� Sand and stones 1 0.062Thornton Loch Beach Sand 2 0.057Eyemouth Harbour Mud and sand 1 0.082Dunbar Inner Harbour � 1 0.071� Mud 1 0.062St Abbs Mud and sand 2 0.079
a See section 5 for definition

130
Table 1.6(a). Radioactivity in seafood and the environment near naval establishments in Scotland, 1995
Material Locationb No. of Mean radioactivity concentration (wet)a, Bq kg-1
samplingobserva-tionsc 3H 60Co 125Sb 131I 137Cs 155Eu
FaslaneMud, sand and stones Carnban boatyard 2 - 3.1 0.5 * 30 *
±0.7 ±0.5 ±1.0Sea water � 1 * - - - - -HolylochMud Mid-Loch 1 - 0.75 * * 21 1.4
±0.26 ±0.7 ±1.0RosythCrabs East of dockyard 2 - * * * 0.22 *
±0.14Fucus vesiculosus � 2 - * * 0.81 0.63 *
±0.24 ±0.10Mud and sand Blackness Castle 2 - * * * 28 1.7
±1.2 ±1.2� West of dockyard 2 - * * * 21 2.0
±0.7 ±0.9Mud East of dockyard 2 - * * * 28 0.75
±1.3 ±0.50� Port Edgar 2 - 0.17 * * 31 0.90
±0.15 ±1.1 ±0.46Sand Pettycur 2 - * * * 1.3 0.15
±0.2 ±0.23
- not analysed* not detected by the method useda Except for sea water where units are Bq l-1, and for sediment where dry concentrations applyb Landing point or sampling area.c See section 5 for definition
Table 1.6(b). Monitoring of radiation dose rates near navalestablishments in Scotland, 1995
Establishment Location Ground No. of µGy h-1
type samplingobserva-tionsa
Gamma dose rates at 1 m over intertidal areas
Faslane Gareloch Head Mud, sand and stones 2 0.059� Gulley Bridge Pier Sand and stones 2 0.068� Rhu Narrows Mussel bed 2 0.059� Rosneath Sand and gravel 2 0.067� Carnban boatyard Mud, sand and stones 2 0.10Holy Loch North Sandbank Mud and sand 1 0.075� Kilmun Pier Sand and stones 1 0.070� Mid-Loch Mussel bed 1 0.056Rosyth Blackness Castle Mud and sand 1 0.062� � Mud 1 0.065� Pettycur Sand 2 0.055� East of Dockyard � 1 0.059� Port Edgar Mud 2 0.068� West of Dockyard Mud and sand 2 0.079
a See section 5 for definition

131
Table 1.7 Estimates of public radiation exposure from discharges of liquid radioactive
waste in Scotland, 1995
Establishment Radiation exposure pathway Critical group Exposureb, mSv
British Nuclear Fuels plc
Chapelcross Fish and shellfish consumption Local fishermen 0.026and external
External Wildfowlers 0.024
Handling of fishing gear Local fishermen 0.088a
United Kingdom AtomicEnergy Authority
Dounreay Handling of fishing gear Local fishermen 0.17a
External Local community 0.008
Fish and shellfish consumption Local fishing community <0.005
Mollusc consumption and external Mollusc collectors 0.030
Scottish Nuclear Ltd
Hunterston Fish and shellfish consumption Local fishing community 0.018and external
Torness Fish and shellfish consumption Local fishing community <0.005
External Local community <0.005
Naval Establishments
Faslane External Boatyard workers 0.020c
Holy Loch External Local community 0.009
Rosyth External Local community 0.010
a Exposure to skin including a component due to natural sources of beta radiation, to be comparedwith the dose limit of 50 mSv
b Unless otherwise stated, represents the committed effective dose calculated using the methodology of ICRP-60, to be compared with the dose limit of 1 mSv. Includes the far-field effects of discharges from BNFL Sellafield.
c Includes the effects of direct radiation from a waste store

132
APPENDIX 2. Abbreviations
AGR Advanced Gas-Cooled Reactor
ALARA As Low as Reasonably Achievable
BPM Best Practicable Means
BNFL British Nuclear Fuels plc
CARE Centre for Analytical Research in the Environment
DFR Directorate of Fisheries Research (MAFF)
EARP Enhanced Actinide Removal Plant
FARM Food and Agriculture Monitoring Programme
GDL Generalised Derived Limit
G-M Geiger-Muller
IAEA International Atomic Energy Agency
HMIP Her Majesty�s Inspectorate of Pollution
ICRP International Commission on Radiological Protection
LoD Limit of Detection
MAFF Ministry of Agriculture, Fisheries and Food
MRL Minimum reporting level
ND Not detected
NEA Nuclear Energy Agency
NRPB National Radiological Protection Board
OECD Organisation for Economic Co-operation and Development
OSPAR Oslo and Paris CommissionPWR Pressurised Water Reactor
RSD Radiological Safety Division (MAFF)
SGHWR Steam Generating Heavy Water Reactor
THORP Thermal Oxide Reprocessing Plant
TRAMP Terrestrial Radioactivity Monitoring Programme
UKAEA United Kingdom Atomic Energy Authority
VLA Veterinary Laboratories Agency

133
APPENDIX 3. Consumption, handling and occupancy rates
This appendix gives the consumption, handling and occupancy rate data used in the assessment of exposures.Consumption rates for terrestrial foods are given in Table 3.1. These are based on national statistics and are taken toapply at each site. Site-specific data for aquatic pathways based on local surveys are given in Table 3.2.
Table 3.1 Consumption rates for terrestrial foods
Food Group Consumption rates (kg y-1)
Average Above average consumption rate*
Adult 10 year old Infant Adult 10 year old Infant
Beef 15 15 3 45 30 10Cereals 50 45 15 100 75 30Eggs 8.5 6.5 5. 25 20 15Fruit 20 15 9 75 50 35Game 6 4 1 15 7.5 2Green Vegetables 15 6 3.5 45 20 10Honey 2.5 2 2 9.5 7.5 7.5Lamb 8 4 1 25 10 3Legumes 20 8 3 50 25 10Milk 95 110 130 240 240 320Mushrooms 3 15 0.5 10 4.5 1.5Nuts 3 15 1 10 7 2Offal 5.5 3 1 20 10 5.5Pork 15 8.5 1.5 40 25 5.5Potatoes 50 45 10 120 85 35Poultry 10 5.5 2 30 15 5.5Root crops 10 6 5 40 20 15Wild fruit 7 3 1 25 10 2
* These rates are the 97.5th percentile of the distribution across all consumers
Table 3.2 Consumption, handling and occupancy rates for aquatic pathways
Site Groupa Rates
Aldermaston 1 kg y-1 pike360 h y-1 over riverbank
Amersham 1 kg y-1 pike1350 h y-1 over riverbank
Barrow 1000 h y-1 over mud and sand
Berkeley and Oldbury 17 kg y-1 flounders4.9 kg y-1 shrimps980 h y-1 over mud
Bradwell A 75 kg y-1 fish5.0 kg y-1 crustaceans2000 h y-1 over mud
B 4.7 kg y-1 oysters
Capenhurst 0.0025 kg y-1 sediment2.5 l y-1 water
Cardiff 28 kg y-1 flounders2.9 kg y-1 mussels650 h y-1 over mud

134
Table 3.2 continued
Site Groupa Rates
Channel Islands 110 kg y-1 fish7 kg y-1 crustaceans18 kg y-1 molluscs
Chapelcross A 8.7 kg y-1 flounders11 kg y-1 salmonids7.3 kg y-1 shrimps0.45 kg y-1 mussels1000 h y-1 over mud and sand
B 1200 h y-1 over salt marshC 250 h y-1 handling nets
Chatham 3000 h y-1 over mud
Devonport 14 kg y-1 salmonids13 kg y-1 fish5 kg y-1 crustaceans2000 h y-1 over mud
Dounreay A 630 h y-1 handling netsB 54 kg y-1 cod
20 kg y-1 crab and lobster0.42 kg y-1 winkles
C 5.5 kg y-1 winkles380 h y-1 over winkle beds
D 100 h y-1 in a Geo
Dungeness 98 kg y-1 fish9.4 kg y-1 shrimps14 kg y-1 whelks2000 h y-1 over mud
Faslane A 500 h y-1 over mudB 38 kg y-1 fish
4.8 kg y-1 molluscs670 h y-1 over mud and sand
Hartlepool A 42 kg y-1 fish23 kg y-1 crab18 kg y-1 winkles3000 h y-1 over sand/coal
Harwell 1 kg y-1 pike650 h y-1 over river bank
Heysham 54 kg y-1 fish21 kg y-1 shrimps22 kg y-1 mussels and cockles900 h y-1 over mussel beds
Hinkley Point A 48 kg y-1 flounder6.5 kg y-1 shrimps780 h y-1 over mud
B 1000 h y-1 over mud
Holy Loch 900 h y-1 over mud
Hunterston 82 kg y-1 fish41 kg y-1 Nephrops21 kg y-1 scallops860 h y-1 over sand and mud
Rosyth A 2.7 kg y-1 crabB 1900 h y-1 over mud and sand

135
Table 3.2 continued
Site Groupa Rates
Sellafield A 26 kg y-1 plaice and cod8.6 kg y-1 crab (75%) and lobster (25%)12 kg y-1 winkles and other molluscs
B 2500 h y-1 handling netsC (Whitehaven boat dwelling) 270 h y-1 over mud
35 kg y-1 cod and plaiceD (anglers) 300 h y-1 over sediment (Whitehaven outer harbour)
300 h y-1 over sediment (Whitehaven inner harbour)1100 h y-1 over sand (Sellafield coastal area)28 kg y-1 cod and plaice
E (Whitehaven commercial) 57 kg y-1 plaice and cod21 kg y-1 Nephrops1 kg y-1 whelks
F (Morecambe Bay) See HeyshamG (Fleetwood) 93 kg y-1 plaice and cod
29 kg y-1 shrimps23 kg y-1 whelks
H (Dumfries and Galloway) 38 kg y-1 plaice, cod and salmon13 kg y-1 crabs and Nephrops6.6 kg y-1 cockles and winkles1000 h y-1 over winkle beds
I (Laverbread) 47 kg y-1 laverbreadJ (Trout) 6.8 kg y-1 rainbow trout
Sizewell 56 kg y-1 fish6.6 kg y-1 crustaceans3.8 kg y-1 molluscs260 h y-1 over mud
Springfields A 2600 h y-1 over mudB 280 h y-1 handling netsC 300 h y-1 wildfowlingD 700 h y-1 angling
Torness A 58 kg y-1 fish11 kg y-1 crab and lobster10 kg y-1 Nephrops2.2 kg y-1 molluscs
B 430 h y-1 over sandC 640y-1 over winkle beds
Trawsfynydd 1.8 kg y-1 Brown trout22 kg y-1 rainbow trout0.93 kg y-1 perch1000 h y-1 over lake shore
Upland lake 37 kg y-1 fish
Whitehaven 50 kg y-1 fish10 kg y-1 crabs and lobsters1.6 kg y-1 winkles
Winfrith A 77 kg y-1 cod26 kg y-1 crab39 kg y-1 whelks
B 390 h y-1 over mud
Wylfa 94 kg y-1 fish23 kg y-1 crab1.8 kg y-1 molluscs370 h y-1 over sand
a Where more than one group exists at a site the groups are denoted A, B, etc.

136
APPENDIX 4. Dosimetric data
Radionuclide Half Life Mean β energy Mean γ energy Dose per unit intake by ingestion(years) (MeV per (MeV per using ICRP-60 methodology (Sv Bq-1)disintegration) disintegration)
Adults 10 yr 1 yr
H3 1.24E+01 5.683E-03 0.000E+00 1.80E-11 2.30E-11 4.80E-11OT3 (f) 3.39E-02 5.683E-03 0.000E+00 4.20E-11 5.70E-11 1.20E-10C 14 5.73E+03 4.945E-02 0.000E+00 5.80E-10 8.00E-10 1.60E-09P 32 3.91E-02 6.950E-01 0.000E+00 2.60E-09 6.00E-09 1.80E-08S 35 2.39E-01 4.884E-02 0.000E+00 7.80E-10 1.60E-09 5.30E-09CA45 4.46E-01 7.720E-02 0.000E+00 8.90E-10 2.00E-09 6.00E-09MN54 8.56E-01 4.220E-03 8.364E-01 7.30E-10 1.30E-09 2.80E-09FE55 2.70E+00 4.201E-03 1.691E-03 3.30E-10 1.10E-09 2.40E-09CO57 7.42E-01 1.860E-02 1.250E-01 2.10E-10 5.80E-10 1.60E-09CO58 1.94E-01 3.413E-02 9.976E-01 7.50E-10 1.70E-09 4.50E-09CO60 5.27E+00 9.656E-02 2.500E+00 3.40E-09 1.10E-08 2.70E-08ZN65 6.67E-01 6.870E-03 5.845E-01 3.90E-09 6.40E-09 1.60E-08SE75 3.28E-01 1.452E-02 3.946E-01 2.60E-09 6.10E-09 1.30E-08SR90 � 2.91E+01 1.131E+00 3.163E-03 3.22E-08 6.99E-08 1.02E-07ZR95 � 1.75E-01 1.605E-01 1.505E+00 1.55E-09 3.09E-09 8.88E-09NB95 9.62E-02 4.444E-02 7.660E-01 5.90E-10 1.20E-09 3.20E-09TC99 2.13E+05 1.010E-01 0.000E+00 6.40E-10 1.30E-09 4.80E-09RU103 � 1.07E-01 7.478E-02 4.685E-01 7.30E-10 1.50E-09 4.60E-09RU106 � 1.01E+00 1.422E+00 2.049E-01 7.00E-09 1.50E-08 5.00E-08AG110M � 6.84E-01 8.699E-02 2.740E+00 2.80E-09 5.20E-09 1.40E-08SB125 2.77E+00 1.007E-01 4.312E-01 1.10E-09 2.10E-09 6.10E-09I 125 1.65E-01 1.940E-02 4.205E-02 1.50E-08 3.20E-08 5.80E-08I 129 1.57E+07 6.383E-02 2.463E-02 1.10E-07 1.90E-07 2.20E-07I 131 � 2.20E-02 1.935E-01 3.813E-01 2.20E-08 5.20E-08 1.80E-07CS134 2.06E+00 1.634E-01 1.550E+00 1.90E-08 1.40E-08 1.60E-08CS137 � 3.00E+01 2.486E-01 5.651E-01 1.40E-08 1.00E-08 1.20E-08BA140 � 3.49E-02 8.493E-01 2.502E+00 5.40E-09 1.19E-08 3.50E-08CE144 � 7.78E-01 1.278E+00 5.282E-02 5.20E-09 1.10E-08 3.90E-08PM147 2.62E+00 6.200E-02 4.374E-06 4.40E-10 1.00E-09 3.10E-09EU154 8.80E+00 2.923E-01 1.237E+00 3.10E-09 6.50E-09 1.80E-08EU155 4.96E+00 6.340E-02 6.062E-02 5.30E-10 1.20E-09 3.40E-09PB210 � 2.23E+01 4.279E-01 4.810E-03 7.02E-07 1.90E-06 3.61E-06BI210 1.37E-02 3.890E-01 0.000E+00 2.10E-09 4.80E-09 1.40E-08PO210 (c) 3.79E-01 0.000E+00 0.000E+00 1.20E-06 2.60E-06 8.80E-06PO210 (d) 3.79E-01 0.000E+00 0.000E+00 1.92E-06 4.16E-06 1.41E-05RA226 � 1.60E+03 9.559E-01 1.765E+00 2.80E-07 8.10E-07 9.70E-07TH228 � 1.91E+00 9.130E-01 1.567E+00 1.47E-07 4.28E-07 1.11E-06TH230 7.70E+04 1.462E-02 1.553E-03 2.10E-07 2.50E-07 4.10E-07TH232 1.41E+10 1.251E-02 1.332E-03 2.30E-07 2.90E-07 4.50E-07U 234 2.44E+05 1.320E-02 1.733E-03 5.00E-08 7.40E-08 1.30E-07U 235 � 7.04E+08 2.147E-01 1.815E-01 4.70E-08 7.10E-08 1.30E-07U 238 � 4.47E+09 8.915E-01 2.235E-02 4.84E-08 7.55E-08 1.45E-07NP237 � 2.14E+06 2.668E-01 2.382E-01 1.10E-07 1.20E-07 2.10E-07PU238 (a) 8.77E+01 1.061E-02 1.812E-03 2.30E-07 2.50E-07 4.00E-07PU238 (b) 9.20E-08 1.00E-07 1.60E-07PU239 (a) 2.41E+04 6.738E-03 8.065E-04 2.50E-07 2.70E-07 4.20E-07PU239 (b) 1.00E-07 1.08E-07 1.68E-07PU α (e) 2.41E+04 6.738E-03 8.065E-04 2.50E-07 2.70E-07 4.20E-07PU240 (a) 6.54E+03 1.061E-02 1.731E-03 2.50E-07 2.70E-07 4.20E-07PU240 (b) 1.00E-07 1.08E-07 1.68E-07PU241 (a) 1.44E+01 5.246E-03 2.546E-06 4.80E-09 5.10E-09 5.80E-09PU241 (b) 1.92E-09 2.04E-09 2.32E-09AM241 (a) 4.32E+02 5.207E-02 3.253E-02 2.10E-07 2.20E-07 3.80E-07AM241 (b) 8.40E-08 8.80E-08 1.52E-07CM242 4.46E-01 9.594E-03 1.832E-03 1.60E-08 3.50E-08 1.00E-07CM243 2.85E+01 1.384E-01 1.347E-01 2.00E-07 2.60E-07 5.40E-07CM244 1.81E+01 8.590E-03 1.700E-03 1.70E-07 2.10E-07 4.70E-07
� Energy and dose per unit intake data include the effects of radiations of short-lived daughter products(a) Gut transfer factor 5.00E-4 for consumption of all foodstuffs except Cumbrian winkles(b) Gut transfer factor 2.00E-4 for consumption of Cumbrian winkles(c) Gut transfer factor 0.5(d) Gut transfer factor 0.8(e) PU239 data used(f) Organically bound tritium

137
APPENDIX 5. Estimates of concentrations of radionuclidesdue to natural sources
5.1 Aquatic foodstuffs
Table 5.1 gives estimated values of concentrations of radionuclides due to natural sources in aquatic foodstuffs. Thevalues are based on sampling and analysis carried out by MAFF. Dose assessments for aquatic foodstuffs are basedon activity concentrations of these radionuclides net of natural background. Similarly, natural levels of carbon-14 aresubtracted when assessing exposures due to man-made sources of this radionuclide. The natural concentrations ofcarbon-14 are determined by measuring the carbon concentration in each sample and applying a specific activity of254 Bq 14C natural/kg C (Collins, et al., 1995).
5.2 Terrestrial foodstuffs
The values of carbon-14 in terrestrial foodstuffs due to natural sources that are used in dose assessments are givenin Table 5.2 (MAFF, 1995).
Table 5.1 Radioactivity in seafood due to natural sources
Radionuclide Concentration of radioactivity Bq kg-1 (wet)
Fish Crustaceans Crabs Lobsters Molluscs Winkles Mussels
Lead-210 0.025 0.3 0.08 0.69 1.1Polonium-210 0.28 8.5 4.6 7.1 25.6Radium-226 0 0.03 0.08Thorium-228 0.0054 0.04 0.0096 0.089Thorium-230 0.00081 0.008 0.0026 0.038Thorium-232 0.00097 0.01 0.0014 0.063Uranium-234 0.0045 0.0547 0.0403 0.714Uranium-238 0.0039 0.0458 0.0351 0.621
Table 5.2 Carbon-14 in terrestrial foodstuffs due to natural sources
Food Category % Carbon content (wet) Concentration of carbon-14(Bq/kg (wet))
Milk 7 18Bovine meat 17 44Ovine meat 21 54Pork 21 54Poultry 28 72Game 15 38Offal 12 31Eggs 15 38Green vegetables 3 8Root vegetables 3 8Legumes/other domestic vegetables 8 20Dry beans 20 51Potato 9 23Cereals 41 105Cultivated fruit 4 10Wild fruit 4 10Mushrooms 2 5Honey 31 79Nuts 58 148

138
APPENDIX 6. Modelling of activity in milk and livestock
At Sellafield, Drigg, Ravenglass and the Isle of Man, a simple foodchain model has been used to provide concentra-tions of activity in milk and livestock for selected radionuclides to supplement data obtained by direct measurement.This is done where relatively high limits of detection are determined or where no measurements were made. Thefoodchain model is applied to grass or soil concentrations which are determined by measurement. The data for themodel are given in Table 6.1 (Simmonds et al., 1995 and Brenk et al., unpublished) and the predicted concentrationsused in the assessment are in Table 6.2.
The activity in the milk is given by the equation:
C = Fm Ca Qf exp(-λt)
Similarly the activity in muscle or offal is
C = Ff Ca Qf exp(-λt)
Table 6.1 Data for foodchain model
Parameter Nuclide Foodstuff
Milk Beef Beef offal Lamb Sheep offal
Qf 13 13 13 1.5 1.5Qs 4 4 4 20 20t f 4 - - - -t s - 20 20 20 20
Fm or Ff99Tc 1.00E-02 1.00E-02 4.00E-02 1.00E-01 4.00E-01106Ru 1.00E-06 1.00E-03 1.00E-02 1.00E-02 1.00E-02144Ce 2.00E-05 1.00E-03 2.00E-01 1.00E-02 2.00E+00147Pm 2.00E-05 5.00E-03 4.00E-02 5.00E-02 3.00E-01241Pu 1.00E-06 1.00E-04 4.00E-04 2.00E-02 3.00E-02
where: Qf = the amount of pasture consumed per day (kg d-1 (dry))Q s = soil consumption as a percentage of dry matter intake (%(dry))tf = time taken from point of milk production to point of consumption (d)ts = time from slaughter to consumption (d)Fm = the fraction of daily intake by ingestion transferred to a litre of milk (d l-1)F f = the fraction of daily intake by ingestion transferred to a kg of muscle or liver (d kg-1)Ca = The concentration of the nuclide in the fodder consumed by the animal (Bq kg-1)
Table 6.2 Predicted concentrations from foodchain model used in assessments of exposures
Foodstuff Location Radioactivity concentration (wet weight), Bq kg-1
99Tc 106Ru 144Ce 147Pm 241Pu
Milk Sellafield <4.94 10-4 <4.94 10-3
Ravenglass <6.50 10-5 <2.86 10-3
Drigg <4.68 10-4 <3.25 10-3 <7.28 10-3
Isle of Man 4.0 10-4 6.0 10-3
Beef Sellafield <0.065* <0.494 <0.247Ravenglass <6.50 10-3 <0.143Drigg <0.065* <0.468 <0.163* <1.82 <1.30 10-3
Lamb Sellafield <0.03* <0.057 <5.7Ravenglass <7.50 10-4
Drigg <0.33* <0.054 <1.5*Isle of Man 0.47 0.26
Beef offal Sellafield <0.65*Ravenglass 47.5* <6.50 10-2 <1.43Drigg <0.65* <4.68 <1.63* <18.2 <0.26
Lamb offal Sellafield <0.3* <0.57Ravenglass 20.3* <7.50 10-3
Drigg <3.3* <0.54 <0.03Isle of Man 0.47
Concentrations were modelled using the activity in Leafy Green Vegetables except for those marked * where the values in grass wereused

ISSN 1365-6414
Ministry of Agriculture, Fisheries and FoodRadiological Safety DivisionErgon House17 Smith SquareLondon SW1P 3JR
Radioactivity in F
ood and the Environm
ent, 1995